Embed Size (px)
Citation preview
Electoral Studies 23 (2004) 601–621
www.elsevier.com/locate/electstud
Thwarted voters at the 2000 US presidentialelection5
Roy Pierce �
Center for Political Studies, The University of Michigan, MI 48106, USA
Abstract
This article examines the behavior at the 2000 US presidential election of the self-described Democrats who, prior to the election but after the candidates were nominated,preferred Bill Bradley to Al Gore, as well as of the Republicans who had a higher opinion ofJohn McCain than they did of George W. Bush. These ‘‘thwarted voters’’ are examined withregard to turnout, candidate choice, and motivations, and they are compared on thesedimensions with thwarted voters at earlier US presidential elections. Attention is given toestimating the extent to which their behavior in 2000 was critical for the popular vote totals,and counterfactual analysis is employed to estimate the probable effects on the election’soutcome of marginal alterations in the voters’ perceptions of the candidates’ attributes.# 2003 Elsevier Ltd. All rights reserved.
Keywords: Electoral behavior; Candidate evaluation; Turnout; Partisanship; Primary elections
1. Introduction
In the fall of the year 2000, well after the presidential nominating conventions,
but prior to the presidential election of November 7, significant proportions of self-
described Democrats had a higher opinion of Bill Bradley than they did of Al
Gore, and an even larger proportion of Republicans preferred John McCain to
George W. Bush. Some 24% of the Republicans who rated both George Bush and
John McCain on a conventional ‘‘thermometer’’ scale ranging from 0 to 100 gave a
higher score to McCain than to Bush. Some 18% of the Democrats who rated both
5 This is a revised version of a paper originally presented at the Annual Meeting of The Public
Choice Society, the US Grant Hotel, San Diego, CA, March 22–24, 2002.� Tel.: +1 734 763 5091; fax: +1 734 764 3341.
E-mail address: [email protected] (R. Pierce).
0261-3794/$ - see front matter # 2003 Elsevier Ltd. All rights reserved.
doi:10.1016/S0261-3794(03)00058-1
Al Gore and Bill Bradley on the same kind of evaluation scale preferred Bradley toGore. These potential voters, the Republicans who preferred McCain to Bush andthe Democrats who favored Bradley over Gore, were the current year’s members ofthe often large and sometimes critically important company of what we call‘‘thwarted voters’’. They were thwarted in the sense that they could not cast theirballots at the presidential election for the candidates whom they preferred.This paper examines the behavior of those thwarted voters at the 2000 election
with regard to turnout, candidate choice, and motivation. Particular attention willbe given to estimating the extent to which their behavior in 2000 can be considered ascritical in affecting the electoral outcome. Comparisons will be drawn with thwartedvoters at earlier US elections to highlight distinguishing features of the 2000 election.
2. The incidence of thwarted voters in 2000
Specialists in US politics will immediately locate the voters we have labeled as‘‘thwarted’’ and the kinds of problems to which we have referred within the familiardomain of the US system of primary elections for the nomination of presidentialcandidates, which has been ably examined on the voter level by such scholars asSouthwell (1986) and at the activist level by Stone (1986), Stone et al. (1992), andAtkeson (1998).From a broader perspective, however, the US voters who may be frustrated by
the results of the primary system are not an isolated group, distinctive to the US,nor are they limited to those voters who literally cast primary election or caucusballots for unsuccessful presidential aspirants. They are, rather, a national subset ofa large class of voters, distributed worldwide, who regularly find themselves in anal-ogous electoral situations. In such countries as France, Russia, and Finland, whichemploy two-ballot presidential electoral systems that are characterized by multiplecandidates at the first ballot normally followed by a runoff between only two final-ists, there are large numbers of voters who inevitably find it impossible to vote fortheir preferred candidates because those candidates do not qualify for the runoff.Indeed, the electoral frustration experienced in these two-ballot election countriescan be more acute and widespread than it is in the US. Only two candidates maycompete at the runoff ballot under the typical two-ballot system. In the US, it is notunusual for defeated primary candidates to compete with the candidates officiallynominated by the two major parties, although that, of course, did not occur in 2000.Furthermore, while thwarted voters in the US have their origin in the primary
election system, their incidence extends well beyond the numbers of disappointedvoters who actually participate in primary elections. Presidential primary electionsin the US are neither universal nor uniform in their array of competing candidates,which limits the scope they provide for actual voter participation. They are, how-ever, broadly and intensely publicized, which creates the opportunity for primarycandidates to gain wide visibility and garner national support. A US voter who pre-ferred John McCain or Bill Bradley in the fall of 2000, but who did not vote in a pri-mary election in which they were candidates, might well be as enthusiastic about oneor the other as a voter who had already voted for one of them in a primary election.
R. Pierce / Electoral Studies 23 (2004) 601–621602
This paper is confined to the US, and focuses on a single presidential election in
which virtually symmetrical pairs of contenders for the major parties’ presidential
nominations competed in several of their parties’ primary elections. Our analysis,
however, derives from a perspective that considers the voters whose hopes were
dashed by the nomination process as sharing an experience familiar to many voters
in other countries as well. Millions of voters worldwide find themselves constrained
to make a second electoral choice because their preferred candidate is no longer
available (see Pierce, 2003).The analysis identifies thwarted voters by means of comparative candidate eva-
luations rather than by reports of discrete primary election choices. There are sev-
eral interrelated reasons why we employ this method. One overwhelming reason is
that, to our knowledge, there is no national survey available that captures the
behavior and attributes of the primary election participants of 2000. But even if
such data were available, say, in the American National Election Study (ANES) of
2000, on which this paper almost exclusively relies for other purposes,1 the method
of comparing candidate evaluation scores would almost surely produce more cases
of thwarted voters for analysis than would reports of actual primary election votes.That, at least, is the experience of those ANES that do contain questions
designed to ascertain primary election behavior, and sometimes by a wide margin.
Indeed, at the ANES of 1984, the question relating to the competition for the
Democratic nomination for president did not ask if the respondents voted in a pri-
mary and, if so, for which candidate they voted, but rather which candidate
(among those listed) the respondents wanted most to see win the Democratic nomi-
nation. That technique, which is related to our method of comparative candidate
evaluations, actually uncovered a larger number of thwarted Democratic party
identifiers than our method did for the same year.2
1 Burns et al. (2001): National Election Studies, 2000: Pre-/Post-Election Study (Dataset). These mate-
rials are based on work supported by the National Science Foundation under grant numbers SBR-
9707741, SBR-9317631, SES-9209410, SES-9009379, SES-8808361, SES-8341310, SES-8207590, and
SOC77-08885, as well as the Russell Sage Foundation under grant number 82-00-01, and the University
of Michigan. Any opinions, findings and conclusions or recommendations expressed in these materials
are those of the author and do not necessarily reflect those of the funding agencies. We have also made
brief use for comparative purposes of the analogous NES for the elections of 1976, 1980, 1984, 1988,
1992, and 1996. The use of those studies, also, is the sole responsibility of the author and not that of the
persons or organizations who funded, collected, or disseminated the data.2 The 1988 ANES included conventional questions asking the respondents which candidate they had
voted for in their party’s primary or caucus, and also asked who, among lists of Democratic and Repub-
lican contenders, cited separately, they thought would make the best president. That approach produced
larger proportions of thwarted Democrats and Republicans than our method of comparative evalua-
tions did for the same year. A direct comparison between the two methods is not possible because ther-
mometer scores were not obtained for all the candidates cited under this variant. However, the broad
structure of preferences is consistent between the two methods. Among satisfied Republicans, as we
define them here, 76% selected Bush as likely to make the best president, compared with only 11% of
those we classify as thwarted. Among our satisfied Democrats, 58% selected Dukakis as likely to make
the best president, while 11% of the thwarted Democrats did.
603R. Pierce / Electoral Studies 23 (2004) 601–621
Comparative candidate evaluations not only normally produce more cases ofthwarted voters with which to work than discrete primary election vote reports do,but also reflect the broad distribution of candidate preferences across the entire USelectorate better than the inevitably limited subset of primary voters containedwithin a typical national sample of the US electorate.3
Finally, among the advantages of identifying thwarted voters in the US bymeans of comparative candidate evaluations, that method ensures consistency anduniformity of measurement across elections (and, when possible and appropriate,across national boundaries). It also automatically injects into consideration thenotion of how much any given voter might prefer one candidate to another. Directexamination of primary voters, of course, in no way precludes the use of candidateevaluations for analytical purposes, but making those evaluations central to thedefinition facilitates both longitudinal and cross-national comparisons in ordinalterms.In identifying thwarted voters in the US, therefore, we rely on the preelectoral
evaluations of the contenders for the presidential nomination recorded in theinvaluable US National Election Studies (NES). Self-declared Republicans, asreported in the preelectoral summary of party identification (and including leanersas partisans), who assigned a higher evaluation to John McCain than to GeorgeW. Bush, are counted as thwarted Republicans, while those who assigned the sameor a higher evaluation to Bush were counted as satisfied Republicans. The equiva-lent operation was performed for self-proclaimed Democrats (again including lea-ners) between Al Gore and Bill Bradley. To be classified as either thwarted orsatisfied, respondents had to assign a valid thermometer score to both of the com-peting candidates for their party’s nomination.4
To be clear about how many potential voters we are talking about, we report inTable 1 the proportions of satisfied and thwarted partisans as we have calculatedthem for the US presidential election of 2000, as well as the proportions of voterswho do not appear in either category, either because they did not evaluate both ofthe relevant candidates or they professed no degree of partisan identification.The incidence of thwarted voters in the US varies widely from election to elec-
tion, depending on how divided the parties are internally, how many candidatesdecide to throw their hats into the ring, how visible they are, and how well they areregarded by various important electoral groups. Historical means, therefore, can be
3 In this regard, probably the most valuable source of survey data for the role of primary elections in
US presidential nominations is the ANES (1988) relating to ‘Super Tuesday’. Unfortunately for our pur-
poses, however, that study contains no report of how the respondents voted at the presidential election
itself.4 The differences between the thermometer scores assigned by thwarted voters and satisfied ones are
not marginal. The mean difference in thermometer scores for Bush and for McCain among satisfied
Republicans was 18.9 to the advantage of Bush; among thwarted Republicans the mean advantage for
McCain was 20.0. Among satisfied Democrats, the mean advantage of Gore over Bradley was 20.9;
among thwarted Democrats, Bradley’s mean lead over Gore was 20.3. Naturally, individual differences
in the relevant thermometer scores may well be a factor in each voter’s behavior, and these will be taken
into account in the analysis.
R. Pierce / Electoral Studies 23 (2004) 601–621604
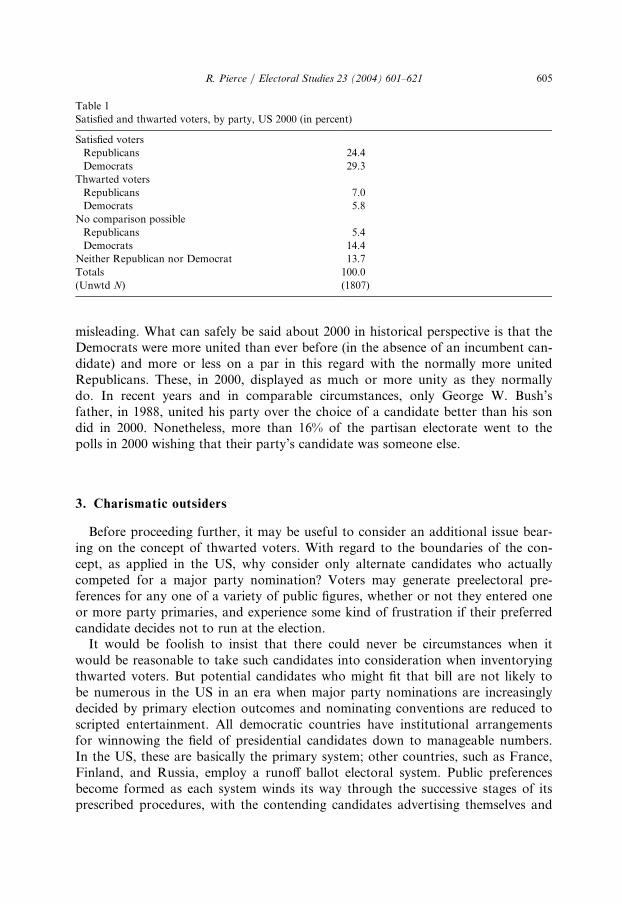
misleading. What can safely be said about 2000 in historical perspective is that theDemocrats were more united than ever before (in the absence of an incumbent can-didate) and more or less on a par in this regard with the normally more unitedRepublicans. These, in 2000, displayed as much or more unity as they normallydo. In recent years and in comparable circumstances, only George W. Bush’sfather, in 1988, united his party over the choice of a candidate better than his sondid in 2000. Nonetheless, more than 16% of the partisan electorate went to thepolls in 2000 wishing that their party’s candidate was someone else.
3. Charismatic outsiders
Before proceeding further, it may be useful to consider an additional issue bear-ing on the concept of thwarted voters. With regard to the boundaries of the con-cept, as applied in the US, why consider only alternate candidates who actuallycompeted for a major party nomination? Voters may generate preelectoral pre-ferences for any one of a variety of public figures, whether or not they entered oneor more party primaries, and experience some kind of frustration if their preferredcandidate decides not to run at the election.It would be foolish to insist that there could never be circumstances when it
would be reasonable to take such candidates into consideration when inventoryingthwarted voters. But potential candidates who might fit that bill are not likely tobe numerous in the US in an era when major party nominations are increasinglydecided by primary election outcomes and nominating conventions are reduced toscripted entertainment. All democratic countries have institutional arrangementsfor winnowing the field of presidential candidates down to manageable numbers.In the US, these are basically the primary system; other countries, such as France,Finland, and Russia, employ a runoff ballot electoral system. Public preferencesbecome formed as each system winds its way through the successive stages of itsprescribed procedures, with the contending candidates advertising themselves and
Table 1
Satisfied and thwarted voters, by party, US 2000 (in percent)
Satisfied voters
Republicans 24.4
Democrats 29.3
Thwarted voters
Republicans 7.0
Democrats 5.8
No comparison possible
Republicans 5.4
Democrats 14.4
Neither Republican nor Democrat 13.7
Totals 100.0
(Unwtd N) (1807)
605R. Pierce / Electoral Studies 23 (2004) 601–621
soliciting electoral support in ways designed to cast them in the image of potentialnominees.One infrequent but recurrent phenomenon in the US that clouds this issue is the
appearance during the presidential nominating season of a military leader madegenerally popular by his role in a recent successful war. Victorious generals posespecial problems, particularly if their partisan leanings are unknown at the start ofthe nominating campaign and/or they deliberately assume an ‘‘above-parties’’stance (see Converse and Dupeux, 1966). A candidate of this sort who arousedpopular expectations and then withdrew from the race might well leave a residue ofregret akin to what we suggest is experienced by thwarted voters.Fortunately, we have a recent US case which enables us to examine whether the
potential candidacy of a victorious general generated sentiments among his suppor-ters similar to those experienced by more conventionally thwarted voters at thesame election. In 1995, it was widely believed that General Colin Powell would runfor president at the 1996 election, in circumstances that gave him broad opportu-nities to seek popular support. In November 1995, however, he withdrew from thefield, identifying himself for the first time ‘‘as a member of the Republican Party’’(Mayer, 1997: pp. 73–74, n.).The Powell experience enables us to compare the behavior of those Republican
voters who may have been thwarted because of the general’s withdrawal with thatof the Republican voters who were thwarted by the lack of success of their pre-ferred candidates who followed the conventional primary route in their pursuit ofthe Republican presidential nomination (Pat Buchanan, Steve Forbes, PhilGramm, and Lamar Alexander). Before doing so, however, it will be useful toestablish the kind of electoral behavior that we can expect from thwarted voters asa class by examining it at the 2000 election and briefly setting it in historicalperspective.
4. The electoral behavior of thwarted voters
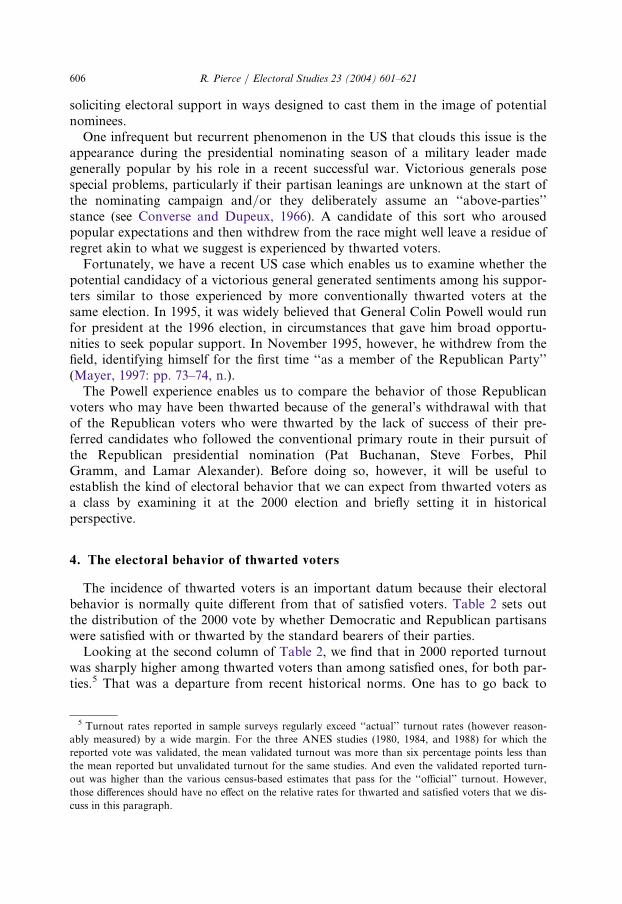
The incidence of thwarted voters is an important datum because their electoralbehavior is normally quite different from that of satisfied voters. Table 2 sets outthe distribution of the 2000 vote by whether Democratic and Republican partisanswere satisfied with or thwarted by the standard bearers of their parties.Looking at the second column of Table 2, we find that in 2000 reported turnout
was sharply higher among thwarted voters than among satisfied ones, for both par-ties.5 That was a departure from recent historical norms. One has to go back to
5 Turnout rates reported in sample surveys regularly exceed ‘‘actual’’ turnout rates (however reason-
ably measured) by a wide margin. For the three ANES studies (1980, 1984, and 1988) for which the
reported vote was validated, the mean validated turnout was more than six percentage points less than
the mean reported but unvalidated turnout for the same studies. And even the validated reported turn-
out was higher than the various census-based estimates that pass for the ‘‘official’’ turnout. However,
those differences should have no effect on the relative rates for thwarted and satisfied voters that we dis-
cuss in this paragraph.
R. Pierce / Electoral Studies 23 (2004) 601–621606
1976 to find an analogous differential in turnout rates. In the intervening years,
turnout rates have been roughly the same for satisfied and thwarted voters of the
same party. In 2000, the evidence suggests that the comparatively protracted and
uniform character of the primary elections in both parties encouraged the suppor-
ters of the losers to turn out at the election itself. Moreover, while Republicans
normally turn out at a higher rate than Democrats, that was true in 2000 only
among voters who did not supply evaluations of both leading contenders for their
party’s nomination.Moving on to the candidate choices made by the satisfied and thwarted voters, it
is useful to think in terms of partisans either remaining loyal to the candidate of
their party or defecting to the candidate of another party. Historically, there are
wide differences in the proportions of thwarted and satisfied voters who remain
loyal and who defect at presidential elections.From 1972 through 1996, omitting parties in years when their presidential candi-
date was unopposed for the nomination, the mean difference in proportions of loy-
alists and defectors was about 25 percentage points in the expected direction,
regardless of party. At the 2000 election, that mean differential reoccurred for the
Republicans, but shrank dramatically for the Democrats. Some 96% of the satisfied
Republicans voted for George W. Bush, while only 70% of the thwarted Repub-
licans did so. Less than 90% of satisfied Democrats voted for Al Gore, but more
than 80% of the thwarted Democrats did so as well. Other things being equal,
Bush was hurt more by the challenge from John McCain than Gore was by his
contest with Bill Bradley.6
Table 2
Reported turnout and presidential vote, by partisanship and candidate preference, US 2000 (in percent)
Turnout Voted for (Unwtd N)
Gore Bush Other
Satisfied voters
Republicans 79.7 3.2 96.0 0.8 (408)
Democrats 78.2 88.6 9.2 2.2 (450)
Thwarted voters
Republicans 87.0 23.6 69.6 6.8 (130)
Democrats 90.7 81.1 16.7 2.2 (101)
No comparison of candidates
Republicans 60.6 21.4 64.0 14.6 (71)
Democrats 53.8 81.8 13.6 4.6 (196)
Neither Republican nor Democrat 44.8 39.6 47.1 13.3 (188)
Totals 71.2 50.1 45.9 4.0 (1544)
Two-party total 52.2 47.8 –
6 The difference between the Republicans’ and Democrats’ loyalty rates in 2000 is not statistically sig-
nificant (Prob ¼ 0:069), but the analogous figures for 1976, 1980, and 1988 all are.
607R. Pierce / Electoral Studies 23 (2004) 601–621
Of course, other things are rarely equal. Bush drew from satisfied Republicans ata higher rate than Gore did from satisfied Democrats, but the electorate includedmore of the latter than the former. And so forth.Against this background of higher rates of partisan defection among thwarted
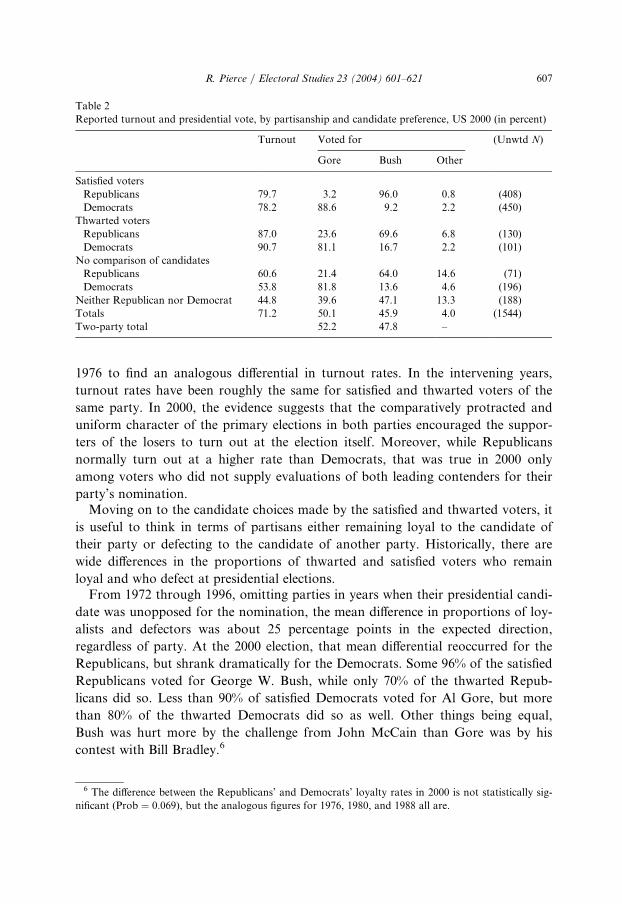
voters than among satisfied ones, we may return briefly to the Powell phenomenonof 1996. In that year, incumbent President Bill Clinton was unopposed for thenomination, so we must limit our considerations to Republican partisans (includ-ing leaners). These could reasonably have had a preference for Robert Dole, theactual Republican candidate, or for any of the four candidates (Buchanan, Forbes,Gramm, and Alexander) who competed with Dole during the primary season, orfor Colin Powell, who was prominently in the news but had never formally con-tended for the Republican nomination.Table 3 presents the 1996 electoral behavior of several sets of Republican parti-
sans in a way that facilitates comparison with the behavior of both Republican andDemocratic partisans set out in Table 2. The baseline group consists of those who
Table 3
Reported turnout and presidential vote, by candidate preference, US 1996, in percent, (Republicans
only)
Preferred candidate Turnout Voted for (Unwtd N)
Dole Clinton Perot or other
Dole 88.1 89.0 7.2 2.9 (236)
Powell 79.7 86.9 9.8 3.3 (153)
Conventional opponent 82.4 48.2 31.2 20.5 (136)
Powell or a conventional opponent � � � � (33)
No comparison possible � � � � (17)
Totals 83.6 79.0 13.9 7.1 575
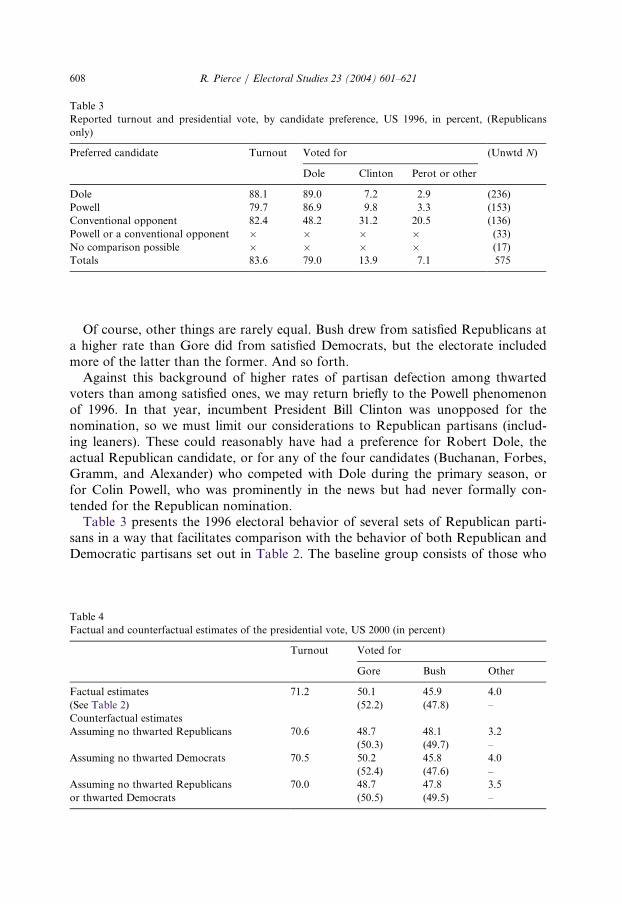
Table 4
Factual and counterfactual estimates of the presidential vote, US 2000 (in percent)
Turnout Voted for
Gore Bush Other
Factual estimates 71.2 50.1 45.9 4.0
(See Table 2) (52.2) (47.8) –
Counterfactual estimates
Assuming no thwarted Republicans 70.6 48.7 48.1 3.2
(50.3) (49.7) –
Assuming no thwarted Democrats 70.5 50.2 45.8 4.0
(52.4) (47.6) –
Assuming no thwarted Republicans
or thwarted Democrats
70.0 48.7 47.8 3.5
(50.5) (49.5) –
R. Pierce / Electoral Studies 23 (2004) 601–621608
were satisfied with Robert Dole as their party’s nominee in that they did not evalu-ate any of the other four active presidential hopefuls, or Colin Powell, more favor-ably than they did Dole. A second group comprises Republicans who preferredPowell to Dole, but who did not prefer any of Dole’s conventional opponents tohim. A third group includes only the voters we have normally considered ‘‘thwar-ted voters’’—those who preferred one of the candidates who formally competedwith Dole for the nomination (which excludes Powell). A fourth (but small) groupconsists of Republicans who preferred both a conventional opponent and Powell toDole. Finally, there is a very small group of Republicans who did not evaluateDole against any Republican alternative.Turnout in 1996 did not vary in the same way as in 2000 (see Table 2). There
was a small drop in turnout among supporters of Dole’s conventional opponentsand a somewhat larger one among Powell’s supporters. The competition for thenomination among Republicans in 1996 did not arouse the same presumed enthusi-asm for electoral participation that it was to do among voters of both parties in2000.With regard to the candidate choices of the Republicans in 1996, Dole appears
to have won a smaller proportion of the votes of those for whom he was the pre-ferred candidate than Bush was to do four years later (but he won as large a pro-portion as Gore was to do). There was only a slight tendency toward defectionamong the Republican partisans who preferred only Powell to Dole; defectionswere much more numerous proportionately among Republican voters who pre-ferred a conventional candidate to Dole.For our purposes here, the main lesson that emerges from Table 3 is that
Powell’s brief test of the presidential electoral waters in 1995 had little electoralimpact on those Republicans who preferred him to Robert Dole. In other circum-stances, the consequences might have been different, but the 1996 Powell phenom-enon suggests that at least for most elections most of the time, it is reasonable torestrict the category of thwarted voters to hopefuls who actively seek the nomi-nation.
5. The effects of thwarted voters on the electoral outcome
In the preceding section, we examined how the electoral behavior of thwartedvoters differs from that of voters who are satisfied with their party’s presidentialnominees. Here, we will estimate how much of an effect the Bush–McCain contestand the Gore–Bradley competition had on the outcome of the 2000 election, takinginto account both the rates of electoral loyalty among the different categories ofpartisan voters and the size of the partisan pools available.We start by comparing the ‘‘actual’’ results of the election (as estimated in Table 2)
with what the results of the election would have in three different hypotheticalsituations defined by simple counterfactual assumptions. The first hypothetical situ-ation (1) assumes that all voters behave as they ‘‘actually’’ did except that there isno McCain challenge to Bush and, therefore, no thwarted Republicans. Hypothesis
609R. Pierce / Electoral Studies 23 (2004) 601–621
(2) assumes that all voters behave as they ‘‘actually’’ did except that there is nocontest between Gore and Bradley and, therefore, no thwarted Democrats. Thethird hypothesis (3) eliminates both the Bush–McCain and the Gore–Bradley rival-ries and assumes that all Republicans and all Democrats are satisfied. All threehypotheses retain the category of both Republican and Democratic voters who didnot directly compare the competing contenders from their parties, and assume thatthey divide as they ‘‘actually’’ did. The voters who were neither Republicans norDemocrats are also treated in that fashion.Table 4 presents the results of these simple arithmetical computations and com-
pares them with the summary estimates of Table 2. What this exercise demon-strates more than anything else is how close, in terms of vote totals, the 2000presidential election was. Gore wins the two-candidate vote under all assumptions,but Gore’s ‘‘actual’’ lead, as estimated in Table 2, grows only barely perceptiblyunder the assumption that would seem to be most favorable for him. Bush’s votetotal increases slightly more under the assumption that is most advantageous forhim. Bush’s vote advances still further (but still only marginally) assuming no con-flict over the nomination in either party.Of course, the counterfactual exercises we have just described are skeletal, and
blissfully ignore all the unknowns of the various dynamics that would operate ifour hypothetical situations were actually realized. They have the virtue of produc-ing hard numerical conclusions, but those rest on few but strong assumptions andare only indicative at best.We can, however, take another tack in trying to answer the question about the
effects of the dual primary fights on the outcome of the election. This differentapproach has the opposite virtues and vices of the simple arithmetical method wehave just applied. It takes into account core elements of the voters’ motivationsand points us toward probabilistic conclusions in which we can have some confi-dence but does not produce any comforting, if hypothetical, vote totals.
6. A model of electoral second choices
We borrow from and enlarge upon a model of the electoral behavior of thwartedvoters we introduced elsewhere (Pierce, 2003). This model derives from both thepsychologically oriented ‘‘Michigan model’’ of electoral behavior and the spatialmodel that was originally inspired by Downs (1957) and specified by Riker andOrdeshook (1968) and by Davis et al. (1970). The hybrid model is applicable to the2000 election in ways that make it possible for us to make at least gross estimatesof the effects of the behavior of the thwarted voters on the actual electoral out-comes.The model’s dependent variable is the Choice made by the thwarted voters: to
remain Loyal to their party (0), to Abstain (1), or to Defect to the candidate ofanother party (2). There are only six independent variables. One is Candidate Pref-erence. This variable considers the respondent’s preference between the two majorparty candidates actually running, and is computed by subtracting the ther-
R. Pierce / Electoral Studies 23 (2004) 601–621610
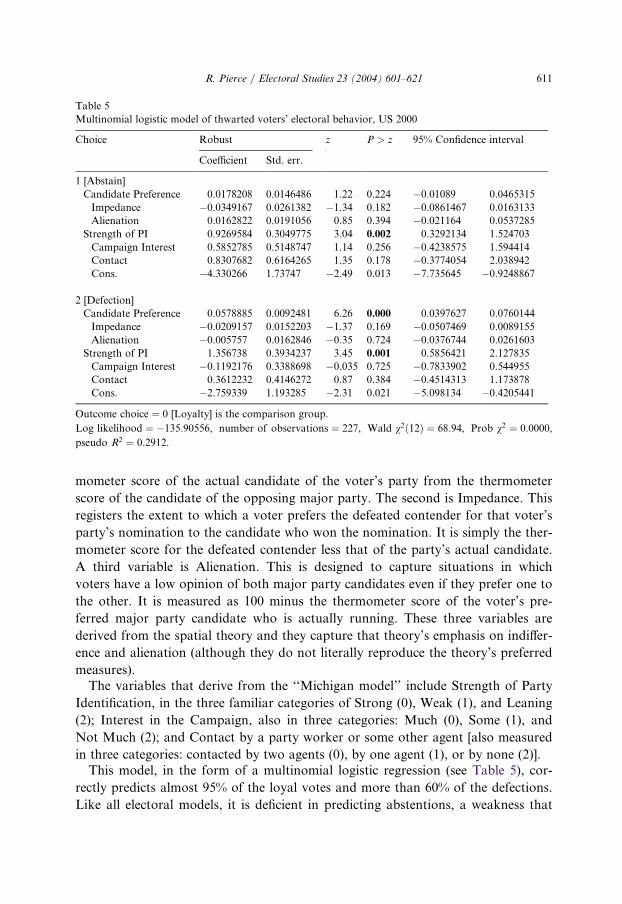
mometer score of the actual candidate of the voter’s party from the thermometer
score of the candidate of the opposing major party. The second is Impedance. This
registers the extent to which a voter prefers the defeated contender for that voter’s
party’s nomination to the candidate who won the nomination. It is simply the ther-
mometer score for the defeated contender less that of the party’s actual candidate.
A third variable is Alienation. This is designed to capture situations in which
voters have a low opinion of both major party candidates even if they prefer one to
the other. It is measured as 100 minus the thermometer score of the voter’s pre-
ferred major party candidate who is actually running. These three variables are
derived from the spatial theory and they capture that theory’s emphasis on indiffer-
ence and alienation (although they do not literally reproduce the theory’s preferred
measures).The variables that derive from the ‘‘Michigan model’’ include Strength of Party
Identification, in the three familiar categories of Strong (0), Weak (1), and Leaning
(2); Interest in the Campaign, also in three categories: Much (0), Some (1), and
Not Much (2); and Contact by a party worker or some other agent [also measured
in three categories: contacted by two agents (0), by one agent (1), or by none (2)].This model, in the form of a multinomial logistic regression (see Table 5), cor-
rectly predicts almost 95% of the loyal votes and more than 60% of the defections.
Like all electoral models, it is deficient in predicting abstentions, a weakness that
Table 5
Multinomial logistic model of thwarted voters’ electoral behavior, US 2000
Choice Robust z P > z 95% Confidence interval
Coefficient Std. err.
1 [Abstain]
Candidate Preference 0.0178208 0.0146486 1.22 0.224 �0.01089 0.0465315
Impedance �0.0349167 0.0261382 �1.34 0.182 �0.0861467 0.0163133
Alienation 0.0162822 0.0191056 0.85 0.394 �0.021164 0.0537285
Strength of PI 0.9269584 0.3049775 3.04 0.002 0.3292134 1.524703
Campaign Interest 0.5852785 0.5148747 1.14 0.256 �0.4238575 1.594414
Contact 0.8307682 0.6164265 1.35 0.178 �0.3774054 2.038942
Cons. �4.330266 1.73747 �2.49 0.013 �7.735645 �0.9248867
2 [Defection]
Candidate Preference 0.0578885 0.0092481 6.26 0.000 0.0397627 0.0760144
Impedance �0.0209157 0.0152203 �1.37 0.169 �0.0507469 0.0089155
Alienation �0.005757 0.0162846 �0.35 0.724 �0.0376744 0.0261603
Strength of PI 1.356738 0.3934237 3.45 0.001 0.5856421 2.127835
Campaign Interest �0.1192176 0.3388698 �0.035 0.725 �0.7833902 0.544955
Contact 0.3612232 0.4146272 0.87 0.384 �0.4514313 1.173878
Cons. �2.759339 1.193285 �2.31 0.021 �5.098134 �0.4205441
Outcome choice ¼ 0 [Loyalty] is the comparison group.
Log likelihood ¼ �135:90556, number of observations ¼ 227, Wald v2ð12Þ ¼ 68:94, Prob v2 ¼ 0:0000,
pseudo R2 ¼ 0:2912.
611R. Pierce / Electoral Studies 23 (2004) 601–621
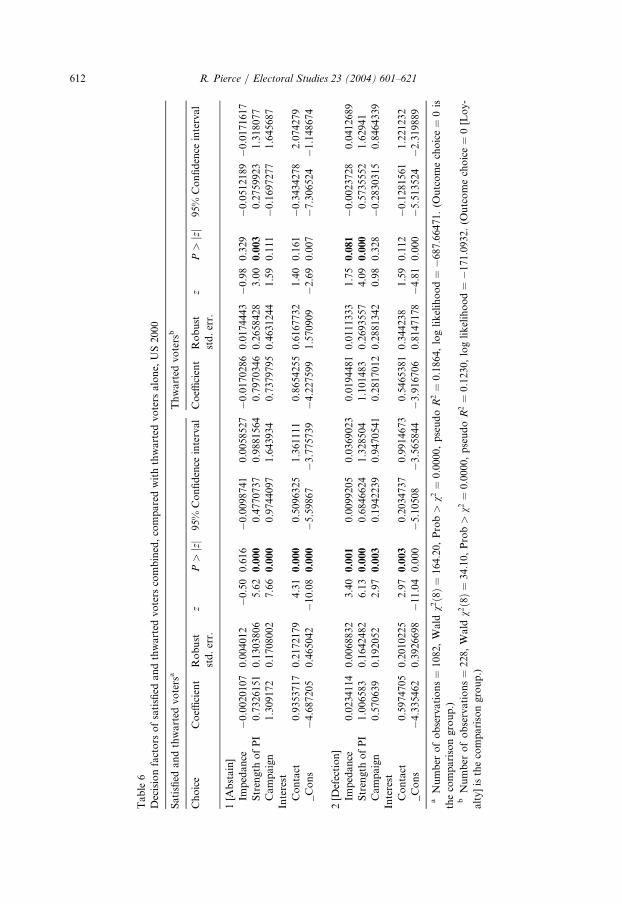
Table6
Decisionfactorsofsatisfied
andthwarted
voterscombined,comparedwiththwarted
votersalone,US2000
Satisfied
andthwarted
votersa
Thwarted
votersb
Choice
Coeffi
cient
Robust
std.err.
zP>
jzj95%
Confidence
interval
Coeffi
cient
Robust
std.err.
zP>
jzj95%
Confidence
interval
1[Abstain]
Impedance
�0.0020107
0.004012
�0.50
0.616
�0.0098741
0.0058527
�0.0170286
0.0174443
�0.98
0.329
�0.0512189
�0.0171617
Strength
ofPI
0.7326151
0.1303806
5.62
0.000
0.4770737
0.9881564
0.7970346
0.2658428
3.00
0.003
0.2759923
1.318077
Campaign
Interest
1.309172
0.1708002
7.66
0.000
0.9744097
1.643934
0.7379795
0.4631244
1.59
0.111
�0.1697277
1.645687
Contact
0.9353717
0.2172179
4.31
0.000
0.5096325
1.361111
0.8654255
0.6167732
1.40
0.161
�0.3434278
2.074279
_Cons
�4.687205
0.465042
�10.08
0.000
�5.59867
�3.775739
�4.227599
1.570909
�2.69
0.007
�7.306524
�1.148674
2[Defection]
Impedance
0.0234114
0.0068832
3.40
0.001
0.0099205
0.0369023
0.0194481
0.0111333
1.75
0.081
�0.0023728
0.0412689
Strength
ofPI
1.006583
0.1642482
6.13
0.000
0.6846624
1.328504
1.101483
0.2693557
4.09
0.000
0.5735552
1.62941
Campaign
Interest
0.570639
0.192052
2.97
0.003
0.1942239
0.9470541
0.2817012
0.2881342
0.98
0.328
�0.2830315
0.8464339
Contact
0.5974705
0.2010225
2.97
0.003
0.2034737
0.9914673
0.5465381
0.344238
1.59
0.112
�0.1281561
1.221232
_Cons
�4.335462
0.3926698
�11.04
0.000
�5.10508
�3.565844
�3.916706
0.8147178
�4.81
0.000
�5.513524
�2.319889
aNumber
ofobservations¼1082,Wald
v2ð8Þ¼
164:20,Prob>
v2¼
0:0000,pseudoR2¼
0:1864,
loglikelihood¼
�687:66471.(Outcomechoice¼0is
thecomparisongroup.)
bNumber
ofobservations¼228,Wald
v2ð8Þ¼
34:10,Prob>
v2¼
0:0000,
pseudoR2¼
0:1230,
loglikelihood¼
�171:0932.
(Outcomechoice¼0[Loy-
alty]isthecomparisongroup.)
R. Pierce / Electoral Studies 23 (2004) 601–621612
was probably exacerbated in our application because of the atypically small pro-
portions of abstentions reported by thwarted voters in 2000.7
The model produces several results that are consistent with those generated by
the same model for the earlier US presidential elections that most closely resembled
that of 2000 (those of 1976, 1980, and 1988), but it also displays some distinctive
characteristics. The features all four elections share in common include the over-
whelming power of Candidate Preference as a factor in affecting the choice of a
candidate and, consequently, the model’s considerable success in predicting Loy-
alty and Defection (but not Abstention). That pattern suggests that indifference,
which is captured principally by Candidate Preference, was comparatively weak as
a predictor in comparison with the matched polarizations that Candidate Prefer-
ence also expresses.Among the other variables deriving from the spatial model, neither Impedance
nor Alienation played a significant role in producing the outcomes. At first blush,
that might seem strange for Impedance, which actually registers as a negative fac-
tor, as one would think that the more a voter preferred a defeated contender for
the nomination to the person who actually received it the more likely that voter
would be to defect (or abstain) at the election. The logic of that consideration is
impeccable, but it is also quite possible for such effects to be limited or even
reversed by the play of other factors, such as Candidate Preference, to which we
have already referred, or Strength of Party Identification, to which we will refer in
a moment.8
Alienation had no significant effect. All we can say about its role in 2000 is that
it is consistent with its weakness in prior comparable years. Thwarted voters, as a
class, are more alienated than satisfied voters, but that does not seem to have had
any strong independent effect on their behavior.
7 We use multinomial logit to capture the implicit simultaneity of the choices among the three alter-
natives when the chronological ordering of the choices is unknown. For safety’s sake, we also ran pairs
of binomial logistic regressions, one distinguishing between voting and abstaining, and the other, among
respondents who voted, distinguishing between choices of candidate. These produce slightly different
coefficients and standard errors for the independent variables, but their overall messages are identical
with those expressed in Table 5, confirming the point made by Alvarez and Nagler (1998: pp. 60–66)
that multinomial logit is equivalent to binomial logit.8 In an effort to enrich our interpretation of the results for Candidate Preference and Impedance,
which both involve the difference between the thermometer scores assigned to pairs of candidates, we
decomposed them by substituting three new variables consisting of the direct thermometer scores out of
which those two variables were constructed. These new variables expressed (1) the thermometer score
assigned by the respondents to their party’s actual candidate, (2) the score assigned to that candidate’s
challenger for the nomination, and (3) the score assigned to the major party opponent of that candidate.
This operation indicated that the thwarted voters’ evaluations of their preferred but unsuccessful candi-
dates for the nomination had a modest (but not statistically significant) effect on their electoral partici-
pation, while their evaluations of the opposing party’s candidate had an important (and highly
significant) effect on their actual vote. Thwarted voters voted negatively in 2000, in the sense that their
choices of a candidate depended less on their assessments of their own party’s candidate than on their
evaluations of the candidate he opposed.
613R. Pierce / Electoral Studies 23 (2004) 601–621
Where the model shows the 2000 election to have been distinctive, at least forthwarted voters as a group regardless of party, is in the potency of Strength ofParty Identification as a factor in both Turnout and Candidate Choice.Strength of Party Identification is the only variable among our six that is indi-
vidually significant in accounting for Turnout. That is highly unusual. In compara-ble prior presidential years, partisan strength was significant for turnout only in1984. It was positively related to turnout in 1976 and 1988, but not statistically sig-nificant. Turnout by thwarted voters is usually dominated by Candidate Preferenceand Interest in the Campaign. Those two variables were highly significant in pro-moting Turnout in all three of our comparison years (1976, 1980, and 1988), butthat was just not the case in 2000. In that year, neither of those two variables wassignificant in bringing thwarted voters to the polls.9
Strength of Party Identification also flexed its muscles in 2000 with regard toCandidate Choice, although in this role it shared the honors with Candidate Pref-erence, while it reigned supreme alone in connection with Turnout. Strength ofParty Identification was previously significant with regard to Candidate Choice bythwarted voters, among our comparable years, only in 1980.Decomposition of our comprehensive group of thwarted voters into its two par-
tisan components shows that the dominant role of partisanship in 2000 was largelyconfined to the Democrats in our sample and absent from the Republicans. Thisimbalance is, of course, consistent with the data reported in Table 2 showing thatGore drew more support among thwarted Democrats than Bush did among thwar-ted Republicans.
7. Thwarted voters and the greater electorate compared
Until this point, we have applied our electoral model to the thwarted voters at the2000 US presidential election in isolation, and not in comparison with any othergroup of voters. It is, however, reasonable to ask whether thwarted voters responddistinctively to certain electoral forces, or whether they are—in their decision rules—simply a subset of and not very different from a larger pool of voters. Accordingly,we applied our basic model not only to the thwarted voters of 2000, but also to thelarger group of thwarted and satisfied voters combined. Remember that this com-bined group does not constitute the entire electorate, because the definition of boththwarted and satisfied voters requires that they supply an evaluation score for bothGore and Bradley, among the Democrats, or both Bush and McCain, among the
9 It is important to emphasize that we are not discussing here turnout by the electorate at large but
rather by our distinctive analytical subgroup of thwarted voters. At least since the publication of The
American Voter (Campbell et al., 1960), scholars have been aware that turnout normally varies across
the electorate by strength of partisanship and political involvement. One of the advantages of examining
such subgroups as thwarted voters is that it creates the necessity for explaining departures from more
general patterns of behavior and gives us the opportunity to do so. For example, although turnout
among thwarted voters in 2000 was not significantly affected by Candidate Preference or Interest in the
Campaign, those variables were highly significant for explaining turnout by satisfied voters in 2000.
R. Pierce / Electoral Studies 23 (2004) 601–621614
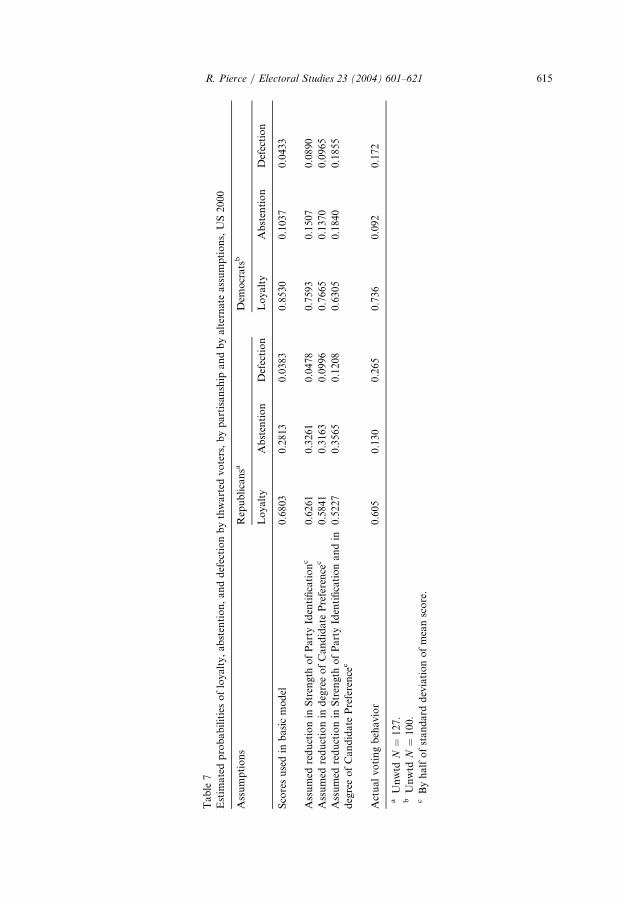
Table7
Estimatedprobabilitiesofloyalty,abstention,anddefectionbythwarted
voters,bypartisanship
andbyalternateassumptions,US2000
Assumptions
Republicansa
Dem
ocratsb
Loyalty
Abstention
Defection
Loyalty
Abstention
Defection
Scoresusedin
basicmodel
0.6803
0.2813
0.0383
0.8530
0.1037
0.0433
Assumed
reductionin
StrengthofPartyIdentificationc
0.6261
0.3261
0.0478
0.7593
0.1507
0.0890
Assumed
reductionin
degreeofCandidatePreference
c0.5841
0.3163
0.0996
0.7665
0.1370
0.0965
Assumed
reductionin
StrengthofPartyIdentificationandin
degreeofCandidatePreference
c0.5227
0.3565
0.1208
0.6305
0.1840
0.1855
Actualvotingbehavior
0.605
0.130
0.265
0.736
0.092
0.172
aUnwtd
N¼127.
bUnwtd
N¼100.
cByhalfofstandard
deviationofmeanscore.
615R. Pierce / Electoral Studies 23 (2004) 601–621
Republicans. Still, that larger group includes almost 80% of the large fraction of theUS electorate that claimed some degree of partisan attachment in 2000.When the model was applied to the larger, combined group, the two variables of
Candidate Preference and Alienation dropped out of the regression because of col-linearity. There was just not enough variance in those variables across the largergroup to permit meaningful measures of association to be created between themand the dependent variable expressing electoral choice. To produce as exact a com-parison as possible between the thwarted voters and the larger combined group, wealso dropped those two independent variables from the regression analysis for thesmaller group of thwarted voters alone.The regression analyses comparing the thwarted voters alone and these com-
bined with the satisfied voters appear in Table 6. Dropping Candidate Preferenceand Alienation accounts for the slight differences between Table 5 and the right-hand part of Table 6.It appears clearly that while almost all of the remaining factors in the vote are
highly significant for the larger group, fewer of them have a significant effect on thedecisions of the thwarted voters alone.With regard to turnout, Strength of Party Identification, Campaign Interest, and
Contact by party workers are powerful forces for the combined group, while onlyStrength of Party Identification has a significant effect for the thwarted (and this,as we saw earlier, only for Democrats). Neither interest in the campaign nor solici-tation by party workers had a real effect on the thwarted in 2000.Every factor in our small inventory had a significant effect on whether voters in
the larger group defected from their partisan affiliation, but this demonstration ofraw motivational power is somewhat misleading, because defections were such asmall proportion of the outcomes produced by this group. Matching polaritiesbetween the independent variables and decisions not to defect greatly outnumberedthose between the independent variables and decisions to defect among the smallernumber of thwarted voters.Among the thwarted voters, defections were governed most by Strength of Party
Identification. Impedance shows some signs of life although it only skirts statisticalsignificance. In our earlier analysis, presented in Table 5, which included CandidatePreference and Alienation, Impedance registered as a negative factor in the defec-tions of thwarted voters. Here at last, in Table 6, we find some glimmering thatwhat we would expect to have happened may actually have done so.
8. Probabilistic effects of adjustments in parameters
The controlling variables affecting the turnout rate and the candidate choices ofthe thwarted voters of 2000 were Strength of Party Identification, for Democrats,and Candidate Preference (the voters’ comparative evaluations of George W. Bushand Al Gore) for voters of both parties. We may, therefore, reasonably ask howmuch change in the actual electoral outcome would likely have occurred had thevalues of those variables among the thwarted voters been different from what theyactually were.
R. Pierce / Electoral Studies 23 (2004) 601–621616
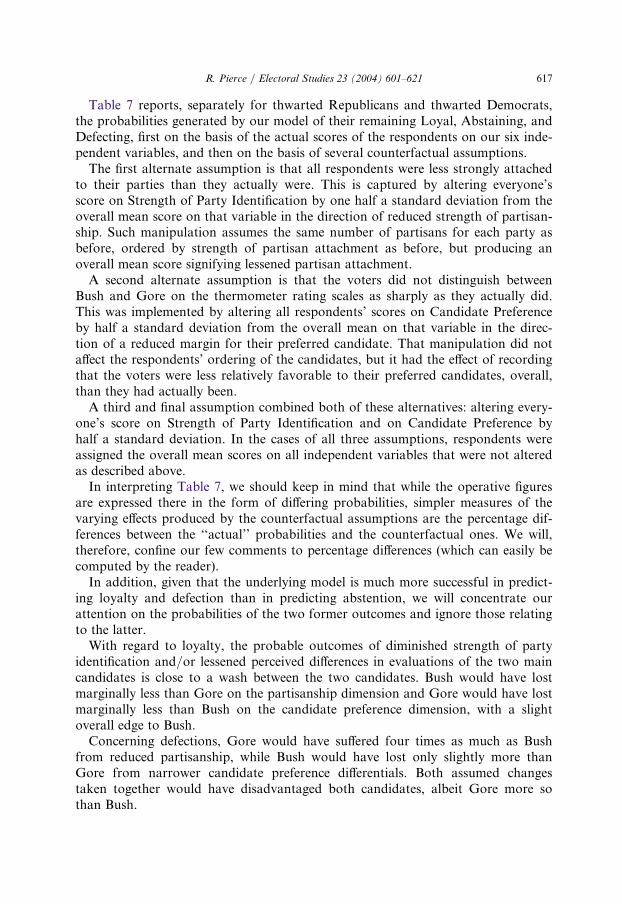
Table 7 reports, separately for thwarted Republicans and thwarted Democrats,the probabilities generated by our model of their remaining Loyal, Abstaining, andDefecting, first on the basis of the actual scores of the respondents on our six inde-pendent variables, and then on the basis of several counterfactual assumptions.The first alternate assumption is that all respondents were less strongly attached
to their parties than they actually were. This is captured by altering everyone’sscore on Strength of Party Identification by one half a standard deviation from theoverall mean score on that variable in the direction of reduced strength of partisan-ship. Such manipulation assumes the same number of partisans for each party asbefore, ordered by strength of partisan attachment as before, but producing anoverall mean score signifying lessened partisan attachment.A second alternate assumption is that the voters did not distinguish between
Bush and Gore on the thermometer rating scales as sharply as they actually did.This was implemented by altering all respondents’ scores on Candidate Preferenceby half a standard deviation from the overall mean on that variable in the direc-tion of a reduced margin for their preferred candidate. That manipulation did notaffect the respondents’ ordering of the candidates, but it had the effect of recordingthat the voters were less relatively favorable to their preferred candidates, overall,than they had actually been.A third and final assumption combined both of these alternatives: altering every-
one’s score on Strength of Party Identification and on Candidate Preference byhalf a standard deviation. In the cases of all three assumptions, respondents wereassigned the overall mean scores on all independent variables that were not alteredas described above.In interpreting Table 7, we should keep in mind that while the operative figures
are expressed there in the form of differing probabilities, simpler measures of thevarying effects produced by the counterfactual assumptions are the percentage dif-ferences between the ‘‘actual’’ probabilities and the counterfactual ones. We will,therefore, confine our few comments to percentage differences (which can easily becomputed by the reader).In addition, given that the underlying model is much more successful in predict-
ing loyalty and defection than in predicting abstention, we will concentrate ourattention on the probabilities of the two former outcomes and ignore those relatingto the latter.With regard to loyalty, the probable outcomes of diminished strength of party
identification and/or lessened perceived differences in evaluations of the two maincandidates is close to a wash between the two candidates. Bush would have lostmarginally less than Gore on the partisanship dimension and Gore would have lostmarginally less than Bush on the candidate preference dimension, with a slightoverall edge to Bush.Concerning defections, Gore would have suffered four times as much as Bush
from reduced partisanship, while Bush would have lost only slightly more thanGore from narrower candidate preference differentials. Both assumed changestaken together would have disadvantaged both candidates, albeit Gore more sothan Bush.
617R. Pierce / Electoral Studies 23 (2004) 601–621
What emerges from this counterfactual exercise is an image of two subsets ofopposing partisan electorates, which we know (by definition) to have been disap-pointed by their party’s choice of a candidate, being bombarded by finely tunedmessages designed to arouse their partisan loyalties and to convince them of thesuperiority of their party’s candidate over that of the other. Both sides did remark-ably well among their respective pools of potentially uncertain supporters. The par-tisan card played somewhat better for Gore than for Bush, while the candidatecomparison worked somewhat better for Bush than for Gore, judging by howmuch each of them might have lost if their messages had fallen on less receptiveears. But the differences were marginal at best.
9. Discussion
We have called attention to the role in the 2000 US presidential election of ahitherto underexplored but periodically important category of voters: partisansympathizers who were thwarted because their preferred candidate did not receivehis party’s nomination and did not appear on the ballot. We have modeled theelectoral behavior of these thwarted voters, as well as estimated the effects of theirbehavior on the electoral outcome.
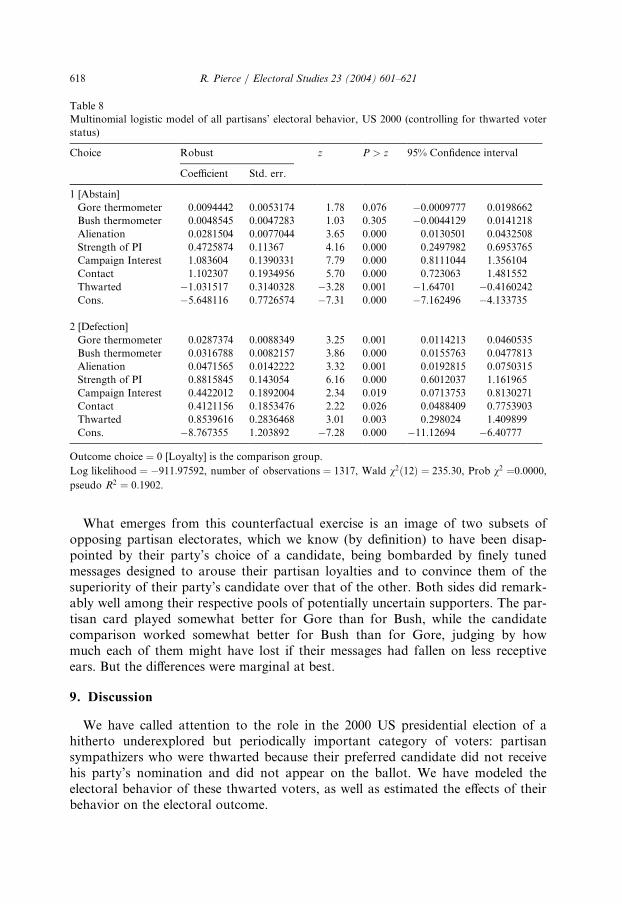
Table 8
Multinomial logistic model of all partisans’ electoral behavior, US 2000 (controlling for thwarted voter
status)
Choice Robust z P > z 95% Confidence interval
Coefficient Std. err.
1 [Abstain]
Gore thermometer 0.0094442 0.0053174 1.78 0.076 �0.0009777 0.0198662
Bush thermometer 0.0048545 0.0047283 1.03 0.305 �0.0044129 0.0141218
Alienation 0.0281504 0.0077044 3.65 0.000 0.0130501 0.0432508
Strength of PI 0.4725874 0.11367 4.16 0.000 0.2497982 0.6953765
Campaign Interest 1.083604 0.1390331 7.79 0.000 0.8111044 1.356104
Contact 1.102307 0.1934956 5.70 0.000 0.723063 1.481552
Thwarted �1.031517 0.3140328 �3.28 0.001 �1.64701 �0.4160242Cons. �5.648116 0.7726574 �7.31 0.000 �7.162496 �4.133735
2 [Defection]
Gore thermometer 0.0287374 0.0088349 3.25 0.001 0.0114213 0.0460535
Bush thermometer 0.0316788 0.0082157 3.86 0.000 0.0155763 0.0477813
Alienation 0.0471565 0.0142222 3.32 0.001 0.0192815 0.0750315
Strength of PI 0.8815845 0.143054 6.16 0.000 0.6012037 1.161965
Campaign Interest 0.4422012 0.1892004 2.34 0.019 0.0713753 0.8130271
Contact 0.4121156 0.1853476 2.22 0.026 0.0488409 0.7753903
Thwarted 0.8539616 0.2836468 3.01 0.003 0.298024 1.409899
Cons. �8.767355 1.203892 �7.28 0.000 �11.12694 �6.40777
Outcome choice ¼ 0 [Loyalty] is the comparison group.
Log likelihood ¼ �911:97592, number of observations ¼ 1317, Wald v2ð12Þ ¼ 235:30, Prob v2 ¼0:0000,pseudo R2 ¼ 0:1902.
R. Pierce / Electoral Studies 23 (2004) 601–621618
It remains for us to consider whether the category of thwarted voters is suffi-
ciently distinctive to warrant such detailed analysis. After all, its key definitional
element is that the voter has a lower opinion of his or her party’s presidential can-
didate than of someone else who unsuccessfully competed with the nominee during
the primary season. Perhaps the operative factor in the electoral behavior of these
voters is simply the comparatively low evaluation assigned to the party’s nominee,
without regard to the higher score awarded to an unsuccessful challenger. Does the
memory of a preferred but absent candidate add explanatory power for the elec-
toral behavior of a voter beyond that already produced by the low score assigned
to the actual candidate?The closest we can come to answering this question is by running a multinomial
regression model of turnout and candidate choice (measured identically with the
dependent variable of the model reported in Table 5), but (a) embracing the entire
partisan electorate, (b) including the direct thermometer evaluations of the two
major-party candidates as independent variables along with all the other variables
of our basic model (again, as reported in Table 5) except for Candidate Preference
and Impedance, and (c) also including a dummy variable (‘‘Thwarted’’) distin-
guishing ‘‘thwarted voters’’ (coded 1) from everyone else (coded 0).If being a ‘‘thwarted voter’’ as defined here has no independent effect on elec-
toral behavior, but is simply the expression of low evaluations of the nominee of
the voter’s party, we would expect the results of the regression to be driven essen-
tially by the direct candidate evaluations and whatever other independent variables
normally affect turnout and candidate choice. The dummy variable distinguishing
thwarted voters from other partisans should contribute little to the results indepen-
dently. That is not what we find, as Table 8 indicates.All the independent variables except the dummy (‘‘Thwarted’’) are positively
associated with turnout, although the thermometer evaluations of Gore and Bush
are not significant. Thwarted, which is negatively related to turnout, is more sig-
nificant than either of the candidate evaluation variables. After the latter have
made their contribution to the overall regression, a significant independent contri-
bution to the outcome is made by the voters who were ‘‘thwarted’’ within the
meaning attributed to the term here.Essentially the same conclusion may be drawn from the part of the regression
relating to candidate choice. Here, all the independent variables are significantly
associated with electoral loyalty to the candidate of one’s own party, including
whether or not one is ‘‘thwarted’’, the latter at a significance level statistically
indistinguishable from that attaching to the direct candidate evaluations. Once
again, inclusion of the ‘‘thwarted’’ dummy variable contributes to the bite of a
model that includes unvarnished candidate evaluations.10
10 As we would expect, the results of both parts of the multinomial logistic regression are confirmed by
those produced by two binomial regressions, one relating to turnout and the other, among respondents
who voted, relating to their candidate choices.
619R. Pierce / Electoral Studies 23 (2004) 601–621
At least at the 2000 US election, it is analytically useful to distinguish between avoter who merely has a poor opinion of the candidate of his or her party and avoter whose poor opinion of the candidate is coupled with a better opinion of analternate candidate of the same party. The evidence we have presented suggeststhat a poor opinion of a candidate gains in motivational potential when it has apolitically relevant comparative component. Indeed, in many cases, the higherevaluation of the alternate candidate may be the basis for the lesser evaluation ofthe actual nominee.Students of US politics have long been aware of the potentially damaging effects
that primary rivalries can have on the electoral fortunes of US parties, but for vari-ous reasons, including the lack of uniformity and unsystematic character of USprimary elections, it has been difficult to focus analytical attention on those voterswhom the nomination process frustrates.We have relied on preelectoral thermometer evaluation scores to identify both
Republican and Democratic party sympathizers whom we consider thwartedbecause their preferred candidate, among those who contended for their party’snomination, was not successful in winning it. We have shown that those voterssupported their parties’ candidates in 2000 at lower rates than did their fellow par-tisans who were satisfied with those candidates. Bush suffered from defections to agreater extent than Gore did, but both candidates produced historically impressivebacking from their respective pools of potential partisan supporters.Both simple arithmetical and probabilistic model-induced simulations suggest,
however, that the thwarted voters cannot be considered to have been a marginallycritical electoral group in 2000. The alternate scenarios we tested indicated that theelectoral outcome (in national vote totals) would have been little affected by any ofseveral counterfactual assumptions.Probably the most commonplace commentary on the 2000 election has been how
close the outcome was. Our examination of the role of the thwarted voters puts aparticular gloss on that obvious point. The overwhelming impression that emergesfrom both our estimates of the actual behavior of the thwarted voters and of whatmight have occurred under altered circumstances (Tables 4 and 7) is of two oppos-ing candidates who exploited their respective partisan bases and candidate appealto the limits of the possible.
Acknowledgements
We are grateful to James F. Adams and Charles H. Franklin for their generousaid and advice in the preparation of this article, as well as to an anonymousreviewer for stimulating and constructive criticism.
References
Alvarez, R.M., Nagler, J., 1998. When politics and models collide: estimating models of multiparty elec-
tions. American Journal of Political Science 42, 55–96.
R. Pierce / Electoral Studies 23 (2004) 601–621620
ANES, 1988. The Presidential Nomination Process [Super Tuesday]. ICPSR Study 9093.
Atkeson, L.R., 1998. Divisive primaries and general election outcomes: another look at presidential
campaigns. American Journal of Political Science 42, 256–271.
Burns, N., Kinder, D.R., Rosenstone, S.J., Sapiro, V. The National Election Studies, 2001. National
Election Studies, 2000: Pre-/Post-Election Study (Dataset). Center for Political Studies, University of
Michigan, Ann Arbor, MI, ((producer and distributor)).
Campbell, A., Converse, P.E., Miller, W.E., Stokes, D., 1960. The American Voter. Wiley, New York.
Converse, P.E., Dupeux, G., 1966. De Gaulle and Eisenhower: the public image of the victorious gen-
eral. In: Campbell, A., Converse, P.E., Miller, W.E., Stokes, D.E. (Eds.), Elections and the Political
Order. Wiley, New York.
Davis, O.A., Hinich, M.J., Ordeshook, P.C., 1970. An expository development of a mathematical model
of the electoral process. American Political Science Review 64, 426–448.
Downs, A., 1957. An Economic Theory of Democracy. Harper & Brothers, New York.
Mayer, W.G., 1997. The presidential nominations. In: Pomper, G.M., et al.(Eds.), The Election of 1996:
Reports and Interpretations. Chatham House, Chatham, NJ.
Pierce, R., 2003. Modeling electoral second choices: thwarted voters in the United States, France and
Russia. Electoral Studies 22, 265–285.
Riker, W.H., Ordeshook, P.C., 1968. A theory of the calculus of voting. American Political Science
Review 62, 25–42.
Southwell, P.L., 1986. The politics of disgruntlement: non-voting and defection among supporters of
nomination losers, 1968–1984. Political Behavior 8, 81–95.
Stone, W.J., 1986. The carryover effect in presidential elections. American Political Science Review 80,
271–279.
Stone, W.J., Atkeson, L.R., Rapoport, R., 1992. Turning on and turning off? Mobilization and demobi-
lization effects of presidential nomination campaigns. American Journal of Political Science 36, 665–
691.
621R. Pierce / Electoral Studies 23 (2004) 601–621