Embed Size (px)
Citation preview
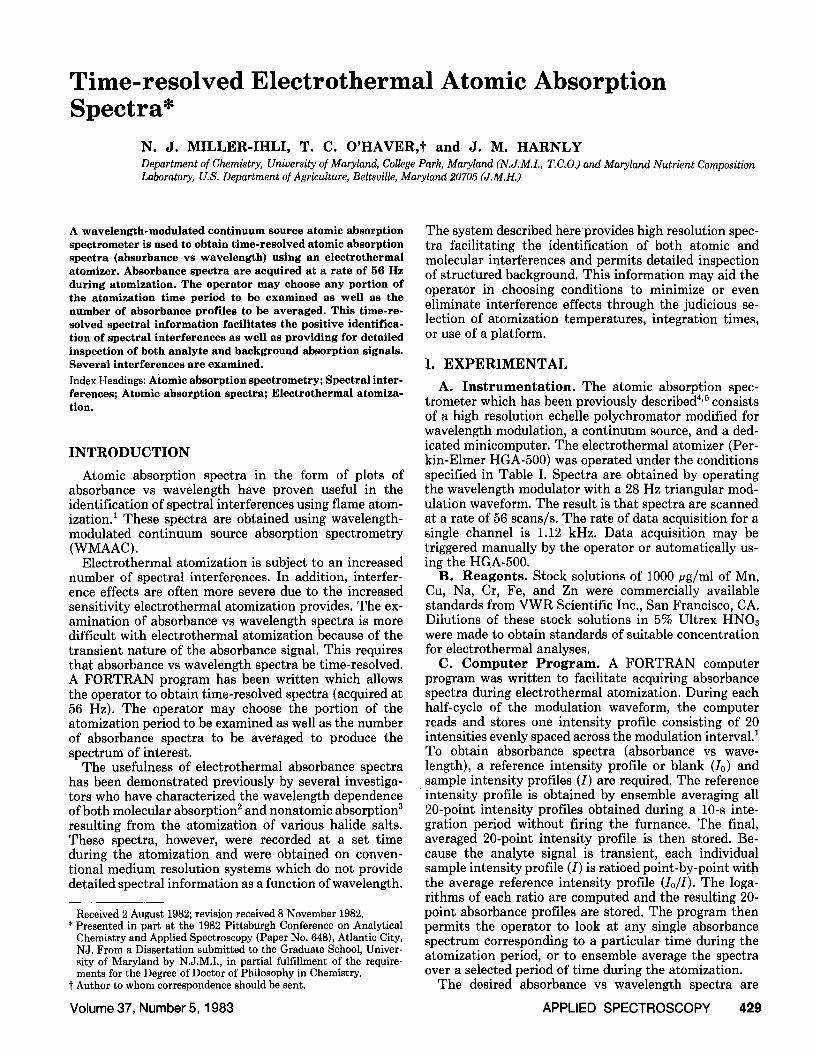
Time-resolved Electrothermal Atomic Absorption Spectra*
N . J . M I L L E R - I H L I , T . C. O ' H A V E R , t a n d J . M. H A R N L Y Department of Chemistry, University of Maryland, College Park, Maryland (N.J.M.I., T.C.O.) and Maryland Nutrient Composition Laboratory, U.S. Department of Agriculture, Beltsville, Maryland 20705 (J.M.H.)
A wavelength-modulated continuum source atomic absorption spectrometer is used to obtain time-resolved atomic absorption spectra (absorbance vs wavelength) using an electrothermal atomizer. Absorbance spectra are acquired at a rate of 56 Hz during atomization. The operator may choose any portion of the atomization time period to be examined as well as the number of absorbance profiles to be averaged. This time-re- solved spectral information facilitates the positive identifica- tion of spectral interferences as well as providing for detailed inspection of both analyte and background absorption signals. Several interferences are examined. Index Headings: Atomic absorption spectrometry; Spectral inter- ferences; Atomic absorption spectra; Electrothermal atomiza- tion.
I N T R O D U C T I O N
Atomic absorption spectra in the form of plots of absorbance vs wavelength have proven useful in the identification of spectral interferences using flame atom- ization. 1 These spectra are obtained using wavelength- modulated continuum source absorption spectrometry (WMAAC).
Electrothermal atomization is subject to an increased number of spectral interferences. In addition, interfer- ence effects are often more severe due to the increased sensitivity electrothermal atomization provides. The ex- amination of absorbance vs wavelength spectra is more difficult with electrothermal atomization because of the transient nature of the absorbance signal. This requires that absorbance vs wavelength spectra be time-resolved. A FORTRAN program has been written which allows the operator to obtain time-resolved spectra (acquired at 56 Hz). The operator may choose the portion of the atomization period to be examined as well as the number of absorbance spectra to be averaged to produce the spectrum of interest.
The usefulness of electrothermal absorbance spectra has been demonstrated previously by several investiga- tors who have characterized the wavelength dependence of both molecular absorption 2 and nonatomic absorption 3 resulting from the atomization of various halide salts. These spectra, however, were recorded at a set time during the atomization and were obtained on conven- tional medium resolution systems which do not provide detailed spectral information as a function of wavelength.
Received 2 August 1982; revision received 8 November 1982. * Presented in part at the 1982 Pittsburgh Conference on Analytical
Chemistry and Applied Spectroscopy (Paper No. 648), Atlantic City, NJ. From a Dissertation submitted to the Graduate School, Univer- sity of Maryland by N.J.M.I., in partial fulfillment of the require- ments for the Degree of Doctor of Philosophy in Chemistry.
"t Author to whom correspondence should be sent.
Volume 37, Number 5, 1983
The system described here provides high resolution spec- tra facilitating the identification of both atomic and molecular interferences and permits detailed inspection of structured background. This information may aid the operator in choosing conditions to minimize or even eliminate interference effects through the judicious se- lection of atomization temperatures, integration times, or use of a platform.
I. E X P E R I M E N T A L
A. I n s t r u m e n t a t i o n . The atomic absorption spec- trometer which has been previously described 4'5 consists of a high resolution echelle polychromator modified for wavelength modulation, a continuum source, and a ded- icated minicomputer. The electrothermal atomizer (Per- kin-Elmer HGA-500) was operated under the conditions specified in Table I. Spectra are obtained by operating the wavelength modulator with a 28 Hz triangular mod- ulation waveform. The result is that spectra are scanned at a rate of 56 scans/s. The rate of data acquisition for a single channel is 1.12 kHz. Data acquisition may be triggered manually by the operator or automatically us- ing the HGA-500.
B. Reagen t s . Stock solutions of 1000 ~g/ml of Mn, Cu, Na, Cr, Fe, and Zn were commercially available standards from VWR Scientific Inc., San Francisco, CA. Dilutions of these stock solutions in 5% Ultrex HNO3 were made to obtain standards of suitable concentration for electrothermal analyses.
C. C o m p u t e r P r o g r a m . A FORTRAN computer program was written to facilitate acquiring absorbance spectra during electrothermal atomization. During each half-cycle of the modulation waveform, the computer reads and stores one intensity profile consisting of 20 intensities evenly spaced across the modulation interval. 1 To obtain absorbance spectra (absorbance vs wave- length), a reference intensity profile or blank (I0) and sample intensity profiles (I) are required. The reference intensity profile is obtained by ensemble averaging all 20-point intensity profiles obtained during a 10-s inte- gration period without firing the furnance. The final, averaged 20-point intensity profile is then stored. Be- cause the analyte signal is transient, each individual sample intensity profile (I) is ratioed point-by-point with the average reference intensity profile (Io/I). The loga- rithms of each ratio are computed and the resulting 20- point absorbance profiles are stored. The program then permits the operator to look at any single absorbance spectrum corresponding to a particular time during the atomization period, or to ensemble average the spectra over a selected period of time during the atomization.
The desired absorbance vs wavelength spectra are
APPLIED SPECTROSCOPY 429
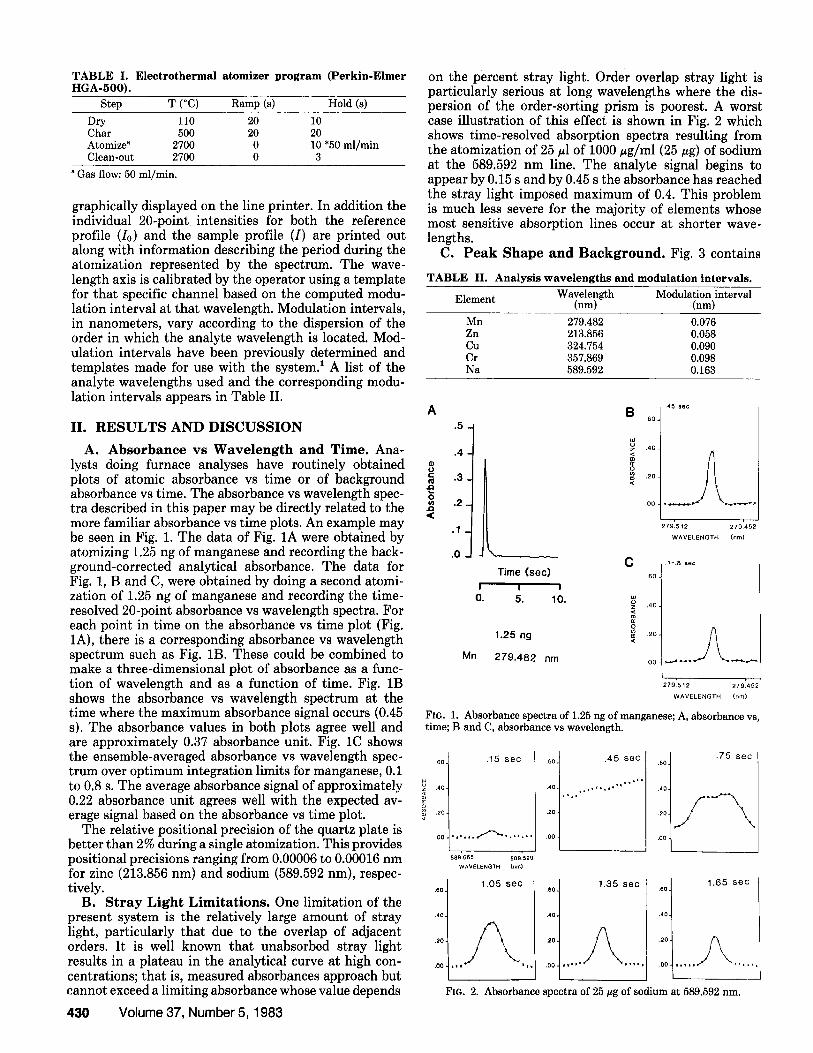
T A B L E I. Electrothermal atomizer program (Perkin-Elmer HGA-500) .
Step T (°C) Ramp (s) Hold (s)
Dry 110 20 10 Char 500 20 20 Atomize a 2700 0 10 *50 ml/min Clean-out 2700 0 3
a Gas flow: 50 mi/min.
graphically displayed on the line printer. In addition the individual 20-point intensities for both the reference profile (Io) and the sample profile (I) are printed out along with information describing the period during the atomization represented by the spectrum. The wave- length axis is calibrated by the operator using a template for that specific channel based on the computed modu- lation interval at that wavelength. Modulation intervals, in nanometers, vary according to the dispersion of the order in which the analyte wavelength is located. Mod- ulation intervals have been previously determined and templates made for use with the system. 1 A list of the analyte wavelengths used and the corresponding modu- lation intervals appears in Table II.
on the percent stray light. Order overlap stray light is particularly serious at long wavelengths where the dis- persion of the order-sorting prism is poorest. A worst case illustration of this effect is shown in Fig. 2 which shows time-resolved absorption spectra resulting from the atomization of 25 ~l of 1000 ~g/ml (25 ~g) of sodium at the 589.592 nm line. The analyte signal begins to appear by 0.15 s and by 0.45 s the absorbance has reached the stray light imposed maximum of 0.4. This problem is much less severe for the majority of elements whose most sensitive absorption lines occur at shorter wave- lengths.
C. P e a k Shape and Background. Fig. 3 contains
T A B L E II. Analysis wavelengths and modulation intervals.
Element Wavelength Modulation interval (nm) (nm)
Mn 279.482 0.076 Zn 213.856 0.058 Cu 324.754 0.090 Cr 357.869 0.098 Na 589.592 0.163
.45 s e c A B 60 .
II. R E S U L T S AND DISCUSSION
A. Absorbance vs Wavelength and Time. Ana- lysts doing furnace analyses have routinely obtained
O
plots of atomic absorbance vs time or of background absorbance vs time. The absorbance vs wavelength spec- tra described in this paper may be directly related to the more familiar absorbance vs time plots. An example may be seen in Fig. 1. The data of Fig. 1A were obtained by atomizing 1.25 ng of manganese and recording the back- ground-corrected analytical absorbance. The data for Fig. 1, B and C, were obtained by doing a second atomi- zation of 1.25 ng of manganese and recording the time- resolved 20-point absorbance vs wavelength spectra. For each point in time on the absorbance vs time plot (Fig. 1A), there is a corresponding absorbance vs wavelength spectrum such as Fig. lB. These could be combined to make a three-dimensional plot of absorbance as a func- tion of wavelength and as a function of time. Fig. 1B shows the absorbance vs wavelength spectrum at the time where the maximum absorbance signal occurs (0.45 s). The absorbance values in both plots agree well and are approximately 0.37 absorbance unit. Fig. 1C shows the ensemble-averaged absorbance vs wavelength spec- ~o trum over optimum integration limits for manganese, 0.1 to 0.8 s. The average absorbance signal of approximately ~ .... 0.22 absorbance unit agrees well with the expected av- erage signal based on the absorbance vs time plot. ~ ....
The relative positional precision of the quartz plate is better than 2% during a single atomization. This provides positional precisions ranging from 0.00006 to 0.00016 nm for zinc (213.856 nm) and sodium (589.592 nm), respec- tively.
B. S t r a y Light Limitations. One limitation of the present system is the relatively large amount of stray light, particularly that due to the overlap of adjacent orders. It is well known that unabsorbed stray light results in a plateau in the analytical curve at high con- centrations; that is, measured absorbances approach but cannot exceed a limiting absorbance whose value depends
430 Volume 37, Number 5, 1983
.5
.4
.2
.1
.0
I
O.
Mn
. 40 ,
20 -
.OO •
L_ C
Time (sec) 60 ! I
5. 10. ,40
1.25 ng 2o
279.482 nm .o9
279 .512 279 .452
WAVELENGTH (nm)
. 1 - . 8 s e c
279 .512 279 .452
WAVELENGTH (nm)
FIG. 1. Absorbance spectra of 1.25 ng of manganese; A, absorbance vs, time; B and C, absorbance vs wavelength.
.15 sec
SS~E55 5aols2~ WAVELENGTH {rim)
"e01.4o 1.05 8ec
6o .45 sec
.2O
.00
.60,
.40.
.20,
.00
.75 sec
1.35 sec .60
.00 ~v = ' " * q~ '
1.65 sec .60
2 0
,00 = . . , I ' ' , , ,
FIG. 2. Absorbance spectra of 25 #g of sodium at 589.592 nm.
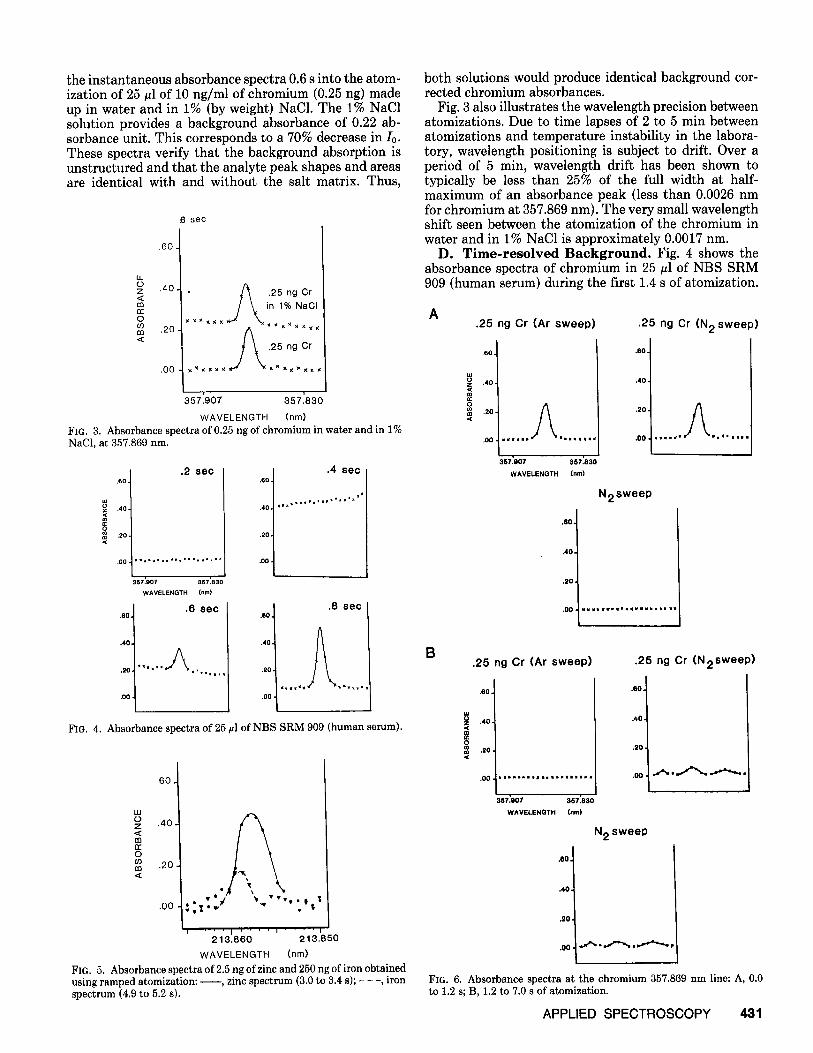
the instantaneous absorbance spectra 0.6 s into the atom- ization of 25 ttl of 10 ng/ml of chromium (0.25 ng) made up in water and in 1% (by weight) NaC1. The 1% NaC1 solution provides a background absorbance of 0.22 ab- sorbance unit. This corresponds to a 70% decrease in Io. These spectra verify that the background absorption is unstructured and that the analyte peak shapes and areas are identical with and without the salt matrix. Thus,
.6 sec
.60 -
LU
° h z .40 .25 ng Cr < ~:m . / ~ in lO/o NaCi
< .2 ng Cr
357.907 3571830
WAVELENGTH (rim)
FIG. 3. Absorbance spectra of 0.25 ng of chromium in water and in 1% NaC1, at 357.869 nm.
.2 sec .60
.40
.20 -
.4 sec .eoJ
.4o4 ='*
.2o.I
.oo 4
367.907 357.830 WAVELENGTH (nm)
.6 sec .00.
.40,
.00
.8 sec .eo.I
,20
.00
Fro. 4. Absorbance spectra of 25 #1 of NBS SRM 909 (human serum).
60
LU o .40 X < m
O 03 .20 f13 <
.oo :: I . . . . I . . . . u . . . .
213 .860 213 .850
WAVELENGTH (nm)
FIG. 5. Absorbance spectra of 2.5 ng of zinc and 250 ng of iron obtained using ramped atomization: , zinc spectrum (3.0 to 3.4 s); - - -, iron spectrum (4.9 to 5.2 s).
both solutions would produce identical background cor- rected chromium absorbances.
Fig. 3 also illustrates the wavelength precision between atomizations. Due to time lapses of 2 to 5 min between atomizations and temperature instability in the labora- tory, wavelength positioning is subject to drift. Over a period of 5 rain, wavelength drift has been shown to typically be less than 25% of the full width at half- maximum of an absorbance peak (less than 0.0026 nm for chromium at 357.869 nm). The very small wavelength shift seen between the atomization of the chromium in water and in 1% NaC1 is approximately 0.0017 nm.
D. Time-reso lved Background. Fig. 4 shows the absorbance spectra of chromium in 25 ttl of NBS SRM 909 (human serum) during the first 1.4 s of atomization.
A .25 ng Cr (Ar sweep)
'60 t
"40' t ~ ,20
,00 ==11== ==1=~]==
357.307 367.830 WAVELENGTH (nm)
.25 ng Cr (N 2 s w e e p )
.60 .I
.4o -I
"°] A .03 ===='u w'IJmu=
N 2 swe ep
. 60 .
.40
,20
,00. m u u N ~ v ' w l a q w u m a m u a u w
B .25 ng Cr (Ar sweep) .25 ng Cr ( N 2 s w e e p )
.60.
.40.
.20
.00
357:B07 367:030 WAVELENGTH (nm)
.6o .I
.~,o .I
=o 4
N 2 sweep
.60.
.40.
.20
FIG. 6. Absorbance spectra at the chromium 357.869 nm line: A, 0.0 to 1.2 s; B, 1.2 to 7.0 s of atomization.
APPLIED SPECTROSCOPY 431
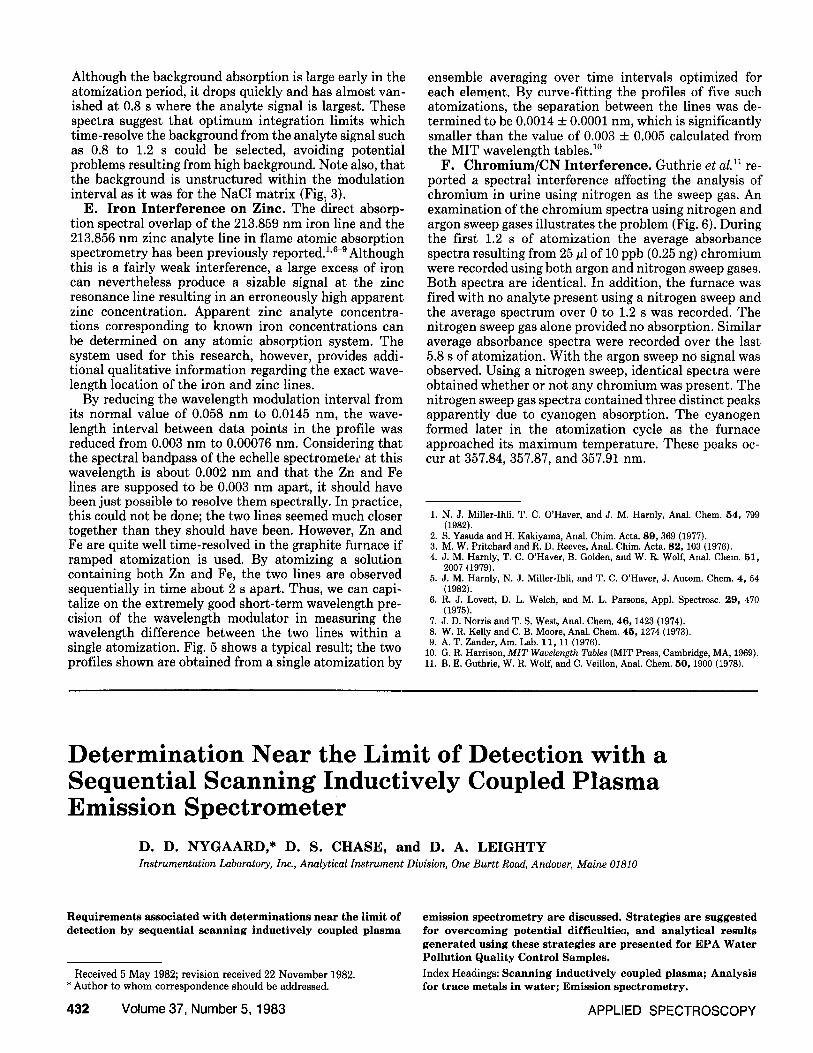
Although the background absorption is large early in the atomization period, it drops quickly and has almost van- ished at 0.8 s where the analyte signal is largest. These spectra suggest that optimum integration limits which time-resolve the background from the analyte signal such as 0.8 to 1.2 s could be selected, avoiding potential problems resulting from high background. Note also, that the background is unstructured within the modulation interval as it was for the NaC1 matrix (Fig: 3).
E. Iron Interference on Zinc. The direct absorp- tion spectral overlap of the 213.859 nm iron line and the 213.856 nm zinc analyte line in flame atomic absorption spectrometry has been previously reported. 1'6-9 Although this is a fairly weak interference, a large excess of iron can nevertheless produce a sizable signal at the zinc resonance line resulting in an erroneously high apparent zinc concentration. Apparent zinc analyte concentra- tions corresponding to known iron concentrations can be determined on any atomic absorption system. The system used for this research, however, provides addi- tional qualitative information regarding the exact wave- length location of the iron and zinc lines.
By reducing the wavelength modulation interval from its normal value of 0.058 nm to 0.0145 nm, the wave- length interval between data points in the profile was reduced from 0.003 nm to 0.00076 nm. Considering that the spectral bandpass of the echelle spectromete,' at this wavelength is about 0.002 nm and that the Zn and Fe lines are supposed to be 0.003 nm apart, it should have been just possible to resolve them spectrally. In practice, this could not be done; the two lines seemed much closer together than they should have been. However, Zn and Fe are quite well time-resolved in the graphite furnace if ramped atomization is used. By atomizing a solution containing both Zn and Fe, the two lines are observed sequentially in time about 2 s apart. Thus, we can capi- talize on the extremely good short-term wavelength pre- cision of the wavelength modulator in measuring the wavelength difference between the two lines within a single atomization. Fig. 5 shows a typical result; the two profiles shown are obtained from a single atomization by
ensemble averaging over time intervals optimized for each element. By curve-fitting the profiles of five such atomizations, the separation between the lines was de- termined to be 0.0014 ± 0.0001 nm, which is significantly smaller than the value of 0.003 ± 0.005 calculated from the MIT wavelength tables. 1°
F. C h r o m i u m / C N In t e r f e r ence . Guthrie e t al. 11 re- ported a spectral interference affecting the analysis of chromium in urine using nitrogen as the sweep gas. An examination of the chromium spectra using nitrogen and argon sweep gases illustrates the problem (Fig. 6). During the first 1.2 s of atomization the average absorbance spectra resulting from 25 ~l of 10 ppb (0.25 ng) chromium were recorded using both argon and nitrogen sweep gases. Both spectra are identical. In addition, the furnace was fired with no analyte present using a nitrogen sweep and the average spectrum over 0 to 1.2 s was recorded. The nitrogen sweep gas alone provided no absorption. Similar average absorbance spectra were recorded over the last 5.8 s of atomization. With the argon sweep no signal was observed. Using a nitrogen sweep, identical spectra were obtained whether or not any chromium was present. The nitrogen sweep gas spectra contained three distinct peaks apparently due to cyanogen absorption. The cyanogen formed later in the atomization cycle as the furnace approached its maximum temperature. These peaks oc- cur at 357.84, 357.87, and 357.91 nm.
1. N. J. Miller-Ihli, T. C. O'Haver, and J. M. Harnly, Anal. Chem. 54, 799 (1982).
2. S. Yasuda and H. Kakiyama, Anal. Chim. Acta. 89,369 {1977). 3. M. W. Pritchard and R. D. Reeves, Anal. Chim. Acta. 82, 103 (1976). 4. J. M. Harnly, T. C. O'Haver, B. Golden, and W. R. Wolf, Anal. Chem. 51,
2007 (1979). 5. J. M. Harnly, N. J. Miller-Ihli, and T. C. O'Haver, J. Autom. Chem. 4, 54
(1982). 6. R. J. Lovett, D. L. Welch, and M. L. Parsons, Appl. Spectrosc. 29, 470
(1975). 7. J. D. Norris and T. S. West, Anal. Chem. 46, 1423 (1974). 8. W. R. Kelly and C. B. Moore, Anal. Chem. 45, 1274 (1973). 9. A. T. Zander, Am. Lab. 11, 11 (1976).
10. G. R. Harrison, MIT Wavelength Tables (MIT Press, Cambridge, MA, 1969). 11. B. E. Guthrie, W. R. Wolf, and C. VeiUon, Anal. Chem. 50, 1900 (1978).
Determinat ion Near the Limit of Detection with a Sequential Scanning Inductively Coupled Plasma Emission Spectrometer
D. D. NYGAARD,* D. S. CHASE, and D. A. LEIGHTY Instrumentation Laboratory, Inc., Analytical Instrument Division, One Burtt Road, Andover, Maine 01810
Requirements associated with determinations near the limit o f detection by sequential scanning inductively coupled plasma
Received 5 May 1982; revision received 22 November 1982. * Au tho r to whom correspondence should be addressed.
emission spectrometry are discussed. Strategies are suggested for overcoming potential difficulties, and analytical results generated using these strategies are presented for EPA Water Pollution Quality Control S a m p l e s .
Index Headings: Scanning inductively coupled plasma; Analysis for trace metals in water; Emission spectrometry.
4:32 Volume 37, Number 5, 1983 APPLIED SPECTROSCOPY