Embed Size (px)
DESCRIPTION
Time Series visualizations. Information Visualization – CPSC 533c Lior Berry March 10 th 2004. Papers presented. ThemeRiver: Visualizing Thematic Changes in Large Document Collections, Susan Havre, Elizabeth Hetzler, Paul Whitney, Lucy Nowell. - PowerPoint PPT Presentation
Citation preview
Time Series visualizations
Information Visualization – CPSC 533c
Lior Berry
March 10th 2004
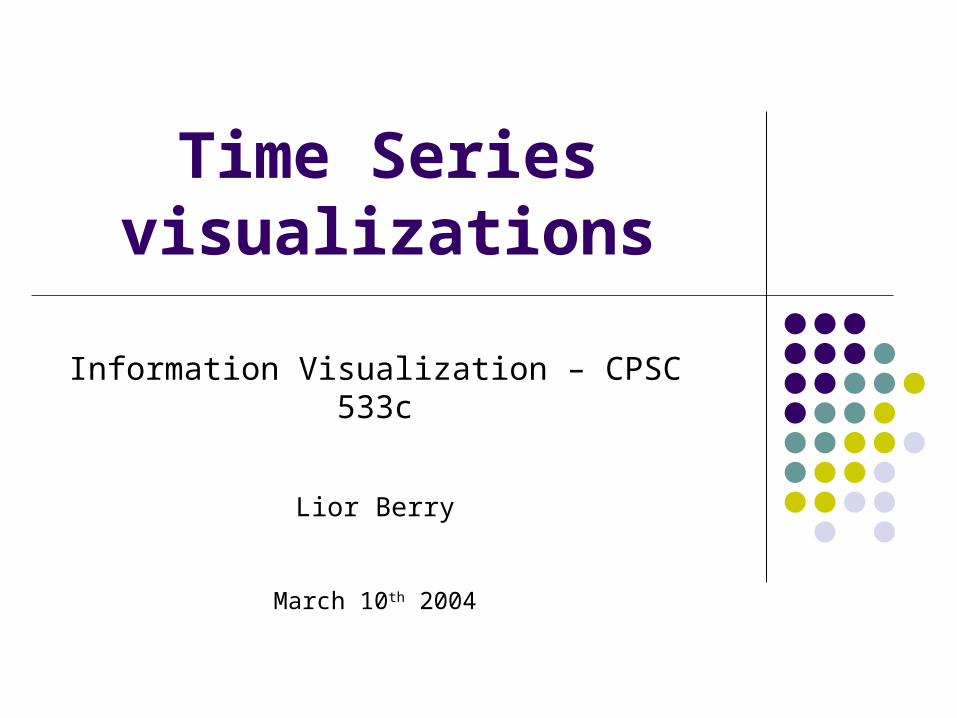
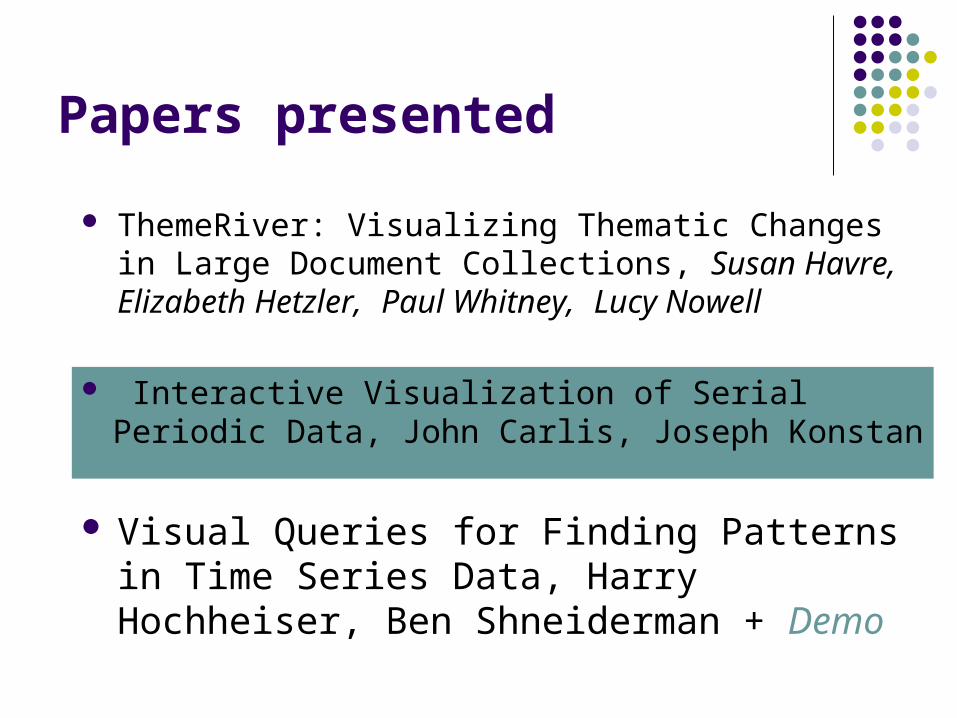
Papers presented
Visual Queries for Finding Patterns in Time Series Data, Harry Hochheiser, Ben Shneiderman + Demo
Interactive Visualization of Serial Periodic Data, John Carlis, Joseph Konstan
ThemeRiver: Visualizing Thematic Changes in Large Document Collections, Susan Havre, Elizabeth Hetzler, Paul Whitney, Lucy Nowell
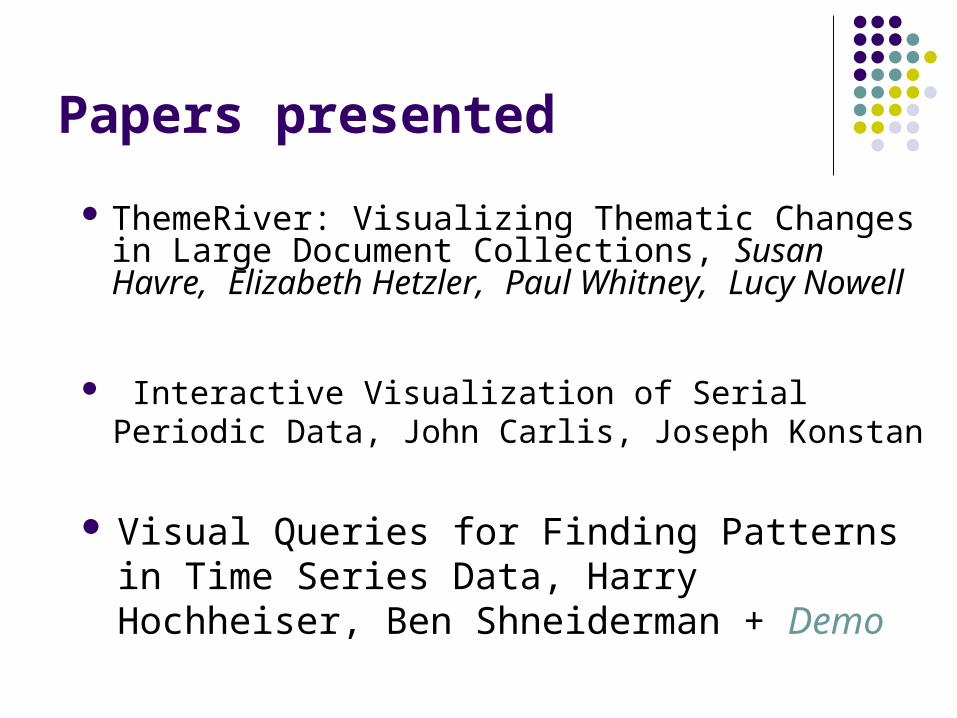
Time series
Data elements are a function of time D = {(t1,y1),(t2,y2),…,(tn,yn)} , where yi=f (ti) Equal / non-equal time steps
Time series, Interesting ?
Fundamental data type Time dependent data Found in many domains such as finance,
meteorology, physiology and genetics
The purpose of visualization
Detect and validate properties of an unknown function f
Temporal behavior of data elements When was something greatest/least? Is there a pattern? Are two series similar? Do any of the series match a pattern? Provide simpler, faster access to the series
Papers presented
ThemeRiver: Visualizing Thematic Changes in Large Document Collections, Susan Havre, Elizabeth Hetzler, Paul Whitney, Lucy Nowell
Visual Queries for Finding Patterns in Time Series Data, Harry Hochheiser, Ben Shneiderman + Demo
Interactive Visualization of Serial Periodic Data, John Carlis, Joseph Konstan
ThemeRiver
Visualize themes over time in large document collection
Suitable for presenting multiple attributes over time
Relying on basic perception rules
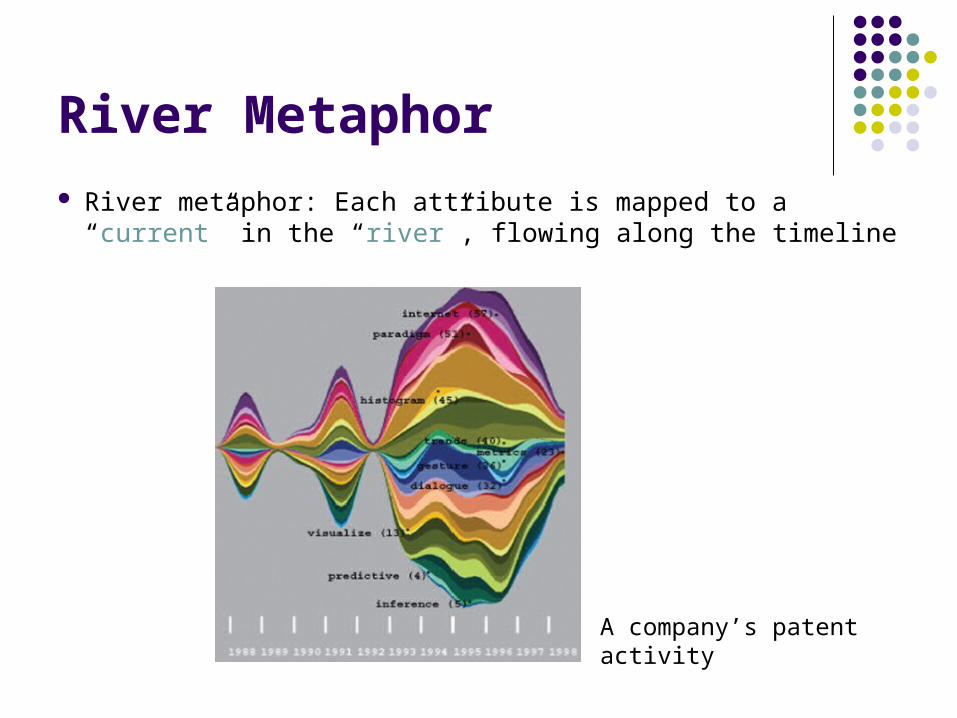
River Metaphor
River metaphor: Each attribute is mapped to a “current” in the “river”, flowing along the timeline
A company’s patent activity
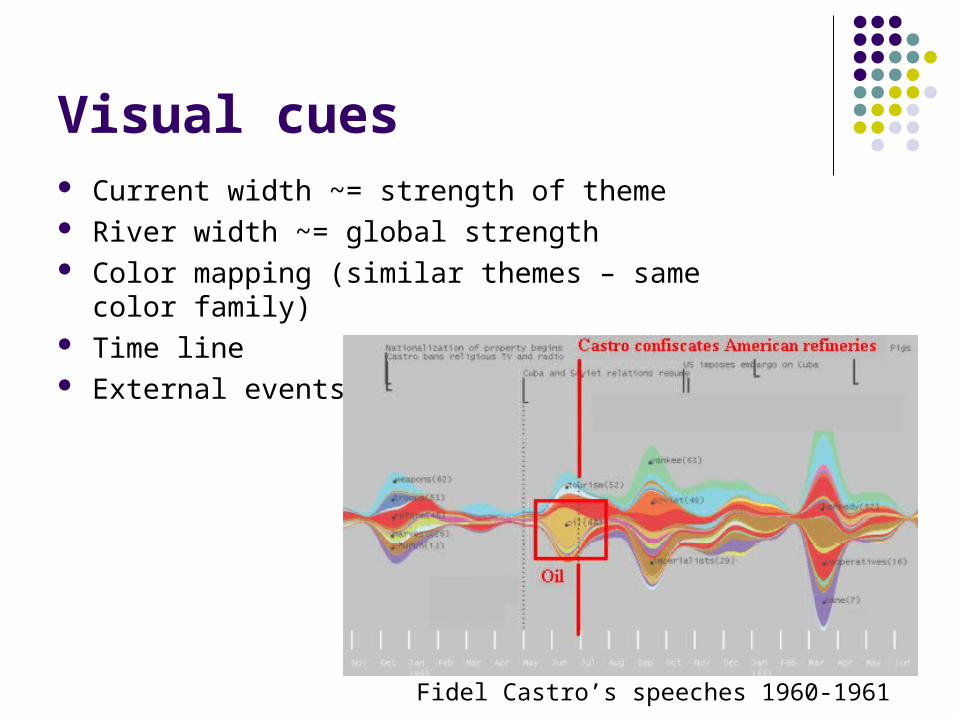
Visual cues Current width ~= strength of theme River width ~= global strength Color mapping (similar themes – same color family) Time line External events
Fidel Castro’s speeches 1960-1961
Cognitive rational
Humans perceive complete “packages” and not individual element (Gestalt theory).
Smooth continuous curves and colors Stacking the patterns facilitates comparisons Careful interpolation, refrain from “lying”
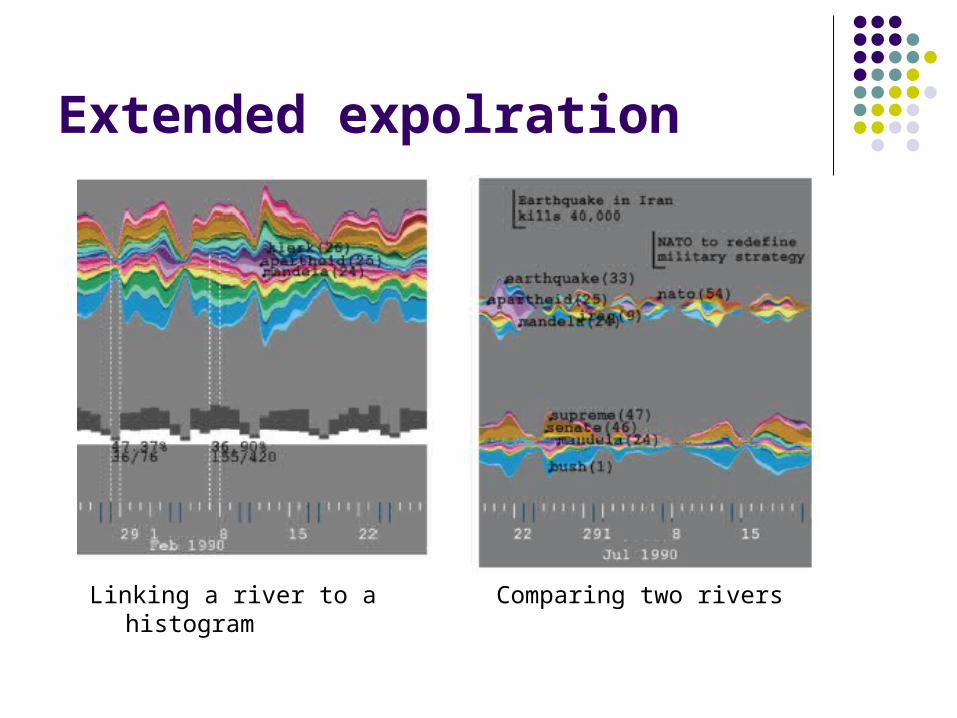
Extended expolration
Comparing two riversLinking a river to a histogram
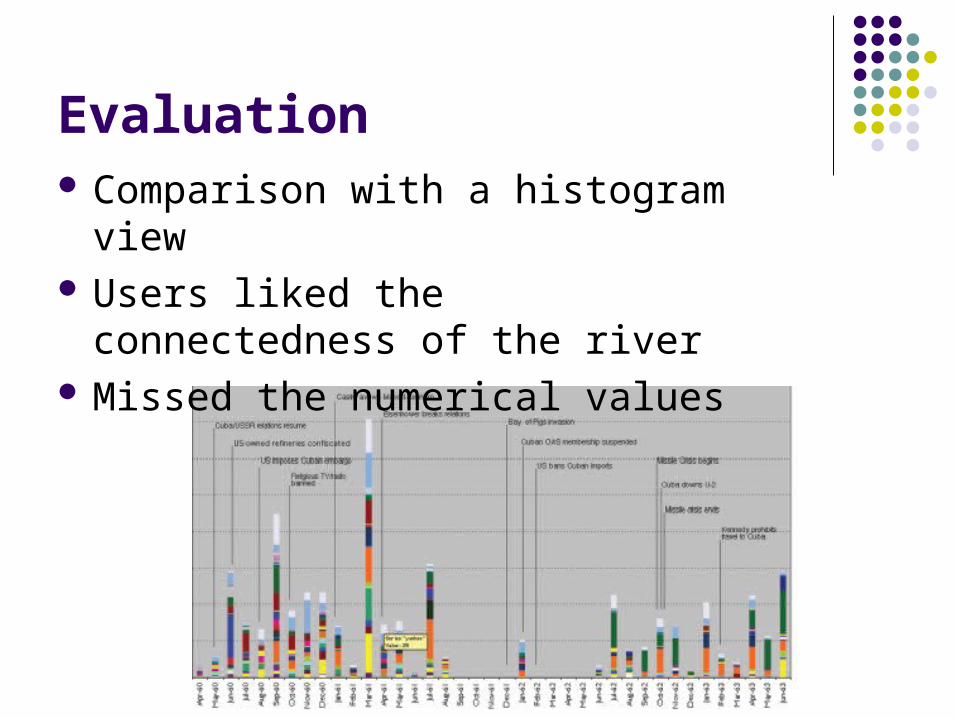
Evaluation Comparison with a histogram view Users liked the connectedness of
the river Missed the numerical values
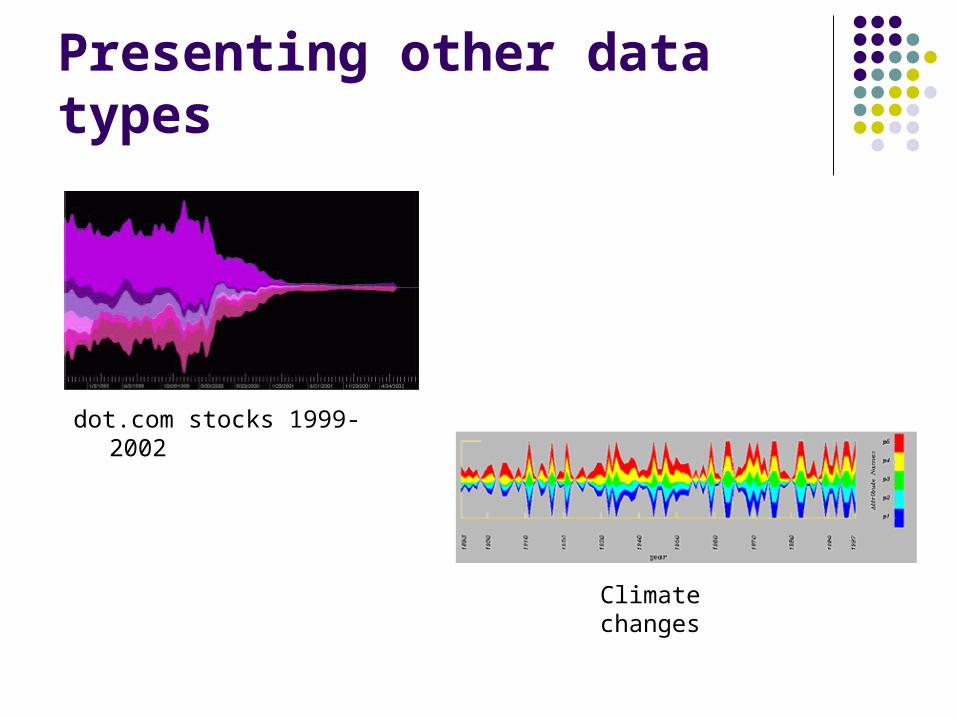
Presenting other data types
Climate changes
dot.com stocks 1999-2002
CritiqueStrong points: Intuitive exploration of temporal
changes and relations Evalutation + improvements Applicable to general attributes
Weak points: Limited number of themes / attributes Interpolated values / outer attributes misleading No ability to reorder currents Performance issues
Papers presented
ThemeRiver: Visualizing Thematic Changes in Large Document Collections, Susan Havre, Elizabeth Hetzler, Paul Whitney, Lucy Nowell
Visual Queries for Finding Patterns in Time Series Data, Harry Hochheiser, Ben Shneiderman + Demo
Interactive Visualization of Serial Periodic Data, John Carlis, Joseph Konstan
Interactive Visualization of Serial Periodic Data
Simultaneous display of serial and periodic attributes (e.g. seasonality)
Traditional layouts exaggerate distance across period boundaries
Focus+Context / Zoom unsuitable
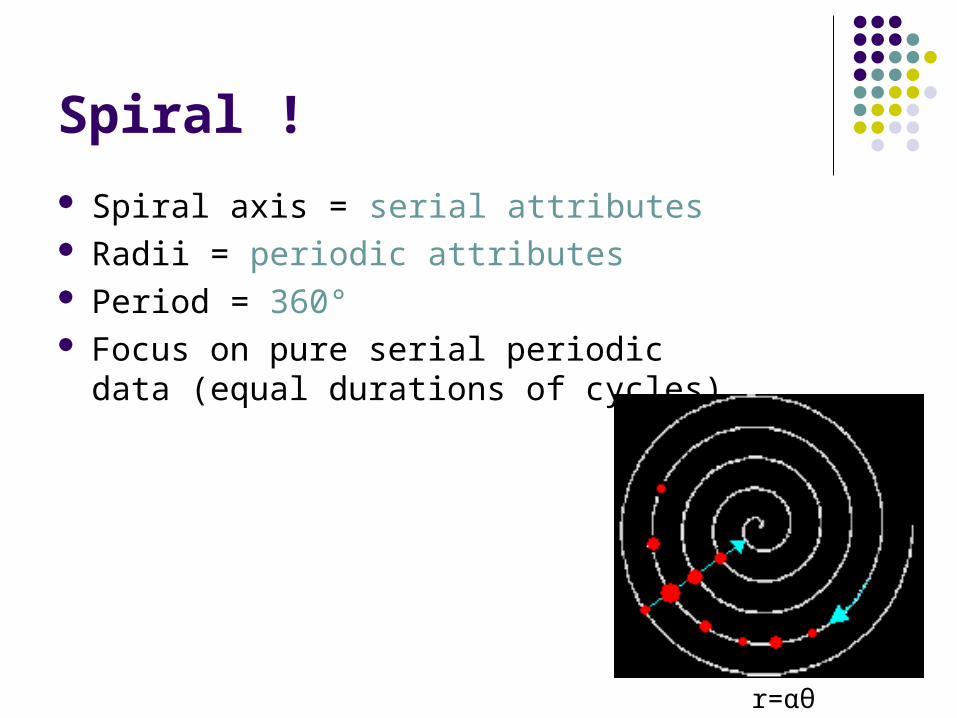
Spiral !
Spiral axis = serial attributes Radii = periodic attributes Period = 360° Focus on pure serial periodic data (equal
durations of cycles)
r=αθ

Spiral Example (for primatologists) Spokes (months) and spiral
guide lines (years) Planar spiral Distinguishable patterns (rainy
season / 1984)
Chimpanzees Monthly food consumption 1980-1988

Using 3D for multiple data sets
•12 common food types
•Consistent ordering
•Boundary lines
Helpful ?
112 food types
Muliple linked spirals:
2 chimpanzees
group avg size / max size
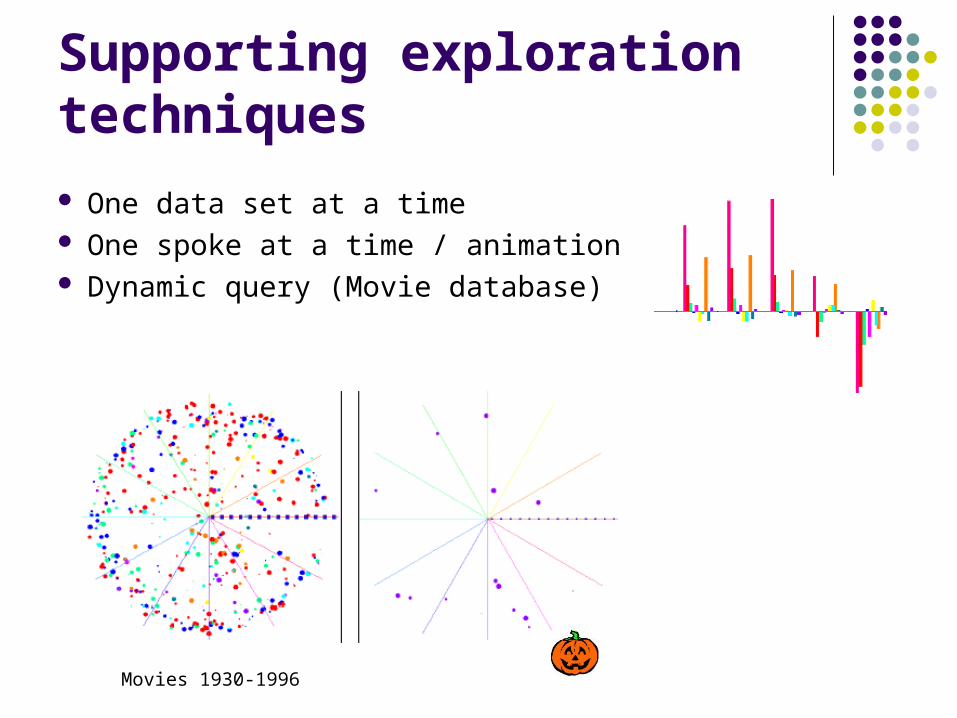
Supporting exploration techniques
One data set at a time One spoke at a time / animation Dynamic query (Movie database)
Movies 1930-1996
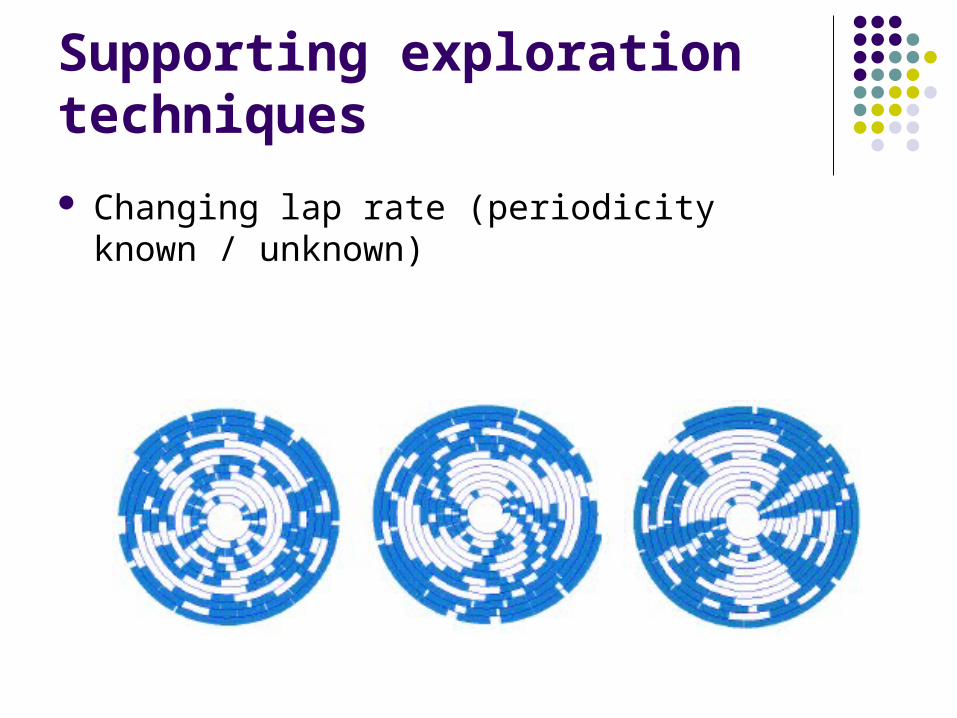
Supporting exploration techniques
Changing lap rate (periodicity known / unknown)
Critique
Strong points: Seasonality is fundamental simple concepts / easy to understand Real data examples and tasks / different disciplines Good analysis of the unsuitability of other solutions
Weak points: Labels ? Exaggerated use of 3D Scalability ? Expert users did not “drive” the tool No assistance in guessing period length

Papers presented
ThemeRiver: Visualizing Thematic Changes in Large Document Collections, Susan Havre, Elizabeth Hetzler, Paul Whitney, Lucy Nowell
Visual Queries for Finding Patterns in Time Series Data, Harry Hochheiser, Ben Shneiderman
Interactive Visualization of Serial Periodic Data, John Carlis, Joseph Konstan
TimeSearcher
Visualization alone is not enough (when dealing
with multiple entities, e.g. stocks/genes) identifying patterns and trends Algorithmic/statistical methods Intuitive tools for dynamic queries (e.g.
QuerySketch)
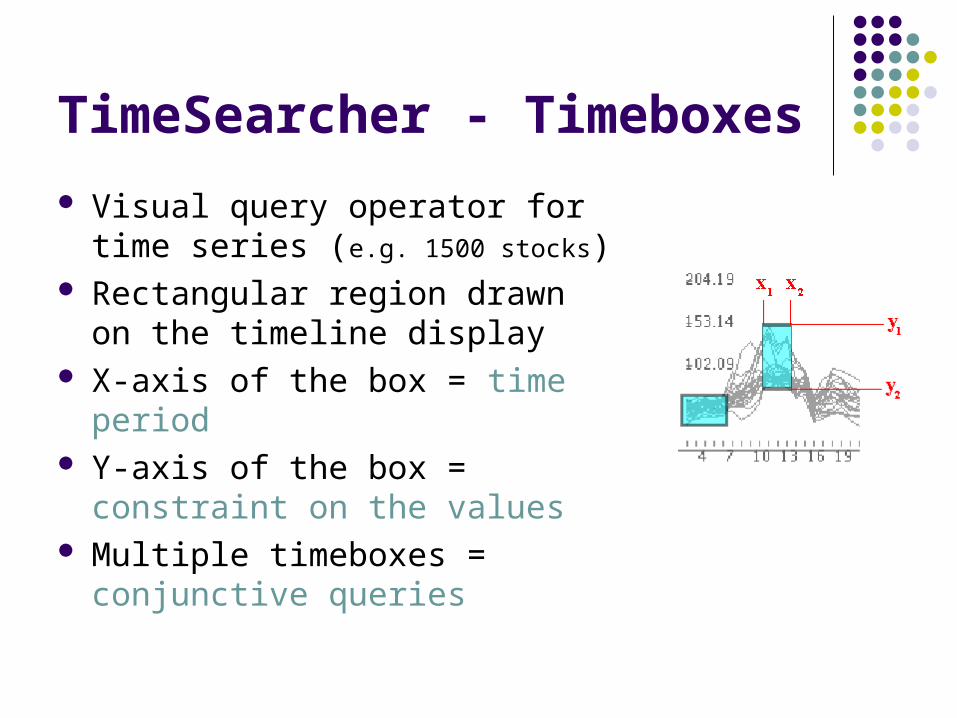
TimeSearcher - Timeboxes
Visual query operator for time series (e.g. 1500 stocks)
Rectangular region drawn on the timeline display
X-axis of the box = time period Y-axis of the box = constraint on
the values Multiple timeboxes = conjunctive
queries
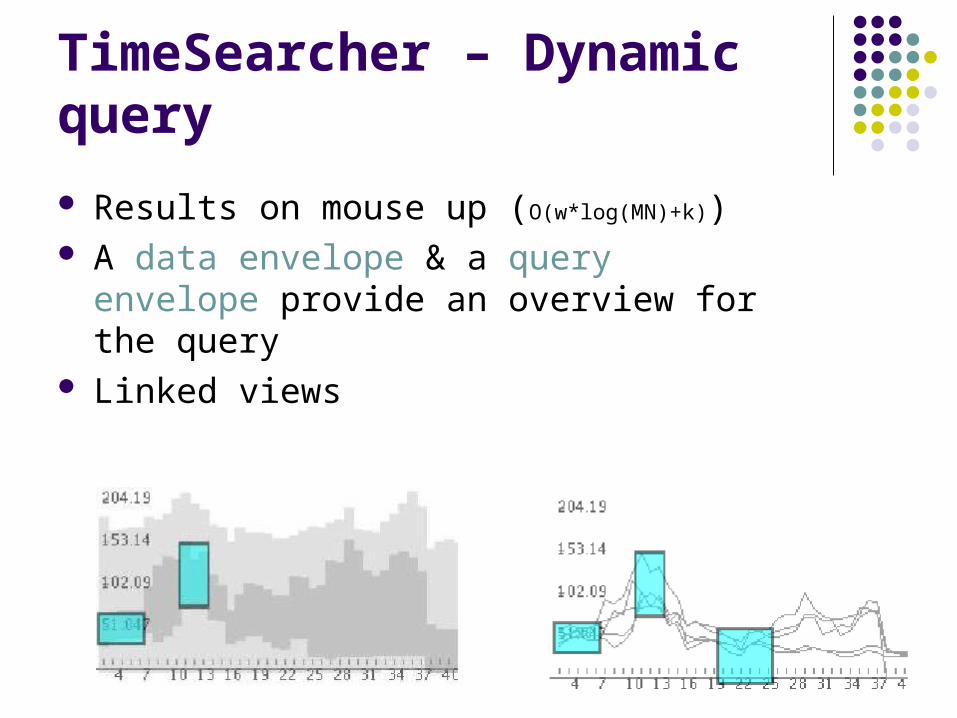
TimeSearcher – Dynamic query
Results on mouse up (O(w*log(MN)+k)) A data envelope & a query envelope provide
an overview for the query Linked views
Extended queries
Relative changes Small interval patterns during a long time
period Querying for “leaders and laggards” Disjunctive queries

TimeSearcher – Demo time !
Entity display window Query space Controlling multiple boxes together Query by example linked updates between views
http://www.cs.umd.edu/hcil/timesearcher/
Critique
Strong points: Simple and intuitive Queries and results have immediate context Highly dynamic exploration
Weak points: Query power may be limited and simplistic Limited scalability for long time lines Envelope may be misleading No Undo / Redo Minimal report on evaluation
Summary
There are not too many task specific visualization tools for time series
Focus on multivariate data Support exploratory viewing Integrate with other tools / views