Embed Size (px)
Citation preview
ISSN: 1942-3268 Copyright © 2009 American Heart Association. All rights reserved. Print ISSN: 1942-325X. Online
Avenue, Dallas, TX 72514Circulation: Cardiovascular Genetics is published by the American Heart Association. 7272 Greenville
DOI: 10.1161/CIRCGENETICS.108.806935 2009;2;116-124; originally published online Feb 18, 2009; Circ Cardiovasc Genet
Sean P. Sheehy, Sui Huang and Kevin Kit Parker Cardiac Hypertrophy
Time-Warped Comparison of Gene Expression in Adaptive and Maladaptive
http://circgenetics.ahajournals.org/cgi/content/full/CIRCGENETICS.108.806935/DC1Data Supplement (unedited) at:
http://circgenetics.ahajournals.org/cgi/content/full/2/2/116
located on the World Wide Web at: The online version of this article, along with updated information and services, is
http://www.lww.com/reprintsReprints: Information about reprints can be found online at
[email protected]. E-mail:
Fax:Kluwer Health, 351 West Camden Street, Baltimore, MD 21202-2436. Phone: 410-528-4050. Permissions: Permissions & Rights Desk, Lippincott Williams & Wilkins, a division of Wolters
http://circgenetics.ahajournals.org/subscriptions/Subscriptions: Information about subscribing to Circulation: Cardiovascular Genetics is online at
at Countway Library of Medicine on July 22, 2010 circgenetics.ahajournals.orgDownloaded from
Time-Warped Comparison of Gene Expression in Adaptiveand Maladaptive Cardiac Hypertrophy
Sean P. Sheehy, ALM; Sui Huang, MD, PhD; Kevin Kit Parker, PhD
Background—Cardiac hypertrophy is classically regarded as a compensatory response, yet the active tissue remodelingprocesses triggered by various types of mechanical stress can enhance or diminish the function of the heart. Despite thedisparity in outcomes, there are similarities in the hypertrophic responses. We hypothesized that a generic geneticresponse that is not dependent on the particular nature of the hypertrophic stimulus exists. To test our hypothesis, wecompared the temporal evolution of transcriptomes measured in hearts subjected to either adaptive (exercise-induced)or maladaptive (aortic banding–induced) hypertrophy.
Methods and Results—Generic hypertrophy-associated genes were identified and distinguished from stimulus-dependenttranscripts by coupling a metric of cardiac growth with a dynamic time-warping algorithm to align transcriptomechanges with respect to the hypertrophy response. The major differences in expression between the adaptive andmaladaptive hypertrophy models were centered around the genes involved in metabolism, fibrosis, and immuneresponse. Conversely, transcripts with common expression patterns in both hypertrophy models were associated withsignal transduction, cytoskeletal development, and muscle contraction. Thus, despite the apparent differences in theexpression response of the heart to either athletic conditioning or pressure overload, there is a set of genes that displayssimilar expression profiles.
Conclusions—This finding lends support to the notion of a generalized cardiac growth mechanism that is activated inresponse to mechanical perturbation. The common and unique genetic signatures of adaptive and maladaptivehypertrophy may be useful in the diagnosis and treatment of pathological myocardial remodeling. (Circ CardiovascGenet. 2009;2:116-124.)
Key Words: heart � hypertrophy � gene expression � self-organizing map � GEDI � time warp
Many risk factors associated with cardiovascular disease,such as high blood pressure, diabetes, and obesity,
increase the workload on the heart and can lead to gross andmicroscale morphological changes associated with a decreasein overall cardiac performance.1 Athletic conditioning alsointensifies demand on the heart, but cardiac function isusually sustained or enhanced by this form of hypertrophicgrowth.2 At the microanatomical level, adaptive and mal-adaptive cardiac hypertrophy elicits distinct morphologicalchanges in the cardiac tissue. Maladaptive cardiac remodelingis characterized by alterations in myocyte size, rarefaction inthe myocardial vasculature, expression of fetal genes, andapoptotic loss of myocytes that leads to fibrosis.3 In contrast,adaptive hypertrophy entails sustained or increased capillarydensity in the myocardium, and an enhanced metabolicprofile with no fetal gene expression and no sign of fibrosis.4
Nevertheless, the relative magnitude of overall myocardialgrowth observed in adaptive and maladaptive remodeling is
remarkably similar.3 This suggests that at its core, cardiacgrowth may be driven in part by a generic mechanism,regardless of the nature of the hypertrophy stimulus.
Clinical Perspective see p 124Genome-scale analyses have provided snapshots of dif-
ferential gene expression between normal and hypertro-phied myocardium.5,6 In a detailed study, Izumo andcolleagues7 looked at gene expression in mice subjected toeither swim training as a model for exercise or transverseconstriction of the aorta (“banding”) as a model forhemodynamic stress due to pressure overload. Mice sub-jected to regular bouts of swim exercise of increasingintensity over a period of 4 weeks experienced an increasein heart mass of up to 45%. Resting heart rate in these micedecreased with respect to nonexercised mice, and noapoptosis or fibrosis was observed in the myocardium.7
Thus, changes in gene expression in these conditionedhearts were considered an “adaptive” hypertrophic re-
Received July 13, 2008; accepted February 12, 2009.From the Disease Biophysics Group, School of Engineering and Applied Sciences (S.P.S., K.K.P), Harvard University, Cambridge, Mass; and the
Department of Biological Sciences (S.H.), Institute for Biocomplexity and Informatics, University of Calgary, Calgary, Alberta, Canada.Guest Editor for this article was Martin M. LeWinter, MD.The online-only Data Supplement is available at http://circgenetics.ahajournals.org/cgi/content/full/CIRCGENETICS.108.806935/DC1.Correspondence to Kevin Kit Parker, PhD, Harvard University, SEAS, Pierce Hall 321, 29 Oxford St, Cambridge, MA 02138. E-mail kkparker@
seas.harvard.edu© 2009 American Heart Association, Inc.
Circ Cardiovasc Genet is available at http://circgenetics.ahajournals.org DOI: 10.1161/CIRCGENETICS.108.806935
116 at Countway Library of Medicine on July 22, 2010 circgenetics.ahajournals.orgDownloaded from
sponse. In the same study, transverse aortic constrictioninduced pressure overload in the left ventricle that resultedin a subset of mice progressing to heart failure. Therefore,the changes in gene expression in this model represent a“maladaptive” hypertrophy response.
We hypothesized that a comparison of the respectivegene expression patterns would differentiate genes whoseexpression was associated with a decrease in cardiacfunction from those associated with enhancement of car-diac performance, as well as identify nonspecific transcrip-tional activity intrinsic to cardiac remodeling. The com-parative dynamics of such an endeavor is complicated bythe differences in the time courses of the different hyper-trophy processes, in which it is inappropriate to simplymatch up expression values collected at equal measure-ment intervals.8 However, a commonly varying featurebetween the 2 response profiles may serve as a referenceframe for comparisons despite the differing time scales.Therefore, instead of the chronological time elapsed afterstress application, we used the change in relative cardiacmass to register the genomic profiles of adaptive andmaladaptive hypertrophy. This was achieved by usingdynamic time warping, an algorithm commonly used instudies of speech pattern recognition.9 In fact, the expres-sion patterns of many genes activated in response topressure overload hypertrophy were recently shown toexhibit a strong correlation to gross parameters of cardiacgrowth.10 Thus, we compared the 2 hypertrophy geneexpression time courses based on heart weight to bodyweight (HW/BW) ratio as a surrogate time line. Despite thedifferences in the transcriptomes of these 2 hypertrophyresponses, we uncovered several transcripts associatedwith cytoskeletal development and regulation of musclecontraction that displayed similar expression profiles whenthe profile data were compared relative to cardiac mass. Incontrast, several fibrosis and immune response-relatedtranscripts demonstrated significant changes in expressionlevel only in the pressure overload model. Expressionlevels of transcripts associated with metabolism weresignificantly changed in the swim training model repre-senting the adaptive response but not in the pressureoverload model representing the maladaptive response.
MethodsSelection of Hypertrophy Model DatasetsA query of the Gene Expression Omnibus revealed a pair of timecourse microarray gene expression datasets published by the Car-dioGenomics Program for Genomic Applications by Izumo andcolleagues7 collected on mice subjected to swim training (GeneExpression Omnibus series GSE77), and pressure overload inducedby transverse aortic constriction (Gene Expression Omnibus seriesGSE76) is suitable for this study. In their study, FVB wild-type micewere subjected to a modified version of a previously described swimtraining protocol11 to stimulate cardiac hypertrophy with enhancedcardiac function and pressure overload was induced using a pub-lished transverse aortic constriction surgical procedure12 to representcardiac hypertrophy associated with diminished cardiac function.Sedentary mice served as a control for exercise-induced hypertrophy.Mice that underwent a sham operation without aortic constrictionserved as the control condition for the pressure overload–inducedhypertrophy model. Affymetrix mgu74A GeneChips were used to
measure gene expression levels in ventricular tissues isolated at 10minutes, 2 days, 1 week, 2 weeks, 3 weeks, and 4 weeks posttrainingin the exercise-induced hypertrophy model and 1 hour, 4 hours, 1day, 2 days, 1 week, and 8 weeks postsurgery in the pressureoverload–induced hypertrophy model. Gene expression measure-ments were collected in triplicate at each time point sampled inboth models. To analyze this data, we downloaded normalizedsignal values and probe set “detection calls” computed byAffymetrix Microarray Suite 5.0 software, as well as HW and BWvalues made by the investigators and available from the Car-dioGenomics web site.7
Preprocessing of Gene Expression DataPreprocessing of the data requires for both hypertrophy models to beevaluated relative to the sham and sedentary control conditions.Detection calls calculated by the Affymetrix Microarray Suite 5.0software at the default cutoff of P�0.05 were used to eliminatetranscripts that were judged not significantly expressed at all timepoints in either of the time series being compared. Specifically,detection call scores from the 3 replicate arrays for each time pointwere evaluated and probe sets whose detection call was “marginal”or “absent” in 2 of the 3 replicate measurements at all time pointswere excluded from analysis. This resulted in a dataset with 5153transcripts. The Microarray Suite 5.0 signal values for these geneswere averaged, log2-transformed, and analyzed with SignificanceAnalysis of Microarrays (SAM) 3.00 software13 to identify the setsof these genes that demonstrated statistically different expressionvalues between the band and sham (control) conditions in thebanding model and between the exercise and sedentary conditions inthe exercise model. The 2-class, paired-response format was used forthe SAM analysis. The � value for determining the false discoveryrate cutoff was set at 0.379 for the exercise-induced hypertrophymodel, resulting in a dataset of 511 genes with a false discovery rateof 0.96%. For the banding-induced hypertrophy model, the � value wasset at 0.119, yielding 544 significant genes with a false discovery rate of31.63%. The � values were chosen to create symmetrical data sets forthe Gene Warp program, where the symmetry is defined by the sameset of genes for both sets of experiments. In further analyses, the 511significant genes from the exercise model and the 544 significantgenes from the banding model were combined into a datasetconsisting of 963 genes that were present in the SAM results for bothhypertrophy models. The remaining 92 transcripts consisted of genesthat were present in the SAM results for the maladaptive hypertrophymodel, but not the adaptive model, and vice versa.
Analysis of Cardiac GrowthPostmortem HW and BW values for the set of mice used at eachmeasurement interval in the time series were averaged and used tocompute the HW/BW ratio representative of each time point. Linearregression analysis was used to compare the HW/BW ratios calcu-lated for the adaptive and maladaptive time courses.
Alignment of Time Course Expression DataLog2-transformed signal ratios (SLRs) were calculated for thetranscripts whose expression levels were significantly changed inresponse to the adaptive and maladaptive hypertrophy stimuli.The time course expression data for the adaptive and maladaptivemodels were then aligned based on the similarity of the HW/BWratio associated with each time point. Finally, the aligned expres-sion data were input into genewarp, a program implementing theclassic dynamic time-warping algorithm modified for analyzingglobal gene expression,9 to assess the alignment. The quality ofthe alignment was determined by measuring the weighted Euclid-ean distance D(a,b) along the warping path between the globalexpression profiles of the 2 models. For comparison, the hyper-trophy expression data were also evaluated with the gene-warpprogram with the expression data aligned with respect to the orderof the measurement intervals rather than HW/BW ratio. Allanalyses were conducted with the parameters of the program setto their default values.
Sheehy et al Comparison of Adaptive and Maladaptive Hypertrophy 117
at Countway Library of Medicine on July 22, 2010 circgenetics.ahajournals.orgDownloaded from
Global Analysis of Differences in Gene ExpressionThe adaptive and maladaptive models were evaluated relative to eachother to identify their differences. We used SAM to identify the setof transcripts among the 963 transcripts that were found to besignificantly expressed in both the exercise and banding hypertrophymodels whose expression significantly differed between the exerciseand banding hypertrophy models. For this analysis, the SLR valuesfrom the exercise and banding datasets were input into SAM, and the2-class, unpaired-response format was used. The � threshold was setat 0.424, yielding a false discovery rate of 5.28%. This analysisresulted in a list of 314 genes with significantly different expressionbetween the exercise and banding models. The expression values forthese differentially expressed genes were then subjected to clusteranalysis and visualization using Gene Expression Dynamics Inspec-tor (GEDI) 2.1 software.14 SLR values for these transcripts aligned,based on change in HW/BW ratio, were input into GEDI. Grid sizewas set to 9�8, and all other parameters were set to their defaultvalues.
Global Analysis of Commonalities inGene ExpressionThe adaptive and maladaptive models were evaluated relative toeach other to identify their commonalities. Transcripts withsimilar expression profiles in the adaptive and maladaptivehypertrophy models were identified with a novel analysis pro-gram designated Statistical Investigator of Transcriptional Ho-mology. This software uses a modified form of the dynamictime-warping algorithm used in the global analysis to identifyindividual genes within a pair of genes in the expression datasetsthat exhibit comparable temporal expression patterns. A score (di)for gene i is computed by summing the Euclidean distancescalculated for the expression measures taken at each pair ofaligned time points multiplied by a time weight that adjusts forthe length of the path through the distance table. This distancescore indicates how closely the temporal expression profiles ofgene i in the 2 experiments match. A cutoff value can then be setto limit the range of distance scores that represent similarlyexpressed transcripts. The distance score di was set to 0.45 in thisstudy, meaning those transcripts that received distance scores�0.45 were considered to have matching temporal expressionprofiles. Transcripts determined to have matching expressionprofiles were visualized using Cluster and Treeview software.15
Functional classification and enrichment analysis of the set ofcommonly expressed genes was conducted using the web-basedDAVID bioinformatics resources.16 Enrichment was assessedusing a “heuristic fuzzy multiple linkage” algorithm that assigns
enrichment scores to functional groups based on the geometricmean of a modified Fisher Exact statistical test.16
StatisticsData are presented as mean�SEM. Pearson product moment corre-lation was used to test for similarity between the HW/BW valuesobserved over time in the adaptive and maladaptive models. Signif-icant differences were revealed to exist at P�0.05.
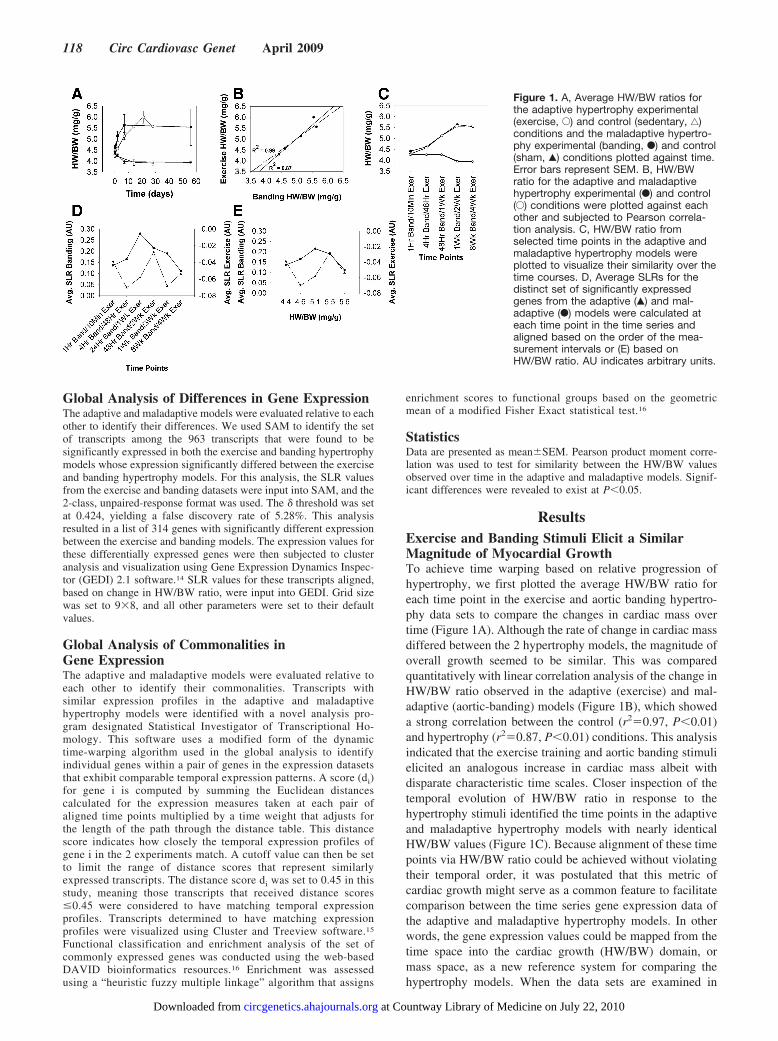
ResultsExercise and Banding Stimuli Elicit a SimilarMagnitude of Myocardial GrowthTo achieve time warping based on relative progression ofhypertrophy, we first plotted the average HW/BW ratio foreach time point in the exercise and aortic banding hypertro-phy data sets to compare the changes in cardiac mass overtime (Figure 1A). Although the rate of change in cardiac massdiffered between the 2 hypertrophy models, the magnitude ofoverall growth seemed to be similar. This was comparedquantitatively with linear correlation analysis of the change inHW/BW ratio observed in the adaptive (exercise) and mal-adaptive (aortic-banding) models (Figure 1B), which showeda strong correlation between the control (r2�0.97, P�0.01)and hypertrophy (r2�0.87, P�0.01) conditions. This analysisindicated that the exercise training and aortic banding stimulielicited an analogous increase in cardiac mass albeit withdisparate characteristic time scales. Closer inspection of thetemporal evolution of HW/BW ratio in response to thehypertrophy stimuli identified the time points in the adaptiveand maladaptive hypertrophy models with nearly identicalHW/BW values (Figure 1C). Because alignment of these timepoints via HW/BW ratio could be achieved without violatingtheir temporal order, it was postulated that this metric ofcardiac growth might serve as a common feature to facilitatecomparison between the time series gene expression data ofthe adaptive and maladaptive hypertrophy models. In otherwords, the gene expression values could be mapped from thetime space into the cardiac growth (HW/BW) domain, ormass space, as a new reference system for comparing thehypertrophy models. When the data sets are examined in
Figure 1. A, Average HW/BW ratios forthe adaptive hypertrophy experimental(exercise, E) and control (sedentary, ‚)conditions and the maladaptive hypertro-phy experimental (banding, F) and control(sham, Œ) conditions plotted against time.Error bars represent SEM. B, HW/BWratio for the adaptive and maladaptivehypertrophy experimental (F) and control(E) conditions were plotted against eachother and subjected to Pearson correla-tion analysis. C, HW/BW ratio fromselected time points in the adaptive andmaladaptive hypertrophy models wereplotted to visualize their similarity over thetime courses. D, Average SLRs for thedistinct set of significantly expressedgenes from the adaptive (Œ) and mal-adaptive (F) models were calculated ateach time point in the time series andaligned based on the order of the mea-surement intervals or (E) based onHW/BW ratio. AU indicates arbitrary units.
118 Circ Cardiovasc Genet April 2009
at Countway Library of Medicine on July 22, 2010 circgenetics.ahajournals.orgDownloaded from
mass space, this registration results in 5 different mass pointsversus the 6 time points in the traditional comparison. Thisdoes not imply a loss of fidelity but rather a shift of the datapoints over a defined mass range for comparison.
Alignment of Hypertrophy Gene Expression TimeSeries Using HW/BWGene expression data sets downloaded from the Car-diogenomics web site7 were subjected to low-level processingto remove genes that were not considered to be expressedsignificantly above noise (see Methods section). This pro-duced a dataset of 963 genes that were present in bothhypertrophy models after the SAM analyses. To assess thebenefit of using HW/BW ratio as an alignment system tostudy the gene expression profiles, we compared the distancescores D(a,b) (�a high-dimensional distance in gene expres-sion space between 2 profiles at [warped] time t) between theprofiles of adaptive and maladaptive hypertrophy time seriesmicroarray data aligned based on temporal progression aloneto that computed for time series data aligned based onHW/BW ratio. The alignment based solely on temporalprogression resulted in a high distance score of 1001.25,indicating that the global expression profiles were not wellaligned between the hypertrophy model datasets (Figure 1D).In contrast, the alignment that used HW/BW ratio rather thantime as an alignment parameter produced a much lowerdistance score of 31.34, demonstrating a markedly betteralignment of the datasets (Figure 1E). Thus, the alignmentbased on the common feature of HW/BW ratio drasticallyreduced the distance between gene expression profiles andhence removed noise in gene expression differences becauseof the disparity of the characteristic time scales.
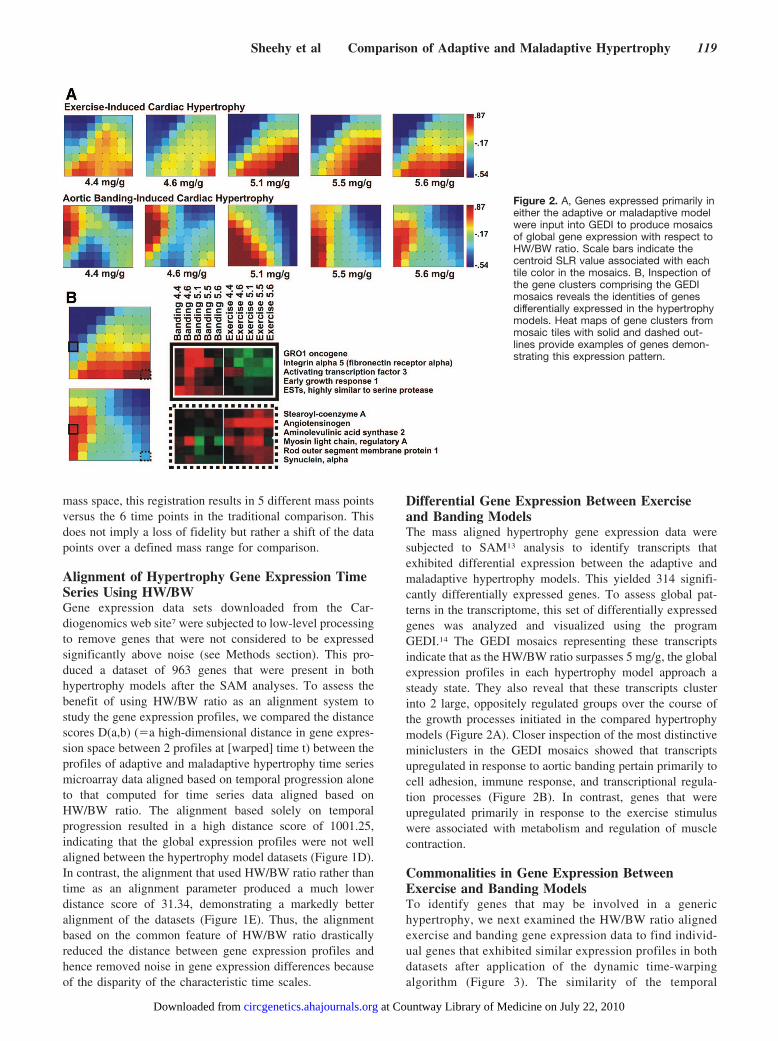
Differential Gene Expression Between Exerciseand Banding ModelsThe mass aligned hypertrophy gene expression data weresubjected to SAM13 analysis to identify transcripts thatexhibited differential expression between the adaptive andmaladaptive hypertrophy models. This yielded 314 signifi-cantly differentially expressed genes. To assess global pat-terns in the transcriptome, this set of differentially expressedgenes was analyzed and visualized using the programGEDI.14 The GEDI mosaics representing these transcriptsindicate that as the HW/BW ratio surpasses 5 mg/g, the globalexpression profiles in each hypertrophy model approach asteady state. They also reveal that these transcripts clusterinto 2 large, oppositely regulated groups over the course ofthe growth processes initiated in the compared hypertrophymodels (Figure 2A). Closer inspection of the most distinctiveminiclusters in the GEDI mosaics showed that transcriptsupregulated in response to aortic banding pertain primarily tocell adhesion, immune response, and transcriptional regula-tion processes (Figure 2B). In contrast, genes that wereupregulated primarily in response to the exercise stimuluswere associated with metabolism and regulation of musclecontraction.
Commonalities in Gene Expression BetweenExercise and Banding ModelsTo identify genes that may be involved in a generichypertrophy, we next examined the HW/BW ratio alignedexercise and banding gene expression data to find individ-ual genes that exhibited similar expression profiles in bothdatasets after application of the dynamic time-warpingalgorithm (Figure 3). The similarity of the temporal
Figure 2. A, Genes expressed primarily ineither the adaptive or maladaptive modelwere input into GEDI to produce mosaicsof global gene expression with respect toHW/BW ratio. Scale bars indicate thecentroid SLR value associated with eachtile color in the mosaics. B, Inspection ofthe gene clusters comprising the GEDImosaics reveals the identities of genesdifferentially expressed in the hypertrophymodels. Heat maps of gene clusters frommosaic tiles with solid and dashed out-lines provide examples of genes demon-strating this expression pattern.
Sheehy et al Comparison of Adaptive and Maladaptive Hypertrophy 119
at Countway Library of Medicine on July 22, 2010 circgenetics.ahajournals.orgDownloaded from
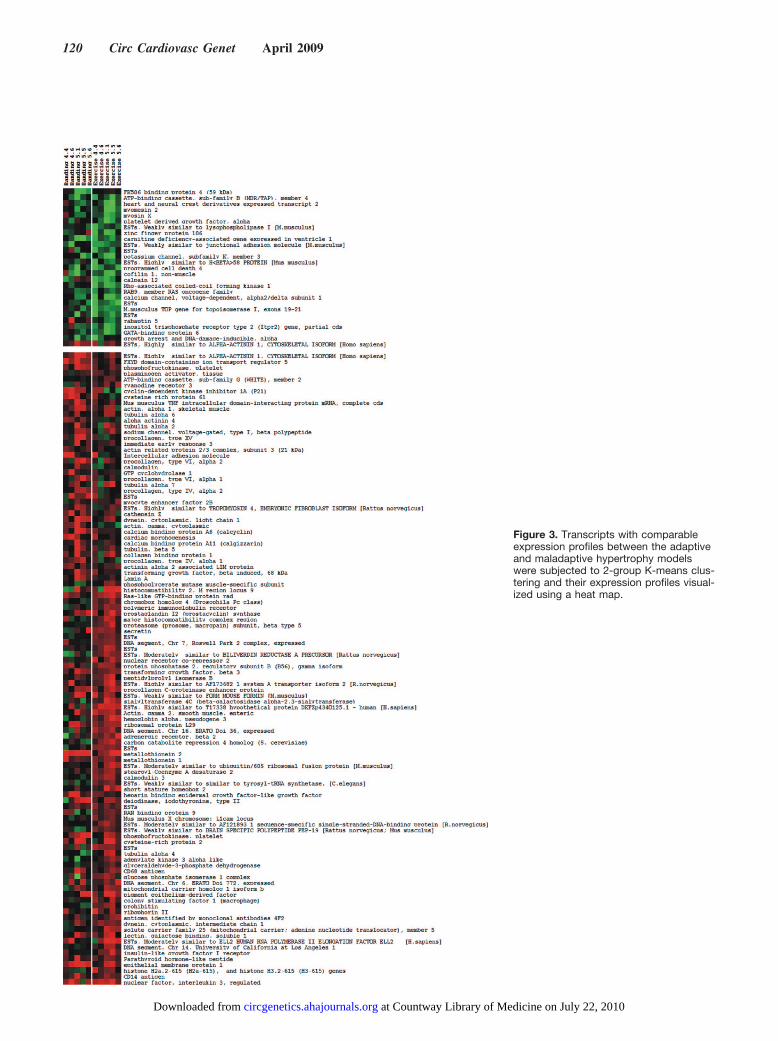
Figure 3. Transcripts with comparableexpression profiles between the adaptiveand maladaptive hypertrophy modelswere subjected to 2-group K-means clus-tering and their expression profiles visual-ized using a heat map.
120 Circ Cardiovasc Genet April 2009
at Countway Library of Medicine on July 22, 2010 circgenetics.ahajournals.orgDownloaded from
expression patterns of individual transcripts in the 2mass-aligned profiles was determined using StatisticalInvestigator of Transcriptional Homology (see Methodssection), which computes a distance scores di for gene i.Values for di ranged from di 0.089 for i�tubulin �6 to 2.65for i�connective tissue growth factor, with lower scores di
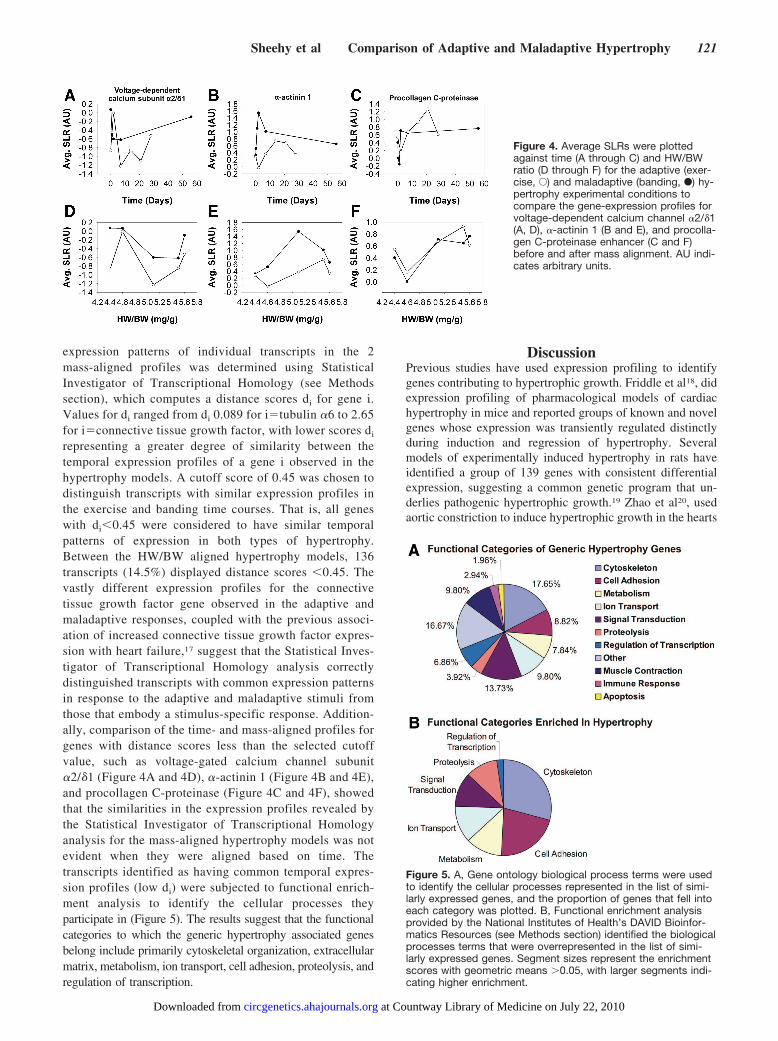
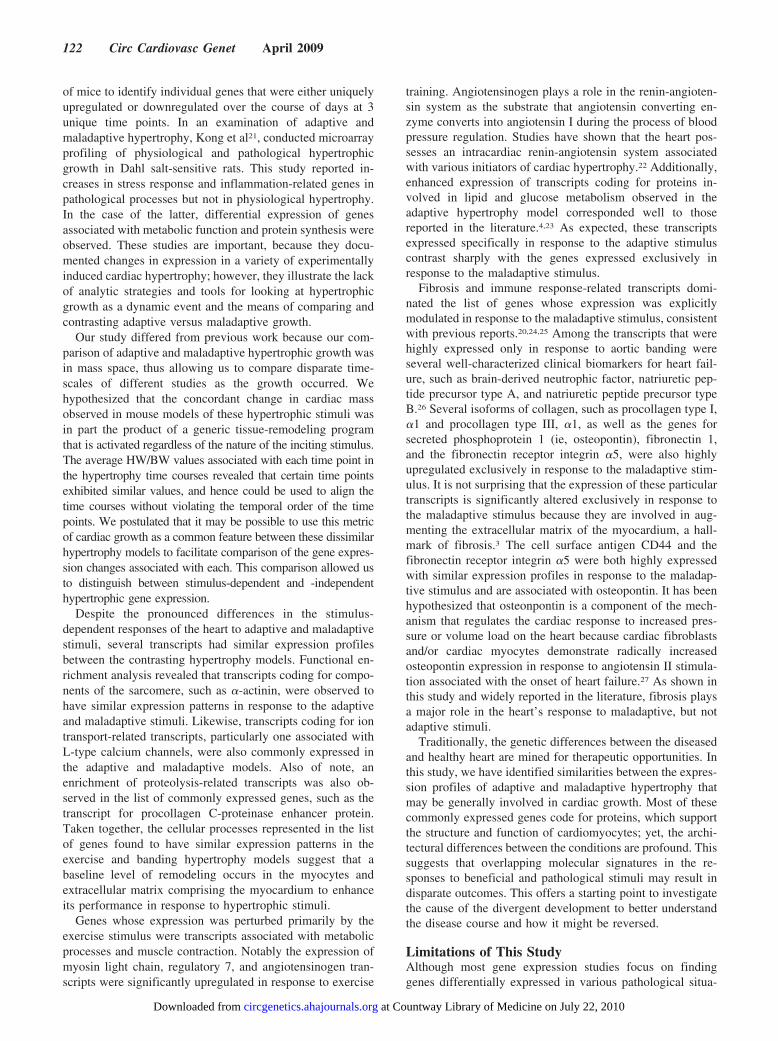
representing a greater degree of similarity between thetemporal expression profiles of a gene i observed in thehypertrophy models. A cutoff score of 0.45 was chosen todistinguish transcripts with similar expression profiles inthe exercise and banding time courses. That is, all geneswith di�0.45 were considered to have similar temporalpatterns of expression in both types of hypertrophy.Between the HW/BW aligned hypertrophy models, 136transcripts (14.5%) displayed distance scores �0.45. Thevastly different expression profiles for the connectivetissue growth factor gene observed in the adaptive andmaladaptive responses, coupled with the previous associ-ation of increased connective tissue growth factor expres-sion with heart failure,17 suggest that the Statistical Inves-tigator of Transcriptional Homology analysis correctlydistinguished transcripts with common expression patternsin response to the adaptive and maladaptive stimuli fromthose that embody a stimulus-specific response. Addition-ally, comparison of the time- and mass-aligned profiles forgenes with distance scores less than the selected cutoffvalue, such as voltage-gated calcium channel subunit�2/�1 (Figure 4A and 4D), �-actinin 1 (Figure 4B and 4E),and procollagen C-proteinase (Figure 4C and 4F), showedthat the similarities in the expression profiles revealed bythe Statistical Investigator of Transcriptional Homologyanalysis for the mass-aligned hypertrophy models was notevident when they were aligned based on time. Thetranscripts identified as having common temporal expres-sion profiles (low di) were subjected to functional enrich-ment analysis to identify the cellular processes theyparticipate in (Figure 5). The results suggest that the functionalcategories to which the generic hypertrophy associated genesbelong include primarily cytoskeletal organization, extracellularmatrix, metabolism, ion transport, cell adhesion, proteolysis, andregulation of transcription.
DiscussionPrevious studies have used expression profiling to identifygenes contributing to hypertrophic growth. Friddle et al18, didexpression profiling of pharmacological models of cardiachypertrophy in mice and reported groups of known and novelgenes whose expression was transiently regulated distinctlyduring induction and regression of hypertrophy. Severalmodels of experimentally induced hypertrophy in rats haveidentified a group of 139 genes with consistent differentialexpression, suggesting a common genetic program that un-derlies pathogenic hypertrophic growth.19 Zhao et al20, usedaortic constriction to induce hypertrophic growth in the hearts
Figure 4. Average SLRs were plottedagainst time (A through C) and HW/BWratio (D through F) for the adaptive (exer-cise, E) and maladaptive (banding, F) hy-pertrophy experimental conditions tocompare the gene-expression profiles forvoltage-dependent calcium channel �2/�1(A, D), �-actinin 1 (B and E), and procolla-gen C-proteinase enhancer (C and F)before and after mass alignment. AU indi-cates arbitrary units.
Figure 5. A, Gene ontology biological process terms were usedto identify the cellular processes represented in the list of simi-larly expressed genes, and the proportion of genes that fell intoeach category was plotted. B, Functional enrichment analysisprovided by the National Institutes of Health’s DAVID Bioinfor-matics Resources (see Methods section) identified the biologicalprocesses terms that were overrepresented in the list of simi-larly expressed genes. Segment sizes represent the enrichmentscores with geometric means �0.05, with larger segments indi-cating higher enrichment.
Sheehy et al Comparison of Adaptive and Maladaptive Hypertrophy 121
at Countway Library of Medicine on July 22, 2010 circgenetics.ahajournals.orgDownloaded from
of mice to identify individual genes that were either uniquelyupregulated or downregulated over the course of days at 3unique time points. In an examination of adaptive andmaladaptive hypertrophy, Kong et al21, conducted microarrayprofiling of physiological and pathological hypertrophicgrowth in Dahl salt-sensitive rats. This study reported in-creases in stress response and inflammation-related genes inpathological processes but not in physiological hypertrophy.In the case of the latter, differential expression of genesassociated with metabolic function and protein synthesis wereobserved. These studies are important, because they docu-mented changes in expression in a variety of experimentallyinduced cardiac hypertrophy; however, they illustrate the lackof analytic strategies and tools for looking at hypertrophicgrowth as a dynamic event and the means of comparing andcontrasting adaptive versus maladaptive growth.
Our study differed from previous work because our com-parison of adaptive and maladaptive hypertrophic growth wasin mass space, thus allowing us to compare disparate time-scales of different studies as the growth occurred. Wehypothesized that the concordant change in cardiac massobserved in mouse models of these hypertrophic stimuli wasin part the product of a generic tissue-remodeling programthat is activated regardless of the nature of the inciting stimulus.The average HW/BW values associated with each time point inthe hypertrophy time courses revealed that certain time pointsexhibited similar values, and hence could be used to align thetime courses without violating the temporal order of the timepoints. We postulated that it may be possible to use this metricof cardiac growth as a common feature between these dissimilarhypertrophy models to facilitate comparison of the gene expres-sion changes associated with each. This comparison allowed usto distinguish between stimulus-dependent and -independenthypertrophic gene expression.
Despite the pronounced differences in the stimulus-dependent responses of the heart to adaptive and maladaptivestimuli, several transcripts had similar expression profilesbetween the contrasting hypertrophy models. Functional en-richment analysis revealed that transcripts coding for compo-nents of the sarcomere, such as �-actinin, were observed tohave similar expression patterns in response to the adaptiveand maladaptive stimuli. Likewise, transcripts coding for iontransport-related transcripts, particularly one associated withL-type calcium channels, were also commonly expressed inthe adaptive and maladaptive models. Also of note, anenrichment of proteolysis-related transcripts was also ob-served in the list of commonly expressed genes, such as thetranscript for procollagen C-proteinase enhancer protein.Taken together, the cellular processes represented in the listof genes found to have similar expression patterns in theexercise and banding hypertrophy models suggest that abaseline level of remodeling occurs in the myocytes andextracellular matrix comprising the myocardium to enhanceits performance in response to hypertrophic stimuli.
Genes whose expression was perturbed primarily by theexercise stimulus were transcripts associated with metabolicprocesses and muscle contraction. Notably the expression ofmyosin light chain, regulatory 7, and angiotensinogen tran-scripts were significantly upregulated in response to exercise
training. Angiotensinogen plays a role in the renin-angioten-sin system as the substrate that angiotensin converting en-zyme converts into angiotensin I during the process of bloodpressure regulation. Studies have shown that the heart pos-sesses an intracardiac renin-angiotensin system associatedwith various initiators of cardiac hypertrophy.22 Additionally,enhanced expression of transcripts coding for proteins in-volved in lipid and glucose metabolism observed in theadaptive hypertrophy model corresponded well to thosereported in the literature.4,23 As expected, these transcriptsexpressed specifically in response to the adaptive stimuluscontrast sharply with the genes expressed exclusively inresponse to the maladaptive stimulus.
Fibrosis and immune response-related transcripts domi-nated the list of genes whose expression was explicitlymodulated in response to the maladaptive stimulus, consistentwith previous reports.20,24,25 Among the transcripts that werehighly expressed only in response to aortic banding wereseveral well-characterized clinical biomarkers for heart fail-ure, such as brain-derived neutrophic factor, natriuretic pep-tide precursor type A, and natriuretic peptide precursor typeB.26 Several isoforms of collagen, such as procollagen type I,�1 and procollagen type III, �1, as well as the genes forsecreted phosphoprotein 1 (ie, osteopontin), fibronectin 1,and the fibronectin receptor integrin �5, were also highlyupregulated exclusively in response to the maladaptive stim-ulus. It is not surprising that the expression of these particulartranscripts is significantly altered exclusively in response tothe maladaptive stimulus because they are involved in aug-menting the extracellular matrix of the myocardium, a hall-mark of fibrosis.3 The cell surface antigen CD44 and thefibronectin receptor integrin �5 were both highly expressedwith similar expression profiles in response to the maladap-tive stimulus and are associated with osteopontin. It has beenhypothesized that osteonpontin is a component of the mech-anism that regulates the cardiac response to increased pres-sure or volume load on the heart because cardiac fibroblastsand/or cardiac myocytes demonstrate radically increasedosteopontin expression in response to angiotensin II stimula-tion associated with the onset of heart failure.27 As shown inthis study and widely reported in the literature, fibrosis playsa major role in the heart’s response to maladaptive, but notadaptive stimuli.
Traditionally, the genetic differences between the diseasedand healthy heart are mined for therapeutic opportunities. Inthis study, we have identified similarities between the expres-sion profiles of adaptive and maladaptive hypertrophy thatmay be generally involved in cardiac growth. Most of thesecommonly expressed genes code for proteins, which supportthe structure and function of cardiomyocytes; yet, the archi-tectural differences between the conditions are profound. Thissuggests that overlapping molecular signatures in the re-sponses to beneficial and pathological stimuli may result indisparate outcomes. This offers a starting point to investigatethe cause of the divergent development to better understandthe disease course and how it might be reversed.
Limitations of This StudyAlthough most gene expression studies focus on findinggenes differentially expressed in various pathological situa-
122 Circ Cardiovasc Genet April 2009
at Countway Library of Medicine on July 22, 2010 circgenetics.ahajournals.orgDownloaded from
tions, we used a new analysis technique to identify commonelements in 2 distinct models of cardiac hypertrophy, forcommonalities can provide a deeper understanding of funda-mental processes that do not depend on specific mechanisticaspects.
In doing so, we first uncovered a relationship betweenHW/BW ratio and the gene expression profiles in adaptive ormaladaptive hypertrophy. However, HW/BW ratio may notbe the best physiological indicator of cardiac hypertrophy.HW/BW ratio was chosen for this study because the valuesfor these physiological parameters are commonly reported instudies of cardiac hypertrophy. Nonetheless, BW can fluctu-ate independently of HW because of perturbations in dietand/or exercise, leading to false-positive or false-negativereporting of hypertrophy. A more stable parameter, such astibia length instead of BW may provide a more reliablecomparison against HW for determining the incidence ofcardiac hypertrophy.
In addition, artifactual differences in the experimentalprotocols often hard to avoid when comparing physiologicaland pathological manifestations of the same process. Thesham operation and sedentary control groups against whichthe aortic banding– and exercise-induced hypertrophy groupswere compared consisted of mice with slight differences inage, weight, and the manner in which they were treated. Thismay introduce unspecific differences in the transcriptomes ofthe mice. However, because our emphasis is on the charac-terization of commonalities between 2 hypertrophy models,technical (nonrelevant) differences will not have affected thespecificity of our findings albeit the sensitivity could havebeen reduced (omission of interesting, commonly alteredgenes).
Finally, the analysis algorithms used in this study requiredthat the gene expression datasets be “symmetrical,” that is,for every transcript in the banding dataset, the same transcripthad to be present in the exercise dataset as well. Thissymmetry was created by using different stringency criteria inthe SAM analyses initially conducted on the banding- andexercise-induced hypertrophy expression datasets. Althoughwe attempted to account for this discrepancy by applyingmore restrictive standards in our characterization of thedifferences and similarities between the banding and exercisedatasets, the criteria used for the selection of the genes wereestablished subjectively. Therefore, the results presented inthis study provide what we feel is a representative, butincomplete, sampling of the differences and commonalities ingene expression between these models of hypertrophy.
Sources of FundingFunding for this work was provided by the Harvard UniversityJoseph H. Clark research support fund and National Institutes ofHealth R01 grant HL079126-01A2 (K.K.P.).
DisclosuresNone.
References1. Levy D, Garrison RJ, Savage DD, Kannel WB, Castelli WP. Prog-
nostic implications of echocardiographically determined left ventric-
ular mass in the Framingham Heart Study. N Eng J Med. 1990;322:1561–1566.
2. Fagard RH. Impact of different sports and training on cardiac structureand function. Cardiol. Clin. 1997;15:397– 412.
3. Wakatsuki T, Schlessinger J, Elson EL. The biochemical response of theheart to hypertension and exercise. TRENDS Biochem Sci. 2004;29:609–617.
4. Strom CC, Aplin M, Ploug T, Christoffersen TEH, Langfort J, Viese M,Galbo H, Haunso S, Sheikh SP. Expression profiling reveals differencesin metabolic gene expression between exercise-induced cardiac effectsand maladaptive cardiac hypertrophy. FEBS Journal. 2005;272:2684–2695.
5. MacLellan WR, Schneider MD. Genetic dissection of cardiac growthcontrol pathways. Annu Rev Physiol. 2000;62:289–319.
6. Mirotsou M, Watanabe CMH, Schultz PG, Pratt RE, Dzau VJ. Eluci-dating the molecular mechanism of cardiac remodeling using a com-parative genomic approach. Physiol Genomics. 2003;15:115–126.
7. Genomics of Cardiovascular Development, Adaptation, and Remodeling.NHLBI Program for Genomic Applications, Harvard Medical School.Available at http://www.cardiogenomics.org. Accessed October 2006.
8. Bar-Joseph Z. Analyzing time series gene expression data. Bioinformatics.2004;20:2493–2503.
9. Aach J, Church GM. Aligning gene expression time series with timewarping algorithms. Bioinformatics. 2001;17:495–508.
10. Mirotsou M, Dzau VJ, Pratt RE, Weinberg EO. Physiological genomicsof cardiac disease: quantitative relationships between gene expression andleft ventricular hypertrophy. Physiol Genomics. 2006;27:86–94.
11. Kaplan ML, Cheslow Y, Vikstrom K, Malhotra A, Geenen DL, NakouziA, Leinwand LA, Buttrick PM. Cardiac adaptations to chronic exercise inmice. Am J Physiol. 1994;267:H1167–H1173.
12. Tarnavski O, McMullen JR, Schinke M, Nie Q, Kong S, Izumo S. Mousecardiac surgery: comprehensive techniques for the generation of mousemodels of human diseases and their application for genomic studies.Physiol Genomics. 2004;16:349–360.
13. Tusher VG, Tibshirani R, Chu G. Significance analysis of microarraysapplied to the ionizing radiation response. Proc Natl Acad Sci USA.2001;98:5116–5121.
14. Eichler GS, Huang S, Ingber DE. Gene Expression Dynamics Inspector(GEDI): for integrative analysis of expression profiles. Bioinformatics.2003;19:2321–2322.
15. Eisen MB, Spellman PT, Brown PO, Botstein D. Cluster analysis anddisplay of genome-wide expression patterns. Proc Natl Acad Sci USA.1998;95:14863–14868.
16. Dennis G Jr, Sherman BT, Hosack DA, Yang J, Gao W, Lane HC,Lempicki RA. DAVID: database for annotation, visualization, and inte-grated discovery. Genome Biol. 2003;4:R60.
17. Weinberg EO, Mirotsou M, Gannon J, Dzau VJ, Lee RT, Pratt RT. Sexdependence and temporal dependence of the left ventricular genomicresponse to pressure overload. Physiol Genomics. 2003;12:113–127.
18. Friddle CJ, Koga T, Rubin EM, Bristow J. Expression profilingreveals distinct sets of genes altered during induction and regressionof cardiac hypertrophy. Proc Natl Acad Sci USA. 2000;97:6745– 6750.
19. Strøm CC, Kruhøffer M, Knudsen S, Stensgaard-Hansen F, Jonassen TE,Orntoft TF, Haunsø S, Sheikh SP. Identification of a core set of genes thatsignifies pathways underlying cardiac hypertrophy. Comp FunctGenomics. 2004;5:459–470.
20. Zhao M, Chow A, Powers J, Fajardo G, Bernstein D. Microarray analysisof gene expression after transverse aortic constriction in mice. PhysiolGenomics. 2004;19:93–105.
21. Kong SW, Bodyak N, Yue P, Liu Z, Brown J, Izumo S, Kang PM.Genetic expression profiles during physiological and pathologicalcardiac hypertrophy and heart failure in rats. Physiol Genomics. 2005;21:34 – 42.
22. Raman VK, Lee YA, Lindpaintner K. The cardiac rennin-angiotensin-al-dosterone system and hypertensive cardiac hypertrophy. Am J Cardiol.1995;76:18D–23D.
23. Selvetella G, Hirsch E, Notte A, Tarone G, Lembo G. Adaptive andmaladaptive hypertrophic pathways: points of convergence anddivergence. Cardiovasc Res. 2004;63:373–380.
24. Johnatty SE, Dyck JRB, Michael LH, Olsen EN, Abdellatif M. Identifi-cation of genes regulated during mechanical load-induced cardiac hyper-trophy. J Mol Cell Cardiol. 2000;32:805–815.
25. Van den Bosch BJC, Lindsey PJ, Van den Burg CMM, Van der VliesSA, Lips DJ, Van der Vusse GJ, Ayoubi TA, Doevendans PA, SmeetsHJM. Early and transient gene expression changes in pressure
Sheehy et al Comparison of Adaptive and Maladaptive Hypertrophy 123
at Countway Library of Medicine on July 22, 2010 circgenetics.ahajournals.orgDownloaded from
overload-induced cardiac hypertrophy in mice. Genomics. 2006;88:480 – 488.
26. Maisel AS, Bhalla V, Braunwald E. Cardiac biomarkers: a contemporarystatus report. Nat Clin Pract Cardiovasc Med. 2006;3:24–34.
27. Graf K, Do YS, Ashizawa N, Meehan WP, Giachelli CM, Marboe CC,Fleck E, Hsueh WH. Myocardial osteopontin expression is associatedwith left ventricular hypertrophy. Circulation. 1997;96:3063-3071.
CLINICAL PERSPECTIVEThe genes identified in this study as having similar expression profiles between adaptive and maladaptive stimuli of cardiachypertrophy, which may have been overseen without the time-warping alignment to the state of hypertrophy, may begenerically involved in profound mechanisms for the development of hypertrophy. They offer a starting point forunderstanding the mechanisms of mechanically induced cardiac remodeling, which could in turn lead to the developmentof diagnostic and treatment strategies for preventing the progression from cardiac hypertrophy to heart failure. Peptides,such as cardiac troponin I, have long been used to evaluate patients for the diagnosis of myocardial infarction. However,these peptides are not released from cardiac myocytes until late in the disease process after cell destruction has occurred.Using gene microarray expression studies, we may be able to identify proteins that are secreted early in the pathologicalresponse to stress before cell death occurs; these proteins could serve as biomarkers for the onset of maladaptiveremodeling. Additionally, understanding the mechanisms underlying myocardial remodeling could yield insight for thedevelopment of therapeutic strategies that take advantage of these common processes to normalize stress in themyocardium before pathological remodeling mechanisms, such as fibrosis, are initiated.
124 Circ Cardiovasc Genet April 2009
at Countway Library of Medicine on July 22, 2010 circgenetics.ahajournals.orgDownloaded from
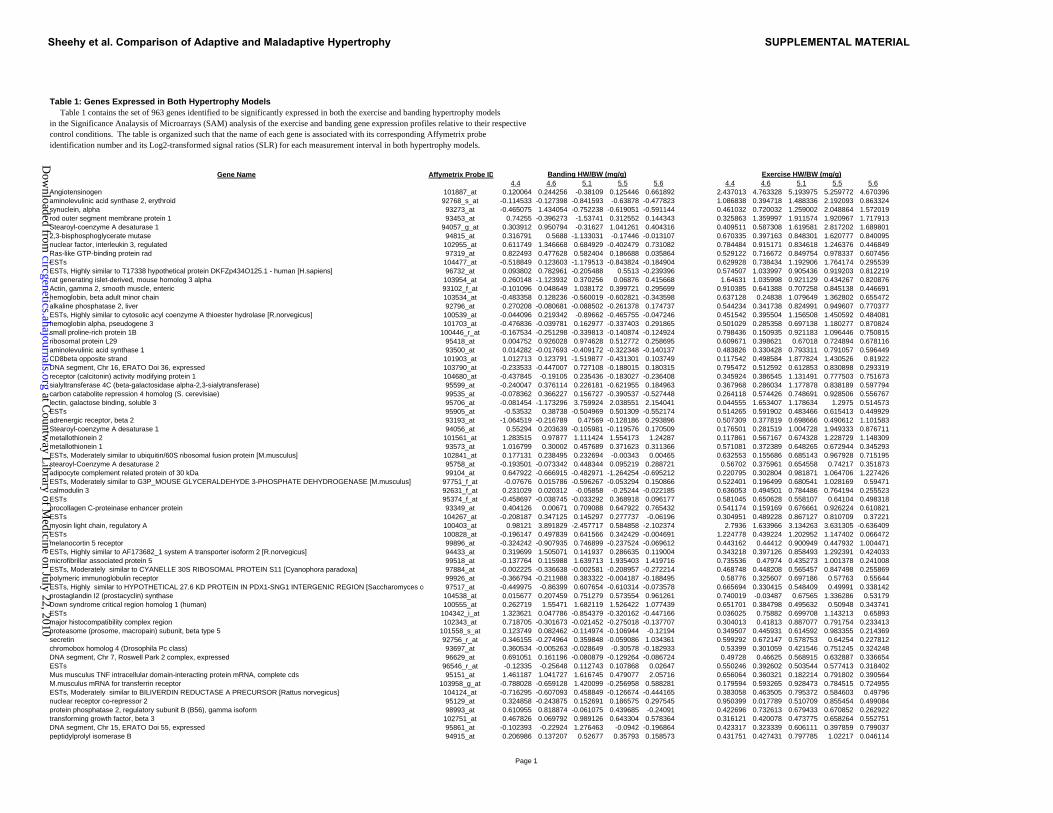
Table 1: Genes Expressed in Both Hypertrophy Models Table 1 contains the set of 963 genes identified to be significantly expressed in both the exercise and banding hypertrophy models in the Significance Analaysis of Microarrays (SAM) analysis of the exercise and banding gene expression profiles relative to their respective control conditions. The table is organized such that the name of each gene is associated with its corresponding Affymetrix probeidentification number and its Log2-transformed signal ratios (SLR) for each measurement interval in both hypertrophy models.
Gene Name Affymetrix Probe ID 4.4 4.6 5.1 5.5 5.6 4.4 4.6 5.1 5.5 5.6Angiotensinogen 101887_at 0.120064 0.244256 -0.38109 0.125446 0.661892 2.437013 4.763328 5.193975 5.259772 4.670396aminolevulinic acid synthase 2, erythroid 92768_s_at -0.114533 -0.127398 -0.841593 -0.63878 -0.477823 1.086838 0.394718 1.488336 2.192093 0.863324synuclein, alpha 93273_at -0.465075 1.434054 -0.752238 -0.619051 -0.591144 0.461032 0.720032 1.259002 2.048864 1.572019rod outer segment membrane protein 1 93453_at 0.74255 -0.396273 -1.53741 0.312552 0.144343 0.325863 1.359997 1.911574 1.920967 1.717913Stearoyl-coenzyme A desaturase 1 94057_g_at 0.303912 0.950794 -0.31627 1.041261 0.404316 0.409511 0.587308 1.619581 2.817202 1.6898012,3-bisphosphoglycerate mutase 94815_at 0.316791 0.5688 -1.133031 -0.17446 -0.013107 0.670335 0.397163 0.848301 1.620777 0.840095nuclear factor, interleukin 3, regulated 102955_at 0.611749 1.346668 0.684929 -0.402479 0.731082 0.784484 0.915171 0.834618 1.246376 0.446849Ras-like GTP-binding protein rad 97319_at 0.822493 0.477628 0.582404 0.186688 0.035864 0.529122 0.716672 0.849754 0.978337 0.607456ESTs 104477_at -0.518849 0.123603 -1.179513 -0.843824 -0.184904 0.629928 0.738434 1.192906 1.764174 0.295539ESTs, Highly similar to T17338 hypothetical protein DKFZp434O125.1 - human [H.sapiens] 96732_at 0.093802 0.782961 -0.205488 0.5513 -0.239396 0.574507 1.033997 0.905436 0.919203 0.812219rat generating islet-derived, mouse homolog 3 alpha 103954_at 0.260148 -1.123932 0.370256 0.06876 0.415668 1.64631 1.035998 0.921129 0.434267 0.820876Actin, gamma 2, smooth muscle, enteric 93102_f_at -0.101096 0.048649 1.038172 0.399721 0.295699 0.910385 0.641388 0.707258 0.845138 0.446691hemoglobin, beta adult minor chain 103534_at -0.483358 0.128236 -0.560019 -0.602821 -0.343598 0.637128 0.24838 1.079649 1.362802 0.655472alkaline phosphatase 2, liver 92796_at 0.270208 -0.080681 -0.088502 -0.261378 0.174737 0.544234 0.341738 0.824991 0.949607 0.770377ESTs, Highly similar to cytosolic acyl coenzyme A thioester hydrolase [R.norvegicus] 100539_at -0.044096 0.219342 -0.89662 -0.465755 -0.047246 0.451542 0.395504 1.156508 1.450592 0.484081hemoglobin alpha, pseudogene 3 101703_at -0.476836 -0.039781 0.162977 -0.337403 0.291865 0.501029 0.285358 0.697138 1.180277 0.870824small proline-rich protein 1B 100446_r_at -0.167534 -0.251298 -0.339813 -0.140874 -0.124924 0.798436 0.150935 0.921183 1.096446 0.750815ribosomal protein L29 95418_at 0.004752 0.926028 0.974628 0.512772 0.258695 0.609671 0.398621 0.67018 0.724894 0.678116aminolevulinic acid synthase 1 93500_at 0.014282 -0.017693 -0.409172 -0.322348 -0.140137 0.483826 0.330428 0.793311 0.791057 0.596449CD8beta opposite strand 101903_at 1.012713 0.123791 -1.519877 -0.431301 0.103749 0.117542 0.498584 1.877824 1.430526 0.81922DNA segment, Chr 16, ERATO Doi 36, expressed 103790_at -0.233533 -0.447007 0.727108 -0.188015 0.180315 0.795472 0.512592 0.612853 0.830898 0.293319receptor (calcitonin) activity modifying protein 1 104680_at -0.437845 -0.19105 0.235436 -0.183027 -0.236408 0.345924 0.386545 1.131491 0.777503 0.751673sialyltransferase 4C (beta-galactosidase alpha-2,3-sialytransferase) 95599_at -0.240047 0.376114 0.226181 -0.621955 0.184963 0.367968 0.286034 1.177878 0.838189 0.597794carbon catabolite repression 4 homolog (S. cerevisiae) 99535_at -0.078362 0.366227 0.156727 -0.390537 -0.527448 0.264118 0.574426 0.748691 0.928506 0.556767lectin, galactose binding, soluble 3 95706_at -0.081454 -1.173296 3.759924 2.038551 2.154041 0.044555 1.653407 1.178634 1.2975 0.514573ESTs 95905_at -0.53532 0.38738 -0.504969 0.501309 -0.552174 0.514265 0.591902 0.483466 0.615413 0.449929adrenergic receptor, beta 2 93193_at -1.064519 -0.216789 0.47569 -0.128186 0.293896 0.507309 0.377819 0.698666 0.490612 1.101583Stearoyl-coenzyme A desaturase 1 94056_at 0.55294 0.203639 -0.105981 -0.119576 0.170509 0.176501 0.281519 1.004728 1.949333 0.876711metallothionein 2 101561_at 1.283515 0.97877 1.111424 1.554173 1.24287 0.117861 0.567167 0.674328 1.228729 1.148309metallothionein 1 93573_at 1.016799 0.30002 0.457689 0.371623 0.311366 0.571081 0.372389 0.648265 0.672944 0.345293ESTs, Moderately similar to ubiquitin/60S ribosomal fusion protein [M.musculus] 102841_at 0.177131 0.238495 0.232694 -0.00343 0.00465 0.632553 0.155686 0.685143 0.967928 0.715195stearoyl-Coenzyme A desaturase 2 95758_at -0.193501 -0.073342 0.448344 0.095219 0.288721 0.56702 0.375961 0.654558 0.74217 0.351873adipocyte complement related protein of 30 kDa 99104_at 0.647922 -0.666915 -0.482971 -1.264254 -0.695212 0.220795 0.302804 0.981871 1.064706 1.227426ESTs, Moderately similar to G3P_MOUSE GLYCERALDEHYDE 3-PHOSPHATE DEHYDROGENASE [M.musculus] 97751_f_at -0.07676 0.015786 -0.596267 -0.053294 0.150866 0.522401 0.196499 0.680541 1.028169 0.59471calmodulin 3 92631_f_at 0.231029 0.020312 -0.05858 -0.25244 -0.022185 0.636053 0.494501 0.784486 0.764194 0.255523ESTs 95374_f_at -0.458697 -0.038745 -0.033292 0.368918 0.096177 0.581045 0.650628 0.558107 0.64104 0.498318procollagen C-proteinase enhancer protein 93349_at 0.404126 0.00671 0.709088 0.647922 0.765432 0.541174 0.159169 0.676661 0.926224 0.610821ESTs 104267_at -0.208187 0.347125 0.145297 0.277737 -0.06196 0.304951 0.489228 0.867127 0.810709 0.37221myosin light chain, regulatory A 100403_at 0.98121 3.891829 -2.457717 0.584858 -2.102374 2.7936 1.633966 3.134263 3.631305 -0.636409ESTs 100828_at -0.196147 0.497839 0.641566 0.342429 -0.004691 1.224778 0.439224 1.202952 1.147402 0.066472melanocortin 5 receptor 99896_at -0.324242 -0.907935 0.746899 -0.237524 -0.069612 0.443162 0.44412 0.900949 0.447932 1.004471ESTs, Highly similar to AF173682_1 system A transporter isoform 2 [R.norvegicus] 94433_at 0.319699 1.505071 0.141937 0.286635 0.119004 0.343218 0.397126 0.858493 1.292391 0.424033microfibrillar associated protein 5 99518_at -0.137764 0.115988 1.639713 1.935403 1.419716 0.735536 0.47974 0.435273 1.001378 0.241008ESTs, Moderately similar to CYANELLE 30S RIBOSOMAL PROTEIN S11 [Cyanophora paradoxa] 97884_at -0.002225 -0.336638 -0.002581 -0.208957 -0.272214 0.468748 0.448208 0.565457 0.847498 0.255869polymeric immunoglobulin receptor 99926_at -0.366794 -0.211988 0.383322 -0.004187 -0.188495 0.58776 0.325607 0.697186 0.57763 0.55644ESTs, Highly similar to HYPOTHETICAL 27.6 KD PROTEIN IN PDX1-SNG1 INTERGENIC REGION [Saccharomyces ce 97517_at -0.449975 -0.86399 0.607654 -0.610314 -0.073578 0.665694 0.330415 0.548409 0.49991 0.338142prostaglandin I2 (prostacyclin) synthase 104538_at 0.015677 0.207459 0.751279 0.573554 0.961261 0.740019 -0.03487 0.67565 1.336286 0.53179Down syndrome critical region homolog 1 (human) 100555_at 0.262719 1.55471 1.682119 1.526422 1.077439 0.651701 0.384798 0.495632 0.50948 0.343741ESTs 104342_i_at 1.323621 0.047786 -0.854379 -0.320162 -0.447166 0.036025 0.75882 0.699708 1.143213 0.65893major histocompatibility complex region 102343_at 0.718705 -0.301673 -0.021452 -0.275018 -0.137707 0.304013 0.41813 0.887077 0.791754 0.233413proteasome (prosome, macropain) subunit, beta type 5 101558_s_at 0.123749 0.082462 -0.114974 -0.106944 -0.12194 0.349507 0.445931 0.614592 0.983355 0.214369secretin 92756_r_at -0.346155 -0.274964 0.359848 -0.059086 1.034361 0.599292 0.672147 0.578753 0.64254 0.227812chromobox homolog 4 (Drosophila Pc class) 93697_at 0.360534 -0.005263 -0.028649 -0.30578 -0.182933 0.53399 0.301059 0.421546 0.751245 0.324248DNA segment, Chr 7, Roswell Park 2 complex, expressed 96629_at 0.691051 0.161196 -0.080879 -0.129264 -0.086724 0.49728 0.46625 0.568915 0.632887 0.336654ESTs 96546_r_at -0.12335 -0.25648 0.112743 0.107868 0.02647 0.550246 0.392602 0.503544 0.577413 0.318402Mus musculus TNF intracellular domain-interacting protein mRNA, complete cds 95151_at 1.461187 1.041727 1.616745 0.479077 2.05716 0.656064 0.360321 0.182214 0.791802 0.390564M.musculus mRNA for transferrin receptor 103958_g_at -0.788028 -0.659128 1.420099 -0.256958 0.588281 0.179594 0.593265 0.928473 0.784515 0.724955ESTs, Moderately similar to BILIVERDIN REDUCTASE A PRECURSOR [Rattus norvegicus] 104124_at -0.716295 -0.607093 0.458849 -0.126674 -0.444165 0.383058 0.463505 0.795372 0.584603 0.49796nuclear receptor co-repressor 2 95129_at 0.324858 -0.243875 0.152691 0.186575 0.297545 0.950399 0.017789 0.510709 0.855454 0.499084protein phosphatase 2, regulatory subunit B (B56), gamma isoform 98993_at 0.610955 0.818874 -0.061075 0.439685 -0.24091 0.422696 0.732613 0.679433 0.670852 0.262922transforming growth factor, beta 3 102751_at 0.467826 0.069792 0.989126 0.643304 0.578364 0.316121 0.420078 0.473775 0.658264 0.552751DNA segment, Chr 15, ERATO Doi 55, expressed 95861_at -0.102393 -0.22924 1.276463 -0.0942 -0.196864 0.423317 0.323339 0.606111 0.397859 0.799037peptidylprolyl isomerase B 94915_at 0.206986 0.137207 0.52677 0.35793 0.158573 0.431751 0.427431 0.797785 1.02217 0.046114
Banding HW/BW (mg/g) Exercise HW/BW (mg/g)
Page 1
Sheehy et al. Comparison of Adaptive and Maladaptive Hypertrophy SUPPLEMENTAL MATERIAL
at Countw
ay Library of M
edicine on July 22, 2010 circgenetics.ahajournals.org
Dow
nloaded from
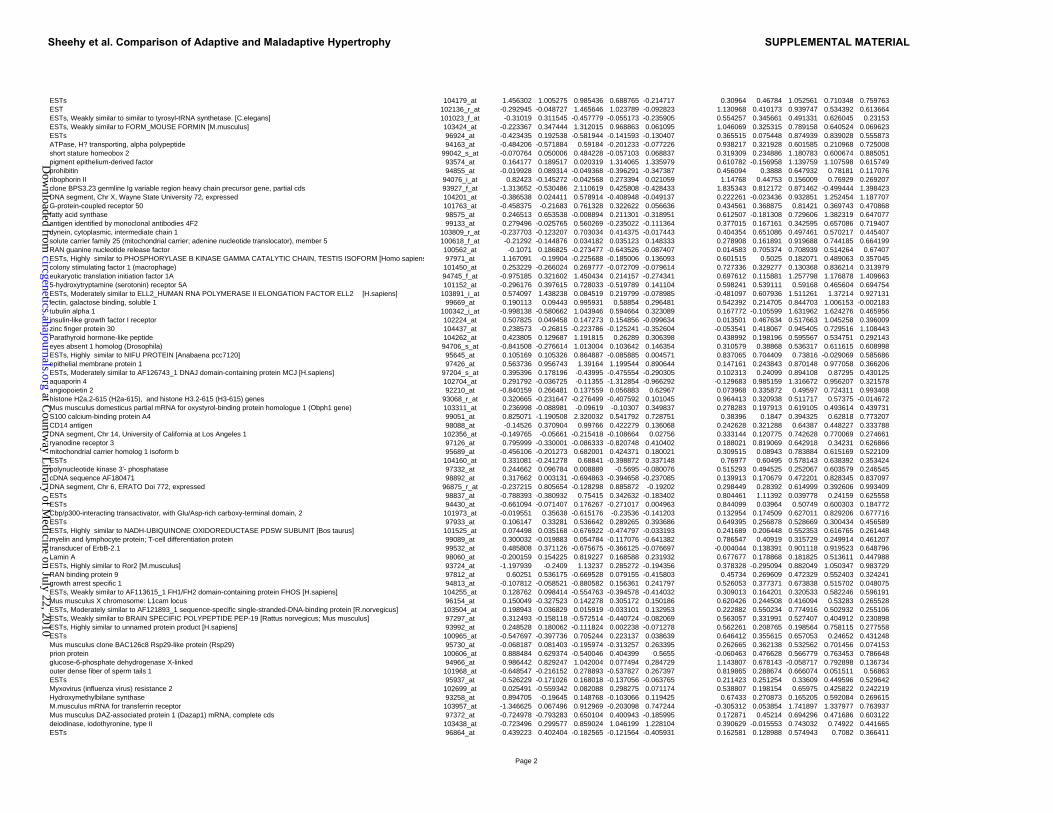
ESTs 104179_at 1.456302 1.005275 0.985436 0.688765 -0.214717 0.30964 0.46784 1.052561 0.710348 0.759763EST 102136_r_at -0.292945 -0.048727 1.465646 1.023789 -0.092823 1.130968 0.410173 0.939747 0.534392 0.613664ESTs, Weakly similar to similar to tyrosyl-tRNA synthetase. [C.elegans] 101023_f_at -0.31019 0.311545 -0.457779 -0.055173 -0.235905 0.554257 0.345661 0.491331 0.626045 0.23153ESTs, Weakly similar to FORM_MOUSE FORMIN [M.musculus] 103424_at -0.223367 0.347444 1.312015 0.968863 0.061095 1.046069 0.325315 0.789158 0.640524 0.069623ESTs 96924_at -0.423435 0.192538 -0.581944 -0.141593 -0.130407 0.365515 0.075448 0.874939 0.839028 0.555873ATPase, H? transporting, alpha polypeptide 94163_at -0.484206 -0.571884 0.59184 -0.201233 -0.077226 0.938217 0.321928 0.601585 0.210968 0.725008short stature homeobox 2 99042_s_at -0.070764 0.050006 0.484228 -0.057103 0.068837 0.319309 0.234886 1.180783 0.600674 0.885051pigment epithelium-derived factor 93574_at 0.164177 0.189517 0.020319 1.314065 1.335979 0.610782 -0.156958 1.139759 1.107598 0.615749prohibitin 94855_at -0.019928 0.089314 -0.049368 -0.396291 -0.347387 0.456094 0.3888 0.647932 0.78181 0.117076ribophorin II 94076_i_at 0.82423 -0.145272 -0.042568 0.273394 0.021059 1.14768 0.44753 0.156009 0.76929 0.269207clone BPS3.23 germline Ig variable region heavy chain precursor gene, partial cds 93927_f_at -1.313652 -0.530486 2.110619 0.425808 -0.428433 1.835343 0.812172 0.871462 -0.499444 1.398423DNA segment, Chr X, Wayne State University 72, expressed 104201_at -0.386538 0.024411 0.578914 -0.408948 -0.049137 0.222261 -0.023436 0.932851 1.252454 1.187707G-protein-coupled receptor 50 101763_at -0.458375 -0.21683 0.761328 0.322622 0.056636 0.434561 0.368875 0.81421 0.369743 0.470868fatty acid synthase 98575_at 0.246513 0.653538 -0.008894 0.211301 -0.318951 0.612507 -0.181308 0.729606 1.382319 0.647077antigen identified by monoclonal antibodies 4F2 99133_at 0.279496 -0.025765 0.560269 -0.235022 -0.111364 0.377015 0.167161 0.342595 0.657086 0.719407dynein, cytoplasmic, intermediate chain 1 103809_r_at -0.237703 -0.123207 0.703034 0.414375 -0.017443 0.404354 0.651086 0.497461 0.570217 0.445407solute carrier family 25 (mitochondrial carrier; adenine nucleotide translocator), member 5 100618_f_at -0.21292 -0.144876 0.034182 0.035123 0.148333 0.278908 0.161891 0.919688 0.744185 0.664199RAN guanine nucleotide release factor 100562_at -0.1071 0.186825 -0.273477 -0.643526 -0.087407 0.014583 0.705374 0.708939 0.514264 0.67407ESTs, Highly similar to PHOSPHORYLASE B KINASE GAMMA CATALYTIC CHAIN, TESTIS ISOFORM [Homo sapiens 97971_at 1.167091 -0.19904 -0.225688 -0.185006 0.136093 0.601515 0.5025 0.182071 0.489063 0.357045colony stimulating factor 1 (macrophage) 101450_at 0.253229 -0.266024 0.269777 -0.072709 -0.079614 0.727336 0.329277 0.130368 0.836214 0.313979eukaryotic translation initiation factor 1A 94745_f_at -0.975185 0.321602 1.450434 0.214157 -0.274341 0.697612 0.115881 1.257798 1.176878 1.4096635-hydroxytryptamine (serotonin) receptor 5A 101152_at -0.296176 0.397615 0.728033 -0.519789 0.141104 0.598241 0.539111 0.59168 0.465604 0.694754
�ESTs, Moderately similar to ELL2_HUMAN RNA POLYMERASE II ELONGATION FACTOR ELL2 [H.sapiens] 103891_i_at 0.574097 1.438238 0.084519 0.219799 -0.078985 -0.481097 0.607936 1.511261 1.37214 0.927131lectin, galactose binding, soluble 1 99669_at 0.190113 0.09443 0.995931 0.58854 0.296481 0.542392 0.214705 0.844703 1.006153 -0.002183tubulin alpha 1 100342_i_at -0.998138 -0.580662 1.043946 0.594664 0.323089 0.167772 -0.105599 1.631962 1.624276 0.465956insulin-like growth factor I receptor 102224_at 0.507825 0.049458 0.147273 0.154856 -0.099634 0.013501 0.467634 0.517663 1.045258 0.396009zinc finger protein 30 104437_at 0.238573 -0.26815 -0.223786 -0.125241 -0.352604 -0.053541 0.418067 0.945405 0.729516 1.108443Parathyroid hormone-like peptide 104262_at 0.423805 0.129687 1.191815 0.26289 0.306398 0.438992 0.198196 0.595567 0.534751 0.292143eyes absent 1 homolog (Drosophila) 94706_s_at -0.841508 -0.276614 1.013004 0.103642 0.146354 0.310579 0.38868 0.536317 0.611615 0.608998ESTs, Highly similar to NIFU PROTEIN [Anabaena pcc7120] 95645_at 0.105169 0.105326 0.864887 -0.085885 0.004571 0.837065 0.704409 0.73816 -0.029069 0.585686epithelial membrane protein 1 97426_at 0.563736 0.956743 1.39164 1.199544 0.890644 0.147161 0.243843 0.870148 0.977058 0.366206ESTs, Moderately similar to AF126743_1 DNAJ domain-containing protein MCJ [H.sapiens] 97204_s_at 0.395396 0.178196 -0.43995 -0.475554 -0.290305 0.102313 0.24099 0.894108 0.87295 0.430125aquaporin 4 102704_at 0.291792 -0.036725 -0.11355 -1.312854 -0.966292 -0.129683 0.985159 1.316672 0.956207 0.321578angiopoietin 2 92210_at -0.840159 0.266481 0.137559 0.056883 0.62967 0.073968 0.335872 0.49597 0.724311 0.993408histone H2a.2-615 (H2a-615), and histone H3.2-615 (H3-615) genes 93068_r_at 0.320665 -0.231647 -0.276499 -0.407592 0.101045 0.964413 0.320938 0.511717 0.57375 -0.014672Mus musculus domesticus partial mRNA for oxystyrol-binding protein homologue 1 (Obph1 gene) 103311_at 0.236998 -0.088981 -0.09619 -0.10307 0.349837 0.278283 0.197913 0.619105 0.493614 0.439731S100 calcium-binding protein A4 99051_at 0.825071 -1.190508 2.320032 0.541792 0.728751 0.38396 0.1847 0.394325 0.62818 0.773207CD14 antigen 98088_at -0.14526 0.370904 0.99766 0.422279 0.136068 0.242628 0.321288 0.64387 0.448227 0.333788DNA segment, Chr 14, University of California at Los Angeles 1 102356_at -0.149765 -0.05661 -0.215418 -0.108664 0.02756 0.333144 0.120775 0.742628 0.770069 0.274661ryanodine receptor 3 97126_at 0.795999 -0.330001 -0.086333 -0.820748 0.410402 0.188021 0.819069 0.642918 0.34231 0.626866mitochondrial carrier homolog 1 isoform b 95689_at -0.456106 -0.201273 0.682001 0.424371 0.180021 0.309515 0.08943 0.783884 0.615169 0.522109ESTs 104160_at 0.331081 -0.241278 0.68841 -0.398872 0.337148 0.76977 0.60495 0.578143 0.638392 0.353424polynucleotide kinase 3'- phosphatase 97332_at 0.244662 0.096784 0.008889 -0.5695 -0.080076 0.515293 0.494525 0.252067 0.603579 0.246545cDNA sequence AF180471 98892_at 0.317662 0.003131 -0.694863 -0.394658 -0.237085 0.139913 0.170679 0.472201 0.828345 0.837097DNA segment, Chr 6, ERATO Doi 772, expressed 96875_r_at -0.237215 0.805654 -0.128298 0.885872 -0.19202 0.298449 0.28392 0.614999 0.392606 0.993409ESTs 98837_at -0.788393 -0.380932 0.75415 0.342632 -0.183402 0.804461 1.11392 0.039778 0.24159 0.625558ESTs 94430_at -0.661094 -0.071407 0.176267 -0.271017 0.004963 0.844099 0.03964 0.50749 0.600303 0.184772Cbp/p300-interacting transactivator, with Glu/Asp-rich carboxy-terminal domain, 2 101973_at -0.019551 0.35638 -0.615176 -0.23536 -0.141203 0.132954 0.174509 0.627011 0.829206 0.677716ESTs 97933_at 0.106147 0.33281 0.536642 0.289265 0.393686 0.649395 0.256878 0.528669 0.300434 0.456589ESTs, Highly similar to NADH-UBIQUINONE OXIDOREDUCTASE PDSW SUBUNIT [Bos taurus] 101525_at 0.074498 0.035168 -0.676922 -0.474797 -0.033193 0.241689 0.206448 0.552353 0.616765 0.261448myelin and lymphocyte protein; T-cell differentiation protein 99089_at 0.300032 -0.019883 0.054784 -0.117076 -0.641382 0.786547 0.40919 0.315729 0.249914 0.461207transducer of ErbB-2.1 99532_at 0.485808 0.371126 -0.675675 -0.366125 -0.076697 -0.004044 0.138391 0.901118 0.919523 0.648796Lamin A 98060_at -0.200159 0.154225 0.819227 0.168588 0.231932 0.677677 0.178868 0.181825 0.513611 0.447988ESTs, Highly similar to Ror2 [M.musculus] 93724_at -1.197939 -0.2409 1.13237 0.285272 -0.194356 0.378328 -0.295094 0.882049 1.050347 0.983729RAN binding protein 9 97812_at 0.60251 0.536175 -0.669528 0.079155 -0.415803 0.45734 0.269609 0.472329 0.552403 0.324241growth arrest specific 1 94813_at -0.107812 -0.058521 -0.880582 0.156361 0.241797 0.526053 0.377371 0.673838 0.515702 0.048075ESTs, Weakly similar to AF113615_1 FH1/FH2 domain-containing protein FHOS [H.sapiens] 104255_at 0.128762 0.098414 -0.554763 -0.394578 -0.414032 0.309013 0.164201 0.320533 0.582246 0.596191Mus musculus X chromosome: L1cam locus 96154_at 0.150049 -0.327523 0.142278 0.305172 0.150186 0.620426 0.244508 0.416094 0.53283 0.265528ESTs, Moderately similar to AF121893_1 sequence-specific single-stranded-DNA-binding protein [R.norvegicus] 103504_at 0.198943 0.036829 0.015919 -0.033101 0.132953 0.222882 0.550234 0.774916 0.502932 0.255106ESTs, Weakly similar to BRAIN SPECIFIC POLYPEPTIDE PEP-19 [Rattus norvegicus; Mus musculus] 97297_at 0.312493 -0.158118 -0.572514 -0.440724 -0.082069 0.563057 0.331991 0.527407 0.404912 0.230898ESTs, Highly similar to unnamed protein product [H.sapiens] 93992_at 0.248528 0.180062 -0.111824 0.002238 -0.071278 0.562261 0.208765 0.198564 0.758115 0.277558ESTs 100965_at -0.547697 -0.397736 0.705244 0.223137 0.038639 0.646412 0.355615 0.657053 0.24652 0.431248Mus musculus clone BAC126c8 Rsp29-like protein (Rsp29) 95730_at -0.068187 0.081403 -0.195974 -0.313257 0.263395 0.262665 0.362138 0.532562 0.701456 0.074153prion protein 100606_at 0.888484 0.629374 -0.540046 0.404399 0.5655 -0.060463 0.476628 0.566779 0.763453 0.786648glucose-6-phosphate dehydrogenase X-linked 94966_at 0.986442 0.829247 1.042004 0.077494 0.284729 1.143807 0.678143 -0.058717 0.792898 0.136734outer dense fiber of sperm tails 1 101968_at -0.648547 -0.216152 0.278893 -0.537827 0.267397 0.819865 0.288674 0.666074 0.051511 0.56863ESTs 95937_at -0.526229 -0.171026 0.168018 -0.137056 -0.063765 0.211423 0.251254 0.33609 0.449596 0.529642Myxovirus (influenza virus) resistance 2 102699_at 0.025491 -0.559342 0.082088 0.298275 0.071174 0.538807 0.198154 0.65975 0.425822 0.242219Hydroxymethylbilane synthase 93258_at 0.894705 -0.19645 0.148768 -0.103066 0.119425 0.67433 0.270873 0.165205 0.592084 0.269615M.musculus mRNA for transferrin receptor 103957_at -1.346625 0.067496 0.912969 -0.203098 0.747244 -0.305312 0.053854 1.741897 1.337977 0.763937Mus musculus DAZ-associated protein 1 (Dazap1) mRNA, complete cds 97372_at -0.724978 -0.793283 0.650104 0.400943 -0.185995 0.172871 0.45214 0.694296 0.471686 0.603122deiodinase, iodothyronine, type II 103438_at -0.723496 0.299577 0.859024 1.046199 1.228104 0.390629 -0.015553 0.743032 0.74922 0.441665ESTs 96864_at 0.439223 0.402404 -0.182565 -0.121564 -0.405931 0.162581 0.128988 0.574943 0.7082 0.366411
Page 2
Sheehy et al. Comparison of Adaptive and Maladaptive Hypertrophy SUPPLEMENTAL MATERIAL
at Countw
ay Library of M
edicine on July 22, 2010 circgenetics.ahajournals.org
Dow
nloaded from
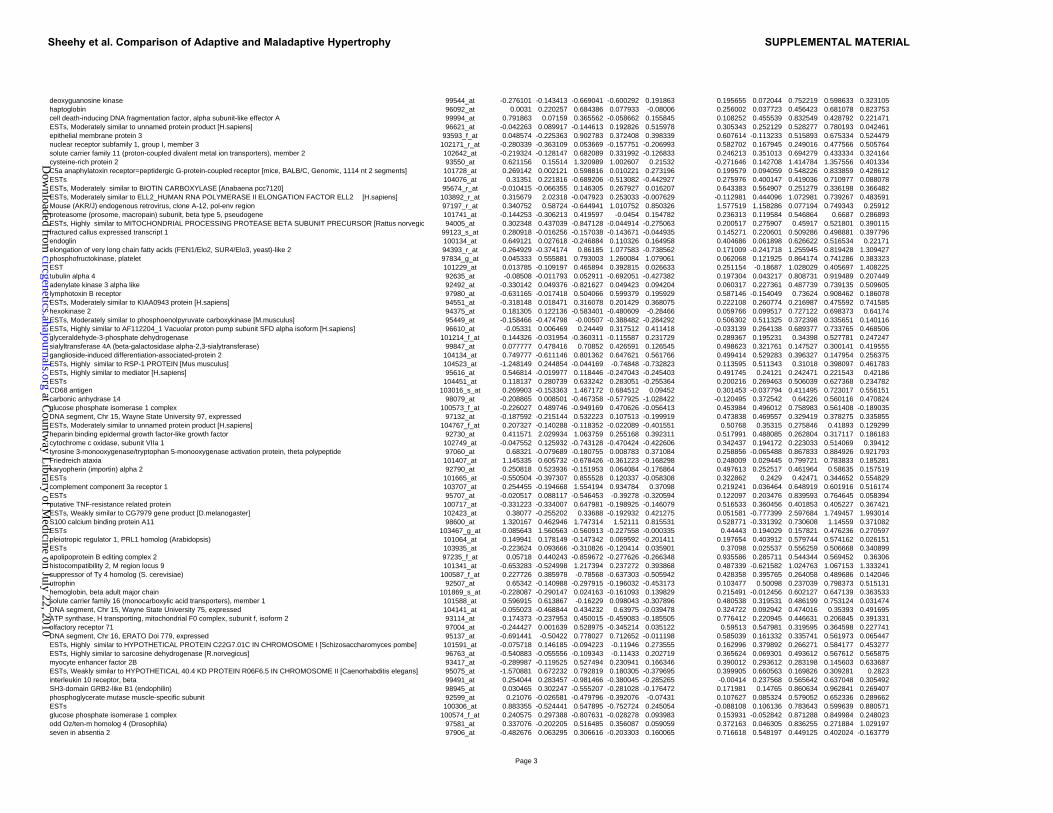
deoxyguanosine kinase 99544_at -0.276101 -0.143413 -0.669041 -0.600292 0.191863 0.195655 0.072044 0.752219 0.598633 0.323105haptoglobin 96092_at 0.0031 0.220257 0.684386 0.077933 -0.08006 0.256002 0.037723 0.456423 0.681078 0.823753cell death-inducing DNA fragmentation factor, alpha subunit-like effector A 99994_at 0.791863 0.07159 0.365562 -0.058662 0.155845 0.108252 0.455539 0.832549 0.428792 0.221471ESTs, Moderately similar to unnamed protein product [H.sapiens] 96621_at -0.042263 0.089917 -0.144613 0.192826 0.515978 0.305343 0.252129 0.528277 0.780193 0.042461epithelial membrane protein 3 93593_f_at 0.048574 -0.225363 0.902783 0.372408 0.398339 0.607614 -0.113233 0.515893 0.675334 0.524479nuclear receptor subfamily 1, group I, member 3 102171_r_at -0.280339 -0.363109 0.053669 -0.157751 -0.206993 0.582702 0.167945 0.249016 0.477566 0.505764solute carrier family 11 (proton-coupled divalent metal ion transporters), member 2 102642_at -0.219324 -0.128147 0.682089 0.331992 -0.126833 0.246213 0.351013 0.694279 0.433334 0.324164cysteine-rich protein 2 93550_at 0.621156 0.15514 1.320989 1.002607 0.21532 -0.271646 0.142708 1.414784 1.357556 0.401334C5a anaphylatoxin receptor=peptidergic G-protein-coupled receptor [mice, BALB/C, Genomic, 1114 nt 2 segments] 101728_at 0.269142 0.002121 0.598816 0.010221 0.273196 0.199579 0.094059 0.548226 0.833859 0.428612ESTs 104076_at 0.31351 0.221816 -0.689206 -0.513082 -0.442927 0.275976 0.400147 0.419036 0.710977 0.088078ESTs, Moderately similar to BIOTIN CARBOXYLASE [Anabaena pcc7120] 95674_r_at -0.010415 -0.066355 0.146305 0.267927 0.016207 0.643383 0.564907 0.251279 0.336198 0.366482
�ESTs, Moderately similar to ELL2_HUMAN RNA POLYMERASE II ELONGATION FACTOR ELL2 [H.sapiens] 103892_r_at 0.315679 2.02318 -0.047923 0.253033 -0.007629 -0.112981 0.444096 1.072981 0.739267 0.483591Mouse (AKR/J) endogenous retrovirus, clone A-12, pol-env region 97197_r_at 0.340752 0.58724 -0.644941 1.010752 0.850326 1.577519 1.158286 0.077194 0.749343 0.25912proteasome (prosome, macropain) subunit, beta type 5, pseudogene 101741_at -0.144253 -0.306213 0.419597 -0.0454 0.154782 0.236313 0.119584 0.546864 0.6687 0.286893ESTs, Highly similar to MITOCHONDRIAL PROCESSING PROTEASE BETA SUBUNIT PRECURSOR [Rattus norvegic 94005_at 0.302348 0.437039 -0.847128 -0.044914 -0.275063 0.200517 0.275907 0.45917 0.521801 0.390115fractured callus expressed transcript 1 99123_s_at 0.280918 -0.016256 -0.157038 -0.143671 -0.044935 0.145271 0.220601 0.509286 0.498881 0.397796endoglin 100134_at 0.649121 0.027618 -0.246884 0.110326 0.164958 0.404686 0.061898 0.626622 0.516534 0.22171elongation of very long chain fatty acids (FEN1/Elo2, SUR4/Elo3, yeast)-like 2 94393_r_at -0.264929 -0.374174 0.86185 1.077583 -0.738562 0.171009 -0.241718 1.255945 0.819428 1.309427phosphofructokinase, platelet 97834_g_at 0.045333 0.555881 0.793003 1.260084 1.079061 0.062068 0.121925 0.864174 0.741286 0.383323EST 101229_at 0.013785 -0.109197 0.465894 0.392815 0.026633 0.251154 -0.18687 1.028029 0.405697 1.408225tubulin alpha 4 92635_at -0.08508 -0.011793 0.052911 -0.692051 -0.427382 0.197304 0.043217 0.808731 0.919489 0.207449adenylate kinase 3 alpha like 92492_at -0.330142 0.049376 -0.821627 0.049423 0.094204 0.060317 0.227361 0.487739 0.739135 0.509605lymphotoxin B receptor 97980_at -0.631165 -0.017418 0.504066 0.599379 0.195929 0.587146 -0.154049 0.73624 0.908462 0.186078ESTs, Moderately similar to KIAA0943 protein [H.sapiens] 94551_at -0.318148 0.018471 0.316078 0.201429 0.368075 0.222108 0.260774 0.216987 0.475592 0.741585hexokinase 2 94375_at 0.181305 0.122136 -0.583401 -0.480609 -0.28466 0.059766 0.099517 0.727122 0.698373 0.64174ESTs, Moderately similar to phosphoenolpyruvate carboxykinase [M.musculus] 95449_at -0.158466 -0.474798 -0.00507 -0.388482 -0.284292 0.506302 0.511325 0.372398 0.335651 0.140116ESTs, Highly similar to AF112204_1 Vacuolar proton pump subunit SFD alpha isoform [H.sapiens] 96610_at -0.05331 0.006469 0.24449 0.317512 0.411418 -0.033139 0.264138 0.689377 0.733765 0.468506glyceraldehyde-3-phosphate dehydrogenase 101214_f_at 0.144326 -0.031954 -0.360311 -0.115587 0.231729 0.289367 0.195231 0.34398 0.527781 0.247247sialyltransferase 4A (beta-galactosidase alpha-2,3-sialytransferase) 99847_at 0.077777 0.478416 0.70852 0.426591 0.126545 0.498623 0.321761 0.147527 0.300141 0.419555ganglioside-induced differentiation-associated-protein 2 104134_at 0.749777 -0.611146 0.801362 0.647621 0.561766 0.499414 0.529283 0.396327 0.147954 0.256375ESTs, Highly similar to RSP-1 PROTEIN [Mus musculus] 104523_at -1.248149 0.244854 -0.044169 -0.74848 -0.732823 0.113595 0.511343 0.31018 0.398097 0.461783ESTs, Highly similar to mediator [H.sapiens] 95616_at 0.546814 -0.019977 0.118446 -0.247043 -0.245403 0.491745 0.24121 0.242471 0.221543 0.42186ESTs 104451_at 0.118137 0.280739 0.633242 0.283051 -0.255364 0.200216 0.269463 0.506039 0.627368 0.234782CD68 antigen 103016_s_at 0.269903 -0.153363 1.467172 0.684512 0.09452 0.301453 -0.037794 0.411495 0.723017 0.556151carbonic anhydrase 14 98079_at -0.208865 0.008501 -0.467358 -0.577925 -1.028422 -0.120495 0.372542 0.64226 0.560116 0.470824glucose phosphate isomerase 1 complex 100573_f_at -0.226027 0.489746 -0.949169 0.470626 -0.056413 0.453984 0.496012 0.758983 0.561408 -0.189035DNA segment, Chr 15, Wayne State University 97, expressed 97132_at -0.187592 -0.215144 0.532223 0.107513 -0.199919 0.473838 0.469557 0.329419 0.378275 0.335855ESTs, Moderately similar to unnamed protein product [H.sapiens] 104767_f_at 0.207327 -0.140288 -0.118352 -0.022089 -0.401551 0.50768 0.35315 0.275846 0.41893 0.129299heparin binding epidermal growth factor-like growth factor 92730_at 0.411571 2.029934 1.063759 0.255168 0.392311 0.517991 0.488085 0.262804 0.317117 0.186183cytochrome c oxidase, subunit VIIa 1 102749_at -0.047552 0.125932 -0.743128 -0.470424 -0.422606 0.342437 0.194172 0.223033 0.514069 0.39412tyrosine 3-monooxygenase/tryptophan 5-monooxygenase activation protein, theta polypeptide 97060_at 0.68321 -0.079689 -0.180755 0.008783 0.371084 0.258856 -0.065488 0.867833 0.884926 0.921793Friedreich ataxia 101407_at 1.145335 0.605732 -0.678426 -0.361223 -0.168298 0.248009 0.029445 0.799721 0.783833 0.185281karyopherin (importin) alpha 2 92790_at 0.250818 0.523936 -0.151953 0.064084 -0.176864 0.497613 0.252517 0.461964 0.58635 0.157519ESTs 101665_at -0.550504 -0.397307 0.855528 0.120337 -0.058308 0.322862 0.2429 0.42471 0.344652 0.554829complement component 3a receptor 1 103707_at 0.254455 -0.194668 1.554194 0.934784 0.37098 0.219241 0.036464 0.648919 0.601916 0.516174ESTs 95707_at -0.020517 0.088117 -0.546453 -0.39278 -0.320594 0.122097 0.203476 0.839593 0.764645 0.058394putative TNF-resistance related protein 100717_at -0.331223 -0.334007 0.647981 -0.198925 -0.146079 0.516533 0.360456 0.401853 0.405227 0.367421ESTs, Weakly similar to CG7979 gene product [D.melanogaster] 102423_at 0.38077 -0.255202 0.33688 -0.192932 0.421275 0.051581 -0.777399 2.597684 1.749457 1.993014S100 calcium binding protein A11 98600_at 1.320167 0.462946 1.747314 1.52111 0.815531 0.528771 -0.331392 0.730608 1.14559 0.371082ESTs 103467_g_at -0.085643 1.560563 -0.560913 -0.227558 -0.000335 0.44443 0.194029 0.157821 0.476236 0.270597pleiotropic regulator 1, PRL1 homolog (Arabidopsis) 101064_at 0.149941 0.178149 -0.147342 0.069592 -0.201411 0.197654 0.403912 0.579744 0.574162 0.026151ESTs 103935_at -0.223624 0.093666 -0.310826 -0.120414 0.035901 0.37098 0.025537 0.556259 0.506668 0.340899apolipoprotein B editing complex 2 97235_f_at 0.05718 0.440243 -0.859672 -0.277626 -0.266348 0.935586 0.285711 0.544344 0.569452 0.36306histocompatibility 2, M region locus 9 101341_at -0.653283 -0.524998 1.217394 0.237272 0.393868 0.487339 -0.621582 1.024763 1.067153 1.333241suppressor of Ty 4 homolog (S. cerevisiae) 100587_f_at 0.227726 0.385978 -0.78568 -0.637303 -0.505942 0.428358 0.395765 0.264058 0.489686 0.142046utrophin 92507_at 0.65342 -0.140988 -0.297915 -0.196032 -0.453173 0.103477 0.50098 0.237039 0.798373 0.515131hemoglobin, beta adult major chain 101869_s_at -0.228087 -0.290147 0.024163 -0.161093 0.139829 0.215491 -0.012456 0.602127 0.647139 0.363533solute carrier family 16 (monocarboxylic acid transporters), member 1 101588_at 0.596915 0.613867 -0.16229 0.098043 -0.307896 0.480538 0.319531 0.486199 0.753124 0.031474DNA segment, Chr 15, Wayne State University 75, expressed 104141_at -0.055023 -0.468844 0.434232 0.63975 -0.039478 0.324722 0.092942 0.474016 0.35393 0.491695ATP synthase, H transporting, mitochondrial F0 complex, subunit f, isoform 2 93114_at 0.174373 -0.237953 0.450015 -0.459083 -0.185505 0.776412 0.220945 0.446631 0.206845 0.391331olfactory receptor 71 97004_at -0.244427 0.001639 0.528975 -0.345214 0.035122 0.59513 0.547981 0.319595 0.364598 0.227741DNA segment, Chr 16, ERATO Doi 779, expressed 95137_at -0.691441 -0.50422 0.778027 0.712652 -0.011198 0.585039 0.161332 0.335741 0.561973 0.065447ESTs, Highly similar to HYPOTHETICAL PROTEIN C22G7.01C IN CHROMOSOME I [Schizosaccharomyces pombe] 101591_at -0.075718 0.146185 -0.094223 -0.11946 0.273555 0.162996 0.379892 0.266271 0.584177 0.453277ESTs, Highly similar to sarcosine dehydrogenase [R.norvegicus] 96763_at -0.540883 -0.055556 -0.109343 -0.11433 0.202719 0.365624 0.069301 0.493612 0.567612 0.565875myocyte enhancer factor 2B 93417_at -0.289987 -0.119525 0.527494 0.230941 0.166346 0.390012 0.293612 0.283198 0.145603 0.633687ESTs, Weakly similar to HYPOTHETICAL 40.4 KD PROTEIN R06F6.5 IN CHROMOSOME II [Caenorhabditis elegans] 95075_at -1.570881 0.672232 0.792819 0.180305 -0.379695 0.399905 0.660563 0.169826 0.309281 0.2823interleukin 10 receptor, beta 99491_at 0.254044 0.283457 -0.981466 -0.380045 -0.285265 -0.00414 0.237568 0.565642 0.637048 0.305492SH3-domain GRB2-like B1 (endophilin) 98945_at 0.030465 0.302247 -0.555207 -0.281028 -0.176472 0.171981 0.14765 0.860634 0.962841 0.269407phosphoglycerate mutase muscle-specific subunit 92599_at 0.21076 -0.026581 -0.479796 -0.392076 -0.07431 0.107627 0.085324 0.579052 0.652336 0.289662ESTs 100306_at 0.883355 -0.524441 0.547895 -0.752724 0.245054 -0.088108 0.106136 0.783643 0.599639 0.880571glucose phosphate isomerase 1 complex 100574_f_at 0.240575 0.297388 -0.807631 -0.028278 0.093983 0.153931 -0.052842 0.871288 0.849984 0.248023odd Oz/ten-m homolog 4 (Drosophila) 97581_at 0.337076 -0.202205 0.516485 0.356087 0.059059 0.372163 0.046305 0.836255 0.271884 1.029197seven in absentia 2 97906_at -0.482676 0.063295 0.306616 -0.203303 0.160065 0.716618 0.548197 0.449125 0.402024 -0.163779
Page 3
Sheehy et al. Comparison of Adaptive and Maladaptive Hypertrophy SUPPLEMENTAL MATERIAL
at Countw
ay Library of M
edicine on July 22, 2010 circgenetics.ahajournals.org
Dow
nloaded from
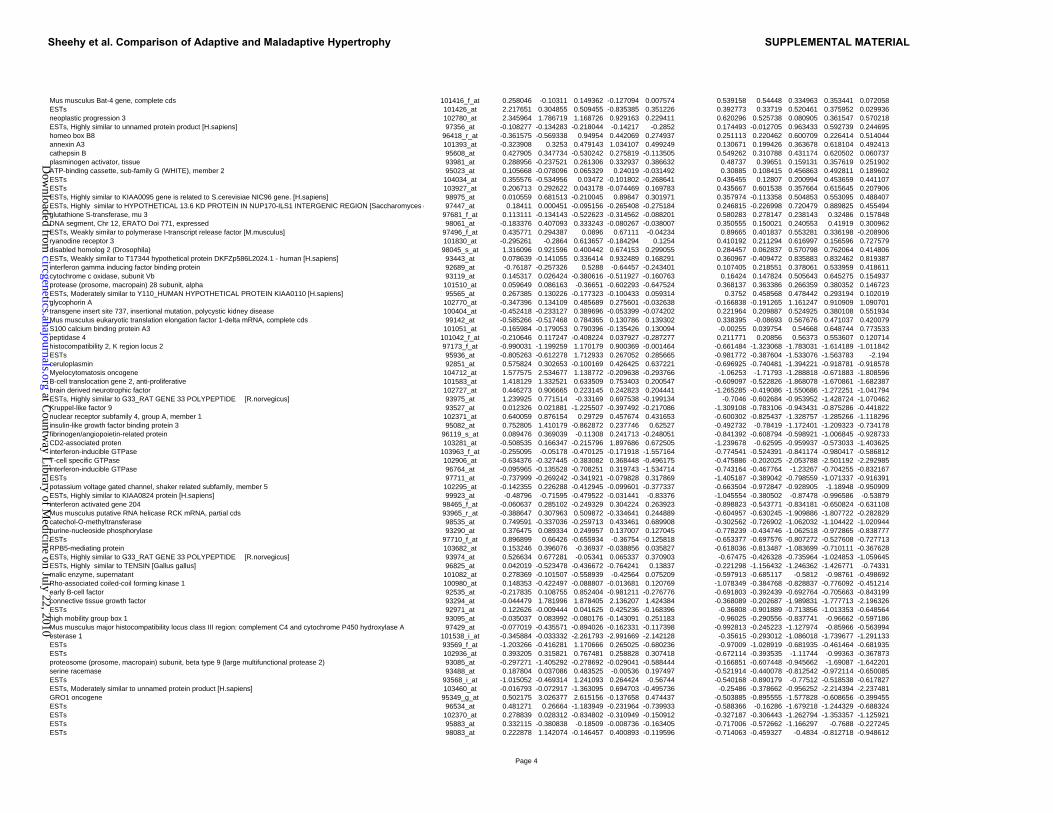
Mus musculus Bat-4 gene, complete cds 101416_f_at 0.258046 -0.10311 0.149362 -0.127094 0.007574 0.539158 0.54448 0.334963 0.353441 0.072058ESTs 101426_at 2.217651 0.304855 0.509455 -0.835385 0.351226 0.392773 0.33719 0.520461 0.375952 0.029936neoplastic progression 3 102780_at 2.345964 1.786719 1.168726 0.929163 0.229411 0.620296 0.525738 0.080905 0.361547 0.570218ESTs, Highly similar to unnamed protein product [H.sapiens] 97356_at -0.108277 -0.134283 -0.218044 -0.14217 -0.2852 0.174493 -0.012705 0.963433 0.592739 0.244695homeo box B8 96418_r_at -0.361575 -0.569338 0.94954 0.442069 0.274937 0.251113 0.220462 0.600709 0.226414 0.514044annexin A3 101393_at -0.323908 0.3253 0.479143 1.034107 0.499249 0.130671 0.199426 0.363678 0.618104 0.492413cathepsin B 95608_at 0.427905 0.347734 -0.530242 0.275819 -0.113505 0.549262 0.310788 0.431174 0.620502 0.060737plasminogen activator, tissue 93981_at 0.288956 -0.237521 0.261306 0.332937 0.386632 0.48737 0.39651 0.159131 0.357619 0.251902ATP-binding cassette, sub-family G (WHITE), member 2 95023_at 0.105668 -0.078096 0.065329 0.24019 -0.031492 0.30885 0.108415 0.456863 0.492811 0.189602ESTs 104034_at 0.355576 -0.534956 0.03472 -0.101802 -0.268641 0.436455 0.12807 0.200994 0.453659 0.441107ESTs 103927_at 0.206713 0.292622 0.043178 -0.074469 0.169783 0.435667 0.601538 0.357664 0.615645 0.207906ESTs, Highly similar to KIAA0095 gene is related to S.cerevisiae NIC96 gene. [H.sapiens] 98975_at 0.010559 0.681513 -0.210045 0.89847 0.301971 0.357974 -0.113358 0.504853 0.553095 0.488407ESTs, Highly similar to HYPOTHETICAL 13.6 KD PROTEIN IN NUP170-ILS1 INTERGENIC REGION [Saccharomyces c 97447_at 0.18411 0.000451 -0.095156 -0.265408 -0.275184 0.246815 -0.226998 0.720479 0.889825 0.455494glutathione S-transferase, mu 3 97681_f_at 0.113111 -0.134143 -0.522623 -0.314562 -0.088201 0.580283 0.278147 0.238143 0.32486 0.157848DNA segment, Chr 12, ERATO Doi 771, expressed 98061_at -0.183376 0.407093 0.333243 -0.080267 -0.038007 0.350555 0.150021 0.240553 0.41919 0.300962ESTs, Weakly similar to polymerase I-transcript release factor [M.musculus] 97496_f_at 0.435771 0.294387 0.0896 0.67111 -0.04234 0.89665 0.401837 0.553281 0.336198 -0.208906ryanodine receptor 3 101830_at -0.295261 -0.2864 0.613657 -0.184294 0.1254 0.410192 0.211294 0.616997 0.156596 0.727579disabled homolog 2 (Drosophila) 98045_s_at 1.316096 0.921596 0.400442 0.674153 0.299055 0.284457 0.062837 0.570798 0.762064 0.414806ESTs, Weakly similar to T17344 hypothetical protein DKFZp586L2024.1 - human [H.sapiens] 93443_at 0.078639 -0.141055 0.336414 0.932489 0.168291 0.360967 -0.409472 0.835883 0.832462 0.819387interferon gamma inducing factor binding protein 92689_at -0.76187 -0.257326 0.5288 -0.64457 -0.243401 0.107405 0.218551 0.378061 0.533959 0.418611cytochrome c oxidase, subunit Vb 93119_at 0.145317 0.026424 -0.380616 -0.511927 -0.160763 0.16424 0.147824 0.505643 0.645275 0.154937protease (prosome, macropain) 28 subunit, alpha 101510_at 0.059649 0.086163 -0.36651 -0.602293 -0.647524 0.368137 0.363386 0.266359 0.380352 0.146723ESTs, Moderately similar to Y110_HUMAN HYPOTHETICAL PROTEIN KIAA0110 [H.sapiens] 95565_at 0.267385 0.130226 -0.177323 -0.100433 0.059314 0.3752 0.458568 0.478442 0.293194 0.102019glycophorin A 102770_at -0.347396 0.134109 0.485689 0.275601 -0.032638 -0.166838 -0.191265 1.161247 0.910909 1.090701transgene insert site 737, insertional mutation, polycystic kidney disease 100404_at -0.452418 -0.233127 0.389696 -0.053399 -0.074202 0.221964 0.209887 0.524925 0.380108 0.551934Mus musculus eukaryotic translation elongation factor 1-delta mRNA, complete cds 99142_at -0.585266 -0.517468 0.784365 0.130786 0.139302 0.338395 -0.08693 0.567676 0.471037 0.420079S100 calcium binding protein A3 101051_at -0.165984 -0.179053 0.790396 -0.135426 0.130094 -0.00255 0.039754 0.54668 0.648744 0.773533peptidase 4 101042_f_at -0.210646 0.117247 -0.408224 0.037927 -0.287277 0.211771 0.20856 0.56373 0.553607 0.120714histocompatibility 2, K region locus 2 97173_f_at -0.990031 -1.199259 1.170179 0.900369 -0.001464 -0.661484 -1.323068 -1.783031 -1.614189 -1.011842ESTs 95936_at -0.805263 -0.612278 1.712933 0.267052 0.285665 -0.981772 -0.387604 -1.533076 -1.563783 -2.194ceruloplasmin 92851_at 0.575824 0.302653 -0.100169 0.426425 0.637221 -0.696925 -0.740481 -1.394221 -0.918781 -0.918578Myelocytomatosis oncogene 104712_at 1.577575 2.534677 1.138772 -0.209638 -0.293766 -1.06253 -1.71793 -1.288818 -0.671883 -1.808596B-cell translocation gene 2, anti-proliferative 101583_at 1.418129 1.332521 0.633509 0.753403 0.200547 -0.609097 -0.522826 -1.868078 -1.670861 -1.682387brain derived neurotrophic factor 102727_at 0.446273 0.906665 0.223145 0.242823 0.204441 -1.265285 -0.419086 -1.550686 -1.272251 -1.041794
�ESTs, Highly similar to G33_RAT GENE 33 POLYPEPTIDE [R.norvegicus] 93975_at 1.239925 0.771514 -0.33169 0.697538 -0.199134 -0.7046 -0.602684 -0.953952 -1.428724 -1.070462Kruppel-like factor 9 93527_at 0.012326 0.021881 -1.225507 -0.397492 -0.217086 -1.309108 -0.783106 -0.943431 -0.875286 -0.441822nuclear receptor subfamily 4, group A, member 1 102371_at 0.640059 0.876154 0.29729 0.457674 0.431653 -0.600302 -0.825437 -1.328757 -1.285266 -1.118296insulin-like growth factor binding protein 3 95082_at 0.752805 1.410179 -0.862872 0.237746 0.62527 -0.492732 -0.78419 -1.172401 -1.209323 -0.734178fibrinogen/angiopoietin-related protein 96119_s_at 0.089476 0.369039 -0.11308 0.241713 -0.248051 -0.841392 -0.608794 -0.598921 -1.006845 -0.928733CD2-associated proten 103281_at -0.508535 0.166347 -0.215796 1.897686 0.672505 -1.239678 -0.62595 -0.959937 -0.573033 -1.403625interferon-inducible GTPase 103963_f_at -0.255095 -0.05178 -0.470125 -0.171918 -1.557164 -0.774541 -0.524391 -0.841174 -0.980417 -0.586812T-cell specific GTPase 102906_at -0.634376 -0.327445 -0.383082 0.368448 -0.496175 -0.475886 -0.202025 -2.053788 -2.501192 -2.292985interferon-inducible GTPase 96764_at -0.095965 -0.135528 -0.708251 0.319743 -1.534714 -0.743164 -0.467764 -1.23267 -0.704255 -0.832167ESTs 97711_at -0.737999 -0.269242 -0.341921 -0.079828 0.317869 -1.405187 -0.389042 -0.798559 -1.071337 -0.916391potassium voltage gated channel, shaker related subfamily, member 5 102295_at -0.142355 0.226288 -0.412945 -0.099601 -0.377337 -0.663504 -0.972847 -0.928905 -1.18948 -0.950909ESTs, Highly similar to KIAA0824 protein [H.sapiens] 99923_at -0.48796 -0.71595 -0.479522 -0.031441 -0.83376 -1.045554 -0.380502 -0.87478 -0.996586 -0.53879interferon activated gene 204 98465_f_at -0.060637 0.285102 -0.249329 0.304224 0.263923 -0.898823 -0.543771 -0.834181 -0.650824 -0.631108Mus musculus putative RNA helicase RCK mRNA, partial cds 93965_r_at -0.388647 0.307963 0.509872 -0.334641 0.244889 -0.604957 -0.630245 -1.909886 -1.807722 -0.282829catechol-O-methyltransferase 98535_at 0.749591 -0.337036 -0.259713 0.433461 0.689908 -0.302562 -0.726902 -1.062032 -1.104422 -1.020944purine-nucleoside phosphorylase 93290_at 0.376475 0.089334 0.249957 0.137007 0.127045 -0.778239 -0.434746 -1.062518 -0.972865 -0.838777ESTs 97710_f_at 0.896899 0.66426 -0.655934 -0.36754 -0.125818 -0.653377 -0.697576 -0.807272 -0.527608 -0.727713RPB5-mediating protein 103682_at 0.153246 0.396076 -0.36937 -0.038856 0.035827 -0.618036 -0.813487 -1.083699 -0.710111 -0.367628
�ESTs, Highly similar to G33_RAT GENE 33 POLYPEPTIDE [R.norvegicus] 93974_at 0.526634 0.677281 -0.05341 0.065337 0.370903 -0.67475 -0.426328 -0.735964 -1.024853 -1.059645ESTs, Highly similar to TENSIN [Gallus gallus] 96825_at 0.042019 -0.523478 -0.436672 -0.764241 0.13837 -0.221298 -1.156432 -1.246362 -1.426771 -0.74331malic enzyme, supernatant 101082_at 0.278369 -0.101507 -0.558939 -0.42564 0.075209 -0.597913 -0.685117 -0.5812 -0.98761 -0.498692Rho-associated coiled-coil forming kinase 1 100980_at 0.148353 -0.422497 -0.088807 -0.013681 0.120769 -1.078349 -0.384768 -0.828837 -0.776092 -0.451214early B-cell factor 92535_at -0.217835 0.108755 0.852404 -0.981211 -0.276776 -0.691803 -0.392439 -0.692764 -0.705663 -0.843199connective tissue growth factor 93294_at -0.044479 1.781996 1.878405 2.136207 1.424384 -0.368089 -0.202687 -1.989831 -1.777713 -2.196326ESTs 92971_at 0.122626 -0.009444 0.041625 0.425236 -0.168396 -0.36808 -0.901889 -0.713856 -1.013353 -0.648564high mobility group box 1 93095_at -0.035037 0.083992 -0.080176 -0.143091 0.251183 -0.96025 -0.290556 -0.837741 -0.96662 -0.597186Mus musculus major histocompatibility locus class III region: complement C4 and cytochrome P450 hydroxylase A 97429_at -0.077019 -0.435571 -0.894026 -0.162331 -0.117398 -0.992813 -0.245223 -1.127974 -0.85966 -0.563994esterase 1 101538_i_at -0.345884 -0.033332 -2.261793 -2.991669 -2.142128 -0.35615 -0.293012 -1.086018 -1.739677 -1.291133ESTs 93569_f_at -1.203266 -0.416281 1.170666 0.265025 -0.680236 -0.97009 -1.028919 -0.681935 -0.461464 -0.681935ESTs 102936_at 0.393205 0.315821 0.767481 0.258828 0.307418 -0.672114 -0.393535 -1.11744 -0.99363 -0.367873proteosome (prosome, macropain) subunit, beta type 9 (large multifunctional protease 2) 93085_at -0.297271 -1.405292 -0.278692 -0.029041 -0.588444 -0.166851 -0.607448 -0.945662 -1.69087 -1.642201serine racemase 93488_at 0.187804 0.037086 0.483525 -0.00536 0.197497 -0.521914 -0.440078 -0.812542 -0.972114 -0.650085ESTs 93568_i_at -1.015052 -0.469314 1.241093 0.264424 -0.56744 -0.540168 -0.890179 -0.77512 -0.518538 -0.617827ESTs, Moderately similar to unnamed protein product [H.sapiens] 103460_at -0.016793 -0.072917 -1.363095 0.694703 -0.495736 -0.25486 -0.378662 -0.956252 -2.214394 -2.237481GRO1 oncogene 95349_g_at 0.502175 3.026377 2.615156 -0.137658 0.474437 -0.503885 -0.895555 -1.577828 -0.608656 -0.399455ESTs 96534_at 0.481271 0.26664 -1.183949 -0.231964 -0.739933 -0.588366 -0.16286 -1.679218 -1.244329 -0.688324ESTs 102370_at 0.278839 0.028312 -0.834802 -0.310949 -0.150912 -0.327187 -0.306443 -1.262794 -1.353357 -1.125921ESTs 95883_at 0.332115 -0.380838 -0.18509 -0.008736 -0.163405 -0.717006 -0.572662 -1.166297 -0.7688 -0.227245ESTs 98083_at 0.222878 1.142074 -0.146457 0.400893 -0.119596 -0.714063 -0.459327 -0.4834 -0.812718 -0.948612
Page 4
Sheehy et al. Comparison of Adaptive and Maladaptive Hypertrophy SUPPLEMENTAL MATERIAL
at Countw
ay Library of M
edicine on July 22, 2010 circgenetics.ahajournals.org
Dow
nloaded from
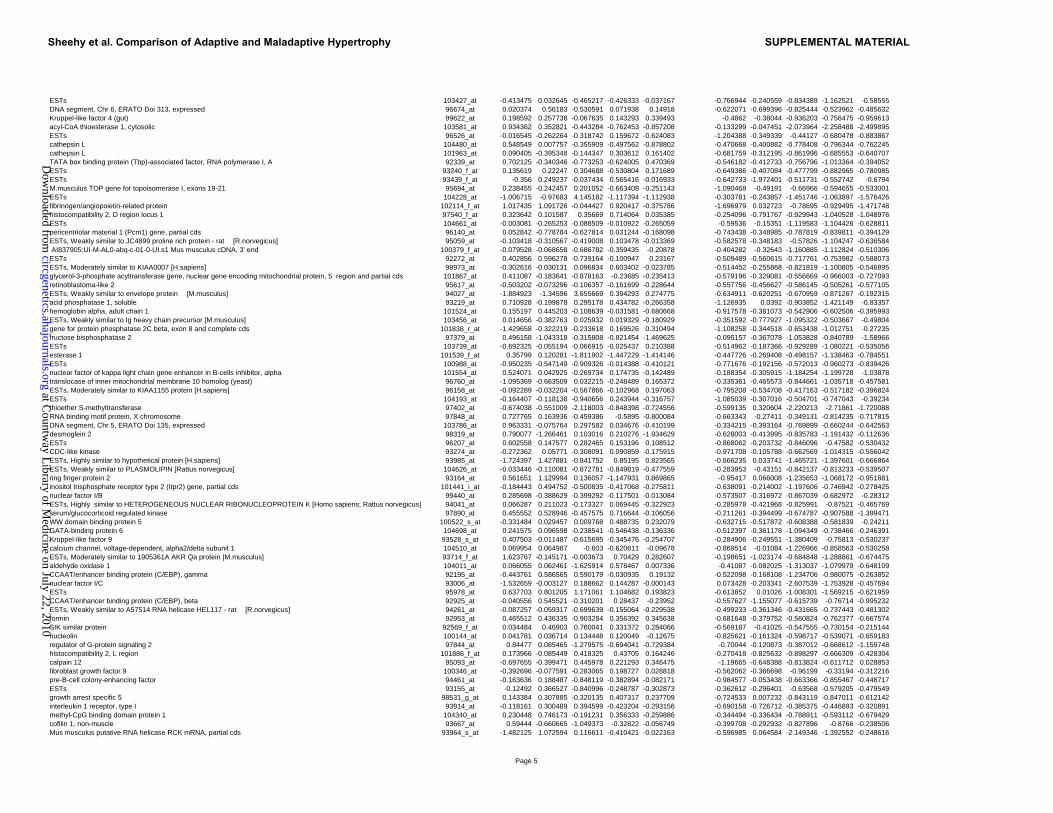
ESTs 103427_at -0.413475 0.032645 -0.465217 -0.426333 -0.037167 -0.766944 -0.240559 -0.834389 -1.162521 -0.58555DNA segment, Chr 6, ERATO Doi 313, expressed 96674_at 0.020374 0.56183 -0.530591 0.071938 0.14918 -0.622071 -0.699396 -0.825444 -0.523962 -0.485632Kruppel-like factor 4 (gut) 99622_at 0.198592 0.257738 -0.067635 0.143293 0.339493 -0.4862 -0.38044 -0.936203 -0.756475 -0.959613acyl-CoA thioesterase 1, cytosolic 103581_at 0.934362 0.352821 -0.443284 -0.762453 -0.857208 -0.133299 -0.047451 -2.073964 -2.258488 -2.499895ESTs 96526_at -0.016545 -0.262264 -0.318742 0.159672 -0.624083 -1.204388 -0.349339 -0.44127 -0.680478 -0.883867cathepsin L 104480_at 0.548549 0.007757 -0.355909 -0.497562 -0.878802 -0.470668 -0.400882 -0.778408 -0.796344 -0.762245cathepsin L 101963_at 0.090405 -0.395348 -0.144347 0.303612 0.161402 -0.681759 -0.312195 -0.861996 -0.685553 -0.640707TATA box binding protein (Tbp)-associated factor, RNA polymerase I, A 92339_at 0.702125 -0.340346 -0.773253 -0.624005 0.470369 -0.546182 -0.412733 -0.756796 -1.013364 -0.394052ESTs 93240_f_at 0.135619 0.22247 0.304688 -0.530804 0.171689 -0.649386 -0.407084 -0.477799 -0.882965 -0.780985ESTs 93439_f_at -0.356 0.249237 -0.037434 0.565416 -0.016933 -0.642733 -1.972401 -0.511731 -0.552742 -0.6794M.musculus TOP gene for topoisomerase I, exons 19-21 95694_at 0.238455 -0.242457 0.201052 -0.663408 -0.251143 -1.090468 -0.49191 -0.66966 -0.594655 -0.533001ESTs 104228_at -1.006715 -0.97683 4.145182 -1.117394 -1.112938 -0.303781 -0.243857 -1.451746 -1.063897 -1.576426fibrinogen/angiopoietin-related protein 102114_f_at 1.017435 1.091726 -0.044427 0.920417 -0.375786 -1.696979 0.032723 -0.78695 -0.929495 -1.471748histocompatibility 2, D region locus 1 97540_f_at 0.323642 0.101587 0.35669 0.714064 0.035385 -0.254096 -0.791767 -0.929943 -1.040528 -1.048976ESTs 104661_at -0.003081 -0.265253 -0.088509 -0.010922 -0.265059 -0.59536 -0.15351 -1.119583 -1.104426 -0.628811pericentriolar material 1 (Pcm1) gene, partial cds 96140_at 0.052842 -0.778784 -0.627814 0.031244 -0.168098 -0.743438 -0.348985 -0.787819 -0.839811 -0.394129
�ESTs, Weakly similar to JC4899 proline rich protein - rat [R.norvegicus] 95059_at -0.103418 -0.310567 -0.419008 0.103478 -0.013369 -0.582578 -0.348183 -0.57826 -1.104247 -0.636584 AI837905:UI-M-AL0-abq-c-01-0-UI.s1 Mus musculus cDNA, 3' end 100379_f_at -0.079528 -0.068658 -0.686782 -0.359435 -0.20878 -0.404282 -0.32643 -1.160885 -1.112824 -0.510306ESTs 92272_at 0.402856 0.596278 -0.739164 -0.100947 0.23167 -0.509489 -0.560615 -0.717761 -0.753982 -0.588073ESTs, Moderately similar to KIAA0007 [H.sapiens] 98973_at -0.302616 -0.030131 0.096834 0.603402 -0.023785 -0.514452 -0.255868 -0.821819 -1.100805 -0.546895glycerol-3-phosphate acyltransferase gene, nuclear gene encoding mitochondrial protein, 5 region and partial cds 101867_at 0.411087 -0.183641 -0.878163 -0.23685 -0.235413 -0.579196 -0.329081 -0.556669 -0.966003 -0.727093retinoblastoma-like 2 95617_at -0.503202 -0.073296 -0.106357 -0.161699 -0.228644 -0.557756 -0.456627 -0.586145 -0.505261 -0.577105
�ESTs, Weakly similar to envelope protein [M.musculus] 94027_at -1.884923 -1.34596 3.655669 0.394293 0.274775 -0.634911 -0.620251 -0.670959 -0.871267 -0.192315acid phosphatase 1, soluble 93219_at 0.710928 -0.199878 0.295178 0.434782 -0.266358 -1.126935 0.0392 -0.903852 -1.421149 -0.83357hemoglobin alpha, adult chain 1 101524_at 0.155197 0.445203 -0.108639 -0.031581 -0.680668 -0.917578 -0.381073 -0.542906 -0.602506 -0.395993ESTs, Weakly similar to Ig heavy chain precursor [M.musculus] 103456_at 0.014656 -0.382763 0.025932 0.019329 -0.180929 -0.351592 -0.777927 -1.095322 -0.503667 -0.49804gene for protein phosphatase 2C beta, exon 8 and complete cds 101838_r_at -1.429658 -0.322219 -0.233618 0.169526 0.310494 -1.108258 -0.344518 -0.653438 -1.012751 -0.27235fructose bisphosphatase 2 97379_at 0.496158 -1.043318 -0.315808 -0.821454 -1.469625 -0.095157 -0.367078 -1.053828 -0.840789 -1.58966ESTs 103739_at -0.692325 -0.055194 -0.066915 -0.025437 0.210388 -0.514962 -0.187366 -0.929289 -1.080221 -0.535056esterase 1 101539_f_at 0.35799 0.120281 -1.811902 -1.447229 -1.414146 -0.447726 -0.269408 -0.498157 -1.138463 -0.784551ESTs 100988_at -0.950235 -0.547149 -0.909326 -0.014388 -0.410121 -0.771676 -0.192156 -0.572013 -0.960273 -0.839426nuclear factor of kappa light chain gene enhancer in B-cells inhibitor, alpha 101554_at 0.524071 0.042925 -0.269734 0.174735 -0.142489 -0.188354 -0.305915 -1.184254 -1.199728 -1.03878translocase of inner mitochondrial membrane 10 homolog (yeast) 96760_at -1.095369 -0.663509 0.032215 -0.248489 0.165372 -0.335361 -0.465573 -0.844661 -1.035718 -0.457581ESTs, Moderately similar to KIAA1155 protein [H.sapiens] 96158_at -0.092289 -0.032204 -0.567866 -0.102968 0.197063 -0.795208 -0.534708 -0.417163 -0.517182 -0.396824ESTs 104193_at -0.164407 -0.118138 -0.940656 0.243944 -0.316757 -1.085039 -0.307016 -0.504701 -0.747043 -0.39234thioether S-methyltransferase 97402_at -0.674038 -0.551009 -2.118003 -0.848398 -0.724556 -0.599135 0.320604 -2.220213 -2.71861 -1.720088RNA binding motif protein, X chromosome 97848_at 0.727765 0.163936 -0.459386 -0.5895 -0.800084 -0.663343 -0.27411 -0.349131 -0.814235 -0.717815DNA segment, Chr 5, ERATO Doi 135, expressed 103786_at 0.963331 -0.075764 0.297582 0.034676 -0.410199 -0.334215 -0.393164 -0.769899 -0.660244 -0.642563desmoglein 2 98319_at 0.790077 -1.266461 0.103016 0.210276 -1.934629 -0.628003 -0.413995 -0.835783 -1.191432 -0.112636ESTs 96207_at 0.602558 0.147577 0.282465 0.153196 0.108512 -0.868062 -0.203732 -0.846096 -0.47582 -0.530432CDC-like kinase 93274_at -0.272362 0.05771 -0.308091 0.090859 -0.175915 -0.971708 -0.105788 -0.662569 -1.014315 -0.556042ESTs, Highly similar to hypothetical protein [H.sapiens] 93985_at -1.724397 1.427881 -0.841752 0.85195 0.823565 -0.666235 0.033741 -1.465721 -1.397601 -0.666864ESTs, Weakly similar to PLASMOLIPIN [Rattus norvegicus] 104626_at -0.033446 -0.110081 -0.872781 -0.849819 -0.477559 -0.283953 -0.43151 -0.842137 -0.813233 -0.539507ring finger protein 2 93164_at 0.561651 1.129994 0.136057 -1.147931 0.869865 -0.95417 0.066008 -1.235653 -1.068172 -0.951881inositol trisphosphate receptor type 2 (Itpr2) gene, partial cds 101441_i_at -0.184443 0.494752 -0.500835 -0.417068 -0.275811 -0.638091 -0.214002 -1.197606 -0.746942 -0.278425nuclear factor I/B 99440_at 0.285698 -0.388629 -0.399292 -0.117501 -0.013084 -0.573507 -0.316972 -0.867039 -0.682972 -0.28312ESTs, Highly similar to HETEROGENEOUS NUCLEAR RIBONUCLEOPROTEIN K [Homo sapiens; Rattus norvegicus] 94041_at 0.066287 0.211023 -0.173327 0.069445 -0.322923 -0.285978 -0.421968 -0.825991 -0.87521 -0.465769serum/glucocorticoid regulated kinase 97890_at 0.455552 0.528946 -0.457575 0.716644 -0.106056 -0.211261 -0.394499 -0.674787 -0.907588 -1.399471WW domain binding protein 5 100522_s_at -0.331484 0.029457 0.009768 0.488735 0.232079 -0.632715 -0.517872 -0.608388 -0.581839 -0.24211GATA-binding protein 6 104698_at 0.241575 0.096598 -0.238541 -0.546438 -0.136336 -0.512397 -0.361178 -1.094349 -0.738466 -0.246391Kruppel-like factor 9 93528_s_at 0.407503 -0.011487 -0.615695 -0.345476 -0.254707 -0.284906 -0.249551 -1.380409 -0.75813 -0.530237calcium channel, voltage-dependent, alpha2/delta subunit 1 104510_at 0.069954 0.064987 -0.603 -0.620611 -0.09678 -0.869514 -0.01084 -1.226966 -0.858563 -0.530258ESTs, Moderately similar to 1905361A AKR Qa protein [M.musculus] 93714_f_at 1.623767 -0.145171 -0.003673 0.70429 0.282607 -0.198651 -1.023174 -0.684848 -1.288861 -0.674475aldehyde oxidase 1 104011_at 0.066055 0.062461 -1.625914 0.578467 0.007336 -0.41087 -0.082025 -1.313037 -1.079979 -0.648109CCAAT/enhancer binding protein (C/EBP), gamma 92195_at -0.443761 0.586565 0.590179 -0.030935 0.19132 -0.522098 -0.168108 -1.234706 -0.980075 -0.263852nuclear factor I/C 93006_at -1.532659 -0.003127 0.188662 0.144287 -0.000143 0.073428 -0.203341 -2.607539 -1.753928 -0.457694ESTs 95978_at 0.637703 0.801205 1.171061 1.104682 0.193823 -0.613852 0.01026 -1.008301 -1.569215 -0.621959CCAAT/enhancer binding protein (C/EBP), beta 92925_at -0.040556 0.545521 -0.310201 0.28437 -0.23952 -0.557627 -1.155077 -0.615739 -0.76714 -0.995232
�ESTs, Weakly similar to A57514 RNA helicase HEL117 - rat [R.norvegicus] 94261_at -0.087257 -0.059317 -0.699639 -0.155064 -0.229538 -0.499233 -0.361346 -0.431665 -0.737443 -0.481302formin 92953_at 0.465512 0.436335 -0.903284 0.356392 0.345638 -0.681648 -0.379752 -0.560824 -0.762377 -0.667574SIK similar protein 92569_f_at 0.034484 0.46903 0.760041 0.331372 0.284066 -0.569187 -0.41025 -0.547555 -0.730154 -0.215144nucleolin 100144_at 0.041781 0.036714 0.134448 0.120049 -0.12675 -0.825621 -0.161324 -0.598717 -0.539071 -0.659183regulator of G-protein signaling 2 97844_at 0.84477 0.085465 -1.279575 -0.694041 -0.729384 -0.70044 -0.120873 -0.387012 -0.668612 -1.159748histocompatibility 2, L region 101886_f_at 0.173966 -0.085449 0.418325 0.43705 0.164246 -0.270418 -0.825632 -0.898297 -0.666309 -0.428304calpain 12 95093_at -0.697655 -0.399471 0.445978 0.221293 0.346475 -1.19665 -0.648388 -0.813824 -0.611712 0.028853fibroblast growth factor 9 100346_at -0.392696 -0.077591 -0.283065 0.198727 0.028818 -0.562062 -0.366698 -0.96199 -0.33194 -0.312216pre-B-cell colony-enhancing factor 94461_at -0.163636 0.188487 -0.848119 -0.382894 -0.082171 -0.984577 -0.053438 -0.663366 -0.855467 -0.448717ESTs 93155_at -0.12492 0.366527 -0.840996 -0.248787 -0.302873 -0.362612 -0.296401 -0.63568 -0.579205 -0.479549growth arrest specific 5 98531_g_at 0.143384 0.307885 -0.320135 0.407317 0.237709 -0.724533 0.007232 -0.843119 -0.847011 -0.612142interleukin 1 receptor, type I 93914_at -0.118161 0.300489 0.394599 -0.423204 -0.293156 -0.690158 -0.726712 -0.385375 -0.446893 -0.320891methyl-CpG binding domain protein 1 104340_at 0.230448 0.746173 -0.191231 0.356333 -0.259886 -0.344494 -0.336434 -0.788911 -0.593112 -0.679429cofilin 1, non-muscle 93667_at 0.59444 -0.660665 -1.049373 -0.32822 -0.056749 -0.399708 -0.292932 -0.827896 -0.8766 -0.238506Mus musculus putative RNA helicase RCK mRNA, partial cds 93964_s_at -1.482125 1.072594 0.116611 -0.410421 -0.022163 -0.596985 0.064584 -2.149346 -1.392552 -0.248616
Page 5
Sheehy et al. Comparison of Adaptive and Maladaptive Hypertrophy SUPPLEMENTAL MATERIAL
at Countw
ay Library of M
edicine on July 22, 2010 circgenetics.ahajournals.org
Dow
nloaded from
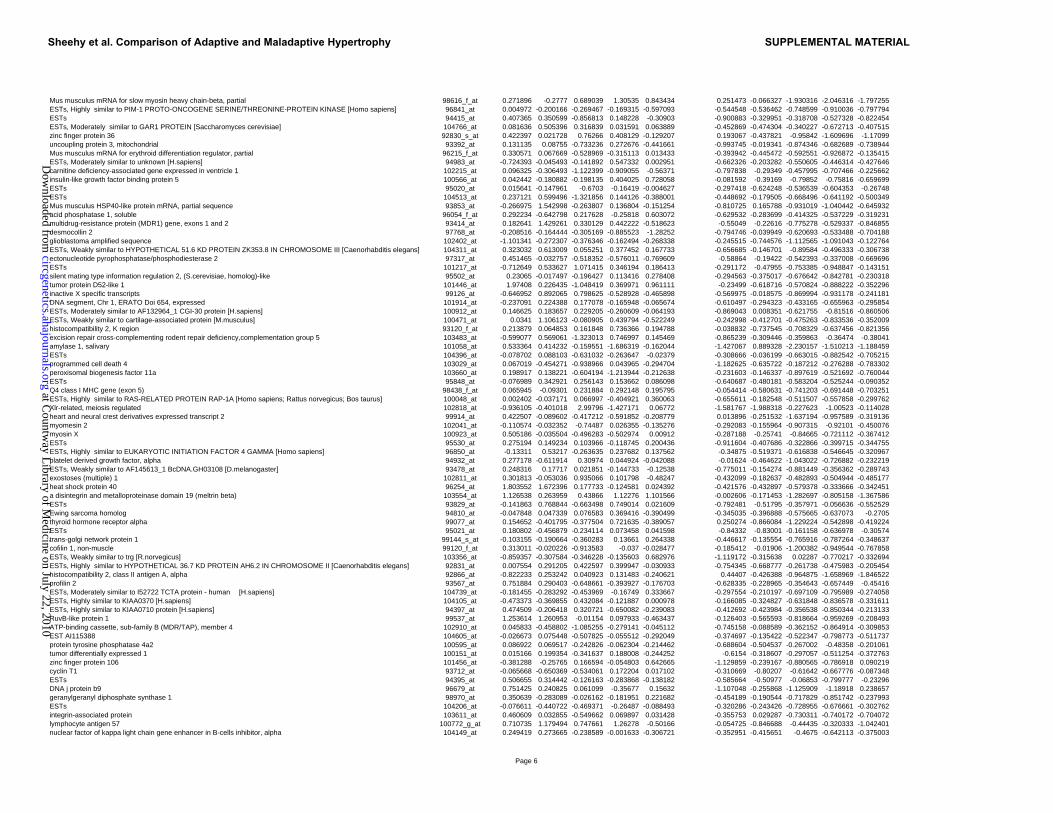
Mus musculus mRNA for slow myosin heavy chain-beta, partial 98616_f_at 0.271896 -0.2777 0.689039 1.30535 0.843434 0.251473 -0.066327 -1.930316 -2.046316 -1.797255ESTs, Highly similar to PIM-1 PROTO-ONCOGENE SERINE/THREONINE-PROTEIN KINASE [Homo sapiens] 96841_at 0.004972 -0.200166 -0.269467 -0.169315 -0.597093 -0.544548 -0.536462 -0.748599 -0.910036 -0.797794ESTs 94415_at 0.407365 0.350599 -0.856813 0.148228 -0.30903 -0.900883 -0.329951 -0.318708 -0.527328 -0.822454ESTs, Moderately similar to GAR1 PROTEIN [Saccharomyces cerevisiae] 104766_at 0.081636 0.505396 0.316839 0.031591 0.063889 -0.452869 -0.474304 -0.340227 -0.672713 -0.407515zinc finger protein 36 92830_s_at 0.422397 0.021728 0.76266 0.408129 -0.129207 0.193067 -0.437821 -0.95842 -1.609696 -1.17099uncoupling protein 3, mitochondrial 93392_at 0.131135 0.08755 -0.733236 0.272676 -0.441661 -0.993745 -0.019341 -0.874346 -0.682689 -0.738944Mus musculus mRNA for erythroid differentiation regulator, partial 96215_f_at 0.330571 0.067669 -0.528969 -0.315113 0.013433 -0.393942 -0.445472 -0.592551 -0.926872 -0.135415ESTs, Moderately similar to unknown [H.sapiens] 94983_at -0.724393 -0.045493 -0.141892 0.547332 0.002951 -0.662326 -0.203282 -0.550605 -0.446314 -0.427646carnitine deficiency-associated gene expressed in ventricle 1 102215_at 0.096325 -0.306493 -1.122399 -0.909055 -0.56371 -0.797838 -0.29349 -0.457995 -0.707466 -0.225662insulin-like growth factor binding protein 5 100566_at 0.042442 -0.180882 -0.198135 0.404025 0.728058 -0.081592 -0.39169 -0.79852 -0.75816 -0.659699ESTs 95020_at 0.015641 -0.147961 -0.6703 -0.16419 -0.004627 -0.297418 -0.624248 -0.536539 -0.604353 -0.26748ESTs 104513_at 0.237121 0.599496 -1.321856 0.144126 -0.388001 -0.448692 -0.179505 -0.668496 -0.641192 -0.500349Mus musculus HSP40-like protein mRNA, partial sequence 93853_at -0.266975 1.542998 -0.263807 0.136804 -0.151254 -0.810725 0.165788 -0.931019 -1.040442 -0.645932acid phosphatase 1, soluble 96054_f_at 0.292234 -0.642798 0.217628 -0.25818 0.603072 -0.629532 -0.283699 -0.414325 -0.537229 -0.319231multidrug-resistance protein (MDR1) gene, exons 1 and 2 93414_at 0.182641 1.429261 0.330129 0.442222 -0.518623 -0.55049 -0.22616 -0.775278 -0.529337 -0.846855desmocollin 2 97768_at -0.208516 -0.164444 -0.305169 -0.885523 -1.28252 -0.794746 -0.039949 -0.620693 -0.533488 -0.704188glioblastoma amplified sequence 102402_at -1.101341 -0.272307 -0.376346 -0.162494 -0.268338 -0.245515 -0.744576 -1.112565 -1.091043 -0.122764ESTs, Weakly similar to HYPOTHETICAL 51.6 KD PROTEIN ZK353.8 IN CHROMOSOME III [Caenorhabditis elegans] 104311_at 0.323032 0.613009 0.055251 0.377452 0.167733 -0.656685 -0.146701 -0.89584 -0.496333 -0.306738ectonucleotide pyrophosphatase/phosphodiesterase 2 97317_at 0.451465 -0.032757 -0.518352 -0.576011 -0.769609 -0.58864 -0.19422 -0.542393 -0.337008 -0.669696ESTs 101217_at -0.712649 0.533627 1.071415 0.346194 0.186413 -0.291172 -0.47955 -0.753385 -0.948847 -0.143151silent mating type information regulation 2, (S.cerevisiae, homolog)-like 95502_at 0.23065 -0.017497 -0.196427 0.113416 0.278408 -0.294563 -0.375017 -0.676642 -0.842781 -0.230318tumor protein D52-like 1 101446_at 1.97408 0.226435 -1.048419 0.369971 0.961111 -0.23499 -0.618716 -0.570824 -0.888222 -0.352296inactive X specific transcripts 99126_at -0.646952 0.892065 0.798625 -0.528928 -0.465898 -0.569975 -0.018575 -0.869994 -0.931178 -0.241181DNA segment, Chr 1, ERATO Doi 654, expressed 101914_at -0.237091 0.224388 0.177078 -0.165948 -0.065674 -0.610497 -0.294323 -0.433165 -0.655963 -0.295854ESTs, Moderately similar to AF132964_1 CGI-30 protein [H.sapiens] 100912_at 0.146625 0.183657 0.229205 -0.260609 -0.064193 -0.869043 0.008351 -0.621755 -0.81516 -0.860506ESTs, Weakly similar to cartilage-associated protein [M.musculus] 100471_at 0.0341 1.106123 -0.080905 0.439794 -0.522249 -0.242998 -0.412701 -0.475263 -0.833536 -0.352009histocompatibility 2, K region 93120_f_at 0.213879 0.064853 0.161848 0.736366 0.194788 -0.038832 -0.737545 -0.708329 -0.637456 -0.821356excision repair cross-complementing rodent repair deficiency,complementation group 5 103483_at -0.599077 0.569061 -1.323013 0.746997 0.145469 -0.865239 -0.309446 -0.359863 -0.36474 -0.38041amylase 1, salivary 101058_at 0.533364 0.414232 -0.159551 -1.686319 -0.162044 -1.427067 0.889328 -2.230157 -1.510213 -1.188459ESTs 104396_at -0.078702 0.088103 -0.631032 -0.263647 -0.02379 -0.308666 -0.036199 -0.663015 -0.882542 -0.705215programmed cell death 4 103029_at 0.067019 -0.454271 -0.938966 0.043965 -0.294704 -1.182625 -0.635722 -0.187212 -0.276288 -0.783302peroxisomal biogenesis factor 11a 103660_at 0.198917 0.138221 -0.604194 -1.213944 -0.212638 -0.231603 -0.146337 -0.897619 -0.521692 -0.760044ESTs 95848_at -0.076989 0.342921 0.256143 0.153662 0.086098 -0.640687 -0.480181 -0.583204 -0.525244 -0.090352Q4 class I MHC gene (exon 5) 98438_f_at 0.065945 -0.09301 0.231884 0.292148 0.195795 -0.054414 -0.580631 -0.741203 -0.691448 -0.703251ESTs, Highly similar to RAS-RELATED PROTEIN RAP-1A [Homo sapiens; Rattus norvegicus; Bos taurus] 100048_at 0.002402 -0.037171 0.066997 -0.404921 0.360063 -0.655611 -0.182548 -0.511507 -0.557858 -0.299762Xlr-related, meiosis regulated 102818_at -0.936105 -0.401018 2.99796 -1.427171 0.06772 -1.581767 -1.988318 -0.227623 -1.00523 -0.114028heart and neural crest derivatives expressed transcript 2 99914_at 0.422507 -0.089602 -0.417212 -0.591852 -0.208779 0.013896 -0.251532 -1.637194 -0.957589 -0.319136myomesin 2 102041_at -0.110574 -0.032352 -0.74487 0.026355 -0.135276 -0.292083 -0.155964 -0.907315 -0.92101 -0.450076myosin X 100923_at 0.505186 -0.035504 -0.496283 -0.502974 0.00912 -0.287188 -0.25741 -0.84665 -0.721112 -0.367412ESTs 95530_at 0.275194 0.149234 0.103966 -0.118745 0.200436 -0.911604 -0.407686 -0.322866 -0.399715 -0.344755ESTs, Highly similar to EUKARYOTIC INITIATION FACTOR 4 GAMMA [Homo sapiens] 96850_at -0.13311 0.53217 -0.263635 0.237682 0.137562 -0.34875 -0.519371 -0.616838 -0.546645 -0.320967platelet derived growth factor, alpha 94932_at 0.277178 -0.611914 0.30974 0.044924 -0.042088 -0.01624 -0.464622 -1.043022 -0.726882 -0.232219ESTs, Weakly similar to AF145613_1 BcDNA.GH03108 [D.melanogaster] 93478_at 0.248316 0.17717 0.021851 -0.144733 -0.12538 -0.775011 -0.154274 -0.881449 -0.356362 -0.289743exostoses (multiple) 1 102811_at 0.301813 -0.053036 0.935066 0.101798 -0.48247 -0.432099 -0.182637 -0.482893 -0.504944 -0.485177heat shock protein 40 96254_at 1.803552 1.672396 0.177733 -0.124581 0.024392 -0.421576 -0.432897 -0.579378 -0.333666 -0.342451a disintegrin and metalloproteinase domain 19 (meltrin beta) 103554_at 1.126538 0.263959 0.43866 1.12276 1.101566 -0.002606 -0.171453 -1.282697 -0.805158 -1.367586ESTs 93829_at -0.141863 0.768844 -0.663498 0.749014 0.021609 -0.792481 -0.51795 -0.357971 -0.056636 -0.552529Ewing sarcoma homolog 94810_at -0.047848 0.047339 0.076583 0.369416 -0.390499 -0.345035 -0.396888 -0.575665 -0.637073 -0.2705thyroid hormone receptor alpha 99077_at 0.154652 -0.401795 -0.377504 0.721635 -0.389057 0.250274 -0.866084 -1.229224 -0.542898 -0.419224ESTs 95021_at 0.180802 -0.456879 -0.234114 0.073458 0.041598 -0.84332 -0.83001 -0.161158 -0.636978 -0.30574trans-golgi network protein 1 99144_s_at -0.103155 -0.190664 -0.360283 0.13661 0.264338 -0.446617 -0.135554 -0.765916 -0.787264 -0.348637cofilin 1, non-muscle 99120_f_at 0.313011 -0.020226 -0.913583 -0.037 -0.028477 -0.185412 -0.01906 -1.200382 -0.949544 -0.767858ESTs, Weakly similar to trg [R.norvegicus] 103356_at -0.859357 -0.307584 -0.346228 -0.135603 0.682976 -1.119172 -0.315638 0.02287 -0.770217 -0.332694ESTs, Highly similar to HYPOTHETICAL 36.7 KD PROTEIN AH6.2 IN CHROMOSOME II [Caenorhabditis elegans] 92831_at 0.007554 0.291205 0.422597 0.399947 -0.030933 -0.754345 -0.668777 -0.261738 -0.475983 -0.205454histocompatibility 2, class II antigen A, alpha 92866_at -0.822233 0.253242 0.040923 0.131483 -0.240621 0.44407 -0.426388 -0.964875 -1.658969 -1.846522profilin 2 93567_at 0.751884 0.290403 -0.648661 -0.393927 -0.176703 -0.628335 -0.228965 -0.354643 -0.657449 -0.45416
�ESTs, Moderately similar to I52722 TCTA protein - human [H.sapiens] 104739_at -0.181455 -0.283292 -0.453969 -0.16749 0.333667 -0.297554 -0.210197 -0.697109 -0.795989 -0.274058ESTs, Highly similar to KIAA0370 [H.sapiens] 104105_at -0.473373 -0.369855 0.432084 -0.121887 0.000978 -0.166085 -0.324827 -0.631848 -0.836578 -0.331611ESTs, Highly similar to KIAA0710 protein [H.sapiens] 94397_at 0.474509 -0.206418 0.320721 -0.650082 -0.239083 -0.412692 -0.423984 -0.356538 -0.850344 -0.213133RuvB-like protein 1 99537_at 1.253614 1.260953 -0.01154 0.097933 -0.463437 -0.126403 -0.565593 -0.818664 -0.959269 -0.208493ATP-binding cassette, sub-family B (MDR/TAP), member 4 102910_at 0.045833 -0.458802 -1.085255 -0.279141 -0.045112 -0.745158 -0.088589 -0.362152 -0.864914 -0.309853EST AI115388 104605_at -0.026673 0.075448 -0.507825 -0.055512 -0.292049 -0.374697 -0.135422 -0.522347 -0.798773 -0.511737protein tyrosine phosphatase 4a2 100595_at 0.086922 0.069517 -0.242826 -0.062304 -0.214462 -0.688604 -0.504537 -0.267002 -0.48358 -0.201061tumor differentially expressed 1 100151_at 0.015166 0.199354 -0.341637 0.188008 -0.244252 -0.6154 -0.318607 -0.297057 -0.511254 -0.372763zinc finger protein 106 101456_at -0.381288 -0.25765 0.166594 -0.054803 0.642665 -1.129859 -0.239167 -0.880565 -0.786918 0.090219cyclin T1 93712_at -0.065668 -0.650369 -0.534061 0.172204 0.017102 -0.310669 -0.80207 -0.61642 -0.667776 -0.087348ESTs 94395_at 0.506655 0.314442 -0.126163 -0.283868 -0.138182 -0.585664 -0.50977 -0.06853 -0.799777 -0.23296DNA j protein b9 96679_at 0.751425 0.240825 0.061099 -0.35677 0.15632 -1.107048 -0.255868 -1.125909 -1.18918 0.238657geranylgeranyl diphosphate synthase 1 98970_at 0.350639 -0.283089 -0.026162 -0.181951 0.221682 -0.454189 -0.190544 -0.717829 -0.851742 -0.237993ESTs 104206_at -0.076611 -0.440722 -0.469371 -0.26487 -0.088493 -0.320286 -0.243426 -0.728955 -0.676661 -0.302762integrin-associated protein 103611_at 0.460609 0.032855 -0.549662 0.069897 0.031428 -0.355753 0.029287 -0.730311 -0.740172 -0.704072lymphocyte antigen 57 100772_g_at 0.710735 1.179494 0.747661 1.26278 -0.50166 -0.054725 -0.846688 -0.44435 -0.320333 -1.042401nuclear factor of kappa light chain gene enhancer in B-cells inhibitor, alpha 104149_at 0.249419 0.273665 -0.238589 -0.001633 -0.306721 -0.352951 -0.415651 -0.4675 -0.642113 -0.375003
Page 6
Sheehy et al. Comparison of Adaptive and Maladaptive Hypertrophy SUPPLEMENTAL MATERIAL
at Countw
ay Library of M
edicine on July 22, 2010 circgenetics.ahajournals.org
Dow
nloaded from
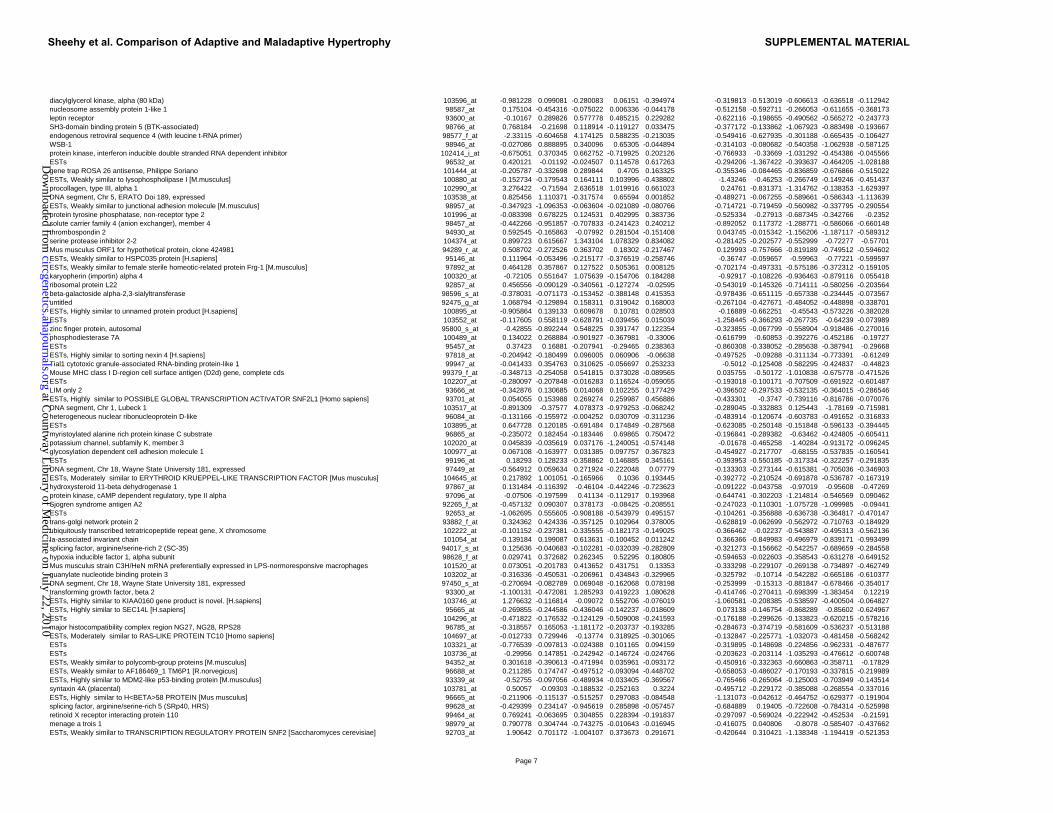
diacylglycerol kinase, alpha (80 kDa) 103596_at -0.981228 0.099081 -0.280083 0.06151 -0.394974 -0.319813 -0.513019 -0.606613 -0.636518 -0.112942nucleosome assembly protein 1-like 1 98587_at 0.175104 -0.454316 -0.075022 0.006336 -0.044178 -0.512158 -0.592711 -0.266053 -0.611655 -0.368173leptin receptor 93600_at -0.10167 0.289826 0.577778 0.485215 0.229282 -0.622116 -0.198655 -0.490562 -0.565272 -0.243773SH3-domain binding protein 5 (BTK-associated) 98766_at 0.768184 -0.21698 0.118914 -0.119127 0.033475 -0.377172 -0.133862 -1.067923 -0.883498 -0.193667endogenous retroviral sequence 4 (with leucine t-RNA primer) 98577_f_at -2.33115 -0.604658 4.174125 0.588235 -0.213035 -0.549416 -0.627935 -0.301188 -0.665435 -0.106427WSB-1 98946_at -0.027086 0.888895 0.340096 0.65305 -0.044894 -0.314103 -0.080682 -0.540358 -1.062938 -0.587125protein kinase, interferon inducible double stranded RNA dependent inhibitor 102414_i_at -0.675051 0.370345 0.662752 -0.719925 0.202126 -0.766933 -0.33669 -1.031292 -0.454386 -0.045566ESTs 96532_at 0.420121 -0.01192 -0.024507 0.114578 0.617263 -0.294206 -1.367422 -0.393637 -0.464205 -1.028188gene trap ROSA 26 antisense, Philippe Soriano 101444_at -0.205787 -0.332698 0.289844 0.4705 0.163325 -0.355346 -0.084465 -0.836859 -0.676866 -0.515022ESTs, Weakly similar to lysophospholipase I [M.musculus] 100880_at -0.152734 -0.179543 0.164111 0.103996 -0.438802 -1.43246 -0.46253 -0.266749 -0.149246 -0.451437procollagen, type III, alpha 1 102990_at 3.276422 -0.71594 2.636518 1.019916 0.661023 0.24761 -0.831371 -1.314762 -0.138353 -1.629397DNA segment, Chr 5, ERATO Doi 189, expressed 103538_at 0.825456 1.110371 -0.317574 0.65594 0.001852 -0.489271 -0.067255 -0.589661 -0.586343 -1.113639ESTs, Weakly similar to junctional adhesion molecule [M.musculus] 98957_at -0.347923 -1.096353 -0.063604 -0.021089 -0.080766 -0.714721 -0.719459 -0.560982 -0.337795 -0.290554protein tyrosine phosphatase, non-receptor type 2 101996_at -0.083398 0.678225 0.124531 0.402995 0.383736 -0.525334 -0.27913 -0.687345 -0.342766 -0.2352solute carrier family 4 (anion exchanger), member 4 98457_at -0.442266 -0.951857 -0.707833 -0.241423 0.240212 -0.892052 0.117372 -1.288771 -0.586066 -0.660148thrombospondin 2 94930_at 0.592545 -0.165863 -0.07992 0.281504 -0.151408 0.043745 -0.015342 -1.156206 -1.187117 -0.589312serine protease inhibitor 2-2 104374_at 0.899723 0.615667 1.343104 1.078329 0.834082 -0.281425 -0.202577 -0.552999 -0.72277 -0.57701Mus musculus ORF1 for hypothetical protein, clone 424981 94289_r_at 0.508702 -0.272526 0.363702 0.18302 -0.217467 0.129993 -0.757666 -0.819189 -0.749512 -0.594602ESTs, Weakly similar to HSPC035 protein [H.sapiens] 95146_at 0.111964 -0.053496 -0.215177 -0.376519 -0.258746 -0.36747 -0.059657 -0.59963 -0.77221 -0.599597ESTs, Weakly similar to female sterile homeotic-related protein Frg-1 [M.musculus] 97892_at 0.464128 0.357867 0.127522 0.505361 0.008125 -0.702174 -0.497331 -0.575186 -0.372312 -0.159105karyopherin (importin) alpha 4 100320_at -0.72105 0.551647 1.075639 -0.154706 0.184288 -0.92917 -0.108226 -0.936463 -0.879116 0.055418ribosomal protein L22 92857_at 0.456556 -0.090129 -0.340561 -0.127274 -0.02595 -0.543019 -0.145326 -0.714111 -0.580256 -0.203564beta-galactoside alpha-2,3-sialyltransferase 98596_s_at -0.378031 -0.071173 -0.153452 -0.388148 0.415353 -0.978436 -0.651115 -0.657338 -0.234445 -0.073567untitled 92475_g_at 1.068794 -0.129894 0.158311 0.319042 0.168003 -0.267104 -0.427671 -0.484052 -0.448898 -0.338701ESTs, Highly similar to unnamed protein product [H.sapiens] 100895_at -0.905864 0.139133 0.609678 0.10781 0.028503 -0.16889 -0.662251 -0.45543 -0.573226 -0.382028ESTs 103552_at -0.117605 0.558119 -0.628791 -0.039456 0.015039 -1.258445 -0.366293 -0.267735 -0.64239 -0.073989zinc finger protein, autosomal 95800_s_at -0.42855 -0.892244 0.548225 0.391747 0.122354 -0.323855 -0.067799 -0.558904 -0.918486 -0.270016phosphodiesterase 7A 100489_at 0.134022 0.268884 -0.901927 -0.367981 -0.33006 -0.616799 -0.60853 -0.392276 -0.452186 -0.19727ESTs 95457_at 0.37423 0.16881 -0.207941 -0.29465 0.238363 -0.860308 -0.338052 -0.285638 -0.387941 -0.29668ESTs, Highly similar to sorting nexin 4 [H.sapiens] 97818_at -0.204942 -0.180499 0.096005 0.060906 -0.06638 -0.497525 -0.09288 -0.311134 -0.773391 -0.61249Tial1 cytotoxic granule-associated RNA-binding protein-like 1 99947_at -0.041433 0.354763 0.310625 -0.056697 0.253233 -0.5012 -0.125408 -0.582295 -0.424837 -0.44823Mouse MHC class I D-region cell surface antigen (D2d) gene, complete cds 99379_f_at -0.348713 -0.254058 0.541815 0.373028 -0.089565 0.035755 -0.50172 -1.010838 -0.675778 -0.471526ESTs 102207_at -0.280097 -0.207848 -0.016283 0.116524 -0.059055 -0.193018 -0.100171 -0.707509 -0.691922 -0.601487LIM only 2 93666_at -0.342876 0.130685 0.014068 0.102255 0.177429 -0.396502 -0.297533 -0.532135 -0.364015 -0.286546ESTs, Highly similar to POSSIBLE GLOBAL TRANSCRIPTION ACTIVATOR SNF2L1 [Homo sapiens] 93701_at 0.054055 0.153988 0.269274 0.259987 0.456886 -0.433301 -0.3747 -0.739116 -0.816786 -0.070076DNA segment, Chr 1, Lubeck 1 103517_at -0.891309 -0.37577 4.078373 -0.979253 -0.068242 -0.289045 -0.332883 0.125443 -1.78169 -0.715981heterogeneous nuclear ribonucleoprotein D-like 96084_at -0.131166 -0.155972 -0.004252 0.030709 -0.311236 -0.483914 -0.120674 -0.603783 -0.491652 -0.316833ESTs 103895_at 0.647728 0.120185 -0.691484 0.174849 -0.287568 -0.623085 -0.250148 -0.151848 -0.596133 -0.394445myristoylated alanine rich protein kinase C substrate 96865_at -0.235072 0.182454 -0.183446 0.69865 0.750472 -0.196841 -0.289382 -0.63462 -0.424805 -0.605411potassium channel, subfamily K, member 3 102020_at 0.045839 -0.035619 0.037176 -1.240051 -0.574148 -0.01678 -0.465258 -1.40284 -0.913172 -0.096245glycosylation dependent cell adhesion molecule 1 100977_at 0.067108 -0.163977 0.031385 0.097757 0.367823 -0.454927 -0.217707 -0.68155 -0.537835 -0.160541ESTs 99196_at 0.18293 0.128233 -0.358862 0.146885 0.345161 -0.393953 -0.550185 -0.317334 -0.322257 -0.291835DNA segment, Chr 18, Wayne State University 181, expressed 97449_at -0.564912 0.059634 0.271924 -0.222048 0.07779 -0.133303 -0.273144 -0.615381 -0.705036 -0.346903ESTs, Moderately similar to ERYTHROID KRUEPPEL-LIKE TRANSCRIPTION FACTOR [Mus musculus] 104645_at 0.217892 1.001051 -0.165966 0.1036 0.193445 -0.392772 -0.210524 -0.691878 -0.536787 -0.167319hydroxysteroid 11-beta dehydrogenase 1 97867_at 0.131484 -0.116392 -0.46104 -0.442246 -0.723623 -0.091222 -0.043758 -0.97019 -0.95608 -0.47269protein kinase, cAMP dependent regulatory, type II alpha 97096_at -0.07506 -0.197599 0.41134 -0.112917 0.193968 -0.644741 -0.302203 -1.214814 -0.546569 0.090462Sjogren syndrome antigen A2 92265_f_at -0.457132 0.090307 0.378173 -0.08425 -0.208551 -0.247023 -0.110301 -1.075728 -1.099985 -0.09441ESTs 92653_at -1.062695 0.555605 -0.908188 -0.543979 0.495157 -0.104261 -0.356888 -0.636738 -0.364817 -0.470147trans-golgi network protein 2 93882_f_at 0.324362 0.424336 -0.357125 0.102964 0.378005 -0.628819 -0.062699 -0.562972 -0.710763 -0.184929ubiquitously transcribed tetratricopeptide repeat gene, X chromosome 102222_at -0.101152 -0.237381 -0.335555 -0.182173 -0.149025 -0.366462 -0.02237 -0.543887 -0.495313 -0.562136Ia-associated invariant chain 101054_at -0.139184 0.199087 0.613631 -0.100452 0.011242 0.366366 -0.849983 -0.496979 -0.839171 -0.993499splicing factor, arginine/serine-rich 2 (SC-35) 94017_s_at 0.125636 -0.040683 -0.102281 -0.032039 -0.282809 -0.321273 -0.156662 -0.542257 -0.689659 -0.284558hypoxia inducible factor 1, alpha subunit 98628_f_at 0.029741 0.372682 0.262345 0.52295 0.180805 -0.594653 -0.022603 -0.358543 -0.631278 -0.649152Mus musculus strain C3H/HeN mRNA preferentially expressed in LPS-normoresponsive macrophages 101520_at 0.073051 -0.201783 0.413652 0.431751 0.13353 -0.333298 -0.229107 -0.269138 -0.734897 -0.462749guanylate nucleotide binding protein 3 103202_at -0.316336 -0.450531 -0.206961 0.434843 -0.329965 -0.325792 -0.10714 -0.542282 -0.665186 -0.610377DNA segment, Chr 18, Wayne State University 181, expressed 97450_s_at -0.270694 -0.082789 0.069048 -0.162068 0.078198 -0.253999 -0.15313 -0.881847 -0.678466 -0.354017transforming growth factor, beta 2 93300_at -1.100131 -0.472081 1.285293 0.419223 1.080628 -0.414746 -0.270411 -0.698399 -1.383454 0.12219ESTs, Highly similar to KIAA0160 gene product is novel. [H.sapiens] 103746_at 1.276632 -0.116814 -0.09072 0.552706 -0.076019 -1.060581 -0.208385 -0.538597 -0.400504 -0.064827ESTs, Highly similar to SEC14L [H.sapiens] 95665_at -0.269855 -0.244586 -0.436046 -0.142237 -0.018609 0.073138 -0.146754 -0.868289 -0.85602 -0.624967ESTs 104296_at -0.471822 -0.176532 -0.124129 -0.509008 -0.241593 -0.176188 -0.299626 -0.133823 -0.620215 -0.578216major histocompatibility complex region NG27, NG28, RPS28 96785_at -0.318557 0.165053 -1.181172 -0.203737 -0.193285 -0.284673 -0.374719 -0.581609 -0.536237 -0.513188ESTs, Moderately similar to RAS-LIKE PROTEIN TC10 [Homo sapiens] 104697_at -0.012733 0.729946 -0.13774 0.318925 -0.301065 -0.132847 -0.225771 -1.032073 -0.481458 -0.568242ESTs 103321_at -0.776539 -0.097813 -0.024388 0.101165 0.094159 -0.319895 -0.148698 -0.224856 -0.962331 -0.487677ESTs 103736_at -0.29956 0.147851 -0.242942 -0.146724 -0.024766 -0.203623 -0.203114 -1.035293 -0.476612 -0.600748ESTs, Weakly similar to polycomb-group proteins [M.musculus] 94352_at 0.301618 -0.390613 -0.471994 0.035961 -0.093172 -0.450916 -0.332363 -0.660863 -0.358711 -0.17829ESTs, Weakly similar to AF186469_1 TM6P1 [R.norvegicus] 96688_at 0.211285 0.174747 -0.497512 -0.093094 -0.448702 -0.658053 -0.486027 -0.170193 -0.337815 -0.219989ESTs, Highly similar to MDM2-like p53-binding protein [M.musculus] 93339_at -0.52755 -0.097056 -0.489934 -0.033405 -0.369567 -0.765466 -0.265064 -0.125003 -0.703949 -0.143514syntaxin 4A (placental) 103781_at 0.50057 -0.09303 -0.188532 -0.252163 0.3224 -0.495712 -0.229172 -0.385088 -0.268554 -0.337016ESTs, Highly similar to H<BETA>58 PROTEIN [Mus musculus] 96665_at -0.211906 -0.115137 -0.515257 0.297083 -0.084548 -1.131073 -0.042612 -0.464752 -0.629377 -0.191904splicing factor, arginine/serine-rich 5 (SRp40, HRS) 99628_at -0.429399 0.234147 -0.945619 0.285898 -0.057457 -0.684889 0.19405 -0.722608 -0.784314 -0.525998retinoid X receptor interacting protein 110 99464_at 0.769241 -0.063695 0.304855 0.228394 -0.191837 -0.297097 -0.569024 -0.222942 -0.452534 -0.21591menage a trois 1 98979_at 0.790778 0.304744 -0.743275 -0.010643 -0.016945 -0.416075 0.040806 -0.8078 -0.585407 -0.437662ESTs, Weakly similar to TRANSCRIPTION REGULATORY PROTEIN SNF2 [Saccharomyces cerevisiae] 92703_at 1.90642 0.701172 -1.004107 0.373673 0.291671 -0.420644 0.310421 -1.138348 -1.194419 -0.521353
Page 7
Sheehy et al. Comparison of Adaptive and Maladaptive Hypertrophy SUPPLEMENTAL MATERIAL
at Countw
ay Library of M
edicine on July 22, 2010 circgenetics.ahajournals.org
Dow
nloaded from
heterogeneous nuclear ribonucleoprotein H1 93990_at 0.173768 0.142153 -0.074752 -0.255705 -0.226942 -0.631184 -0.354388 -0.173972 -0.430667 -0.174616regulator of G-protein signaling 5 103294_at 0.050993 0.35306 -1.26487 0.061869 0.004051 -0.322025 -0.031604 -0.729432 -0.448153 -0.964468caspase 6 94458_at 0.218543 0.16446 -0.336753 0.899836 -0.528002 -0.650291 0.144609 -0.857981 -0.80292 -0.746473microtubule-associated protein tau 102743_at 0.240175 -0.191165 -0.150992 0.528868 0.194538 0.105126 0.023279 -1.222174 -0.96854 -0.505475DNA segment, Chr 13, ERATO Doi 275, expressed 103314_at 0.022026 -0.24394 -0.445534 0.74632 0.524941 -0.32925 -0.216338 -1.210178 -0.270312 -0.263639serine/threonine kinase 2 101437_at -0.21676 0.636424 0.371792 0.335133 0.511164 -0.189003 -0.115654 -0.884378 -1.046217 -0.097619proteosome (prosome, macropain) subunit, beta type 8 (large multifunctional protease 7) 102791_at 0.246575 -0.201596 0.02053 0.526744 -0.343579 0.065922 -0.249738 -0.907332 -0.835406 -0.552696DNA segment, Chr 6, Wayne State University 176, expressed 95541_at -0.466533 0.304992 1.053965 0.800286 1.048915 -0.411056 -0.259451 -0.346731 -0.163073 -0.636013ESTs 102645_at 0.155474 -0.04007 -0.668619 0.084294 0.070546 -0.620679 0.116373 -0.370729 -0.542024 -0.691653receptor (calcitonin) activity modifying protein 2 99444_at -0.084767 -0.341634 -0.272281 -0.091211 -0.021994 0.038723 -0.560387 -0.572687 -0.635112 -0.744679enabled homolog (Drosophila) 93864_s_at 1.423037 2.425833 2.990955 1.149261 1.632775 -0.346902 0.0165 -0.676596 -0.265445 -0.008183natriuretic peptide precursor type B 104184_at 0.693059 1.668498 1.986334 1.095484 0.747987 0.346947 0.077078 -0.646241 -0.013869 -0.264797Fibrinogen-like protein 2 97949_at 0.975569 1.484109 0.903138 1.142259 0.948865 -0.217875 -0.45116 0.258493 -0.006776 -0.091549ESTs, Moderately similar to URIDINE KINASE [Escherichia coli] 94367_at 0.763204 0.93516 2.267056 1.69587 0.471282 -0.004261 -0.215721 -0.296323 -0.277501 -0.228421small inducible cytokine A2 102736_at 2.343038 3.634905 4.437081 1.088562 0.087433 0.409769 -0.667716 0.396726 1.195944 0.27264four and a half LIM domains 1 97500_g_at 0.361903 0.89596 2.282789 1.377623 1.311755 0.136614 0.46512 0.293299 0.04591 0.405263CD44 antigen 103005_s_at 0.646466 1.244165 2.783508 1.187047 0.386487 0.178506 0.082328 -1.847697 -0.706269 -0.301987four and a half LIM domains 1 97498_at 0.376959 0.932753 2.095301 1.385084 0.646247 0.135858 0.424339 0.341829 0.199456 0.235578FXYD domain-containing ion transport regulator 5 103394_at 2.319813 0.630208 1.266871 0.572288 0.542671 0.417786 0.130123 0.221048 0.574704 0.038341ESTs, Highly similar to serine protease [H.sapiens] 94238_at 2.34843 1.817072 0.974275 1.135736 0.807167 0.354835 -0.025668 -0.425348 -0.211427 -0.2464P lysozyme structural 101753_s_at 0.737929 0.634211 2.581448 0.987521 0.368265 -0.407042 -0.034241 -0.011068 0.062616 0.620003interleukin 4 receptor, alpha 102021_at 1.301467 0.53187 1.526064 1.148166 0.264522 0.510931 -1.026274 -0.810766 -0.326661 -0.251214CD53 antigen 94939_at 0.320359 1.64322 1.36486 0.992152 0.38688 -1.008136 -0.454416 0.130312 0.277266 0.52526natriuretic peptide precursor type A 103593_at 0.290039 0.743007 0.894518 2.009901 1.423113 0.273546 0.203117 -0.045966 0.019481 0.236562secreted phosphoprotein 1 97519_at 0.079727 0.011195 6.266377 2.525576 2.414031 0.009238 -0.64811 -0.170764 0.14055 1.908232NPC derived proline rich protein 1 100472_at 0.6634 0.817798 0.442064 0.732315 0.758508 -0.07625 -0.108555 -0.731627 -0.367302 -0.192401ESTs, Highly similar to ALPHA-ACTININ 1, CYTOSKELETAL ISOFORM [Homo sapiens] 104578_f_at 0.324987 0.524777 1.540381 1.011281 0.651005 0.283708 -0.034351 0.377251 0.738648 0.341089lysozyme M gene 100611_at 0.475986 0.595901 1.840523 0.695202 0.404211 -0.347884 -0.267476 0.20815 0.398389 0.494224activating transcription factor 3 104155_f_at 1.053722 2.892277 0.874443 0.639912 0.161055 1.332704 1.013668 -1.149394 -1.225832 -1.148836follistatin-like 94833_at 0.479773 0.177143 1.845953 1.17469 1.135799 -0.116848 -0.527781 -0.274744 0.015007 0.027774glycoprotein 49 A 100325_at 1.173738 0.958188 1.13401 1.040512 0.022076 -0.531575 -0.463552 0.689093 0.629799 0.170784tubulin, beta 2 94835_f_at 0.40112 0.194603 1.393911 0.92128 0.607577 0.352092 -0.251973 0.082584 0.173599 -0.346456MHC class III region RD gene, partial cds; Bf, C2, G9A, NG22, G9, HSP70, HSP70, HSC70t, and smRNP genes; G7A ge 100946_at 0.281986 3.264022 0.74086 0.853577 0.168039 -0.025003 -0.295787 1.188775 0.990236 0.404167heat shock protein, 86 kDa 1 95282_at 0.736183 1.29054 0.175655 0.434455 0.588474 -0.893606 -0.667188 -0.30577 0.300229 -0.216842Early growth response 1 98579_at 0.551939 1.633444 0.77457 0.240172 0.417116 0.114092 -0.422896 -0.474119 -0.395193 -0.347941insulin receptor substrate 1 98824_at 1.417668 0.658361 0.831902 0.184959 2.954708 -1.133966 -0.465642 0.184139 0.068347 0.398155ESTs, Highly similar to ALPHA-ACTININ 1, CYTOSKELETAL ISOFORM [Homo sapiens] 104579_r_at 0.266193 0.396659 1.064664 0.588147 0.595583 0.766457 -0.415386 0.422228 0.623009 0.226235plasminogen activator inhibitor, type I 94147_at -0.371289 0.980606 2.187135 1.708013 0.835098 -0.220213 0.059802 -0.61818 -1.028148 -0.960082cyclin-dependent kinase inhibitor 1A (P21) 94881_at 0.896864 1.197141 0.720501 0.686639 0.041632 0.68175 0.686842 -0.647415 0.07645 -0.62711expressed in non-metastatic cells 1, protein (NM23A) (nucleoside diphosphate kinase) 92794_f_at 0.645378 0.81187 0.777325 0.322257 0.630962 -0.818474 -0.486675 0.384764 0.519557 0.03479 C85523:C85523 Mus musculus cDNA, 3' end 99849_at 0.63248 0.39584 0.673011 0.532001 0.300716 0.06067 0.592672 0.331822 0.375013 0.366302procollagen, type I, alpha 1 94305_at 0.662495 -0.133044 2.169968 1.858587 1.530609 0.467567 -0.341869 0.214176 0.719356 -0.109667RAN GTPase activating protein 1 98603_s_at 0.743077 0.321181 0.231787 1.752149 1.423976 -0.249741 -0.904094 -1.041865 0.38882 0.610545osteoblast specific factor 2 (fasciclin I-like) 92593_at -0.194561 0.103874 3.14774 3.031569 2.496345 -0.1552 -0.45937 0.185706 0.362278 -0.02272phosphofructokinase, platelet 97833_at 0.513542 0.127196 1.015957 0.823648 0.700993 0.462135 0.056214 0.162992 0.585607 0.315657DNA segment, Chr 2, ERATO Doi 198, expressed 104639_i_at 0.504805 0.934593 1.407047 0.803608 0.576469 -0.430634 -0.017068 -0.4303 -0.692643 -0.242905Mus musculus TNF intracellular domain-interacting protein mRNA, complete cds 95152_g_at 0.455091 0.32978 1.111826 0.727923 0.19864 0.49742 0.014732 0.19513 0.538648 0.1737procollagen, type V, alpha 2 92567_at 0.113551 -0.099944 2.706678 2.940866 1.549529 0.394485 -0.426404 0.383278 0.809787 -0.30947actin, alpha 1, skeletal muscle 100381_at 0.245005 0.450645 0.93033 0.911128 0.334738 0.422998 0.163627 0.688193 0.739672 -0.343721cysteine rich protein 61 92777_at 0.796322 1.824274 0.859545 -0.003005 0.324082 0.683352 0.174506 0.107009 -0.375304 -0.107701pleckstrin homology, Sec7 and coiled/coil domains 3 103434_at 0.525091 0.914889 0.250478 0.143158 2.004785 0.140093 -0.375733 -1.105517 -0.535884 -0.688431lymphocyte specific 1 104093_at 0.39491 0.330081 1.553131 0.901134 0.196052 0.051289 -0.467766 -0.106478 0.072545 -0.1394Lipocortin 1 93037_i_at 2.098505 1.015322 0.321144 0.651037 0.228094 -0.47059 -0.530958 0.662052 0.364976 0.281128oncostatin receptor 102255_at 0.321156 0.652422 0.697026 0.452498 0.269866 -0.052609 0.010436 -0.170819 0.00143 -0.384844matrix gamma-carboxyglutamate (gla) protein 93866_s_at 0.286192 0.304696 0.778516 0.947017 0.862129 0.026724 -0.162457 0.602387 0.646094 0.132481ornithine decarboxylase antizyme inhibitor 101002_at 0.571224 0.867218 0.474787 0.333233 0.227198 -0.28841 0.104459 -0.092689 -0.118641 -0.21332a disintegrin and metalloproteinase domain 9 (meltrin gamma) 96738_at 0.156527 0.818033 0.75709 1.021869 0.353601 -0.466213 -0.061016 0.023008 -0.167209 -0.011425solute carrier family 20, member 1 103065_at 1.177405 1.011167 0.771586 0.278213 0.178597 -0.187282 -0.110769 -0.614202 -0.523277 -0.298486small inducible cytokine A9 104388_at 1.061167 1.389657 1.764198 0.105284 -0.01128 -0.30898 -0.582817 1.154209 1.22675 0.574313ESTs, Highly similar to U05334_1 rap7a [R.norvegicus] 93842_at 1.147571 0.054968 1.038009 0.823368 0.733905 0.275157 -0.158379 -0.211963 0.021414 -0.268768procollagen-proline, 2-oxoglutarate 4-dioxygenase (proline 4-hydroxylase), alpha 1 polypeptide 104139_at 0.345604 0.549282 0.378522 0.525059 0.623625 -0.226181 -0.54706 0.039484 0.412695 -0.325414TYRO protein tyrosine kinase binding protein 100397_at 0.580196 0.732743 1.26046 0.462556 0.160661 -0.058882 -0.585173 0.457408 0.432575 0.541513cathepsin Z 92633_at 0.477369 1.086035 0.154236 0.694196 0.330906 0.264133 -0.046904 0.371773 0.516492 -0.318787cathepsin S 98543_at 0.403588 0.200128 2.141695 1.168404 0.207606 -0.410754 -0.097475 0.108238 -0.072772 -0.289507GRO1 oncogene 95348_at 1.613054 1.845626 1.28651 -0.166214 0.307815 -0.005241 -0.05769 0.146425 0.310371 -0.388548ESTs, Moderately similar to AF120206_1 XY body protein [M.musculus] 103563_at 0.979866 1.330913 0.133375 0.183061 0.367493 0.341003 -0.088799 0.056236 0.300528 0.300977integrin alpha 5 (fibronectin receptor alpha) 103039_at 0.515697 2.279611 3.220285 1.912429 -0.556933 0.56539 -1.656924 -1.004694 -0.912503 -1.456433ESTs, Highly similar to PROTEIN HI1715 [Haemophilus influenzae] 94034_at 0.680351 0.771941 0.182422 0.398335 0.276314 0.159278 0.245085 0.458733 0.483745 0.173634v-maf musculoaponeurotic fibrosarcoma oncogene family, protein K (avian) 102919_at 0.873737 0.377558 0.398526 0.214821 0.551807 0.369516 0.327435 0.211628 0.436278 0.077888ESTs, Weakly similar to DIA1_MOUSE DIAPHANOUS PROTEIN HOMOLOG 1 [M.musculus] 96278_at 0.604706 0.073852 1.055509 0.387902 0.430417 0.498137 0.259799 -0.168188 -0.198533 0.019047dynein, cytoplasmic, light chain 1 96298_f_at 0.550596 -0.013757 1.135388 0.880408 0.810417 0.030851 -0.12078 0.557494 0.735175 0.129382procollagen, type III, alpha 1 98331_at 0.186059 -0.094864 1.999963 1.897202 1.043648 0.441607 -0.871836 0.409393 0.567532 0.106031transgelin 93541_at 0.33113 0.257686 1.085604 0.941015 0.294552 0.047834 0.039451 0.223208 0.313779 0.285907
Page 8
Sheehy et al. Comparison of Adaptive and Maladaptive Hypertrophy SUPPLEMENTAL MATERIAL
at Countw
ay Library of M
edicine on July 22, 2010 circgenetics.ahajournals.org
Dow
nloaded from
DNA segment, Chr 5, ERATO Doi 287, expressed 100024_at 0.293242 0.295019 0.495369 0.828562 0.349396 0.089317 -0.023852 0.041206 0.281116 -0.525814ninjurin 1 93318_at 0.647152 0.527188 0.335876 0.571936 0.236604 0.601052 0.384437 -0.094491 0.547587 0.048687actin, gamma, cytoplasmic 96573_at 0.494114 0.504194 1.143136 0.432997 0.053542 0.180243 -0.337411 -0.118308 -0.128295 -0.592902small inducible cytokine A7 94761_at 1.080993 0.966018 2.553028 -0.091182 0.030312 0.231202 -0.695225 0.550405 0.383755 -1.866901transforming growth factor, beta 1 101918_at 0.309502 0.842319 0.872297 0.446495 0.222783 0.505262 -1.707786 -0.173753 -0.094805 -0.127608Mus musculus TNF intracellular domain-interacting protein mRNA, complete cds 95150_at 0.533404 0.335557 0.175939 0.437646 0.537191 0.120697 -0.012281 0.394342 0.594274 0.397102ESTs, Highly similar to HYPOTHETICAL 13.5 KD PROTEIN C45G9.7 IN CHROMOSOME III [Caenorhabditis elegans] 93327_at 1.177395 0.217846 0.16904 0.640318 0.593677 0.209694 -0.019308 -0.106339 0.198698 -0.09736DNA segment, Chr 15, ERATO Doi 621, expressed 98013_at 2.427299 1.544017 -0.079475 0.427717 0.686175 0.14566 0.198448 -0.415407 -0.719176 -0.50763calcium binding protein A6 (calcyclin) 92770_at 0.474969 -0.072682 1.285171 0.967211 0.490838 0.543418 0.267586 0.278098 0.279284 -0.086075A kinase anchor protein 2 101435_at 0.367411 0.42223 0.493582 0.376023 0.49531 -0.519502 -0.129799 0.664377 0.230453 0.749631synaptobrevin like 1 102885_at 2.349661 1.000309 -0.757851 0.536512 0.961821 -0.458377 -0.637686 -0.05854 -0.120941 0.096955cardiac morphogenesis 102213_at 0.834963 1.680522 0.726925 0.144607 -0.019137 0.792622 0.043138 0.076835 0.287985 0.078477amyloid beta (A4) precursor protein-binding, family B, member 1 interacting protein 102710_at 0.043985 0.385138 0.963401 0.804475 0.425082 0.360505 -0.082221 0.08272 0.335621 0.053399ESTs, Highly similar to TROPOMYOSIN 4, EMBRYONIC FIBROBLAST ISOFORM [Rattus norvegicus] 95542_at 0.324474 0.187186 0.833252 0.664631 0.303909 -0.261714 -0.20714 0.238612 0.557426 0.387586UDP-glucose dehydrogenase 102322_at 0.022067 0.393117 0.885657 0.586568 0.5423 -0.033545 0.38763 0.415232 0.304208 -0.011713calcium binding protein A11 (calgizzarin) 92539_at 0.221298 0.25752 1.616015 0.426204 0.229879 0.236432 -0.16765 0.431607 0.314159 -0.021378collagen binding protein 1 94817_at 0.559572 0.117189 1.077142 0.314848 0.328858 0.372573 -0.424948 0.620443 0.905967 0.249186fibrillin 1 101090_at -0.416862 0.432223 1.681274 1.781112 0.882968 0.549394 -0.228386 -0.707837 -0.290198 -0.86097complement component 1, q subcomponent, beta polypeptide 96020_at 0.673836 0.350745 0.956865 0.507525 0.223822 0.233831 -0.290681 0.829606 1.030296 0.263812
�ESTs, Highly similar to THRR_MOUSE THROMBIN RECEPTOR PRECURSOR [M.musculus] 95474_at 0.176824 0.244909 0.858809 0.957478 0.584058 -0.041139 -0.080909 0.188271 0.423949 0.018871spinocerebellar ataxia 10 homolog (human) 99127_at 0.254165 0.08161 0.800672 0.722427 0.444787 0.166608 0.184695 0.099723 0.145459 0.031449procollagen, type IV, alpha 1 101093_at 0.316278 0.439054 0.630936 0.898303 0.122271 0.420172 -0.377638 -0.081647 0.245686 -0.472475fibulin 2 100928_at 0.126889 0.011596 1.294428 1.203166 0.894727 0.195468 0.008428 -0.52545 -0.065243 -0.516877ESTs, Highly similar to ALPHA-ACTININ 1, CYTOSKELETAL ISOFORM [Homo sapiens] 92280_at 0.70974 -0.460943 2.275436 0.296493 1.75756 0.097638 -0.013796 -0.426831 -1.474312 0.858993ESTs, Moderately similar to GOLIATH PROTEIN [Drosophila melanogaster] 98915_at 0.798718 -0.0129 1.263653 0.89215 0.060101 -0.045057 0.492482 -0.246106 -0.712934 -0.337956actinin alpha 2 associated LIM protein 101089_at 0.525031 0.653099 0.095821 0.503694 0.226588 0.300175 0.13199 0.362511 0.346268 0.528035ESTs, Moderately similar to KIAA1029 protein [H.sapiens] 94991_at -0.077739 0.365471 0.891129 0.966554 0.687795 0.474072 -0.053771 -0.06087 0.47327 0.214471drebrin-like 95529_at 0.567154 0.181202 0.083361 0.793693 0.843998 0.657633 -0.399045 -0.025217 -0.032002 -0.222017
�ESTs, Weakly similar to CA11_RAT COLLAGEN ALPHA 1(I) CHAIN [R.norvegicus] 95035_at 0.677278 0.097621 0.675931 0.403241 0.272136 0.925793 0.153453 -0.592076 -0.246216 -0.202031peptidylprolyl isomerase C-associated protein 97507_at 0.422217 0.556753 0.671072 0.930062 0.210552 0.609538 -0.354288 -0.642893 -0.164931 -0.068199ESTs, Highly similar to MYOSIN HEAVY CHAIN, NONMUSCLE [Gallus gallus] 100915_at 0.445596 0.566757 0.466992 0.655125 0.187065 0.445087 -0.481283 -0.176949 0.657361 0.139738procollagen, type VIII, alpha 1 100308_at -0.054925 -0.044483 1.788599 1.833656 0.663274 -0.100881 -0.216485 0.047248 0.381326 0.365336cytotoxic T lymphocyte-associated protein 2 alpha 96912_s_at 0.300694 0.209717 0.699715 0.419956 0.309683 -0.406095 0.138119 0.587121 0.544981 0.824156growth arrest and DNA-damage-inducible, gamma 101979_at 0.182439 0.514449 1.665014 0.030317 0.264634 0.228289 0.354166 0.079514 -0.411786 -0.631459ADP-ribosylation-like 6 101439_at 0.901273 0.335652 0.468109 0.543619 0.120844 -0.36913 0.334333 -0.198553 -0.085256 -0.018622transforming growth factor, beta induced, 68 kDa 92877_at 0.127121 0.192596 1.256435 0.609513 0.379241 0.628109 -0.029583 0.269797 0.276881 -0.128648Lamin A 98059_s_at 0.293237 -0.003353 1.063849 0.74308 0.372693 0.337976 -0.105274 0.164749 0.365985 0.137587actin, gamma, cytoplasmic 97904_at 0.295154 0.22118 0.627082 0.442121 0.243514 -0.35907 -0.138674 -0.001583 -0.247795 -0.154523aryl hydrocarbon receptor nuclear translocator-like 102382_at 1.226771 0.590975 1.303786 -0.131257 0.555265 0.642467 0.669817 -0.32577 -0.970154 -0.269511Lipocortin 1 93038_f_at 0.426302 -0.040862 0.965597 0.987381 0.717629 -0.218688 0.064907 0.239162 0.172461 -0.011432major histocompatibility locus class III regions Hsc70t gene 95654_at -0.113918 0.336644 1.284168 0.855705 0.239584 0.364141 -0.002951 0.313622 0.32618 0.332041tyrosine 3-monooxygenase/tryptophan 5-monooxygenase activation protein, eta polypeptide 97535_at 0.302008 0.384939 0.476398 0.349827 0.221979 0.088825 0.148804 0.412186 0.469937 0.190323serine protease inhibitor 4 97487_at 0.33889 0.292053 0.219739 0.803388 0.8107 -0.059258 0.025328 -0.030235 0.417378 0.37943Mus musculus p53-variant (p53) mRNA, partial cds 101617_s_at 0.144213 0.350941 0.956784 0.947424 0.394723 0.062471 -0.352815 -0.368265 0.206272 -0.321146ESTs 103667_at 0.176496 0.375513 0.286307 0.562168 0.276081 -0.630084 -0.414216 -0.163157 -0.106936 -0.060103calpain 2 101040_at 0.353431 0.295473 0.917075 0.321776 0.134775 -0.107666 -0.043013 -0.464507 -0.230406 0.038799steroid dehydrogenase 94276_at 0.156247 0.893691 0.448484 -0.035369 0.755661 -0.488392 -0.15437 0.447858 0.22894 -0.018541protein tyrosine phosphatase, receptor type, C 101048_at 0.650023 -0.155486 0.406173 0.983442 0.300678 -0.467838 -0.588693 0.17814 -0.408696 -0.45877ESTs, Weakly similar to DYNA_RAT DYNACTIN, 150 KD ISOFORM [R.norvegicus] 97276_at 1.346355 0.520655 0.224705 0.208177 0.287909 -0.220253 -0.241935 -0.443939 -0.53883 -0.286605ESTs 97838_at 0.356987 0.44651 0.419927 0.309553 0.142846 -0.484629 -0.287556 -0.359527 -0.229796 -0.155043heat shock protein, 70 kDa 3 93875_at 0.31081 2.754836 0.98182 0.723276 -0.416273 -0.383689 -0.767388 0.143075 0.205517 -0.26254tubulin, beta 5 94788_f_at 0.268954 0.017928 1.472174 0.56238 0.212916 0.486959 -0.19581 0.346319 0.618233 -0.12996
�ESTs, Highly similar to THRR_MOUSE THROMBIN RECEPTOR PRECURSOR [M.musculus] 95313_at -0.361344 0.940294 0.855935 0.916731 0.405385 -0.528431 -0.417594 0.12827 0.322181 0.635938insulin-like growth factor binding protein 6 103904_at 0.299549 0.516101 0.097936 0.592468 1.075313 0.570729 0.367951 -0.193604 -0.128316 -1.038787secreted acidic cysteine rich glycoprotein 97160_at 0.212281 -0.144643 0.746349 1.292225 0.478303 0.031298 -0.828255 0.231717 0.301704 -0.044476
�ESTs, Highly similar to G02273 LIV-1 protein - human [H.sapiens] 103459_at 0.018905 0.61485 1.288161 1.21124 -0.051637 0.205702 -0.038078 0.304698 0.112738 -0.023913nuclear receptor-binding SET-domain protein 1 92827_at 0.660364 -0.244622 1.273882 0.897956 0.231824 -1.033457 0.126572 -0.367446 -0.51253 0.11773ESTs, Weakly similar to INTERFERON-INDUCED PROTEIN 6-16 PRECURSOR [Homo sapiens] 92718_at 0.498083 0.672261 1.068318 0.283704 0.387871 0.38901 0.168842 0.396625 0.305033 0.058744annexin A2 100569_at -0.222788 0.060258 1.682275 0.943186 0.432832 0.161873 -0.152279 0.644167 0.402842 0.381612eukaryotic translation initiation factor 1A 93058_at 0.720777 0.61503 0.847194 1.061615 -0.270254 -0.213677 0.503857 -0.129555 -0.088006 -0.117415protein tyrosine phosphatase, receptor type, A 100908_at 0.515327 0.913433 -0.290512 0.424073 1.01141 -0.224358 -0.58543 0.065569 -0.286816 -0.227342WD repeat domain 1 96075_at 0.430511 0.11607 0.740107 0.474212 0.105366 -0.021336 -0.236905 0.315097 0.336967 0.037162FK506 binding protein 5 (51 kDa) 94297_at -0.262835 0.414603 0.924336 1.306302 0.292918 -0.241311 0.714965 -0.092703 -0.2019 -0.31001ESTs 102056_f_at 0.702499 0.435402 0.28224 0.685865 0.074298 0.404398 0.069486 0.155335 0.112171 -0.1082625' nucleotidase 93202_at -0.054751 0.458777 0.647406 1.376546 0.185282 0.038323 0.048094 0.184608 -0.277167 0.266846thioredoxin reductase 1 99985_at 0.200314 0.369993 0.568476 0.116334 0.321838 0.381518 0.235995 -0.188693 -0.358173 0.194097ESTs 98346_at -0.298955 1.041677 0.474802 0.485865 0.933109 0.788779 -0.284729 0.299086 -0.018654 0.172497ESTs 95404_at 0.630255 0.241136 0.504197 0.462706 0.188798 -0.108681 -0.063976 -0.245372 -0.193514 -0.124086Rho interacting protein 2 92710_at 0.660176 0.162377 0.375069 0.608879 0.483634 0.072286 -0.080869 0.246345 0.277528 0.29577nidogen 2 93563_s_at -0.016575 0.956402 0.315619 1.050273 0.456036 0.081491 -0.329353 -0.339241 -0.232688 -0.437428ESTs 98594_at 0.465112 1.170591 -0.176861 0.29864 0.365056 -0.483642 0.297439 -0.357818 -0.385932 -0.359527tumor necrosis factor receptor superfamily, member 1a 92793_at 0.086402 0.358107 0.396221 0.441495 0.270742 0.359562 0.014082 0.030545 0.182203 -0.249112neoplastic progression 1 101168_at 0.189057 0.339232 0.349831 0.487069 0.422151 -0.108339 0.012715 0.102204 -0.424989 0.167587
Page 9
Sheehy et al. Comparison of Adaptive and Maladaptive Hypertrophy SUPPLEMENTAL MATERIAL
at Countw
ay Library of M
edicine on July 22, 2010 circgenetics.ahajournals.org
Dow
nloaded from
Intercellular adhesion molecule 96752_at 1.1134 1.335823 0.294069 0.154769 -0.117336 1.032653 -0.190495 -0.219524 0.086995 0.15879biglycan 96049_at -0.042858 -0.129856 1.576702 1.496142 1.438945 0.196357 -0.162442 -0.025184 0.264697 -0.057889glutamine fructose-6-phosphate transaminase 2 103737_at 0.481368 1.179765 0.932746 0.288679 0.28898 -0.068757 -0.05145 0.1142 0.140663 0.181241mitogen-activated protein kinase kinase kinase kinase 4 102195_at 1.235088 0.607551 0.050437 0.198787 0.271479 0.003152 -0.147954 0.058635 -0.030573 -0.187954suppressor of clear, C. elegans, homolog of 104216_at 1.172464 0.822123 0.017984 0.027546 0.318848 -0.289948 0.051809 -0.243379 0.083637 -0.677166secreted frizzled-related sequence protein 3 104672_at 0.790686 -0.33989 1.67533 1.971734 1.305057 0.23785 -0.574523 -0.27675 -0.312628 -0.522134procollagen, type I, alpha 2 101130_at 0.15623 -0.139725 1.444894 1.874827 1.112612 0.559211 -0.589601 -0.174927 0.604866 0.044843ESTs, Weakly similar to AF234765_1 serine-arginine-rich splicing regulatory protein SRRP86 [R.norvegicus] 98948_at 0.658609 0.800372 0.429277 -0.033402 0.058543 -0.367932 0.067819 -0.44597 -0.303333 -0.168506procollagen, type IV, alpha 2 101039_at -0.046107 0.110588 0.74361 0.801582 0.544584 0.56576 -0.294996 -0.162261 0.063329 0.061536ESTs, Highly similar to TRAM PROTEIN [Canis familiaris] 98956_at 0.418903 0.198245 0.220369 0.365934 0.228267 -0.026013 0.31769 0.466363 0.270533 0.248672mannose receptor, C type 1 103226_at 0.301472 0.476385 0.344195 0.513798 0.358536 -0.46277 -0.321872 -0.110539 -0.04696 -0.232227alpha actinin 4 96343_at 0.680848 0.592559 0.217558 0.574832 0.224138 0.302276 -0.184547 -0.206922 -0.088776 -0.204823ESTs 93458_at -0.271481 0.966588 0.41528 0.891284 0.252892 0.680283 -0.291278 -0.341661 -0.173879 -0.347604Mus musculus chromosome 10 popeye protein 3 (Pop3) mRNA, complete cds 103484_at 0.209386 0.525018 0.435826 0.119971 0.263019 0.144109 0.08461 0.438281 0.764737 0.259264E26 avian leukemia oncogene 1, 5' domain 94720_at 0.846825 0.2553 0.688665 0.225581 0.301753 -0.151985 0.452595 -0.467169 0.059744 0.165191ESTs, Highly similar to RIBONUCLEASE INHIBITOR [Rattus norvegicus] 100621_at 1.166647 -0.313662 0.935004 0.687273 0.190026 0.044715 -0.02174 -0.231413 -0.295384 -0.361487solute carrier family 25 (mitochondrial carrier; peroxisomal membrane protein, 34 kDa), member 17 97473_at 0.351238 -0.076526 0.637229 0.518465 0.273099 0.020603 -0.256362 -0.502637 -0.018142 0.012254tubulin alpha 2 98759_f_at 0.212911 0.127285 1.219979 0.345907 0.1102 0.24649 -0.482547 0.901031 0.551637 0.280601ESTs, Highly similar to TRANSLOCON-ASSOCIATED PROTEIN, BETA SUBUNIT PRECURSOR [Homo sapiens] 101061_at 0.79391 0.314865 0.069572 0.484207 0.193601 0.324744 -0.079821 0.112915 0.002708 0.118474ESTs 93187_at 0.368157 -0.022147 0.720096 0.345186 0.512074 0.414873 -0.229408 -0.129694 0.169523 -0.040494clusterin 95286_at 0.22662 0.130588 0.821711 0.925807 0.071836 0.279245 -0.024518 -0.511602 -0.400513 -0.380258immediate early response 2 99109_at 0.481628 0.838363 0.206683 0.191851 0.048969 0.23787 -0.280458 -0.349769 -0.091757 -0.580997serum amyloid A 3 102712_at -0.924018 0.708052 2.379979 2.285736 0.147122 -0.423916 -0.851542 0.62684 0.806487 0.367732ESTs, Moderately similar to 60S RIBOSOMAL PROTEIN L39 [Rattus norvegicus] 94844_at 0.116802 0.229217 0.813871 0.256723 0.256473 0.498138 -0.640933 0.25013 0.392499 0.119571actin, alpha, vascular smooth muscle 93100_at 0.91492 0.05983 0.574016 0.521389 0.221227 0.584484 -0.090852 0.079421 0.475172 0.060549hematological and neurological expressed sequence 1 93276_at 0.473767 -0.06749 0.513023 0.659304 0.380337 0.368569 0.178137 0.11272 0.548909 0.271984ferritin light chain 1 99872_s_at 0.477258 0.280446 0.423243 0.516709 0.170711 0.057007 -0.167215 -0.245777 0.144908 -0.081981ESTs, Weakly similar to nuclear protein ZAP [M.musculus] 96288_at 0.272864 0.232787 0.625592 0.120245 0.501661 0.401726 -0.072949 -0.368702 -0.134574 -0.323998ESTs, Highly similar to ER23_HUMAN ER LUMEN PROTEIN RETAINING RECEPTOR 3 [H.sapiens] 104464_s_at 0.218993 -0.325886 1.382523 1.211213 0.345941 0.770966 -0.004731 0.131027 0.159498 -0.193736latent transforming growth factor beta binding protein 2 92335_at 0.526675 -0.10468 2.519514 2.049431 1.605186 0.035709 -1.110404 0.733815 0.705146 0.776986aortic preferentially expressed gene 1 99331_at 0.190657 0.156868 0.736655 0.215533 0.258453 0.644015 -0.141548 0.253172 0.70434 0.287881ESTs, Weakly similar to AF154120_1 sorting nexin 1 [M.musculus] 96331_at 0.323884 0.818136 0.176841 0.432923 0.110342 -0.061183 0.44059 -0.163059 -0.38112 -0.322279mitogen activated protein kinase 3 101834_at 0.517143 0.279038 0.630417 0.365407 0.015294 -0.047146 -0.463837 -0.272473 -0.493223 0.203211G protein-coupled receptor kinase 5 102217_at -0.136872 0.170014 0.604811 0.43431 0.805529 0.486734 -0.025469 -0.571927 -0.508339 -0.378705
�ESTs, Weakly similar to CA11_RAT COLLAGEN ALPHA 1(I) CHAIN [R.norvegicus] 95034_f_at 0.378995 0.539565 -0.152899 0.639726 0.310845 0.331992 -0.318176 0.284203 0.643162 -0.563355B-cell translocation gene 3 96146_at 0.619808 0.509852 -0.098071 0.603099 0.205549 -0.167923 0.295443 0.255833 0.53375 0.511186keratin-associated protein 14 92246_at 0.53477 0.386038 0.603605 0.517733 0.087617 -0.397529 -0.715981 0.051544 -0.11188 0.153237chromobox homolog 1 (Drosophila HP1 beta) 96775_at 0.748023 0.801293 0.693699 0.208009 0.709479 -0.126119 -0.318159 0.136915 -0.964639 0.117168cholesterol 25-hydroxylase 104509_at 0.146903 1.014224 1.86853 0.574424 -0.001599 0.204604 -0.271527 0.064007 0.4467 0.690997ESTs, Highly similar to POSSIBLE GUSTATORY RECEPTOR TYPE B [Bos taurus] 97383_at 0.39528 0.25442 0.617664 -0.088479 0.380121 0.144751 0.284043 -0.323351 0.099067 0.078032Mus musculus collagenous repeat-containing sequence of 26kDa protein (CORS26) mRNA, complete cds 103570_at -0.231677 0.063209 1.896222 2.048282 0.711508 -0.121883 -0.34262 -0.560752 -0.513517 -0.486315TGFB inducible early growth response 99603_g_at 0.013268 0.580838 0.379459 0.008012 0.906948 -0.564327 -0.138369 -0.040396 -0.27136 -0.41628ribosomal protein L3 100734_at 0.130729 0.044027 1.144895 0.296403 0.21057 -0.021784 -0.052666 0.108155 -0.268278 -0.206657DNA segment, Chr 11, ERATO Doi 175, expressed 97824_at -0.038905 0.644808 0.691484 0.14188 0.225784 -0.231815 -0.03711 -0.479939 -0.461765 -0.593226DNA segment, Chr 11, KL Mohlke 35 98635_at 0.657573 -0.111057 0.265789 0.525837 0.272064 0.114185 -0.24474 0.020245 -0.392089 -0.143187ESTs, Moderately similar to PLSL_MOUSE L-PLASTIN [M.musculus] 94445_at -0.299506 0.456656 0.352636 0.883169 0.395466 -0.093601 0.122714 -0.080492 0.213626 0.059316membrane-spanning 4-domains, subfamily A, member 11 102104_f_at -0.293563 0.965182 1.06965 1.283233 -0.107912 -0.202027 -0.354922 0.280172 0.161553 0.215532vasodilator-stimulated phosphoprotein 101982_at 0.402119 0.035957 0.403638 0.293649 0.31878 0.31301 -0.506951 -0.127426 0.158052 -0.104064SEC23B (S. cerevisiae) 98944_at 1.608496 0.098276 0.050495 0.443524 0.057207 0.600164 0.24972 0.087157 0.167499 -0.090734heat shock protein, 110 kDa 92571_at 0.244325 0.820261 0.126915 0.355528 0.024038 -0.346762 0.082721 -0.152109 -0.128695 -0.16532cathepsin C 101019_at 0.212847 0.824643 0.948045 1.001345 -0.269778 0.263613 0.266706 0.241662 0.072204 -0.216471sodium channel, voltage-gated, type I, beta polypeptide 102808_at 0.25586 -0.081711 0.724866 0.77293 0.490301 0.088128 -0.364848 0.432925 0.841756 0.291954ESTs, Highly similar to KINESIN-II 85 KD SUBUNIT [Strongylocentrotus purpuratus] 95118_r_at 0.272404 0.08313 1.650936 1.147889 0.124441 -0.019669 -0.899826 -0.341257 -0.059857 0.294303ESTs, Weakly similar to AF164793_1 protein x 013 [H.sapiens] 98615_at 0.136255 0.679958 0.4304 0.173217 0.111947 -0.197613 0.029915 0.667661 0.760911 0.099561proteolipid protein 2 93323_at 0.007002 -0.009389 0.981451 0.753216 0.667173 0.110814 0.161535 0.179938 0.112278 0.113721procollagen, type XV 99637_at 0.391513 -0.162265 1.044238 1.102739 0.401082 0.403017 -0.254686 -0.35669 0.216715 -0.01153peripheral myelin protein, 22 kDa 102395_at 0.186049 0.575266 0.211473 0.46419 0.303425 0.378729 0.021751 0.354348 0.702053 -0.11046NF-YB-like protein 100408_at -0.384912 0.757282 1.02715 0.82026 0.578551 0.604917 0.313868 0.021374 0.005799 0.025745tubulin alpha 1 100343_f_at 0.006812 0.184888 1.06606 0.156206 0.647153 0.268687 -0.766704 1.138372 0.699416 -0.182977ESTs 103709_at -0.467796 -0.082076 2.031433 1.282214 0.645392 0.720352 -0.338096 0.168156 0.548826 0.012245origin recognition complex subunit 6 95712_at 0.187585 1.036324 0.136162 0.510041 0.491898 -0.167665 -0.11115 -0.000227 -0.318182 -0.52017ESTs 103423_at 0.300556 0.18139 0.355395 0.366858 0.157285 0.107792 0.087297 0.156498 0.670036 0.081366DNA segment, Chr 3, University of California at Los Angeles 1 95708_at -0.007045 0.180491 0.638269 0.421329 0.273846 -0.107883 0.012763 0.055173 0.085259 -0.217148annexin A4 100584_at 0.351537 0.124203 0.505645 0.677164 0.606313 0.115577 0.00649 0.336658 0.15958 -0.257485pleckstrin homology, Sec7 and coiled/coil domains 3 103433_at 0.800444 0.348523 0.272732 0.208315 0.430555 0.439592 0.237741 -0.23395 -0.229764 -0.364023MORF-related gene X 96632_at -0.152314 -0.013304 1.054946 0.59151 0.420612 -0.612387 -0.215569 0.119295 -0.329099 -0.097148DNA segment, Chr 2, ERATO Doi 93, expressed 97165_r_at 1.191502 0.018532 0.352473 0.726304 -0.119718 -0.52167 -1.029671 0.547414 0.270055 0.786494glutathione peroxidase 3 101676_at 0.522328 0.048124 -0.027724 1.09492 0.55393 -0.006304 -0.819686 -0.935203 -0.437939 -0.332215karyopherin (importin) alpha 3 93857_at 0.823122 0.336777 -0.522019 0.506996 0.887369 -0.316712 0.041536 -0.20524 -0.583214 0.091796nucleoplasmin 3 102796_at 1.045385 1.525396 0.240543 0.228136 -0.006578 0.068536 0.001085 0.547894 0.210868 0.129386ESTs, Highly similar to KIAA0456 protein [H.sapiens] 96516_at 0.461565 -0.013436 0.324261 0.446987 0.087605 -0.159884 -0.527715 -0.467409 -0.267896 -0.323531MARCKS-like protein 97203_at 0.106239 0.137441 0.818454 0.312889 0.078397 0.21069 -0.828012 0.340474 0.482605 0.52408platelet/endothelial cell adhesion molecule 97830_at -0.154358 0.216574 0.936397 0.445232 0.343453 0.686497 -0.185959 0.562355 0.38149 0.418722
Page 10
Sheehy et al. Comparison of Adaptive and Maladaptive Hypertrophy SUPPLEMENTAL MATERIAL
at Countw
ay Library of M
edicine on July 22, 2010 circgenetics.ahajournals.org
Dow
nloaded from
DNA segment, Chr 6, ERATO Doi 746, expressed 104168_at 1.07502 0.424375 -0.322081 1.017215 0.44909 -0.919787 -0.074526 0.107475 -0.028648 0.174688ubiquitin-like 1 (sentrin) activating enzyme subunit 2 96701_at 0.118914 0.423361 0.668266 0.389029 -0.031097 -0.117819 -0.268849 0.123488 -0.301702 0.075499fibroblast growth factor receptor 1 97509_f_at 0.433489 -0.062096 0.393039 0.51627 0.206425 0.263069 -0.044375 -0.32486 -0.495344 -0.183745cyclin-dependent kinase 4 101017_at 0.555491 0.414274 -0.205771 0.679227 0.148859 -0.042137 -0.542671 0.059763 0.325337 0.35324ESTs, Weakly similar to HYPOTHETICAL 39.2 KD PROTEIN IN EGT2-KRE1 INTERGENIC REGION [Saccharomyces c 104582_g_at 0.85207 0.592793 0.542467 0.733185 -0.447431 -0.069826 -0.149604 -0.508141 -0.503016 -0.149284ESTs, Moderately similar to quiescin [H.sapiens] 96603_at 0.898181 -0.604366 1.403711 0.263487 0.318292 0.154775 -0.545622 0.278363 0.207719 0.317941immediate early response 3 94384_at 0.23705 -0.1763 1.167892 0.054257 0.447563 0.151535 0.287016 0.281759 0.46541 0.054902ESTs, Weakly similar to ADP-RIBOSYLATION FACTOR 2 [Saccharomyces cerevisiae] 98491_at 0.228896 0.623719 -0.137155 0.309102 0.444408 -0.114809 -0.167032 0.199727 0.090537 0.188743RAS p21 protein activator 3 93319_at 0.390234 0.186424 0.114342 0.167925 0.279106 0.649932 0.273447 0.025901 0.334073 -0.458205capping protein alpha 1 93499_at 0.040646 0.353923 0.364578 0.425689 0.093905 -0.246067 0.064584 0.06743 0.040823 -0.068169ERG-associated protein 98129_at 0.47585 -0.171437 0.784812 0.676672 0.218198 0.448891 -0.313166 0.177175 0.735654 -0.388398endothelin 1 102737_at 0.590232 1.242994 0.520908 -0.029255 0.038501 -0.240439 -0.345614 0.130289 0.050613 -0.288329ESTs, Highly similar to ARGINYL-TRNA SYNTHETASE [Cricetulus longicaudatus] 96693_at 0.224169 0.224526 0.1589 0.275176 0.454005 -0.492245 0.104381 -0.104762 0.03847 -0.046491ESTs 99366_at -0.363388 0.307587 0.560258 0.720906 0.989371 0.217186 -0.09617 0.215507 0.296628 0.199395glycogenin 1 100597_at 0.01298 0.400203 0.155523 0.208357 0.395673 0.305943 -0.173567 0.020608 0.250371 0.141923tenascin C 101993_at -0.148779 0.304232 3.464742 0.305185 -0.054858 0.353747 -0.161109 0.388155 -0.527692 -0.006199ESTs, Highly similar to HYPOTHETICAL 45.3 KD PROTEIN ZK370.5 IN CHROMOSOME III [Caenorhabditis elegans] 92810_at 0.555163 -0.651802 0.457063 1.196623 0.285388 0.345878 0.131973 -0.136573 0.31009 0.374329fragile X mental retardation syndrome 1 homolog 98441_at -0.350743 0.43085 0.395413 0.867643 0.367692 -0.832797 -0.460498 -0.239686 -0.515266 -0.025795rabaptin 5 101381_at 0.066447 1.218102 0.107432 0.110974 0.38247 -0.222123 0.106019 -0.526258 -0.641235 -0.254441cystatin B 100581_at 0.206297 0.058423 0.639899 0.390248 0.191196 0.122409 -0.208185 0.465059 0.513893 -0.06235
�ESTs, Moderately similar to I53908 major vault protein - rat [R.norvegicus] 103793_at 0.802173 -0.057157 0.486615 0.275815 0.167507 0.094974 -0.120019 -0.68112 -0.551329 -0.524078interferon concensus sequence binding protein 98002_at 0.404856 0.641081 0.988438 0.749286 0.135094 0.339034 -0.500539 0.022624 -0.174527 0.228941calponin 2 94004_at 0.790527 -0.261843 0.699299 0.214323 0.310786 0.198015 -0.690209 0.151769 0.464324 0.234775ESTs, Weakly similar to ZINC FINGER PROTEIN ZFP-27 [Mus musculus] 103631_at 1.199859 1.241214 -0.116191 0.190817 0.013123 0.090104 0.185509 -0.21507 0.152755 0.12577annexin A5 93083_at 0.27845 -0.048771 0.552537 0.443716 0.359364 0.282966 0.046606 -0.056099 0.046521 -0.166845spermidine/spermine N1-acetyl transferase 96657_at 0.342029 0.69248 0.036127 0.395603 0.191661 0.340643 0.437229 -0.4362 0.163994 0.150788interferon (alpha and beta) receptor 2 101015_s_at -0.281629 0.379077 -0.048502 0.66494 1.097896 0.481484 0.174476 0.370502 0.657406 -0.415912NCK-associated protein 1 95508_at 0.062815 0.461638 0.175487 0.442648 0.189157 -0.338465 0.057674 -0.317885 -0.244788 -0.214767ESTs 94362_at 0.135253 0.352522 -0.000287 0.325252 0.293301 -0.750796 -0.485117 0.106154 0.137218 -0.199848cytokine inducible SH2-containing protein 2 99475_at 0.954158 0.112511 -0.085823 0.218852 0.478667 -0.472186 -0.194258 -0.677989 -0.145476 0.265966mesenchyme homeobox 1 98419_at -0.140829 -0.281821 1.630842 0.838387 0.889152 0.098205 -0.595144 -0.139837 0.326172 0.254136centrin 3 92789_r_at 0.295884 0.889572 0.133214 0.102281 0.009844 -0.294471 -0.536239 0.074371 -0.322925 -0.278035apolipoprotein D 93592_at 0.916739 0.107312 0.244732 0.319357 0.686825 -0.058 1.426389 0.078763 0.423326 -0.904904pre B-cell leukemia transcription factor 3 93615_at 0.67299 0.276407 0.314252 0.139436 -0.111603 0.29956 -0.004116 -0.986048 -0.225521 -0.316407deoxycytidine kinase 98071_f_at 0.068542 -0.309727 1.189571 1.169697 0.279224 -0.083277 -0.136273 0.526884 0.329275 0.102877SH3-binding domain glutamic acid-rich protein like 93806_at -0.002081 0.213697 0.199339 0.587334 0.492422 -0.807071 -0.34369 0.01047 -0.054522 -0.341411ESTs 95284_at 1.184425 -0.536462 2.983485 0.361219 0.113159 -0.311851 -0.47468 0.050753 -0.303824 0.398804Sid394p 93818_g_at 0.46678 0.630029 0.116841 0.081507 0.126641 -0.332665 -0.060389 0.061559 -0.045687 -0.027177phospholipase A2, group IV 99513_at 0.219005 -0.249607 1.215913 0.339223 1.126079 -0.24383 -0.584963 0.246209 -0.239945 -0.190623tubulin alpha 6 101543_f_at 0.374882 0.145942 0.79231 -0.033118 0.120353 0.281654 0.071464 0.754047 0.702142 -0.083208retinol binding protein 1, cellular 104716_at -0.341787 0.114469 1.270614 1.403133 0.997345 0.192097 -0.06798 -0.189329 -0.245766 -0.796068growth associated protein 43 102389_s_at -0.220783 0.193457 0.571906 1.039211 0.271513 0.009497 -1.351609 1.10803 0.657874 0.250914DNA segment, Chr 6, ERATO Doi 109, expressed 98608_at 0.193251 0.182053 0.079598 0.363199 0.237926 -0.518367 0.407391 0.022286 -0.485158 -0.112783DNA segment, Chr 19, ERATO Doi 721, expressed 97241_at 0.383807 0.178027 -0.047295 0.191935 0.351989 0.114979 0.037552 -0.004272 0.371107 0.092322actin related protein 2/3 complex, subunit 3 (21 kDa) 95434_at 0.543139 0.356395 -0.028976 0.277969 0.466749 0.089632 0.345631 0.043594 0.102171 -0.13301Mus musculus mRNA for MAIL, complete cds 98988_at 0.526646 0.176472 0.964683 0.095312 -0.046399 0.277061 -0.29192 0.055648 -0.154369 0.126965interferon activated gene 202A 94774_at 0.937785 0.117021 0.435043 0.022515 0.093892 -0.75738 -0.376416 -0.414427 -0.118383 0.288923procollagen, type VI, alpha 2 93517_at 0.386882 -0.289732 0.865564 1.222689 0.593479 0.267766 -0.579264 0.650253 0.373278 0.000871OCTN3 92486_at 0.283736 0.442258 0.311095 0.854809 -0.164378 -0.343887 -1.300298 0.05242 0.035591 -0.057865kidney cell line derived transcript 1 102644_at 0.12421 0.388388 0.148161 0.322113 0.184133 -0.291498 0.178706 -0.324222 -0.410282 -0.296639fascin homolog 1 (actin bundling protein, Strongylocentrotus purpuratus) 92838_at 0.041171 -0.168806 1.049274 0.487602 0.482611 0.109423 0.146914 0.500747 0.395365 0.374486ESTs, Highly similar to AF161530_1 HSPC182 [H.sapiens] 93533_at 0.627028 0.165213 -0.095679 0.541843 0.049381 0.258516 -0.067953 0.399187 0.506183 0.148822Eph receptor B4 98446_s_at 0.345938 -0.086317 1.179113 0.048663 0.081637 0.07427 -0.341147 -0.052063 0.035689 -0.119273ESTs, Weakly similar to AF114379_1 cypher2 [M.musculus] 102845_at 0.064711 -0.355686 0.751674 0.819991 0.479101 0.539189 0.346588 0.11235 0.489424 -0.149501ATP-binding cassette, sub-family A (ABC1), member 1 97198_at 0.226338 0.041006 0.70209 0.110934 0.680442 -0.46196 -0.125369 -0.486595 -0.219476 0.430958calmodulin 96522_at 0.194291 -0.082504 0.762351 0.321272 0.3235 -0.344334 -0.458556 0.131698 0.2309 0.010419ESTs, Weakly similar to Edp1 protein [M.musculus] 102099_f_at 0.548001 0.234506 0.918007 0.066475 0.121775 0.67713 -0.12146 0.061169 0.319787 0.116497heat shock 70 kDa protein 4 100353_g_at 0.189264 0.084343 -0.033603 0.617211 0.334623 0.295747 0.724728 -0.139255 -0.1162 -0.033094GTP cyclohydrolase 1 102313_at 0.367012 1.663663 0.295522 -0.113518 0.234106 0.444737 -0.074793 0.234968 0.309656 -0.145866ESTs, Weakly similar to unknown [S.cerevisiae] 103853_at 0.101595 0.539667 -0.052419 0.167316 0.111483 0.278185 -0.178627 0.159049 0.306936 -0.055551ESTs 92836_at -0.053184 -0.3872 0.906823 1.859313 0.305337 0.675893 0.282977 0.152729 0.340164 -0.228227Tumor necrosis factor induced protein 1 93215_at 0.481441 0.130881 0.293217 -0.000993 0.20589 -0.000139 -0.194615 -0.661397 -0.320187 -0.148449vascular cell adhesion molecule 1 92559_at 0.15976 0.922117 -0.14389 0.253099 0.092052 -0.635257 -0.200215 -0.276659 -0.057126 0.016123serine protease inhibitor 3 96060_at -0.1149 0.105907 0.704471 0.51598 0.243607 -0.171611 0.011259 0.261642 0.146795 0.068531H2A histone family, member Z 101954_at 0.659509 0.279069 0.5634 0.455641 -0.249178 -0.314952 -0.021406 0.36532 0.373573 0.242264LIM and SH3 protein 1 93793_at 0.638188 0.618962 0.303879 0.290006 0.180075 0.573146 -0.151393 -0.06479 0.264351 -0.164695ESTs, Moderately similar to CLATHRIN LIGHT CHAIN B [Bos taurus] 98560_at 0.011214 0.151074 0.343781 0.290803 0.37096 0.153733 0.202178 0.198014 0.306193 0.367886
�ESTs, Weakly similar to A57514 RNA helicase HEL117 - rat [R.norvegicus] 94262_at 0.673917 0.088006 0.002481 0.377211 0.113569 -0.203984 0.244905 -0.622656 -0.504033 -0.286674claudin 5 104516_at 0.703511 -0.097526 0.24354 1.553236 -0.081718 0.092122 -0.133334 -0.535384 -0.144401 -0.708159purinergic receptor P2X, ligand-gated ion channel 4 95586_at 0.592462 0.515 -0.460356 0.689595 0.255272 0.002376 -0.001189 -0.035348 -0.235624 -0.111588enhancer of rudimentary homolog (Drosophila) 94040_at 0.294267 0.046761 0.425676 0.213538 0.13314 -0.442207 -0.245774 0.314302 0.117746 0.03601calpain 3 99812_at 0.550244 -0.354185 0.80203 0.893571 0.306193 0.054422 0.002805 0.030652 0.078781 0.464352ESTs, Weakly similar to hepatoma-derived growth factor [M.musculus] 97853_at 0.157151 0.321443 0.311188 0.401657 0.470418 -0.823757 -0.719129 0.059876 -0.144895 0.459595
Page 11
Sheehy et al. Comparison of Adaptive and Maladaptive Hypertrophy SUPPLEMENTAL MATERIAL
at Countw
ay Library of M
edicine on July 22, 2010 circgenetics.ahajournals.org
Dow
nloaded from
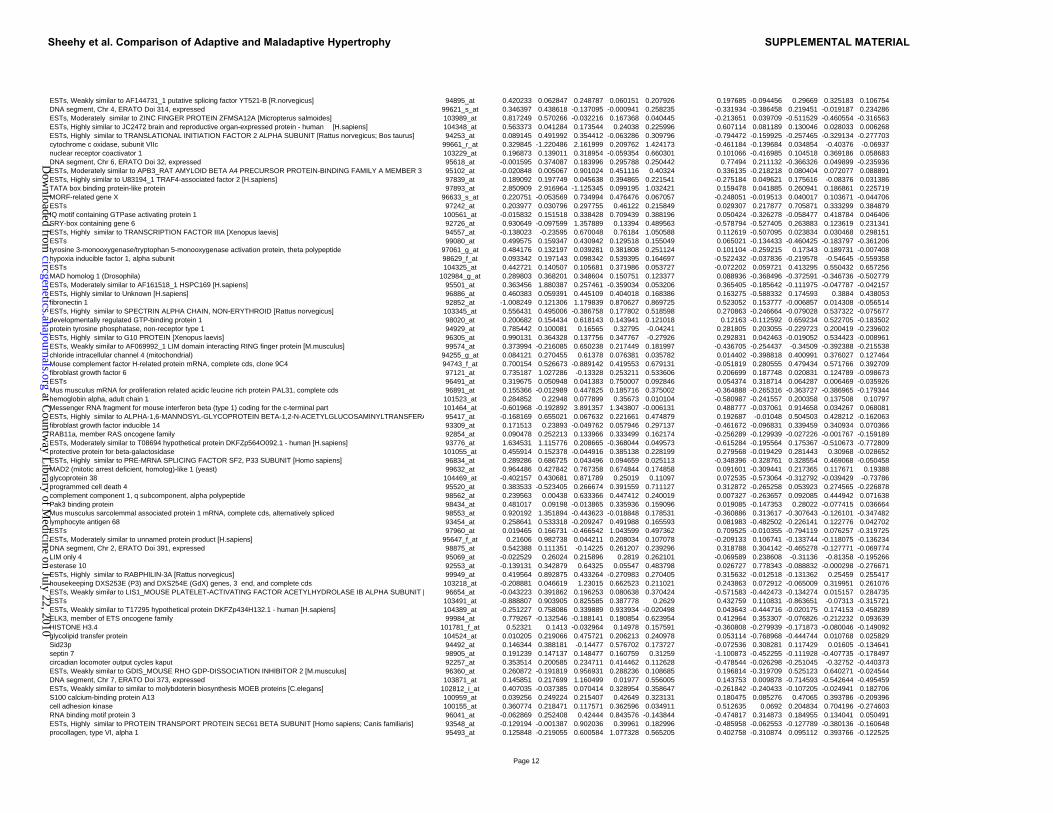
ESTs, Weakly similar to AF144731_1 putative splicing factor YT521-B [R.norvegicus] 94895_at 0.420233 0.062847 0.248787 0.060151 0.207926 0.197685 -0.094456 0.29669 0.325183 0.106754DNA segment, Chr 4, ERATO Doi 314, expressed 99621_s_at 0.346397 0.438618 -0.137095 -0.000941 0.258235 -0.331934 -0.386458 0.219451 -0.019187 0.234286ESTs, Moderately similar to ZINC FINGER PROTEIN ZFMSA12A [Micropterus salmoides] 103989_at 0.817249 0.570266 -0.032216 0.167368 0.040445 -0.213651 0.039709 -0.511529 -0.460554 -0.316563
�ESTs, Highly similar to JC2472 brain and reproductive organ-expressed protein - human [H.sapiens] 104348_at 0.563373 0.041284 0.173544 0.24038 0.225996 0.607114 0.081189 0.130046 0.028033 0.006268ESTs, Highly similar to TRANSLATIONAL INITIATION FACTOR 2 ALPHA SUBUNIT [Rattus norvegicus; Bos taurus] 94253_at 0.089145 0.491992 0.354412 -0.063286 0.309796 -0.794472 -0.159925 -0.257465 -0.329134 -0.277703cytochrome c oxidase, subunit VIIc 99661_r_at 0.329845 -1.220486 2.161999 0.209762 1.424173 -0.461184 -0.139684 0.034854 -0.40376 -0.06937nuclear receptor coactivator 1 103229_at 0.196873 0.139011 0.318954 -0.059354 0.660301 0.101066 -0.416985 0.104518 0.369186 0.058683DNA segment, Chr 6, ERATO Doi 32, expressed 95618_at -0.001595 0.374087 0.183996 0.295788 0.250442 0.77494 0.211132 -0.366326 0.049899 -0.235936ESTs, Moderately similar to APB3_RAT AMYLOID BETA A4 PRECURSOR PROTEIN-BINDING FAMILY A MEMBER 3 95102_at -0.020848 0.005067 0.901024 0.451116 0.40324 0.336135 -0.218218 0.080404 0.072077 0.088891ESTs, Highly similar to U83194_1 TRAF4-associated factor 2 [H.sapiens] 97839_at 0.189092 0.197749 0.045638 0.394865 0.221541 -0.275184 0.049621 0.175616 -0.08376 0.031386TATA box binding protein-like protein 97893_at 2.850909 2.916964 -1.125345 0.099195 1.032421 0.159478 0.041885 0.260941 0.186861 0.225719MORF-related gene X 96633_s_at 0.220751 -0.053569 0.734994 0.476476 0.067057 -0.248051 -0.019513 0.040017 0.103671 -0.044706ESTs 97242_at 0.203977 0.030796 0.297755 0.46122 0.215849 0.029307 0.217877 0.705871 0.333299 0.384879IQ motif containing GTPase activating protein 1 100561_at -0.015832 0.151518 0.338428 0.709439 0.388196 0.050424 -0.326278 -0.058477 0.418784 0.046406SRY-box containing gene 6 92726_at 0.930649 -0.097599 1.357889 0.13394 0.489563 -0.578794 -0.527405 0.263883 0.123619 0.231341ESTs, Highly similar to TRANSCRIPTION FACTOR IIIA [Xenopus laevis] 94557_at -0.138023 -0.23595 0.670048 0.76184 1.050588 0.112619 -0.507095 0.023834 0.030468 0.298151ESTs 99080_at 0.499575 0.159347 0.430942 0.129518 0.155049 0.065021 -0.134433 -0.460425 -0.183797 -0.361206tyrosine 3-monooxygenase/tryptophan 5-monooxygenase activation protein, theta polypeptide 97061_g_at 0.484176 0.132197 0.039281 0.381808 0.251124 0.101104 -0.259215 0.17343 0.189731 -0.007408hypoxia inducible factor 1, alpha subunit 98629_f_at 0.093342 0.197143 0.098342 0.539395 0.164697 -0.522432 -0.037836 -0.219578 -0.54645 -0.559358ESTs 104325_at 0.442721 0.140507 0.105681 0.371986 0.053727 -0.072202 0.059721 0.413295 0.550432 0.657256MAD homolog 1 (Drosophila) 102984_g_at 0.289803 0.368201 0.348604 0.150751 0.123377 0.088936 -0.368496 -0.372591 -0.346736 -0.502779ESTs, Moderately similar to AF161518_1 HSPC169 [H.sapiens] 95501_at 0.363456 1.880387 0.257461 -0.359034 0.053206 0.365405 -0.185642 -0.111975 -0.047787 -0.042157ESTs, Highly similar to Unknown [H.sapiens] 96886_at 0.460383 0.059391 0.445109 0.404018 0.168386 0.163275 -0.588332 0.174593 0.3884 0.438053fibronectin 1 92852_at -1.008249 0.121306 1.179839 0.870627 0.869725 0.523052 0.153777 -0.006857 0.014308 -0.056514ESTs, Highly similar to SPECTRIN ALPHA CHAIN, NON-ERYTHROID [Rattus norvegicus] 103345_at 0.556431 0.495006 -0.386758 0.177802 0.518598 0.270863 -0.246664 -0.079028 0.537322 -0.075677developmentally regulated GTP-binding protein 1 98020_at 0.200682 0.154434 0.618143 0.143941 0.121018 0.12163 -0.112592 0.659234 0.522705 -0.183502protein tyrosine phosphatase, non-receptor type 1 94929_at 0.785442 0.100081 0.16565 0.32795 -0.04241 0.281805 0.203055 -0.229723 0.200419 -0.239602ESTs, Highly similar to G10 PROTEIN [Xenopus laevis] 96305_at 0.990131 0.364328 0.137756 0.347767 -0.27926 0.292831 0.042463 -0.019052 0.534423 -0.008961ESTs, Weakly similar to AF069992_1 LIM domain interacting RING finger protein [M.musculus] 99574_at 0.373994 -0.216085 0.650238 0.217449 0.181997 -0.436705 -0.254437 -0.34509 -0.392388 -0.215538chloride intracellular channel 4 (mitochondrial) 94255_g_at 0.084121 0.270455 0.61378 0.076381 0.035782 0.014402 -0.398818 0.400991 0.376027 0.127464Mouse complement factor H-related protein mRNA, complete cds, clone 9C4 94743_f_at 0.700154 0.526673 -0.889142 0.419553 0.679131 -0.051819 0.280555 0.479434 0.571766 0.392709fibroblast growth factor 6 97121_at 0.735187 1.027286 -0.13328 0.253211 0.533606 0.206699 0.187748 0.020831 0.124789 -0.098673ESTs 96491_at 0.319675 0.050948 0.041383 0.750007 0.092846 0.054374 0.318714 0.064287 0.006469 -0.035926Mus musculus mRNA for proliferation related acidic leucine rich protein PAL31, complete cds 96891_at 0.155366 -0.012989 0.447825 0.185716 0.375002 -0.364888 -0.265316 -0.363727 -0.386965 -0.179344hemoglobin alpha, adult chain 1 101523_at 0.284852 0.22948 0.077899 0.35673 0.010104 -0.580987 -0.241557 0.200358 0.137508 0.10797Messenger RNA fragment for mouse interferon beta (type 1) coding for the c-terminal part 101464_at -0.601968 -0.192892 3.891357 1.343807 -0.006131 0.488777 -0.037061 0.914658 0.034267 0.068081ESTs, Highly similar to ALPHA-1,6-MANNOSYL-GLYCOPROTEIN BETA-1,2-N-ACETYLGLUCOSAMINYLTRANSFERA 95417_at -0.168169 0.655021 0.067632 0.221661 0.474879 0.192687 -0.01048 0.504503 0.428212 -0.162063fibroblast growth factor inducible 14 93309_at 0.171513 0.23893 -0.049762 0.057946 0.297137 -0.461672 -0.096831 0.339459 0.340934 0.070366RAB11a, member RAS oncogene family 92854_at 0.090478 0.252213 0.133966 0.333499 0.162174 -0.256289 -0.129939 -0.027226 -0.001767 -0.159189ESTs, Moderately similar to T08694 hypothetical protein DKFZp564O092.1 - human [H.sapiens] 93776_at 1.634531 1.115776 0.208665 -0.368044 0.049573 -0.615284 -0.195564 0.175367 -0.510673 -0.772809protective protein for beta-galactosidase 101055_at 0.455914 0.152378 -0.044916 0.385138 0.228199 0.279568 -0.019429 0.281443 0.30968 -0.028652ESTs, Highly similar to PRE-MRNA SPLICING FACTOR SF2, P33 SUBUNIT [Homo sapiens] 96834_at 0.289286 0.686725 0.043496 0.094659 0.025113 -0.348396 -0.328761 0.328554 0.469068 -0.050458MAD2 (mitotic arrest deficient, homolog)-like 1 (yeast) 99632_at 0.964486 0.427842 0.767358 0.674844 0.174858 0.091601 -0.309441 0.217365 0.117671 0.19388glycoprotein 38 104469_at -0.402157 0.430681 0.871789 0.25019 0.11097 0.072535 -0.573064 -0.312792 -0.039429 -0.73786programmed cell death 4 95520_at 0.383533 -0.523405 0.266674 0.391559 0.711127 0.312872 -0.265258 0.053923 0.274565 -0.226878complement component 1, q subcomponent, alpha polypeptide 98562_at 0.239563 0.00438 0.633366 0.447412 0.240019 0.007327 -0.263657 0.092085 0.444942 0.071638Pak3 binding protein 98434_at 0.481017 0.09198 -0.013865 0.335936 0.159096 0.019085 -0.147353 0.28022 -0.077415 0.036664Mus musculus sarcolemmal associated protein 1 mRNA, complete cds, alternatively spliced 98553_at 0.920192 1.351894 -0.443623 -0.018848 0.178531 -0.360886 0.313617 -0.307643 -0.126101 -0.347482lymphocyte antigen 68 93454_at 0.258641 0.533318 -0.209247 0.491988 0.165593 0.081983 -0.482502 -0.226141 0.122776 0.042702ESTs 97960_at 0.019465 0.166731 -0.466542 1.043599 0.497362 0.709525 -0.010355 -0.794119 0.076257 -0.319725ESTs, Moderately similar to unnamed protein product [H.sapiens] 95647_f_at 0.21606 0.982738 0.044211 0.208034 0.107078 -0.209133 0.106741 -0.133744 -0.118075 -0.136234DNA segment, Chr 2, ERATO Doi 391, expressed 98875_at 0.542388 0.111351 -0.14225 0.261207 0.239296 0.318788 0.304142 -0.465278 -0.127771 -0.069774LIM only 4 95069_at -0.022529 0.26024 0.215896 0.2819 0.262101 -0.069589 0.238608 -0.31136 -0.81358 -0.195266esterase 10 92553_at -0.139131 0.342879 0.64325 0.05547 0.483798 0.026727 0.778343 -0.088832 -0.000298 -0.276671ESTs, Highly similar to RABPHILIN-3A [Rattus norvegicus] 99949_at 0.419564 0.892875 0.433264 -0.270983 0.270405 0.315632 -0.012518 -0.131362 0.25459 0.255417housekeeping DXS253E (P3) and DXS254E (GdX) genes, 3 end, and complete cds 103218_at -0.208881 0.046619 1.23015 0.662523 0.211021 0.243863 0.072912 -0.065009 0.319951 0.261076ESTs, Weakly similar to LIS1_MOUSE PLATELET-ACTIVATING FACTOR ACETYLHYDROLASE IB ALPHA SUBUNIT [ 96654_at -0.043223 0.391862 0.196253 0.080638 0.370424 -0.571583 -0.442473 -0.134274 0.015157 0.284735ESTs 103491_at -0.888807 0.903905 0.825585 0.387778 0.2629 0.432759 0.110831 -0.863651 -0.07313 -0.315721ESTs, Weakly similar to T17295 hypothetical protein DKFZp434H132.1 - human [H.sapiens] 104389_at -0.251227 0.758086 0.339889 0.933934 -0.020498 0.043643 -0.444716 -0.020175 0.174153 -0.458289ELK3, member of ETS oncogene family 99984_at 0.779267 -0.132546 -0.188141 0.180854 0.623954 0.412964 0.353307 -0.076826 -0.212232 0.093639HISTONE H3.4 101781_f_at 0.52321 0.1413 -0.032964 0.14978 0.157591 -0.360808 -0.279939 -0.171873 -0.080046 -0.149092glycolipid transfer protein 104524_at 0.010205 0.219066 0.475721 0.206213 0.240978 0.053114 -0.768968 -0.444744 0.010768 0.025829Sid23p 94492_at 0.146344 0.388181 -0.14477 0.576702 0.173727 -0.072536 0.308281 0.117429 0.01605 -0.134641septin 7 98905_at 0.191239 0.147137 0.148477 0.160759 0.31259 -1.100873 -0.452255 -0.111928 -0.407735 -0.178497circadian locomoter output cycles kaput 92257_at 0.353514 0.200585 0.234711 0.414462 0.112628 -0.478544 -0.026298 -0.251045 -0.32752 -0.440373ESTs, Weakly similar to GDIS_MOUSE RHO GDP-DISSOCIATION INHIBITOR 2 [M.musculus] 96360_at 0.260872 -0.191819 0.956931 0.288236 0.108685 0.196814 -0.319709 0.525123 0.640271 -0.024544DNA segment, Chr 7, ERATO Doi 373, expressed 103871_at 0.145851 0.217699 1.160499 0.01977 0.556005 0.143753 0.009878 -0.714593 -0.542644 -0.495459ESTs, Weakly similar to similar to molybdoterin biosynthesis MOEB proteins [C.elegans] 102812_i_at 0.407035 -0.037385 0.070414 0.328954 0.358647 -0.261842 -0.240433 -0.107205 -0.024941 0.182706S100 calcium-binding protein A13 100959_at 0.039256 0.249224 0.215407 0.42649 0.323131 0.180475 0.085276 0.47065 0.393786 -0.209396cell adhesion kinase 100155_at 0.360774 0.218471 0.117571 0.362596 0.034911 0.512635 0.0692 0.204834 0.704196 -0.274603RNA binding motif protein 3 96041_at -0.062869 0.252408 0.42444 0.843576 -0.143844 -0.474817 0.314873 0.184955 0.134041 0.050491ESTs, Highly similar to PROTEIN TRANSPORT PROTEIN SEC61 BETA SUBUNIT [Homo sapiens; Canis familiaris] 93548_at -0.129194 -0.001387 0.902036 0.39961 0.182996 -0.485958 -0.062553 -0.127789 -0.380136 -0.160648procollagen, type VI, alpha 1 95493_at 0.125848 -0.219055 0.600584 1.077328 0.565205 0.402758 -0.310874 0.095112 0.393766 -0.122525
Page 12
Sheehy et al. Comparison of Adaptive and Maladaptive Hypertrophy SUPPLEMENTAL MATERIAL
at Countw
ay Library of M
edicine on July 22, 2010 circgenetics.ahajournals.org
Dow
nloaded from
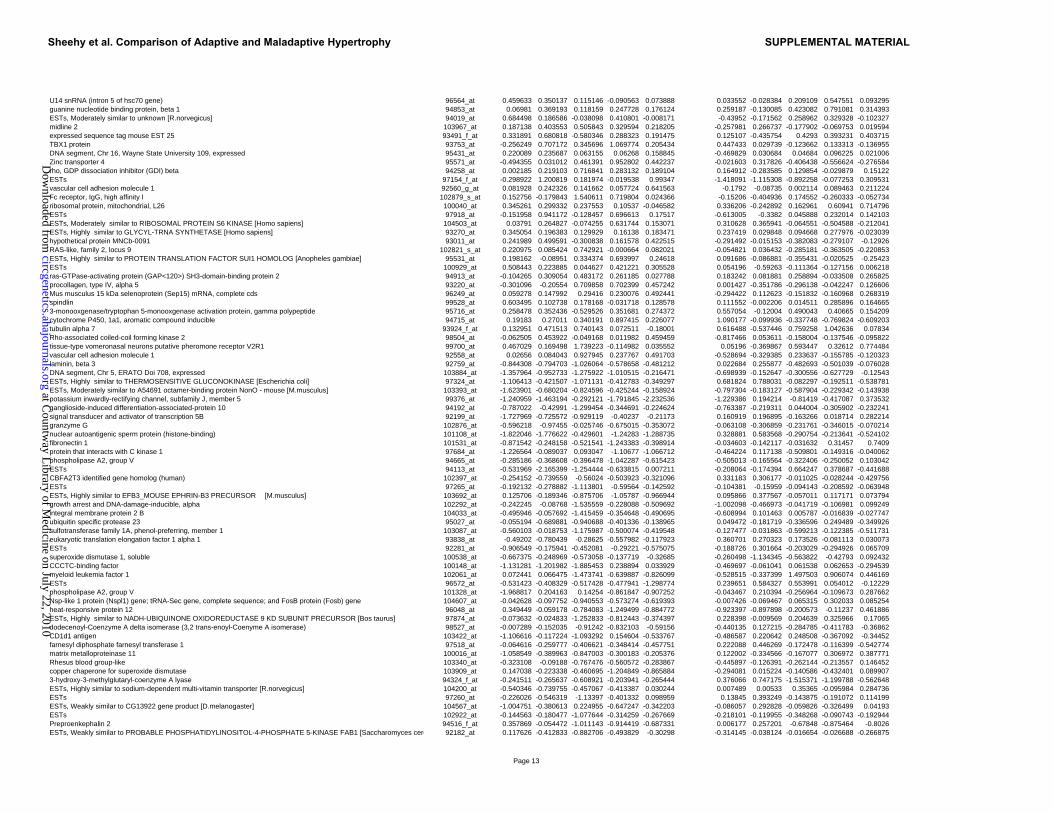
U14 snRNA (intron 5 of hsc70 gene) 96564_at 0.459633 0.350137 0.115146 -0.090563 0.073888 0.033552 -0.028384 0.209109 0.547551 0.093295guanine nucleotide binding protein, beta 1 94853_at 0.06981 0.369193 0.118159 0.247728 0.176124 0.259187 -0.130085 0.423082 0.791081 0.314393ESTs, Moderately similar to unknown [R.norvegicus] 94019_at 0.684498 0.186586 -0.038098 0.410801 -0.008171 -0.43952 -0.171562 0.258962 0.329328 -0.102327midline 2 103967_at 0.187138 0.403553 0.505843 0.329594 0.218205 -0.257981 0.266737 -0.177902 -0.069753 0.019594expressed sequence tag mouse EST 25 93491_f_at 0.331891 0.680818 -0.580346 0.288323 0.191475 0.125107 -0.435754 0.4293 0.393231 0.403715TBX1 protein 93753_at -0.256249 0.707172 0.345696 1.069774 0.205434 0.447433 0.029739 -0.123662 0.133313 -0.136955DNA segment, Chr 16, Wayne State University 109, expressed 95431_at 0.220089 0.235687 0.063155 0.06268 0.158845 -0.469829 0.030684 0.04684 0.096225 0.021006Zinc transporter 4 95571_at -0.494355 0.031012 0.461391 0.952802 0.442237 -0.021603 0.317826 -0.406438 -0.556624 -0.276584rho, GDP dissociation inhibitor (GDI) beta 94258_at 0.002185 0.219103 0.716841 0.283132 0.189104 0.164912 -0.283585 0.129854 -0.029879 0.15122ESTs 97154_f_at -0.298922 1.200819 0.181974 -0.019538 0.99347 -1.418091 -1.115308 -0.892258 -0.077253 0.309531vascular cell adhesion molecule 1 92560_g_at 0.081928 0.242326 0.141662 0.057724 0.641563 -0.1792 -0.08735 0.002114 0.089463 0.211224Fc receptor, IgG, high affinity I 102879_s_at 0.152756 -0.179843 1.540611 0.719804 0.024366 -0.15206 -0.404936 0.174552 -0.260333 -0.052734ribosomal protein, mitochondrial, L26 100040_at 0.345261 0.299332 0.237553 0.10537 -0.046582 0.336206 -0.242892 0.162961 0.60941 0.714796ESTs 97918_at -0.151958 0.941172 -0.128457 0.696613 0.17517 -0.613005 -0.3382 0.045888 0.232014 0.142103ESTs, Moderately similar to RIBOSOMAL PROTEIN S6 KINASE [Homo sapiens] 104503_at 0.03791 0.264827 -0.074255 0.631744 0.153071 0.310628 0.365941 -0.064551 -0.504588 -0.212041ESTs, Highly similar to GLYCYL-TRNA SYNTHETASE [Homo sapiens] 93270_at 0.345054 0.196383 0.129929 0.16138 0.183471 0.237419 0.029848 0.094668 0.277976 -0.023039hypothetical protein MNCb-0091 93011_at 0.241989 0.499591 -0.300838 0.161578 0.422515 -0.291492 -0.015153 -0.382083 -0.279107 -0.12926RAS-like, family 2, locus 9 102821_s_at 0.220975 0.085424 0.742921 -0.000664 0.082021 -0.054821 0.036432 -0.285181 -0.363505 -0.220853ESTs, Highly similar to PROTEIN TRANSLATION FACTOR SUI1 HOMOLOG [Anopheles gambiae] 95531_at 0.198162 -0.08951 0.334374 0.693997 0.24618 0.091686 -0.086881 -0.355431 -0.020525 -0.25423ESTs 100929_at 0.508443 0.223885 0.044627 0.421221 0.305528 0.054196 -0.59263 -0.111364 -0.127156 0.006218ras-GTPase-activating protein (GAP<120>) SH3-domain-binding protein 2 94913_at -0.104265 0.309054 0.483172 0.261185 0.027788 0.183242 0.081881 0.258894 -0.033508 0.265825procollagen, type IV, alpha 5 93220_at -0.301096 -0.20554 0.709858 0.702399 0.457242 0.001427 -0.351786 -0.296138 -0.042247 0.126606Mus musculus 15 kDa selenoprotein (Sep15) mRNA, complete cds 96249_at 0.059278 0.147992 0.29416 0.230076 0.492441 -0.294422 0.112623 -0.151832 -0.160968 0.268319spindlin 99528_at 0.603495 0.102738 0.178168 -0.031718 0.128578 0.111552 -0.002206 0.014511 0.285896 0.1646653-monooxgenase/tryptophan 5-monooxgenase activation protein, gamma polypeptide 95716_at 0.258478 0.352436 -0.529526 0.351681 0.274372 0.557054 -0.12004 0.490043 0.40665 0.154209cytochrome P450, 1a1, aromatic compound inducible 94715_at 0.19183 0.27011 0.340191 0.897415 0.226077 1.090177 -0.099936 -0.337748 -0.769824 -0.609203tubulin alpha 7 93924_f_at 0.132951 0.471513 0.740143 0.072511 -0.18001 0.616488 -0.537446 0.759258 1.042636 0.07834Rho-associated coiled-coil forming kinase 2 98504_at -0.062505 0.453922 -0.049168 0.011982 0.459459 -0.817466 0.053611 -0.158004 -0.137546 -0.095822tissue-type vomeronasal neurons putative pheromone receptor V2R1 99700_at 0.467029 0.169498 1.739223 -0.114982 0.035552 0.05196 -0.369867 0.593447 0.32612 0.774484vascular cell adhesion molecule 1 92558_at 0.02656 0.084043 0.927945 0.237767 0.491703 -0.528694 -0.329385 0.233637 -0.155785 -0.120323laminin, beta 3 92759_at -0.844308 -0.794703 -1.026064 -0.578658 -0.481212 0.022684 0.255877 -0.482693 -0.501039 -0.076028DNA segment, Chr 5, ERATO Doi 708, expressed 103884_at -1.357964 -0.952733 -1.275922 -1.010515 -0.216471 -0.698939 -0.152647 -0.300556 -0.627729 -0.12543ESTs, Highly similar to THERMOSENSITIVE GLUCONOKINASE [Escherichia coli] 97324_at -1.106413 -0.421507 -1.071131 -0.412783 -0.349297 0.681824 0.788031 -0.082297 -0.192511 -0.538781ESTs, Moderately similar to A54691 octamer-binding protein NonO - mouse [M.musculus] 103393_at -1.623901 -0.680204 -0.824596 -0.425244 -0.158924 -0.797304 -0.183127 -0.587904 -0.229342 -0.143938potassium inwardly-rectifying channel, subfamily J, member 5 99376_at -1.240959 -1.463194 -0.292121 -1.791845 -2.232536 -1.229386 0.194214 -0.81419 -0.417087 0.373532ganglioside-induced differentiation-associated-protein 10 94192_at -0.787022 -0.42991 -1.299454 -0.344691 -0.224624 -0.763387 -0.219311 0.044004 -0.305902 -0.232241signal transducer and activator of transcription 5B 92199_at -1.727969 -0.725572 -0.929119 -0.40237 -0.21173 0.160919 0.196895 -0.163266 0.018714 0.282214granzyme G 102876_at -0.596218 -0.97455 -0.025746 -0.675015 -0.353072 -0.063108 -0.306859 -0.231761 -0.346015 -0.070214nuclear autoantigenic sperm protein (histone-binding) 101108_at -1.822046 -1.776622 -0.429601 -1.24283 -1.288735 0.328881 0.583568 -0.290754 -0.213641 -0.524102fibronectin 1 101531_at -0.871542 -0.248158 -0.521541 -1.243383 -0.398914 -0.034603 -0.142117 -0.031632 0.31457 0.7409protein that interacts with C kinase 1 97684_at -1.226564 -0.089037 0.093047 -1.10677 -1.066712 -0.464224 0.117138 -0.509801 -0.149316 -0.040062phospholipase A2, group V 94665_at -0.285186 -0.368608 -0.396478 -1.042287 -0.615423 -0.505013 -0.165564 -0.322406 -0.250052 0.103042ESTs 94113_at -0.531969 -2.165399 -1.254444 -0.633815 0.007211 -0.208064 -0.174394 0.664247 0.378687 -0.441688CBFA2T3 identified gene homolog (human) 102397_at -0.254152 -0.739559 -0.56024 -0.503923 -0.321096 0.331183 0.306177 -0.011025 -0.028244 -0.429756ESTs 97265_at -0.192132 -0.278882 -1.113801 -0.59564 -0.142592 -0.104381 -0.15959 -0.094143 -0.208592 -0.063948
�ESTs, Highly similar to EFB3_MOUSE EPHRIN-B3 PRECURSOR [M.musculus] 103692_at 0.125706 -0.189346 -0.875706 -1.05787 -0.966944 0.095866 0.377567 -0.057011 0.117171 0.073794growth arrest and DNA-damage-inducible, alpha 102292_at -0.242245 -0.08768 -1.535559 -0.228088 -0.509692 -1.002098 -0.466973 -0.041719 -0.106981 0.099249integral membrane protein 2 B 104033_at -0.495946 -0.057692 -1.415459 -0.354648 -0.490695 -0.608994 0.101463 0.005787 -0.016839 -0.027747ubiquitin specific protease 23 95027_at -0.055194 -0.689881 -0.940688 -0.401336 -0.138965 0.049472 -0.181719 -0.336596 0.249489 -0.349926sulfotransferase family 1A, phenol-preferring, member 1 103087_at -0.560103 -0.018753 -1.175987 -0.500074 -0.419548 -0.127477 -0.031863 -0.599213 -0.122385 -0.511731eukaryotic translation elongation factor 1 alpha 1 93838_at -0.49202 -0.780439 -0.28625 -0.557982 -0.117923 0.360701 0.270323 0.173526 -0.081113 0.030073ESTs 92281_at -0.906549 -0.175941 -0.452081 -0.29221 -0.575075 -0.188726 0.301664 -0.203029 -0.294926 0.065709superoxide dismutase 1, soluble 100538_at -0.667375 -0.248969 -0.573058 -0.137719 -0.32685 -0.260498 -1.134345 -0.563822 -0.42793 0.092432CCCTC-binding factor 100148_at -1.131281 -1.201982 -1.885453 0.238894 0.033929 -0.469697 -0.061041 0.061538 0.062653 -0.294539myeloid leukemia factor 1 102061_at 0.072441 0.066475 -1.473741 -0.639887 -0.826099 -0.528515 -0.337399 1.497503 0.906074 0.446169ESTs 96572_at -0.531423 -0.408329 -0.517428 -0.477941 -1.298774 0.239651 0.584327 0.553991 0.054012 -0.12229phospholipase A2, group V 101328_at -1.968817 0.204163 0.14254 -0.861847 -0.907252 -0.043467 0.210394 -0.256964 -0.109673 0.287662Nsp-like 1 protein (Nspl1) gene; tRNA-Sec gene, complete sequence; and FosB protein (Fosb) gene 104607_at -0.042628 -0.097752 -0.940553 -0.573274 -0.619393 -0.007426 -0.069467 0.065315 0.302033 0.085254heat-responsive protein 12 96048_at 0.349449 -0.059178 -0.784083 -1.249499 -0.884772 -0.923397 -0.897898 -0.200573 -0.11237 0.461886ESTs, Highly similar to NADH-UBIQUINONE OXIDOREDUCTASE 9 KD SUBUNIT PRECURSOR [Bos taurus] 97874_at -0.073632 -0.024833 -1.252833 -0.812443 -0.374397 0.228398 -0.009569 0.204639 0.325966 0.17065dodecenoyl-Coenzyme A delta isomerase (3,2 trans-enoyl-Coenyme A isomerase) 98527_at -0.007289 -0.152035 -0.91242 -0.832103 -0.59156 -0.440135 0.127215 -0.284785 -0.411783 -0.36862CD1d1 antigen 103422_at -1.106616 -0.117224 -1.093292 0.154604 -0.533767 -0.486587 0.220642 0.248508 -0.367092 -0.34452farnesyl diphosphate farnesyl transferase 1 97518_at -0.064616 -0.259777 -0.406621 -0.348414 -0.457751 0.222088 0.446269 -0.172478 -0.116399 -0.542774matrix metalloproteinase 11 100016_at -1.058549 -0.389963 -0.847003 -0.300183 -0.205376 0.122002 -0.334566 -0.167077 0.306972 0.387771Rhesus blood group-like 103340_at -0.323108 -0.09188 -0.767476 -0.560572 -0.283867 -0.445897 -0.126391 -0.262144 -0.213557 0.146452copper chaperone for superoxide dismutase 103909_at 0.147038 -0.223338 -0.460695 -1.204849 -0.865884 -0.294081 0.015224 -0.140586 -0.432401 0.0899073-hydroxy-3-methylglutaryl-coenzyme A lyase 94324_f_at -0.241511 -0.265637 -0.608921 -0.203941 -0.265444 0.376066 0.747175 -1.515371 -1.199788 -0.562648ESTs, Highly similar to sodium-dependent multi-vitamin transporter [R.norvegicus] 104200_at -0.540346 -0.739755 -0.457067 -0.413387 0.030244 0.007489 0.00533 0.35365 -0.095984 0.284736ESTs 97260_at -0.226026 -0.546319 -1.13397 -0.401332 0.098959 0.13845 0.393249 -0.143875 -0.191072 0.114199ESTs, Weakly similar to CG13922 gene product [D.melanogaster] 104567_at -1.004751 -0.380613 0.224955 -0.647247 -0.342203 -0.086057 0.292828 -0.059826 -0.326499 0.04193ESTs 102922_at -0.144563 -0.180477 -1.077644 -0.314259 -0.267669 -0.218101 -0.119955 -0.348268 -0.090743 -0.192944Preproenkephalin 2 94516_f_at 0.357869 -0.054472 -1.011143 -0.914419 -0.687331 0.006177 0.257201 -0.67848 -0.875464 -0.8026ESTs, Weakly similar to PROBABLE PHOSPHATIDYLINOSITOL-4-PHOSPHATE 5-KINASE FAB1 [Saccharomyces cere 92182_at 0.117626 -0.412833 -0.882706 -0.493829 -0.30298 -0.314145 -0.038124 -0.016654 -0.026688 -0.266875
Page 13
Sheehy et al. Comparison of Adaptive and Maladaptive Hypertrophy SUPPLEMENTAL MATERIAL
at Countw
ay Library of M
edicine on July 22, 2010 circgenetics.ahajournals.org
Dow
nloaded from
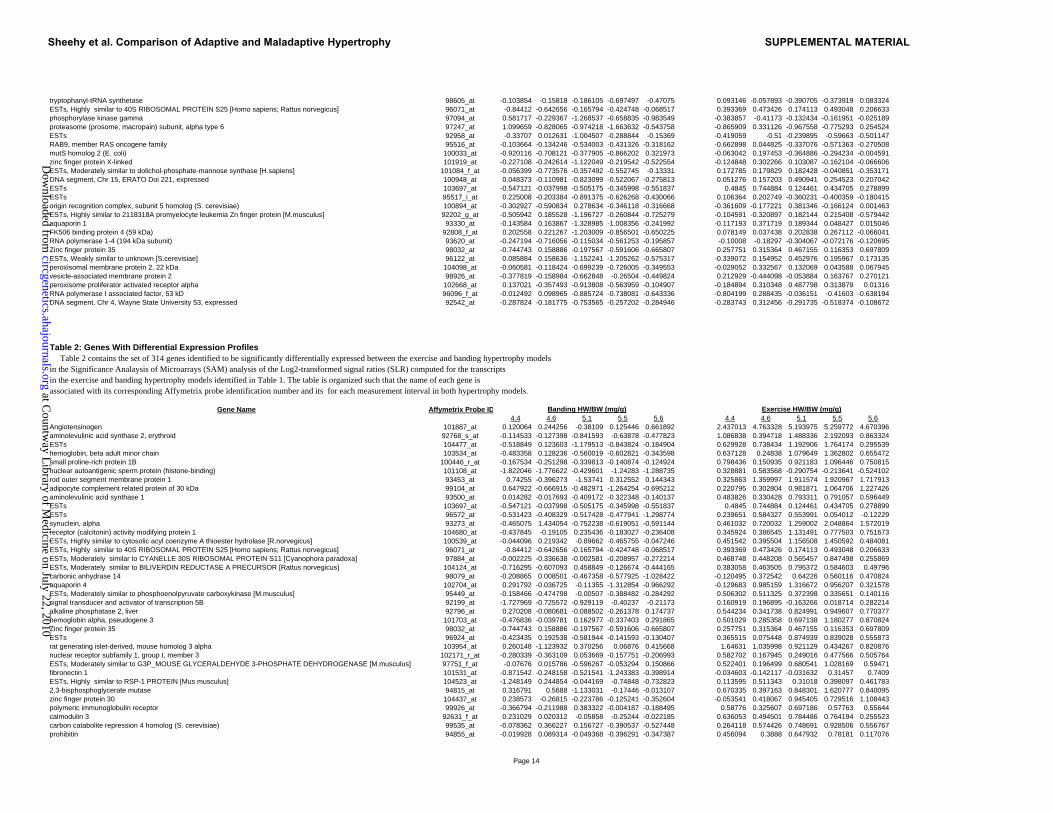
tryptophanyl-tRNA synthetase 98605_at -0.103854 -0.15818 -0.186105 -0.697497 -0.47075 0.093146 -0.057893 -0.390705 -0.373919 0.083324ESTs, Highly similar to 40S RIBOSOMAL PROTEIN S25 [Homo sapiens; Rattus norvegicus] 96071_at -0.84412 -0.642656 -0.165794 -0.424748 -0.068517 0.393369 0.473426 0.174113 0.493048 0.206633phosphorylase kinase gamma 97094_at 0.581717 -0.229367 -1.268537 -0.658835 -0.983549 -0.383857 -0.41173 -0.132434 -0.161951 -0.025189proteasome (prosome, macropain) subunit, alpha type 6 97247_at 1.099659 -0.828065 -0.974218 -1.663632 -0.543758 -0.865909 0.331126 -0.967558 -0.775293 0.254524ESTs 92958_at -0.33707 0.012631 -1.004507 -0.288844 -0.15369 -0.419059 -0.51 -0.239895 -0.59663 -0.501147RAB9, member RAS oncogene family 95516_at -0.103664 -0.134246 -0.534003 -0.431326 -0.318162 -0.662898 0.044825 -0.337076 -0.571363 -0.270508mutS homolog 2 (E. coli) 100033_at -0.920116 -0.708121 -0.377905 -0.866202 0.321973 -0.063042 0.197453 -0.364886 -0.294234 -0.004591zinc finger protein X-linked 101919_at -0.227108 -0.242614 -1.122049 -0.219542 -0.522554 -0.124848 0.302266 0.103087 -0.162104 -0.066606ESTs, Moderately similar to dolichol-phosphate-mannose synthase [H.sapiens] 101084_f_at -0.056399 -0.773576 -0.357492 -0.552745 -0.13331 0.172785 0.179829 0.182428 -0.040851 -0.353171DNA segment, Chr 15, ERATO Doi 221, expressed 100948_at 0.048373 -0.110981 -0.823099 -0.522067 -0.275813 0.051276 0.157203 0.490941 0.254523 0.207042ESTs 103697_at -0.547121 -0.037998 -0.505175 -0.345998 -0.551837 0.4845 0.744884 0.124461 0.434705 0.278899ESTs 95517_i_at 0.225008 -0.203384 -0.891375 -0.626268 -0.430066 0.106364 0.202749 -0.360231 -0.400359 -0.180415origin recognition complex, subunit 5 homolog (S. cerevisiae) 100894_at -0.302927 -0.590834 0.278634 -0.346118 -0.316668 -0.361609 -0.177221 0.381346 -0.166124 0.001463ESTs, Highly similar to 2118318A promyelocyte leukemia Zn finger protein [M.musculus] 92202_g_at -0.505942 0.185528 -1.196727 -0.260844 -0.725279 -0.104591 -0.320897 0.182144 0.215408 -0.579442aquaporin 1 93330_at -0.143584 0.163867 -1.328985 -1.008356 -0.241992 -0.117193 0.371719 0.189344 0.048427 0.015046FK506 binding protein 4 (59 kDa) 92808_f_at 0.202558 0.221267 -1.203009 -0.856501 -0.650225 0.078149 0.037438 0.202838 0.267112 -0.066041RNA polymerase 1-4 (194 kDa subunit) 93620_at -0.247194 -0.716056 -0.115034 -0.561253 -0.195857 -0.10008 -0.18297 -0.304067 -0.072176 -0.120695Zinc finger protein 35 98032_at -0.744743 0.158886 -0.197567 -0.591606 -0.665807 0.257751 0.315364 0.467155 0.116353 0.697809ESTs, Weakly similar to unknown [S.cerevisiae] 96122_at 0.085884 0.158636 -1.152241 -1.205262 -0.575317 -0.339072 0.154952 0.452976 0.195967 0.173135peroxisomal membrane protein 2, 22 kDa 104098_at -0.060581 -0.118424 -0.699239 -0.726005 -0.349553 -0.029052 0.332567 0.132069 0.043588 0.067945vesicle-associated membrane protein 2 98926_at -0.377819 -0.158984 -0.662848 -0.26504 -0.449824 0.212929 -0.444098 -0.053884 0.163767 0.270121peroxisome proliferator activated receptor alpha 102668_at 0.137021 -0.357493 -0.913808 -0.563959 -0.104907 -0.184894 0.310348 0.487798 0.313879 0.01316RNA polymerase I associated factor, 53 kD 96096_f_at -0.012492 0.098965 -0.885724 -0.738081 -0.643336 -0.804199 0.288435 -0.036151 -0.41603 -0.638194DNA segment, Chr 4, Wayne State University 53, expressed 92542_at -0.287824 -0.181775 -0.753565 -0.257202 -0.284946 -0.283743 0.312456 -0.291735 -0.518374 -0.108672
Table 2: Genes With Differential Expression Profiles Table 2 contains the set of 314 genes identified to be significantly differentially expressed between the exercise and banding hypertrophy models in the Significance Analaysis of Microarrays (SAM) analysis of the Log2-transformed signal ratios (SLR) computed for the transcripts in the exercise and banding hypertrophy models identified in Table 1. The table is organized such that the name of each gene isassociated with its corresponding Affymetrix probe identification number and its for each measurement interval in both hypertrophy models.
Gene Name Affymetrix Probe ID 4.4 4.6 5.1 5.5 5.6 4.4 4.6 5.1 5.5 5.6
Angiotensinogen 101887_at 0.120064 0.244256 -0.38109 0.125446 0.661892 2.437013 4.763328 5.193975 5.259772 4.670396aminolevulinic acid synthase 2, erythroid 92768_s_at -0.114533 -0.127398 -0.841593 -0.63878 -0.477823 1.086838 0.394718 1.488336 2.192093 0.863324ESTs 104477_at -0.518849 0.123603 -1.179513 -0.843824 -0.184904 0.629928 0.738434 1.192906 1.764174 0.295539hemoglobin, beta adult minor chain 103534_at -0.483358 0.128236 -0.560019 -0.602821 -0.343598 0.637128 0.24838 1.079649 1.362802 0.655472small proline-rich protein 1B 100446_r_at -0.167534 -0.251298 -0.339813 -0.140874 -0.124924 0.798436 0.150935 0.921183 1.096446 0.750815nuclear autoantigenic sperm protein (histone-binding) 101108_at -1.822046 -1.776622 -0.429601 -1.24283 -1.288735 0.328881 0.583568 -0.290754 -0.213641 -0.524102rod outer segment membrane protein 1 93453_at 0.74255 -0.396273 -1.53741 0.312552 0.144343 0.325863 1.359997 1.911574 1.920967 1.717913adipocyte complement related protein of 30 kDa 99104_at 0.647922 -0.666915 -0.482971 -1.264254 -0.695212 0.220795 0.302804 0.981871 1.064706 1.227426aminolevulinic acid synthase 1 93500_at 0.014282 -0.017693 -0.409172 -0.322348 -0.140137 0.483826 0.330428 0.793311 0.791057 0.596449ESTs 103697_at -0.547121 -0.037998 -0.505175 -0.345998 -0.551837 0.4845 0.744884 0.124461 0.434705 0.278899ESTs 96572_at -0.531423 -0.408329 -0.517428 -0.477941 -1.298774 0.239651 0.584327 0.553991 0.054012 -0.12229synuclein, alpha 93273_at -0.465075 1.434054 -0.752238 -0.619051 -0.591144 0.461032 0.720032 1.259002 2.048864 1.572019receptor (calcitonin) activity modifying protein 1 104680_at -0.437845 -0.19105 0.235436 -0.183027 -0.236408 0.345924 0.386545 1.131491 0.777503 0.751673ESTs, Highly similar to cytosolic acyl coenzyme A thioester hydrolase [R.norvegicus] 100539_at -0.044096 0.219342 -0.89662 -0.465755 -0.047246 0.451542 0.395504 1.156508 1.450592 0.484081ESTs, Highly similar to 40S RIBOSOMAL PROTEIN S25 [Homo sapiens; Rattus norvegicus] 96071_at -0.84412 -0.642656 -0.165794 -0.424748 -0.068517 0.393369 0.473426 0.174113 0.493048 0.206633ESTs, Moderately similar to CYANELLE 30S RIBOSOMAL PROTEIN S11 [Cyanophora paradoxa] 97884_at -0.002225 -0.336638 -0.002581 -0.208957 -0.272214 0.468748 0.448208 0.565457 0.847498 0.255869ESTs, Moderately similar to BILIVERDIN REDUCTASE A PRECURSOR [Rattus norvegicus] 104124_at -0.716295 -0.607093 0.458849 -0.126674 -0.444165 0.383058 0.463505 0.795372 0.584603 0.49796carbonic anhydrase 14 98079_at -0.208865 0.008501 -0.467358 -0.577925 -1.028422 -0.120495 0.372542 0.64226 0.560116 0.470824aquaporin 4 102704_at 0.291792 -0.036725 -0.11355 -1.312854 -0.966292 -0.129683 0.985159 1.316672 0.956207 0.321578ESTs, Moderately similar to phosphoenolpyruvate carboxykinase [M.musculus] 95449_at -0.158466 -0.474798 -0.00507 -0.388482 -0.284292 0.506302 0.511325 0.372398 0.335651 0.140116signal transducer and activator of transcription 5B 92199_at -1.727969 -0.725572 -0.929119 -0.40237 -0.21173 0.160919 0.196895 -0.163266 0.018714 0.282214alkaline phosphatase 2, liver 92796_at 0.270208 -0.080681 -0.088502 -0.261378 0.174737 0.544234 0.341738 0.824991 0.949607 0.770377hemoglobin alpha, pseudogene 3 101703_at -0.476836 -0.039781 0.162977 -0.337403 0.291865 0.501029 0.285358 0.697138 1.180277 0.870824Zinc finger protein 35 98032_at -0.744743 0.158886 -0.197567 -0.591606 -0.665807 0.257751 0.315364 0.467155 0.116353 0.697809ESTs 96924_at -0.423435 0.192538 -0.581944 -0.141593 -0.130407 0.365515 0.075448 0.874939 0.839028 0.555873rat generating islet-derived, mouse homolog 3 alpha 103954_at 0.260148 -1.123932 0.370256 0.06876 0.415668 1.64631 1.035998 0.921129 0.434267 0.820876nuclear receptor subfamily 1, group I, member 3 102171_r_at -0.280339 -0.363109 0.053669 -0.157751 -0.206993 0.582702 0.167945 0.249016 0.477566 0.505764ESTs, Moderately similar to G3P_MOUSE GLYCERALDEHYDE 3-PHOSPHATE DEHYDROGENASE [M.musculus] 97751_f_at -0.07676 0.015786 -0.596267 -0.053294 0.150866 0.522401 0.196499 0.680541 1.028169 0.59471fibronectin 1 101531_at -0.871542 -0.248158 -0.521541 -1.243383 -0.398914 -0.034603 -0.142117 -0.031632 0.31457 0.7409ESTs, Highly similar to RSP-1 PROTEIN [Mus musculus] 104523_at -1.248149 0.244854 -0.044169 -0.74848 -0.732823 0.113595 0.511343 0.31018 0.398097 0.4617832,3-bisphosphoglycerate mutase 94815_at 0.316791 0.5688 -1.133031 -0.17446 -0.013107 0.670335 0.397163 0.848301 1.620777 0.840095zinc finger protein 30 104437_at 0.238573 -0.26815 -0.223786 -0.125241 -0.352604 -0.053541 0.418067 0.945405 0.729516 1.108443polymeric immunoglobulin receptor 99926_at -0.366794 -0.211988 0.383322 -0.004187 -0.188495 0.58776 0.325607 0.697186 0.57763 0.55644calmodulin 3 92631_f_at 0.231029 0.020312 -0.05858 -0.25244 -0.022185 0.636053 0.494501 0.784486 0.764194 0.255523carbon catabolite repression 4 homolog (S. cerevisiae) 99535_at -0.078362 0.366227 0.156727 -0.390537 -0.527448 0.264118 0.574426 0.748691 0.928506 0.556767prohibitin 94855_at -0.019928 0.089314 -0.049368 -0.396291 -0.347387 0.456094 0.3888 0.647932 0.78181 0.117076
Banding HW/BW (mg/g) Exercise HW/BW (mg/g)
Page 14
Sheehy et al. Comparison of Adaptive and Maladaptive Hypertrophy SUPPLEMENTAL MATERIAL
at Countw
ay Library of M
edicine on July 22, 2010 circgenetics.ahajournals.org
Dow
nloaded from
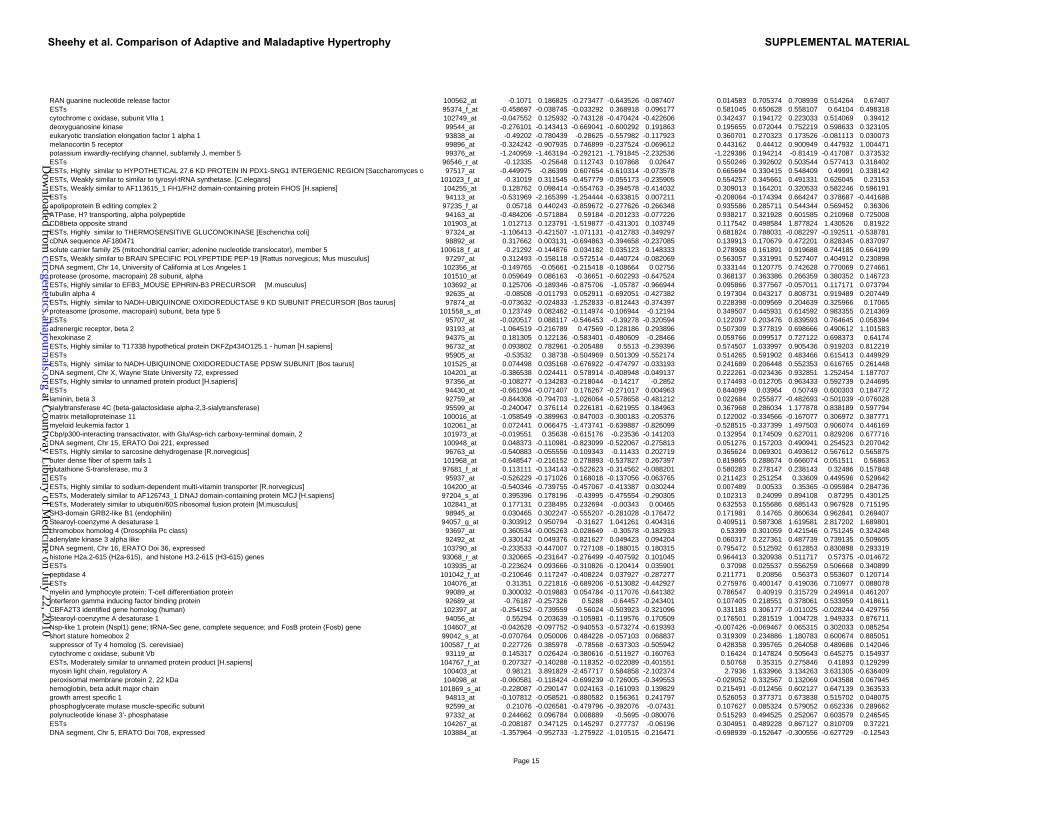
RAN guanine nucleotide release factor 100562_at -0.1071 0.186825 -0.273477 -0.643526 -0.087407 0.014583 0.705374 0.708939 0.514264 0.67407ESTs 95374_f_at -0.458697 -0.038745 -0.033292 0.368918 0.096177 0.581045 0.650628 0.558107 0.64104 0.498318cytochrome c oxidase, subunit VIIa 1 102749_at -0.047552 0.125932 -0.743128 -0.470424 -0.422606 0.342437 0.194172 0.223033 0.514069 0.39412deoxyguanosine kinase 99544_at -0.276101 -0.143413 -0.669041 -0.600292 0.191863 0.195655 0.072044 0.752219 0.598633 0.323105eukaryotic translation elongation factor 1 alpha 1 93838_at -0.49202 -0.780439 -0.28625 -0.557982 -0.117923 0.360701 0.270323 0.173526 -0.081113 0.030073melanocortin 5 receptor 99896_at -0.324242 -0.907935 0.746899 -0.237524 -0.069612 0.443162 0.44412 0.900949 0.447932 1.004471potassium inwardly-rectifying channel, subfamily J, member 5 99376_at -1.240959 -1.463194 -0.292121 -1.791845 -2.232536 -1.229386 0.194214 -0.81419 -0.417087 0.373532ESTs 96546_r_at -0.12335 -0.25648 0.112743 0.107868 0.02647 0.550246 0.392602 0.503544 0.577413 0.318402ESTs, Highly similar to HYPOTHETICAL 27.6 KD PROTEIN IN PDX1-SNG1 INTERGENIC REGION [Saccharomyces ce 97517_at -0.449975 -0.86399 0.607654 -0.610314 -0.073578 0.665694 0.330415 0.548409 0.49991 0.338142ESTs, Weakly similar to similar to tyrosyl-tRNA synthetase. [C.elegans] 101023_f_at -0.31019 0.311545 -0.457779 -0.055173 -0.235905 0.554257 0.345661 0.491331 0.626045 0.23153ESTs, Weakly similar to AF113615_1 FH1/FH2 domain-containing protein FHOS [H.sapiens] 104255_at 0.128762 0.098414 -0.554763 -0.394578 -0.414032 0.309013 0.164201 0.320533 0.582246 0.596191ESTs 94113_at -0.531969 -2.165399 -1.254444 -0.633815 0.007211 -0.208064 -0.174394 0.664247 0.378687 -0.441688apolipoprotein B editing complex 2 97235_f_at 0.05718 0.440243 -0.859672 -0.277626 -0.266348 0.935586 0.285711 0.544344 0.569452 0.36306ATPase, H? transporting, alpha polypeptide 94163_at -0.484206 -0.571884 0.59184 -0.201233 -0.077226 0.938217 0.321928 0.601585 0.210968 0.725008CD8beta opposite strand 101903_at 1.012713 0.123791 -1.519877 -0.431301 0.103749 0.117542 0.498584 1.877824 1.430526 0.81922ESTs, Highly similar to THERMOSENSITIVE GLUCONOKINASE [Escherichia coli] 97324_at -1.106413 -0.421507 -1.071131 -0.412783 -0.349297 0.681824 0.788031 -0.082297 -0.192511 -0.538781cDNA sequence AF180471 98892_at 0.317662 0.003131 -0.694863 -0.394658 -0.237085 0.139913 0.170679 0.472201 0.828345 0.837097solute carrier family 25 (mitochondrial carrier; adenine nucleotide translocator), member 5 100618_f_at -0.21292 -0.144876 0.034182 0.035123 0.148333 0.278908 0.161891 0.919688 0.744185 0.664199ESTs, Weakly similar to BRAIN SPECIFIC POLYPEPTIDE PEP-19 [Rattus norvegicus; Mus musculus] 97297_at 0.312493 -0.158118 -0.572514 -0.440724 -0.082069 0.563057 0.331991 0.527407 0.404912 0.230898DNA segment, Chr 14, University of California at Los Angeles 1 102356_at -0.149765 -0.05661 -0.215418 -0.108664 0.02756 0.333144 0.120775 0.742628 0.770069 0.274661protease (prosome, macropain) 28 subunit, alpha 101510_at 0.059649 0.086163 -0.36651 -0.602293 -0.647524 0.368137 0.363386 0.266359 0.380352 0.146723
�ESTs, Highly similar to EFB3_MOUSE EPHRIN-B3 PRECURSOR [M.musculus] 103692_at 0.125706 -0.189346 -0.875706 -1.05787 -0.966944 0.095866 0.377567 -0.057011 0.117171 0.073794tubulin alpha 4 92635_at -0.08508 -0.011793 0.052911 -0.692051 -0.427382 0.197304 0.043217 0.808731 0.919489 0.207449ESTs, Highly similar to NADH-UBIQUINONE OXIDOREDUCTASE 9 KD SUBUNIT PRECURSOR [Bos taurus] 97874_at -0.073632 -0.024833 -1.252833 -0.812443 -0.374397 0.228398 -0.009569 0.204639 0.325966 0.17065proteasome (prosome, macropain) subunit, beta type 5 101558_s_at 0.123749 0.082462 -0.114974 -0.106944 -0.12194 0.349507 0.445931 0.614592 0.983355 0.214369ESTs 95707_at -0.020517 0.088117 -0.546453 -0.39278 -0.320594 0.122097 0.203476 0.839593 0.764645 0.058394adrenergic receptor, beta 2 93193_at -1.064519 -0.216789 0.47569 -0.128186 0.293896 0.507309 0.377819 0.698666 0.490612 1.101583hexokinase 2 94375_at 0.181305 0.122136 -0.583401 -0.480609 -0.28466 0.059766 0.099517 0.727122 0.698373 0.64174ESTs, Highly similar to T17338 hypothetical protein DKFZp434O125.1 - human [H.sapiens] 96732_at 0.093802 0.782961 -0.205488 0.5513 -0.239396 0.574507 1.033997 0.905436 0.919203 0.812219ESTs 95905_at -0.53532 0.38738 -0.504969 0.501309 -0.552174 0.514265 0.591902 0.483466 0.615413 0.449929ESTs, Highly similar to NADH-UBIQUINONE OXIDOREDUCTASE PDSW SUBUNIT [Bos taurus] 101525_at 0.074498 0.035168 -0.676922 -0.474797 -0.033193 0.241689 0.206448 0.552353 0.616765 0.261448DNA segment, Chr X, Wayne State University 72, expressed 104201_at -0.386538 0.024411 0.578914 -0.408948 -0.049137 0.222261 -0.023436 0.932851 1.252454 1.187707ESTs, Highly similar to unnamed protein product [H.sapiens] 97356_at -0.108277 -0.134283 -0.218044 -0.14217 -0.2852 0.174493 -0.012705 0.963433 0.592739 0.244695ESTs 94430_at -0.661094 -0.071407 0.176267 -0.271017 0.004963 0.844099 0.03964 0.50749 0.600303 0.184772laminin, beta 3 92759_at -0.844308 -0.794703 -1.026064 -0.578658 -0.481212 0.022684 0.255877 -0.482693 -0.501039 -0.076028sialyltransferase 4C (beta-galactosidase alpha-2,3-sialytransferase) 95599_at -0.240047 0.376114 0.226181 -0.621955 0.184963 0.367968 0.286034 1.177878 0.838189 0.597794matrix metalloproteinase 11 100016_at -1.058549 -0.389963 -0.847003 -0.300183 -0.205376 0.122002 -0.334566 -0.167077 0.306972 0.387771myeloid leukemia factor 1 102061_at 0.072441 0.066475 -1.473741 -0.639887 -0.826099 -0.528515 -0.337399 1.497503 0.906074 0.446169Cbp/p300-interacting transactivator, with Glu/Asp-rich carboxy-terminal domain, 2 101973_at -0.019551 0.35638 -0.615176 -0.23536 -0.141203 0.132954 0.174509 0.627011 0.829206 0.677716DNA segment, Chr 15, ERATO Doi 221, expressed 100948_at 0.048373 -0.110981 -0.823099 -0.522067 -0.275813 0.051276 0.157203 0.490941 0.254523 0.207042ESTs, Highly similar to sarcosine dehydrogenase [R.norvegicus] 96763_at -0.540883 -0.055556 -0.109343 -0.11433 0.202719 0.365624 0.069301 0.493612 0.567612 0.565875outer dense fiber of sperm tails 1 101968_at -0.648547 -0.216152 0.278893 -0.537827 0.267397 0.819865 0.288674 0.666074 0.051511 0.56863glutathione S-transferase, mu 3 97681_f_at 0.113111 -0.134143 -0.522623 -0.314562 -0.088201 0.580283 0.278147 0.238143 0.32486 0.157848ESTs 95937_at -0.526229 -0.171026 0.168018 -0.137056 -0.063765 0.211423 0.251254 0.33609 0.449596 0.529642ESTs, Highly similar to sodium-dependent multi-vitamin transporter [R.norvegicus] 104200_at -0.540346 -0.739755 -0.457067 -0.413387 0.030244 0.007489 0.00533 0.35365 -0.095984 0.284736ESTs, Moderately similar to AF126743_1 DNAJ domain-containing protein MCJ [H.sapiens] 97204_s_at 0.395396 0.178196 -0.43995 -0.475554 -0.290305 0.102313 0.24099 0.894108 0.87295 0.430125ESTs, Moderately similar to ubiquitin/60S ribosomal fusion protein [M.musculus] 102841_at 0.177131 0.238495 0.232694 -0.00343 0.00465 0.632553 0.155686 0.685143 0.967928 0.715195SH3-domain GRB2-like B1 (endophilin) 98945_at 0.030465 0.302247 -0.555207 -0.281028 -0.176472 0.171981 0.14765 0.860634 0.962841 0.269407Stearoyl-coenzyme A desaturase 1 94057_g_at 0.303912 0.950794 -0.31627 1.041261 0.404316 0.409511 0.587308 1.619581 2.817202 1.689801chromobox homolog 4 (Drosophila Pc class) 93697_at 0.360534 -0.005263 -0.028649 -0.30578 -0.182933 0.53399 0.301059 0.421546 0.751245 0.324248adenylate kinase 3 alpha like 92492_at -0.330142 0.049376 -0.821627 0.049423 0.094204 0.060317 0.227361 0.487739 0.739135 0.509605DNA segment, Chr 16, ERATO Doi 36, expressed 103790_at -0.233533 -0.447007 0.727108 -0.188015 0.180315 0.795472 0.512592 0.612853 0.830898 0.293319histone H2a.2-615 (H2a-615), and histone H3.2-615 (H3-615) genes 93068_r_at 0.320665 -0.231647 -0.276499 -0.407592 0.101045 0.964413 0.320938 0.511717 0.57375 -0.014672ESTs 103935_at -0.223624 0.093666 -0.310826 -0.120414 0.035901 0.37098 0.025537 0.556259 0.506668 0.340899peptidase 4 101042_f_at -0.210646 0.117247 -0.408224 0.037927 -0.287277 0.211771 0.20856 0.56373 0.553607 0.120714ESTs 104076_at 0.31351 0.221816 -0.689206 -0.513082 -0.442927 0.275976 0.400147 0.419036 0.710977 0.088078myelin and lymphocyte protein; T-cell differentiation protein 99089_at 0.300032 -0.019883 0.054784 -0.117076 -0.641382 0.786547 0.40919 0.315729 0.249914 0.461207interferon gamma inducing factor binding protein 92689_at -0.76187 -0.257326 0.5288 -0.64457 -0.243401 0.107405 0.218551 0.378061 0.533959 0.418611CBFA2T3 identified gene homolog (human) 102397_at -0.254152 -0.739559 -0.56024 -0.503923 -0.321096 0.331183 0.306177 -0.011025 -0.028244 -0.429756Stearoyl-coenzyme A desaturase 1 94056_at 0.55294 0.203639 -0.105981 -0.119576 0.170509 0.176501 0.281519 1.004728 1.949333 0.876711Nsp-like 1 protein (Nspl1) gene; tRNA-Sec gene, complete sequence; and FosB protein (Fosb) gene 104607_at -0.042628 -0.097752 -0.940553 -0.573274 -0.619393 -0.007426 -0.069467 0.065315 0.302033 0.085254short stature homeobox 2 99042_s_at -0.070764 0.050006 0.484228 -0.057103 0.068837 0.319309 0.234886 1.180783 0.600674 0.885051suppressor of Ty 4 homolog (S. cerevisiae) 100587_f_at 0.227726 0.385978 -0.78568 -0.637303 -0.505942 0.428358 0.395765 0.264058 0.489686 0.142046cytochrome c oxidase, subunit Vb 93119_at 0.145317 0.026424 -0.380616 -0.511927 -0.160763 0.16424 0.147824 0.505643 0.645275 0.154937ESTs, Moderately similar to unnamed protein product [H.sapiens] 104767_f_at 0.207327 -0.140288 -0.118352 -0.022089 -0.401551 0.50768 0.35315 0.275846 0.41893 0.129299myosin light chain, regulatory A 100403_at 0.98121 3.891829 -2.457717 0.584858 -2.102374 2.7936 1.633966 3.134263 3.631305 -0.636409peroxisomal membrane protein 2, 22 kDa 104098_at -0.060581 -0.118424 -0.699239 -0.726005 -0.349553 -0.029052 0.332567 0.132069 0.043588 0.067945hemoglobin, beta adult major chain 101869_s_at -0.228087 -0.290147 0.024163 -0.161093 0.139829 0.215491 -0.012456 0.602127 0.647139 0.363533growth arrest specific 1 94813_at -0.107812 -0.058521 -0.880582 0.156361 0.241797 0.526053 0.377371 0.673838 0.515702 0.048075phosphoglycerate mutase muscle-specific subunit 92599_at 0.21076 -0.026581 -0.479796 -0.392076 -0.07431 0.107627 0.085324 0.579052 0.652336 0.289662polynucleotide kinase 3'- phosphatase 97332_at 0.244662 0.096784 0.008889 -0.5695 -0.080076 0.515293 0.494525 0.252067 0.603579 0.246545ESTs 104267_at -0.208187 0.347125 0.145297 0.277737 -0.06196 0.304951 0.489228 0.867127 0.810709 0.37221DNA segment, Chr 5, ERATO Doi 708, expressed 103884_at -1.357964 -0.952733 -1.275922 -1.010515 -0.216471 -0.698939 -0.152647 -0.300556 -0.627729 -0.12543
Page 15
Sheehy et al. Comparison of Adaptive and Maladaptive Hypertrophy SUPPLEMENTAL MATERIAL
at Countw
ay Library of M
edicine on July 22, 2010 circgenetics.ahajournals.org
Dow
nloaded from
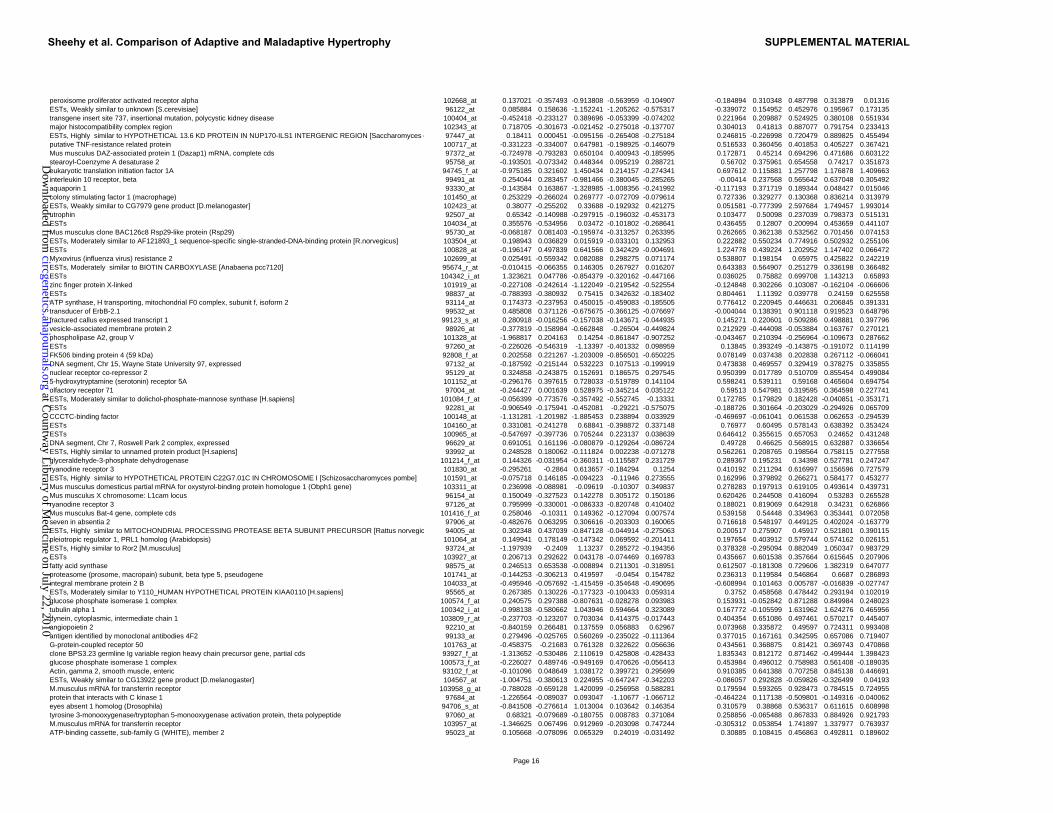
peroxisome proliferator activated receptor alpha 102668_at 0.137021 -0.357493 -0.913808 -0.563959 -0.104907 -0.184894 0.310348 0.487798 0.313879 0.01316ESTs, Weakly similar to unknown [S.cerevisiae] 96122_at 0.085884 0.158636 -1.152241 -1.205262 -0.575317 -0.339072 0.154952 0.452976 0.195967 0.173135transgene insert site 737, insertional mutation, polycystic kidney disease 100404_at -0.452418 -0.233127 0.389696 -0.053399 -0.074202 0.221964 0.209887 0.524925 0.380108 0.551934major histocompatibility complex region 102343_at 0.718705 -0.301673 -0.021452 -0.275018 -0.137707 0.304013 0.41813 0.887077 0.791754 0.233413ESTs, Highly similar to HYPOTHETICAL 13.6 KD PROTEIN IN NUP170-ILS1 INTERGENIC REGION [Saccharomyces c 97447_at 0.18411 0.000451 -0.095156 -0.265408 -0.275184 0.246815 -0.226998 0.720479 0.889825 0.455494putative TNF-resistance related protein 100717_at -0.331223 -0.334007 0.647981 -0.198925 -0.146079 0.516533 0.360456 0.401853 0.405227 0.367421Mus musculus DAZ-associated protein 1 (Dazap1) mRNA, complete cds 97372_at -0.724978 -0.793283 0.650104 0.400943 -0.185995 0.172871 0.45214 0.694296 0.471686 0.603122stearoyl-Coenzyme A desaturase 2 95758_at -0.193501 -0.073342 0.448344 0.095219 0.288721 0.56702 0.375961 0.654558 0.74217 0.351873eukaryotic translation initiation factor 1A 94745_f_at -0.975185 0.321602 1.450434 0.214157 -0.274341 0.697612 0.115881 1.257798 1.176878 1.409663interleukin 10 receptor, beta 99491_at 0.254044 0.283457 -0.981466 -0.380045 -0.285265 -0.00414 0.237568 0.565642 0.637048 0.305492aquaporin 1 93330_at -0.143584 0.163867 -1.328985 -1.008356 -0.241992 -0.117193 0.371719 0.189344 0.048427 0.015046colony stimulating factor 1 (macrophage) 101450_at 0.253229 -0.266024 0.269777 -0.072709 -0.079614 0.727336 0.329277 0.130368 0.836214 0.313979ESTs, Weakly similar to CG7979 gene product [D.melanogaster] 102423_at 0.38077 -0.255202 0.33688 -0.192932 0.421275 0.051581 -0.777399 2.597684 1.749457 1.993014utrophin 92507_at 0.65342 -0.140988 -0.297915 -0.196032 -0.453173 0.103477 0.50098 0.237039 0.798373 0.515131ESTs 104034_at 0.355576 -0.534956 0.03472 -0.101802 -0.268641 0.436455 0.12807 0.200994 0.453659 0.441107Mus musculus clone BAC126c8 Rsp29-like protein (Rsp29) 95730_at -0.068187 0.081403 -0.195974 -0.313257 0.263395 0.262665 0.362138 0.532562 0.701456 0.074153ESTs, Moderately similar to AF121893_1 sequence-specific single-stranded-DNA-binding protein [R.norvegicus] 103504_at 0.198943 0.036829 0.015919 -0.033101 0.132953 0.222882 0.550234 0.774916 0.502932 0.255106ESTs 100828_at -0.196147 0.497839 0.641566 0.342429 -0.004691 1.224778 0.439224 1.202952 1.147402 0.066472Myxovirus (influenza virus) resistance 2 102699_at 0.025491 -0.559342 0.082088 0.298275 0.071174 0.538807 0.198154 0.65975 0.425822 0.242219ESTs, Moderately similar to BIOTIN CARBOXYLASE [Anabaena pcc7120] 95674_r_at -0.010415 -0.066355 0.146305 0.267927 0.016207 0.643383 0.564907 0.251279 0.336198 0.366482ESTs 104342_i_at 1.323621 0.047786 -0.854379 -0.320162 -0.447166 0.036025 0.75882 0.699708 1.143213 0.65893zinc finger protein X-linked 101919_at -0.227108 -0.242614 -1.122049 -0.219542 -0.522554 -0.124848 0.302266 0.103087 -0.162104 -0.066606ESTs 98837_at -0.788393 -0.380932 0.75415 0.342632 -0.183402 0.804461 1.11392 0.039778 0.24159 0.625558ATP synthase, H transporting, mitochondrial F0 complex, subunit f, isoform 2 93114_at 0.174373 -0.237953 0.450015 -0.459083 -0.185505 0.776412 0.220945 0.446631 0.206845 0.391331transducer of ErbB-2.1 99532_at 0.485808 0.371126 -0.675675 -0.366125 -0.076697 -0.004044 0.138391 0.901118 0.919523 0.648796fractured callus expressed transcript 1 99123_s_at 0.280918 -0.016256 -0.157038 -0.143671 -0.044935 0.145271 0.220601 0.509286 0.498881 0.397796vesicle-associated membrane protein 2 98926_at -0.377819 -0.158984 -0.662848 -0.26504 -0.449824 0.212929 -0.444098 -0.053884 0.163767 0.270121phospholipase A2, group V 101328_at -1.968817 0.204163 0.14254 -0.861847 -0.907252 -0.043467 0.210394 -0.256964 -0.109673 0.287662ESTs 97260_at -0.226026 -0.546319 -1.13397 -0.401332 0.098959 0.13845 0.393249 -0.143875 -0.191072 0.114199FK506 binding protein 4 (59 kDa) 92808_f_at 0.202558 0.221267 -1.203009 -0.856501 -0.650225 0.078149 0.037438 0.202838 0.267112 -0.066041DNA segment, Chr 15, Wayne State University 97, expressed 97132_at -0.187592 -0.215144 0.532223 0.107513 -0.199919 0.473838 0.469557 0.329419 0.378275 0.335855nuclear receptor co-repressor 2 95129_at 0.324858 -0.243875 0.152691 0.186575 0.297545 0.950399 0.017789 0.510709 0.855454 0.4990845-hydroxytryptamine (serotonin) receptor 5A 101152_at -0.296176 0.397615 0.728033 -0.519789 0.141104 0.598241 0.539111 0.59168 0.465604 0.694754olfactory receptor 71 97004_at -0.244427 0.001639 0.528975 -0.345214 0.035122 0.59513 0.547981 0.319595 0.364598 0.227741ESTs, Moderately similar to dolichol-phosphate-mannose synthase [H.sapiens] 101084_f_at -0.056399 -0.773576 -0.357492 -0.552745 -0.13331 0.172785 0.179829 0.182428 -0.040851 -0.353171ESTs 92281_at -0.906549 -0.175941 -0.452081 -0.29221 -0.575075 -0.188726 0.301664 -0.203029 -0.294926 0.065709CCCTC-binding factor 100148_at -1.131281 -1.201982 -1.885453 0.238894 0.033929 -0.469697 -0.061041 0.061538 0.062653 -0.294539ESTs 104160_at 0.331081 -0.241278 0.68841 -0.398872 0.337148 0.76977 0.60495 0.578143 0.638392 0.353424ESTs 100965_at -0.547697 -0.397736 0.705244 0.223137 0.038639 0.646412 0.355615 0.657053 0.24652 0.431248DNA segment, Chr 7, Roswell Park 2 complex, expressed 96629_at 0.691051 0.161196 -0.080879 -0.129264 -0.086724 0.49728 0.46625 0.568915 0.632887 0.336654ESTs, Highly similar to unnamed protein product [H.sapiens] 93992_at 0.248528 0.180062 -0.111824 0.002238 -0.071278 0.562261 0.208765 0.198564 0.758115 0.277558glyceraldehyde-3-phosphate dehydrogenase 101214_f_at 0.144326 -0.031954 -0.360311 -0.115587 0.231729 0.289367 0.195231 0.34398 0.527781 0.247247ryanodine receptor 3 101830_at -0.295261 -0.2864 0.613657 -0.184294 0.1254 0.410192 0.211294 0.616997 0.156596 0.727579ESTs, Highly similar to HYPOTHETICAL PROTEIN C22G7.01C IN CHROMOSOME I [Schizosaccharomyces pombe] 101591_at -0.075718 0.146185 -0.094223 -0.11946 0.273555 0.162996 0.379892 0.266271 0.584177 0.453277Mus musculus domesticus partial mRNA for oxystyrol-binding protein homologue 1 (Obph1 gene) 103311_at 0.236998 -0.088981 -0.09619 -0.10307 0.349837 0.278283 0.197913 0.619105 0.493614 0.439731Mus musculus X chromosome: L1cam locus 96154_at 0.150049 -0.327523 0.142278 0.305172 0.150186 0.620426 0.244508 0.416094 0.53283 0.265528ryanodine receptor 3 97126_at 0.795999 -0.330001 -0.086333 -0.820748 0.410402 0.188021 0.819069 0.642918 0.34231 0.626866Mus musculus Bat-4 gene, complete cds 101416_f_at 0.258046 -0.10311 0.149362 -0.127094 0.007574 0.539158 0.54448 0.334963 0.353441 0.072058seven in absentia 2 97906_at -0.482676 0.063295 0.306616 -0.203303 0.160065 0.716618 0.548197 0.449125 0.402024 -0.163779ESTs, Highly similar to MITOCHONDRIAL PROCESSING PROTEASE BETA SUBUNIT PRECURSOR [Rattus norvegic 94005_at 0.302348 0.437039 -0.847128 -0.044914 -0.275063 0.200517 0.275907 0.45917 0.521801 0.390115pleiotropic regulator 1, PRL1 homolog (Arabidopsis) 101064_at 0.149941 0.178149 -0.147342 0.069592 -0.201411 0.197654 0.403912 0.579744 0.574162 0.026151ESTs, Highly similar to Ror2 [M.musculus] 93724_at -1.197939 -0.2409 1.13237 0.285272 -0.194356 0.378328 -0.295094 0.882049 1.050347 0.983729ESTs 103927_at 0.206713 0.292622 0.043178 -0.074469 0.169783 0.435667 0.601538 0.357664 0.615645 0.207906fatty acid synthase 98575_at 0.246513 0.653538 -0.008894 0.211301 -0.318951 0.612507 -0.181308 0.729606 1.382319 0.647077proteasome (prosome, macropain) subunit, beta type 5, pseudogene 101741_at -0.144253 -0.306213 0.419597 -0.0454 0.154782 0.236313 0.119584 0.546864 0.6687 0.286893integral membrane protein 2 B 104033_at -0.495946 -0.057692 -1.415459 -0.354648 -0.490695 -0.608994 0.101463 0.005787 -0.016839 -0.027747ESTs, Moderately similar to Y110_HUMAN HYPOTHETICAL PROTEIN KIAA0110 [H.sapiens] 95565_at 0.267385 0.130226 -0.177323 -0.100433 0.059314 0.3752 0.458568 0.478442 0.293194 0.102019glucose phosphate isomerase 1 complex 100574_f_at 0.240575 0.297388 -0.807631 -0.028278 0.093983 0.153931 -0.052842 0.871288 0.849984 0.248023tubulin alpha 1 100342_i_at -0.998138 -0.580662 1.043946 0.594664 0.323089 0.167772 -0.105599 1.631962 1.624276 0.465956dynein, cytoplasmic, intermediate chain 1 103809_r_at -0.237703 -0.123207 0.703034 0.414375 -0.017443 0.404354 0.651086 0.497461 0.570217 0.445407angiopoietin 2 92210_at -0.840159 0.266481 0.137559 0.056883 0.62967 0.073968 0.335872 0.49597 0.724311 0.993408antigen identified by monoclonal antibodies 4F2 99133_at 0.279496 -0.025765 0.560269 -0.235022 -0.111364 0.377015 0.167161 0.342595 0.657086 0.719407G-protein-coupled receptor 50 101763_at -0.458375 -0.21683 0.761328 0.322622 0.056636 0.434561 0.368875 0.81421 0.369743 0.470868clone BPS3.23 germline Ig variable region heavy chain precursor gene, partial cds 93927_f_at -1.313652 -0.530486 2.110619 0.425808 -0.428433 1.835343 0.812172 0.871462 -0.499444 1.398423glucose phosphate isomerase 1 complex 100573_f_at -0.226027 0.489746 -0.949169 0.470626 -0.056413 0.453984 0.496012 0.758983 0.561408 -0.189035Actin, gamma 2, smooth muscle, enteric 93102_f_at -0.101096 0.048649 1.038172 0.399721 0.295699 0.910385 0.641388 0.707258 0.845138 0.446691ESTs, Weakly similar to CG13922 gene product [D.melanogaster] 104567_at -1.004751 -0.380613 0.224955 -0.647247 -0.342203 -0.086057 0.292828 -0.059826 -0.326499 0.04193M.musculus mRNA for transferrin receptor 103958_g_at -0.788028 -0.659128 1.420099 -0.256958 0.588281 0.179594 0.593265 0.928473 0.784515 0.724955protein that interacts with C kinase 1 97684_at -1.226564 -0.089037 0.093047 -1.10677 -1.066712 -0.464224 0.117138 -0.509801 -0.149316 -0.040062eyes absent 1 homolog (Drosophila) 94706_s_at -0.841508 -0.276614 1.013004 0.103642 0.146354 0.310579 0.38868 0.536317 0.611615 0.608998tyrosine 3-monooxygenase/tryptophan 5-monooxygenase activation protein, theta polypeptide 97060_at 0.68321 -0.079689 -0.180755 0.008783 0.371084 0.258856 -0.065488 0.867833 0.884926 0.921793M.musculus mRNA for transferrin receptor 103957_at -1.346625 0.067496 0.912969 -0.203098 0.747244 -0.305312 0.053854 1.741897 1.337977 0.763937ATP-binding cassette, sub-family G (WHITE), member 2 95023_at 0.105668 -0.078096 0.065329 0.24019 -0.031492 0.30885 0.108415 0.456863 0.492811 0.189602
Page 16
Sheehy et al. Comparison of Adaptive and Maladaptive Hypertrophy SUPPLEMENTAL MATERIAL
at Countw
ay Library of M
edicine on July 22, 2010 circgenetics.ahajournals.org
Dow
nloaded from
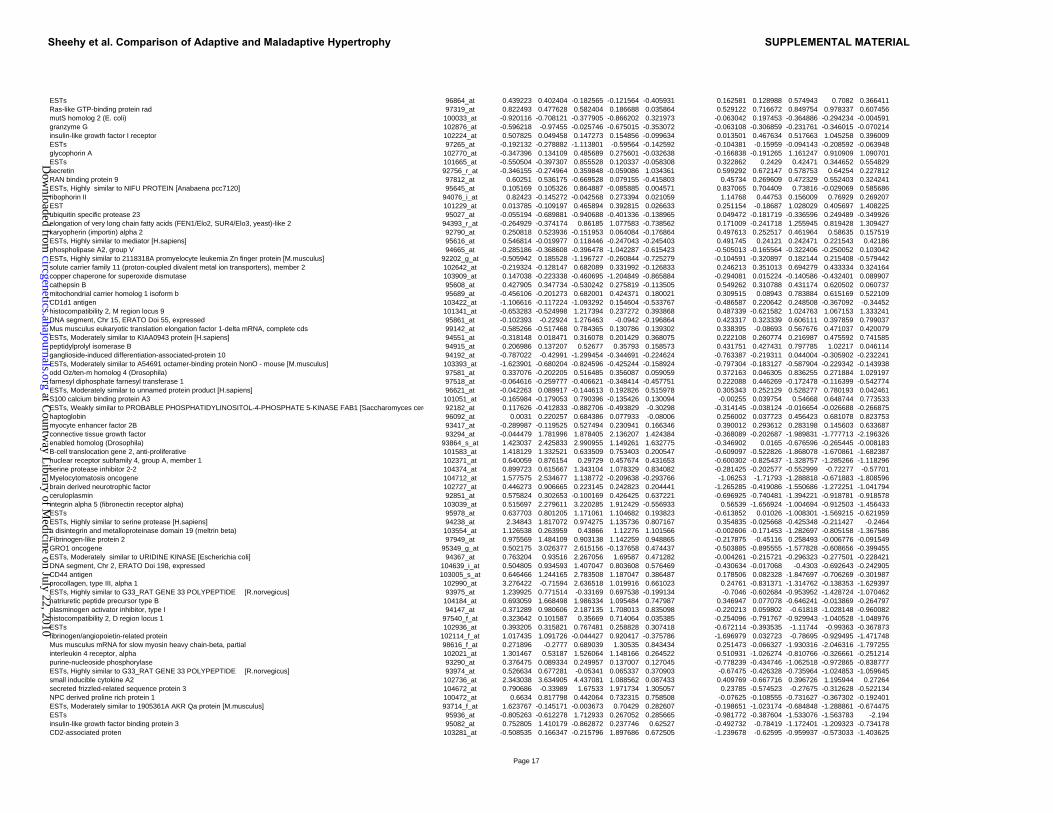
ESTs 96864_at 0.439223 0.402404 -0.182565 -0.121564 -0.405931 0.162581 0.128988 0.574943 0.7082 0.366411Ras-like GTP-binding protein rad 97319_at 0.822493 0.477628 0.582404 0.186688 0.035864 0.529122 0.716672 0.849754 0.978337 0.607456mutS homolog 2 (E. coli) 100033_at -0.920116 -0.708121 -0.377905 -0.866202 0.321973 -0.063042 0.197453 -0.364886 -0.294234 -0.004591granzyme G 102876_at -0.596218 -0.97455 -0.025746 -0.675015 -0.353072 -0.063108 -0.306859 -0.231761 -0.346015 -0.070214insulin-like growth factor I receptor 102224_at 0.507825 0.049458 0.147273 0.154856 -0.099634 0.013501 0.467634 0.517663 1.045258 0.396009ESTs 97265_at -0.192132 -0.278882 -1.113801 -0.59564 -0.142592 -0.104381 -0.15959 -0.094143 -0.208592 -0.063948glycophorin A 102770_at -0.347396 0.134109 0.485689 0.275601 -0.032638 -0.166838 -0.191265 1.161247 0.910909 1.090701ESTs 101665_at -0.550504 -0.397307 0.855528 0.120337 -0.058308 0.322862 0.2429 0.42471 0.344652 0.554829secretin 92756_r_at -0.346155 -0.274964 0.359848 -0.059086 1.034361 0.599292 0.672147 0.578753 0.64254 0.227812RAN binding protein 9 97812_at 0.60251 0.536175 -0.669528 0.079155 -0.415803 0.45734 0.269609 0.472329 0.552403 0.324241ESTs, Highly similar to NIFU PROTEIN [Anabaena pcc7120] 95645_at 0.105169 0.105326 0.864887 -0.085885 0.004571 0.837065 0.704409 0.73816 -0.029069 0.585686ribophorin II 94076_i_at 0.82423 -0.145272 -0.042568 0.273394 0.021059 1.14768 0.44753 0.156009 0.76929 0.269207EST 101229_at 0.013785 -0.109197 0.465894 0.392815 0.026633 0.251154 -0.18687 1.028029 0.405697 1.408225ubiquitin specific protease 23 95027_at -0.055194 -0.689881 -0.940688 -0.401336 -0.138965 0.049472 -0.181719 -0.336596 0.249489 -0.349926elongation of very long chain fatty acids (FEN1/Elo2, SUR4/Elo3, yeast)-like 2 94393_r_at -0.264929 -0.374174 0.86185 1.077583 -0.738562 0.171009 -0.241718 1.255945 0.819428 1.309427karyopherin (importin) alpha 2 92790_at 0.250818 0.523936 -0.151953 0.064084 -0.176864 0.497613 0.252517 0.461964 0.58635 0.157519ESTs, Highly similar to mediator [H.sapiens] 95616_at 0.546814 -0.019977 0.118446 -0.247043 -0.245403 0.491745 0.24121 0.242471 0.221543 0.42186phospholipase A2, group V 94665_at -0.285186 -0.368608 -0.396478 -1.042287 -0.615423 -0.505013 -0.165564 -0.322406 -0.250052 0.103042ESTs, Highly similar to 2118318A promyelocyte leukemia Zn finger protein [M.musculus] 92202_g_at -0.505942 0.185528 -1.196727 -0.260844 -0.725279 -0.104591 -0.320897 0.182144 0.215408 -0.579442solute carrier family 11 (proton-coupled divalent metal ion transporters), member 2 102642_at -0.219324 -0.128147 0.682089 0.331992 -0.126833 0.246213 0.351013 0.694279 0.433334 0.324164copper chaperone for superoxide dismutase 103909_at 0.147038 -0.223338 -0.460695 -1.204849 -0.865884 -0.294081 0.015224 -0.140586 -0.432401 0.089907cathepsin B 95608_at 0.427905 0.347734 -0.530242 0.275819 -0.113505 0.549262 0.310788 0.431174 0.620502 0.060737mitochondrial carrier homolog 1 isoform b 95689_at -0.456106 -0.201273 0.682001 0.424371 0.180021 0.309515 0.08943 0.783884 0.615169 0.522109CD1d1 antigen 103422_at -1.106616 -0.117224 -1.093292 0.154604 -0.533767 -0.486587 0.220642 0.248508 -0.367092 -0.34452histocompatibility 2, M region locus 9 101341_at -0.653283 -0.524998 1.217394 0.237272 0.393868 0.487339 -0.621582 1.024763 1.067153 1.333241DNA segment, Chr 15, ERATO Doi 55, expressed 95861_at -0.102393 -0.22924 1.276463 -0.0942 -0.196864 0.423317 0.323339 0.606111 0.397859 0.799037Mus musculus eukaryotic translation elongation factor 1-delta mRNA, complete cds 99142_at -0.585266 -0.517468 0.784365 0.130786 0.139302 0.338395 -0.08693 0.567676 0.471037 0.420079ESTs, Moderately similar to KIAA0943 protein [H.sapiens] 94551_at -0.318148 0.018471 0.316078 0.201429 0.368075 0.222108 0.260774 0.216987 0.475592 0.741585peptidylprolyl isomerase B 94915_at 0.206986 0.137207 0.52677 0.35793 0.158573 0.431751 0.427431 0.797785 1.02217 0.046114ganglioside-induced differentiation-associated-protein 10 94192_at -0.787022 -0.42991 -1.299454 -0.344691 -0.224624 -0.763387 -0.219311 0.044004 -0.305902 -0.232241ESTs, Moderately similar to A54691 octamer-binding protein NonO - mouse [M.musculus] 103393_at -1.623901 -0.680204 -0.824596 -0.425244 -0.158924 -0.797304 -0.183127 -0.587904 -0.229342 -0.143938odd Oz/ten-m homolog 4 (Drosophila) 97581_at 0.337076 -0.202205 0.516485 0.356087 0.059059 0.372163 0.046305 0.836255 0.271884 1.029197farnesyl diphosphate farnesyl transferase 1 97518_at -0.064616 -0.259777 -0.406621 -0.348414 -0.457751 0.222088 0.446269 -0.172478 -0.116399 -0.542774ESTs, Moderately similar to unnamed protein product [H.sapiens] 96621_at -0.042263 0.089917 -0.144613 0.192826 0.515978 0.305343 0.252129 0.528277 0.780193 0.042461S100 calcium binding protein A3 101051_at -0.165984 -0.179053 0.790396 -0.135426 0.130094 -0.00255 0.039754 0.54668 0.648744 0.773533ESTs, Weakly similar to PROBABLE PHOSPHATIDYLINOSITOL-4-PHOSPHATE 5-KINASE FAB1 [Saccharomyces cere 92182_at 0.117626 -0.412833 -0.882706 -0.493829 -0.30298 -0.314145 -0.038124 -0.016654 -0.026688 -0.266875haptoglobin 96092_at 0.0031 0.220257 0.684386 0.077933 -0.08006 0.256002 0.037723 0.456423 0.681078 0.823753myocyte enhancer factor 2B 93417_at -0.289987 -0.119525 0.527494 0.230941 0.166346 0.390012 0.293612 0.283198 0.145603 0.633687connective tissue growth factor 93294_at -0.044479 1.781996 1.878405 2.136207 1.424384 -0.368089 -0.202687 -1.989831 -1.777713 -2.196326enabled homolog (Drosophila) 93864_s_at 1.423037 2.425833 2.990955 1.149261 1.632775 -0.346902 0.0165 -0.676596 -0.265445 -0.008183B-cell translocation gene 2, anti-proliferative 101583_at 1.418129 1.332521 0.633509 0.753403 0.200547 -0.609097 -0.522826 -1.868078 -1.670861 -1.682387nuclear receptor subfamily 4, group A, member 1 102371_at 0.640059 0.876154 0.29729 0.457674 0.431653 -0.600302 -0.825437 -1.328757 -1.285266 -1.118296serine protease inhibitor 2-2 104374_at 0.899723 0.615667 1.343104 1.078329 0.834082 -0.281425 -0.202577 -0.552999 -0.72277 -0.57701Myelocytomatosis oncogene 104712_at 1.577575 2.534677 1.138772 -0.209638 -0.293766 -1.06253 -1.71793 -1.288818 -0.671883 -1.808596brain derived neurotrophic factor 102727_at 0.446273 0.906665 0.223145 0.242823 0.204441 -1.265285 -0.419086 -1.550686 -1.272251 -1.041794ceruloplasmin 92851_at 0.575824 0.302653 -0.100169 0.426425 0.637221 -0.696925 -0.740481 -1.394221 -0.918781 -0.918578integrin alpha 5 (fibronectin receptor alpha) 103039_at 0.515697 2.279611 3.220285 1.912429 -0.556933 0.56539 -1.656924 -1.004694 -0.912503 -1.456433ESTs 95978_at 0.637703 0.801205 1.171061 1.104682 0.193823 -0.613852 0.01026 -1.008301 -1.569215 -0.621959ESTs, Highly similar to serine protease [H.sapiens] 94238_at 2.34843 1.817072 0.974275 1.135736 0.807167 0.354835 -0.025668 -0.425348 -0.211427 -0.2464a disintegrin and metalloproteinase domain 19 (meltrin beta) 103554_at 1.126538 0.263959 0.43866 1.12276 1.101566 -0.002606 -0.171453 -1.282697 -0.805158 -1.367586Fibrinogen-like protein 2 97949_at 0.975569 1.484109 0.903138 1.142259 0.948865 -0.217875 -0.45116 0.258493 -0.006776 -0.091549GRO1 oncogene 95349_g_at 0.502175 3.026377 2.615156 -0.137658 0.474437 -0.503885 -0.895555 -1.577828 -0.608656 -0.399455ESTs, Moderately similar to URIDINE KINASE [Escherichia coli] 94367_at 0.763204 0.93516 2.267056 1.69587 0.471282 -0.004261 -0.215721 -0.296323 -0.277501 -0.228421DNA segment, Chr 2, ERATO Doi 198, expressed 104639_i_at 0.504805 0.934593 1.407047 0.803608 0.576469 -0.430634 -0.017068 -0.4303 -0.692643 -0.242905CD44 antigen 103005_s_at 0.646466 1.244165 2.783508 1.187047 0.386487 0.178506 0.082328 -1.847697 -0.706269 -0.301987procollagen, type III, alpha 1 102990_at 3.276422 -0.71594 2.636518 1.019916 0.661023 0.24761 -0.831371 -1.314762 -0.138353 -1.629397
�ESTs, Highly similar to G33_RAT GENE 33 POLYPEPTIDE [R.norvegicus] 93975_at 1.239925 0.771514 -0.33169 0.697538 -0.199134 -0.7046 -0.602684 -0.953952 -1.428724 -1.070462natriuretic peptide precursor type B 104184_at 0.693059 1.668498 1.986334 1.095484 0.747987 0.346947 0.077078 -0.646241 -0.013869 -0.264797plasminogen activator inhibitor, type I 94147_at -0.371289 0.980606 2.187135 1.708013 0.835098 -0.220213 0.059802 -0.61818 -1.028148 -0.960082histocompatibility 2, D region locus 1 97540_f_at 0.323642 0.101587 0.35669 0.714064 0.035385 -0.254096 -0.791767 -0.929943 -1.040528 -1.048976ESTs 102936_at 0.393205 0.315821 0.767481 0.258828 0.307418 -0.672114 -0.393535 -1.11744 -0.99363 -0.367873fibrinogen/angiopoietin-related protein 102114_f_at 1.017435 1.091726 -0.044427 0.920417 -0.375786 -1.696979 0.032723 -0.78695 -0.929495 -1.471748Mus musculus mRNA for slow myosin heavy chain-beta, partial 98616_f_at 0.271896 -0.2777 0.689039 1.30535 0.843434 0.251473 -0.066327 -1.930316 -2.046316 -1.797255interleukin 4 receptor, alpha 102021_at 1.301467 0.53187 1.526064 1.148166 0.264522 0.510931 -1.026274 -0.810766 -0.326661 -0.251214purine-nucleoside phosphorylase 93290_at 0.376475 0.089334 0.249957 0.137007 0.127045 -0.778239 -0.434746 -1.062518 -0.972865 -0.838777
�ESTs, Highly similar to G33_RAT GENE 33 POLYPEPTIDE [R.norvegicus] 93974_at 0.526634 0.677281 -0.05341 0.065337 0.370903 -0.67475 -0.426328 -0.735964 -1.024853 -1.059645small inducible cytokine A2 102736_at 2.343038 3.634905 4.437081 1.088562 0.087433 0.409769 -0.667716 0.396726 1.195944 0.27264secreted frizzled-related sequence protein 3 104672_at 0.790686 -0.33989 1.67533 1.971734 1.305057 0.23785 -0.574523 -0.27675 -0.312628 -0.522134NPC derived proline rich protein 1 100472_at 0.6634 0.817798 0.442064 0.732315 0.758508 -0.07625 -0.108555 -0.731627 -0.367302 -0.192401ESTs, Moderately similar to 1905361A AKR Qa protein [M.musculus] 93714_f_at 1.623767 -0.145171 -0.003673 0.70429 0.282607 -0.198651 -1.023174 -0.684848 -1.288861 -0.674475ESTs 95936_at -0.805263 -0.612278 1.712933 0.267052 0.285665 -0.981772 -0.387604 -1.533076 -1.563783 -2.194insulin-like growth factor binding protein 3 95082_at 0.752805 1.410179 -0.862872 0.237746 0.62527 -0.492732 -0.78419 -1.172401 -1.209323 -0.734178CD2-associated proten 103281_at -0.508535 0.166347 -0.215796 1.897686 0.672505 -1.239678 -0.62595 -0.959937 -0.573033 -1.403625
Page 17
Sheehy et al. Comparison of Adaptive and Maladaptive Hypertrophy SUPPLEMENTAL MATERIAL
at Countw
ay Library of M
edicine on July 22, 2010 circgenetics.ahajournals.org
Dow
nloaded from
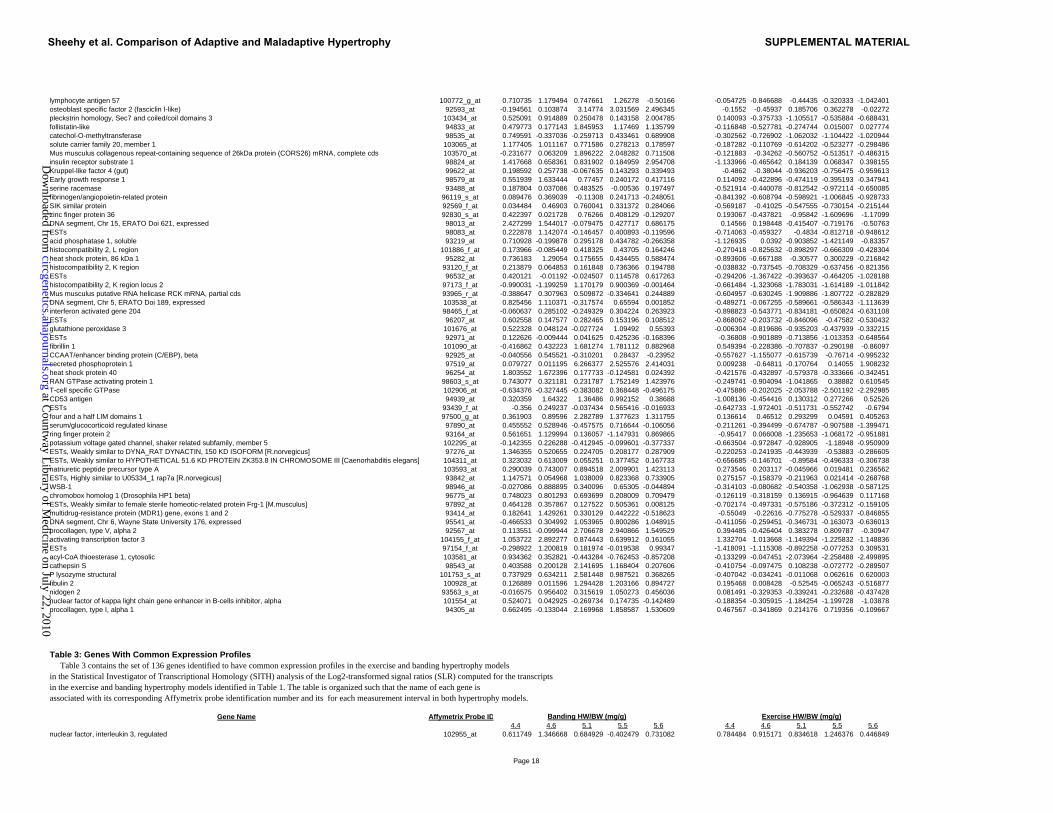
lymphocyte antigen 57 100772_g_at 0.710735 1.179494 0.747661 1.26278 -0.50166 -0.054725 -0.846688 -0.44435 -0.320333 -1.042401osteoblast specific factor 2 (fasciclin I-like) 92593_at -0.194561 0.103874 3.14774 3.031569 2.496345 -0.1552 -0.45937 0.185706 0.362278 -0.02272pleckstrin homology, Sec7 and coiled/coil domains 3 103434_at 0.525091 0.914889 0.250478 0.143158 2.004785 0.140093 -0.375733 -1.105517 -0.535884 -0.688431follistatin-like 94833_at 0.479773 0.177143 1.845953 1.17469 1.135799 -0.116848 -0.527781 -0.274744 0.015007 0.027774catechol-O-methyltransferase 98535_at 0.749591 -0.337036 -0.259713 0.433461 0.689908 -0.302562 -0.726902 -1.062032 -1.104422 -1.020944solute carrier family 20, member 1 103065_at 1.177405 1.011167 0.771586 0.278213 0.178597 -0.187282 -0.110769 -0.614202 -0.523277 -0.298486Mus musculus collagenous repeat-containing sequence of 26kDa protein (CORS26) mRNA, complete cds 103570_at -0.231677 0.063209 1.896222 2.048282 0.711508 -0.121883 -0.34262 -0.560752 -0.513517 -0.486315insulin receptor substrate 1 98824_at 1.417668 0.658361 0.831902 0.184959 2.954708 -1.133966 -0.465642 0.184139 0.068347 0.398155Kruppel-like factor 4 (gut) 99622_at 0.198592 0.257738 -0.067635 0.143293 0.339493 -0.4862 -0.38044 -0.936203 -0.756475 -0.959613Early growth response 1 98579_at 0.551939 1.633444 0.77457 0.240172 0.417116 0.114092 -0.422896 -0.474119 -0.395193 -0.347941serine racemase 93488_at 0.187804 0.037086 0.483525 -0.00536 0.197497 -0.521914 -0.440078 -0.812542 -0.972114 -0.650085fibrinogen/angiopoietin-related protein 96119_s_at 0.089476 0.369039 -0.11308 0.241713 -0.248051 -0.841392 -0.608794 -0.598921 -1.006845 -0.928733SIK similar protein 92569_f_at 0.034484 0.46903 0.760041 0.331372 0.284066 -0.569187 -0.41025 -0.547555 -0.730154 -0.215144zinc finger protein 36 92830_s_at 0.422397 0.021728 0.76266 0.408129 -0.129207 0.193067 -0.437821 -0.95842 -1.609696 -1.17099DNA segment, Chr 15, ERATO Doi 621, expressed 98013_at 2.427299 1.544017 -0.079475 0.427717 0.686175 0.14566 0.198448 -0.415407 -0.719176 -0.50763ESTs 98083_at 0.222878 1.142074 -0.146457 0.400893 -0.119596 -0.714063 -0.459327 -0.4834 -0.812718 -0.948612acid phosphatase 1, soluble 93219_at 0.710928 -0.199878 0.295178 0.434782 -0.266358 -1.126935 0.0392 -0.903852 -1.421149 -0.83357histocompatibility 2, L region 101886_f_at 0.173966 -0.085449 0.418325 0.43705 0.164246 -0.270418 -0.825632 -0.898297 -0.666309 -0.428304heat shock protein, 86 kDa 1 95282_at 0.736183 1.29054 0.175655 0.434455 0.588474 -0.893606 -0.667188 -0.30577 0.300229 -0.216842histocompatibility 2, K region 93120_f_at 0.213879 0.064853 0.161848 0.736366 0.194788 -0.038832 -0.737545 -0.708329 -0.637456 -0.821356ESTs 96532_at 0.420121 -0.01192 -0.024507 0.114578 0.617263 -0.294206 -1.367422 -0.393637 -0.464205 -1.028188histocompatibility 2, K region locus 2 97173_f_at -0.990031 -1.199259 1.170179 0.900369 -0.001464 -0.661484 -1.323068 -1.783031 -1.614189 -1.011842Mus musculus putative RNA helicase RCK mRNA, partial cds 93965_r_at -0.388647 0.307963 0.509872 -0.334641 0.244889 -0.604957 -0.630245 -1.909886 -1.807722 -0.282829DNA segment, Chr 5, ERATO Doi 189, expressed 103538_at 0.825456 1.110371 -0.317574 0.65594 0.001852 -0.489271 -0.067255 -0.589661 -0.586343 -1.113639interferon activated gene 204 98465_f_at -0.060637 0.285102 -0.249329 0.304224 0.263923 -0.898823 -0.543771 -0.834181 -0.650824 -0.631108ESTs 96207_at 0.602558 0.147577 0.282465 0.153196 0.108512 -0.868062 -0.203732 -0.846096 -0.47582 -0.530432glutathione peroxidase 3 101676_at 0.522328 0.048124 -0.027724 1.09492 0.55393 -0.006304 -0.819686 -0.935203 -0.437939 -0.332215ESTs 92971_at 0.122626 -0.009444 0.041625 0.425236 -0.168396 -0.36808 -0.901889 -0.713856 -1.013353 -0.648564fibrillin 1 101090_at -0.416862 0.432223 1.681274 1.781112 0.882968 0.549394 -0.228386 -0.707837 -0.290198 -0.86097CCAAT/enhancer binding protein (C/EBP), beta 92925_at -0.040556 0.545521 -0.310201 0.28437 -0.23952 -0.557627 -1.155077 -0.615739 -0.76714 -0.995232secreted phosphoprotein 1 97519_at 0.079727 0.011195 6.266377 2.525576 2.414031 0.009238 -0.64811 -0.170764 0.14055 1.908232heat shock protein 40 96254_at 1.803552 1.672396 0.177733 -0.124581 0.024392 -0.421576 -0.432897 -0.579378 -0.333666 -0.342451RAN GTPase activating protein 1 98603_s_at 0.743077 0.321181 0.231787 1.752149 1.423976 -0.249741 -0.904094 -1.041865 0.38882 0.610545T-cell specific GTPase 102906_at -0.634376 -0.327445 -0.383082 0.368448 -0.496175 -0.475886 -0.202025 -2.053788 -2.501192 -2.292985CD53 antigen 94939_at 0.320359 1.64322 1.36486 0.992152 0.38688 -1.008136 -0.454416 0.130312 0.277266 0.52526ESTs 93439_f_at -0.356 0.249237 -0.037434 0.565416 -0.016933 -0.642733 -1.972401 -0.511731 -0.552742 -0.6794four and a half LIM domains 1 97500_g_at 0.361903 0.89596 2.282789 1.377623 1.311755 0.136614 0.46512 0.293299 0.04591 0.405263serum/glucocorticoid regulated kinase 97890_at 0.455552 0.528946 -0.457575 0.716644 -0.106056 -0.211261 -0.394499 -0.674787 -0.907588 -1.399471ring finger protein 2 93164_at 0.561651 1.129994 0.136057 -1.147931 0.869865 -0.95417 0.066008 -1.235653 -1.068172 -0.951881potassium voltage gated channel, shaker related subfamily, member 5 102295_at -0.142355 0.226288 -0.412945 -0.099601 -0.377337 -0.663504 -0.972847 -0.928905 -1.18948 -0.950909ESTs, Weakly similar to DYNA_RAT DYNACTIN, 150 KD ISOFORM [R.norvegicus] 97276_at 1.346355 0.520655 0.224705 0.208177 0.287909 -0.220253 -0.241935 -0.443939 -0.53883 -0.286605ESTs, Weakly similar to HYPOTHETICAL 51.6 KD PROTEIN ZK353.8 IN CHROMOSOME III [Caenorhabditis elegans] 104311_at 0.323032 0.613009 0.055251 0.377452 0.167733 -0.656685 -0.146701 -0.89584 -0.496333 -0.306738natriuretic peptide precursor type A 103593_at 0.290039 0.743007 0.894518 2.009901 1.423113 0.273546 0.203117 -0.045966 0.019481 0.236562ESTs, Highly similar to U05334_1 rap7a [R.norvegicus] 93842_at 1.147571 0.054968 1.038009 0.823368 0.733905 0.275157 -0.158379 -0.211963 0.021414 -0.268768WSB-1 98946_at -0.027086 0.888895 0.340096 0.65305 -0.044894 -0.314103 -0.080682 -0.540358 -1.062938 -0.587125chromobox homolog 1 (Drosophila HP1 beta) 96775_at 0.748023 0.801293 0.693699 0.208009 0.709479 -0.126119 -0.318159 0.136915 -0.964639 0.117168ESTs, Weakly similar to female sterile homeotic-related protein Frg-1 [M.musculus] 97892_at 0.464128 0.357867 0.127522 0.505361 0.008125 -0.702174 -0.497331 -0.575186 -0.372312 -0.159105multidrug-resistance protein (MDR1) gene, exons 1 and 2 93414_at 0.182641 1.429261 0.330129 0.442222 -0.518623 -0.55049 -0.22616 -0.775278 -0.529337 -0.846855DNA segment, Chr 6, Wayne State University 176, expressed 95541_at -0.466533 0.304992 1.053965 0.800286 1.048915 -0.411056 -0.259451 -0.346731 -0.163073 -0.636013procollagen, type V, alpha 2 92567_at 0.113551 -0.099944 2.706678 2.940866 1.549529 0.394485 -0.426404 0.383278 0.809787 -0.30947activating transcription factor 3 104155_f_at 1.053722 2.892277 0.874443 0.639912 0.161055 1.332704 1.013668 -1.149394 -1.225832 -1.148836ESTs 97154_f_at -0.298922 1.200819 0.181974 -0.019538 0.99347 -1.418091 -1.115308 -0.892258 -0.077253 0.309531acyl-CoA thioesterase 1, cytosolic 103581_at 0.934362 0.352821 -0.443284 -0.762453 -0.857208 -0.133299 -0.047451 -2.073964 -2.258488 -2.499895cathepsin S 98543_at 0.403588 0.200128 2.141695 1.168404 0.207606 -0.410754 -0.097475 0.108238 -0.072772 -0.289507P lysozyme structural 101753_s_at 0.737929 0.634211 2.581448 0.987521 0.368265 -0.407042 -0.034241 -0.011068 0.062616 0.620003fibulin 2 100928_at 0.126889 0.011596 1.294428 1.203166 0.894727 0.195468 0.008428 -0.52545 -0.065243 -0.516877nidogen 2 93563_s_at -0.016575 0.956402 0.315619 1.050273 0.456036 0.081491 -0.329353 -0.339241 -0.232688 -0.437428nuclear factor of kappa light chain gene enhancer in B-cells inhibitor, alpha 101554_at 0.524071 0.042925 -0.269734 0.174735 -0.142489 -0.188354 -0.305915 -1.184254 -1.199728 -1.03878procollagen, type I, alpha 1 94305_at 0.662495 -0.133044 2.169968 1.858587 1.530609 0.467567 -0.341869 0.214176 0.719356 -0.109667
Table 3: Genes With Common Expression Profiles Table 3 contains the set of 136 genes identified to have common expression profiles in the exercise and banding hypertrophy models in the Statistical Investigator of Transcriptional Homology (SITH) analysis of the Log2-transformed signal ratios (SLR) computed for the transcripts in the exercise and banding hypertrophy models identified in Table 1. The table is organized such that the name of each gene isassociated with its corresponding Affymetrix probe identification number and its for each measurement interval in both hypertrophy models.
Gene Name Affymetrix Probe ID 4.4 4.6 5.1 5.5 5.6 4.4 4.6 5.1 5.5 5.6
nuclear factor, interleukin 3, regulated 102955_at 0.611749 1.346668 0.684929 -0.402479 0.731082 0.784484 0.915171 0.834618 1.246376 0.446849
Banding HW/BW (mg/g) Exercise HW/BW (mg/g)
Page 18
Sheehy et al. Comparison of Adaptive and Maladaptive Hypertrophy SUPPLEMENTAL MATERIAL
at Countw
ay Library of M
edicine on July 22, 2010 circgenetics.ahajournals.org
Dow
nloaded from
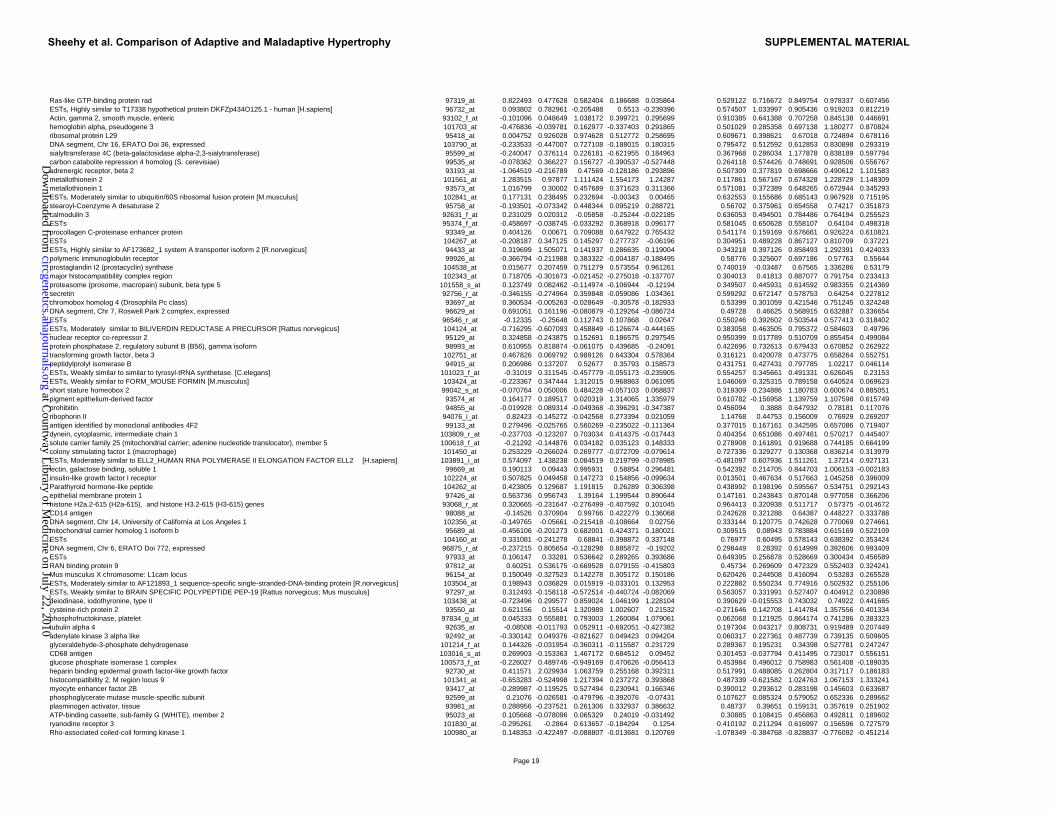
Ras-like GTP-binding protein rad 97319_at 0.822493 0.477628 0.582404 0.186688 0.035864 0.529122 0.716672 0.849754 0.978337 0.607456ESTs, Highly similar to T17338 hypothetical protein DKFZp434O125.1 - human [H.sapiens] 96732_at 0.093802 0.782961 -0.205488 0.5513 -0.239396 0.574507 1.033997 0.905436 0.919203 0.812219Actin, gamma 2, smooth muscle, enteric 93102_f_at -0.101096 0.048649 1.038172 0.399721 0.295699 0.910385 0.641388 0.707258 0.845138 0.446691hemoglobin alpha, pseudogene 3 101703_at -0.476836 -0.039781 0.162977 -0.337403 0.291865 0.501029 0.285358 0.697138 1.180277 0.870824ribosomal protein L29 95418_at 0.004752 0.926028 0.974628 0.512772 0.258695 0.609671 0.398621 0.67018 0.724894 0.678116DNA segment, Chr 16, ERATO Doi 36, expressed 103790_at -0.233533 -0.447007 0.727108 -0.188015 0.180315 0.795472 0.512592 0.612853 0.830898 0.293319sialyltransferase 4C (beta-galactosidase alpha-2,3-sialytransferase) 95599_at -0.240047 0.376114 0.226181 -0.621955 0.184963 0.367968 0.286034 1.177878 0.838189 0.597794carbon catabolite repression 4 homolog (S. cerevisiae) 99535_at -0.078362 0.366227 0.156727 -0.390537 -0.527448 0.264118 0.574426 0.748691 0.928506 0.556767adrenergic receptor, beta 2 93193_at -1.064519 -0.216789 0.47569 -0.128186 0.293896 0.507309 0.377819 0.698666 0.490612 1.101583metallothionein 2 101561_at 1.283515 0.97877 1.111424 1.554173 1.24287 0.117861 0.567167 0.674328 1.228729 1.148309metallothionein 1 93573_at 1.016799 0.30002 0.457689 0.371623 0.311366 0.571081 0.372389 0.648265 0.672944 0.345293ESTs, Moderately similar to ubiquitin/60S ribosomal fusion protein [M.musculus] 102841_at 0.177131 0.238495 0.232694 -0.00343 0.00465 0.632553 0.155686 0.685143 0.967928 0.715195stearoyl-Coenzyme A desaturase 2 95758_at -0.193501 -0.073342 0.448344 0.095219 0.288721 0.56702 0.375961 0.654558 0.74217 0.351873calmodulin 3 92631_f_at 0.231029 0.020312 -0.05858 -0.25244 -0.022185 0.636053 0.494501 0.784486 0.764194 0.255523ESTs 95374_f_at -0.458697 -0.038745 -0.033292 0.368918 0.096177 0.581045 0.650628 0.558107 0.64104 0.498318procollagen C-proteinase enhancer protein 93349_at 0.404126 0.00671 0.709088 0.647922 0.765432 0.541174 0.159169 0.676661 0.926224 0.610821ESTs 104267_at -0.208187 0.347125 0.145297 0.277737 -0.06196 0.304951 0.489228 0.867127 0.810709 0.37221ESTs, Highly similar to AF173682_1 system A transporter isoform 2 [R.norvegicus] 94433_at 0.319699 1.505071 0.141937 0.286635 0.119004 0.343218 0.397126 0.858493 1.292391 0.424033polymeric immunoglobulin receptor 99926_at -0.366794 -0.211988 0.383322 -0.004187 -0.188495 0.58776 0.325607 0.697186 0.57763 0.55644prostaglandin I2 (prostacyclin) synthase 104538_at 0.015677 0.207459 0.751279 0.573554 0.961261 0.740019 -0.03487 0.67565 1.336286 0.53179major histocompatibility complex region 102343_at 0.718705 -0.301673 -0.021452 -0.275018 -0.137707 0.304013 0.41813 0.887077 0.791754 0.233413proteasome (prosome, macropain) subunit, beta type 5 101558_s_at 0.123749 0.082462 -0.114974 -0.106944 -0.12194 0.349507 0.445931 0.614592 0.983355 0.214369secretin 92756_r_at -0.346155 -0.274964 0.359848 -0.059086 1.034361 0.599292 0.672147 0.578753 0.64254 0.227812chromobox homolog 4 (Drosophila Pc class) 93697_at 0.360534 -0.005263 -0.028649 -0.30578 -0.182933 0.53399 0.301059 0.421546 0.751245 0.324248DNA segment, Chr 7, Roswell Park 2 complex, expressed 96629_at 0.691051 0.161196 -0.080879 -0.129264 -0.086724 0.49728 0.46625 0.568915 0.632887 0.336654ESTs 96546_r_at -0.12335 -0.25648 0.112743 0.107868 0.02647 0.550246 0.392602 0.503544 0.577413 0.318402ESTs, Moderately similar to BILIVERDIN REDUCTASE A PRECURSOR [Rattus norvegicus] 104124_at -0.716295 -0.607093 0.458849 -0.126674 -0.444165 0.383058 0.463505 0.795372 0.584603 0.49796nuclear receptor co-repressor 2 95129_at 0.324858 -0.243875 0.152691 0.186575 0.297545 0.950399 0.017789 0.510709 0.855454 0.499084protein phosphatase 2, regulatory subunit B (B56), gamma isoform 98993_at 0.610955 0.818874 -0.061075 0.439685 -0.24091 0.422696 0.732613 0.679433 0.670852 0.262922transforming growth factor, beta 3 102751_at 0.467826 0.069792 0.989126 0.643304 0.578364 0.316121 0.420078 0.473775 0.658264 0.552751peptidylprolyl isomerase B 94915_at 0.206986 0.137207 0.52677 0.35793 0.158573 0.431751 0.427431 0.797785 1.02217 0.046114ESTs, Weakly similar to similar to tyrosyl-tRNA synthetase. [C.elegans] 101023_f_at -0.31019 0.311545 -0.457779 -0.055173 -0.235905 0.554257 0.345661 0.491331 0.626045 0.23153ESTs, Weakly similar to FORM_MOUSE FORMIN [M.musculus] 103424_at -0.223367 0.347444 1.312015 0.968863 0.061095 1.046069 0.325315 0.789158 0.640524 0.069623short stature homeobox 2 99042_s_at -0.070764 0.050006 0.484228 -0.057103 0.068837 0.319309 0.234886 1.180783 0.600674 0.885051pigment epithelium-derived factor 93574_at 0.164177 0.189517 0.020319 1.314065 1.335979 0.610782 -0.156958 1.139759 1.107598 0.615749prohibitin 94855_at -0.019928 0.089314 -0.049368 -0.396291 -0.347387 0.456094 0.3888 0.647932 0.78181 0.117076ribophorin II 94076_i_at 0.82423 -0.145272 -0.042568 0.273394 0.021059 1.14768 0.44753 0.156009 0.76929 0.269207antigen identified by monoclonal antibodies 4F2 99133_at 0.279496 -0.025765 0.560269 -0.235022 -0.111364 0.377015 0.167161 0.342595 0.657086 0.719407dynein, cytoplasmic, intermediate chain 1 103809_r_at -0.237703 -0.123207 0.703034 0.414375 -0.017443 0.404354 0.651086 0.497461 0.570217 0.445407solute carrier family 25 (mitochondrial carrier; adenine nucleotide translocator), member 5 100618_f_at -0.21292 -0.144876 0.034182 0.035123 0.148333 0.278908 0.161891 0.919688 0.744185 0.664199colony stimulating factor 1 (macrophage) 101450_at 0.253229 -0.266024 0.269777 -0.072709 -0.079614 0.727336 0.329277 0.130368 0.836214 0.313979
�ESTs, Moderately similar to ELL2_HUMAN RNA POLYMERASE II ELONGATION FACTOR ELL2 [H.sapiens] 103891_i_at 0.574097 1.438238 0.084519 0.219799 -0.078985 -0.481097 0.607936 1.511261 1.37214 0.927131lectin, galactose binding, soluble 1 99669_at 0.190113 0.09443 0.995931 0.58854 0.296481 0.542392 0.214705 0.844703 1.006153 -0.002183insulin-like growth factor I receptor 102224_at 0.507825 0.049458 0.147273 0.154856 -0.099634 0.013501 0.467634 0.517663 1.045258 0.396009Parathyroid hormone-like peptide 104262_at 0.423805 0.129687 1.191815 0.26289 0.306398 0.438992 0.198196 0.595567 0.534751 0.292143epithelial membrane protein 1 97426_at 0.563736 0.956743 1.39164 1.199544 0.890644 0.147161 0.243843 0.870148 0.977058 0.366206histone H2a.2-615 (H2a-615), and histone H3.2-615 (H3-615) genes 93068_r_at 0.320665 -0.231647 -0.276499 -0.407592 0.101045 0.964413 0.320938 0.511717 0.57375 -0.014672CD14 antigen 98088_at -0.14526 0.370904 0.99766 0.422279 0.136068 0.242628 0.321288 0.64387 0.448227 0.333788DNA segment, Chr 14, University of California at Los Angeles 1 102356_at -0.149765 -0.05661 -0.215418 -0.108664 0.02756 0.333144 0.120775 0.742628 0.770069 0.274661mitochondrial carrier homolog 1 isoform b 95689_at -0.456106 -0.201273 0.682001 0.424371 0.180021 0.309515 0.08943 0.783884 0.615169 0.522109ESTs 104160_at 0.331081 -0.241278 0.68841 -0.398872 0.337148 0.76977 0.60495 0.578143 0.638392 0.353424DNA segment, Chr 6, ERATO Doi 772, expressed 96875_r_at -0.237215 0.805654 -0.128298 0.885872 -0.19202 0.298449 0.28392 0.614999 0.392606 0.993409ESTs 97933_at 0.106147 0.33281 0.536642 0.289265 0.393686 0.649395 0.256878 0.528669 0.300434 0.456589RAN binding protein 9 97812_at 0.60251 0.536175 -0.669528 0.079155 -0.415803 0.45734 0.269609 0.472329 0.552403 0.324241Mus musculus X chromosome: L1cam locus 96154_at 0.150049 -0.327523 0.142278 0.305172 0.150186 0.620426 0.244508 0.416094 0.53283 0.265528ESTs, Moderately similar to AF121893_1 sequence-specific single-stranded-DNA-binding protein [R.norvegicus] 103504_at 0.198943 0.036829 0.015919 -0.033101 0.132953 0.222882 0.550234 0.774916 0.502932 0.255106ESTs, Weakly similar to BRAIN SPECIFIC POLYPEPTIDE PEP-19 [Rattus norvegicus; Mus musculus] 97297_at 0.312493 -0.158118 -0.572514 -0.440724 -0.082069 0.563057 0.331991 0.527407 0.404912 0.230898deiodinase, iodothyronine, type II 103438_at -0.723496 0.299577 0.859024 1.046199 1.228104 0.390629 -0.015553 0.743032 0.74922 0.441665cysteine-rich protein 2 93550_at 0.621156 0.15514 1.320989 1.002607 0.21532 -0.271646 0.142708 1.414784 1.357556 0.401334phosphofructokinase, platelet 97834_g_at 0.045333 0.555881 0.793003 1.260084 1.079061 0.062068 0.121925 0.864174 0.741286 0.383323tubulin alpha 4 92635_at -0.08508 -0.011793 0.052911 -0.692051 -0.427382 0.197304 0.043217 0.808731 0.919489 0.207449adenylate kinase 3 alpha like 92492_at -0.330142 0.049376 -0.821627 0.049423 0.094204 0.060317 0.227361 0.487739 0.739135 0.509605glyceraldehyde-3-phosphate dehydrogenase 101214_f_at 0.144326 -0.031954 -0.360311 -0.115587 0.231729 0.289367 0.195231 0.34398 0.527781 0.247247CD68 antigen 103016_s_at 0.269903 -0.153363 1.467172 0.684512 0.09452 0.301453 -0.037794 0.411495 0.723017 0.556151glucose phosphate isomerase 1 complex 100573_f_at -0.226027 0.489746 -0.949169 0.470626 -0.056413 0.453984 0.496012 0.758983 0.561408 -0.189035heparin binding epidermal growth factor-like growth factor 92730_at 0.411571 2.029934 1.063759 0.255168 0.392311 0.517991 0.488085 0.262804 0.317117 0.186183histocompatibility 2, M region locus 9 101341_at -0.653283 -0.524998 1.217394 0.237272 0.393868 0.487339 -0.621582 1.024763 1.067153 1.333241myocyte enhancer factor 2B 93417_at -0.289987 -0.119525 0.527494 0.230941 0.166346 0.390012 0.293612 0.283198 0.145603 0.633687phosphoglycerate mutase muscle-specific subunit 92599_at 0.21076 -0.026581 -0.479796 -0.392076 -0.07431 0.107627 0.085324 0.579052 0.652336 0.289662plasminogen activator, tissue 93981_at 0.288956 -0.237521 0.261306 0.332937 0.386632 0.48737 0.39651 0.159131 0.357619 0.251902ATP-binding cassette, sub-family G (WHITE), member 2 95023_at 0.105668 -0.078096 0.065329 0.24019 -0.031492 0.30885 0.108415 0.456863 0.492811 0.189602ryanodine receptor 3 101830_at -0.295261 -0.2864 0.613657 -0.184294 0.1254 0.410192 0.211294 0.616997 0.156596 0.727579Rho-associated coiled-coil forming kinase 1 100980_at 0.148353 -0.422497 -0.088807 -0.013681 0.120769 -1.078349 -0.384768 -0.828837 -0.776092 -0.451214
Page 19
Sheehy et al. Comparison of Adaptive and Maladaptive Hypertrophy SUPPLEMENTAL MATERIAL
at Countw
ay Library of M
edicine on July 22, 2010 circgenetics.ahajournals.org
Dow
nloaded from
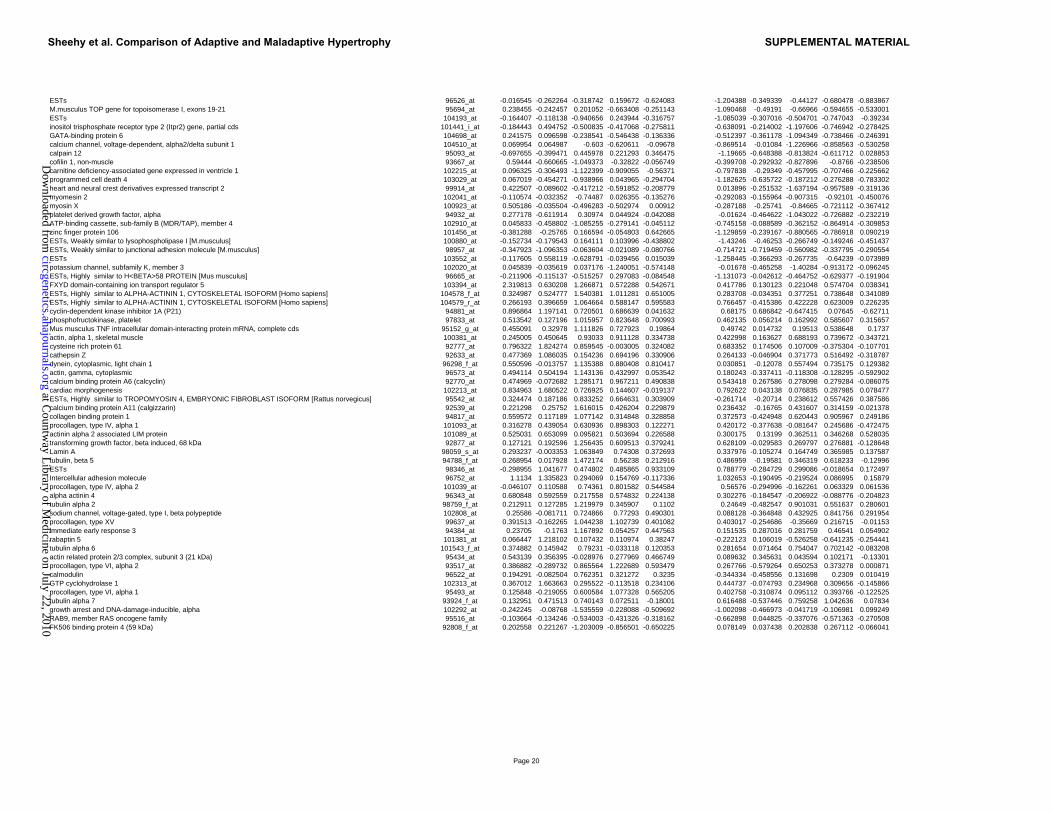
ESTs 96526_at -0.016545 -0.262264 -0.318742 0.159672 -0.624083 -1.204388 -0.349339 -0.44127 -0.680478 -0.883867M.musculus TOP gene for topoisomerase I, exons 19-21 95694_at 0.238455 -0.242457 0.201052 -0.663408 -0.251143 -1.090468 -0.49191 -0.66966 -0.594655 -0.533001ESTs 104193_at -0.164407 -0.118138 -0.940656 0.243944 -0.316757 -1.085039 -0.307016 -0.504701 -0.747043 -0.39234inositol trisphosphate receptor type 2 (Itpr2) gene, partial cds 101441_i_at -0.184443 0.494752 -0.500835 -0.417068 -0.275811 -0.638091 -0.214002 -1.197606 -0.746942 -0.278425GATA-binding protein 6 104698_at 0.241575 0.096598 -0.238541 -0.546438 -0.136336 -0.512397 -0.361178 -1.094349 -0.738466 -0.246391calcium channel, voltage-dependent, alpha2/delta subunit 1 104510_at 0.069954 0.064987 -0.603 -0.620611 -0.09678 -0.869514 -0.01084 -1.226966 -0.858563 -0.530258calpain 12 95093_at -0.697655 -0.399471 0.445978 0.221293 0.346475 -1.19665 -0.648388 -0.813824 -0.611712 0.028853cofilin 1, non-muscle 93667_at 0.59444 -0.660665 -1.049373 -0.32822 -0.056749 -0.399708 -0.292932 -0.827896 -0.8766 -0.238506carnitine deficiency-associated gene expressed in ventricle 1 102215_at 0.096325 -0.306493 -1.122399 -0.909055 -0.56371 -0.797838 -0.29349 -0.457995 -0.707466 -0.225662programmed cell death 4 103029_at 0.067019 -0.454271 -0.938966 0.043965 -0.294704 -1.182625 -0.635722 -0.187212 -0.276288 -0.783302heart and neural crest derivatives expressed transcript 2 99914_at 0.422507 -0.089602 -0.417212 -0.591852 -0.208779 0.013896 -0.251532 -1.637194 -0.957589 -0.319136myomesin 2 102041_at -0.110574 -0.032352 -0.74487 0.026355 -0.135276 -0.292083 -0.155964 -0.907315 -0.92101 -0.450076myosin X 100923_at 0.505186 -0.035504 -0.496283 -0.502974 0.00912 -0.287188 -0.25741 -0.84665 -0.721112 -0.367412platelet derived growth factor, alpha 94932_at 0.277178 -0.611914 0.30974 0.044924 -0.042088 -0.01624 -0.464622 -1.043022 -0.726882 -0.232219ATP-binding cassette, sub-family B (MDR/TAP), member 4 102910_at 0.045833 -0.458802 -1.085255 -0.279141 -0.045112 -0.745158 -0.088589 -0.362152 -0.864914 -0.309853zinc finger protein 106 101456_at -0.381288 -0.25765 0.166594 -0.054803 0.642665 -1.129859 -0.239167 -0.880565 -0.786918 0.090219ESTs, Weakly similar to lysophospholipase I [M.musculus] 100880_at -0.152734 -0.179543 0.164111 0.103996 -0.438802 -1.43246 -0.46253 -0.266749 -0.149246 -0.451437ESTs, Weakly similar to junctional adhesion molecule [M.musculus] 98957_at -0.347923 -1.096353 -0.063604 -0.021089 -0.080766 -0.714721 -0.719459 -0.560982 -0.337795 -0.290554ESTs 103552_at -0.117605 0.558119 -0.628791 -0.039456 0.015039 -1.258445 -0.366293 -0.267735 -0.64239 -0.073989potassium channel, subfamily K, member 3 102020_at 0.045839 -0.035619 0.037176 -1.240051 -0.574148 -0.01678 -0.465258 -1.40284 -0.913172 -0.096245ESTs, Highly similar to H<BETA>58 PROTEIN [Mus musculus] 96665_at -0.211906 -0.115137 -0.515257 0.297083 -0.084548 -1.131073 -0.042612 -0.464752 -0.629377 -0.191904FXYD domain-containing ion transport regulator 5 103394_at 2.319813 0.630208 1.266871 0.572288 0.542671 0.417786 0.130123 0.221048 0.574704 0.038341ESTs, Highly similar to ALPHA-ACTININ 1, CYTOSKELETAL ISOFORM [Homo sapiens] 104578_f_at 0.324987 0.524777 1.540381 1.011281 0.651005 0.283708 -0.034351 0.377251 0.738648 0.341089ESTs, Highly similar to ALPHA-ACTININ 1, CYTOSKELETAL ISOFORM [Homo sapiens] 104579_r_at 0.266193 0.396659 1.064664 0.588147 0.595583 0.766457 -0.415386 0.422228 0.623009 0.226235cyclin-dependent kinase inhibitor 1A (P21) 94881_at 0.896864 1.197141 0.720501 0.686639 0.041632 0.68175 0.686842 -0.647415 0.07645 -0.62711phosphofructokinase, platelet 97833_at 0.513542 0.127196 1.015957 0.823648 0.700993 0.462135 0.056214 0.162992 0.585607 0.315657Mus musculus TNF intracellular domain-interacting protein mRNA, complete cds 95152_g_at 0.455091 0.32978 1.111826 0.727923 0.19864 0.49742 0.014732 0.19513 0.538648 0.1737actin, alpha 1, skeletal muscle 100381_at 0.245005 0.450645 0.93033 0.911128 0.334738 0.422998 0.163627 0.688193 0.739672 -0.343721cysteine rich protein 61 92777_at 0.796322 1.824274 0.859545 -0.003005 0.324082 0.683352 0.174506 0.107009 -0.375304 -0.107701cathepsin Z 92633_at 0.477369 1.086035 0.154236 0.694196 0.330906 0.264133 -0.046904 0.371773 0.516492 -0.318787dynein, cytoplasmic, light chain 1 96298_f_at 0.550596 -0.013757 1.135388 0.880408 0.810417 0.030851 -0.12078 0.557494 0.735175 0.129382actin, gamma, cytoplasmic 96573_at 0.494114 0.504194 1.143136 0.432997 0.053542 0.180243 -0.337411 -0.118308 -0.128295 -0.592902calcium binding protein A6 (calcyclin) 92770_at 0.474969 -0.072682 1.285171 0.967211 0.490838 0.543418 0.267586 0.278098 0.279284 -0.086075cardiac morphogenesis 102213_at 0.834963 1.680522 0.726925 0.144607 -0.019137 0.792622 0.043138 0.076835 0.287985 0.078477ESTs, Highly similar to TROPOMYOSIN 4, EMBRYONIC FIBROBLAST ISOFORM [Rattus norvegicus] 95542_at 0.324474 0.187186 0.833252 0.664631 0.303909 -0.261714 -0.20714 0.238612 0.557426 0.387586calcium binding protein A11 (calgizzarin) 92539_at 0.221298 0.25752 1.616015 0.426204 0.229879 0.236432 -0.16765 0.431607 0.314159 -0.021378collagen binding protein 1 94817_at 0.559572 0.117189 1.077142 0.314848 0.328858 0.372573 -0.424948 0.620443 0.905967 0.249186procollagen, type IV, alpha 1 101093_at 0.316278 0.439054 0.630936 0.898303 0.122271 0.420172 -0.377638 -0.081647 0.245686 -0.472475actinin alpha 2 associated LIM protein 101089_at 0.525031 0.653099 0.095821 0.503694 0.226588 0.300175 0.13199 0.362511 0.346268 0.528035transforming growth factor, beta induced, 68 kDa 92877_at 0.127121 0.192596 1.256435 0.609513 0.379241 0.628109 -0.029583 0.269797 0.276881 -0.128648Lamin A 98059_s_at 0.293237 -0.003353 1.063849 0.74308 0.372693 0.337976 -0.105274 0.164749 0.365985 0.137587tubulin, beta 5 94788_f_at 0.268954 0.017928 1.472174 0.56238 0.212916 0.486959 -0.19581 0.346319 0.618233 -0.12996ESTs 98346_at -0.298955 1.041677 0.474802 0.485865 0.933109 0.788779 -0.284729 0.299086 -0.018654 0.172497Intercellular adhesion molecule 96752_at 1.1134 1.335823 0.294069 0.154769 -0.117336 1.032653 -0.190495 -0.219524 0.086995 0.15879procollagen, type IV, alpha 2 101039_at -0.046107 0.110588 0.74361 0.801582 0.544584 0.56576 -0.294996 -0.162261 0.063329 0.061536alpha actinin 4 96343_at 0.680848 0.592559 0.217558 0.574832 0.224138 0.302276 -0.184547 -0.206922 -0.088776 -0.204823tubulin alpha 2 98759_f_at 0.212911 0.127285 1.219979 0.345907 0.1102 0.24649 -0.482547 0.901031 0.551637 0.280601sodium channel, voltage-gated, type I, beta polypeptide 102808_at 0.25586 -0.081711 0.724866 0.77293 0.490301 0.088128 -0.364848 0.432925 0.841756 0.291954procollagen, type XV 99637_at 0.391513 -0.162265 1.044238 1.102739 0.401082 0.403017 -0.254686 -0.35669 0.216715 -0.01153immediate early response 3 94384_at 0.23705 -0.1763 1.167892 0.054257 0.447563 0.151535 0.287016 0.281759 0.46541 0.054902rabaptin 5 101381_at 0.066447 1.218102 0.107432 0.110974 0.38247 -0.222123 0.106019 -0.526258 -0.641235 -0.254441tubulin alpha 6 101543_f_at 0.374882 0.145942 0.79231 -0.033118 0.120353 0.281654 0.071464 0.754047 0.702142 -0.083208actin related protein 2/3 complex, subunit 3 (21 kDa) 95434_at 0.543139 0.356395 -0.028976 0.277969 0.466749 0.089632 0.345631 0.043594 0.102171 -0.13301procollagen, type VI, alpha 2 93517_at 0.386882 -0.289732 0.865564 1.222689 0.593479 0.267766 -0.579264 0.650253 0.373278 0.000871calmodulin 96522_at 0.194291 -0.082504 0.762351 0.321272 0.3235 -0.344334 -0.458556 0.131698 0.2309 0.010419GTP cyclohydrolase 1 102313_at 0.367012 1.663663 0.295522 -0.113518 0.234106 0.444737 -0.074793 0.234968 0.309656 -0.145866procollagen, type VI, alpha 1 95493_at 0.125848 -0.219055 0.600584 1.077328 0.565205 0.402758 -0.310874 0.095112 0.393766 -0.122525tubulin alpha 7 93924_f_at 0.132951 0.471513 0.740143 0.072511 -0.18001 0.616488 -0.537446 0.759258 1.042636 0.07834growth arrest and DNA-damage-inducible, alpha 102292_at -0.242245 -0.08768 -1.535559 -0.228088 -0.509692 -1.002098 -0.466973 -0.041719 -0.106981 0.099249RAB9, member RAS oncogene family 95516_at -0.103664 -0.134246 -0.534003 -0.431326 -0.318162 -0.662898 0.044825 -0.337076 -0.571363 -0.270508FK506 binding protein 4 (59 kDa) 92808_f_at 0.202558 0.221267 -1.203009 -0.856501 -0.650225 0.078149 0.037438 0.202838 0.267112 -0.066041
Page 20
Sheehy et al. Comparison of Adaptive and Maladaptive Hypertrophy SUPPLEMENTAL MATERIAL
at Countw
ay Library of M
edicine on July 22, 2010 circgenetics.ahajournals.org
Dow
nloaded from