Embed Size (px)
Citation preview
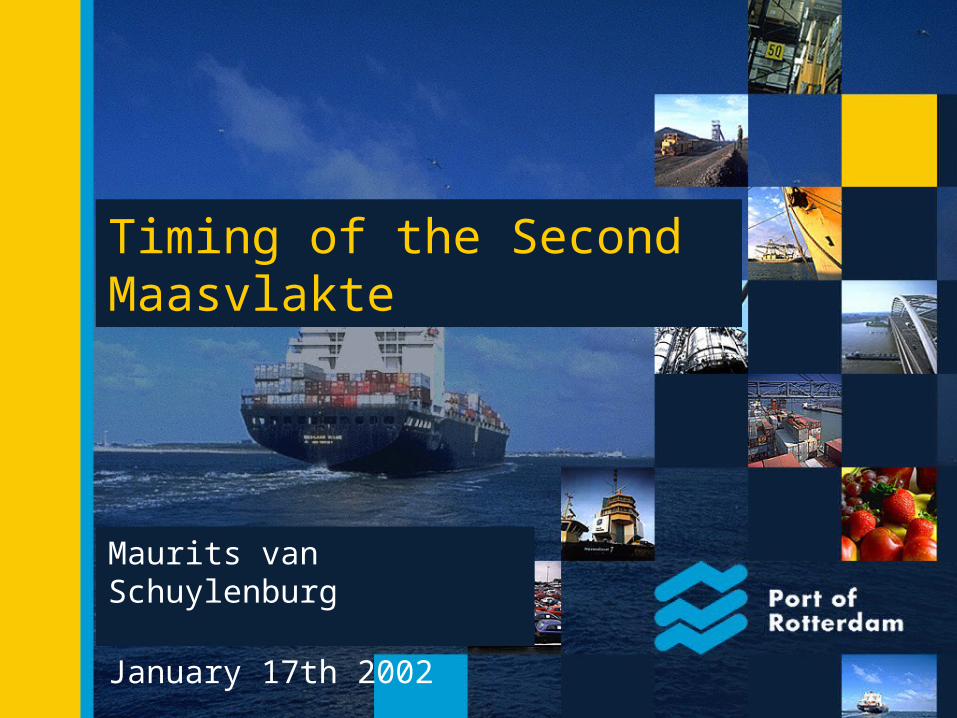
Timing of the Second Maasvlakte
Maurits van Schuylenburg
January 17th 2002
3
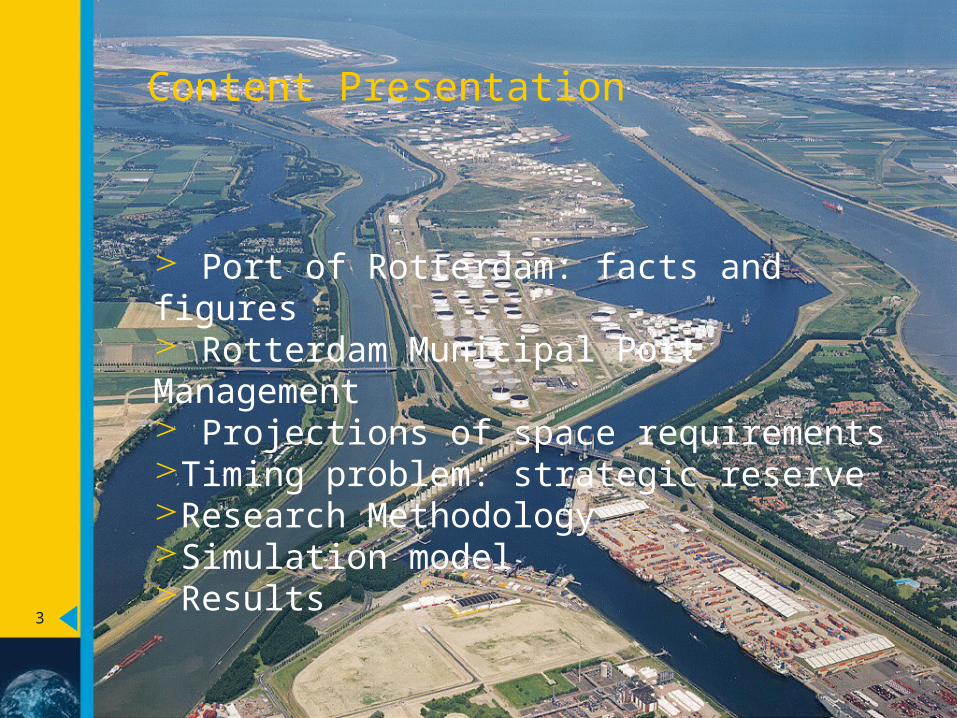
Port of Rotterdam: facts and figures Rotterdam Municipal Port Management Projections of space requirements Timing problem: strategic reserveResearch MethodologySimulation modelResults
Content Presentation
4
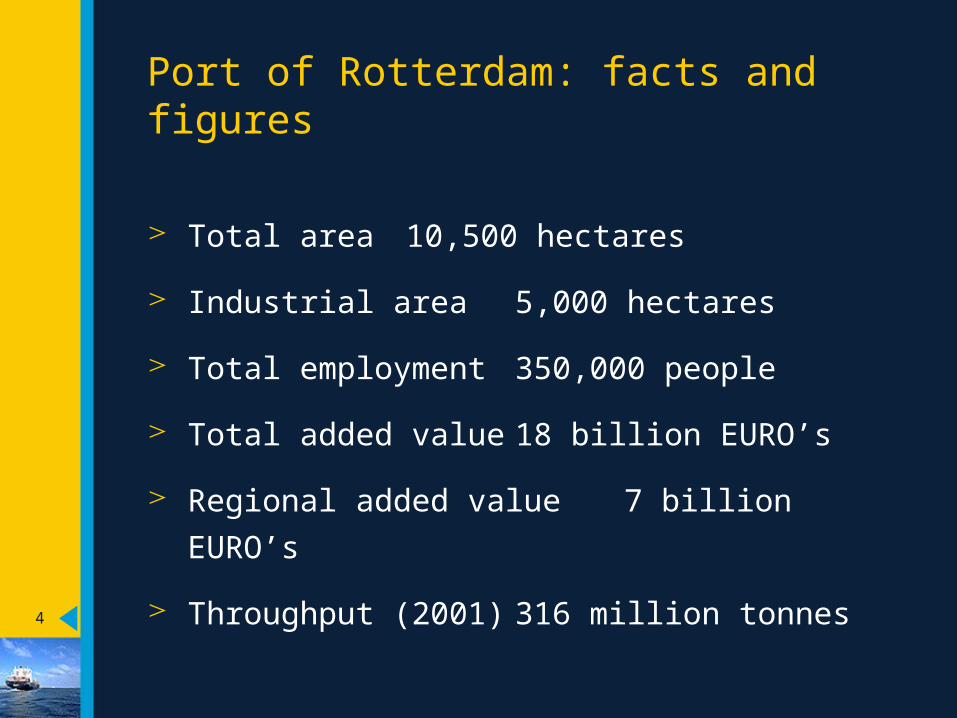
Port of Rotterdam: facts and figures
Total area 10,500 hectares
Industrial area 5,000 hectares
Total employment 350,000 people
Total added value 18 billion EURO’s
Regional added value 7 billion EURO’s
Throughput (2001) 316 million tonnes
5
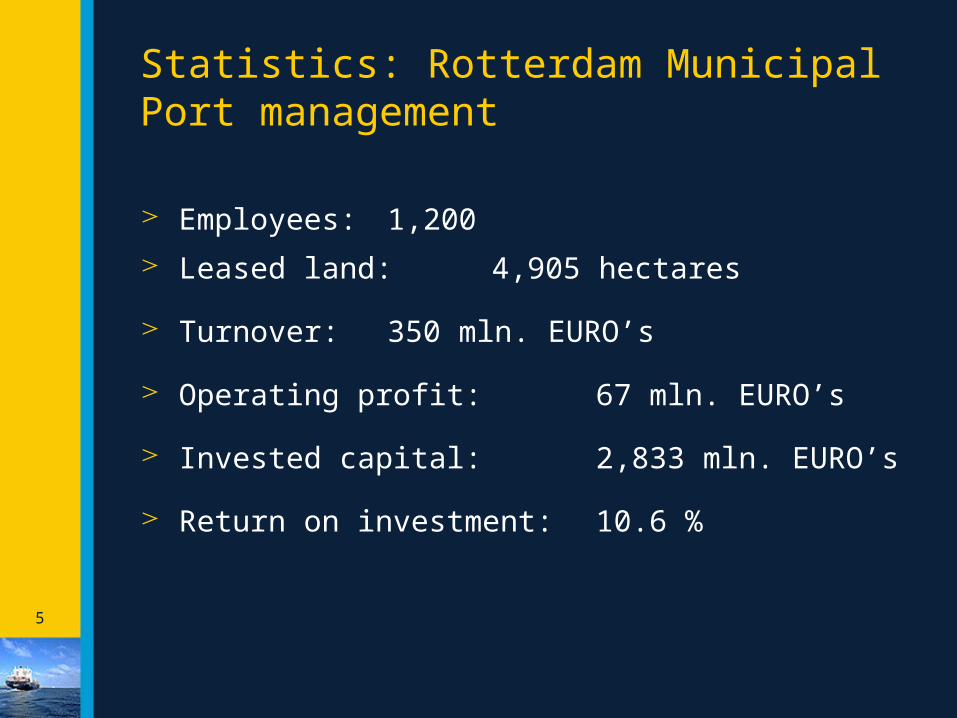
Statistics: Rotterdam Municipal Port management
Employees: 1,200
Leased land: 4,905 hectares
Turnover: 350 mln. EURO’s
Operating profit: 67 mln. EURO’s
Invested capital: 2,833 mln. EURO’s
Return on investment: 10.6 %
6
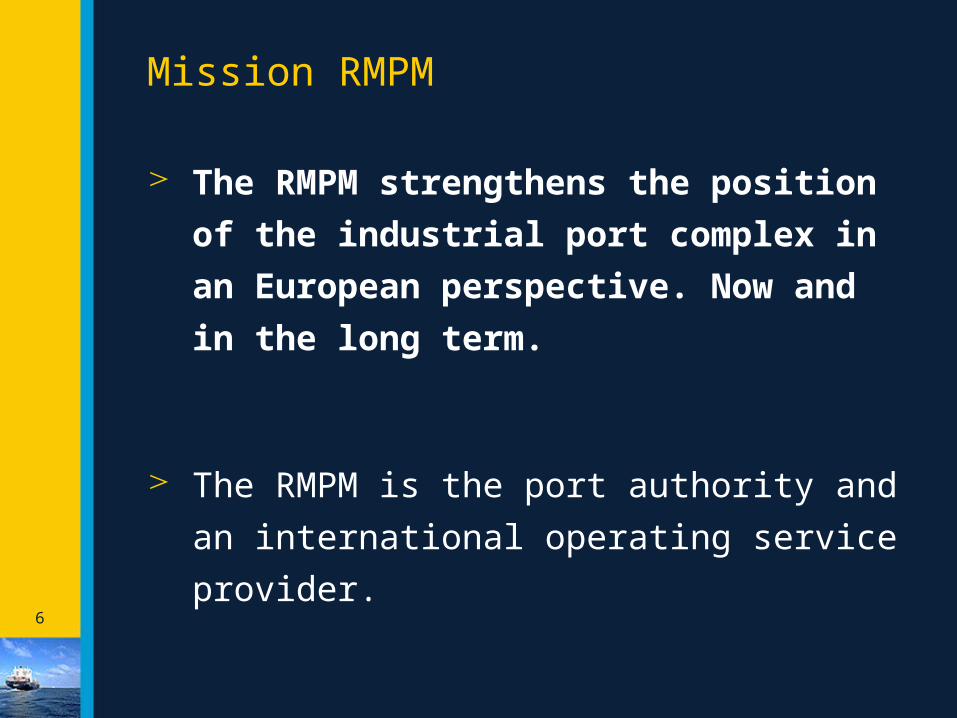
Mission RMPM
The RMPM strengthens the position of the
industrial port complex in an European
perspective. Now and in the long term.
The RMPM is the port authority and an
international operating service provider.
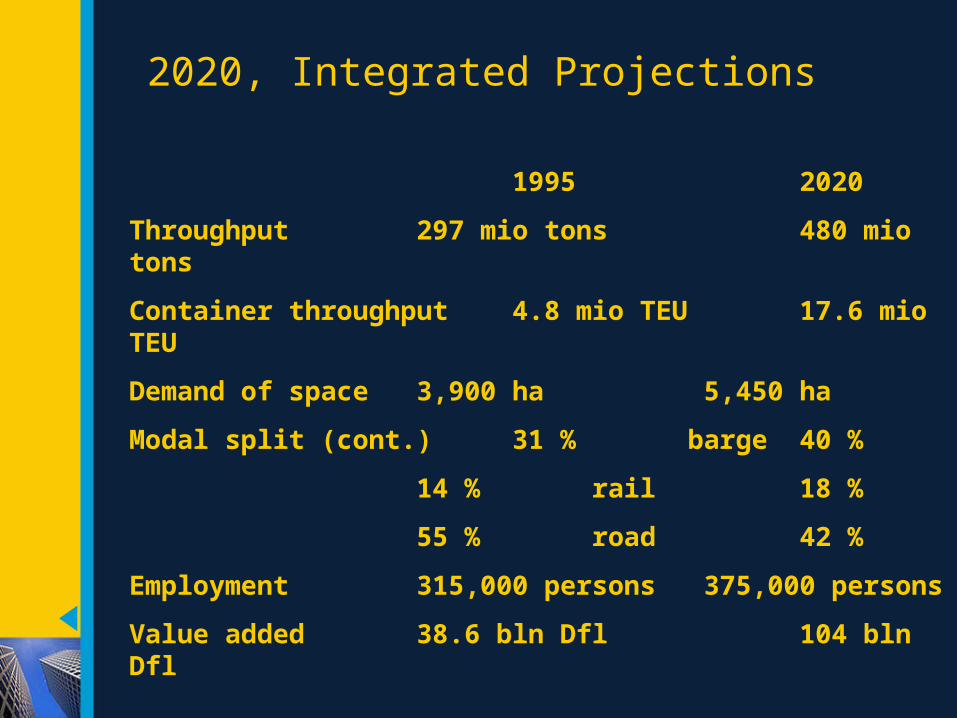
2020, Integrated Projections
1995 2020
Throughput 297 mio tons 480 mio tons
Container throughput 4.8 mio TEU 17.6 mio TEU
Demand of space 3,900 ha 5,450 ha
Modal split (cont.) 31 % barge 40 %
14 % rail 18 %
55 % road 42 %
Employment 315,000 persons 375,000 persons
Value added 38.6 bln Dfl 104 bln Dfl
8
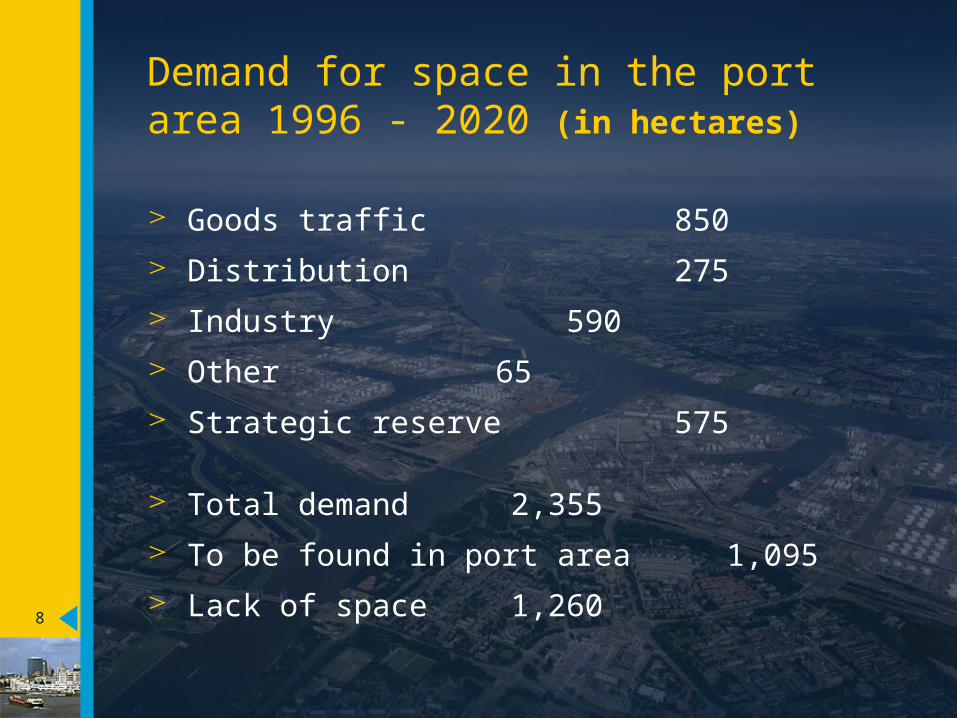
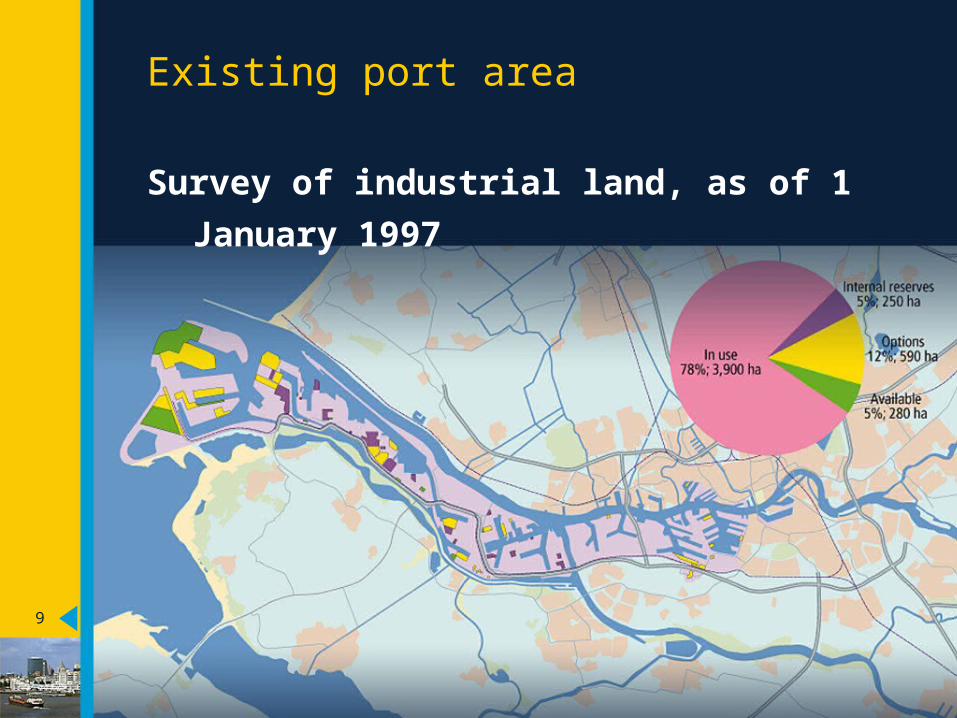
Demand for space in the port area 1996 - 2020 (in hectares)
Goods traffic 850
Distribution 275
Industry 590
Other 65
Strategic reserve 575
Total demand 2,355
To be found in port area 1,095
Lack of space 1,260
9
Existing port area
Survey of industrial land, as of 1 January 1997
10
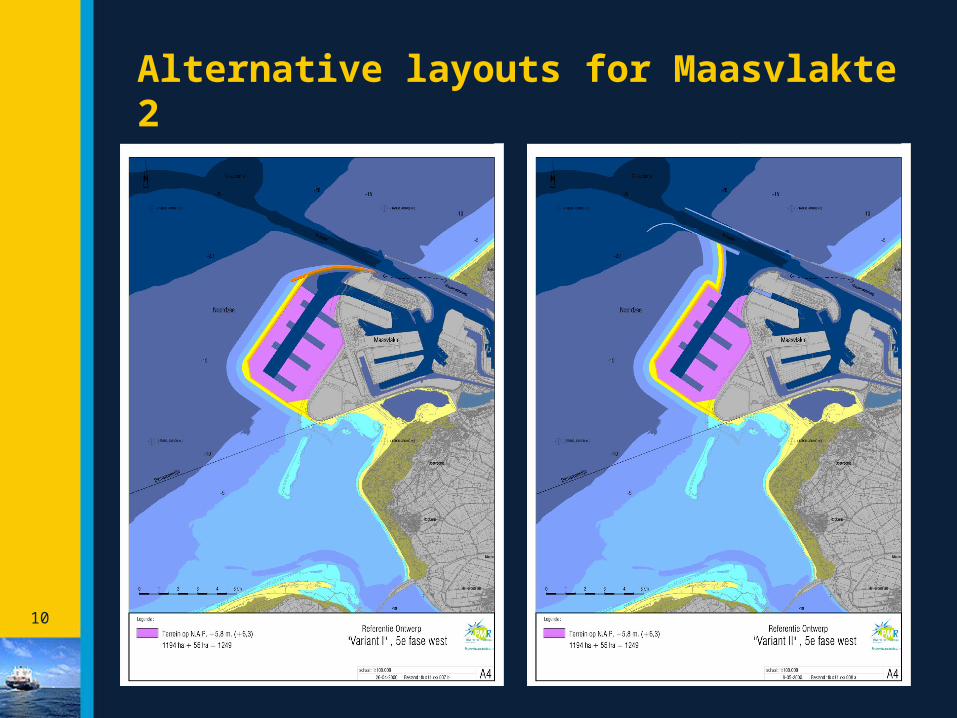
Alternative layouts for Maasvlakte 2
11
Land Reclamation
Two alternative designs:Via Yangtze Port
* Nett number of hectares to be granted: 1,000 (in phases)
* Entrance via Yangtze Port (width 500 m.)
* Costs: 1.8 billion EURO’s
Separate Entrance* Nett number of hectares to be granted: 1,000 (in phases)
* Inland shipping via Yangtze port (width 200 m.)* Costs: 2.3 billion EURO’s
12
Parties involved
Official players:
* National Government (5 ministries)
* Province of South Holland
* Municipality of Rotterdam
* Stadsregio Rotterdam (Greater Rotterdam Area)
Actors:
* Environmental and Nature Groups
* Employers / employees
* Municipalities involved
* Private firms
13
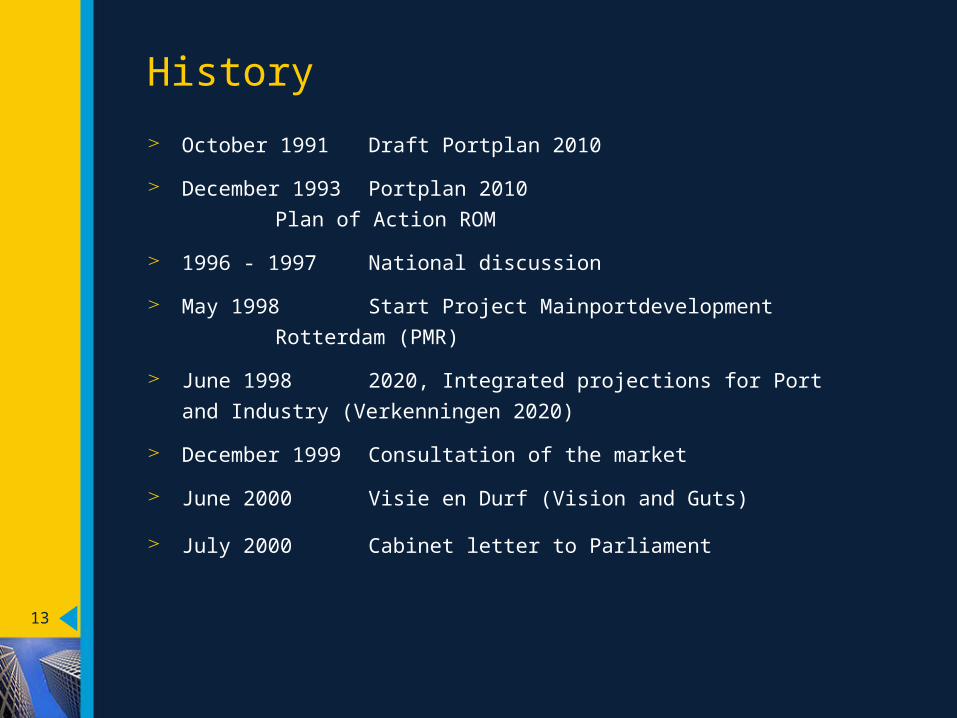
History
October 1991 Draft Portplan 2010
December 1993 Portplan 2010
Plan of Action ROM
1996 - 1997 National discussion
May 1998 Start Project Mainportdevelopment
Rotterdam (PMR)
June 1998 2020, Integrated projections for Port
and Industry (Verkenningen 2020)
December 1999 Consultation of the market
June 2000 Visie en Durf (Vision and Guts)
July 2000 Cabinet letter to Parliament
14
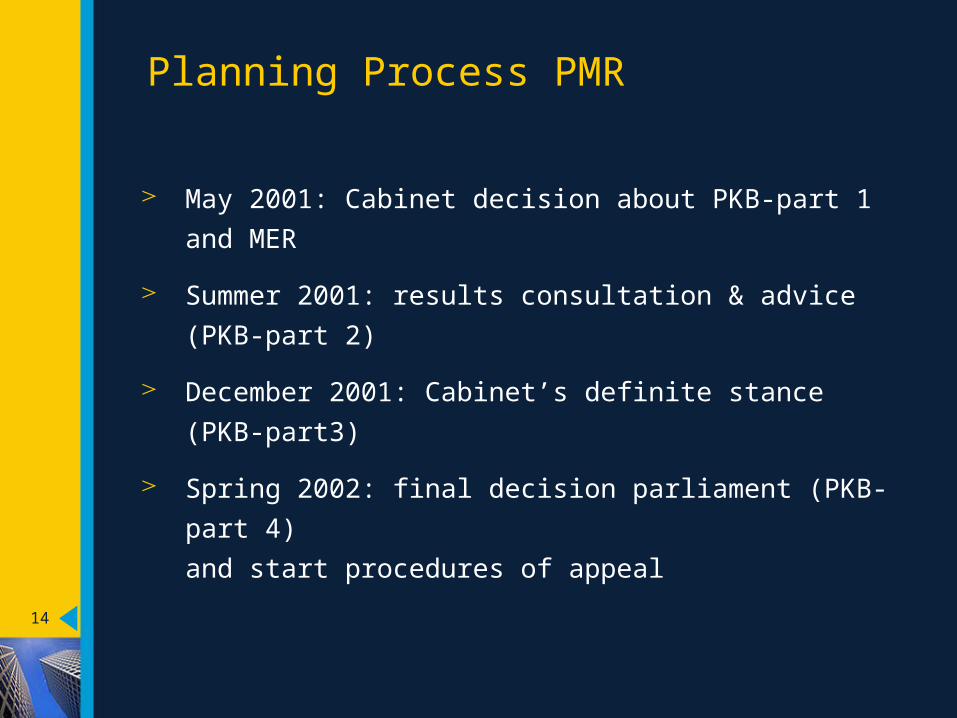
Planning Process PMR
May 2001: Cabinet decision about PKB-part 1 and MER
Summer 2001: results consultation & advice (PKB-part 2)
December 2001: Cabinet’s definite stance (PKB-part3)
Spring 2002: final decision parliament (PKB-part 4)
and start procedures of appeal
15
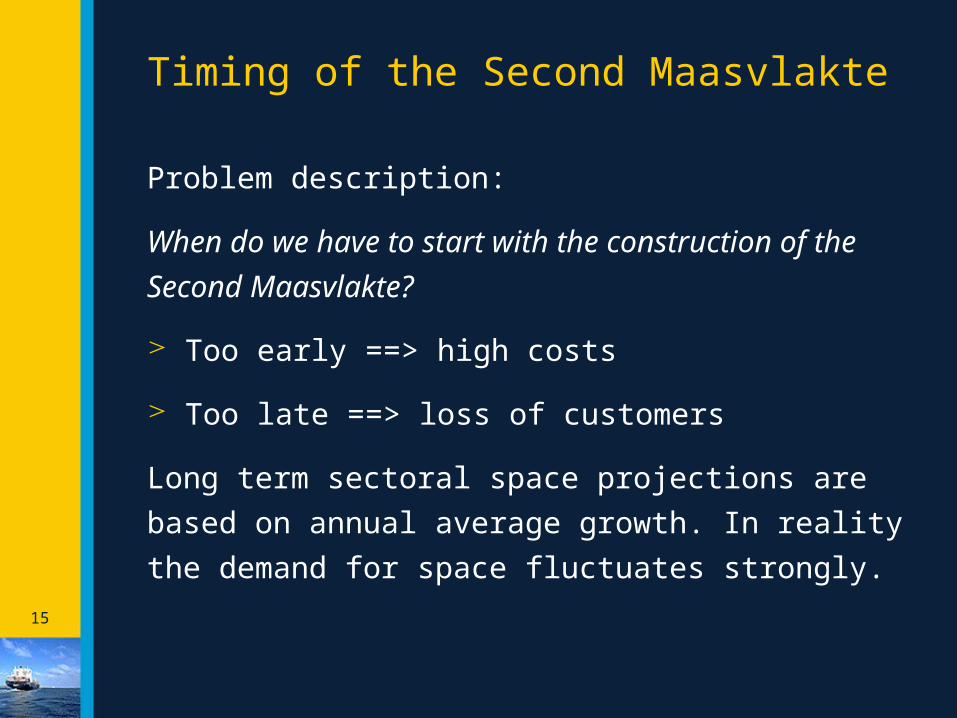
Timing of the Second Maasvlakte
Problem description:
When do we have to start with the construction of the
Second Maasvlakte?
Too early ==> high costs
Too late ==> loss of customers
Long term sectoral space projections are based on
annual average growth. In reality the demand for
space fluctuates strongly.
16
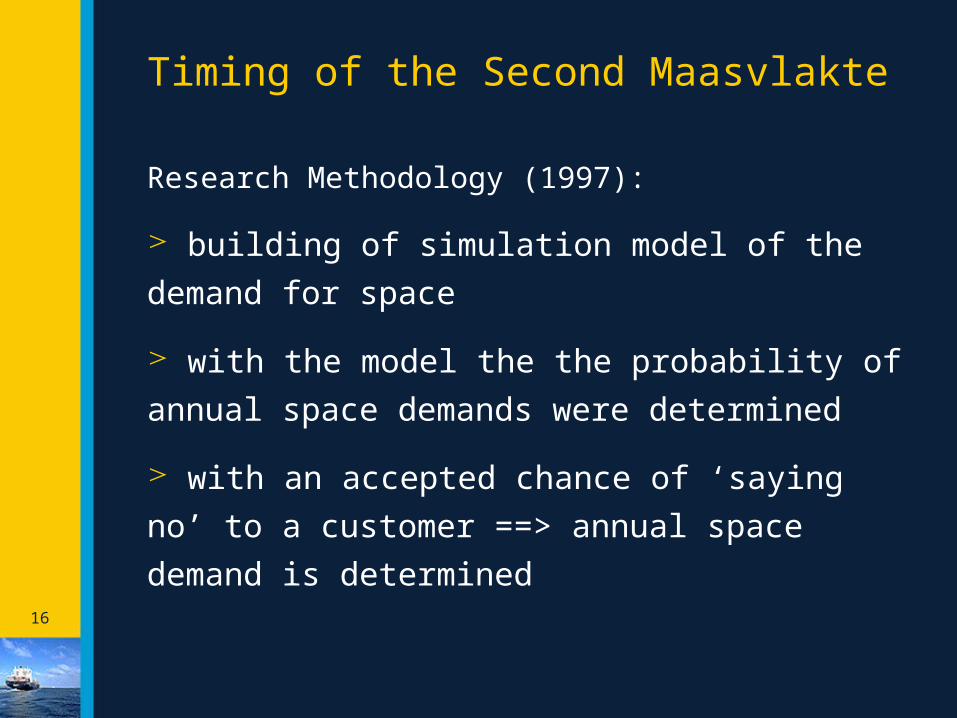
Timing of the Second Maasvlakte
Research Methodology (1997):
building of simulation model of the demand for
space
with the model the the probability of annual
space demands were determined
with an accepted chance of ‘saying no’ to a
customer ==> annual space demand is
determined
17
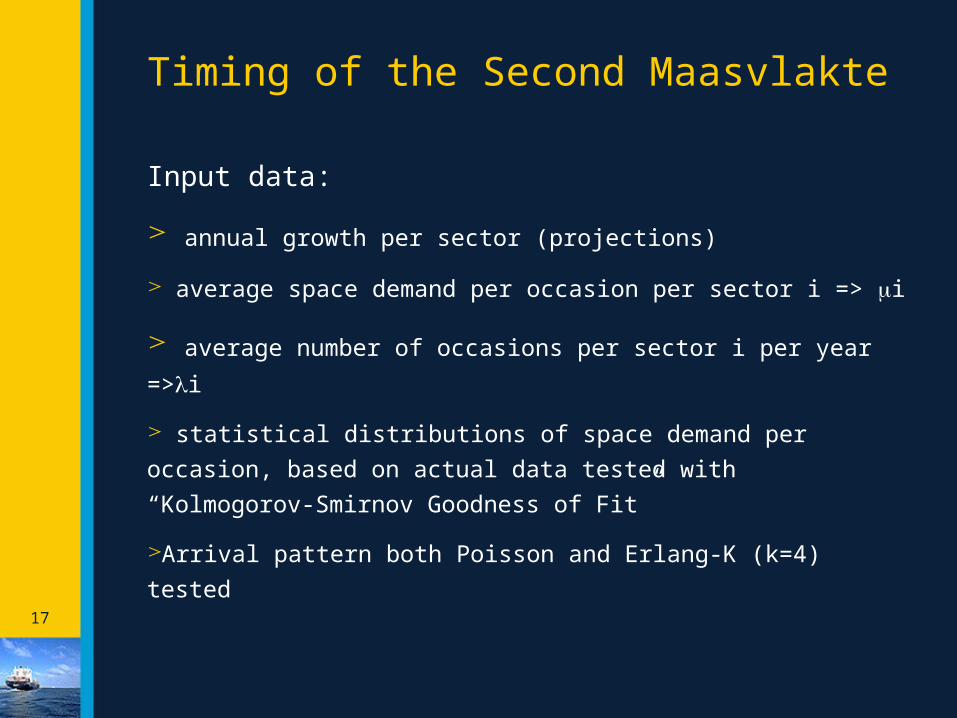
Timing of the Second Maasvlakte
Input data:
annual growth per sector (projections)
average space demand per occasion per sector i => i
average number of occasions per sector i per year =>i
statistical distributions of space demand per occasion, based
on actual data tested with “Kolmogorov-Smirnov Goodness of
Fit”
Arrival pattern both Poisson and Erlang-K (k=4) tested
18
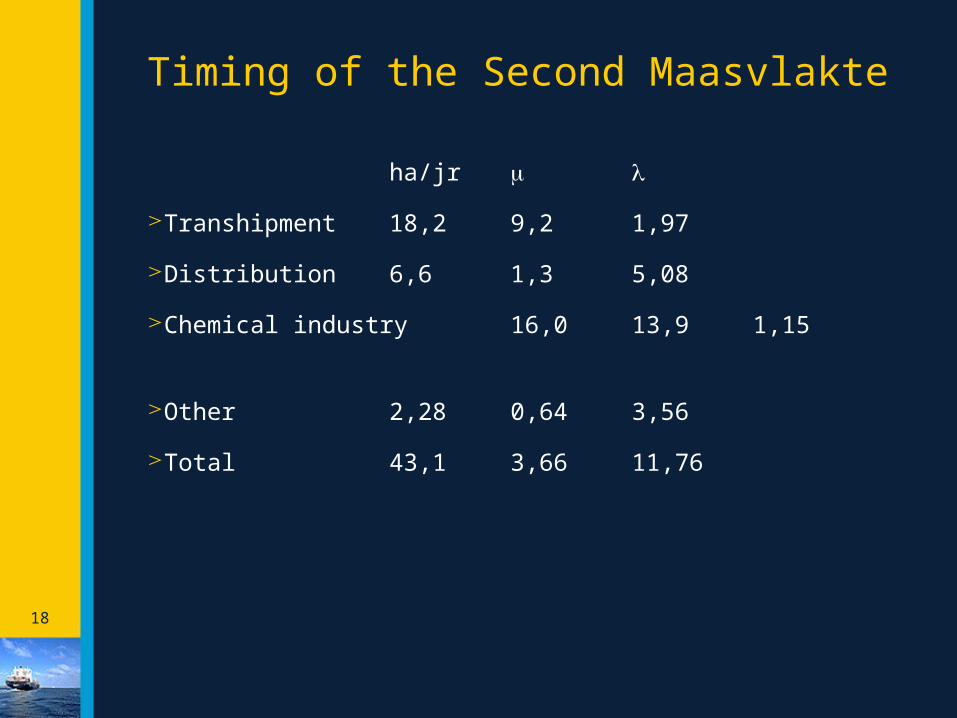
Timing of the Second Maasvlakte
ha/jr
Transhipment 18,2 9,2 1,97
Distribution 6,6 1,3 5,08
Chemical industry 16,0 13,9 1,15
Other 2,28 0,64 3,56
Total 43,1 3,66 11,76
19
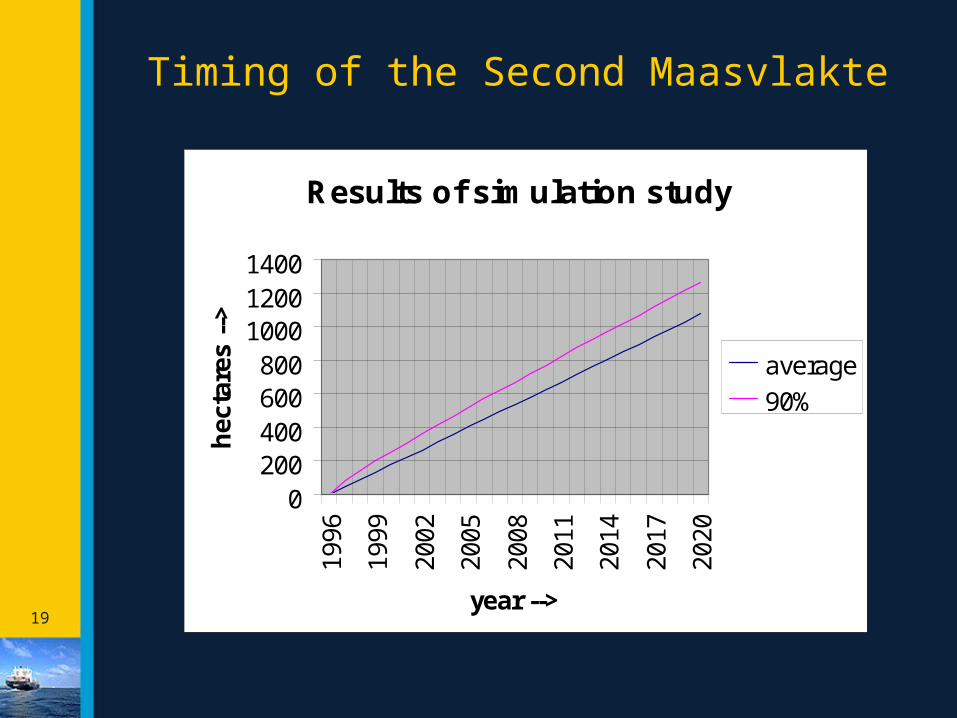
Timing of the Second Maasvlakte
Results of simulation study
0200400600800
100012001400
1996
1999
2002
2005
2008
2011
2014
2017
2020
year -->
hec
tare
s --
>
average
90%
20
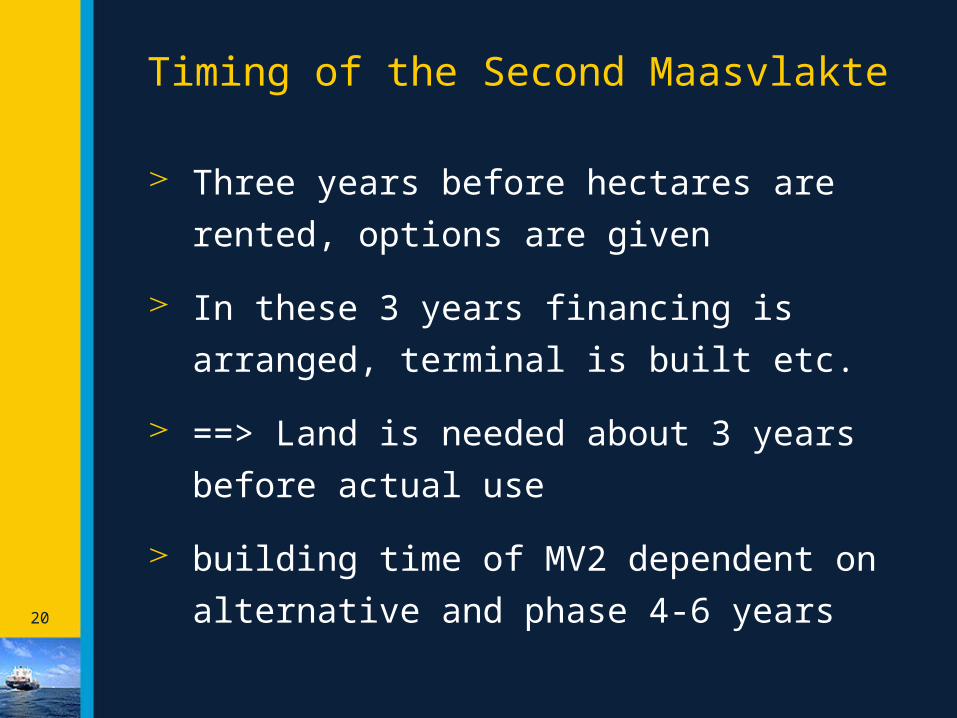
Timing of the Second Maasvlakte
Three years before hectares are rented,
options are given
In these 3 years financing is arranged,
terminal is built etc.
==> Land is needed about 3 years before
actual use
building time of MV2 dependent on alternative
and phase 4-6 years
21
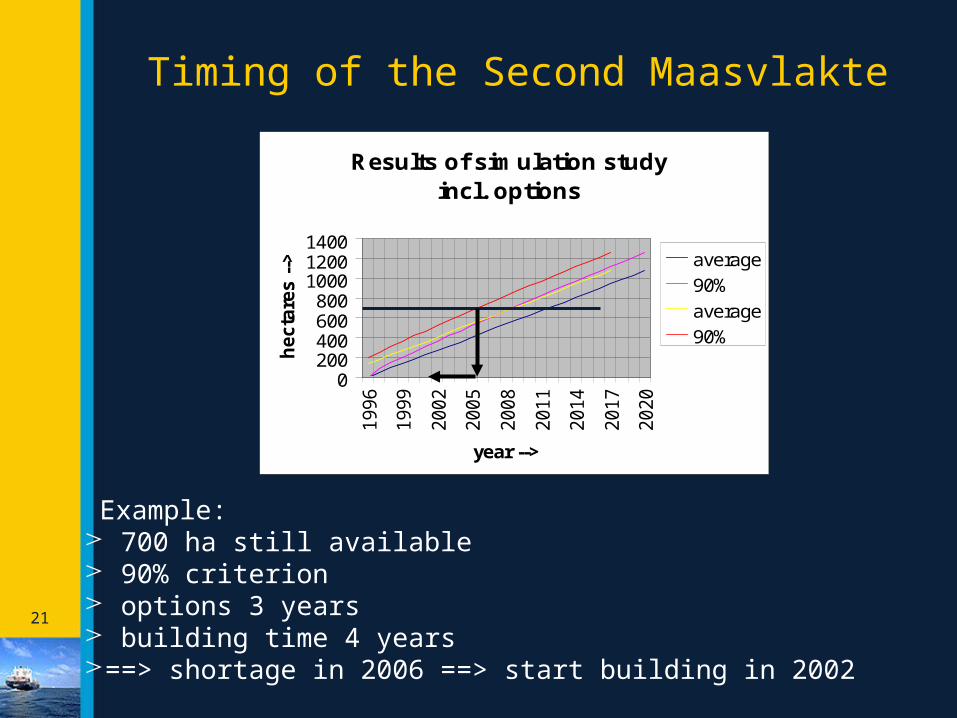
Timing of the Second Maasvlakte
Results of simulation studyincl. options
0200400600800
100012001400
1996
1999
2002
2005
2008
2011
2014
2017
2020
year -->
hecta
res -
-> average
90%
average
90%
Example: 700 ha still available 90% criterion options 3 years building time 4 years==> shortage in 2006 ==> start building in 2002
Thank You!