Embed Size (px)
Citation preview
14 T I R E R E V I E W - September/2011
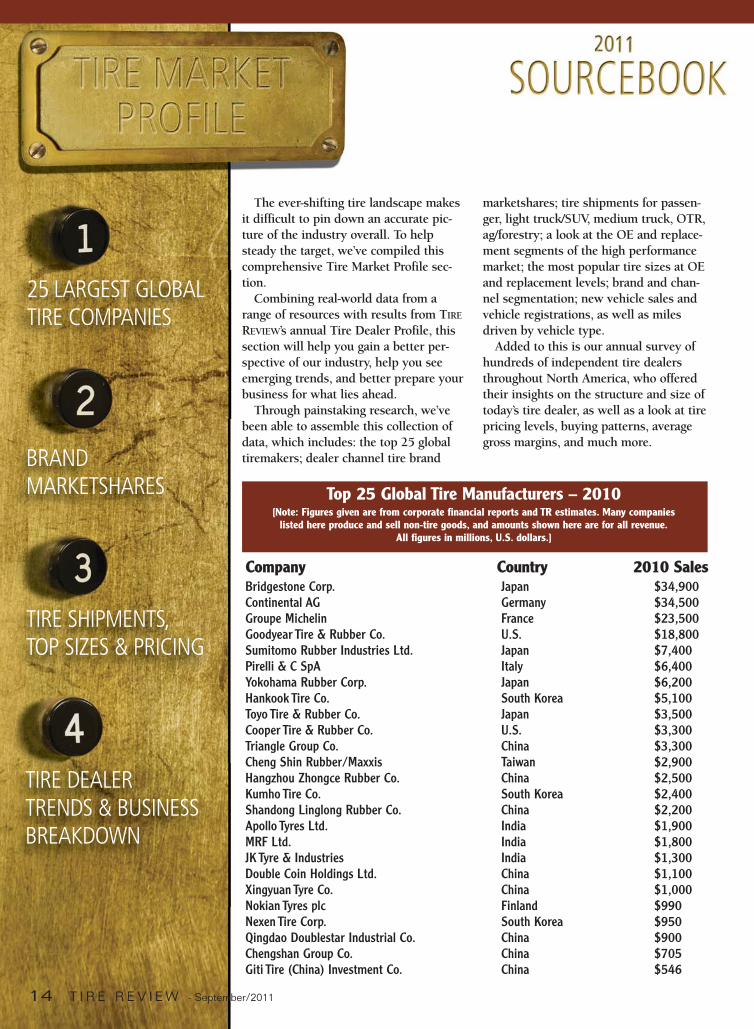
The ever-shifting tire landscape makesit difficult to pin down an accurate pic-ture of the industry overall. To helpsteady the target, we’ve compiled thiscomprehensive Tire Market Profile sec-tion.
Combining real-world data from arange of resources with results from TIRE
REVIEW’s annual Tire Dealer Profile, thissection will help you gain a better per-spective of our industry, help you seeemerging trends, and better prepare yourbusiness for what lies ahead.
Through painstaking research, we’vebeen able to assemble this collection ofdata, which includes: the top 25 globaltiremakers; dealer channel tire brand
marketshares; tire shipments for passen-ger, light truck/SUV, medium truck, OTR,ag/forestry; a look at the OE and replace-ment segments of the high performancemarket; the most popular tire sizes at OEand replacement levels; brand and chan-nel segmentation; new vehicle sales andvehicle registrations, as well as milesdriven by vehicle type.
Added to this is our annual survey ofhundreds of independent tire dealersthroughout North America, who offeredtheir insights on the structure and size oftoday’s tire dealer, as well as a look at tirepricing levels, buying patterns, averagegross margins, and much more.
25 LARGEST GLOBALTIRE COMPANIES
BRAND MARKETSHARES
TIRE SHIPMENTS, TOP SIZES & PRICING
TIRE DEALER TRENDS & BUSINESS BREAKDOWN
Top 25 Global Tire Manufacturers – 2010[Note: Figures given are from corporate financial reports and TR estimates. Many companies
listed here produce and sell non-tire goods, and amounts shown here are for all revenue. All figures in millions, U.S. dollars.]
Bridgestone Corp. Japan $34,900Continental AG Germany $34,500Groupe Michelin France $23,500Goodyear Tire & Rubber Co. U.S. $18,800Sumitomo Rubber Industries Ltd. Japan $7,400Pirelli & C SpA Italy $6,400Yokohama Rubber Corp. Japan $6,200Hankook Tire Co. South Korea $5,100Toyo Tire & Rubber Co. Japan $3,500Cooper Tire & Rubber Co. U.S. $3,300Triangle Group Co. China $3,300Cheng Shin Rubber/Maxxis Taiwan $2,900Hangzhou Zhongce Rubber Co. China $2,500Kumho Tire Co. South Korea $2,400Shandong Linglong Rubber Co. China $2,200Apollo Tyres Ltd. India $1,900MRF Ltd. India $1,800JK Tyre & Industries India $1,300Double Coin Holdings Ltd. China $1,100Xingyuan Tyre Co. China $1,000Nokian Tyres plc Finland $990Nexen Tire Corp. South Korea $950Qingdao Doublestar Industrial Co. China $900Chengshan Group Co. China $705Giti Tire (China) Investment Co. China $546
Company Country 2010 Sales
14-46 Tire Market Profile_Layout 1 9/22/11 1:31 PM Page 14
September/2011 - t i r e r e v i e w . c o m 15
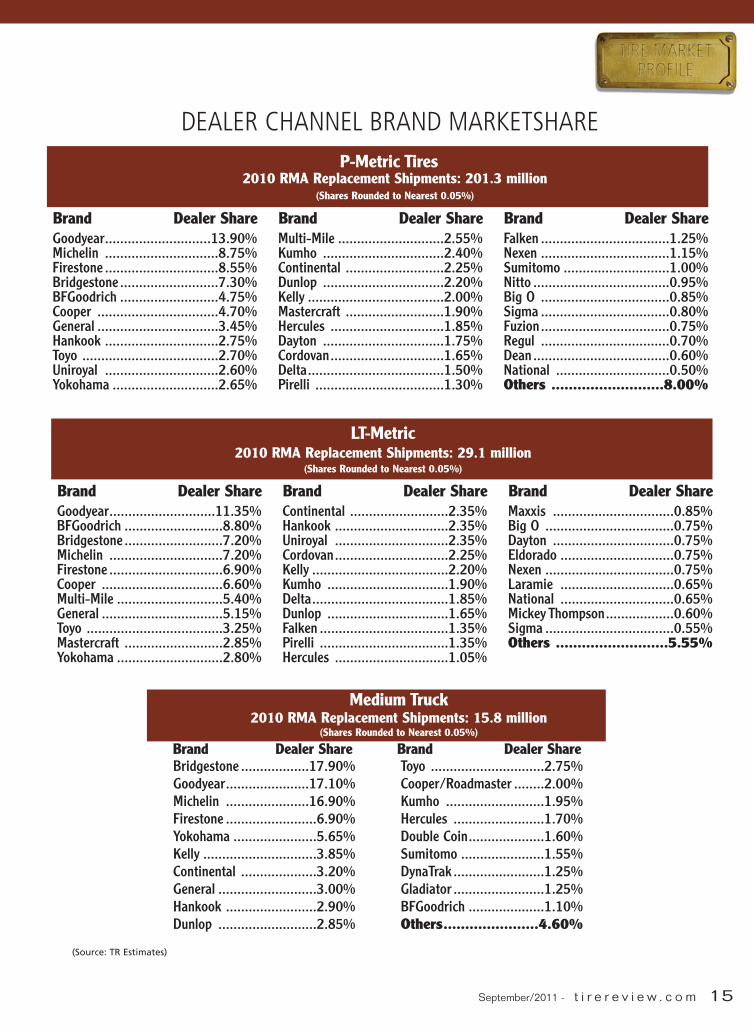
Medium Truck 2010 RMA Replacement Shipments: 15.8 million
(Shares Rounded to Nearest 0.05%)
Bridgestone ..................17.90%Goodyear......................17.10%Michelin ......................16.90%Firestone ........................6.90%Yokohama ......................5.65%Kelly ..............................3.85%Continental ....................3.20%General ..........................3.00%Hankook ........................2.90%Dunlop ..........................2.85%
Toyo ..............................2.75%Cooper/Roadmaster ........2.00%Kumho ..........................1.95%Hercules ........................1.70%Double Coin....................1.60%Sumitomo ......................1.55%DynaTrak ........................1.25%Gladiator ........................1.25%BFGoodrich ....................1.10%Others......................4.60%
Goodyear............................13.90%Michelin ..............................8.75%Firestone ..............................8.55%Bridgestone ..........................7.30%BFGoodrich ..........................4.75%Cooper ................................4.70%General ................................3.45%Hankook ..............................2.75%Toyo ....................................2.70%Uniroyal ..............................2.60%Yokohama ............................2.65%
Multi-Mile ............................2.55%Kumho ................................2.40%Continental ..........................2.25%Dunlop ................................2.20%Kelly ....................................2.00%Mastercraft ..........................1.90%Hercules ..............................1.85%Dayton ................................1.75%Cordovan..............................1.65%Delta....................................1.50%Pirelli ..................................1.30%
Falken ..................................1.25%Nexen ..................................1.15%Sumitomo ............................1.00%Nitto ....................................0.95%Big O ..................................0.85%Sigma ..................................0.80%Fuzion..................................0.75%Regul ..................................0.70%Dean ....................................0.60%National ..............................0.50%Others ..........................8.00%
P-Metric Tires2010 RMA Replacement Shipments: 201.3 million
(Shares Rounded to Nearest 0.05%)
LT-Metric2010 RMA Replacement Shipments: 29.1 million
(Shares Rounded to Nearest 0.05%)
Brand Dealer Share Brand Dealer Share Brand Dealer Share
Goodyear............................11.35%BFGoodrich ..........................8.80%Bridgestone ..........................7.20%Michelin ..............................7.20%Firestone ..............................6.90%Cooper ................................6.60%Multi-Mile ............................5.40%General ................................5.15%Toyo ....................................3.25%Mastercraft ..........................2.85%Yokohama ............................2.80%
Continental ..........................2.35%Hankook ..............................2.35%Uniroyal ..............................2.35%Cordovan..............................2.25%Kelly ....................................2.20%Kumho ................................1.90%Delta....................................1.85%Dunlop ................................1.65%Falken ..................................1.35%Pirelli ..................................1.35%Hercules ..............................1.05%
Maxxis ................................0.85%Big O ..................................0.75%Dayton ................................0.75%Eldorado ..............................0.75%Nexen ..................................0.75%Laramie ..............................0.65%National ..............................0.65%Mickey Thompson..................0.60%Sigma ..................................0.55%Others ..........................5.55%
Brand Dealer Share Brand Dealer Share Brand Dealer Share
DEALER CHANNEL BRAND MARKETSHARE
Brand Dealer Share Brand Dealer Share
(Source: TR Estimates)
14-46 Tire Market Profile_Layout 1 9/22/11 1:31 PM Page 15
16 T I R E R E V I E W - September/2011
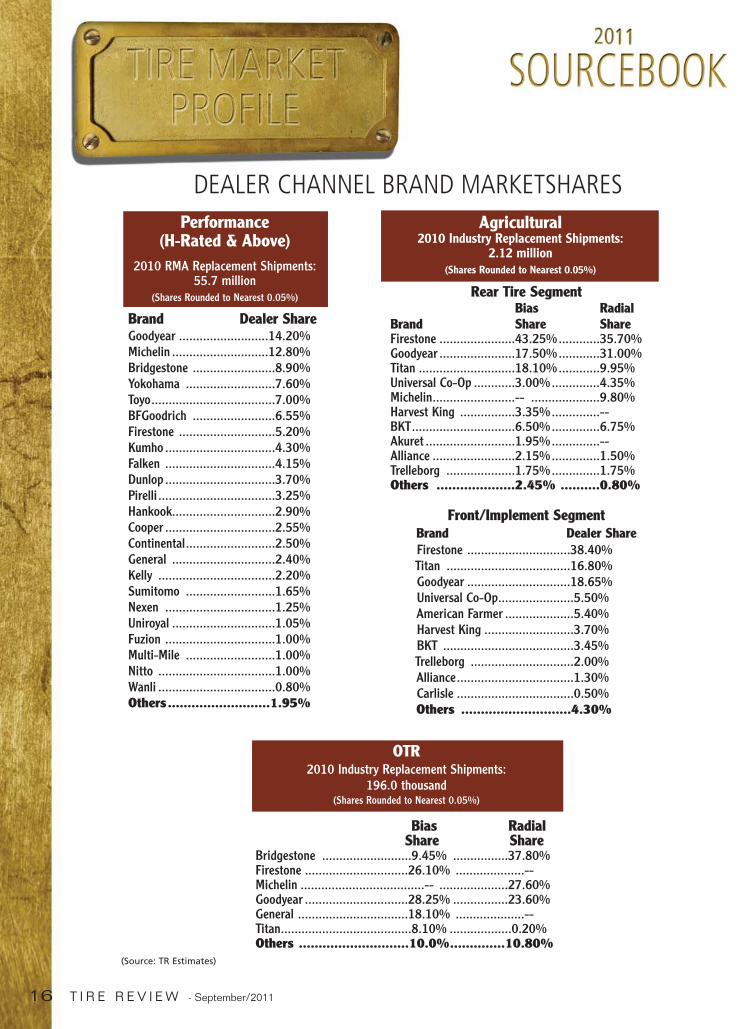
Performance (H-Rated & Above)
2010 RMA Replacement Shipments:55.7 million
(Shares Rounded to Nearest 0.05%)
Brand Dealer ShareGoodyear ..........................14.20%Michelin ............................12.80%Bridgestone ........................8.90%Yokohama ..........................7.60%Toyo....................................7.00%BFGoodrich ........................6.55%Firestone ............................5.20%Kumho ................................4.30%Falken ................................4.15%Dunlop ................................3.70%Pirelli ..................................3.25%Hankook..............................2.90%Cooper ................................2.55%Continental..........................2.50%General ..............................2.40%Kelly ..................................2.20%Sumitomo ..........................1.65%Nexen ................................1.25%Uniroyal ..............................1.05%Fuzion ................................1.00%Multi-Mile ..........................1.00%Nitto ..................................1.00%Wanli ..................................0.80%Others..........................1.95%
Bias RadialShare Share
Bridgestone ..........................9.45% ................37.80%Firestone ..............................26.10% ....................--Michelin ....................................-- ....................27.60%Goodyear ..............................28.25% ................23.60%General ................................18.10% ....................--Titan......................................8.10% ..................0.20%Others ............................10.0%..............10.80%
OTR 2010 Industry Replacement Shipments:
196.0 thousand(Shares Rounded to Nearest 0.05%)
Agricultural2010 Industry Replacement Shipments:
2.12 million(Shares Rounded to Nearest 0.05%)
(Source: TR Estimates)
Rear Tire SegmentBias Radial
Brand Share ShareFirestone ......................43.25%............35.70%Goodyear ......................17.50%............31.00%Titan ............................18.10%............9.95%Universal Co-Op ............3.00%..............4.35%Michelin........................-- ....................9.80%Harvest King ................3.35%..............--BKT..............................6.50%..............6.75%Akuret ..........................1.95%..............--Alliance ........................2.15%..............1.50%Trelleborg ....................1.75%..............1.75%Others ....................2.45% ..........0.80%
Front/Implement SegmentBrand Dealer ShareFirestone ..............................38.40%Titan ....................................16.80%Goodyear ..............................18.65%Universal Co-Op......................5.50%American Farmer ....................5.40%Harvest King ..........................3.70%BKT ......................................3.45%Trelleborg ..............................2.00%Alliance..................................1.30%Carlisle ..................................0.50%Others ............................4.30%
DEALER CHANNEL BRAND MARKETSHARES
14-46 Tire Market Profile_Layout 1 9/22/11 1:31 PM Page 16
18 T I R E R E V I E W - September/2011
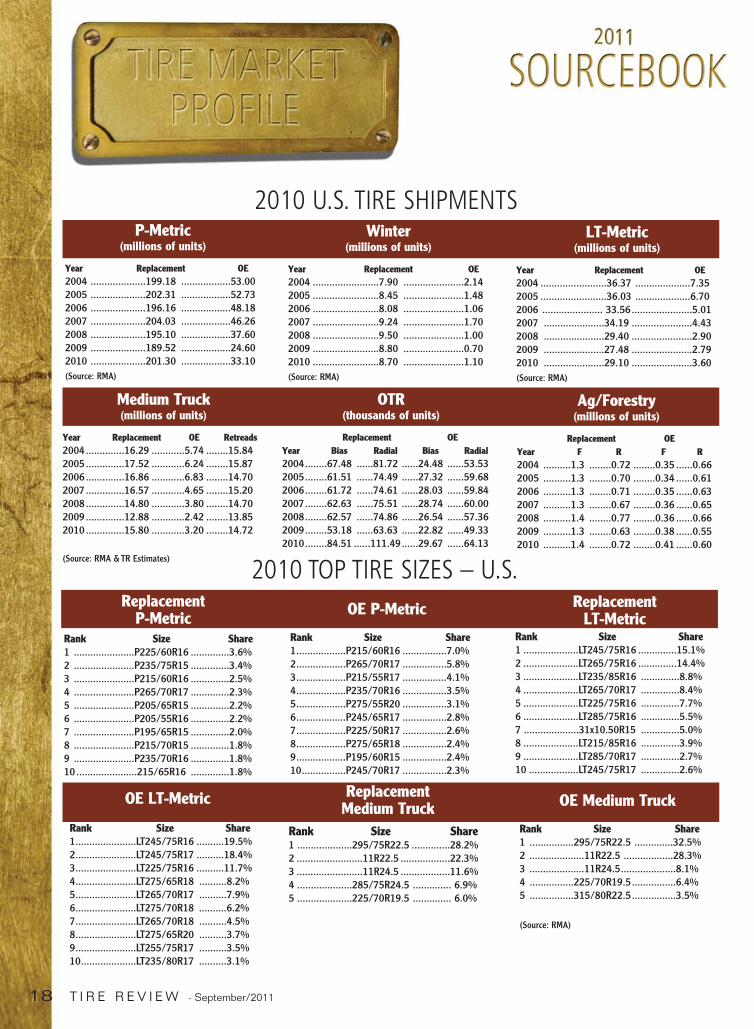
2010 U.S. TIRE SHIPMENTSP-Metric
(millions of units)
Year Replacement OE2004 ....................199.18 ..................53.002005 ....................202.31 ..................52.732006 ....................196.16 ..................48.182007 ....................204.03 ..................46.262008 ....................195.10 ..................37.602009 ....................189.52 ..................24.602010 ....................201.30 ..................33.10(Source: RMA)
Winter(millions of units)
Year Replacement OE2004 ........................7.90 ......................2.142005 ........................8.45 ......................1.482006 ........................8.08 ......................1.062007 ........................9.24 ......................1.702008 ........................9.50 ......................1.002009 ........................8.80 ......................0.702010 ........................8.70 ......................1.10(Source: RMA)
LT-Metric(millions of units)
Year Replacement OE2004 ........................36.37 ....................7.352005 ........................36.03 ....................6.702006 ...................... 33.56......................5.012007 ......................34.19 ......................4.432008 ......................29.40 ......................2.902009 ......................27.48 ......................2.792010 ......................29.10 ......................3.60(Source: RMA)
Medium Truck(millions of units)
Year Replacement OE Retreads2004..............16.29 ............5.74 ........15.842005..............17.52 ............6.24 ........15.872006..............16.86 ............6.83 ........14.702007..............16.57 ............4.65 ........15.202008..............14.80 ............3.80 ........14.702009..............12.88 ............2.42 ........13.852010..............15.80 ............3.20 ........14.72
(Source: RMA & TR Estimates)
Ag/Forestry(millions of units)
Replacement OEYear F R F R2004 ..........1.3 ........0.72 ........0.35 ......0.662005 ..........1.3 ........0.70 ........0.34 ......0.612006 ..........1.3 ........0.71 ........0.35 ......0.632007 ..........1.3 ........0.67 ........0.36 ......0.652008 ..........1.4 ........0.77 ........0.36 ......0.662009 ..........1.3 ........0.63 ........0.38 ......0.552010 ..........1.4 ........0.72 ........0.41 ......0.60
OTR(thousands of units)
Replacement OEYear Bias Radial Bias Radial2004........67.48 ......81.72 ......24.48 ......53.532005........61.51 ......74.49 ......27.32 ......59.682006........61.72 ......74.61 ......28.03 ......59.842007........62.63 ......75.51 ......28.74 ......60.002008........62.57 ......74.86 ......26.54 ......57.362009........53.18 ......63.63 ......22.82 ......49.332010........84.51 ......111.49......29.67 ......64.13
ReplacementLT-Metric
Rank Size Share1 ....................LT245/75R16 ..............15.1%2 ....................LT265/75R16 ..............14.4%3 ....................LT235/85R16 ..............8.8%4 ....................LT265/70R17 ..............8.4%5 ....................LT225/75R16 ..............7.7%6 ....................LT285/75R16 ..............5.5%7 ....................31x10.50R15 ..............5.0%8 ....................LT215/85R16 ..............3.9%9 ....................LT285/70R17 ..............2.7%10 ..................LT245/75R17 ..............2.6%
ReplacementP-Metric
Rank Size Share1 ......................P225/60R16 ..............3.6%2 ......................P235/75R15 ..............3.4%3 ......................P215/60R16 ..............2.5%4 ......................P265/70R17 ..............2.3%5 ......................P205/65R15 ..............2.2%6 ......................P205/55R16 ..............2.2%7 ......................P195/65R15 ..............2.0%8 ......................P215/70R15 ..............1.8%9 ......................P235/70R16 ..............1.8%10 ......................215/65R16 ..............1.8%
OE P-Metric
Rank Size Share1..................P215/60R16 ................7.0%2..................P265/70R17 ................5.8%3..................P215/55R17 ................4.1%4..................P235/70R16 ................3.5%5..................P275/55R20 ................3.1%6..................P245/65R17 ................2.8%7..................P225/50R17 ................2.6%8..................P275/65R18 ................2.4%9..................P195/60R15 ................2.4%10................P245/70R17 ................2.3%
OE LT-Metric
Rank Size Share1......................LT245/75R16 ..........19.5%2......................LT245/75R17 ..........18.4%3......................LT225/75R16 ..........11.7%4......................LT275/65R18 ..........8.2%5......................LT265/70R17 ..........7.9%6......................LT275/70R18 ..........6.2% 7......................LT265/70R18 ..........4.5%8......................LT275/65R20 ..........3.7%9......................LT255/75R17 ..........3.5%10....................LT235/80R17 ..........3.1%
ReplacementMedium Truck
Rank Size Share1 ....................295/75R22.5 ..............28.2%2 ........................11R22.5 ..................22.3%3 ........................11R24.5 ..................11.6%4 ....................285/75R24.5 .............. 6.9%5 ....................225/70R19.5 .............. 6.0%
OE Medium Truck
Rank Size Share1 ................295/75R22.5 ..............32.5% 2 ....................11R22.5 ..................28.3%3 ....................11R24.5....................8.1%4 ................225/70R19.5................6.4%5 ................315/80R22.5................3.5%
(Source: RMA)
2010 TOP TIRE SIZES – U.S.
14-46 Tire Market Profile_Layout 1 9/22/11 1:31 PM Page 18
20 T I R E R E V I E W - September/2011
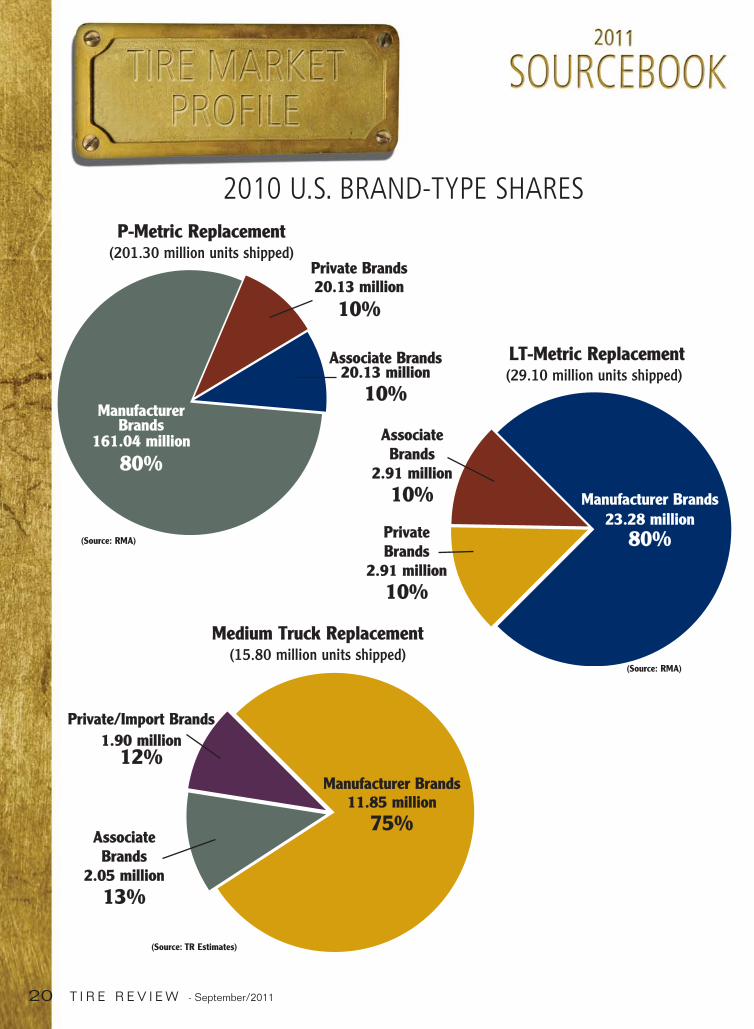
Medium Truck Replacement(15.80 million units shipped)
Manufacturer Brands11.85 million
75%
Private/Import Brands1.90 million
12%
(Source: TR Estimates)
2010 U.S. BRAND-TYPE SHARESP-Metric Replacement
(201.30 million units shipped)
LT-Metric Replacement(29.10 million units shipped)
Manufacturer Brands23.28 million
80%
Manufacturer Brands
161.04 million
80%
PrivateBrands
2.91 million10%
Private Brands20.13 million
10%
AssociateBrands
2.91 million10%
Associate Brands20.13 million
10%
(Source: RMA)
AssociateBrands
2.05 million13%
(Source: RMA)
14-46 Tire Market Profile_Layout 1 9/22/11 1:31 PM Page 20
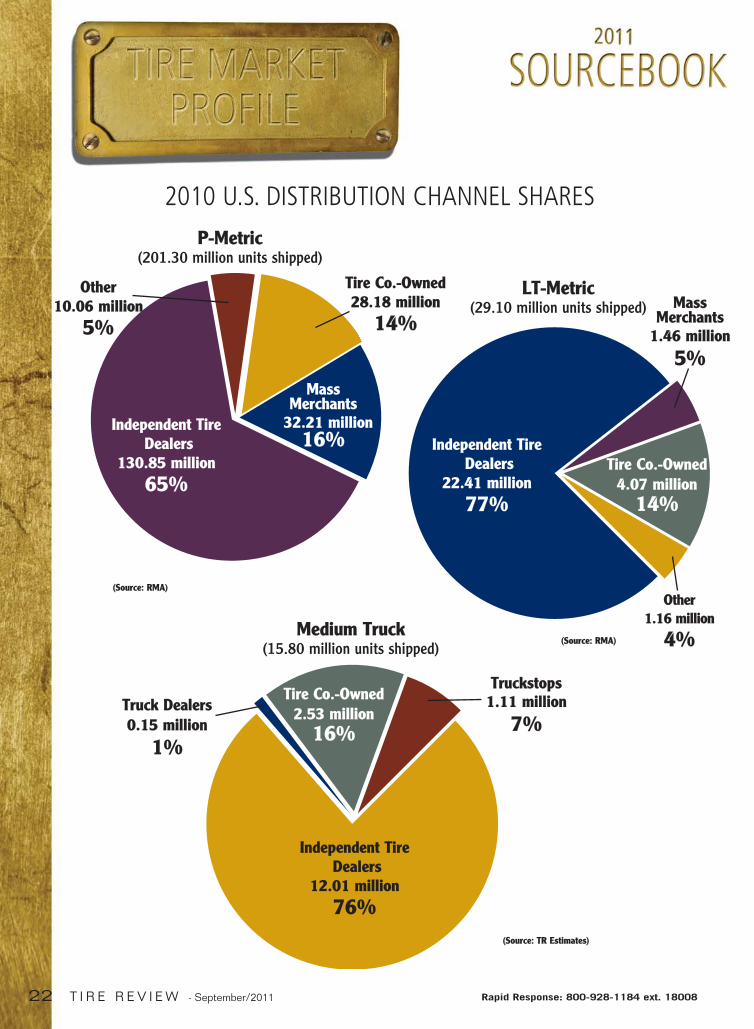
P-Metric(201.30 million units shipped)
Tire Co.-Owned28.18 million
14%
Other10.06 million
5%
Mass Merchants
32.21 million16%
Independent TireDealers
130.85 million65%
(Source: RMA)
LT-Metric(29.10 million units shipped)
Independent TireDealers
22.41 million77%
Medium Truck(15.80 million units shipped)
Tire Co.-Owned2.53 million
16%Truck Dealers0.15 million
1%
Truckstops1.11 million
7%
Independent TireDealers
12.01 million76%
(Source: TR Estimates)
2010 U.S. DISTRIBUTION CHANNEL SHARES
Tire Co.-Owned4.07 million
14%
Other1.16 million
4%
Mass Merchants
1.46 million
5%
(Source: RMA)
22 T I R E R E V I E W - September/2011 Rapid Response: 800-928-1184 ext. 18008
14-46 Tire Market Profile_Layout 1 9/22/11 1:31 PM Page 22
24 T I R E R E V I E W - September/2011
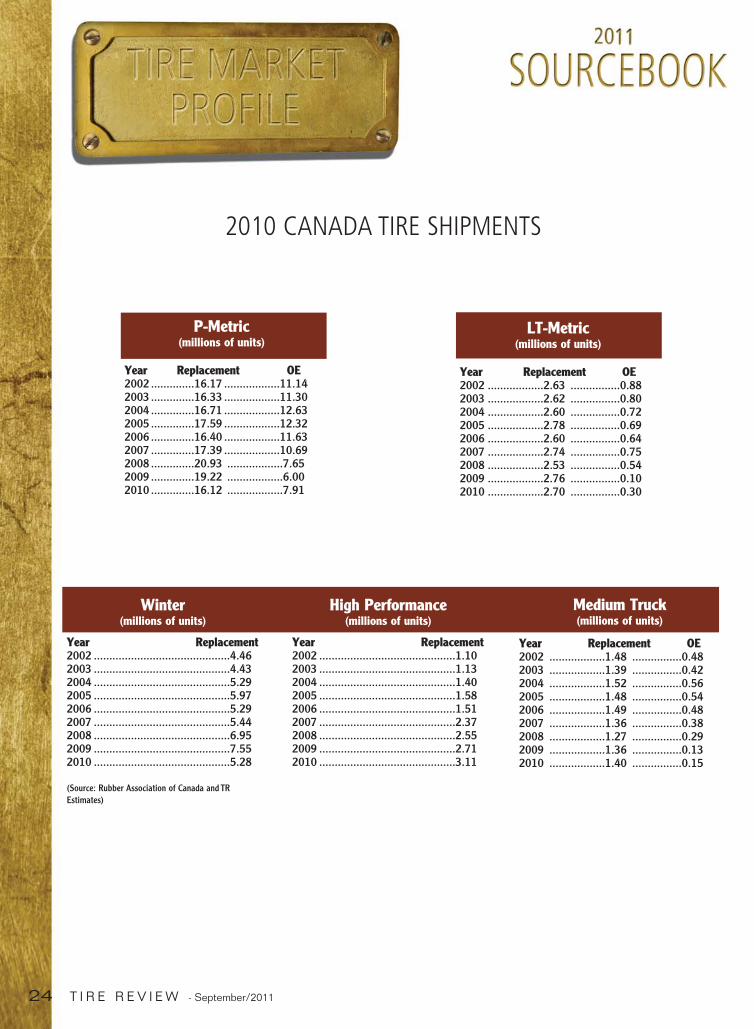
2010 CANADA TIRE SHIPMENTS
Winter(millions of units)
Year Replacement2002 ............................................4.462003 ............................................4.432004 ............................................5.292005 ............................................5.972006 ............................................5.292007 ............................................5.442008 ............................................6.952009 ............................................7.552010 ............................................5.28
(Source: Rubber Association of Canada and TREstimates)
High Performance(millions of units)
Year Replacement2002 ............................................1.102003 ............................................1.132004 ............................................1.402005 ............................................1.582006 ............................................1.512007 ............................................2.372008 ............................................2.552009 ............................................2.712010 ............................................3.11
Medium Truck(millions of units)
Year Replacement OE2002 ..................1.48 ................0.482003 ..................1.39 ................0.422004 ..................1.52 ................0.562005 ..................1.48 ................0.542006 ..................1.49 ................0.482007 ..................1.36 ................0.382008 ..................1.27 ................0.292009 ..................1.36 ................0.132010 ..................1.40 ................0.15
P-Metric(millions of units)
Year Replacement OE2002 ..............16.17 ..................11.142003 ..............16.33 ..................11.302004 ..............16.71 ..................12.632005 ..............17.59 ..................12.322006 ..............16.40 ..................11.632007 ..............17.39 ..................10.692008 ..............20.93 ..................7.652009 ..............19.22 ..................6.002010 ..............16.12 ..................7.91
LT-Metric(millions of units)
Year Replacement OE2002 ..................2.63 ................0.882003 ..................2.62 ................0.802004 ..................2.60 ................0.722005 ..................2.78 ................0.692006 ..................2.60 ................0.64 2007 ..................2.74 ................0.752008 ..................2.53 ................0.542009 ..................2.76 ................0.102010 ..................2.70 ................0.30
14-46 Tire Market Profile_Layout 1 9/22/11 1:31 PM Page 24
26 T I R E R E V I E W - September/2011
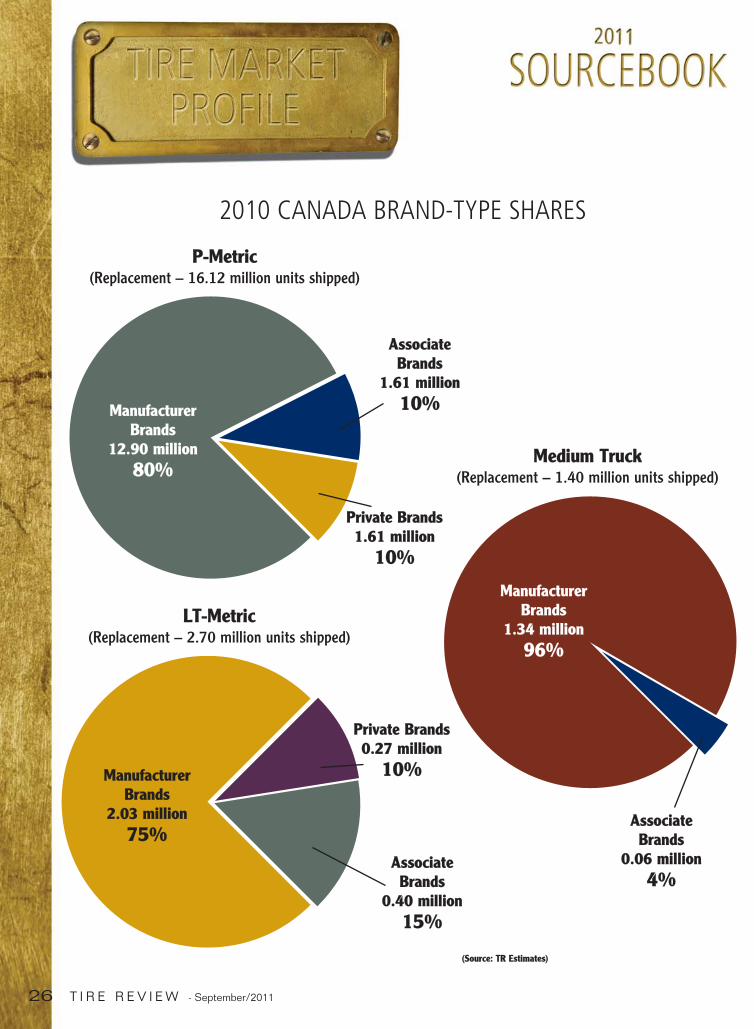
2010 CANADA BRAND-TYPE SHARES
P-Metric(Replacement – 16.12 million units shipped)
ManufacturerBrands
12.90 million80%
Private Brands1.61 million
10%
AssociateBrands
1.61 million10%
LT-Metric(Replacement – 2.70 million units shipped)
Manufacturer Brands
2.03 million75%
Private Brands0.27 million
10%
AssociateBrands
0.40 million15%
Manufacturer Brands
1.34 million96%
Medium Truck(Replacement – 1.40 million units shipped)
(Source: TR Estimates)
AssociateBrands
0.06 million4%
14-46 Tire Market Profile_Layout 1 9/22/11 1:31 PM Page 26
28 T I R E R E V I E W - September/2011
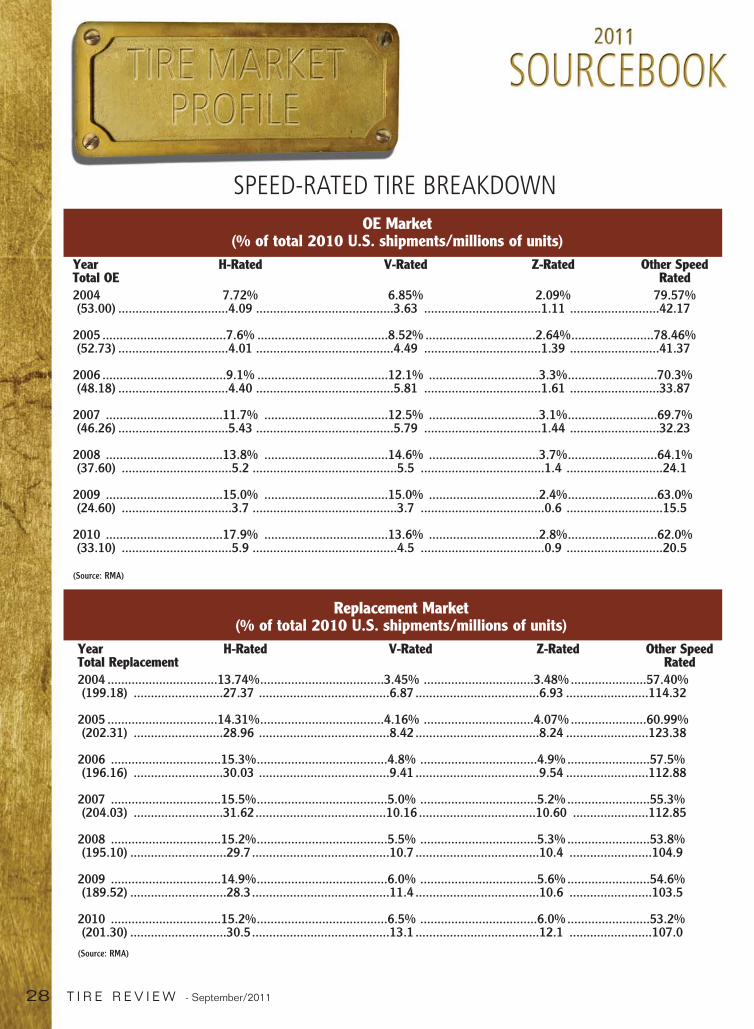
SPEED-RATED TIRE BREAKDOWNOE Market
(% of total 2010 U.S. shipments/millions of units)Year H-Rated V-Rated Z-Rated Other Speed Total OE Rated2004 7.72% 6.85% 2.09% 79.57%(53.00) ................................4.09 ........................................3.63 ..................................1.11 ..........................42.17
2005 ....................................7.6% ......................................8.52% ................................2.64%........................78.46%(52.73) ................................4.01 ........................................4.49 ..................................1.39 ..........................41.37
2006 ....................................9.1% ......................................12.1% ................................3.3%..........................70.3%(48.18) ................................4.40 ........................................5.81 ..................................1.61 ..........................33.87
2007 ..................................11.7% ....................................12.5% ................................3.1%..........................69.7%(46.26) ................................5.43 ........................................5.79 ..................................1.44 ..........................32.23
2008 ..................................13.8% ....................................14.6% ................................3.7%..........................64.1%(37.60) ................................5.2 ..........................................5.5 ....................................1.4 ............................24.1
2009 ..................................15.0% ....................................15.0% ................................2.4%..........................63.0%(24.60) ................................3.7 ..........................................3.7 ....................................0.6 ............................15.5
2010 ..................................17.9% ....................................13.6% ................................2.8%..........................62.0%(33.10) ................................5.9 ..........................................4.5 ....................................0.9 ............................20.5
(Source: RMA)
Replacement Market(% of total 2010 U.S. shipments/millions of units)
Year H-Rated V-Rated Z-Rated Other Speed Total Replacement Rated2004 ................................13.74%....................................3.45% ................................3.48% ......................57.40%(199.18) ..........................27.37 ......................................6.87 ....................................6.93 ........................114.32
2005 ................................14.31%....................................4.16% ................................4.07% ......................60.99%(202.31) ..........................28.96 ......................................8.42 ....................................8.24 ........................123.38
2006 ................................15.3%......................................4.8% ..................................4.9% ........................57.5%(196.16) ..........................30.03 ......................................9.41 ....................................9.54 ........................112.88
2007 ................................15.5%......................................5.0% ..................................5.2% ........................55.3%(204.03) ..........................31.62......................................10.16 ..................................10.60 ......................112.85
2008 ................................15.2%......................................5.5% ..................................5.3% ........................53.8%(195.10) ............................29.7........................................10.7 ....................................10.4 ........................104.9
2009 ................................14.9%......................................6.0% ..................................5.6% ........................54.6%(189.52) ............................28.3........................................11.4 ....................................10.6 ........................103.5
2010 ................................15.2%......................................6.5% ..................................6.0% ........................53.2%(201.30) ............................30.5........................................13.1 ....................................12.1 ........................107.0
(Source: RMA)
14-46 Tire Market Profile_Layout 1 9/22/11 1:31 PM Page 28
30 T I R E R E V I E W - September/2011
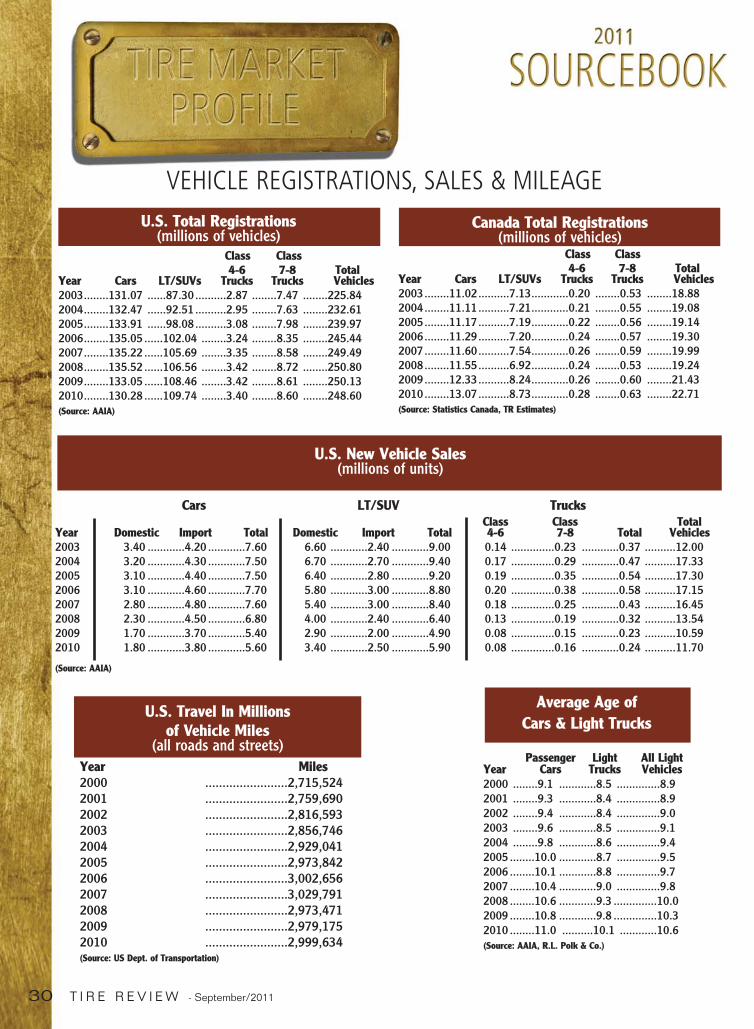
VEHICLE REGISTRATIONS, SALES & MILEAGEU.S. Total Registrations
(millions of vehicles)Class Class 4-6 7-8 Total
Year Cars LT/SUVs Trucks Trucks Vehicles2003........131.07 ......87.30 ..........2.87 ........7.47 ........225.842004........132.47 ......92.51 ..........2.95 ........7.63 ........232.612005........133.91 ......98.08 ..........3.08 ........7.98 ........239.972006........135.05 ......102.04 ........3.24 ........8.35 ........245.442007........135.22 ......105.69 ........3.35 ........8.58 ........249.492008........135.52 ......106.56 ........3.42 ........8.72 ........250.802009........133.05 ......108.46 ........3.42 ........8.61 ........250.132010........130.28 ......109.74 ........3.40 ........8.60 ........248.60(Source: AAIA)
Canada Total Registrations(millions of vehicles)
Class Class 4-6 7-8 Total
Year Cars LT/SUVs Trucks Trucks Vehicles2003........11.02..........7.13............0.20 ........0.53 ........18.882004........11.11..........7.21............0.21 ........0.55 ........19.082005........11.17..........7.19............0.22 ........0.56 ........19.142006........11.29..........7.20............0.24 ........0.57 ........19.302007........11.60..........7.54............0.26 ........0.59 ........19.992008........11.55..........6.92............0.24 ........0.53 ........19.242009........12.33..........8.24............0.26 ........0.60 ........21.43 2010........13.07..........8.73............0.28 ........0.63 ........22.71(Source: Statistics Canada, TR Estimates)
Average Age of Cars & Light Trucks
Passenger Light All LightYear Cars Trucks Vehicles2000 ........9.1 ............8.5 ..............8.92001 ........9.3 ............8.4 ..............8.92002 ........9.4 ............8.4 ..............9.02003 ........9.6 ............8.5 ..............9.12004 ........9.8 ............8.6 ..............9.42005 ........10.0 ............8.7 ..............9.52006 ........10.1 ............8.8 ..............9.72007 ........10.4 ............9.0 ..............9.82008 ........10.6 ............9.3 ..............10.02009 ........10.8 ............9.8 ..............10.32010 ........11.0 ..........10.1 ............10.6(Source: AAIA, R.L. Polk & Co.)
U.S. New Vehicle Sales(millions of units)
Cars LT/SUV TrucksClass Class Total
Year Domestic Import Total Domestic Import Total 4-6 7-8 Total Vehicles2003 3.40 ............4.20 ............7.60 6.60 ............2.40 ............9.00 0.14 ..............0.23 ............0.37 ..........12.002004 3.20 ............4.30 ............7.50 6.70 ............2.70 ............9.40 0.17 ..............0.29 ............0.47 ..........17.332005 3.10 ............4.40 ............7.50 6.40 ............2.80 ............9.20 0.19 ..............0.35 ............0.54 ..........17.302006 3.10 ............4.60 ............7.70 5.80 ............3.00 ............8.80 0.20 ..............0.38 ............0.58 ..........17.152007 2.80 ............4.80 ............7.60 5.40 ............3.00 ............8.40 0.18 ..............0.25 ............0.43 ..........16.452008 2.30 ............4.50 ............6.80 4.00 ............2.40 ............6.40 0.13 ..............0.19 ............0.32 ..........13.542009 1.70 ............3.70 ............5.40 2.90 ............2.00 ............4.90 0.08 ..............0.15 ............0.23 ..........10.592010 1.80 ............3.80 ............5.60 3.40 ............2.50 ............5.90 0.08 ..............0.16 ............0.24 ..........11.70
(Source: AAIA)
U.S. Travel In Millions of Vehicle Miles
(all roads and streets)Year Miles2000 ........................2,715,5242001 ........................2,759,6902002 ........................2,816,5932003 ........................2,856,7462004 ........................2,929,0412005 ........................2,973,8422006 ........................3,002,6562007 ........................3,029,7912008 ........................2,973,4712009 ........................2,979,1752010 ........................2,999,634(Source: US Dept. of Transportation)
14-46 Tire Market Profile_Layout 1 9/22/11 1:31 PM Page 30
32 T I R E R E V I E W - September/2011
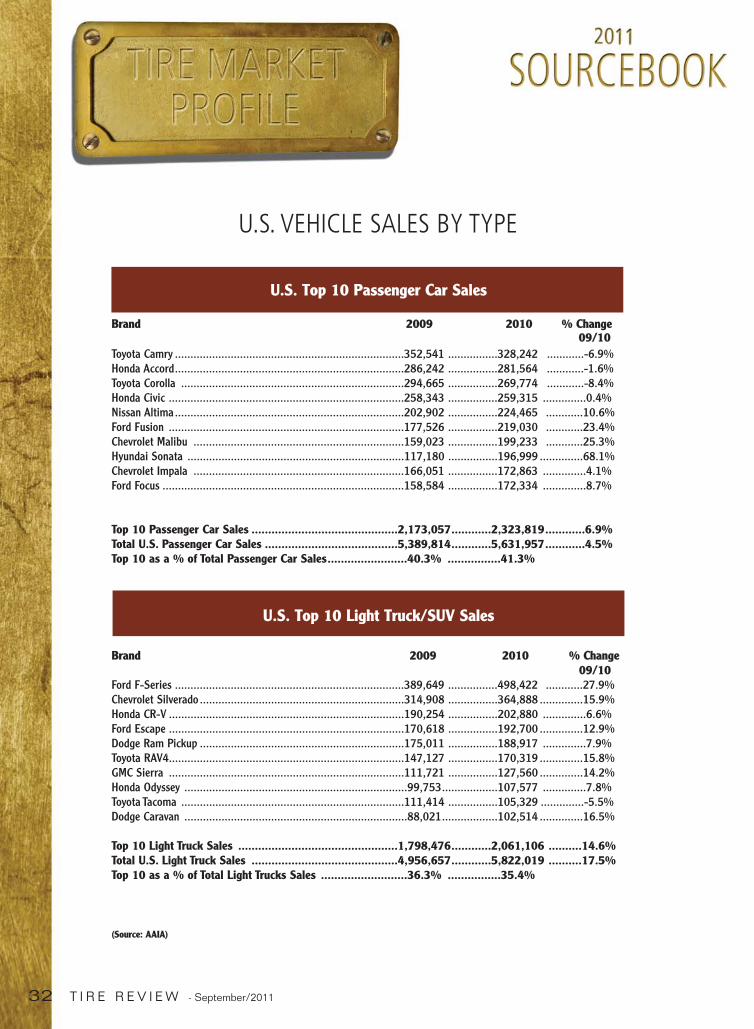
U.S. Top 10 Passenger Car Sales
Brand 2009 2010 % Change09/10
Toyota Camry ..........................................................................352,541 ................328,242 ............-6.9%Honda Accord..........................................................................286,242 ................281,564 ............-1.6% Toyota Corolla ........................................................................294,665 ................269,774 ............-8.4%Honda Civic ............................................................................258,343 ................259,315 ..............0.4%Nissan Altima..........................................................................202,902 ................224,465 ............10.6%Ford Fusion ............................................................................177,526 ................219,030 ............23.4%Chevrolet Malibu ....................................................................159,023 ................199,233 ............25.3%Hyundai Sonata ......................................................................117,180 ................196,999 ..............68.1%Chevrolet Impala ....................................................................166,051 ................172,863 ..............4.1%Ford Focus ..............................................................................158,584 ................172,334 ..............8.7%
Top 10 Passenger Car Sales ............................................2,173,057............2,323,819............6.9%Total U.S. Passenger Car Sales ........................................5,389,814............5,631,957............4.5%Top 10 as a % of Total Passenger Car Sales........................40.3% ................41.3%
U.S. Top 10 Light Truck/SUV Sales
Brand 2009 2010 % Change09/10
Ford F-Series ..........................................................................389,649 ................498,422 ............27.9% Chevrolet Silverado ..................................................................314,908 ................364,888 ..............15.9%Honda CR-V ............................................................................190,254 ................202,880 ..............6.6%Ford Escape ............................................................................170,618 ................192,700 ..............12.9%Dodge Ram Pickup ..................................................................175,011 ................188,917 ..............7.9%Toyota RAV4............................................................................147,127 ................170,319 ..............15.8%GMC Sierra ............................................................................111,721 ................127,560 ..............14.2%Honda Odyssey ........................................................................99,753..................107,577 ..............7.8%Toyota Tacoma ........................................................................111,414 ................105,329 ..............-5.5%Dodge Caravan ........................................................................88,021..................102,514 ..............16.5%
Top 10 Light Truck Sales ................................................1,798,476............2,061,106 ..........14.6%Total U.S. Light Truck Sales ............................................4,956,657............5,822,019 ..........17.5%Top 10 as a % of Total Light Trucks Sales ..........................36.3% ................35.4%
(Source: AAIA)
U.S. VEHICLE SALES BY TYPE
14-46 Tire Market Profile_Layout 1 9/22/11 1:31 PM Page 32
34 T I R E R E V I E W - September/2011
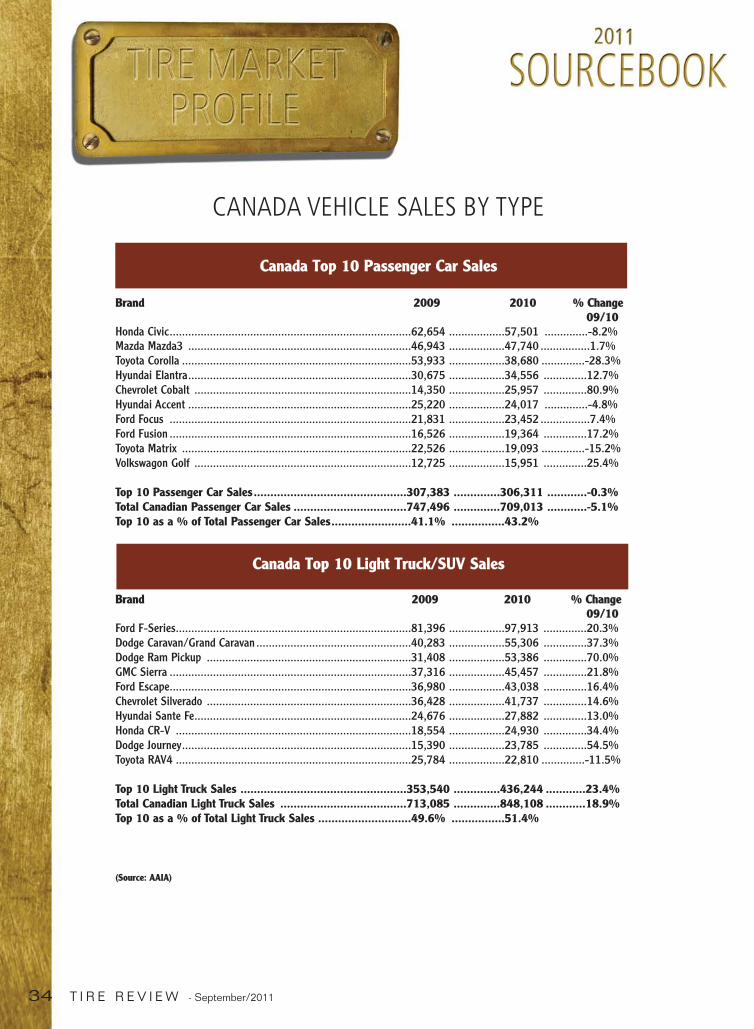
Canada Top 10 Passenger Car Sales
Brand 2009 2010 % Change09/10
Honda Civic..............................................................................62,654 ..................57,501 ..............-8.2%Mazda Mazda3 ........................................................................46,943 ..................47,740 ................1.7%Toyota Corolla ..........................................................................53,933 ..................38,680 ..............-28.3%Hyundai Elantra........................................................................30,675 ..................34,556 ..............12.7%Chevrolet Cobalt ......................................................................14,350 ..................25,957 ..............80.9%Hyundai Accent ........................................................................25,220 ..................24,017 ..............-4.8%Ford Focus ..............................................................................21,831 ..................23,452 ................7.4%Ford Fusion ..............................................................................16,526 ..................19,364 ..............17.2%Toyota Matrix ..........................................................................22,526 ..................19,093 ..............-15.2%Volkswagon Golf ......................................................................12,725 ..................15,951 ..............25.4%
Top 10 Passenger Car Sales..............................................307,383 ..............306,311 ............-0.3%Total Canadian Passenger Car Sales ..................................747,496 ..............709,013 ............-5.1%Top 10 as a % of Total Passenger Car Sales........................41.1% ................43.2%
Canada Top 10 Light Truck/SUV Sales
Brand 2009 2010 % Change 09/10
Ford F-Series............................................................................81,396 ..................97,913 ..............20.3% Dodge Caravan/Grand Caravan ..................................................40,283 ..................55,306 ..............37.3%Dodge Ram Pickup ..................................................................31,408 ..................53,386 ..............70.0%GMC Sierra ..............................................................................37,316 ..................45,457 ..............21.8%Ford Escape..............................................................................36,980 ..................43,038 ..............16.4%Chevrolet Silverado ..................................................................36,428 ..................41,737 ..............14.6%Hyundai Sante Fe......................................................................24,676 ..................27,882 ..............13.0%Honda CR-V ............................................................................18,554 ..................24,930 ..............34.4%Dodge Journey..........................................................................15,390 ..................23,785 ..............54.5%Toyota RAV4 ............................................................................25,784 ..................22,810 ..............-11.5%
Top 10 Light Truck Sales ..................................................353,540 ..............436,244 ............23.4%Total Canadian Light Truck Sales ......................................713,085 ..............848,108 ............18.9%Top 10 as a % of Total Light Truck Sales ............................49.6% ................51.4%
(Source: AAIA)
CANADA VEHICLE SALES BY TYPE
14-46 Tire Market Profile_Layout 1 9/22/11 1:31 PM Page 34

36 T I R E R E V I E W - September/2011
100,000
150,000
200,000
250,000
300,000
350,000
400,000
2005 2006 2007 2008 2009 2010
199,446
0.5%
U.S. HYBRID VEHICLE REGISTRATION & RETAIL SHARE
0
50,000 0.5%
1.0%
1.5%
2.0%
2.5%
3.0%
3.5%
0
254,628
1.4%
350,692
1.8%
2.5%
312,418
2.6%
288,951
2.9%
273,509
Total Registration (Left Scale)
Hybrid Share of Retail Sales (Right Scale)
WHAT RETAIL DEALERSSELL EACH DAY
(average tires sold per day 2010)
15.9 Passenger
11.5 Light Truck/SUV
7.1 HP
5 10 15 20
31% Customers ask for a specific tire brand, and...61% Will listen to dealer recommendation, but...12% Won’t switch at all
Which means that.....
88% Customers rely on dealer for the “right tire”
HOW DEALER INFLUENCESCONSUMER BUYING DECISION
(Source: AAIA)
14-46 Tire Market Profile_Layout 1 9/22/11 1:31 PM Page 36
38 T I R E R E V I E W - September/2011
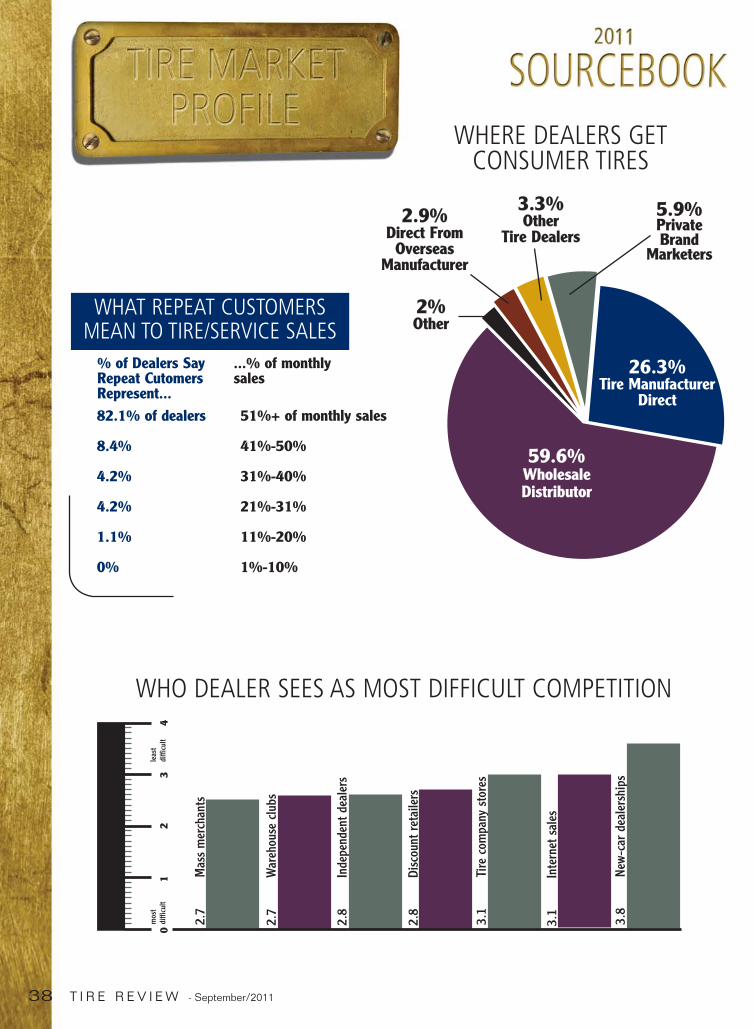
3.3%Other
Tire Dealers
WHERE DEALERS GET CONSUMER TIRES
26.3%Tire Manufacturer
Direct
5.9%Private Brand
Marketers
59.6%Wholesale Distributor
2%Other
2.9%Direct From
OverseasManufacturer
82.1% of dealers 51%+ of monthly sales
8.4% 41%-50%
4.2% 31%-40%
4.2% 21%-31%
1.1% 11%-20%
0% 1%-10%
WHAT REPEAT CUSTOMERSMEAN TO TIRE/SERVICE SALES
% of Dealers SayRepeat CutomersRepresent...
...% of monthlysales
WHO DEALER SEES AS MOST DIFFICULT COMPETITION
2.7
War
ehou
se c
lubs
2.8
Inde
pend
ent d
eale
rs
2.7
Mas
s m
erch
ants
2.8
Disc
ount
reta
ilers
3.1
Tire
com
pany
sto
res
3.8
New-
car
deal
ersh
ips
mos
t di
fficu
ltle
ast
diffi
cult
01
23
4
3.1
Inte
rnet
sal
es
14-46 Tire Market Profile_Layout 1 9/22/11 1:31 PM Page 38
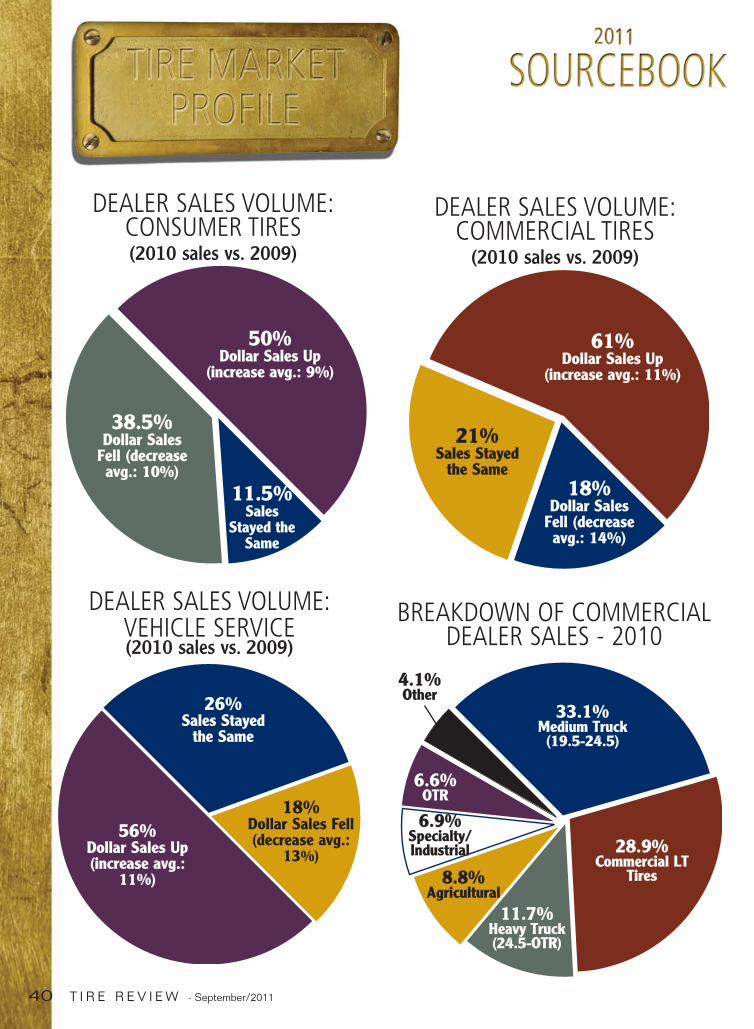
DEALER SALES VOLUME: CONSUMER TIRES (2010 sales vs. 2009)
11.5%Sales
Stayed theSame
50%Dollar Sales Up
(increase avg.: 9%)
38.5% Dollar Sales
Fell (decrease avg.: 10%)
DEALER SALES VOLUME: COMMERCIAL TIRES
(2010 sales vs. 2009)
21%Sales Stayed
the Same
61%Dollar Sales Up
(increase avg.: 11%)
18% Dollar Sales
Fell (decrease avg.: 14%)
40 T I R E R E V I E W - September/2011
DEALER SALES VOLUME: VEHICLE SERVICE (2010 sales vs. 2009)
26%Sales Stayed
the Same
56%Dollar Sales Up(increase avg.:
11%)
18%Dollar Sales Fell(decrease avg.:
13%) 28.9%Commercial LT
Tires
33.1%Medium Truck(19.5-24.5)
11.7%Heavy Truck(24.5-OTR)
8.8%Agricultural
6.9%Specialty/Industrial
6.6%OTR
4.1%Other
BREAKDOWN OF COMMERCIALDEALER SALES - 2010
14-46 Tire Market Profile_Layout 1 9/22/11 1:31 PM Page 40
42 T I R E R E V I E W - September/2011
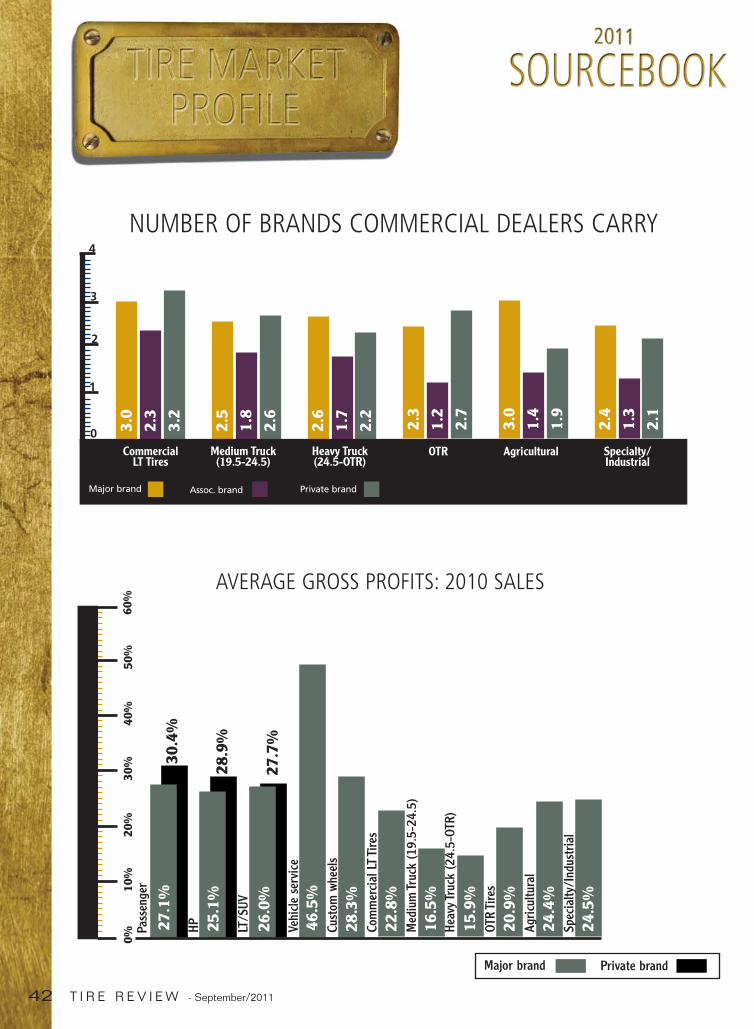
AVERAGE GROSS PROFITS: 2010 SALES
Major brand Private brand
Pass
enge
r
HP LT/S
UV
Vehi
cle s
ervi
ce
0%10
%20
%30
%40
%50
%
30.4
%
28.9
%
27.7
%
Cust
om w
heel
s
60%
27.1
%
25.1
%
26.0
%
46.5
%
28.3
%Co
mm
erci
al L
T Ti
res
22.8
%M
ediu
m Tr
uck
(19.
5-24
.5)
16.5
%He
avy T
ruck
(24.
5-OT
R)
15.9
%OT
R Ti
res
20.9
%Ag
ricul
tura
l24
.4%
Spec
ialty
/Ind
ustr
ial
24.5
%
4
3
2
1
0 3.0
2.3
3.2
2.5
1.8
2.6
2.6
1.7
2.2
CommercialLT Tires
Major brand Private brandAssoc. brand
Medium Truck(19.5-24.5)
Heavy Truck(24.5-OTR)
NUMBER OF BRANDS COMMERCIAL DEALERS CARRY
2.3
1.2
2.7
3.0
1.4
1.9
2.4
1.3
2.1
OTR Agricultural Specialty/Industrial
14-46 Tire Market Profile_Layout 1 9/22/11 1:31 PM Page 42
44 T I R E R E V I E W - September/2011
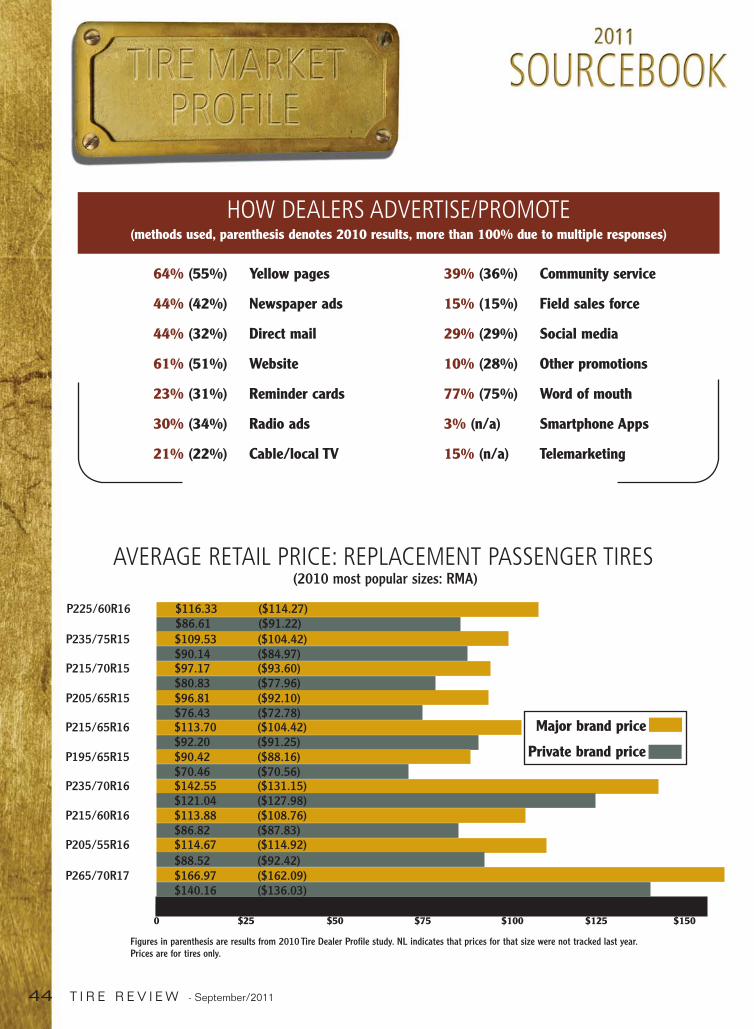
AVERAGE RETAIL PRICE: REPLACEMENT PASSENGER TIRES(2010 most popular sizes: RMA)
Figures in parenthesis are results from 2010 Tire Dealer Profile study. NL indicates that prices for that size were not tracked last year.Prices are for tires only.
Major brand price
Private brand price
0 $25 $50 $75 $100 $125 $150
P225/60R16 $116.33 ($114.27)$86.61 ($91.22)
P235/75R15 $109.53 ($104.42)$90.14 ($84.97)
P215/70R15 $97.17 ($93.60)$80.83 ($77.96)
P205/65R15 $96.81 ($92.10)$76.43 ($72.78)
P215/65R16 $113.70 ($104.42)$92.20 ($91.25)
P195/65R15 $90.42 ($88.16) $70.46 ($70.56)
P235/70R16 $142.55 ($131.15) $121.04 ($127.98)
P215/60R16 $113.88 ($108.76)$86.82 ($87.83)
P205/55R16 $114.67 ($114.92)$88.52 ($92.42)
P265/70R17 $166.97 ($162.09)$140.16 ($136.03)
64% (55%) Yellow pages
44% (42%) Newspaper ads
44% (32%) Direct mail
61% (51%) Website
23% (31%) Reminder cards
30% (34%) Radio ads
21% (22%) Cable/local TV
39% (36%) Community service
15% (15%) Field sales force
29% (29%) Social media
10% (28%) Other promotions
77% (75%) Word of mouth
3% (n/a) Smartphone Apps
15% (n/a) Telemarketing
HOW DEALERS ADVERTISE/PROMOTE(methods used, parenthesis denotes 2010 results, more than 100% due to multiple responses)
14-46 Tire Market Profile_Layout 1 9/22/11 1:31 PM Page 44
46 T I R E R E V I E W - September/2011
0 $400 $600 $800 $1000
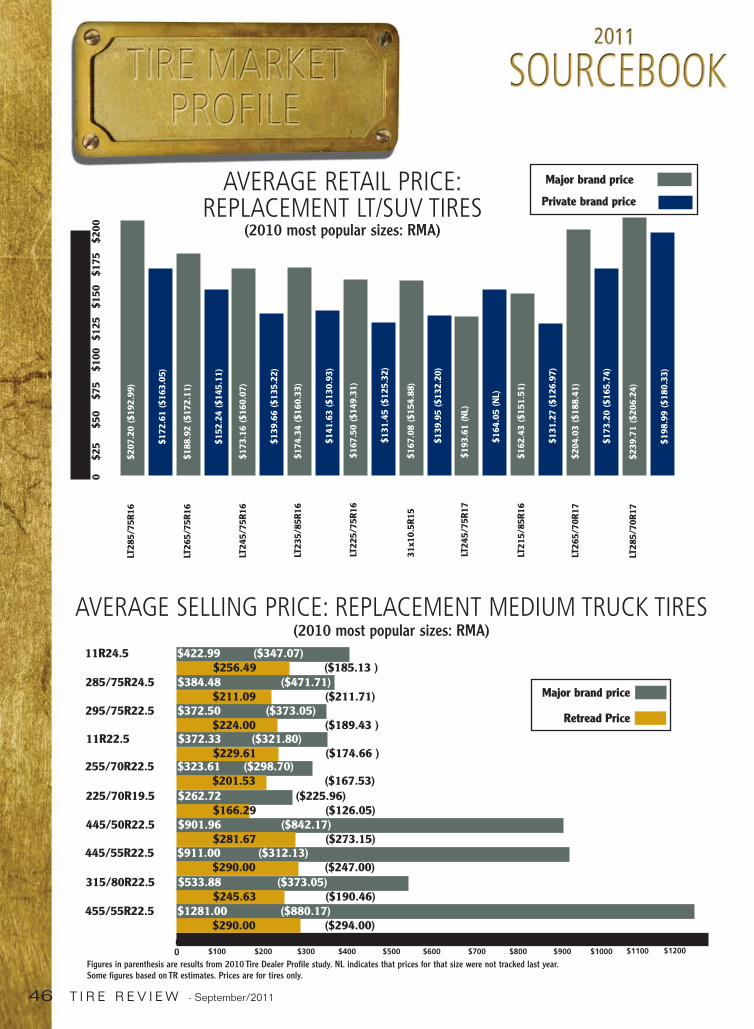
AVERAGE RETAIL PRICE:REPLACEMENT LT/SUV TIRES
(2010 most popular sizes: RMA)
Major brand price
Retread Price
AVERAGE SELLING PRICE: REPLACEMENT MEDIUM TRUCK TIRES(2010 most popular sizes: RMA)
$200 $300 $500 $700 $900$100
11R24.5 $422.99 ($347.07)$256.49 ($185.13 )
285/75R24.5 $384.48 ($471.71)$211.09 ($211.71)
295/75R22.5 $372.50 ($373.05)$224.00 ($189.43 )
11R22.5 $372.33 ($321.80)$229.61 ($174.66 )
255/70R22.5 $323.61 ($298.70)$201.53 ($167.53)
225/70R19.5 $262.72 ($225.96)$166.29 ($126.05)
445/50R22.5 $901.96 ($842.17)$281.67 ($273.15)
445/55R22.5 $911.00 ($312.13)$290.00 ($247.00)
Major brand price
Private brand price
0$1
00$1
50$2
00$5
0$7
5$1
25$1
75$2
5
LT28
5/75
R16
$207
.20
($19
2.99
)
$172
.61
($16
3.05
)
LT26
5/75
R16
$188
.92
($17
2.11
)
$152
.24
($14
5.11
)
LT24
5/75
R16
$173
.16
($16
0.07
)
$139
.66
($13
5.22
)
LT23
5/85
R16
$174
.34
($16
0.33
)
$141
.63
($13
0.93
)
LT22
5/75
R16
$167
.50
($14
9.31
)
$131
.45
($12
5.32
)
31x1
0.5R
15$1
67.0
8 ($
154.
88)
$139
.95
($13
2.20
)
LT24
5/75
R17
$193
.61
(NL)
$164
.05
(NL)
LT21
5/85
R16
$162
.43
($15
1.51
)
$131
.27
($12
6.97
)
LT26
5/70
R17
$204
.03
($18
8.41
)
$173
.20
($16
5.74
)
LT28
5/70
R17
$239
.71
($20
6.24
)
$198
.99
($18
0.33
)
315/80R22.5 $533.88 ($373.05)$245.63 ($190.46)
455/55R22.5 $1281.00 ($880.17)$290.00 ($294.00)
Figures in parenthesis are results from 2010 Tire Dealer Profile study. NL indicates that prices for that size were not tracked last year.Some figures based on TR estimates. Prices are for tires only.
$1100 $1200
14-46 Tire Market Profile_Layout 1 9/22/11 1:31 PM Page 46