Embed Size (px)
Citation preview

Disclaimer:This report was prepared as an account of work sponsored by an agency of the
United States Government. Neither the United States Government nor any agency thereof,nor any of their employees, makes any warranty, express or implied, or assumes any legalliability or responsibility for the accuracy, completeness, or usefulness of any information,apparatus, product, or process disclosed, or represents that its use would not infringeprivately owned rights. Reference herein to any specific commercial product, process, orservice by trade name, trademark, manufacturer, or otherwise does not necessarilyconstitute or imply its endorsement, recommendation, or favoring by the United StatesGovernment or any agency thereof. The views and opinions of authors expressed herein donot necessarily state or reflect those of the United States Government or any agencythereof.
TITLE: IMPROVED OIL RECOVERY IN MISSISSIPPIAN CARBONATE RESERVOIRS OF KANSAS -- NEAR TERM -- CLASS 2
Cooperative Agreement No.: DE-FC22-93BC14987
Contractor Name and Address: The University of Kansas Center for Research Inc.
Date of Report: June 1, 1999
Award Date: September 18, 1994
DOE Cost of Project: $ 3,169,252 (Budget Period 2 05/16/97 -- 07/30/99)
Principal Investigators: Timothy R. Carr (Program Manager)Don W. GreenG. Paul Willhite
Project Manager: Daniel J. Ferguson, NPTO Tulsa, Oklahoma
Reporting Period: January 1, 1998 -- December 31, 1998
Report: Annual
ii
TABLE OF CONTENTSpage
FORWARD ................................................................................................ ivABSTRACT .............................................................……………………… ivEXECUTIVE SUMMARY ......................................……....…………….. v1.0 INTRODUCTION ....................................................…………… 1
1.1 Objectives and Significance ..........………..............……… 11.2 Site Description ...........................................…………………. 21.3 Participating Organizations .........................……………… 2
2.0 DISCUSSION .............................................................……………… 102.1 Field Activities .....………......................................…………. 102.2 Summary of Reservoir Geology .....………...................……… 112.3 Overview of Petrophysical Analysis .......….………............. 182.4 Evaluation of Horizontal Drilling ..………..……............ 252.5 Synopsis of PfEFFER ...................………..........………....... 282.6 Cost-Effective PC-based Simulation and Management …........ 332.7 Material Balance Calculations …………………………..….. 36
3.0 TECHNOLOGY TRANSFER ACTIVITIES …………………….... 434.0 PROBLEMS ENCOUNTERED …………………………….... 455.0 RECOMMENDATIONS …………………………………….... 456.0 REFERENCES CITED ..................................…......……………….... 467.0 APPENDIX LIST OF PUBLICATIONS ...................…………. 48
FIGURES
Figure 1.1. Kansas annual and cumulative oil production ..............…….. 3Figure 1.2. Schaben Field demonstration site ..................................……….. 4Figure 1.3. Regional southwest-northeast cross-section ......................…….. 5Figure 1.4. Kansas Mississippian subcrop map .........................……… 6Figure 1.5. Ness County Mississippian subcrop map and structure .......…. 7Figure 1.6. Schaben annual field production and producing wells ...………. 8Figure 2.1. Predicted and historical fluid rates .........................……… 11Figure 2.2. Mississippian Structure map for Schaben ................…………… 13Figure 2.3. East-west cross-section EW27-26-1 .........................……… 14Figure 2.4. NMR porosity versus gravimetric porosity ............……… 20Figure 2.5. Water saturation versus permeability .........………………… 20Figure 2.6. Permeability versus porosity ..………......................……… 21Figure 2.7. Permeability versus principal pore throat diameter ..…..…. 22Figure 2.8. NMR measured T2 peak versus pore throat diameter ......….. 23Figure 2.9. NMR T2 cutoff and Klinkenberg permeability .....................… 24Figure 2.10. Electrical resistivity factor versus porosity .....…....……… 24Figure 2.11. Oil production in the Wieland West Field .....................… 26Figure 2.12. Remaining hydrocarbon saturation-feet map .............……… 27Figure 2.13. The "Super Pickett" crossplot .………………...............…… 30Figure 2.14. PfEFFER 2.0 Mapping module …………………......……….. 31

iii
Figure 2.15. PfEFFER 2.0 moveable oil plot .......……………….........…… 32Figure 2.16. History match and performance prediction ................…… 35Figure 2.17. Performance prediction of Moore BCP #3 .................…… 36Figure 2.18. Plot of F/E versus We/E .....………………………………..…. 39Figure 2.19. Sensitivity of aquifer and reservoir parameters .………......…. 40Figure 2.20. Average pressure profile for "Best Case" Scenario .....…… 41Figure 2.21. F/E versus We/E for the “best case” scenario ....................…. 42Figure 2.22. Kansas Digital Petroleum Atlas Schaben Homepage .........…… 44
TABLES
Table 1.1. List of infill locations drilled or recompleted .............…..…. 9
iv
FOREWORD
Contributors to this report include: Dana Adkins-Heljeson, Saibal Bhattacharya, Tim Carr, EvanFranseen, Paul Gerlach, Willard Guy, John Hopkins and W. Lynn Watney.
ABSTRACT
This annual report describes progress during the third year of the project entitled “Improved OilRecovery in Mississippian Carbonate Reservoirs in Kansas”. This project funded under theDepartment of Energy’s Class 2 program targets improving the reservoir performance of matureoil fields located in shallow shelf carbonate reservoirs. The focus of this project is developmentand demonstration of cost-effective reservoir description and management technologies to extendthe economic life of mature reservoirs in Kansas and the mid-continent. The project introduced anumber of potentially useful technologies, and demonstrated these technologies in actual oil fieldoperations. Advanced technology was tailored specifically to the scale appropriate to theoperations of Kansas producers. An extensive technology transfer effort is ongoing. Traditionaltechnology transfer methods (e.g., publications and workshops) are supplemented with a publicdomain relational database and an online package of project results that is available through theInternet. The goal is to provide the independent complete access to project data, project resultsand project technology on their desktop.
Included in this report is a summary of significant project results at the demonstration site(Schaben Field, Ness County, Kansas). The value of cost-effective techniques for reservoircharacterization and simulation at Schaben Field were demonstrated to independent operators.All major operators at Schaben have used results of the reservoir management strategy to locateand drill additional infill locations. At the Schaben Demonstration Site, the additional locationsresulted in incremental production increases of 200 BOPD from a smaller number of wells.
v
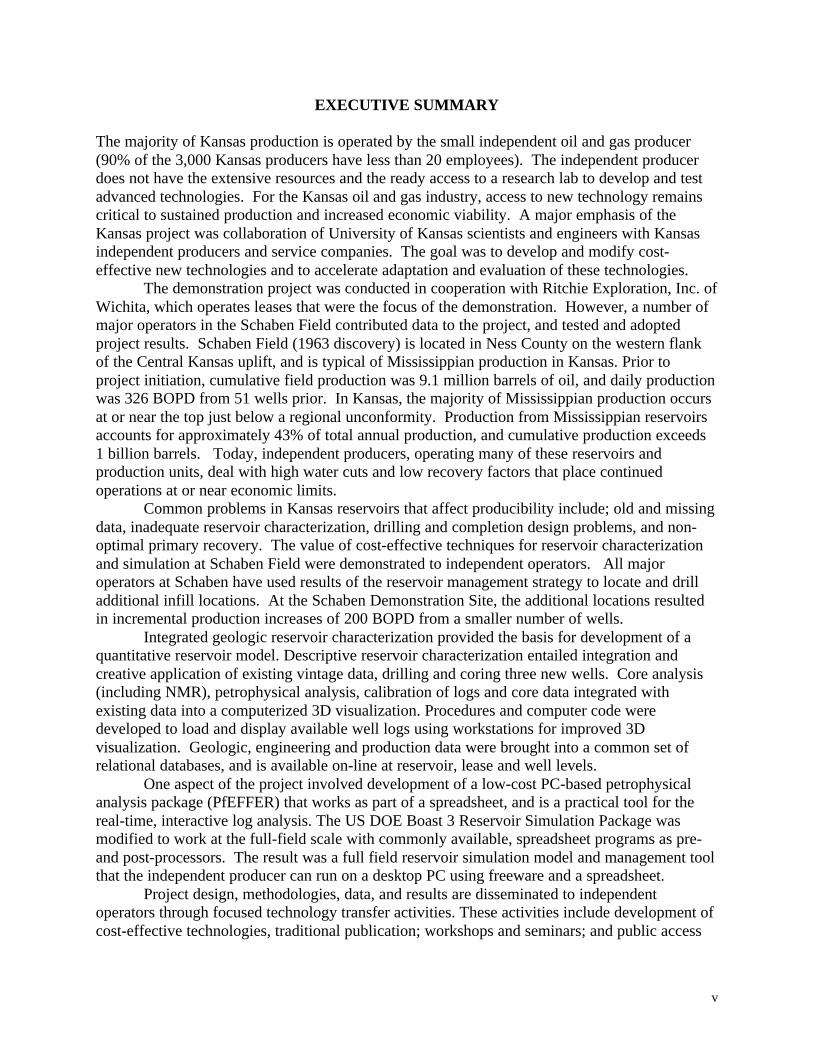
EXECUTIVE SUMMARY
The majority of Kansas production is operated by the small independent oil and gas producer(90% of the 3,000 Kansas producers have less than 20 employees). The independent producerdoes not have the extensive resources and the ready access to a research lab to develop and testadvanced technologies. For the Kansas oil and gas industry, access to new technology remainscritical to sustained production and increased economic viability. A major emphasis of theKansas project was collaboration of University of Kansas scientists and engineers with Kansasindependent producers and service companies. The goal was to develop and modify cost-effective new technologies and to accelerate adaptation and evaluation of these technologies.
The demonstration project was conducted in cooperation with Ritchie Exploration, Inc. ofWichita, which operates leases that were the focus of the demonstration. However, a number ofmajor operators in the Schaben Field contributed data to the project, and tested and adoptedproject results. Schaben Field (1963 discovery) is located in Ness County on the western flankof the Central Kansas uplift, and is typical of Mississippian production in Kansas. Prior toproject initiation, cumulative field production was 9.1 million barrels of oil, and daily productionwas 326 BOPD from 51 wells prior. In Kansas, the majority of Mississippian production occursat or near the top just below a regional unconformity. Production from Mississippian reservoirsaccounts for approximately 43% of total annual production, and cumulative production exceeds1 billion barrels. Today, independent producers, operating many of these reservoirs andproduction units, deal with high water cuts and low recovery factors that place continuedoperations at or near economic limits.
Common problems in Kansas reservoirs that affect producibility include; old and missingdata, inadequate reservoir characterization, drilling and completion design problems, and non-optimal primary recovery. The value of cost-effective techniques for reservoir characterizationand simulation at Schaben Field were demonstrated to independent operators. All majoroperators at Schaben have used results of the reservoir management strategy to locate and drilladditional infill locations. At the Schaben Demonstration Site, the additional locations resultedin incremental production increases of 200 BOPD from a smaller number of wells.
Integrated geologic reservoir characterization provided the basis for development of aquantitative reservoir model. Descriptive reservoir characterization entailed integration andcreative application of existing vintage data, drilling and coring three new wells. Core analysis(including NMR), petrophysical analysis, calibration of logs and core data integrated withexisting data into a computerized 3D visualization. Procedures and computer code weredeveloped to load and display available well logs using workstations for improved 3Dvisualization. Geologic, engineering and production data were brought into a common set ofrelational databases, and is available on-line at reservoir, lease and well levels.
One aspect of the project involved development of a low-cost PC-based petrophysicalanalysis package (PfEFFER) that works as part of a spreadsheet, and is a practical tool for thereal-time, interactive log analysis. The US DOE Boast 3 Reservoir Simulation Package wasmodified to work at the full-field scale with commonly available, spreadsheet programs as pre-and post-processors. The result was a full field reservoir simulation model and management toolthat the independent producer can run on a desktop PC using freeware and a spreadsheet.
Project design, methodologies, data, and results are disseminated to independentoperators through focused technology transfer activities. These activities include development ofcost-effective technologies, traditional publication; workshops and seminars; and public access

vi
through the Internet. In addition to traditional workshops, electronic courses covering importanttechnologies are available. All technologies used have been adapted to be cost-effective forindependent operators of mature fields. Technologies include petrophysical analysis (PfEFFER),visualization (Pseudoseismic), core analysis using NMR, numerical simulation on a PC, andInternet technology transfer. The value of these technologies for independent operators has beendemonstrated. All major operators at Schaben have adopted the results of the reservoirmanagement strategy developed as part of the study, and have located and drilled approximately20 infill locations. Overall results of the incremental wells are very favorable. The procedurescontinued to be transferred to other independent operators through publication, presentations,hands-on computer workshops and Internet access.
1
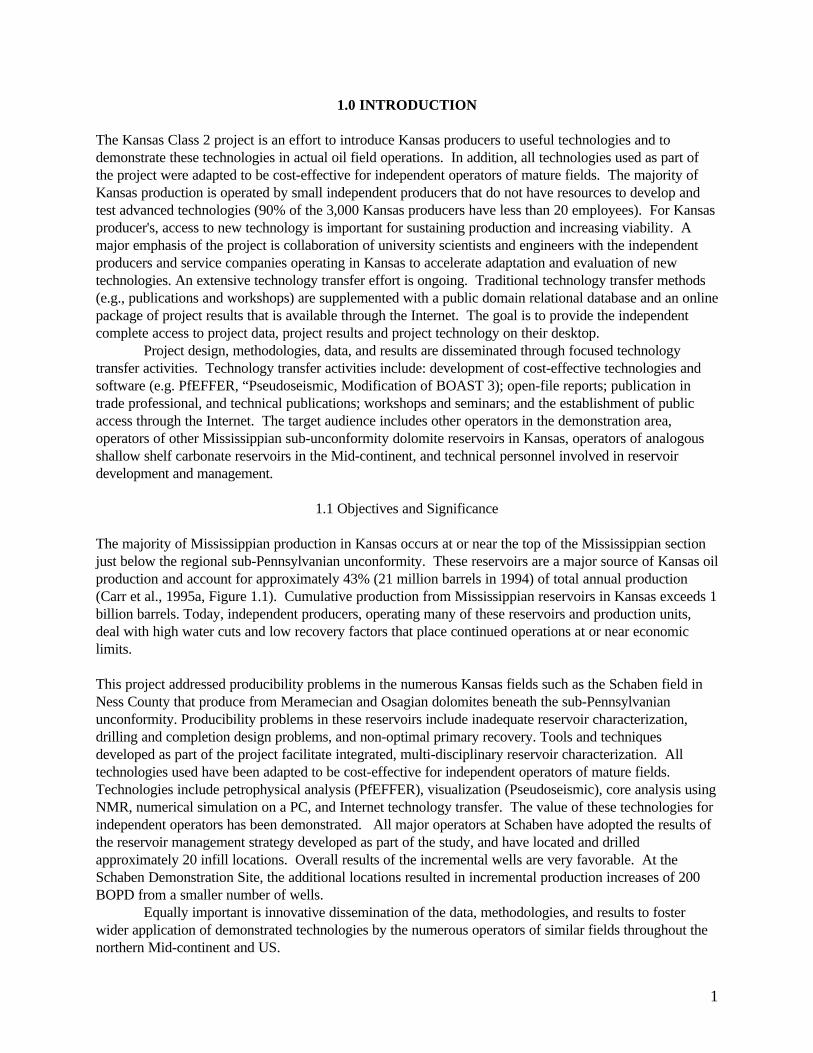
1.0 INTRODUCTION
The Kansas Class 2 project is an effort to introduce Kansas producers to useful technologies and todemonstrate these technologies in actual oil field operations. In addition, all technologies used as part ofthe project were adapted to be cost-effective for independent operators of mature fields. The majority ofKansas production is operated by small independent producers that do not have resources to develop andtest advanced technologies (90% of the 3,000 Kansas producers have less than 20 employees). For Kansasproducer's, access to new technology is important for sustaining production and increasing viability. Amajor emphasis of the project is collaboration of university scientists and engineers with the independentproducers and service companies operating in Kansas to accelerate adaptation and evaluation of newtechnologies. An extensive technology transfer effort is ongoing. Traditional technology transfer methods(e.g., publications and workshops) are supplemented with a public domain relational database and an onlinepackage of project results that is available through the Internet. The goal is to provide the independentcomplete access to project data, project results and project technology on their desktop.
Project design, methodologies, data, and results are disseminated through focused technologytransfer activities. Technology transfer activities include: development of cost-effective technologies andsoftware (e.g. PfEFFER, “Pseudoseismic, Modification of BOAST 3); open-file reports; publication intrade professional, and technical publications; workshops and seminars; and the establishment of publicaccess through the Internet. The target audience includes other operators in the demonstration area,operators of other Mississippian sub-unconformity dolomite reservoirs in Kansas, operators of analogousshallow shelf carbonate reservoirs in the Mid-continent, and technical personnel involved in reservoirdevelopment and management.
1.1 Objectives and Significance
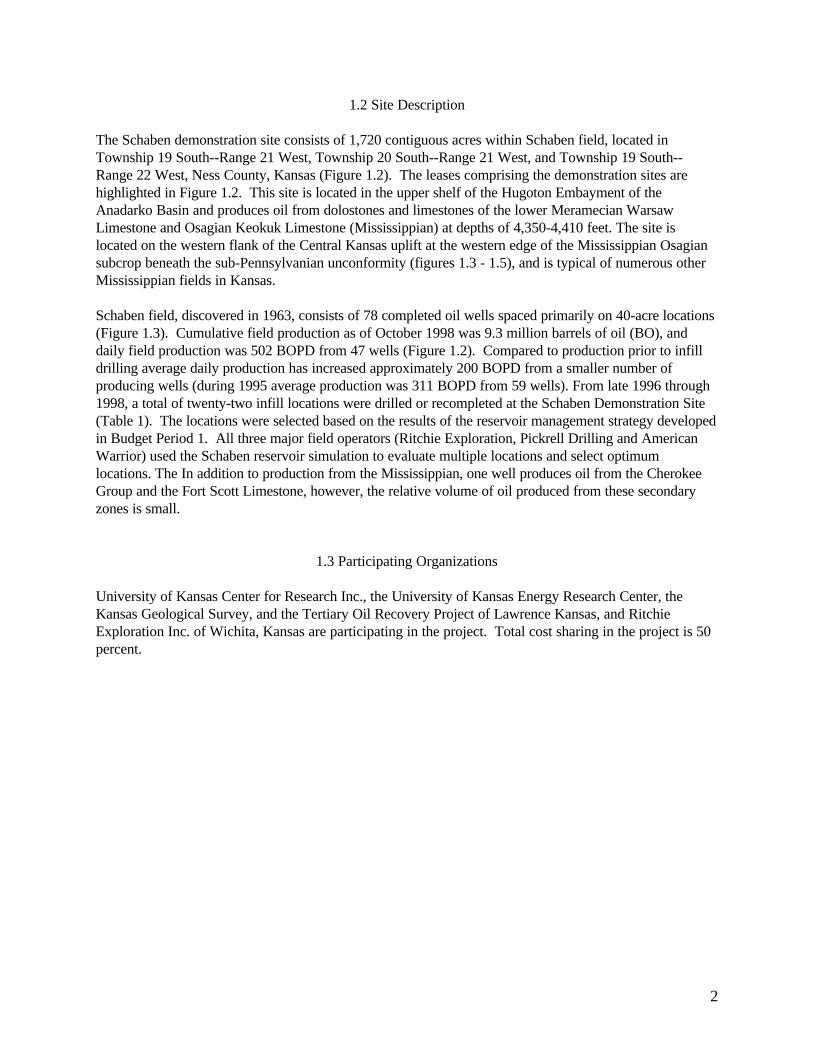
The majority of Mississippian production in Kansas occurs at or near the top of the Mississippian sectionjust below the regional sub-Pennsylvanian unconformity. These reservoirs are a major source of Kansas oilproduction and account for approximately 43% (21 million barrels in 1994) of total annual production(Carr et al., 1995a, Figure 1.1). Cumulative production from Mississippian reservoirs in Kansas exceeds 1billion barrels. Today, independent producers, operating many of these reservoirs and production units,deal with high water cuts and low recovery factors that place continued operations at or near economiclimits.
This project addressed producibility problems in the numerous Kansas fields such as the Schaben field inNess County that produce from Meramecian and Osagian dolomites beneath the sub-Pennsylvanianunconformity. Producibility problems in these reservoirs include inadequate reservoir characterization,drilling and completion design problems, and non-optimal primary recovery. Tools and techniquesdeveloped as part of the project facilitate integrated, multi-disciplinary reservoir characterization. Alltechnologies used have been adapted to be cost-effective for independent operators of mature fields.Technologies include petrophysical analysis (PfEFFER), visualization (Pseudoseismic), core analysis usingNMR, numerical simulation on a PC, and Internet technology transfer. The value of these technologies forindependent operators has been demonstrated. All major operators at Schaben have adopted the results ofthe reservoir management strategy developed as part of the study, and have located and drilledapproximately 20 infill locations. Overall results of the incremental wells are very favorable. At theSchaben Demonstration Site, the additional locations resulted in incremental production increases of 200BOPD from a smaller number of wells.
Equally important is innovative dissemination of the data, methodologies, and results to fosterwider application of demonstrated technologies by the numerous operators of similar fields throughout thenorthern Mid-continent and US.
2
1.2 Site Description
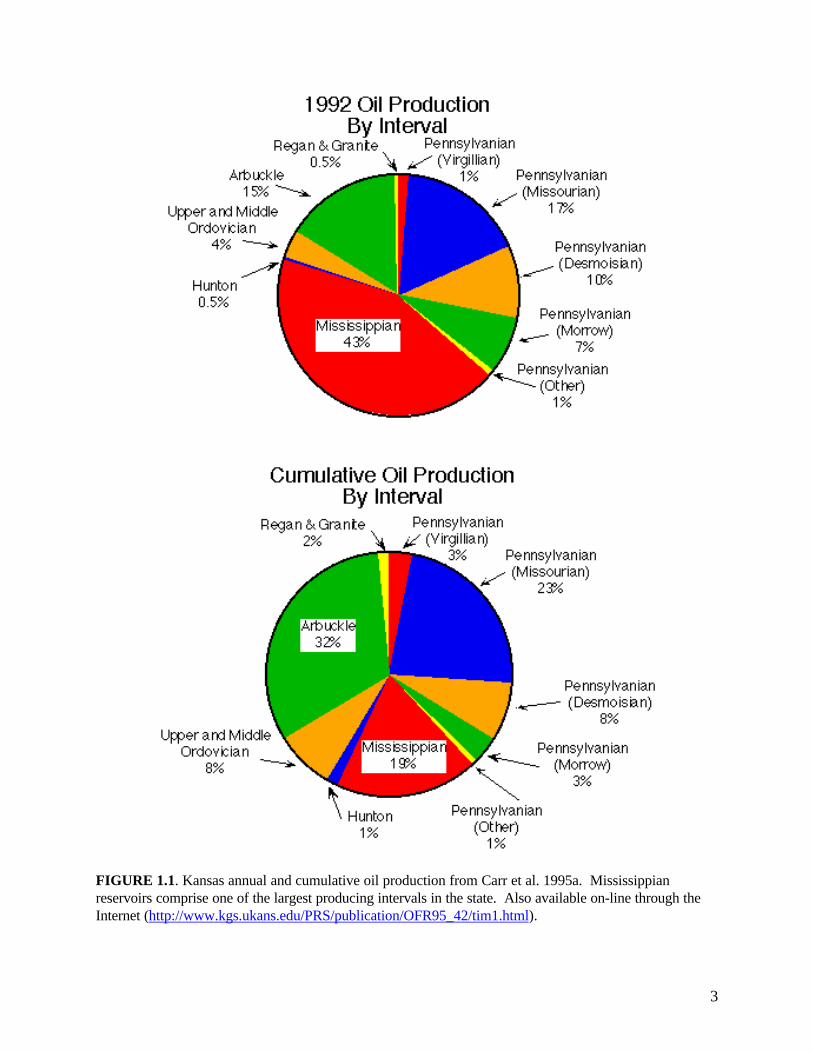
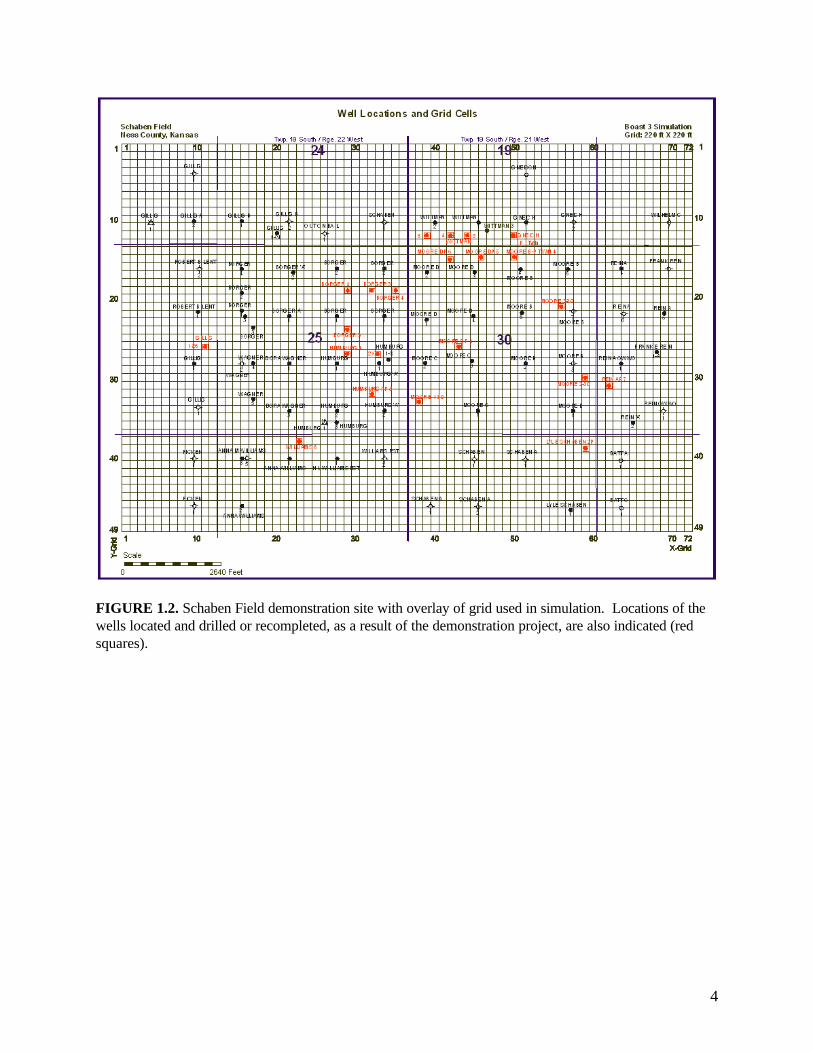
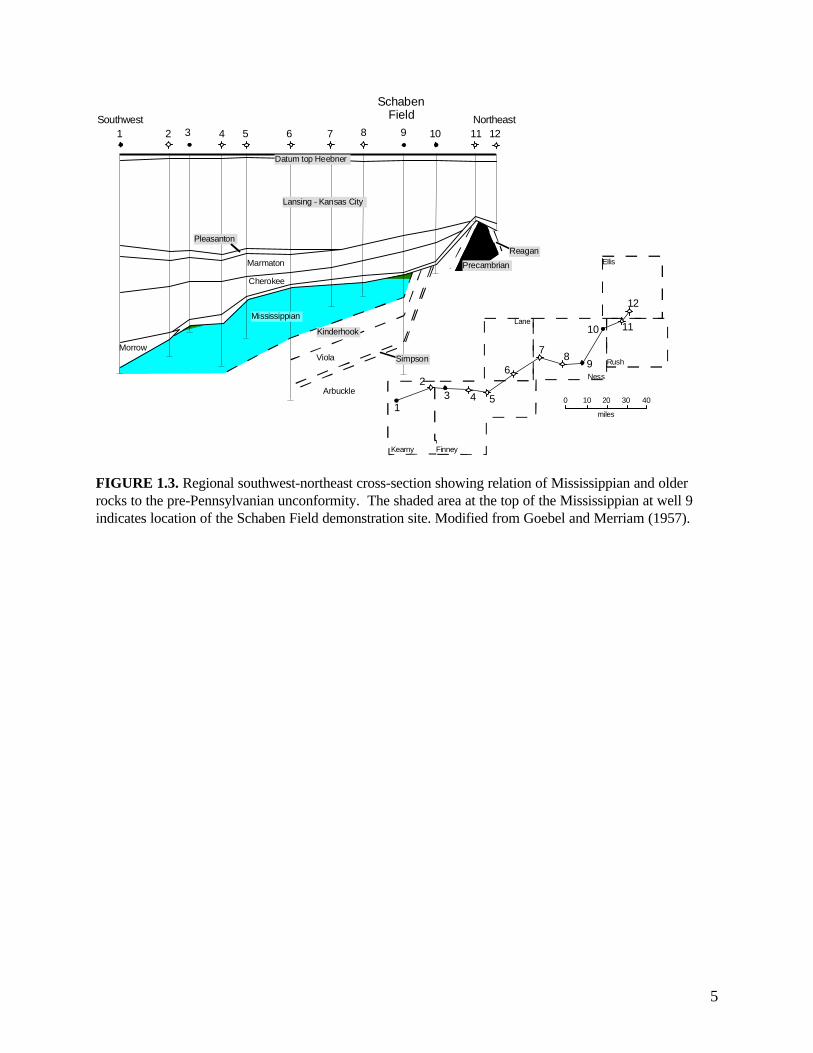
The Schaben demonstration site consists of 1,720 contiguous acres within Schaben field, located inTownship 19 South--Range 21 West, Township 20 South--Range 21 West, and Township 19 South--Range 22 West, Ness County, Kansas (Figure 1.2). The leases comprising the demonstration sites arehighlighted in Figure 1.2. This site is located in the upper shelf of the Hugoton Embayment of theAnadarko Basin and produces oil from dolostones and limestones of the lower Meramecian WarsawLimestone and Osagian Keokuk Limestone (Mississippian) at depths of 4,350-4,410 feet. The site islocated on the western flank of the Central Kansas uplift at the western edge of the Mississippian Osagiansubcrop beneath the sub-Pennsylvanian unconformity (figures 1.3 - 1.5), and is typical of numerous otherMississippian fields in Kansas.
Schaben field, discovered in 1963, consists of 78 completed oil wells spaced primarily on 40-acre locations(Figure 1.3). Cumulative field production as of October 1998 was 9.3 million barrels of oil (BO), anddaily field production was 502 BOPD from 47 wells (Figure 1.2). Compared to production prior to infilldrilling average daily production has increased approximately 200 BOPD from a smaller number ofproducing wells (during 1995 average production was 311 BOPD from 59 wells). From late 1996 through1998, a total of twenty-two infill locations were drilled or recompleted at the Schaben Demonstration Site(Table 1). The locations were selected based on the results of the reservoir management strategy developedin Budget Period 1. All three major field operators (Ritchie Exploration, Pickrell Drilling and AmericanWarrior) used the Schaben reservoir simulation to evaluate multiple locations and select optimumlocations. The In addition to production from the Mississippian, one well produces oil from the CherokeeGroup and the Fort Scott Limestone, however, the relative volume of oil produced from these secondaryzones is small.
1.3 Participating Organizations
University of Kansas Center for Research Inc., the University of Kansas Energy Research Center, theKansas Geological Survey, and the Tertiary Oil Recovery Project of Lawrence Kansas, and RitchieExploration Inc. of Wichita, Kansas are participating in the project. Total cost sharing in the project is 50percent.
3
FIGURE 1.1. Kansas annual and cumulative oil production from Carr et al. 1995a. Mississippianreservoirs comprise one of the largest producing intervals in the state. Also available on-line through theInternet (http://www.kgs.ukans.edu/PRS/publication/OFR95_42/tim1.html).
4
FIGURE 1.2. Schaben Field demonstration site with overlay of grid used in simulation. Locations of thewells located and drilled or recompleted, as a result of the demonstration project, are also indicated (redsquares).
5
Southwest Northeast1 2 3 4 5 6 7 8 9 10 11 12
1
23 4 5
6
78
9
10 11
12
Rush
Ness
Ellis
Lane
FinneyKearny
0 10 20 30 40
miles
Lansing - Kansas City
Pleasanton
Marmaton
Arbuckle
Viola Simpson
Reagan
Datum top Heebner
SchabenField
Cherokee
Mississippian
Kinderhook
Precambrian
Morrow
FIGURE 1.3. Regional southwest-northeast cross-section showing relation of Mississippian and olderrocks to the pre-Pennsylvanian unconformity. The shaded area at the top of the Mississippian at well 9indicates location of the Schaben Field demonstration site. Modified from Goebel and Merriam (1957).
6
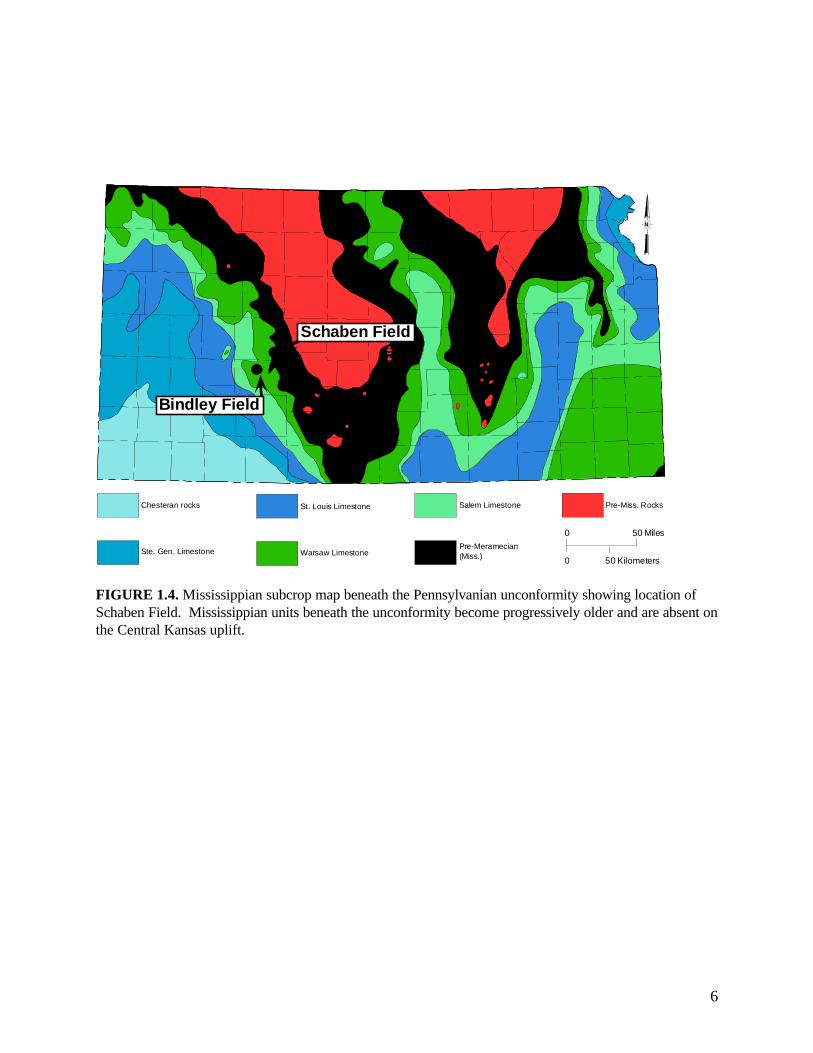
Ste. Gen. Limestone Warsaw Limestone
St. Louis Limestone
Pre-Meramecian(Miss.)
Salem LimestoneChesteran rocks Pre-Miss. Rocks
50 Miles0
0 50 Kilometers
N
Schaben Field
Bindley Field
FIGURE 1.4. Mississippian subcrop map beneath the Pennsylvanian unconformity showing location ofSchaben Field. Mississippian units beneath the unconformity become progressively older and are absent onthe Central Kansas uplift.
7
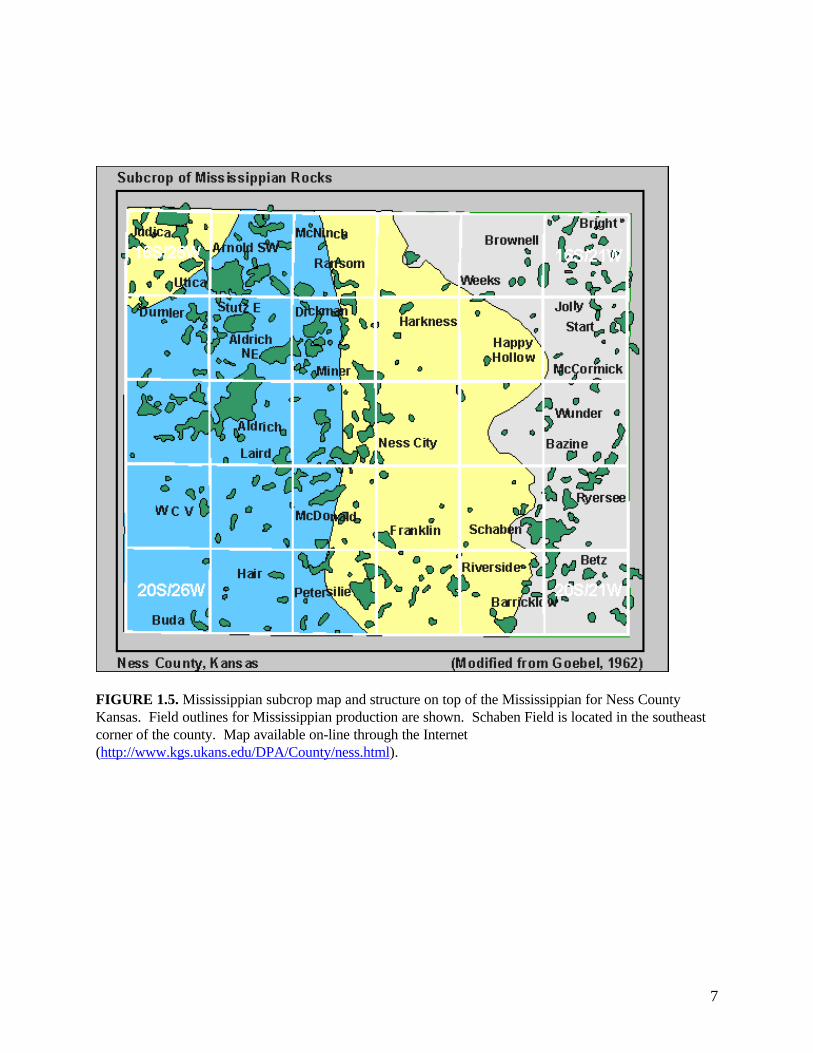
FIGURE 1.5. Mississippian subcrop map and structure on top of the Mississippian for Ness CountyKansas. Field outlines for Mississippian production are shown. Schaben Field is located in the southeastcorner of the county. Map available on-line through the Internet(http://www.kgs.ukans.edu/DPA/County/ness.html).
8
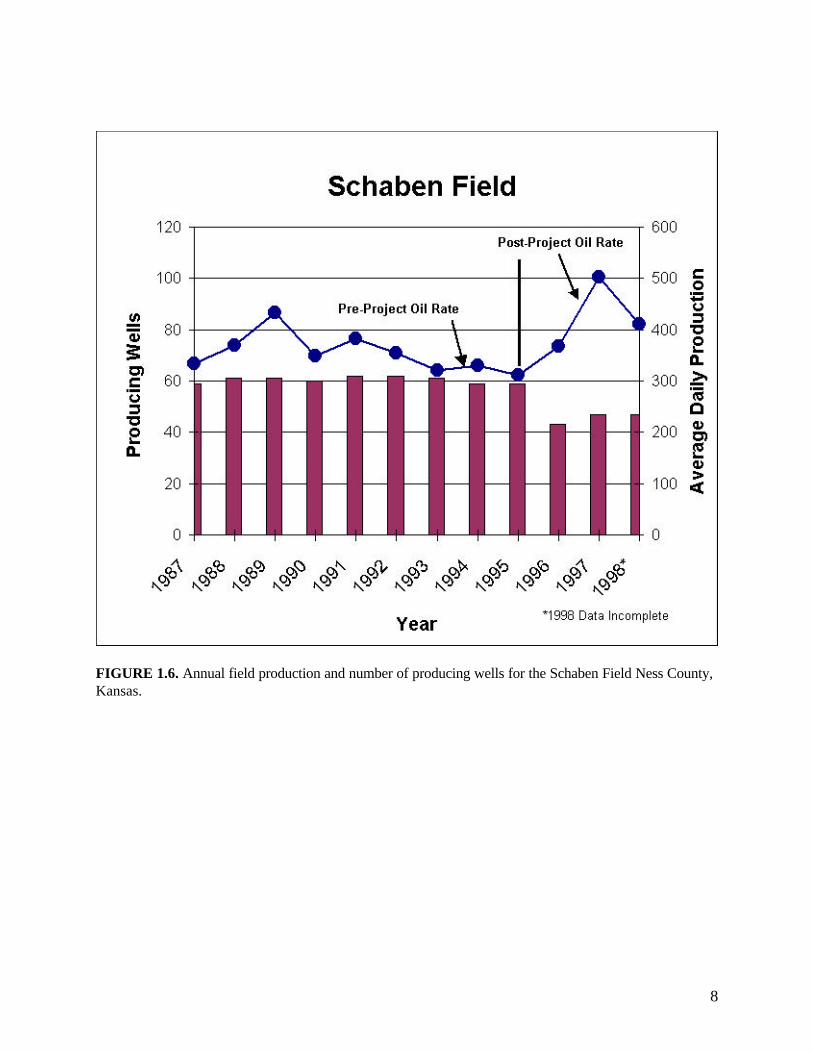
FIGURE 1.6. Annual field production and number of producing wells for the Schaben Field Ness County,Kansas.
9
WellName/Year
Operator API Number StatusRates Per Day
Location
4 BP Twin / 1996 Ritchie Exploration 15-135-23864 15 BO, 283 BW 30-19S-21W, NW-NW-NE
2 P Lyle Schaben/ 1996
Ritchie Exploration 15-135-23925 53 BO, 97 BW 31-19S-21W, NE-NE-NE
1 Gneich P Twin /1996
Ritchie Exploration 15-135-23933 13 BO 72 BW 19-19S-21W, SW-SW-SE
2-30 Moore /1997
American Warrior 15-135-23800 37 BO 0 BW 30-19S-21W, SE-NE-SE
6 DP Moore /1997
Ritchie Exploration 15-135-24006 60 BOPD, 100BW, 241’ FOP
30-19S-21W, NE-NW-NW
3 AP Humburg /1997
Ritchie Exploration 15-135-24013 70 BOPD, 130BW, 33’ FOP
25-19S-22W, NW-SE-SE
4 Humburg / 1997 Pickrell Drilling 15-135-24010 70 BOPD, 130BW, 1347’ FOP
25-19S-22W, NE-NW-SE
3 Borger / 1997 Pickrell Drilling 15-135-23998 66 BOPD, 66 BW,1426’ FOP
25-19S-22W, SW-NE-NE
4 Wittman/ 1997 American Warrior 15-135-23958 108 BO. ? BW 19-19S-21W, SE-SW-SW
5 Wittman / 1997 American Warrior 15-135-23966 108 BO. ? BW 19-19S-21W, SW-SW-SW
7 Rein AP / 1997 Ritchie Exploration 15-135-24031 70 BOPD, 80 BW,530’ FOP
29-19S-21W, SW-NW-SW
5 DP Moore /1997
Ritchie Exploration 15-135-23973 ? 30-19S-21W, NE-NE-NW
4 CP Moore /1997
Ritchie Exploration 15-135-24030 ? 30-19S-21W, NW-NE-SW
4 Borger / 1997 American Warrior 15-135-24007 20 BO, 30 BW 25-19S-22W, SE-NW-NE
3-30 Moore /1997
American Warrior 15-135-23801 25 BO, LittleWater
30-19S-21W, NW-SE-NE
1-30 Moore /1997
American Warrior 15-135-23799 13 BO, 21 BW 30-19S-21W, NW-SW-SW
3 Borger / 1997 American Warrior 15-135-23969 250' FOP 25-19S-22W, SE-SW-NE
2X Humburg Mid Cont R 15-135-24015 12 BO, 60 BW 25-19S-22W, NW-NE-SE
4 Borger Pickrell Drilling 15-135-24048 40 BO, 9 BW 25-19S-22W, NE-SE-NE
1-26 Gillig American Warrior 15-135-24052 15 BO, 110 BW 26-19S-22W, NE-NE-SE
6 Williams American Warrior 15-135-24053 15 BO, 150 BW 36-19S-22W, NE-NE-NW6 Wittman American Warrior 15-135-23958 20 BO, 30 BW 19-19S-22W, SE-SW-SW
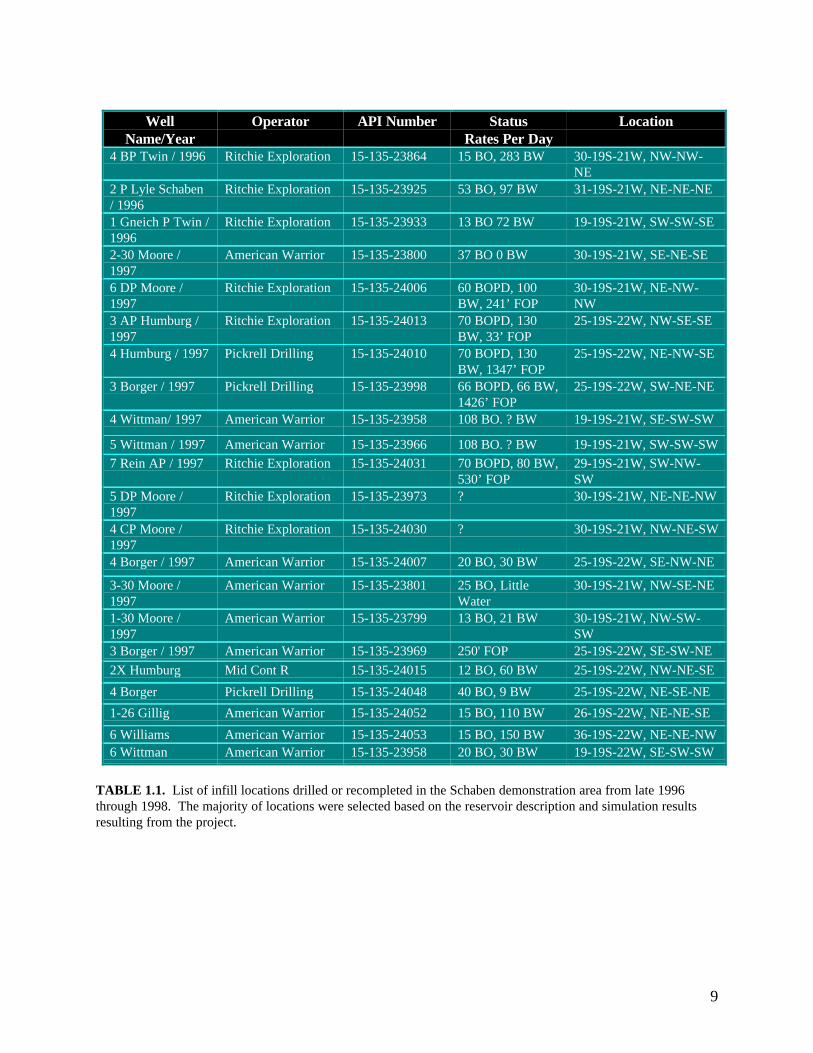
TABLE 1.1. List of infill locations drilled or recompleted in the Schaben demonstration area from late 1996through 1998. The majority of locations were selected based on the reservoir description and simulation resultsresulting from the project.

10
2.0 DISCUSSION
The general goal of the project is the application of existing cost-effective recovery technologies to extendthe economic life of selected fields producing from shallow shelf carbonate reservoirs, and the innovativedissemination of the data, methodologies, and results for the purpose of fostering wider application ofdemonstrated technologies to other fields. The specific goal is to identify areas of unrecovered mobile oil inOsagian and Meramecian (Mississippian) dolostone reservoirs in western Kansas through integrated, multi-disciplinary reservoir characterization, and the demonstration of incremental primary recovery at theSchaben Field Demonstration Site.
At the Schaben site, integrated, descriptive reservoir characterization provided the basis fordevelopment of a reservoir model. Descriptive reservoir characterization entailed integration and creativeapplication of existing data, drilling and coring three new wells through the reservoir interval. Descriptivecore analysis, petrophysical and petrographic analysis, calibration of logs and core data, and integration ofexisting well data into a computerized three dimensional visualization/simulation were used to develop adescriptive reservoir model for the Osagian and Meramecian rocks at the Schaben site.
Acquisition and consolidation of geologic, digital log, and production data are complete and alldata have been entered into a database management and analysis system. Digital data used in constructinggeologic maps and cross-sections and reservoir analysis is available through the Internet(http://www.kgs.ukans.edu/Class2/index.html andhttp://www.kgs.ukans.edu/DPA/Schaben/schabenMain.html). Log analyses, core analyses and descriptionswere completed to better understand the pore geometry of the carbonate reservoir in the Schaben Field. Allof the complexities existing in an evaluation of an extremely heterogeneous reservoir, are present in theproducing reservoir in the Schaben Field. Satisfactory determinations of pore size, throat size, irreduciblewater saturation, permeability, effective porosity, and movable oil are possible with the techniques beingused in the Schaben Field project.
2.1 Field Activities
From late 1996 through 1998, a total of twenty-two infill locations were drilled or recompleted at theSchaben Demonstration Site (Table 1). The locations were selected based on the results of the reservoirmanagement strategy developed in Budget Period 1. All three major field operators (Ritchie Exploration,Pickrell Drilling and American Warrior) used the Schaben reservoir simulation to evaluate multiplelocations and select optimum locations. The history of each well is being evaluated and incorporated into afinal revised full-field simulation. The current reservoir simulation has provided excellent full-field andgood individual history matches for all existing wells. The simulation also provides an estimate ofadditional incremental oil as a result of targeted infill drilling (Figure 2.1).
11
Schaben FieldIncreased Production Rate by Infill Drilling
10
100
1000
10000
10220
10585
10950
11315
11680
12045
12410
12775
13140
13505
13870
14235
Time in days from 1/1/1990
Bar
rels
per
Day
Historical Water RateHistorical Oil RatePredicted Water RatePredicted Oil Rate
Predicted Oil Ratewithout Infill Drilling
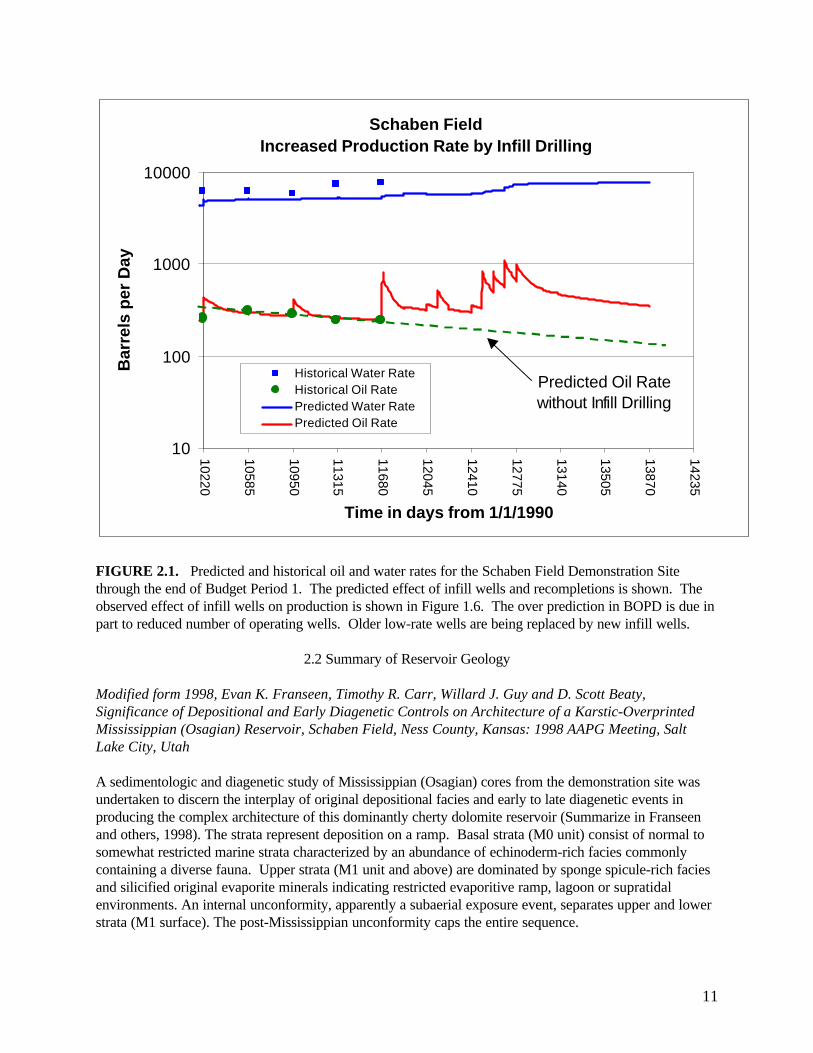
FIGURE 2.1. Predicted and historical oil and water rates for the Schaben Field Demonstration Sitethrough the end of Budget Period 1. The predicted effect of infill wells and recompletions is shown. Theobserved effect of infill wells on production is shown in Figure 1.6. The over prediction in BOPD is due inpart to reduced number of operating wells. Older low-rate wells are being replaced by new infill wells.
2.2 Summary of Reservoir Geology
Modified form 1998, Evan K. Franseen, Timothy R. Carr, Willard J. Guy and D. Scott Beaty,Significance of Depositional and Early Diagenetic Controls on Architecture of a Karstic-OverprintedMississippian (Osagian) Reservoir, Schaben Field, Ness County, Kansas: 1998 AAPG Meeting, SaltLake City, Utah
A sedimentologic and diagenetic study of Mississippian (Osagian) cores from the demonstration site wasundertaken to discern the interplay of original depositional facies and early to late diagenetic events inproducing the complex architecture of this dominantly cherty dolomite reservoir (Summarize in Franseenand others, 1998). The strata represent deposition on a ramp. Basal strata (M0 unit) consist of normal tosomewhat restricted marine strata characterized by an abundance of echinoderm-rich facies commonlycontaining a diverse fauna. Upper strata (M1 unit and above) are dominated by sponge spicule-rich faciesand silicified original evaporite minerals indicating restricted evaporitive ramp, lagoon or supratidalenvironments. An internal unconformity, apparently a subaerial exposure event, separates upper and lowerstrata (M1 surface). The post-Mississippian unconformity caps the entire sequence.

12
Macroscopic, microscopic, well-log, petrophysical and minipermeameter data, and oil shows,indicate that depositional facies and early diagenetic events were dominant controls for reservoircharacteristics. The best reservoir is the sponge spicule-rich wackestone/packstone facies (SWP) withreplaced evaporites. Echinoderm-rich wacke-packstones (EWPG) are also locally important reservoirfacies. Burrow mottling was important in creating localized networks for early diagenetic fluids. Earlydissolution of grains and dolomitization created the moldic, intercrystalline and vuggy porosity importantfor favorable reservoir conditions. Abundant early silica cementation and replacement (chert, megaquartz,chalcedony) created complex heterogeneity. Silica replacement and cementation in EWPG facies typicallyresults in impermeable areas whereas silica cementation and replacement in SWP and mudstone-wackestone (MW) facies results in variably tight or porous (tripolitic) areas containing vuggy, moldic, andintercrystalline porosity. Coarse calcite cementation and poikilotopic calcite replacement associated withthe M1 surface significantly occluded much of the porosity in underlying M0 strata. Fracturing andbrecciation from the post-Mississippian karst, burial and structural events variously enhanced or destroyedreservoir characteristics. Ramp strata were differentially eroded at the post-Mississippian unconformityresulting in complex buried paleotopography.
The most favorable areas for successful production appear to be where SWP facies containingabundant evaporites (M1 unit and above) intersect the post-Mississippian unconformity and formtopographic highs. Our data suggest the EWPG facies to be locally favorable reservoirs. However EWPGfacies that are dominant in the M0 unit are not likely to be favorable reservoirs because processesassociated with the M1 surface significantly occluded much of the porosity. This prediction is confirmed tothe northeast of our study area where M0 strata intersect the unconformity and are not productive. Ourmethods and results provide predictive capability, indicate the potential for deeper stratigraphic traps, andsuggest alternate production strategies such as horizontal drilling or targeted infill drilling may bewarranted.
The results presented here come from three recently cored wells from the Schaben field located inNess County of west central Kansas (Figure 2.2). This area is located on the upper shelf of the HugotonEmbayment of the Anadarko Basin, on the southwest flank of the Central Kansas Uplift. This areaproduces oil from Mississippian (lower Meramecian Warsaw Limestone and Osagian Keokuk Limestone)dolomites and limestones. The three cores of this study are from the Osagian interval. The strata representdeposition on a ramp, the dip of which has been accentuated by post-depositional regional uplift. The rampstrata were differentially eroded at the post-Mississippian unconformity resulting in paleotopographic highs(buried hogbacks, Figures1.3-1.5, 2.3). Previously, these strata have been understood using a karstreservoir model based on the truncation of these strata by the post-Mississippian subaerial unconformity(Figure 2.3). The data of this study indicate that original depositional facies and relatively early diageneticevents have a significant influence on present reservoir characteristics and that later fracturing anddissolution from karst and/or structural influences are locally important but may not be the primary controlon favorable reservoir conditions. The results presented here are providing predictive capabilities to bettercharacterize the many existing subunconformity fields in Kansas.
13
Schaben Field Demonstration Sites
Countour Interval 10'
Schaben
Hinnergardt E.
Hinnergardt
Betz W.
Betz
Betz SW.Schaben S.Bondurant N.
Bondurant W. Bondurant
Schaben NW.Schaben W. Margheim
A
A'
Logged and Cored Well
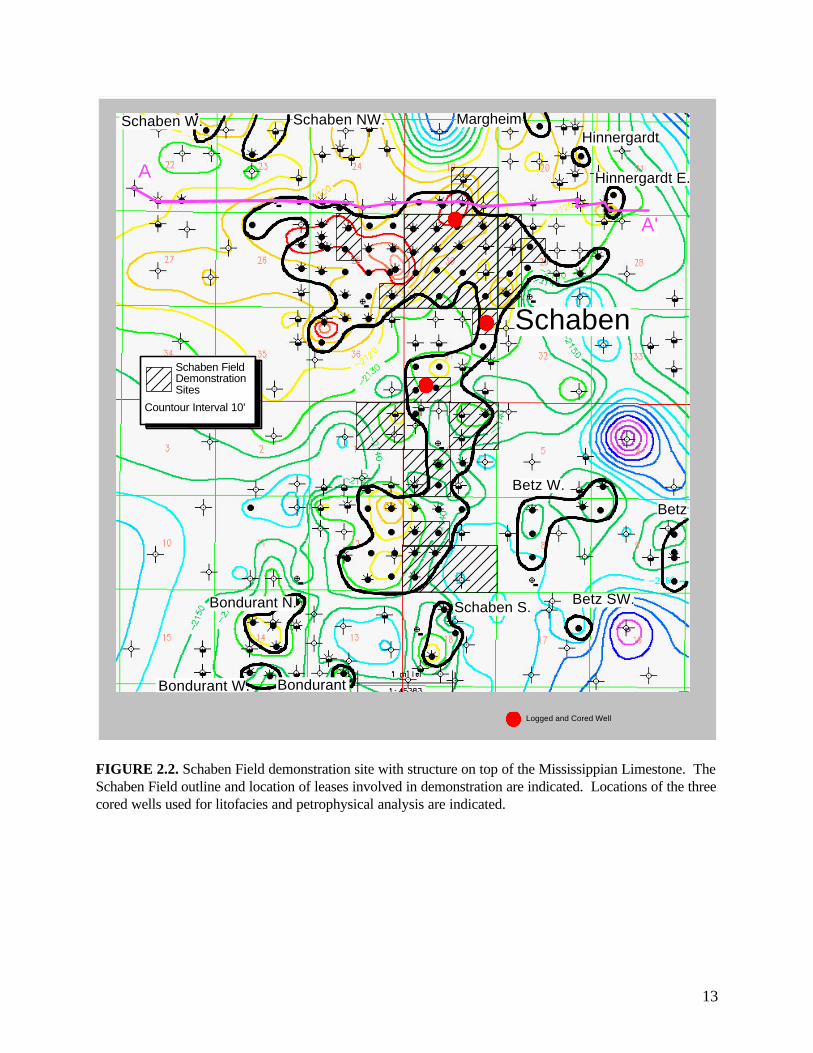
FIGURE 2.2. Schaben Field demonstration site with structure on top of the Mississippian Limestone. TheSchaben Field outline and location of leases involved in demonstration are indicated. Locations of the threecored wells used for litofacies and petrophysical analysis are indicated.
14
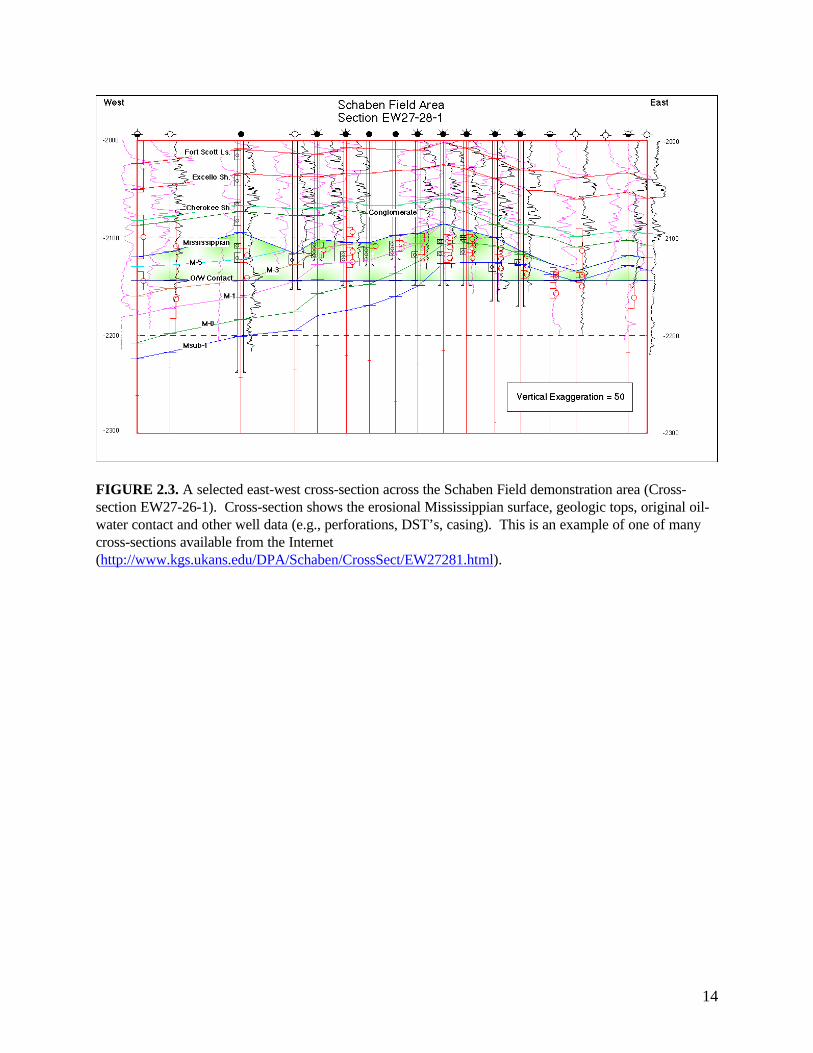
FIGURE 2.3. A selected east-west cross-section across the Schaben Field demonstration area (Cross-section EW27-26-1). Cross-section shows the erosional Mississippian surface, geologic tops, original oil-water contact and other well data (e.g., perforations, DST’s, casing). This is an example of one of manycross-sections available from the Internet(http://www.kgs.ukans.edu/DPA/Schaben/CrossSect/EW27281.html).
15
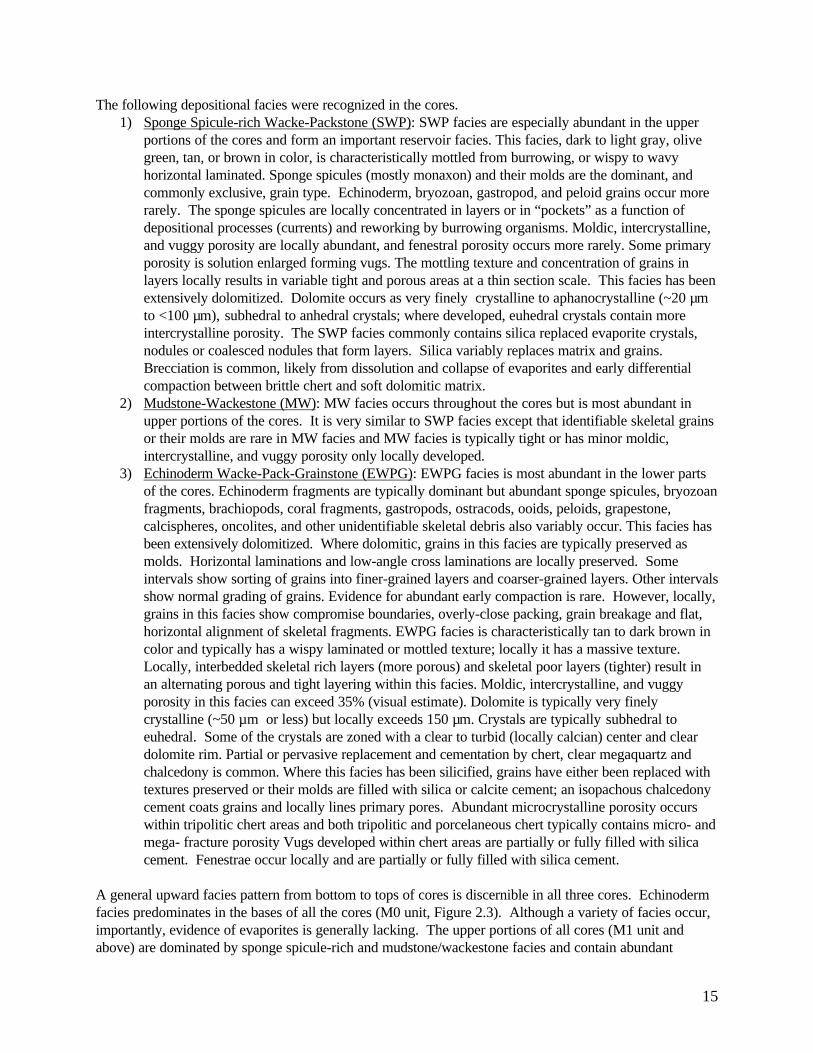
The following depositional facies were recognized in the cores.1) Sponge Spicule-rich Wacke-Packstone (SWP): SWP facies are especially abundant in the upper
portions of the cores and form an important reservoir facies. This facies, dark to light gray, olivegreen, tan, or brown in color, is characteristically mottled from burrowing, or wispy to wavyhorizontal laminated. Sponge spicules (mostly monaxon) and their molds are the dominant, andcommonly exclusive, grain type. Echinoderm, bryozoan, gastropod, and peloid grains occur morerarely. The sponge spicules are locally concentrated in layers or in “pockets” as a function ofdepositional processes (currents) and reworking by burrowing organisms. Moldic, intercrystalline,and vuggy porosity are locally abundant, and fenestral porosity occurs more rarely. Some primaryporosity is solution enlarged forming vugs. The mottling texture and concentration of grains inlayers locally results in variable tight and porous areas at a thin section scale. This facies has beenextensively dolomitized. Dolomite occurs as very finely crystalline to aphanocrystalline (~20 µmto <100 µm), subhedral to anhedral crystals; where developed, euhedral crystals contain moreintercrystalline porosity. The SWP facies commonly contains silica replaced evaporite crystals,nodules or coalesced nodules that form layers. Silica variably replaces matrix and grains.Brecciation is common, likely from dissolution and collapse of evaporites and early differentialcompaction between brittle chert and soft dolomitic matrix.
2) Mudstone-Wackestone (MW): MW facies occurs throughout the cores but is most abundant inupper portions of the cores. It is very similar to SWP facies except that identifiable skeletal grainsor their molds are rare in MW facies and MW facies is typically tight or has minor moldic,intercrystalline, and vuggy porosity only locally developed.
3) Echinoderm Wacke-Pack-Grainstone (EWPG): EWPG facies is most abundant in the lower partsof the cores. Echinoderm fragments are typically dominant but abundant sponge spicules, bryozoanfragments, brachiopods, coral fragments, gastropods, ostracods, ooids, peloids, grapestone,calcispheres, oncolites, and other unidentifiable skeletal debris also variably occur. This facies hasbeen extensively dolomitized. Where dolomitic, grains in this facies are typically preserved asmolds. Horizontal laminations and low-angle cross laminations are locally preserved. Someintervals show sorting of grains into finer-grained layers and coarser-grained layers. Other intervalsshow normal grading of grains. Evidence for abundant early compaction is rare. However, locally,grains in this facies show compromise boundaries, overly-close packing, grain breakage and flat,horizontal alignment of skeletal fragments. EWPG facies is characteristically tan to dark brown incolor and typically has a wispy laminated or mottled texture; locally it has a massive texture.Locally, interbedded skeletal rich layers (more porous) and skeletal poor layers (tighter) result inan alternating porous and tight layering within this facies. Moldic, intercrystalline, and vuggyporosity in this facies can exceed 35% (visual estimate). Dolomite is typically very finelycrystalline (~50 µm or less) but locally exceeds 150 µm. Crystals are typically subhedral toeuhedral. Some of the crystals are zoned with a clear to turbid (locally calcian) center and cleardolomite rim. Partial or pervasive replacement and cementation by chert, clear megaquartz andchalcedony is common. Where this facies has been silicified, grains have either been replaced withtextures preserved or their molds are filled with silica or calcite cement; an isopachous chalcedonycement coats grains and locally lines primary pores. Abundant microcrystalline porosity occurswithin tripolitic chert areas and both tripolitic and porcelaneous chert typically contains micro- andmega- fracture porosity Vugs developed within chert areas are partially or fully filled with silicacement. Fenestrae occur locally and are partially or fully filled with silica cement.
A general upward facies pattern from bottom to tops of cores is discernible in all three cores. Echinodermfacies predominates in the bases of all the cores (M0 unit, Figure 2.3). Although a variety of facies occur,importantly, evidence of evaporites is generally lacking. The upper portions of all cores (M1 unit andabove) are dominated by sponge spicule-rich and mudstone/wackestone facies and contain abundant

16
evidence of evaporites. Correlations of facies in cores and well-logs indicate deposition on a ramp. Theabundance of echinoderm-rich facies with other diverse fauna, abundance of burrowing organisms and onlyrare occurrence of evaporites in M0 suggest deposition in relatively normal to somewhat restricted marineenvironments. In contrast, the abundance of mudstone, wackestone and spicule-rich facies, relative rarityof echinoderm-rich facies, and abundance of evaporites in M1 and above suggest deposition in restricted,evaporitive ramp, lagoon or supratidal environments. However, the abundance of burrow mottling indicatesconditions sufficient to support organisms that reworked the sediment. Evaporite characteristics (radiatingblades, isolated to coalesced nodules, and coalesced vertically elongate nodule layers) indicate formation ina supratidal to shallow subaqueous setting at or just below the sediment/water interface. Local fenestralfabric indicates at least intermittent subaerial exposure.
EWPG facies are mostly characteristic of a shallow subtidal ramp setting. Horizontal lamination,cross-lamination, normal grading, packing of grains, grain breakage, and scoured contacts evidence at leastintermittent high energy. In the M0 unit, this facies likely represents deposition from storm and turbiditycurrents or from migration of subtidal shoals or banks. Local fenestral fabrics in the echinoderm facies,especially in the M1 unit, indicate at least local subaerial exposure. Local echinoderm-rich layers in the M1unit may represent shelfward migration of subtidal shoals or shelfward deposition from storm currents.
SWP and MW facies are more indicative of a low energy and restricted setting. Although spongespicule facies are commonly thought to represent deeper water basinal sections, their association withevaporites and local evidence of subaerial exposure evidence shallow water environments. As demonstratedby studies in other areas, sponges thrived and likely formed sponge mats, gardens or mounds in thisenvironment. Local wispy and wavy horizontal lamination, horizontal planar lamination and interbeds ofgrainstone in mudstone to packstone indicate transport and reworking of sediment by currents likelygenerated from tides or storms. The change between the normal to restricted marine ramp (M0 unit) andthe evaporitic ramp to lagoon (M1 unit and above) is marked by a sharp contact (termed the M1 surface).This surface and the strata immediately below for several meters show significant alteration. A coarsecalcite cement and replacive poikilotopic calcite is associated with the M1 surface and occurs variablythroughout strata below this surface to the bottom of the cores. This cement is very important foroccluding porosity in strata below the surface. A similar calcite cement and calcite replacement in the upperfive feet of the cores is presumably a separate event related to post-Mississippian subaerial exposure.The interpretation of two separate events is supported by:
1) the absence of calcite in strata lying between the M1 surface and the occurrence of calcite inthe upper five feet,
2) fractures that were filled with coarse calcite cement below the M1 surface are cross cut byfractures filled with sediment from facies overlying the M1 surface, and
3) brecciated areas just below the M1 surface that contain clasts of the poikilotopic calcite-replaced facies in dolomitic matrix.
These features are not observed in strata above the M1 surface. The strata immediately below the M1surface contain local fenestral fabric, fractures, breccia, autobreccia, clay-rich horizons with abundanthorizontal fenestrae interlaminated with fine- to coarse-grained detrital quartz, locally abundant glauconite,oblong altered areas with abundant fenestrae and local branching, downward tapering microfractures(roots?). In combination, these features and crosscutting relationships strongly support a subaerialexposure event at the M1 surface.
Petrographic, minipermeameter, and nuclear magnetic remanence (NMR) data indicate SWP facieswith abundant original evaporites are the most favorable reservoirs. EWPG facies are also locallyfavorable reservoir facies. Burrow mottling was very important in creating networks for later diageneticfluids that resulted in variable porous and tight areas on macroscopic and microscopic scales. Very finelycrystalline (<10-50 µm) dolomite is characteristic of early reflux or mixing zone dolomitization. Thepredominance of original evaporites in M1 strata is supportive of a reflux mechanism. Early dissolution of

17
grains and dolomitization created moldic, intercrystalline and vuggy porosity important for favorablereservoir conditions.
Silica cementation and replacement of original lithologies is abundant throughout all three coresand replaces all facies types. The abundance of silica replacement is at least partially due to the abundanceof sponge spicules. Early silica cementation and replacement is evidenced by silicified areas closelyfollowing burrow networks, displacive growth of silica nodules, brittle fracturing of silica areas and soft-sediment deformation of surrounding dolomite sediment and fractures in silica filled with dolomiticsediment. In addition, preservation of radiating bladed evaporite crystal and nodule textures without muchbreakage or compaction is supportive of early silica replacement. Silica replacement and cementation tendto result in relatively tight and pervasive replacement in EWPG facies whereas in SWP and MW facies,silica replacement is variable, especially where evaporites were replaced and contain more moldic andvuggy porosity. Brittle fracturing results in local micro- and macro-fracture porosity The silicified areas inEWPG are typically tight and form impermeable layers. However, some silicified areas contain abundantmicrocrystalline, vuggy and moldic porosity (tripolitic chert). In SWP and MW facies, silica replacementmay partially or totally replace matrix and grains or replace the dolomite matrix and leave spicules asmolds.
Silicified areas, MW facies and local shale layers that tend to be tight impart a complex verticalheterogeneity in the cores. Minipermeameter data collected every 0.25 feet (0.08 meters) supportmacroscopic and petrographic observations and document this vertical heterogeneity at a detailed scale notrevealed by whole-core and standard plug data.
The coarse calcite cement and replacement associated with the M1 surface was extremelyimportant in occluding porosity in underlying strata. This is confirmed by low minipermeameter readings,NMR data, the relative lack of oil staining, and the lack of production even where the M0 intervalintersects the post-Mississippian unconformity in favorable structurally high areas to the northeast ofSchaben Field (Figures 2.2, 2.3).
Brecciation and fracturing are ubiquitous throughout the three cores on macroscopic andmicroscopic scales. Fracture fill and breccia matrix includes shale, subangular to rounded, silt- to coarse-grained size detrital quartz, chert, megaquartz, chalcedony grains, carbonate micrite, carbonate grains, andskeletal grains. Clasts (ranging from rounded to angular) include chert/chalcedony/megaquartz fragments,clasts of original carbonate facies, replacive poikilotopic calcite clasts, coarse calcite cement fragments,and rubble of red and greenish limy clay.
Brecciation and fracturing were caused by a variety of processes interacting at different times.Some areas reveal several generations of fracturing, brecciation, cementation and sediment fills resulting incomplex fabrics. As discussed earlier, early differential compaction between silicified areas andsurrounding matrix resulted in brittle fracturing and soft-sediment deformation of surrounding matrixwhich imparted a fracture and breccia fabric. Local fracturing and brecciation were caused by earlysubaerial exposure (M1 surface). Post-Mississippian subaerial exposure, burial compaction and structuraluplift resulted in brittle fracturing and brecciation of all facies and previous diagenetic events. Early andlate fracturing and brecciation variably enhanced or destroyed reservoir characteristics as indicated byminipermeameter and NMR data and oil stain patterns. Fracture and breccia matrix porosity that remainedopen results in vertical communication among the thin intervals with favorable reservoir characteristicscontrolled by depositional facies and early diagenesis.
Historically, topographic highs just underlying the post-Mississippian unconformity are viewed asthe most favorable locations for petroleum exploration and production. This study indicates thatstructurally uplifted and tilted Mississippian ramp strata were differentially eroded at the post-Mississippian unconformity resulting in a complex buried paleotopography. Sedimentologic, stratigraphic,diagenetic, petrophysical and well log data indicate that the most favorable areas for successful productionmay be where SWP facies originally containing abundant evaporites intersect the post-Mississippianunconformity and form the topographic highs. In contrast, areas where EWPG facies intersect the
18
unconformity and form topographic highs are more variable as to reservoir characteristics. Our resultsindicate that M0 strata are relatively tight due to calcite cementation and replacement associated withsubaerial exposure at the M1 surface and, therefore, are not favorable reservoir intervals. The fact that M0strata are not productive where the M0 interval intersects the post-Mississippian unconformity instructurally favorable positions to the NE of our study area confirms the above prediction and highlightsthe value of detailed sedimentologic and diagenetic studies for understanding the relative importance ofcontrols on reservoirs and providing predictive capabilities.
Although drilling strategies have been based on a karst-controlled model, the complex verticalheterogeneity and significance of depositional facies and early diagenesis in controlling reservoirarchitecture demonstrated in this study indicate that other production strategies such as horizontal drillingor targeted infill drilling may be viable alternative strategies. Future studies should address whether or notfracture porosity is necessary for making the depositional and early diagenetic controlled reservoir faciesproductive intervals.
2.3 Overview of Petrophysical Analyses
Modified from: 1998, Guy, W.J., Byrnes, A.P., Doveton, J.H., and Franseen, E.K., Influence of Lithologyand Pore Geometry on NMR Prediction of Permeability and Effective Porosity in MississippianCarbonates, Kansas: 1998 AAPG Meeting, Salt Lake City, Utah.
Saturated and desaturated NMR response was integrated with air-brine and air-mercury capillary pressureanalysis and with lithologic and other petrophysical analyses for cores from a carbonate reservoir inKansas. This integration provides guidelines for selection of appropriate T2 cutoffs in these rocks and anunderstanding of lithologic controls on permeability prediction using NMR response. Three cores from theMississippian reservoir, Schaben Field, Ness County, Kansas were studied (Figure 2.1). From these wells,50 core plugs, representing a wide range in porosity, permeability, and lithology were selected for detailedinvestigation. Special core-analysis testing was performed on these samples including (for most samples):routine and in situ porosity and pore volume compressibility, routine air and in situ Klinkenbergpermeability, air-brine capillary pressure analysis and determination of "irreducible" brine saturation, air-mercury capillary pressure on selected samples, effective and relative gas permeability, determination of theArchie cementation and saturation exponents, and saturated and desaturated NMR analysis for selectedsamples. Core lithologies were described and thin-sections of representative samples were examined.
The reservoir at Schaben Field is composed primarily of dolomite or lime mudstone-wackestone,sponge spicule-rich wackestone-packstone, and echinoderm-rich wackestone-packstone-grainstone.Porosity within these lithologies is generally intergranular, intercrystalline, or moldic but may also containa significant portion of vugs. Grain or crystal sizes are fine to micrite size (<100um to <2um) resulting invery fine pores. Brecciation, fracturing, and carbonate replacement with microporous chert are common inall lithologies. Each lithology exhibits a generally unique range of porosity and permeability values, whichtogether define a continuous porosity-permeability trend. Where fracturing and vugs are present,permeability is enhanced and the range in permeability for any given porosity is broadened. Mercurycapillary pressure analysis shows that pore throat size for all lithologies is the dominant control onpermeability and threshold entry pressures.
Oil columns in this region are generally less than 50 feet. Water saturations, corresponding to thecapillary pressure generated by this column, correlate well with permeability for rocks with little or novuggy porosity or microporous chert. Because of this correlation, permeability prediction using bothporosity and T2 is improved over prediction using porosity alone. While a causal relationship existsbetween effective porosity (and pore body size), measured by T2, and permeability, the relative influence ofeffective porosity and pore body sizes appears to be small compared to the influence of pore throats. Basedon the significant difference in the correlation between T2 and permeability for rocks with and without

19
vugs, it is probable that this correlation is partially based on a correlation between pore body and porethroat size, which can differ between lithologies exhibiting different pore geometries. If this is correct,accurate permeability prediction using NMR will require “calibration” of the T2-permeability relationshipfor each lithology exhibiting a unique relationship between pore throats and pore bodies. Thesecorrelations and the constant or exponents obtained will therefore be lithology specific. However,relationships using T2 in addition to porosity should also provide a significant improvement overpermeability prediction using porosity alone. Where vuggy porosity is present, T2 cutoffs appropriate forintergranular porosity do not provide good permeability prediction. Based on these observationsappropriate T2 cutoffs for delineating effective intergranular porosity are range from 10 to 100 andincrease with increasing permeability and pore throat and body size.
Many Mississippian reservoirs exhibit high water-cuts and low recovery efficiencies, whichrequires accurate reservoir characterization and assessment for effective reservoir management.Delineation of effective and ineffective porosity and accurate prediction of production potential plays animportant role. Conventional logging tools provide significant data but do not generally allow definitiveidentification of productive and non-productive intervals. NMR logs provide information concerningeffective porosity and pore size, both of which can aid significantly in reservoir characterization, but NMRresponse has not been evaluated against petrophysical properties in these carbonate reservoir systems. Ofparticular interest are issues concerning the selection of T2 cutoffs, permeability prediction, and therobustness of selected parameters for the wide range of lithologies present in these reservoirs. As part ofthe Class 2 project the Schaben field has been extensively studied to provide information for the hundredsof other small operators who manage fields with similar characteristics.
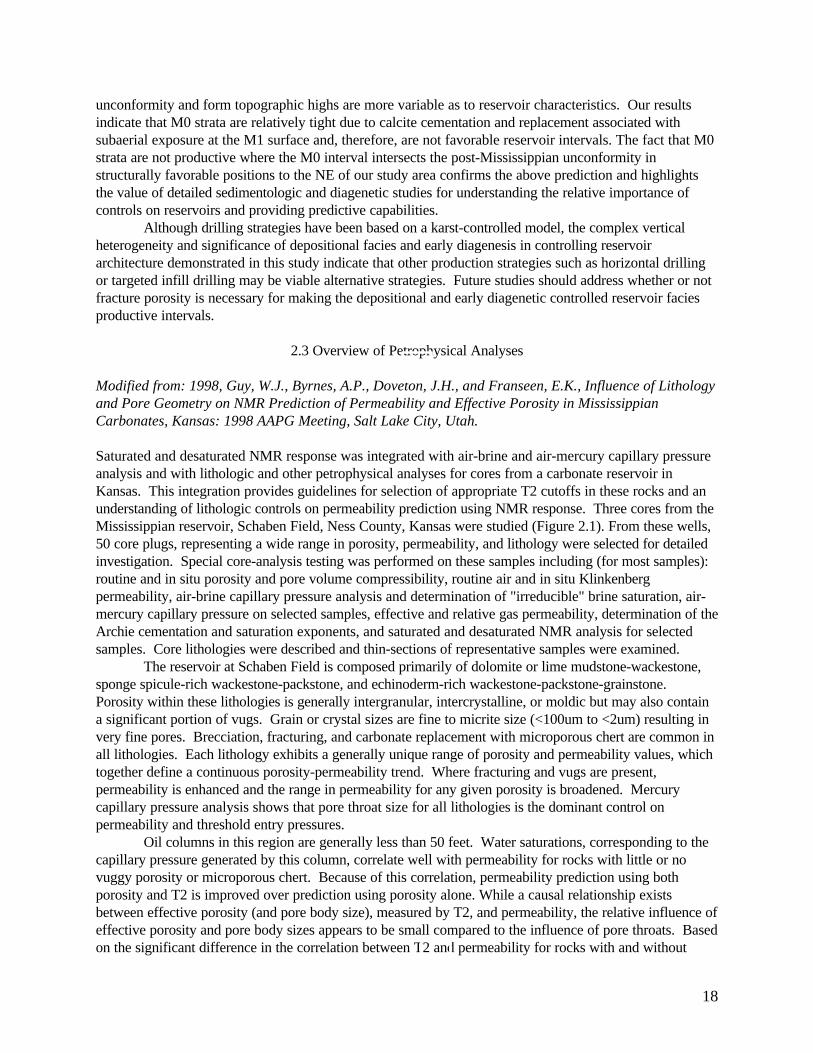
Total Porosity. Routine helium-porosity values, measured on core plugs, range from 4 to 26%.Petrographic analysis indicates that porosity is dominantly intergranular or intercrystalline or moldic wherethe rock is dolomitized. Locally, subaerial exposure and karstification resulted in the development offenestral or vuggy porosity. Porosity values are generally highest in the grainstones and lowest in themudstones. In situ porosity values, measured at a net confining stress of ~2,000 psi (13,800 kPa), areapproximately 96+6% of ambient values (error represents 2 standard deviations). NMR total porosityvalues agreed with helium and gravimetric fluid-filled porosity values within the error of the variousmeasurement methods (+0.1 porosity percent).for 75% of the samples and was off by approximately 1 p.u.for 25% of the samples (Figure 2.4).
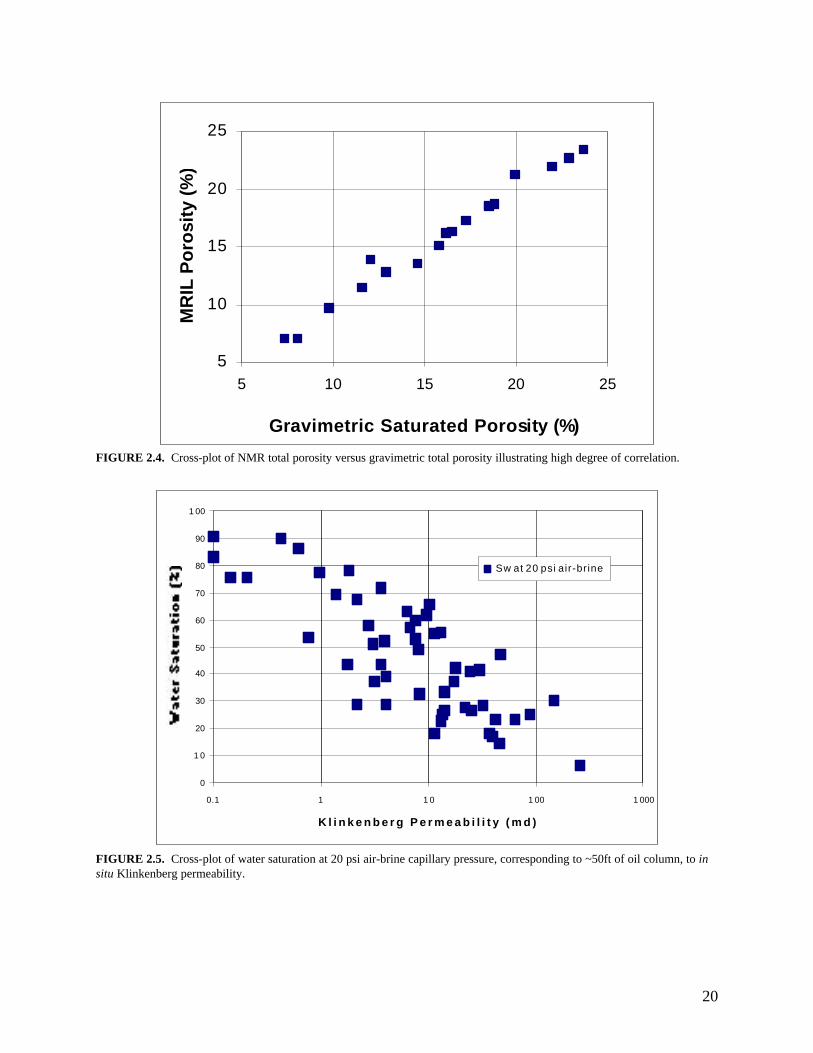
“Irreducible Water” Saturation. Air-brine and air-mercury capillary pressure curves indicate thatfor many of the lithologies present in the Schaben field reservoir there is insufficient oil column to displacewater to “irreducible” water saturation levels. Oil columns in the Schaben field range from approximately35-50ft, corresponding to laboratory air-brine capillary pressures of 15-20 psi and pore entry throatdiameters of 2-3 microns. At air-brine capillary pressures of 20 psi, water saturations (Sw20) average26+5% higher than those near “irreducible” brine saturation, as measured at 1,000 psi air-brine capillarypressure (Figure 2.5). When capillary pressures are insufficient to desaturate a rock to “irreducible” it isimportant to distinguish between effective porosity as measured by NMR, which represents the volume ofthe pores involved with total fluid flow, and effective hydrocarbon porosity, which represents the fractionof the effective porosity that is available for hydrocarbon flow. For the carbonates studied here,permeabilities predicted using the effective porosity must be modified to reflect the relative permeability ofthe actual sample saturations. This requires the development of a correlation between the effectivehydrocarbon permeability at the appropriate water saturation and total or absolute permeability.
20
5
10
15
20
25
5 10 15 20 25
Gravimetric Saturated Porosity (%)
MR
IL P
oro
sity
(%
)
FIGURE 2.4. Cross-plot of NMR total porosity versus gravimetric total porosity illustrating high degree of correlation.
0
1 0
20
30
40
50
60
70
80
90
1 00
0.1 1 1 0 1 00 1 000
K l i n k e n b e r g P e r m e a b i l i t y ( m d )
Sw at 20 psi air-brine
FIGURE 2.5. Cross-plot of water saturation at 20 psi air-brine capillary pressure, corresponding to ~50ft of oil column, to insitu Klinkenberg permeability.
21
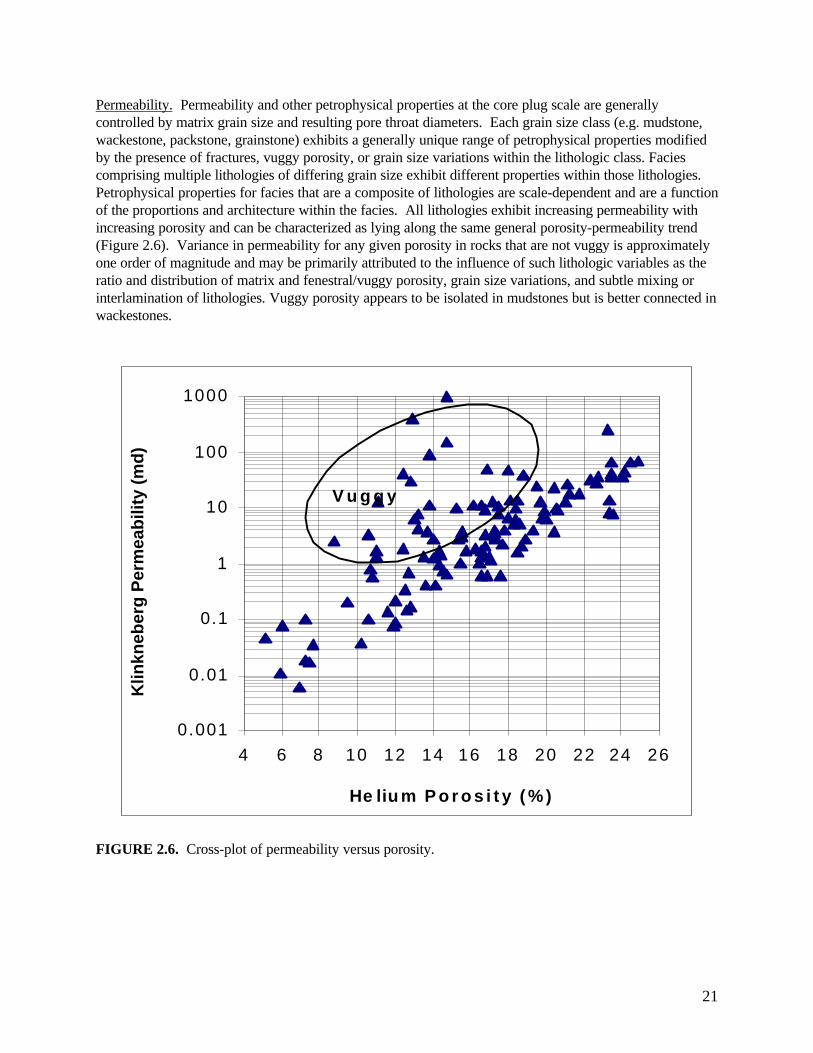
Permeability. Permeability and other petrophysical properties at the core plug scale are generallycontrolled by matrix grain size and resulting pore throat diameters. Each grain size class (e.g. mudstone,wackestone, packstone, grainstone) exhibits a generally unique range of petrophysical properties modifiedby the presence of fractures, vuggy porosity, or grain size variations within the lithologic class. Faciescomprising multiple lithologies of differing grain size exhibit different properties within those lithologies.Petrophysical properties for facies that are a composite of lithologies are scale-dependent and are a functionof the proportions and architecture within the facies. All lithologies exhibit increasing permeability withincreasing porosity and can be characterized as lying along the same general porosity-permeability trend(Figure 2.6). Variance in permeability for any given porosity in rocks that are not vuggy is approximatelyone order of magnitude and may be primarily attributed to the influence of such lithologic variables as theratio and distribution of matrix and fenestral/vuggy porosity, grain size variations, and subtle mixing orinterlamination of lithologies. Vuggy porosity appears to be isolated in mudstones but is better connected inwackestones.
0.001
0.01
0.1
1
10
100
1000
4 6 8 10 12 14 16 18 20 22 24 26
He liu m P o r o s i t y ( % )
Klin
kneb
erg
Per
mea
bili
ty (
md
)
V u g g y
FIGURE 2.6. Cross-plot of permeability versus porosity.
22
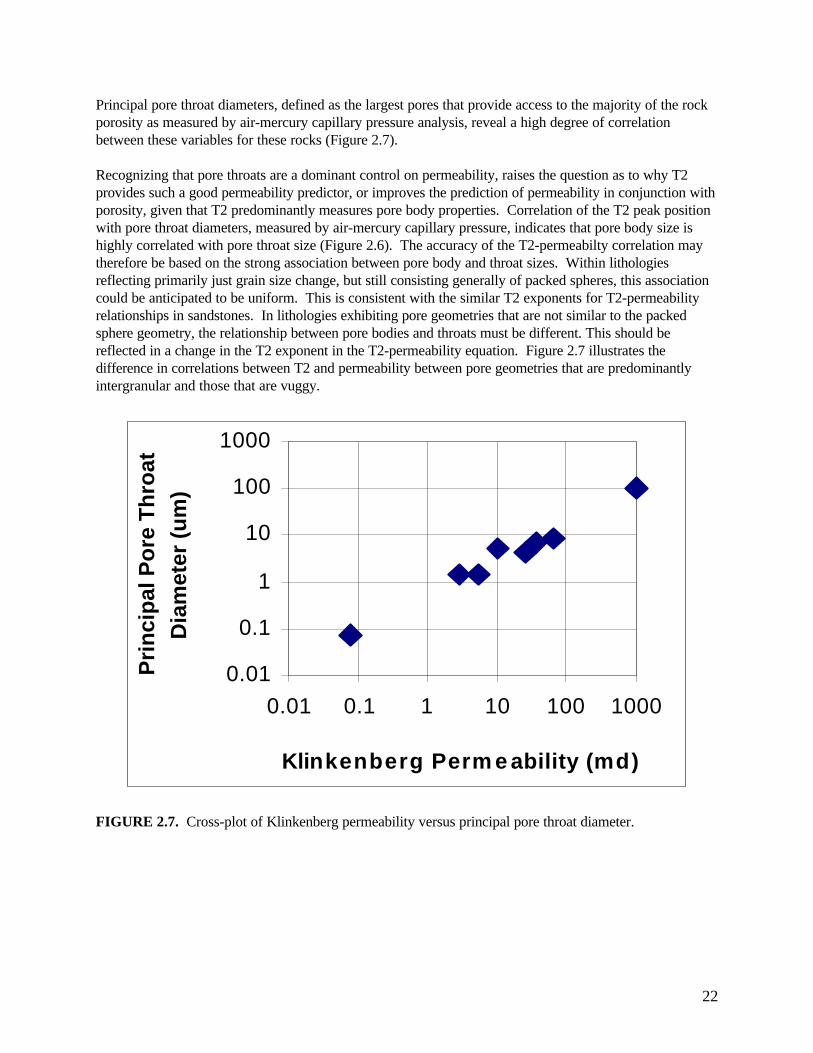
Principal pore throat diameters, defined as the largest pores that provide access to the majority of the rockporosity as measured by air-mercury capillary pressure analysis, reveal a high degree of correlationbetween these variables for these rocks (Figure 2.7).
Recognizing that pore throats are a dominant control on permeability, raises the question as to why T2provides such a good permeability predictor, or improves the prediction of permeability in conjunction withporosity, given that T2 predominantly measures pore body properties. Correlation of the T2 peak positionwith pore throat diameters, measured by air-mercury capillary pressure, indicates that pore body size ishighly correlated with pore throat size (Figure 2.6). The accuracy of the T2-permeabilty correlation maytherefore be based on the strong association between pore body and throat sizes. Within lithologiesreflecting primarily just grain size change, but still consisting generally of packed spheres, this associationcould be anticipated to be uniform. This is consistent with the similar T2 exponents for T2-permeabilityrelationships in sandstones. In lithologies exhibiting pore geometries that are not similar to the packedsphere geometry, the relationship between pore bodies and throats must be different. This should bereflected in a change in the T2 exponent in the T2-permeability equation. Figure 2.7 illustrates thedifference in correlations between T2 and permeability between pore geometries that are predominantlyintergranular and those that are vuggy.
0.01
0.1
1
10
100
1000
0.01 0.1 1 10 100 1000
Klinkenberg Perm e ability (md)
Pri
nci
pal
Po
re T
hro
at
Dia
met
er (
um
)
FIGURE 2.7. Cross-plot of Klinkenberg permeability versus principal pore throat diameter.
23
1
10
100
1000
0.1 1 10 100 1000Principal Pore Throat Diameter (u m)
NM
R T
2 P
eak
(ms)
Principal Peak
Vuggy
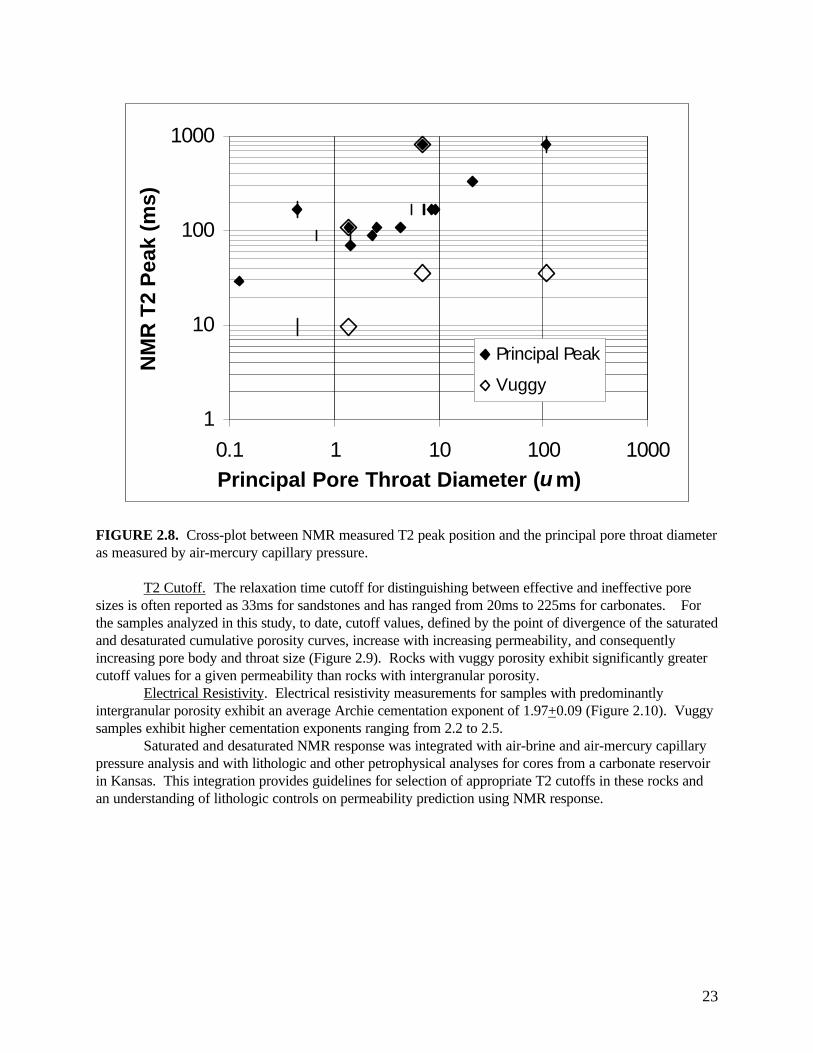
FIGURE 2.8. Cross-plot between NMR measured T2 peak position and the principal pore throat diameteras measured by air-mercury capillary pressure.
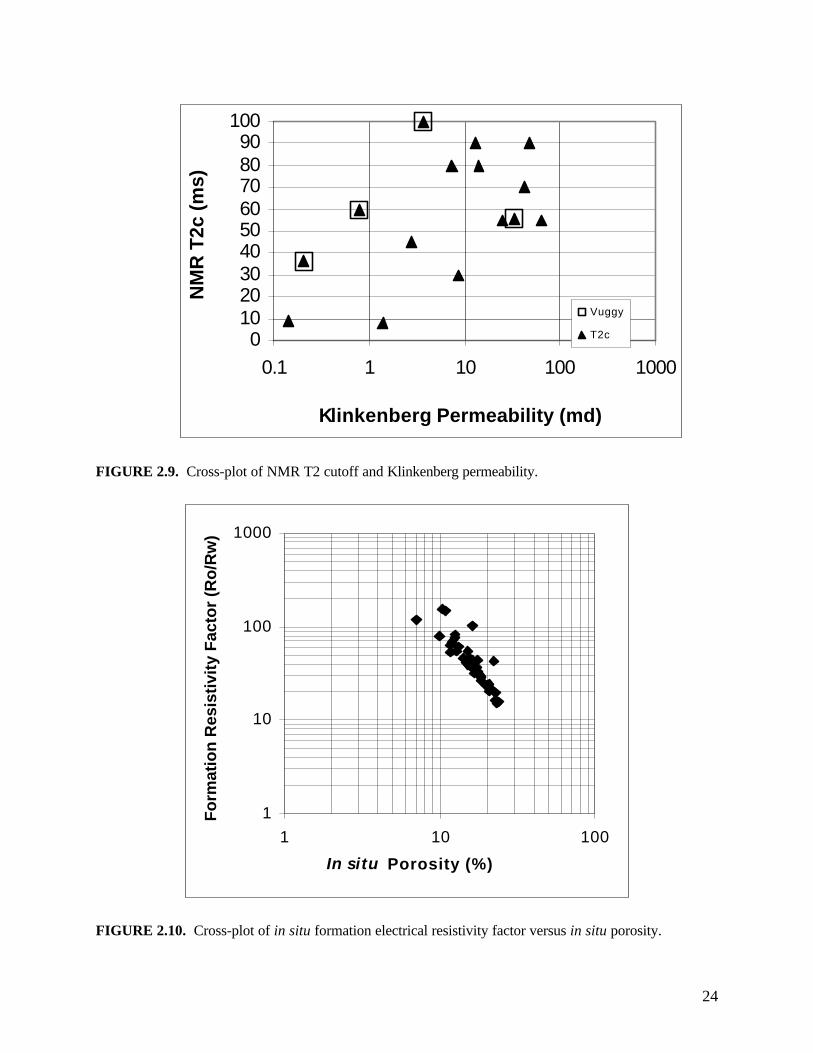
T2 Cutoff. The relaxation time cutoff for distinguishing between effective and ineffective poresizes is often reported as 33ms for sandstones and has ranged from 20ms to 225ms for carbonates. Forthe samples analyzed in this study, to date, cutoff values, defined by the point of divergence of the saturatedand desaturated cumulative porosity curves, increase with increasing permeability, and consequentlyincreasing pore body and throat size (Figure 2.9). Rocks with vuggy porosity exhibit significantly greatercutoff values for a given permeability than rocks with intergranular porosity.
Electrical Resistivity. Electrical resistivity measurements for samples with predominantlyintergranular porosity exhibit an average Archie cementation exponent of 1.97+0.09 (Figure 2.10). Vuggysamples exhibit higher cementation exponents ranging from 2.2 to 2.5.
Saturated and desaturated NMR response was integrated with air-brine and air-mercury capillarypressure analysis and with lithologic and other petrophysical analyses for cores from a carbonate reservoirin Kansas. This integration provides guidelines for selection of appropriate T2 cutoffs in these rocks andan understanding of lithologic controls on permeability prediction using NMR response.
24
0102030405060708090
100
0.1 1 10 100 1000
Klinkenberg Permeability (md)
NM
R T
2c (
ms)
Vuggy
T2c
FIGURE 2.9. Cross-plot of NMR T2 cutoff and Klinkenberg permeability.
1
10
100
1000
1 10 100
In situ Porosity (%)
Fo
rmat
ion
Res
isti
vity
Fac
tor
(Ro
/Rw
)
FIGURE 2.10. Cross-plot of in situ formation electrical resistivity factor versus in situ porosity.

25
2.4 Evaluation of Horizontal Drilling
Modified from: in press, P.M. Gerlach, S. Bhattacharya, T.R. Carr, Cost Effective Techniques for theIndependent Producer to Evaluate Horizontal Drilling Candidates in Mature Areas: AAPG HedbergConference, International Horizontal Well Symposium: Focus on the Reservoir,http://www.kgs.ukans.edu/PRS/AAPG/papers/gerlach.html.
Horizontal wells are a cost efficient tool for reservoir management that has not been widely adopted bysmall independent operators of mature oil fields. Horizontal drilling has been extensively applied as anexploitation and exploration tool in relatively under-exploited reservoirs such as the Austin Chalk and instructurally complex reservoirs. In recent years horizontal technology has been extended to incremental oilrecovery in the mature oil fields of southeast Saskatchewan. Though the technological needs in manymature onshore reservoirs are unique, the overall reservoir management objectives and requirements forcommercial success are similar to those elsewhere.
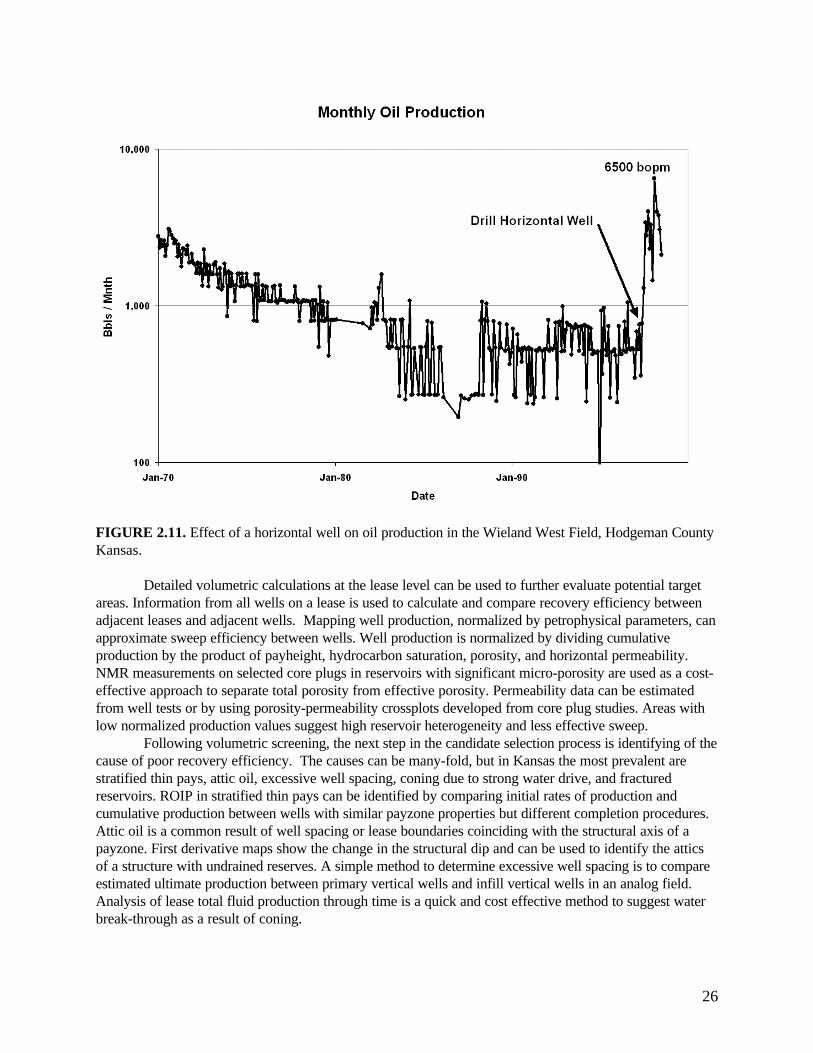
Application of horizontal drilling in Kansas has been limited to 28 wells. In Kansas results havebeen mixed with a few significant successes (Figure 2.11). Operator concerns for appropriate economicreturn, and difficulty in identifying candidate reservoirs have been the principal factors restrictingapplication of horizontal drilling technology. Recent declines in cost factors have brought horizontaldrilling technology within the economic reach of small independent producers. The remaining barrier towider application of horizontal technology by the small independent is cost-effective approaches to target ahorizontal well. We present several low-cost approaches that can be used to evaluate a potential horizontalwell. These cost-effective screening techniques apply at the field scale, the lease level, and the well level.The techniques discussed enable the small independent producer to quickly and efficiently evaluatereservoir candidates, and predict performance of horizontal well application.
Kansas is a mature petroleum producing province with many marginal oil and gas fields operatedby over 3,000 independent oil producers. As a result of operational and depositional-diageneticheterogeneities most of these fields have recovery efficiencies of less than 30% original oil in place (OOIP).This low recovery efficiency results in significant remaining oil in place (ROIP). Operators can usehorizontal technology to add new reserves by exploiting the ROIP in their existing fields, and to moreefficiently recover known oil and gas reserves.
Operational heterogeneities are inherent in field development practices and results in significantROIP. Examples of operational heterogeneities include inadequate drainage due to excessive well spacing,openhole/partial completions, bypassed attic oil, thin pays, and water coning. Depositional-diageneticreservoir heterogeneities due to vertical and lateral variability of petrophysical properties createcompartments in the reservoir. These types of heterogeneities are a function of original depositionalarchitecture and the subsequent diagenetic overprint. Examples include highly variable pore geometry ofcarbonate rocks, anisotropic permeability in fractured reservoirs, and stratified flow units.
Cost-effective screening tools. The primary screening tool for identifying candidate reservoirs is"quick-look volumetric" calculations. This method uses only one well per unit area (e.g., quarter section) toidentify pay height, porosity, and saturation to compute OOIP. These reservoir properties can be estimatedfrom public domain data and computed using simple log analysis programs. PfEFFER, a low costintegrated log analysis tool developed by the Kansas Geological Survey, is used to identify well flow units,associated petrophysical and reservoir properties, and potential for production. Cumulative production perquarter section is then divided by OOIP to calculate recovery efficiency. The mapping of recoveryefficiency across the field identifies target areas for further study. Regions with low recovery efficiency arethose most likely to yield additional or incremental hydrocarbon reserves.
26
FIGURE 2.11. Effect of a horizontal well on oil production in the Wieland West Field, Hodgeman CountyKansas.
Detailed volumetric calculations at the lease level can be used to further evaluate potential targetareas. Information from all wells on a lease is used to calculate and compare recovery efficiency betweenadjacent leases and adjacent wells. Mapping well production, normalized by petrophysical parameters, canapproximate sweep efficiency between wells. Well production is normalized by dividing cumulativeproduction by the product of payheight, hydrocarbon saturation, porosity, and horizontal permeability.NMR measurements on selected core plugs in reservoirs with significant micro-porosity are used as a cost-effective approach to separate total porosity from effective porosity. Permeability data can be estimatedfrom well tests or by using porosity-permeability crossplots developed from core plug studies. Areas withlow normalized production values suggest high reservoir heterogeneity and less effective sweep.
Following volumetric screening, the next step in the candidate selection process is identifying of thecause of poor recovery efficiency. The causes can be many-fold, but in Kansas the most prevalent arestratified thin pays, attic oil, excessive well spacing, coning due to strong water drive, and fracturedreservoirs. ROIP in stratified thin pays can be identified by comparing initial rates of production andcumulative production between wells with similar payzone properties but different completion procedures.Attic oil is a common result of well spacing or lease boundaries coinciding with the structural axis of apayzone. First derivative maps show the change in the structural dip and can be used to identify the atticsof a structure with undrained reserves. A simple method to determine excessive well spacing is to compareestimated ultimate production between primary vertical wells and infill vertical wells in an analog field.Analysis of lease total fluid production through time is a quick and cost effective method to suggest waterbreak-through as a result of coning.
27
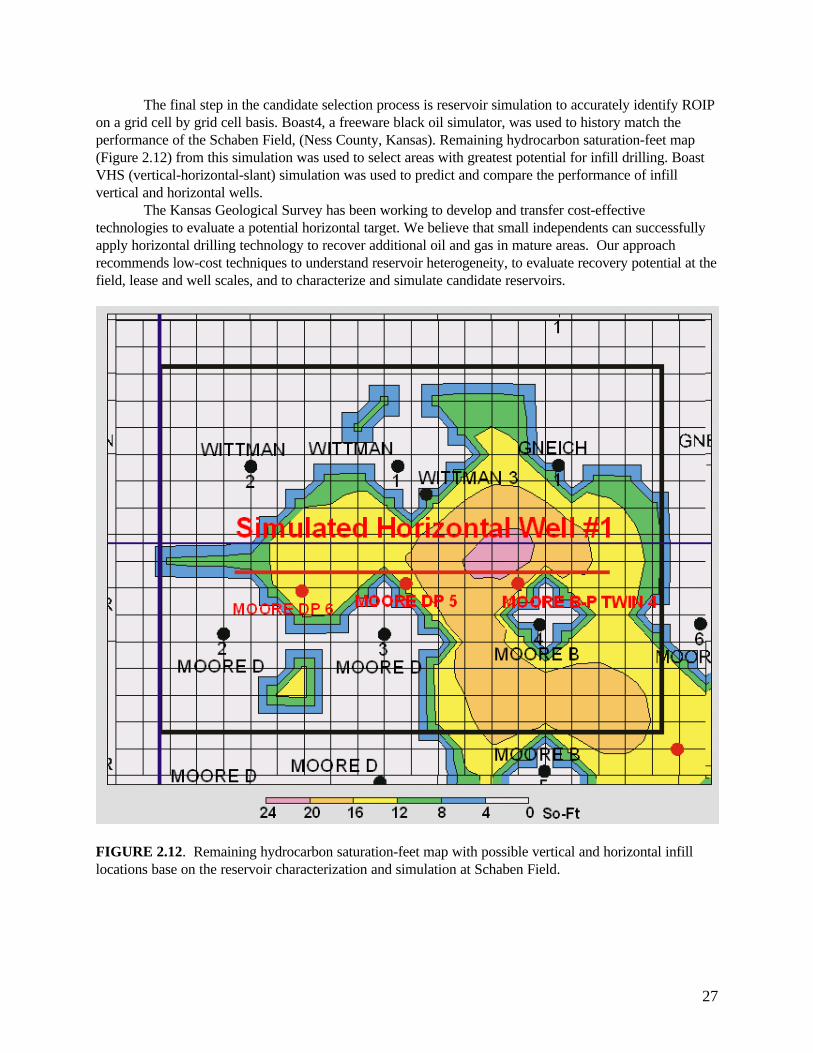
The final step in the candidate selection process is reservoir simulation to accurately identify ROIPon a grid cell by grid cell basis. Boast4, a freeware black oil simulator, was used to history match theperformance of the Schaben Field, (Ness County, Kansas). Remaining hydrocarbon saturation-feet map(Figure 2.12) from this simulation was used to select areas with greatest potential for infill drilling. BoastVHS (vertical-horizontal-slant) simulation was used to predict and compare the performance of infillvertical and horizontal wells.
The Kansas Geological Survey has been working to develop and transfer cost-effectivetechnologies to evaluate a potential horizontal target. We believe that small independents can successfullyapply horizontal drilling technology to recover additional oil and gas in mature areas. Our approachrecommends low-cost techniques to understand reservoir heterogeneity, to evaluate recovery potential at thefield, lease and well scales, and to characterize and simulate candidate reservoirs.
FIGURE 2.12. Remaining hydrocarbon saturation-feet map with possible vertical and horizontal infilllocations base on the reservoir characterization and simulation at Schaben Field.

28
2.5 Synopsis of PfEFFER
The petrophysical analysis and reservoir evaluation computer package (PfEFFER) was enhanced inconjunction with the Class 2 project. PfEFFER version 2.0 and PfEFFER Pro were released in February1998. Prototype software was tested and successfully applied in Schaben Field. PfEFFER stands for"Petrofacies Evaluation of Formations For Engineering Reservoirs" (Doveton and others, 1995).
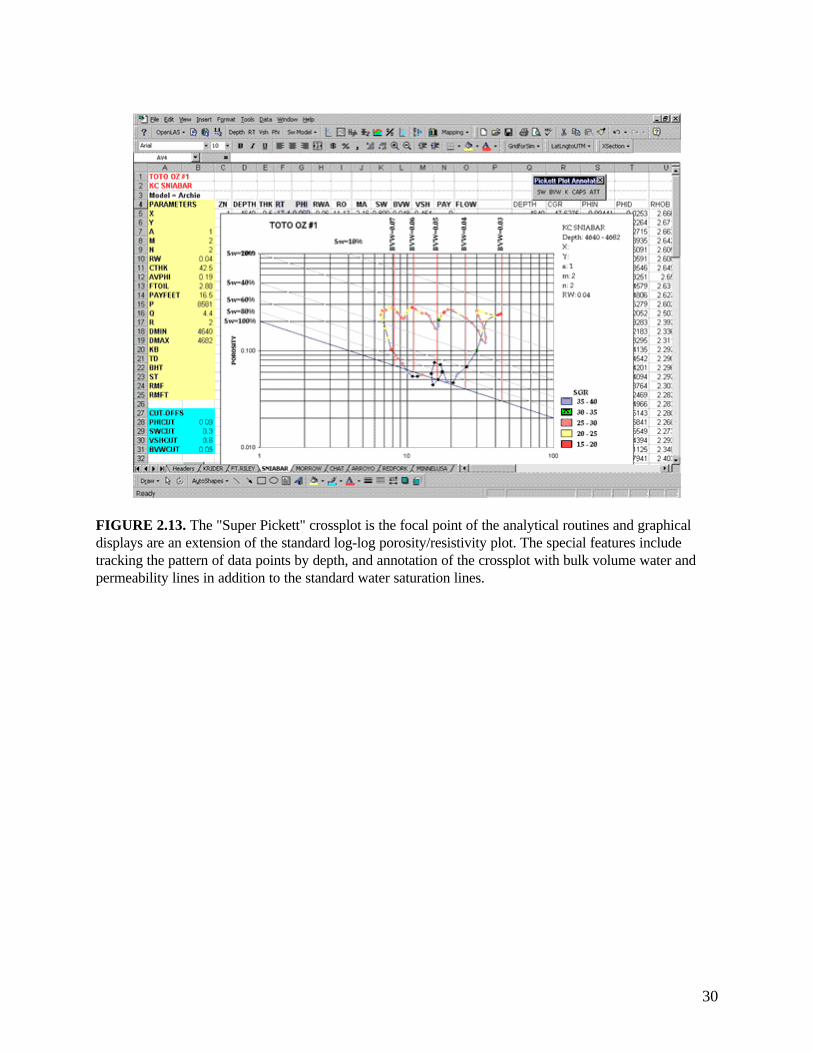
The minimum log data required by the spreadsheet-based software are a porosity and resistivitylog. Old logs are well suited to this analysis once they are digitized or simply typed into the spreadsheet.Toolbars and menus perform most operations through the utilization of nearly 8,000 lines of Visual Basiccode. PfEFFER v. 1 reads standard LAS log data files such as those obtained from a logging truck orpermits manual entry, organizes digital data by well and zone, and creates a "Super Pickett" crossplot,depth plots, and lithology solutions (if sufficient logs are available (Figure 2.13).
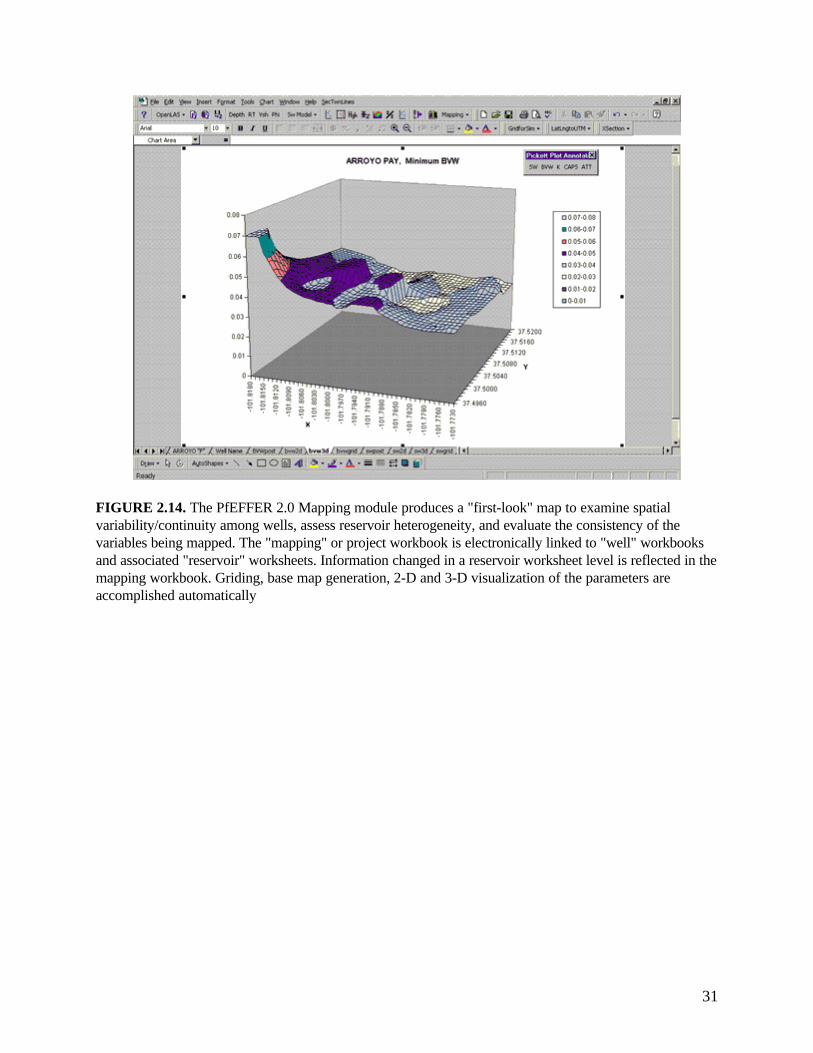
The software is focused on interpreting and analyzing reservoir pore type, permeability trends, andvariations in mineral composition. PfEFFER provides procedures for optimal estimation of bulk volumewater and water saturation (including irreducible values) to better evaluate potential production, reservoirquality, and heterogeneity. Also capillary pressure data can be incorporated to further calibrate well logdata with pore size or to assess depth to the free water level. The program will assemble zonal informationfrom well workbooks into a project workbook and can automatically generate map and 3-D visualizationsof key parameters as defined by the user. "Hot links" are maintained in the project workbook to each wellworkbook to aid in data management (Figure 2.14).
All of the standard EXCEL features continue to be available to users for independent analysis anddata exploration. The simplicity of hardware and software requirements means that PfEFFER is anattractive option for companies of all sizes. The range and versatility of module capabilities makes thempowerful tools for the analysis of both old log suites and the latest generation of logging measurements.
In addition to revising the appearance of the spreadsheet and refining the modules as describedabove, PfEFFER v. 2.0 contains new modules. The new features in PfEFFER v. 2.0 are:
1) Vshale (shale proportion) can be calculated, based on either the gamma ray or the neutron anddensity porosity logs.
2) Porosity can be calculated using density, neutron, density/neutron, or sonic with and withoutcorrection for shale volume.
3) Shaly sand models are available for Sw calculation. Sw model menu permit selection of Archiewater saturation model (the default) and two shaly sand models, the Simandoux model and thedual-water model.
4) Hough Transform is included. The Hough transform is used for simultaneous solution of Archieequation constants and formation water resistivity.
5) Secondary porosity is calculated as the difference between the total porosity (from density orneutron porosity) minus sonic porosity.
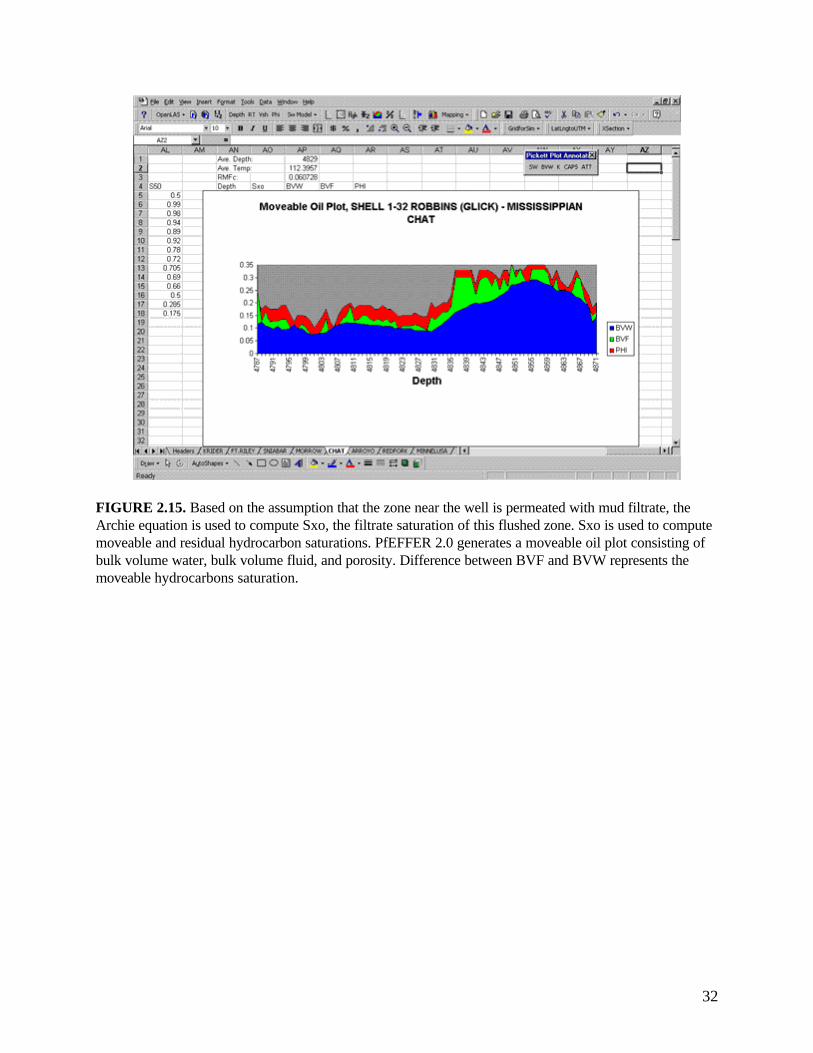
6) Moveable hydrocarbons can be determined (Figure 2.15). Based on the assumption that the zonenear the well is permeated with mud filtrate, the Archie equation is used to compute Sxo, thefiltrate saturation of this flushed zone. Sxo is used to compute moveable and residual hydrocarbonsaturations. PfEFFER generates a moveable oil plot consisting of bulk volume water, bulk volumefluid, and porosity. Difference between BVF and BVW represents the moveable hydrocarbonsaturation.

29
7) Lithological analysis now includes two options in PfEFFER v. 2.0, one based on the RHOMAA-UMAA plot and the other allowing a more general selection of logs and system components. Thegeneral option allows user to compute up to six components based on up to five logs. Any log canbe employed and the component selection is at the discretion of the user.
8) Depth-constrained multivariate cluster analysis can be employed to segment the entire spreadsheetinto subintervals based on user-specified set of logs. A hierarchical cluster (Ward's method) isused to produce subintervals that are as homogeneous as possible and distinct as possible fromeach other, in terms of their log characteristics. Option is useful in evaluating flow units and can beused as a blocking function.
9) Forward modeling module implements equations to predict values of rx, capillary pressure, andhydrocarbon column height for a range of water saturation values based on specific values ofpermeability and porosity.
10) Pay flag cuttoff can be activated to add color to cells of selected variables used to determine pay(porosity, BVW, Sw, and Vsh) and to color cells in the pay column according to pay and non-payintervals.
Three additional modules (add-ins) are available as PfEFFER Pro. These modules include color crosssection generation, map coordinate conversion (longitude-latitude to UTM x-y), and software to help buildan input file for a reservoir simulator based on the petrophysical characterization. DOE's freeware reservoirsimulation software, BOAST 3, was used in the development and testing.
30
FIGURE 2.13. The "Super Pickett" crossplot is the focal point of the analytical routines and graphicaldisplays are an extension of the standard log-log porosity/resistivity plot. The special features includetracking the pattern of data points by depth, and annotation of the crossplot with bulk volume water andpermeability lines in addition to the standard water saturation lines.
31
FIGURE 2.14. The PfEFFER 2.0 Mapping module produces a "first-look" map to examine spatialvariability/continuity among wells, assess reservoir heterogeneity, and evaluate the consistency of thevariables being mapped. The "mapping" or project workbook is electronically linked to "well" workbooksand associated "reservoir" worksheets. Information changed in a reservoir worksheet level is reflected in themapping workbook. Griding, base map generation, 2-D and 3-D visualization of the parameters areaccomplished automatically
32
FIGURE 2.15. Based on the assumption that the zone near the well is permeated with mud filtrate, theArchie equation is used to compute Sxo, the filtrate saturation of this flushed zone. Sxo is used to computemoveable and residual hydrocarbon saturations. PfEFFER 2.0 generates a moveable oil plot consisting ofbulk volume water, bulk volume fluid, and porosity. Difference between BVF and BVW represents themoveable hydrocarbons saturation.
33
2.6 Cost-Effective PC-based Reservoir Simulation and Management
Modified from: 1998, Gerlach, P, and S. Bhattacharya, T. R. Carr, Application of Cost-Effective PC-based Reservoir Simulation and Management - Schaben Field (Mississippian), Ness County, Kansas:1998 AAPG Meeting, Salt Lake City, Utah.
In today's competitive economic climate, cost-effective production technology is required by producers ofmarginal petroleum reservoirs to continue to survive and prosper. Field management based on reservoircharacterization and simulation studies can assist the producer in efficient exploitation of hydrocarbonreserves in marginal fields. In the past reservoir simulation and management was restricted to large oilcompanies and to producing fields considered "core assets". Today, PC-based reservoir simulation iseconomically and technically feasible for the small independent producer.
The objective of the Class 2 project was to characterize and simulate a typical oil field producingfrom a Mississippian reservoir by using tools that are modern and cost-effective for small independentproducers operating mature fields. General application of PC-based simulators such as BOAST3 to large-scale or full-field simulation has been restricted by hardware and software limitations. Recent advances inthe computational speed and memory capabilities have drastically reduced the simulation run time. Thedevelopment of powerful and “user-friendly” spreadsheet, relational database, girding and mappingsoftware have provided the front and back-end tools to efficiently assemble and manipulate simulationinput data and generate useful maps and charts.
Integrated reservoir characterization forms the foundation for the development of a descriptivereservoir model and provides the framework for simulation. The descriptive reservoir model integratedexisting and newly acquired well. Simulation input parameters were generated from the reservoir model andused to simulate the reservoir performance of the Schaben field from discovery to 1996. Analysis of thereservoir performance and the distribution of the remaining mobile oil in place led to the identification ofregions with potential for incremental oil recovery. The simulator was used to predict the performance ofpotential infill wells drilled in these areas. It is hoped that this study will provide a model for improvingfield management of similar reservoirs in Kansas and in the mid-continent.
Reservoir Model and Volumetric Calculations. Descriptive reservoir characterization entailedintegration and creative application of existing data and new data from three wells. New core and log dataprovided insight into fundamental reservoir parameters (e.g., core plug NMR analysis to determineeffective porosity). Integrated analyses of welllogs, core data and field mapping provided a betterunderstanding of the complexities of an extremely heterogeneity of the reservoir. Determination of pore andthroat size, irreducible water saturation, permeability, effective porosity, and movable oil are part of anintegrated reservoir characterization. The descriptive reservoir model developed for Schaben Field provideda major component of the input data for reservoir simulation. (Carr and others, 1996a, 1996b; Carr andothers, 1997; Guy and others, 1996)
Prior to the start of reservoir simulation, a volumetric study of the Schaben simulation study areawas completed on a grid-by-grid basis. The volumetric calculations were performed to check if the differentreservoir parameters such as effective porosity, net pay thickness, and water saturation in the effectiveporosity were able to support the observed historic production volumes. The resultant oil saturation valuesin the grid cells of the reservoir layer indicate the combination of reservoir parameters can with thehistorical production figures for the Schaben field.
BOAST 3 Simulation. The major premise of this simulation study was to enter eleven years ofhistorical data and have the simulator predict and match the next 23 years of known field production data.At the field level, a good match between simulated and observed was obtained for both oil and waterproduction rates during the 34 years encompassed by the historical and predictive periods (Figure 2.16).
A good match was also obtained for the simulated and observed cumulative oil and waterproduction for the field from 1963 to 1995. After matches were obtained within acceptable tolerances for

34
both oil and water at a field scale, attention was focused on the performance of the individual wells. Themismatch of water production in some of the wells may be due to inaccurate description of the reservoirproperties surrounding these wells. The vertical permeability in the reservoir and aquifer layers plays animportant role in controlling the water production at each well. Several simulation runs were carried outwith varied (decreased and increased) vertical permeabilities in the cells of the reservoir and aquifer layersurrounding wells with a poor history match. The results drastically improved the history match for waterproduction. This process of local adjustment of the vertical permeability is now being applied on a well bywell basis and should result in an acceptable individual well history match for the entire field.
Cost-Effective Reservoir Management. Oil saturation maps from simulation output at the end of1973 (field life of 10 years) show areas of low oil saturation (<40%) have developed around most wells.The poor areal sweep efficiency of the reservoir, due to its heterogeneity, is demonstrated by the areabetween wells which have high oil saturation (>60%). At the end of 1996 (field life of 33 years) thesimulation shows oil saturation around most wells to just above the irreducible oil saturation (between31%-35%). However, significant pockets of high oil saturation (>60%) are still left unswept in betweenthe drainage areas of surrounding wells.
The choice of location for infill (increased density) wells for efficient oil recovery in accordancewith a cost-effective reservoir management plan requires the consideration of current oil saturation and payheight in the reservoir layer. Due to the difficulty of producing oil from zones with low oil saturation(<40%) and thin pay height (<20 ft.), those areas of the field at low oil saturation and thin pay height canbe eliminated from consideration for infill drilling. Those areas of the field with the highest predicted infilldrilling potential can be identified with a saturation-feet map. All grid cells on the reservoir layer with anoil saturation less than 40% or with a net pay thickness less than 20 feet were set to zero. The oil saturationlayer and the pay height layer were then multiplied in a grid to grid operation to produce a saturation-feetmap showing those areas of the field with best infill potential.
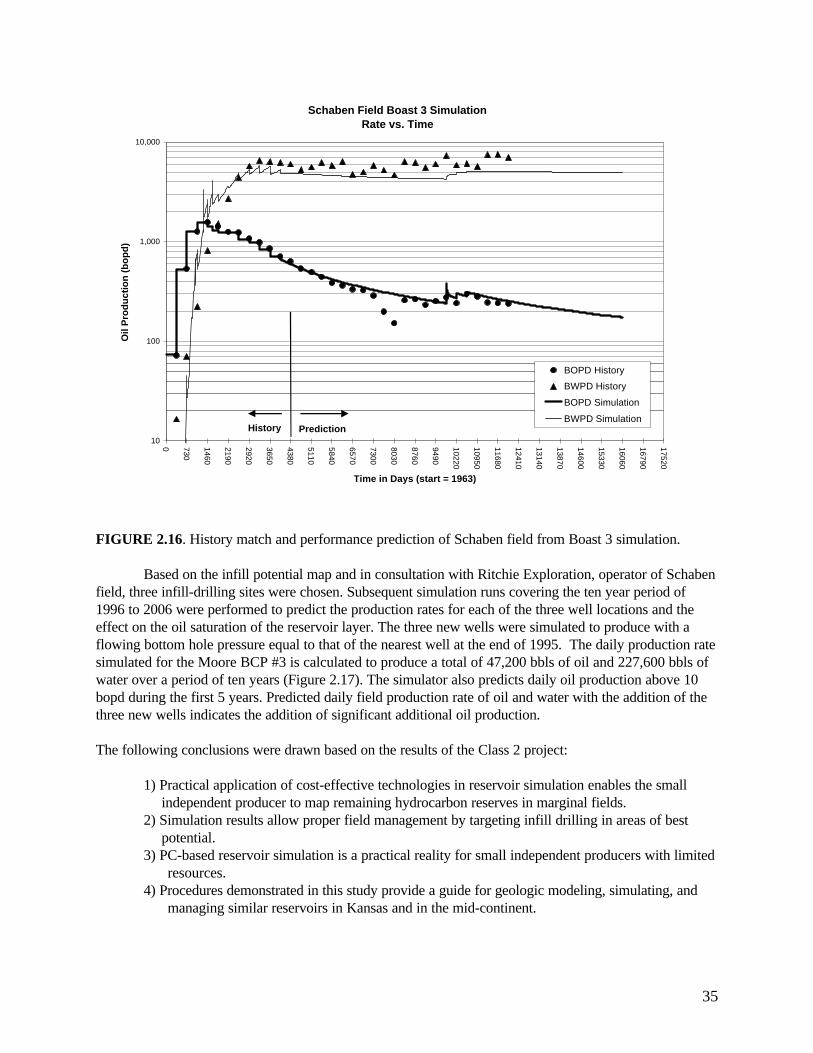
35
FIGURE 2.16. History match and performance prediction of Schaben field from Boast 3 simulation.
Based on the infill potential map and in consultation with Ritchie Exploration, operator of Schabenfield, three infill-drilling sites were chosen. Subsequent simulation runs covering the ten year period of1996 to 2006 were performed to predict the production rates for each of the three well locations and theeffect on the oil saturation of the reservoir layer. The three new wells were simulated to produce with aflowing bottom hole pressure equal to that of the nearest well at the end of 1995. The daily production ratesimulated for the Moore BCP #3 is calculated to produce a total of 47,200 bbls of oil and 227,600 bbls ofwater over a period of ten years (Figure 2.17). The simulator also predicts daily oil production above 10bopd during the first 5 years. Predicted daily field production rate of oil and water with the addition of thethree new wells indicates the addition of significant additional oil production.
The following conclusions were drawn based on the results of the Class 2 project:
1) Practical application of cost-effective technologies in reservoir simulation enables the smallindependent producer to map remaining hydrocarbon reserves in marginal fields.
2) Simulation results allow proper field management by targeting infill drilling in areas of bestpotential.
3) PC-based reservoir simulation is a practical reality for small independent producers with limitedresources.
4) Procedures demonstrated in this study provide a guide for geologic modeling, simulating, andmanaging similar reservoirs in Kansas and in the mid-continent.
Schaben Field Boast 3 SimulationRate vs. Time
10
100
1,000
10,000
0 730
1460
2190
2920
3650
4380
5110
5840
6570
7300
8030
8760
9490
10220
10950
11680
12410
13140
13870
14600
15330
16060
16790
17520
Time in Days (start = 1963)
Oil
Pro
du
ctio
n (
bo
pd
)
BOPD History
BWPD History
BOPD Simulation
BWPD SimulationHistory Prediction
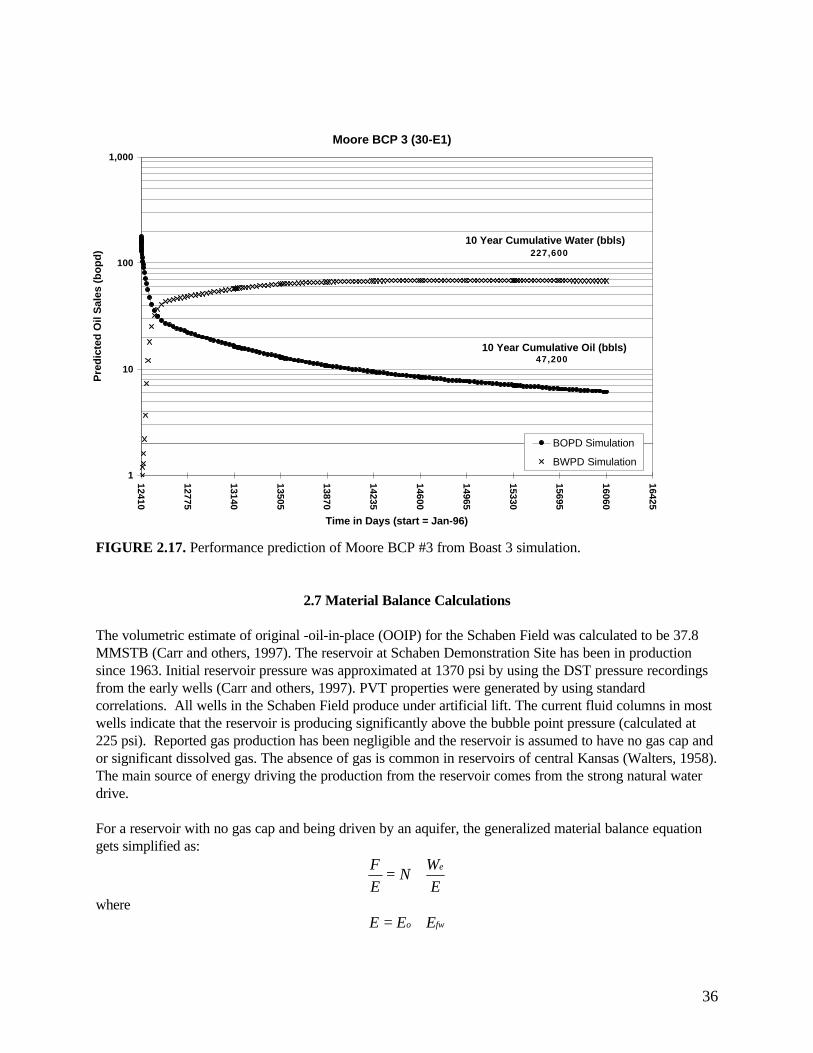
36
FIGURE 2.17. Performance prediction of Moore BCP #3 from Boast 3 simulation.
2.7 Material Balance Calculations
The volumetric estimate of original -oil-in-place (OOIP) for the Schaben Field was calculated to be 37.8MMSTB (Carr and others, 1997). The reservoir at Schaben Demonstration Site has been in productionsince 1963. Initial reservoir pressure was approximated at 1370 psi by using the DST pressure recordingsfrom the early wells (Carr and others, 1997). PVT properties were generated by using standardcorrelations. All wells in the Schaben Field produce under artificial lift. The current fluid columns in mostwells indicate that the reservoir is producing significantly above the bubble point pressure (calculated at225 psi). Reported gas production has been negligible and the reservoir is assumed to have no gas cap andor significant dissolved gas. The absence of gas is common in reservoirs of central Kansas (Walters, 1958).The main source of energy driving the production from the reservoir comes from the strong natural waterdrive.
For a reservoir with no gas cap and being driven by an aquifer, the generalized material balance equationgets simplified as:
E
WN
E
F e+=
wherefwo EEE +=
Moore BCP 3 (30-E1)
1
10
100
1,000
12410
12775
13140
13505
13870
14235
14600
14965
15330
15695
16060
16425
Time in Days (start = Jan-96)
Pre
dic
ted
Oil
Sal
es (
bo
pd
)
BOPD Simulation
BWPD Simulation
10 Year Cumulative Oil (bbls)
10 Year Cumulative Water (bbls)
47,200
227,600
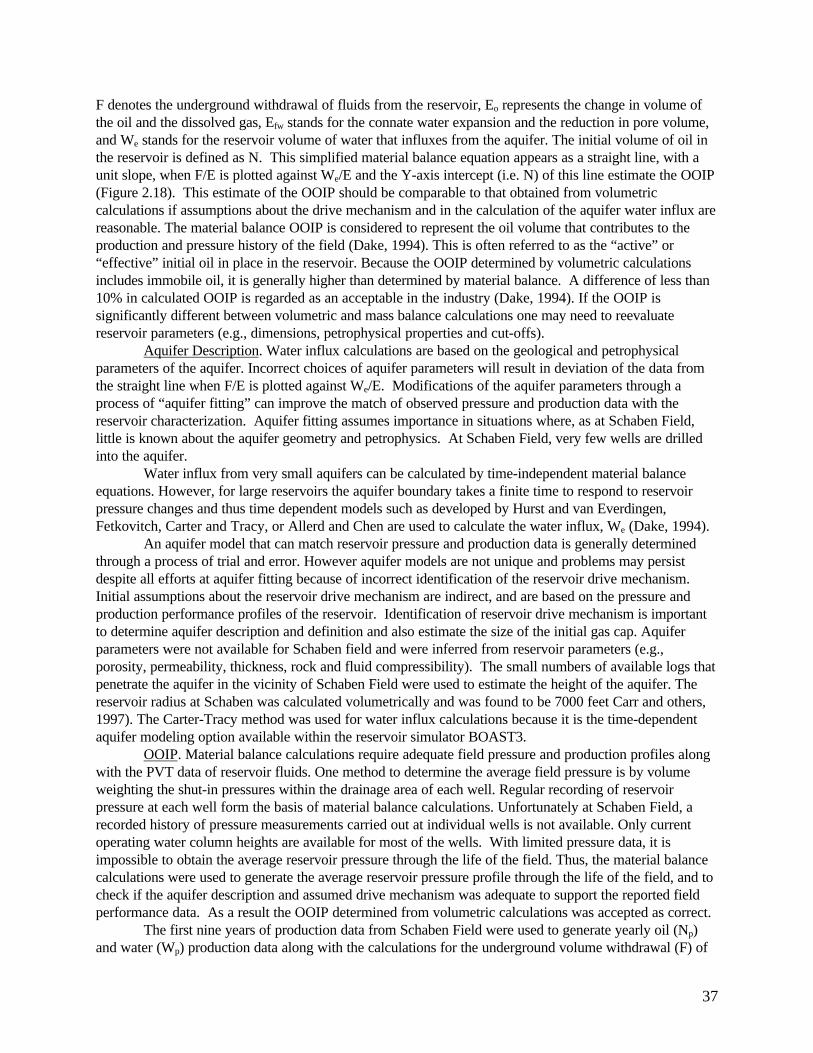
37
F denotes the underground withdrawal of fluids from the reservoir, Eo represents the change in volume ofthe oil and the dissolved gas, Efw stands for the connate water expansion and the reduction in pore volume,and We stands for the reservoir volume of water that influxes from the aquifer. The initial volume of oil inthe reservoir is defined as N. This simplified material balance equation appears as a straight line, with aunit slope, when F/E is plotted against We/E and the Y-axis intercept (i.e. N) of this line estimate the OOIP(Figure 2.18). This estimate of the OOIP should be comparable to that obtained from volumetriccalculations if assumptions about the drive mechanism and in the calculation of the aquifer water influx arereasonable. The material balance OOIP is considered to represent the oil volume that contributes to theproduction and pressure history of the field (Dake, 1994). This is often referred to as the “active” or“effective” initial oil in place in the reservoir. Because the OOIP determined by volumetric calculationsincludes immobile oil, it is generally higher than determined by material balance. A difference of less than10% in calculated OOIP is regarded as an acceptable in the industry (Dake, 1994). If the OOIP issignificantly different between volumetric and mass balance calculations one may need to reevaluatereservoir parameters (e.g., dimensions, petrophysical properties and cut-offs).
Aquifer Description. Water influx calculations are based on the geological and petrophysicalparameters of the aquifer. Incorrect choices of aquifer parameters will result in deviation of the data fromthe straight line when F/E is plotted against We/E. Modifications of the aquifer parameters through aprocess of “aquifer fitting” can improve the match of observed pressure and production data with thereservoir characterization. Aquifer fitting assumes importance in situations where, as at Schaben Field,little is known about the aquifer geometry and petrophysics. At Schaben Field, very few wells are drilledinto the aquifer.
Water influx from very small aquifers can be calculated by time-independent material balanceequations. However, for large reservoirs the aquifer boundary takes a finite time to respond to reservoirpressure changes and thus time dependent models such as developed by Hurst and van Everdingen,Fetkovitch, Carter and Tracy, or Allerd and Chen are used to calculate the water influx, We (Dake, 1994).
An aquifer model that can match reservoir pressure and production data is generally determinedthrough a process of trial and error. However aquifer models are not unique and problems may persistdespite all efforts at aquifer fitting because of incorrect identification of the reservoir drive mechanism.Initial assumptions about the reservoir drive mechanism are indirect, and are based on the pressure andproduction performance profiles of the reservoir. Identification of reservoir drive mechanism is importantto determine aquifer description and definition and also estimate the size of the initial gas cap. Aquiferparameters were not available for Schaben field and were inferred from reservoir parameters (e.g.,porosity, permeability, thickness, rock and fluid compressibility). The small numbers of available logs thatpenetrate the aquifer in the vicinity of Schaben Field were used to estimate the height of the aquifer. Thereservoir radius at Schaben was calculated volumetrically and was found to be 7000 feet Carr and others,1997). The Carter-Tracy method was used for water influx calculations because it is the time-dependentaquifer modeling option available within the reservoir simulator BOAST3.
OOIP. Material balance calculations require adequate field pressure and production profiles alongwith the PVT data of reservoir fluids. One method to determine the average field pressure is by volumeweighting the shut-in pressures within the drainage area of each well. Regular recording of reservoirpressure at each well form the basis of material balance calculations. Unfortunately at Schaben Field, arecorded history of pressure measurements carried out at individual wells is not available. Only currentoperating water column heights are available for most of the wells. With limited pressure data, it isimpossible to obtain the average reservoir pressure through the life of the field. Thus, the material balancecalculations were used to generate the average reservoir pressure profile through the life of the field, and tocheck if the aquifer description and assumed drive mechanism was adequate to support the reported fieldperformance data. As a result the OOIP determined from volumetric calculations was accepted as correct.
The first nine years of production data from Schaben Field were used to generate yearly oil (Np)and water (Wp) production data along with the calculations for the underground volume withdrawal (F) of

38
fluids. The Carter-Tracy formulation was used to calculate the water influx (We) from an infinite aquifer.Initial aquifer parameters were varied within geologic and engineering limits. The resulting plot betweenF/E versus We/E showed a straight line with unit slope and an intercept showing an OOIP value that islower but within 10% volumetric OOIP (Figure 2.18). The average reservoir pressure (for the first 9years) as a result of this match is plotted as the “base case” profile (Figure 2.19).
Sensitivity calculations were carried out by varying aquifer and reservoir parameters (e.g., aquiferheight, reservoir radius, aquifer permeability, and aquifer porosity). In each case, the value of only one ofthe above parameters was changed. In each case the average reservoir pressure profile was generated, sothat the resultant F/E versus We/E plot was a straight line with unit slope and its intercept read an OOIPvalue that was within acceptable tolerances. The plotted pressure profiles show the effects of varyingdifferent aquifer and reservoir parameters (Figure 2.19). Available fluid level data from the SchabenDemonstration Area indicate that the majority of the wells are currently producing against a backpressureof 400 to 1100 psi. The “Best case” scenario, incorporating knowledge of Schaben Field performance(e.g., strong water drive and a significant backpressure), was modified over a period of 34 years. Due tothe rapid development of the field during the first 9 years, the average reservoir pressure profile shows arapid decline from 1370 psi to 1000 psi (Figure 2.20). Subsequently, reservoir pressure stabilized near1000 psi for the next 14 years and then gradually declined to 880 psi over the next 11 years. The plot ofF/E versus We/E for the “best case” scenario remains a straight line with unit slope and the OOIP value atthe intercept is within acceptable tolerances (Figure 2.21).
Summary.--The material balance study at the Schaben Demonstration Site confirms that thevolumetric description of the reservoir-aquifer system together with the natural water drive mechanism iscapable of supporting the reported fluid production history of the field. A process of “aquifer-fitting” wasused to fine tune selected aquifer parameters (e.g., height, porosity, permeability, and effectivecompressibility). In addition a better understanding of the radius of the reservoir at Schaben was obtained.
As typical of older fields in the mid-continent the average reservoir pressure profile for the Schabenfield is not available and the mass balance calculations can not be used to validate of the volumetricdescription of the reservoir. As a consequence the volumetric OOIP is assumed correct and used tocalculate an average reservoir pressure profile. The reservoir pressure profile controls the PVT propertiesof the reservoir fluids and hence the mobility ratios operating during the production life of the field.Changes in average reservoir pressure are indicative of the amount of change occurring in the fluidviscosities. The material balance calculations were used to check the consistency among different aspects ofreservoir description. These calculations tie together the geologic reservoir characterization of the reservoir,the PVT data, production data and available pressure data. The material balance calculations were used toconfirm the reservoir drive mechanism and aquifer parameters. The results of the material balancecalculations confirm the initial reservoir characterization and refine important input parameters that can beused to revise the full-field reservoir simulation.
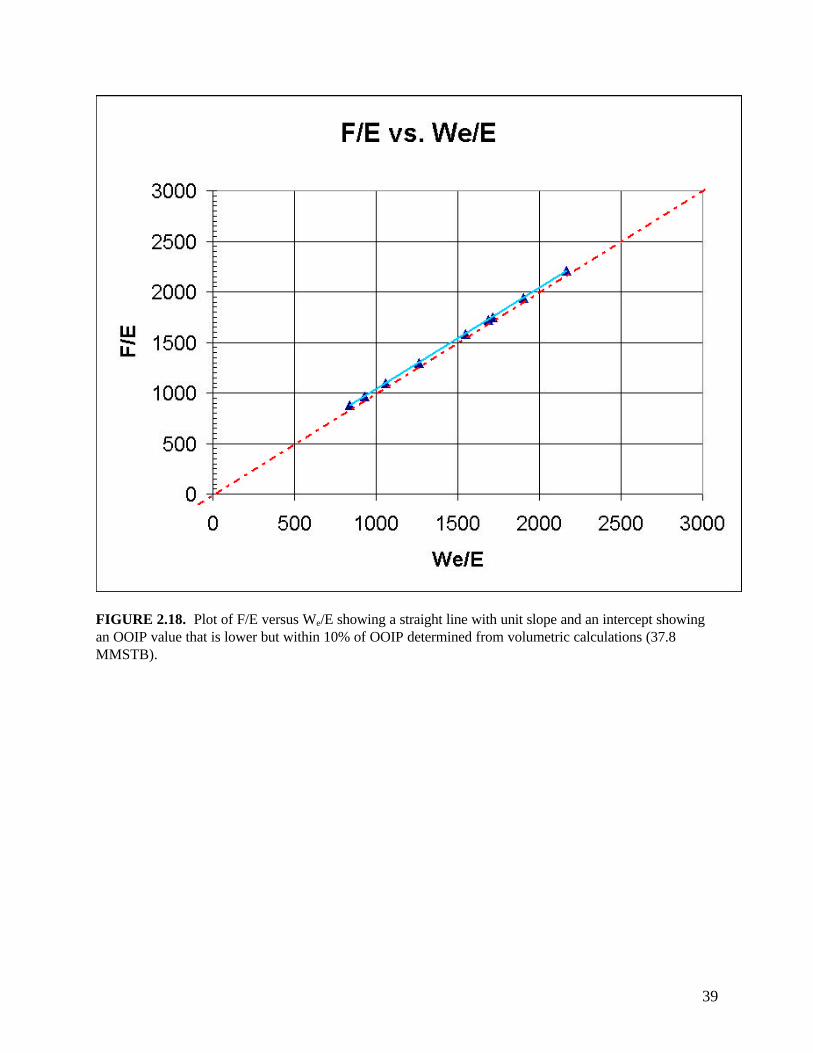
39
FIGURE 2.18. Plot of F/E versus We/E showing a straight line with unit slope and an intercept showingan OOIP value that is lower but within 10% of OOIP determined from volumetric calculations (37.8MMSTB).
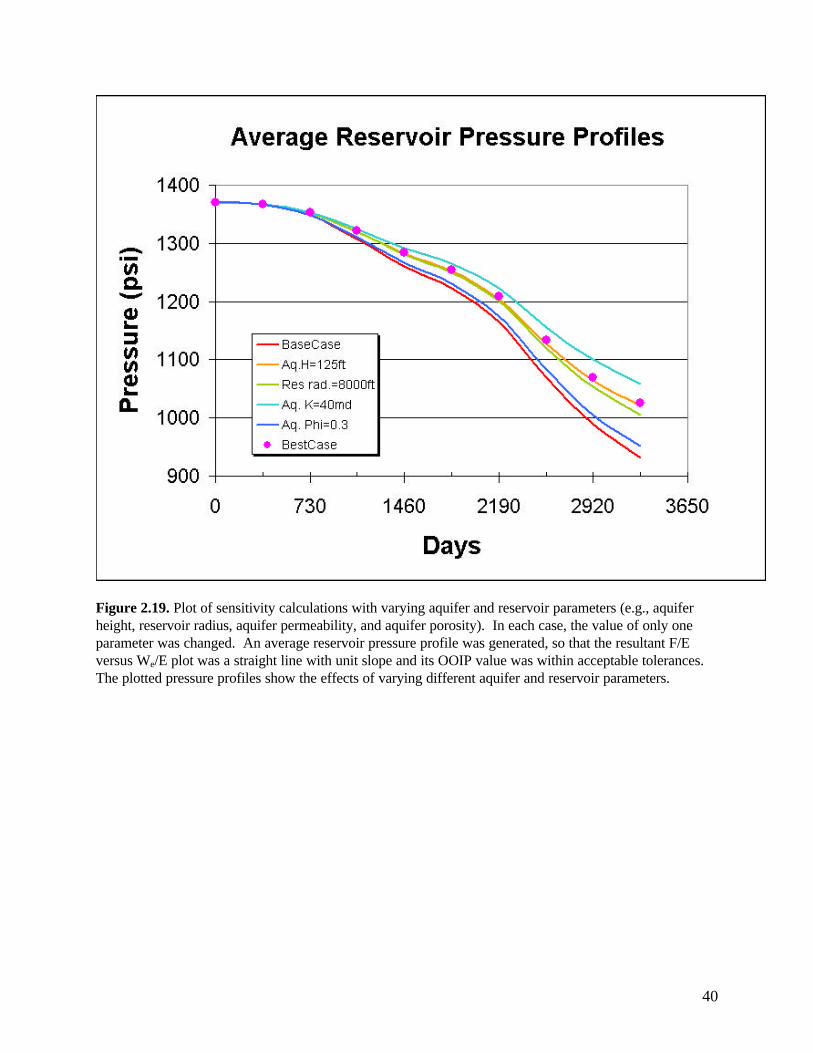
40
Figure 2.19. Plot of sensitivity calculations with varying aquifer and reservoir parameters (e.g., aquiferheight, reservoir radius, aquifer permeability, and aquifer porosity). In each case, the value of only oneparameter was changed. An average reservoir pressure profile was generated, so that the resultant F/Eversus We/E plot was a straight line with unit slope and its OOIP value was within acceptable tolerances.The plotted pressure profiles show the effects of varying different aquifer and reservoir parameters.
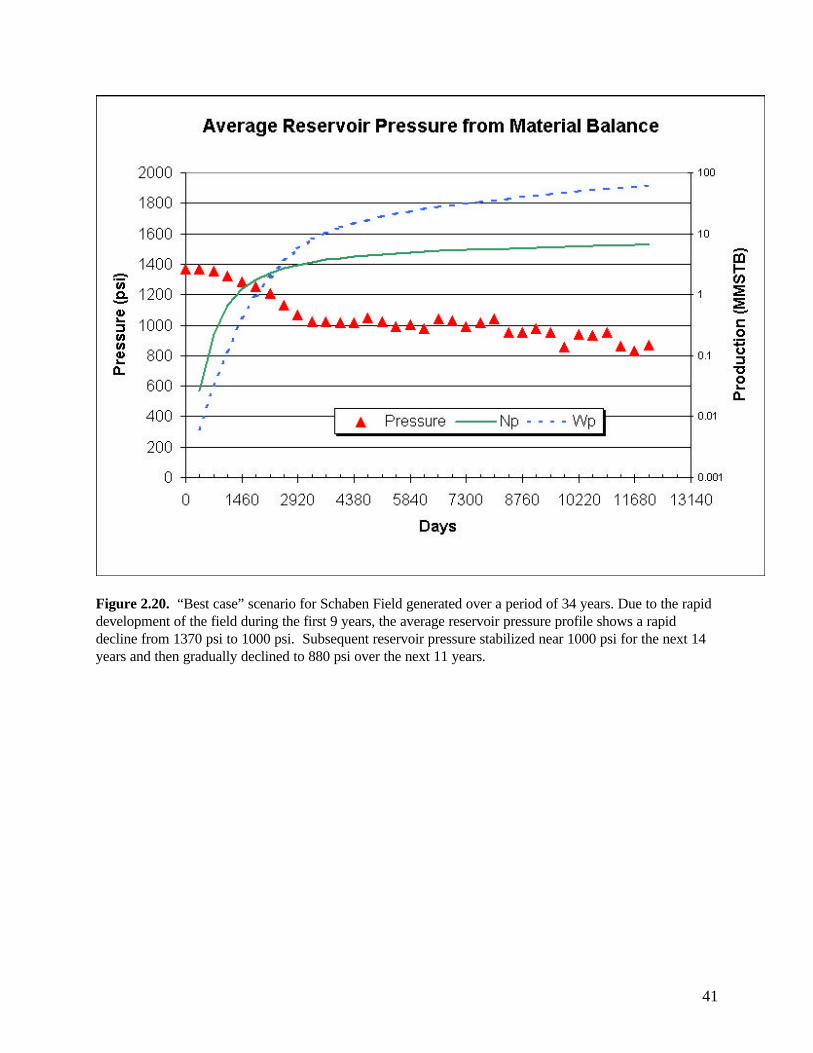
41
Figure 2.20. “Best case” scenario for Schaben Field generated over a period of 34 years. Due to the rapiddevelopment of the field during the first 9 years, the average reservoir pressure profile shows a rapiddecline from 1370 psi to 1000 psi. Subsequent reservoir pressure stabilized near 1000 psi for the next 14years and then gradually declined to 880 psi over the next 11 years.
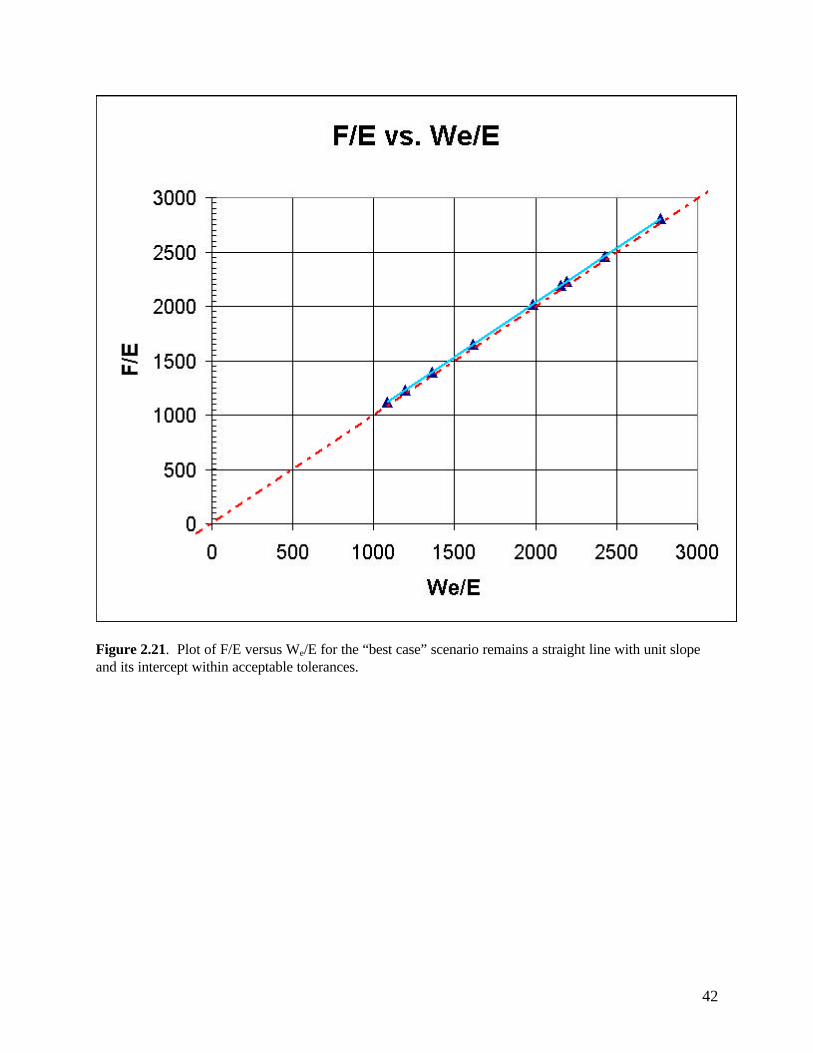
42
Figure 2.21. Plot of F/E versus We/E for the “best case” scenario remains a straight line with unit slopeand its intercept within acceptable tolerances.

43
3.0 TECHNOLOGY TRANSFER ACTIVITIES
Technology transfer is an ongoing process that includes access to information through theInternet, almost daily inquires from operators and formal presentations. The data, results andtechnology developed as part of the project have been presented at numerous technical meetingsand published in technical papers in local, regional and national publications (Appendix A).
PfEFFER, a software package using a widely available spreadsheet, continues to beimproved, tested and demonstrated as part of the Class 2 project. PfEFFER Version 2.0/Pro wasreleased in February 1998. PfEFFER Version 2.0/Pro is a popular and cost-effective tool for theindependent oil and gas operator. Hands-on demonstrations and workshops focusing onPfEFFER were presented for the Michigan Oil and Gas Association (Mt. Pleasant, Michigan,February 19) at National Petroleum Technology Office (Tulsa, Oklahoma, February 24), at theSIPES National Meeting (Wichita, Kansas, March 3) and in Odessa Texas (Invitation of PhillipsPetroleum Company, March 3-4). Also four hours of hands-on demonstrations and presentationsusing PfEFFER were presented at the North Midcontinent PTTC workshop in (Wichita, Kansas,November 19). The PTTC short course involved well log analysis techniques with an emphasison modern logging technologies applicable to Kansas. Many of these new techniques were adirect development of the Class2 project.
The results of the evaluation of horizontal drilling technology in the Mississippianreservoirs of Kansas was presented at the North Midcontinent PTTC Horizontal DrillingWorkshop (June 16, Wichita Kansas). This presentation emphasized cost-effective strategies forindependents in selection of reservoir targets for horizontal drilling. The presentation has beeninvited and accepted for an AAPG Hedberg Conference entitled " International Horizontal WellSymposium: Focus on the Reservoir" (October 10-13, The Woodlands, Texas). Additionalinformation on the conference and an online extended abstract (Gerlach and others, submitted)are available at http://www.kgs.ukans.edu/PRS/AAPG/horizon.html).
A presentation at the Tertiary Oil Recovery Project Oil Recovery Conference in (Wichita,KS, March 17-18) focused on application of a commercial simulator and the role of fractureporosity to a portion of the Schaben Field. Additional presentations are planned for the USDOEOil and Gas Conference (Dallas, TX, June 29, 30), and at the joint meeting of the MidcontinentAAPG and Kansas Independent Oil and Gas Association (Wichita, KS, August 29-31). A paperhas been accepted for the proceedings of a research conference on advanced reservoircharacterization (Gulf Coast Section SEPM Nineteenth Annual Research Conference, December5-8, Houston, Texas; Bhattacharya and others, accepted). Three extended abstracts covering avariety of topics were prepared for the 1998 AAPG Annual Meeting in Salt Lake City Utah(Franseen and others 1998; Guy and others, 1998 and Gerlach and others, 1998). We haveworked to assure that the presentations provided complementary information and had similarformats. A manuscript covering the approach to geologic/engineering developed as part of theClass 2 project was completed (Watney and others, in press).
All data and results of the Schaben project are being added to a world-wide-web server.The Internet protocol provides independent operators with on-line access to digital information,digital databases, results of the field study, related regional geologic and production data, andpurposeful transfer of technology. Access is through the Class 2 page(http://www.kgs.ukans.edu/Class2/index.html), and through the Schaben Field Page (Figure 2.22)of the Kansas Digital Petroleum Atlas (http://www.kgs.ukans.edu/DPA/dpaHome.html).
We continue to work on a daily basis with a number of Kansas’s operators on applicationof the technologies developed as part of the Class 2 project.
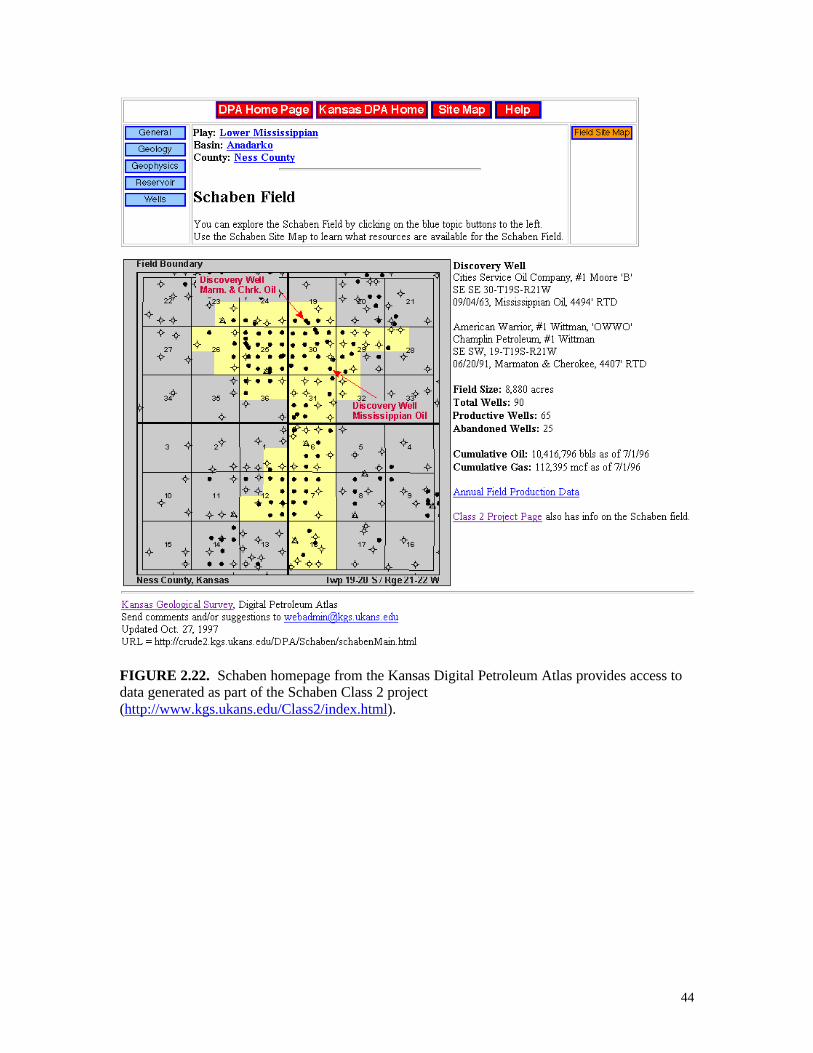
44
FIGURE 2.22. Schaben homepage from the Kansas Digital Petroleum Atlas provides access todata generated as part of the Schaben Class 2 project(http://www.kgs.ukans.edu/Class2/index.html).

45
4.0 PROBLEMS ENCOUNTERED
The historically low oil prices of late 1998 and early 1999 have affected continued operationsthroughout Kansas including the Schaben Demonstration Area. However, the project hasdemonstrated the value of cost-effective technology and will be applied when oil prices justifyresuming development activity. The project is well within budget and cost sharing is in excess of50%.
5.0 RECOMMENDATIONS FOR REMAINDER OF BUDGET PERIOD 2
Tasks for Budget Period 2 as outlined in the original Continuation Proposal remain unchanged.Plans for the remainder of the Project, which concludes on July 30, 1999 include:
1) Develop Improved Boast 3 model that incorporates a refined reservoir description.The reservoir will be divided into two units M1 and M0 that better reflect the knownreservoir geology.
2) Develop an online tutorial for using BOAST 3 at the full-field scale that usescommonly available spreadsheets as pre and post-processors.
3) Complete a full-field simulation using a commercial simulator (e.g., VIP).4) Continue technology transfer activities (e.g., the Midcontinent AAPG and Kansas
Independent Oil and Gas Association).5) Complete manuscript entitled “Significance of Depositional and Early Diagenetic
Controls on Architecture of a Karstic-Overprinted Mississippian (Osagian) Reservoirin Kansas” for AAPG Bulletin.
6) Develop an digital online petrophysical atlas that includes Mississippian reservoirs7) Complete Final Report.
46
6.0 REFERENCES CITED
Bhattacharya, S., Watney, W.L., Guy, W., and Gerlach, P., accepted, Nineteenth AnnualResearch Conference, Advanced Reservoir Characterization for the Twenty-First Century,Gulf Coast Section SEPM Foundation. (Meeting December 5-8, 1999).
Carr, T. R., D. Beene, and D. R. Collins, 1995a, Kansas Oil and Gas Production Trends: KansasGeological Survey Open File Report 95-42, 8p.
Carr, T. R., Hopkins, J. H., Feldman, H. R., Feltz, A., Doveton J. H., and D. Collins, D. R.,1995b, Color 2-D and 3-D Pseudo-Seismic Transforms of Wireline Logs: A SeismicApproach To Petrophysical Sequence Stratigraphy; Landmark Computer Graphics UserNet,6p.
Carr, T. R., W. R. Guy, E. K. Franseen, and S. Bhattacharya, 1996a, Enhanced Carbonatereservoir model for an old reservoir utilizing new techniques: The Schaben Field(Mississippian), Ness County, Kansas; American Association of Petroleum Geologists,Annual Meeting Abstracts, p. A23-A24.
Carr, T. R., W. R. Guy, E. K. Franseen, and S. Bhattacharya, 1996b, Enhanced Carbonatereservoir model for an old reservoir utilizing new techniques: The Schaben Field(Mississippian), Ness County, Kansas: Kansas Geological Survey Open-File Report 96-30.
Carr, Timothy R., G. Paul Willhite, Dana Adkins-Heljeson, Scott Beaty, Saibal Bhattacharya,Evan Franseen, Paul Gerlach, Willard Guy, John Hopkins, W. Lynn Watney, RodneyReynolds, Shapour Vossoughi, and G. Paul Willhite, 1997a, Improved Oil Recovery inMississippian Carbonate Reservoirs of Kansas -- Near Term -- Class 2, USDOE AnnualReport DOE/BC/14987-10, 168p. (Available online athttp://www.kgs.ukans.edu/PRS/Info/webPubs97-24.html).
Carr, Timothy R., G. Paul Willhite, Dana Adkins-Heljeson, Scott Beaty, Saibal Bhattacharya,Evan Franseen, Paul Gerlach, Willard Guy, John Hopkins, W. Lynn Watney, RodneyReynolds, Shapour Vossoughi, and G. Paul Willhite, 1997b, Improved Oil Recovery inMississippian Carbonate Reservoirs of Kansas: Kansas Geological Survey Open-File Report97-38.
Doveton, J. H., Guy, W., Watney, W. L., Bohling, G. C., Ullah, S., and Atkins-Heljeson, D.,1995, PfEFFER 1.0 Manual, Kansas Geological Survey Open File Report 95-86.
Doveton, J.H., Guy, W.J., Watney, W. L., Bohling, G.C., Ullah, S., and Adkins-Heljeson, D.,1996, Log analysis of petrofacies and flow-units with microcomputer spreadsheet software:1995 AAPG Mid-Continent Meeting.Transactions, p.224-233.
Doveton, 1994, Geologic Log Analysis Using Computer Methods, A. A. P. G. ComputerApplications in Geology 2, 169p.
Dake, L. P., 1994, Practice of Reservoir Engineering: Elsevier, 534p.Goebel, E. D., and Merriam, D. F., 1957, Trend players look to western Kansas Cherokee; Oil
and Gas Journal, v. 55, p. 126-135.Franseen, E.K., Carr, T.R., Guy, W.J., and Beaty, S.D., 1998, Significance of Depositional and
Early Diagenetic Controls on Architecture of a Karstic-Overprinted Mississippian (Osagian)Reservoir, Schaben Field, Ness County, Kansas: 1998 AAPG Meeting, Salt Lake City, Utah,4 p.
Guy, W. R., J. H. Doveton, W. L. Watney, T. R. Carr, and S. Bhattacharya, 1996, Reservoircharacterization utilizing a low cost resistivity-porosity crossplot and an interactivespreadsheet; American Association of Petroleum Geologists, Annual Meeting Abstracts, p.A58.
Guy, W.J., Byrnes, A.P., Doveton, J.H., and Franseen, E.K., 1998, Influence of Lithology andPore Geometry on NMR Prediction of Permeability and Effective Porosity in MississippianCarbonates, Kansas: 1998 AAPG Meeting, Salt Lake City, Utah, 5p.

47
Gerlach, P, and S. Bhattacharya, T. R. Carr, 1998, Application of Cost-Effective PC-basedReservoir Simulation and Management - Schaben Field (Mississippian), Ness County,Kansas: 1998 AAPG Meeting, Salt Lake City, Utah, 4p.
Gerlach, P. M., S. Bhattacharya, T.R. Carr, W. J. Guy, S. C. Beaty, and E.K. Franseen, in press,PC based reservoir characterization and simulation of the Schaben Field, Ness County,Kansas: Proceedings of Midcontinent Platform Carbonates, Oklahoma Geological SurveySpecial Publication.
Gerlach, P. M., S. Bhattacharya, T.R. Carr, in press, Cost Effective Techniques for theIndependent Producer to Evaluate Horizontal Drilling Candidates in Mature Areas: AAPGHedberg Conference, International Horizontal Well Symposium: Focus on the Reservoir,(October 10-13, 1999, The Woodlands, Texas),http://www.kgs.ukans.edu/PRS/AAPG/papers/gerlach.html .
Walters, R. F., 1958, Differential entrapment of oil and gas in Arbuckle dolomite of central Kansas: AAPG Bulletin, 42, p. 2133-2173.Watney, W. L. and Bohling, G., 1998, PfEFFER Demo, in Mark, Sandra, compiler, PTTC’s Petroleum E&P Software Sampler, CD-ROM v. 1.0, PTTC, Washington.Watney, W.L., W.J. Guy, J.H. Doveton, S. Bhattacharya, P. M. Gerlach, G. C. Bohling, T. R.
Carr, in press, Petrofacies Analysis - A petrophysical tool for geologic/engineering reservoircharacterization: Proceedings of the Fourth International Reservoir Characterization TechnicalConference, Studies in Geology, American Association of Petroleum Geologists.
48
7.0 APPENDIX LIST OF PUBLICATIONS
A list of publications that are a result of the Class 2 Demonstration Project.
Bhattacharya, S, and P. M. Gerlach, 1997, Carbonate Reservoir characterization and fieldsimulation using boast 3: The Schaben Field (Mississippian), Ness County , Kansas;Proceedings Twelfth Tertiary Oil Recovery Conference, Wichita, Kansas (March 19-20),p.39-58.
Bhattacharya, S., Watney, W.L., Guy, W., and Gerlach, P., accepted, Nineteenth AnnualResearch Conference, Advanced Reservoir Characterization for the Twenty-First Century,Gulf Coast Section SEPM Foundation. (Meeting December 5-8, 1999).
Carr, T. R., 1996, Improved oil recovery in Mississippian carbonate reservoirs of Kansas; USDepartment of Energy and BDM Oklahoma Workshop “Improving Production in ShallowCarbonate Reservoirs”, p. G1-G46.
Carr, T. R., 1996, Technology transfer for the independent; Society of Independent ProfessionalEarth Scientists National Convention Abstracts, p. 10. Invited Talk/Panel Discussion atSociety of Independent Petroleum Earth Scientists (SIPES) National Convention, March 20 --23, Dallas, TX.
Carr, T. R., J. Hopkins, H. Feldman, A. Feltz, J. Doveton, and D. Collins, 1994, Color ImageTransforms of Wireline Logs: A Seismic Approach to Petrophysical Sequence Stratigraphy,Landmark Worldwide Technology Symposium, p. 36. Invited Talk at Landmark WorldwideTechnology Forum, November, 29 - December 1, 1994, Houston, Texas.
Carr, T. R., Hopkins, J. H., Feldman, H. R., Feltz, A., Doveton J. H., and D. Collins, D. R., 1995,Color 2-D and 3-D Pseudo-Seismic Transforms of Wireline Logs: A Seismic Approach ToPetrophysical Sequence Stratigraphy; Landmark Computer Graphics UserNet, 6p.
Carr, T. R., Adkins-Heljeson, D.M., Beaty, S.D., Bhattacharya, S., Franseen, E.K., Gerlach, P.M.,Guy, W.J. and Watney, W.L., 1996, Improved Oil Recovery in Mississippian CarbonateReservoirs of Kansas-Near Term-Class 2: Annual Report: Kansas Geological Survey OpenFile Report 96-7, 55 p.
Carr, T. R., D. Adkins-Heljeson, R. C. Buchanan, T. D. Mettille, 1996, The impact of the Interneton the public sector: Providing natural resource information and technology to Kansas:Geological Society of America, Annual Meeting, Abstracts with Programs, p. 285.http://www.geosociety.org/cgi-bin/config/doc.pl?annual/s/abs/50119.htm~1139205.
Carr, T. R., D. W. Green, and G. P. Willhite, Improved oil recovery in Mississippian carbonatereservoirs of Kansas -- Near term -- Class 2, Annual Report DOE/BC/14987-5(DE96001245), USDOE Office of Scientific and Technical Information, 50p.
Carr, T. R., W. R. Guy, E. K. Franseen, and S. Bhattacharya, 1996, Enhanced Carbonate reservoirmodel for an old reservoir utilizing new techniques: The Schaben Field (Mississippian), NessCounty, Kansas; American Association of Petroleum Geologists, Annual Meeting Abstracts,p. A23-A24.
Carr, T. R., H. R. Feldman, W. J. Guy, 1996, A new look at the reservoir geology of theMississippian Schaben Field, Ness County, Kansas; Oklahoma Geological Survey Workshopon “Platform Carbonates in the Southern Midcontinent” Abstracts, p. 8.
Carr, T. R., 1996, New Techniques for Sequence Stratigraphic Analysis Using Wireline Logs.Invited Talk, at San Joaquin Geological Society, December 3, 1996.
Carr, Timothy R., G. Paul Willhite, Dana Adkins-Heljeson, Scott Beaty, Saibal Bhattacharya,Evan Franseen, Paul Gerlach, Willard Guy, John Hopkins, W. Lynn Watney, RodneyReynolds, Shapour Vossoughi, and G. Paul Willhite, 1997a, Improved Oil Recovery inMississippian Carbonate Reservoirs of Kansas -- Near Term -- Class 2, USDOE AnnualReport DOE/BC/14987-10, 168p. (Available online athttp://www.kgs.ukans.edu/PRS/Info/webPubs97-24.html).
49
Carr, Timothy R., G. Paul Willhite, Dana Adkins-Heljeson, Scott Beaty, Saibal Bhattacharya,Evan Franseen, Paul Gerlach, Willard Guy, John Hopkins, W. Lynn Watney, RodneyReynolds, Shapour Vossoughi, and G. Paul Willhite, 1997b, Improved Oil Recovery inMississippian Carbonate Reservoirs of Kansas: Kansas Geological Survey Open-File Report97-38.
Doveton, J. H., Guy, W., Watney, W. L., Bohling, G. C., Ullah, S., and Atkins-Heljeson, D.,1995, PfEFFER 1.0 Manual, Kansas Geological Survey Open File Report 95-86.
Doveton, J.H., Guy, W.J., Watney, W. L., Bohling, G.C., Ullah, S., and Adkins-Heljeson, D.,1996, Log analysis of petrofacies and flow-units with microcomputer spreadsheet software:1995 AAPG Mid-Continent Meeting.Transactions, p.224-233.
Franseen, E.K., 1996, Depositional Facies and Diagenetic Characteristics of Mississippian(Osagian) Strata from the Schaben Field, Ness County, Kansas: Kansas Geological SurveyOpen File Report 96-48, 43p.
Franseen, E. K., 1999, Significance of Depositional and Early Diagenetic Controls onArchitecture of a Karstic-Overprinted Mississippian (Osagian) Reservoir, Schaben Field,Ness County; Abstract of presentation to the Kansas Geological Society, Wichita, KS,February 16.
Franseen, E.K., Carr, T.R., Guy, W.J., and Beaty, S.D., 1998, Significance of Depositional andEarly Diagenetic Controls on Architecture of a Karstic-Overprinted Mississippian (Osagian)Reservoir, Schaben Field, Ness County, Kansas: 1998 AAPG Meeting, Salt Lake City, Utah,4 p.
Guy, W. R., J. H. Doveton, W. L. Watney, T. R. Carr, and S. Bhattacharya, 1996, Reservoircharacterization utilizing a low cost resistivity-porosity crossplot and an interactivespreadsheet; American Association of Petroleum Geologists, Annual Meeting Abstracts, p.A58.
Guy, W. J., T. R. Carr, E. K. Franseen, S. Bhattacharya, and S. Beaty, 1997, Combination ofmagnetic resonance and classic petrophysical techniques to determine pore geometry andcharacterization of a complex heterogeneous carbonate reservoir: American Association ofPetroleum Geologists Annual Meeting Abstracts, Dallas.
Guy, W.J., Byrnes, A.P., Doveton, J.H., and Franseen, E.K., 1998, Influence of Lithology andPore Geometry on NMR Prediction of Permeability and Effective Porosity in MississippianCarbonates, Kansas: 1998 AAPG Meeting, Salt Lake City, Utah, 5p.
Gerlach, P, and S. Bhattacharya, 1997, Simulation of primary and alternate locations for fiveinfill wells, Schaben Field, Ness County, Kansas: Kansas Geological Survey Open FileReport 97-46.
Gerlach, P, and S. Bhattacharya, T. R. Carr, 1998, Application of Cost-Effective PC-basedReservoir Simulation and Management - Schaben Field (Mississippian), Ness County,Kansas: 1998 AAPG Meeting, Salt Lake City, Utah, 4p.
Gerlach, P. M., S. Bhattacharya, T.R. Carr, W. J. Guy, S. C. Beaty, and E.K. Franseen, in press,PC based reservoir characterization and simulation of the Schaben Field, Ness County,Kansas: Proceedings of Midcontinent Platform Carbonates, Oklahoma Geological SurveySpecial Publication.
Gerlach, P. M., S. Bhattacharya, T.R. Carr, in press, Cost Effective Techniques for theIndependent Producer to Evaluate Horizontal Drilling Candidates in Mature Areas: AAPGHedberg Conference, International Horizontal Well Symposium: Focus on the Reservoir,(October 10-13, 1999, The Woodlands, Texas),http://www.kgs.ukans.edu/PRS/AAPG/papers/gerlach.html.
Hopkins, J. F., T. R. Carr, H. R. Feldman, 1996, Pseudoseismic Transforms of Wireline Logs: ASeismic Approach to Petrophysical Sequence Stratigraphy, in J. A. Pacht, R. E. Sheriff and B.F. Perkins, eds., Stratigraphic Analysis Utilizing Advanced Geophysical, Wireline and

50
Borehole Technology for Petroleum Exploration and Production: Gulf Coast SEPMSeventeenth Annual Research Conference, p. 133-144.
Watney, W. L., W. J. Guy, J. H. Doveton, S. Bhattacharya, P. M. Gerlach, G. C. Bohling, and T.R. Carr, 1997, Petrofacies Analysis -- The petrophysical tool for geologic/engineeringreservoir characterization; in Proceedings of the USDOE 4th International ReservoirCharacterization Technical Conference (Houston, Texas, March 3-5), p. 95-114.
Watney, W. L. and Bohling, G., 1998, PfEFFER Demo, in Mark, Sandra, compiler, PTTC’sPetroleum E&P Software Sampler, CD-ROM v. 1.0, PTTC, Washington.
Watney, W.L., W.J. Guy, J.H. Doveton, S. Bhattacharya, P. M. Gerlach, G. C. Bohling, T. R.Carr, in press, Petrofacies Analysis - A petrophysical tool for geologic/engineering reservoircharacterization: Proceedings of the Fourth International Reservoir CharacterizationTechnical Conference, Studies in Geology, American Association of Petroleum Geologists.