Embed Size (px)
Citation preview
Final Report under IAEA Research Agreement No.15951
Title of Project: Validation and Improvement of COPERNIC Code at Extended
Burnup
Title of Report
CALCULATIONS OF FISSION GAS RELEASE DURING
RAMP TESTS USING COPERNIC CODE
Host organization: Nuclear Fuel R&D Center, China Nuclear Power Technology
Research Institute (CNPRI)
Chief Scientific Investigator: Dr. Tong Liu
December, 2011
I
TABLE OF CONTENTS Executive summary...........................................................................................................................1 1. INTRODUCTION .....................................................................................................................2 2. CODE DESCRIPTION..............................................................................................................3 3. DATA DESCRIPTION OF THE RAMP TESTS .......................................................................4
3.1 Introduction......................................................................................................................4 3.2 Rod Design and Fabrication.............................................................................................5 3.3 General Assumption Used................................................................................................9
4. RESULTS AND DISCUSSIONS.............................................................................................13 4.1 Power Histories of the Ramp Tests ................................................................................13 4.2 Sensitivity Study of the FGR Models.............................................................................17 4.3 Application of COPERNIC to Real-time FGR ..............................................................22
5. CONCLUSIONS......................................................................................................................26 REFERENCES................................................................................................................................27
II
LIST OF TABLES Table 3-1 Summary of the central segment characteristics ...............................................................6 Table 3-2 Main characteristics of PK rods ........................................................................................7 Table 3-3 Main fuel rod component dimensions and rod characteristics ..........................................8 Table 4-1 Irradiation information of each rod.................................................................................14 Table 4-2 The diffusion parameters used in different COPERNIC FGR models............................17
LIST OF FIGURES Figure 3-1 Schematic diagram of the segment fuel rod stringer .......................................................6 Figure 3-2 Bump test power history of rod AN4 provided by the data file of AN4 document .......10 Figure 3-3 Bump test power history of rod AN4 provided by the pdf format document................11 Figure 3-4 Modified bump test power history of rod AN4 .............................................................11 Figure 3-5 The base irradiation history of rod group PK1 ..............................................................12 Figure 4-1 The power history of the ANF fuel rods........................................................................13 Figure 4-2 Power histories of PK1 series rods................................................................................15 Figure 4-3 Power histories of PK2 series rods................................................................................15 Figure 4-4 Power histories of PK4 series rods................................................................................16 Figure 4-5 Power histories of PK6 series rods................................................................................16 Figure 4-6 Comparison of the model predictions with the in-pile measurement data for ANF fuel........................................................................................................................................................18 Figure 4-7 Comparison of the model predictions with the experimental data for rods PK1, PK4 and PK6...........................................................................................................................................19 Figure 4-8 Comparison of the model predictions with the experimental data for rod PK2 ............19 Figure 4-9 The predicted versus measured fission gas release for ANF and PK fuel. ....................20 Figure 4-10 Comparison between predicted and measured FGR for rods AN1, AN3, AN4 and AN10...............................................................................................................................................22 Figure 4-11 Comparison between predicted and measured fuel centerline temperature of AN3 and AN10...............................................................................................................................................23 Figure 4-12 Measured fission gas release fraction of AN4 during temperature change .................24
1
Executive summary
The report performed under IAEA research contract No.15951 describes the
results of fuel performance evaluation of LWR fuel rods operated at ramp conditions
using the COPERNIC code developed by AREVA. The experimental data from the
Third Risø Fission Gas Project and the Studsvik SUPER-RAMP Project presented in
the IFPE database of the OECD/NEA has been utilized for assessing the code itself
during simulation of fission gas release (FGR).
Standard code models for LWR fuel were used in simulations with parameters
set properly in accordance with relevant test reports. With the help of data adjustment,
the input power histories are restructured to fit the real ones, so as to ensure the
validity of FGR prediction. The results obtained by COPERNIC show that different
models lead to diverse predictions and discrepancies. By comparison, the COPERNIC
V2.2 model (95% Upper bound) is selected as the standard FGR model in this report
and the FGR phenomenon is properly simulated by the code. To interpret the large
discrepancies of some certain PK rods, the burst effect of FGR which is taken into
consideration in COPERNIC is described and the influence of the input power
histories is extrapolated.
In addition, the real-time tracking capability of COPERNIC is tested against
experimental data. In the process of investigation, two main dominant factors
influencing the measured gas release rate are described and different mechanisms are
analyzed. With the limited predicting capacity, accurate predictions cannot be carried
out on abrupt changes of FGR during ramp tests by COPERNIC and improvements
may be necessary to some relevant models.
2
1. INTRODUCTION
The incentive of developing extended burnup fuel is to maintain the
competitiveness of nuclear energy. With increasing demand for economics, the
industry needs to reduce maintenance and fuel cycle costs, while enhancing safety
features. Extended burnup is one of the methods applied to meet these objectives.
There are a number of issues that need resolution to be able to successfully implement
extended burnup.
The performance of the critical fuel components is the result of a complex
interaction of a large number of variables that challenge the evaluation of the
mechanisms in progress and the prediction of their behavior at extended and more
severe conditions (e.g. higher burnup). In order to guarantee the rod integrity and
operation safety, a number of fuel rod performance codes are developed, such as
URANUS[1,2], TRANSURANUS[3,4], FRAPCON-3[5], PAD, COPERNIC[6],
FEMAXI-V[7], FALCON[8] and so on. They are widely used by research centers as
well as nuclear safety authorities to assess specific fuel rod design and offer a good
tool for evaluating a limited number of variables and mechanisms and have provided
some valuable data.
The International Atomic Energy Agency (IAEA) has initiated a new
Coordinated Research Project on Fuel Modeling at Extended Burnup (FUMEX-III) in
which all principal investigators exchange information and experience in testing and
developing their fuel performance codes against data and cases provided by the IAEA
and OECD/NEA. As a participant, the present work of CNPRI is focus on the
validation of the COPERNIC prediction capability in simulating burnup, cladding
waterside corrosion, cladding creep, fuel temperature, FGR, fuel axial elongation and
rod internal pressure for LWR fuel rods operated at steady-state or transient
conditions. Based on the experimental data from the Third Risø Fission Gas Project
and the Studsvik SUPER-RAMP Project, numerous rods are tested and certain
mechanisms are investigated.
3
2. CODE DESCRIPTION
The COPERNIC code is an advanced fuel rod design tool for evaluating fuel rod
thermal-mechanical performance. It incorporates several state-of-the-art models
developed by FRAMATOME and borrows the European TRANSURANUS code
architecture which is based on a mathematical framework of the heat transfer and
mechanical models. The main objectives of COPERNIC are to describe the behavior
of the fuel accurately and provide credible data for fuel rod design[9].
Using the fuel rod fabrication and irradiation data, COPERNIC evaluates the fuel
performances under a continuously varying power history by introducing the time
discretization and spacial discretization method. Each macro time step is further
divided into additional micro ones by the code itself during the time discretization
process. As for the spacial discretization of rod geometry, the fuel rod is expressed in
sequential axial slices or sections. In each slice, there are several coarse concentric
rings (iso-volume discretization) which are subdivided into many fine ones.
During a micro time step, the time-dependent quantities (linear power, fast flux,
thermohydraulics data) are considered as constant in each axial slice, the young's
modulus and the poisson's ratio are assumed constant in each coarse ring (cladding or
pellet) while the thermal conductivity is considered as constant in each fine ring. The
fuel temperature, fission gas release, densification, swelling, cladding stress, strain
and cladding corrosion are calculated separately for each axial slice, and the effects
are integrated to obtain the overall rod void volume and internal pressure. The code
runs iteratively due to the complex interaction of individual model until convergence
occurs[10].
The physical models in COPERNIC code were developed from the latest
knowledge of fuel in-pile phenomena based on experimental data base. The database
is obtained from different rod design and under different operation conditions.
4
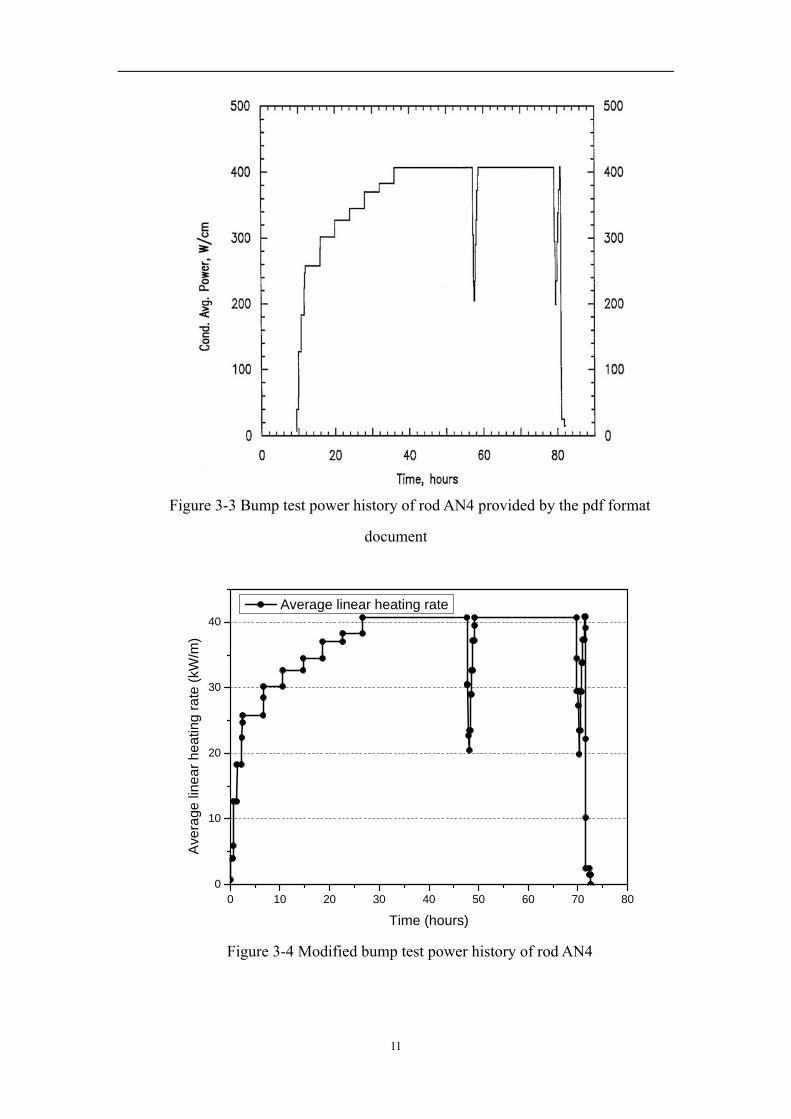
3. DATA DESCRIPTION OF THE RAMP TESTS
3.1 Introduction
The data sets used in this report come from two ramp (or bump) tests. During
these tests, thermomechanical fuel behaviour such as fission gas release and fuel
microstructural changes is investigated with the help of COPERNIC code. Brief
introduction of these projects is conducted as follows:
1) the third Risø fission gas project
The Risø National Laboratory in Denmark have carried out three irradiation
programs of slow ramp and hold tests, so called ‘bump test’ to investigate fission gas
release and fuel microstructural changes. The Third Risø Fission Gas Project was
organized as joint international project with sponsorship from a number of
organizations in Europe, Japan and the USA. The project was executed by Risø
between 1986 and 1990.
Two Risø projects have already generated comprehensive data sets with high
burnup fuel. Part of these data, such as transient fission gas release as a function of
time, is described in detail. In addition, detailed characterizations are provided of
local fission product distributions and fuel structures resulting from the power
transients.
In the Third Risø Fission Gas Project, previously irradiated power reactor fuel
was refabricated into test fuel pins that were instrumented with pressure transducers
and fuel thermocouples. This enabled continuous monitoring of fission gas release
and fuel temperature during power transients. As in the previous projects, extensive
hotcell examinations before and after the transient testing provided detailed data on
local fission product distribution and fuel structure.
The project has provided valuable data derived from the PIE process. In the
project, extensive hotcell examinations were performed to characterize the tested fuels
after base irradiation and after bump testing. Some examinations were carried out at
the Institute for Transuranium Elements in Karlsruhe, including electron probe micro
5
analysis as well as optical and electron microscopy.
There were three kinds of fuel rods used in the project: IFA-161 irradiated in the
Halden BWR with burnups from 13 to 46 MWd/kgUO2, GE BWR fuel irradiated in
Quad Cities 1 and Millstone 1 with burnups from 20 to 40 MWd/kgUO2 and ANF
PWR fuel irradiated in Biblis A to 38 MWd/kgUO2. In this report, only the ANF fuel
is discussed.
2) the Studsvik SUPER-RAMP project
The Studsvik SUPER-RAMP Project investigated the failure propensity of
typical LWR fuel in the form of test rods when subjected to power ramps, after base
irradiation to high burn-up[11].
The Project power ramped 28 individual PWR rods and 16 BWR rods. The 28
fuel rods of PWR subprogram consisted of 6 groups of rods with variations in design
and material parameters. 4 groups among them, PK1, PK2, PK4 and PK6 are
simulated with COEOPRNIC code. Group PK1, PK2, PK4, PK6 consisting of 19 rods
(18 of them were modeled in this activity) were delivered by Kraftwerk Union
AG/Combusting Engineer (KWU/CE). The PK rods were base irradiated in power
reactor environment KK Obrigheim at time averaged heat ratings mainly in the range
14-26 kW/m to peak burn-ups in the range 33-45 MWd/kgU and were subsequently
ramp tested in the research reactor R2 at Studsvik, Sweden.
After irradiation, all rods underwent a thorough examination program,
comprising characterisation prior to base irradiation, examination between base and
ramp irradiation and examination after ramp irradiation.
3.2 Rod Design and Fabrication
1) the third Risø fission gas project
Fuel rod stringers with zirconium lined barrier cladding rod segments were
irradiated as part of the Biblis A XN-3 fuel reload. These rods were fabricated by the
Advanced Nuclear Fuels Corporation. Each rod has six segments, but only the central
four segments are characterized and have zircaloy-4/zirconium barrier cladding [12].
6
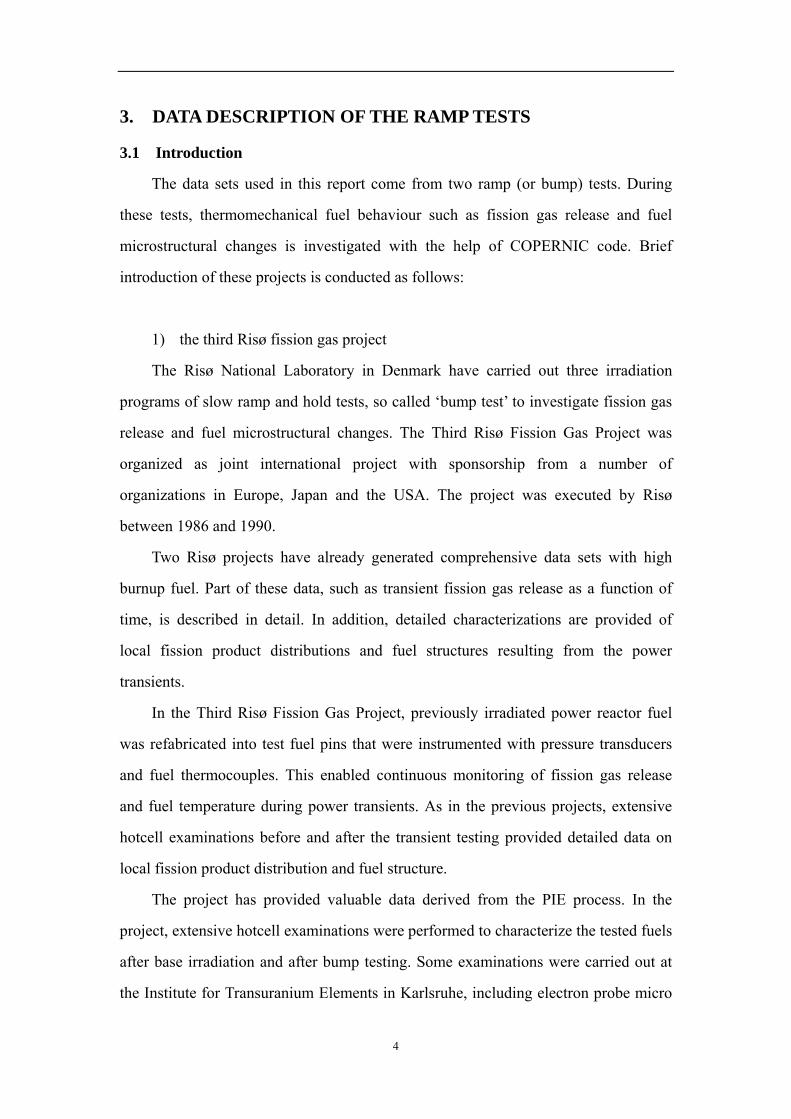
Each of the central segments is ~653.4mm long. Every segment contains a fuel stack
of enriched pellet, one natural UO2 depressor pellet and one insulator disk on each
end of the fuel stack, plenum spring and zircaloy-4 end fittings that are welded to the
cladding. The characterized segments contain solid core dished pellets. The nominal
cladding-pellet gap is 0.19mm. The schematic diagram of the segment fuel rod
stringer is shown in Figure 3-1 and the summary of the central segment characteristics
is listed in Table 3-1
Figure 3-1 Schematic diagram of the segment fuel rod stringer
Table 3-1 Summary of the central segment characteristics
Parameter description Mean value Standard deviation
Segment
Length(mm) 653.5
Active fuel length(mm) 541.8
Plenum length(mm) 61.0
Diametral gap(mm) 0.19
Fill pressure, He(MN/m2) 2.52
Pellet
Process ADU
Outer diameter(mm) 9.053 0.005
Length(mm) 6.909 0.071
Enrichment(w/o) 2.95
Density(g/cm3) 10.274
T.D.(%) 93.74 0.434
7
Resintered density(%) 93.92
Dish volume(%) 0.97 0.07
Grain size(μm) 6.0
Open porosity(%) 0.07 0.05
Cladding
Material Zr-4, Zirconium lined
Treatment Coldworked-Stress relieved
Manufacturer Sandvik Special Metals
Outer diameter(mm) 10.82
Inner diameter(mm) 9.25
Thickness(mm) 0.787
Barrier thickness(mm) 0.057
CSR-R value 1.797
Burst hoop stress(MN/m2) 887.0
0.2% Yield strength(MN/m2) 535
Ultimate strength(MN/m2) 728
Elongation(%) 19.5
ASTM grain size 12.0
Hydride orientation <0.1
2) the Studsvik SUPER-RAMP project
18 PWR fuel rods of PK rods were simulated by COPERNIC code. The rods
formed four groups containing 4 to 5 rods of identical design. The main
characteristics of PK rods are shown in Table 3-2.
Table 3-2 Main characteristics of PK rods
Group Type Number of Rods Cycles Rod Average Burnup
MWd/tU
PK1 Standard 4 KWO Cycle 9, 10, 11 35
PK2 Standard 5 KWO Cycle 8, 9, 10, 11 44
8
PK4 Standard 4 KWO Cycle 8, 9, 10 33
PK6 Large grain 5 KWO Cycle 8, 9, 10 36
The main fuel rod component dimensions and rod characteristics are shown in
Table 3-3.
Table 3-3 Main fuel rod component dimensions and rod characteristics
PK1 PK2 PK4 PK6
Pellet type Standard Standard 4% Gd2O3 Large grain
He fill pressure bar
22.5 22.5 22.5 22.5
UO2 stack length mm
311 318 314 315
Overall rod length mm
388 390 390 390
Cladding OD mm
10.67 10.75 10.77 10.74
Cladding ID mm
9.31 9.38 9.28 9.29
Diametral gap μm
197 145 169 146
Pellet fabrication AUC AUC AUC DC Enrichment wt% 235U
3.2 3.21 3.19 2.99
Gd content wt% Gd2O3 in UO2
4.09±0.05
Pellet OD mm
9.11 9.14 9.11 9.14
Pellet L/D 1.25 1.24 1.19 1.21 Increase after densification test
% 0.4 0.7 0.7 none
Average grain size μm
6 5.5 5.5 22
Final density g/cm3
10.36 ±0.012
10.34 ±0.019
10.295 ±0.01
10.42 ±0.04
Pellet OD mm
9.110 ±0.006
9.138 ±0.003
9.113 ±0.004
9.144 ±0.008
Pellet length mm
11.35 ±0.60
11.34 ±0.40
11.799 ±0.65
11.1 ±0.90
O/U 2.00±0.01 2.00±0.01 2.037±0.01 2.00±0.01
9
Open porosity %
50±5 55.8±3.1 2.1±0.7 42.8±7.8
IFPE database also provide detailed information of some of the rod
characteristics for fuel rods of PWR subprogram which may differ from the table
above slightly due to fabrication tolerance.
3.3 General Assumption Used
The following assumptions were made to obtain the necessary data for
evaluation of fuel rod performances.
Fuel pellet and fuel rod data:
– Total number of plenum spring turns, spring external diameter and spring wire
diameter are substituted by a multiplicative factor on upper plenum volume.
Then, the multiplicative factor is adjusted to fit the rod void volume. This
method is applied to all of the tested rods.
– The fill gas temperature of 20℃ is used.
– Dish depth and pellet dish spherical radius, which are used to calculate the
dish volume, are replaced by the ratio between the dish and pellet volume.
– The pellet chip volume used to calculate void volume inside the rod was set as
0.3% for all the rods in this project.
– The large gain pellets of PK6 rods were manufactured by DC process, which
is a dry conversion procedure. Since COPERNIC code dose not have a DC
pellets model, the pellets of PK rods are regarded as IDR (which is also a dry
conversion procedure) pellets in calculation.
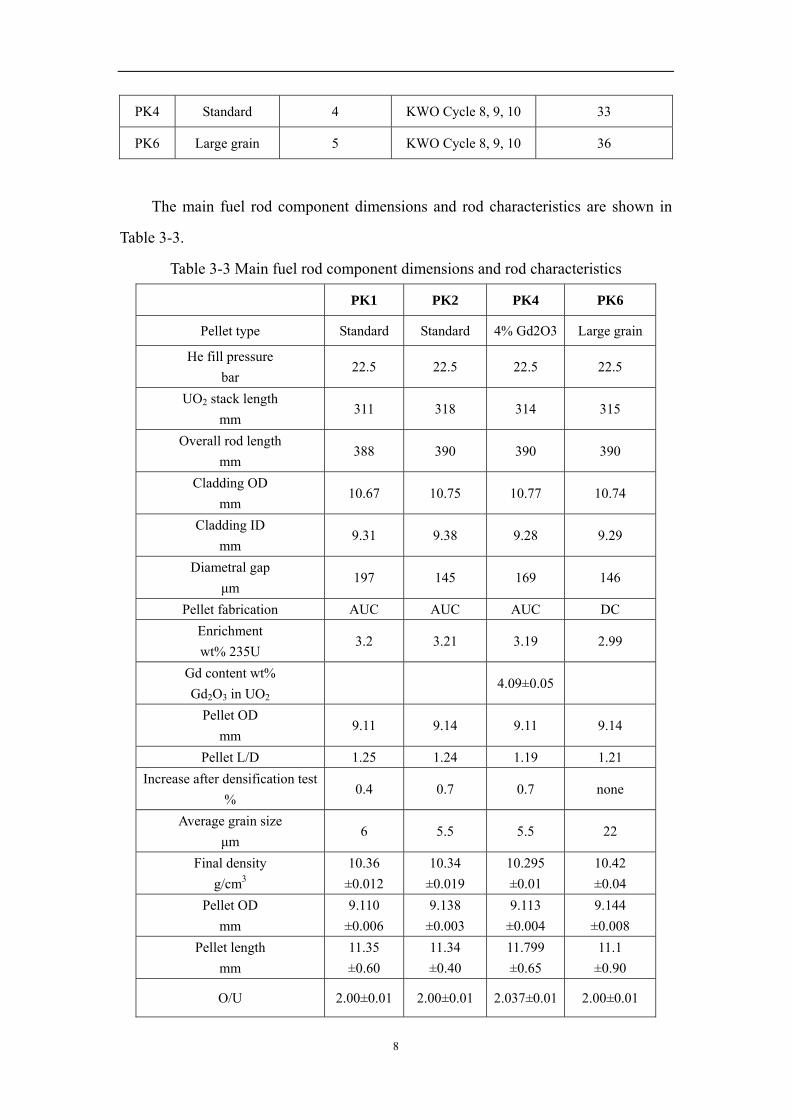
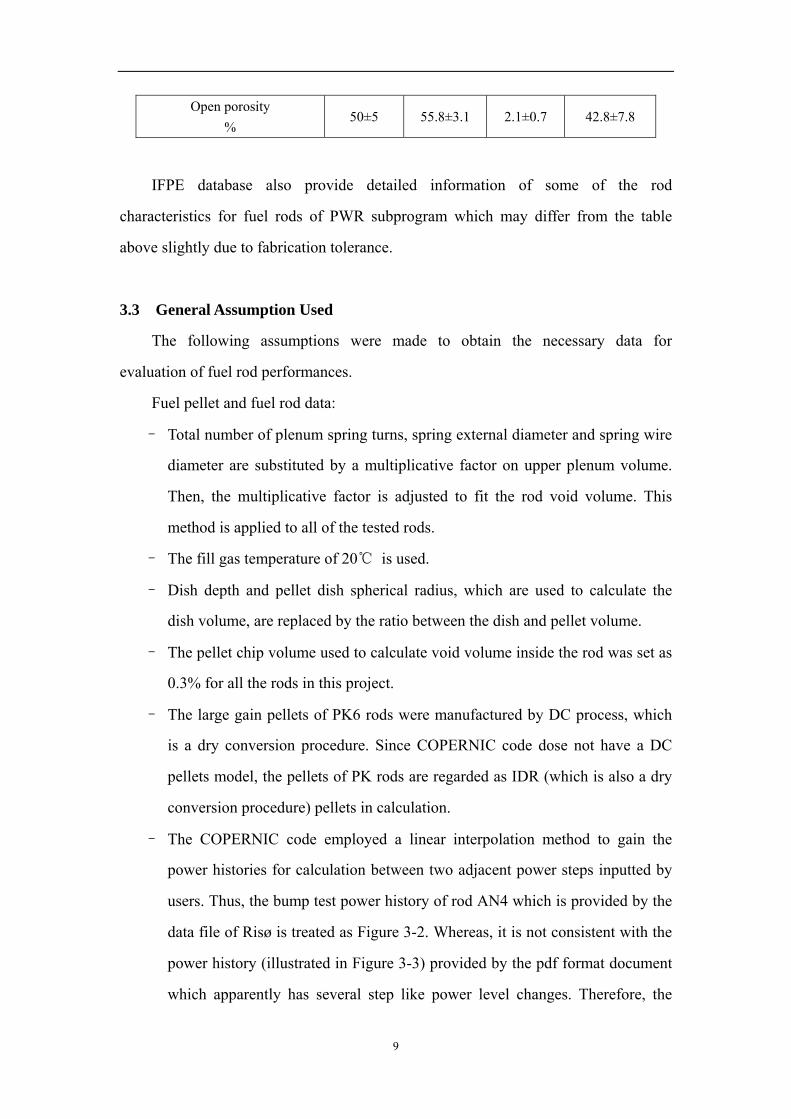
– The COPERNIC code employed a linear interpolation method to gain the
power histories for calculation between two adjacent power steps inputted by
users. Thus, the bump test power history of rod AN4 which is provided by the
data file of Risø is treated as Figure 3-2. Whereas, it is not consistent with the
power history (illustrated in Figure 3-3) provided by the pdf format document
which apparently has several step like power level changes. Therefore, the
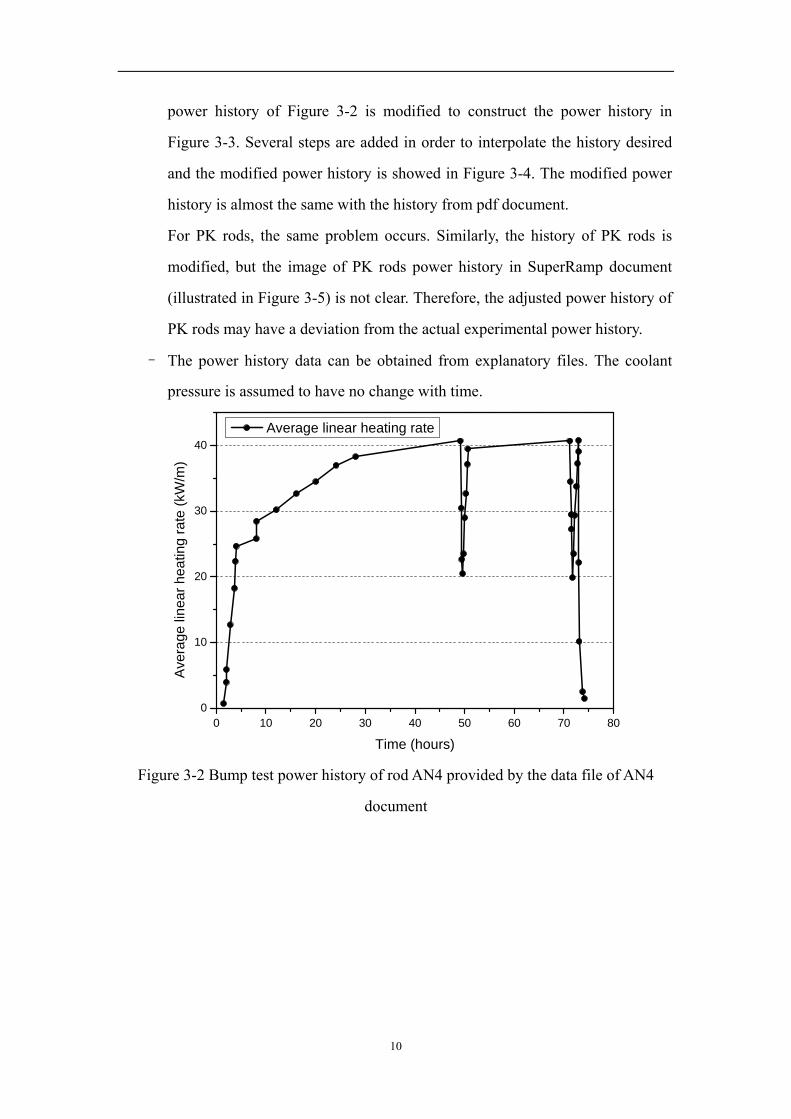
10
power history of Figure 3-2 is modified to construct the power history in
Figure 3-3. Several steps are added in order to interpolate the history desired
and the modified power history is showed in Figure 3-4. The modified power
history is almost the same with the history from pdf document.
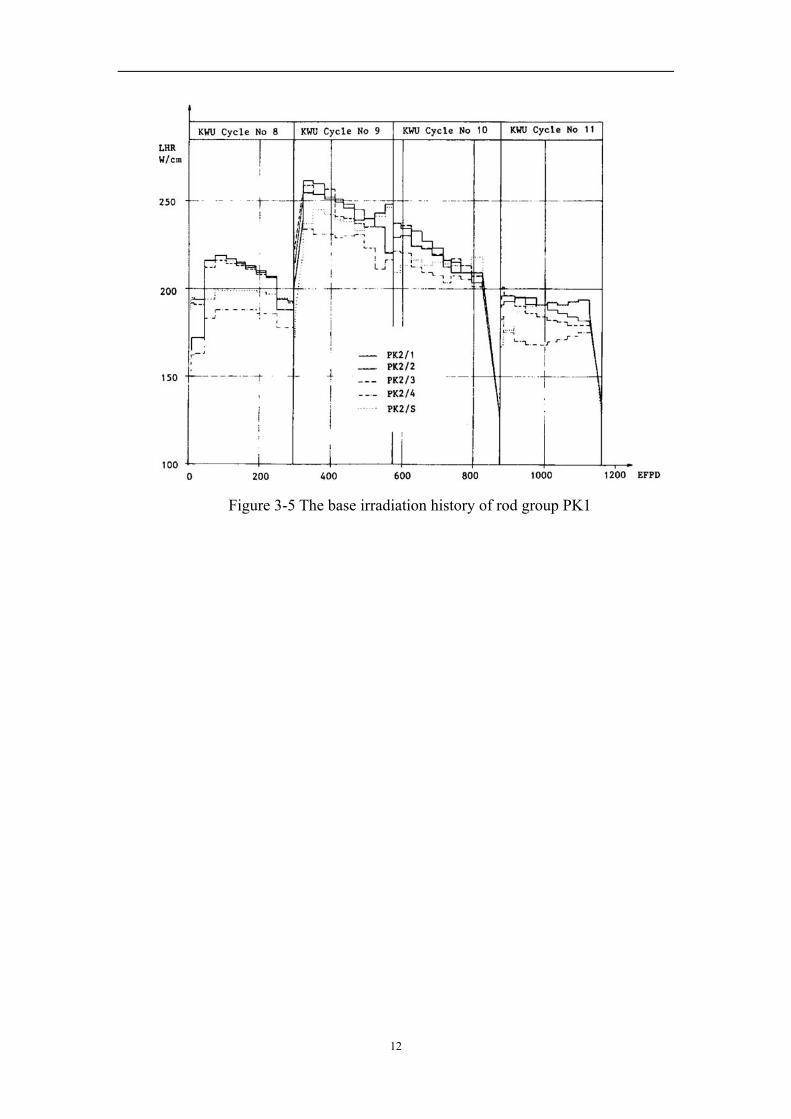
For PK rods, the same problem occurs. Similarly, the history of PK rods is
modified, but the image of PK rods power history in SuperRamp document
(illustrated in Figure 3-5) is not clear. Therefore, the adjusted power history of
PK rods may have a deviation from the actual experimental power history.
– The power history data can be obtained from explanatory files. The coolant
pressure is assumed to have no change with time.
0 10 20 30 40 50 60 70 800
10
20
30
40 Average linear heating rate
Ave
rage
line
ar h
eatin
g ra
te (k
W/m
)
Time (hours)
Figure 3-2 Bump test power history of rod AN4 provided by the data file of AN4
document
11
Figure 3-3 Bump test power history of rod AN4 provided by the pdf format
document
0 10 20 30 40 50 60 70 800
10
20
30
40
Ave
rage
line
ar h
eatin
g ra
te (k
W/m
)
Time (hours)
Average linear heating rate
Figure 3-4 Modified bump test power history of rod AN4
12
Figure 3-5 The base irradiation history of rod group PK1
13
4. RESULTS AND DISCUSSIONS
4.1 Power Histories of the Ramp Tests
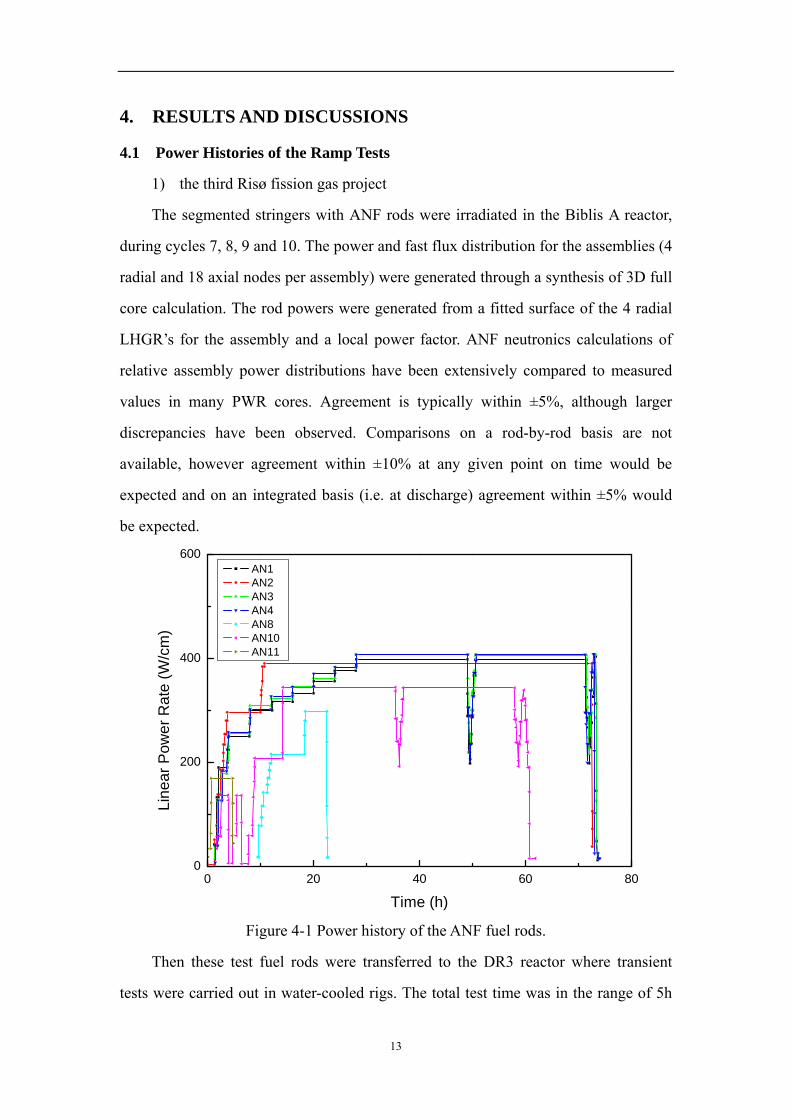
1) the third Risø fission gas project
The segmented stringers with ANF rods were irradiated in the Biblis A reactor,
during cycles 7, 8, 9 and 10. The power and fast flux distribution for the assemblies (4
radial and 18 axial nodes per assembly) were generated through a synthesis of 3D full
core calculation. The rod powers were generated from a fitted surface of the 4 radial
LHGR’s for the assembly and a local power factor. ANF neutronics calculations of
relative assembly power distributions have been extensively compared to measured
values in many PWR cores. Agreement is typically within ±5%, although larger
discrepancies have been observed. Comparisons on a rod-by-rod basis are not
available, however agreement within ±10% at any given point on time would be
expected and on an integrated basis (i.e. at discharge) agreement within ±5% would
be expected.
0 20 40 60 800
200
400
600
Line
ar P
ower
Rat
e (W
/cm
)
Time (h)
AN1 AN2 AN3 AN4 AN8 AN10 AN11
Figure 4-1 Power history of the ANF fuel rods.
Then these test fuel rods were transferred to the DR3 reactor where transient
tests were carried out in water-cooled rigs. The total test time was in the range of 5h
14
to 3d. The test power was determined from calorimetric measurements during the test.
The axial power shape was obtained from 140La axial gamma scans (T/2=40.2h, and
12.79d for the 140Ba pre cursor). Axial power variations were small for the
refabricated tests, due to the short stack length. Figure 4-1 shows the power history of
the ANF fuel.
2) the Studsvik SUPER-RAMP project
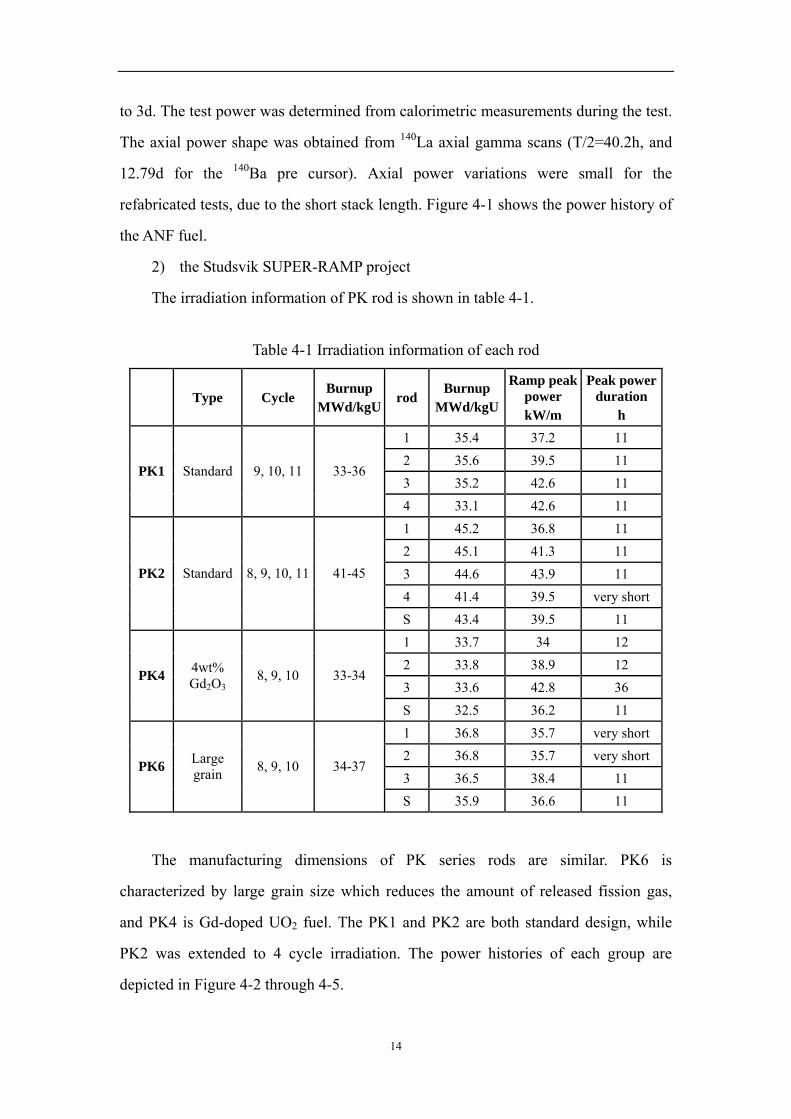
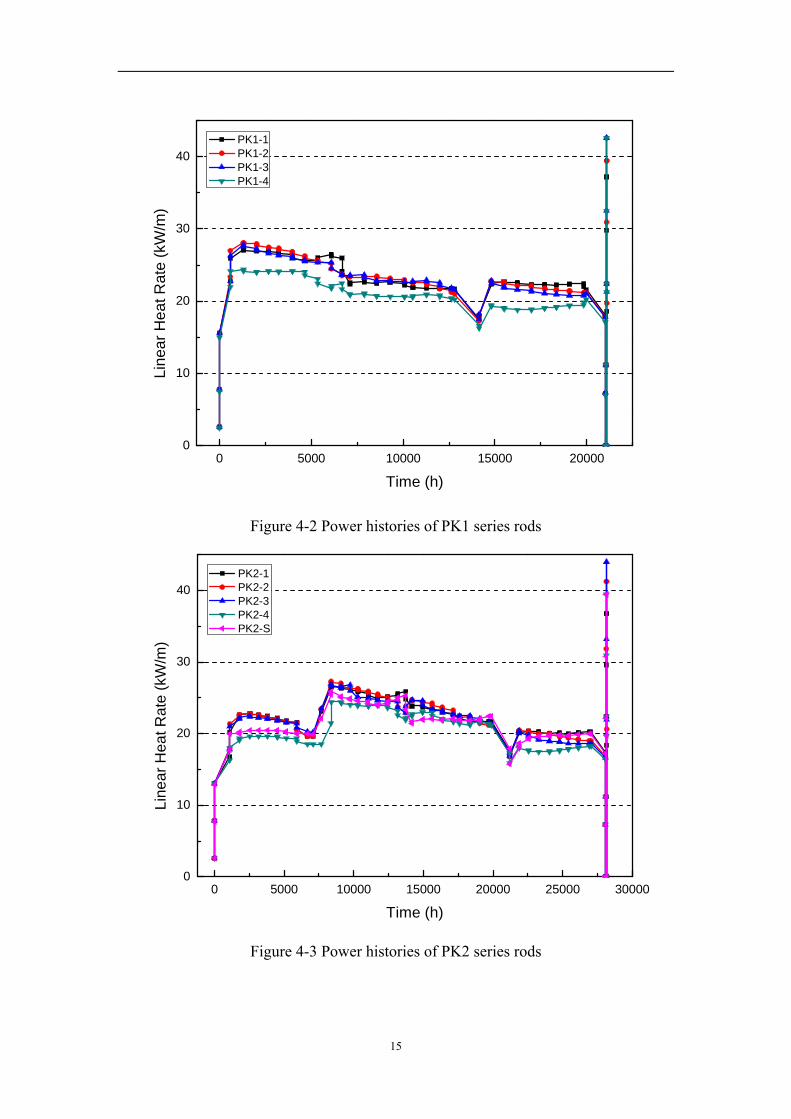
The irradiation information of PK rod is shown in table 4-1.
Table 4-1 Irradiation information of each rod
Type Cycle Burnup
MWd/kgUrod
Burnup MWd/kgU
Ramp peak power kW/m
Peak power duration
h 1 35.4 37.2 11 2 35.6 39.5 11 3 35.2 42.6 11
PK1 Standard 9, 10, 11 33-36
4 33.1 42.6 11 1 45.2 36.8 11 2 45.1 41.3 11 3 44.6 43.9 11 4 41.4 39.5 very short
PK2 Standard 8, 9, 10, 11 41-45
S 43.4 39.5 11 1 33.7 34 12 2 33.8 38.9 12 3 33.6 42.8 36
PK4 4wt% Gd2O3
8, 9, 10 33-34
S 32.5 36.2 11 1 36.8 35.7 very short 2 36.8 35.7 very short 3 36.5 38.4 11
PK6 Large grain 8, 9, 10 34-37
S 35.9 36.6 11
The manufacturing dimensions of PK series rods are similar. PK6 is
characterized by large grain size which reduces the amount of released fission gas,
and PK4 is Gd-doped UO2 fuel. The PK1 and PK2 are both standard design, while
PK2 was extended to 4 cycle irradiation. The power histories of each group are
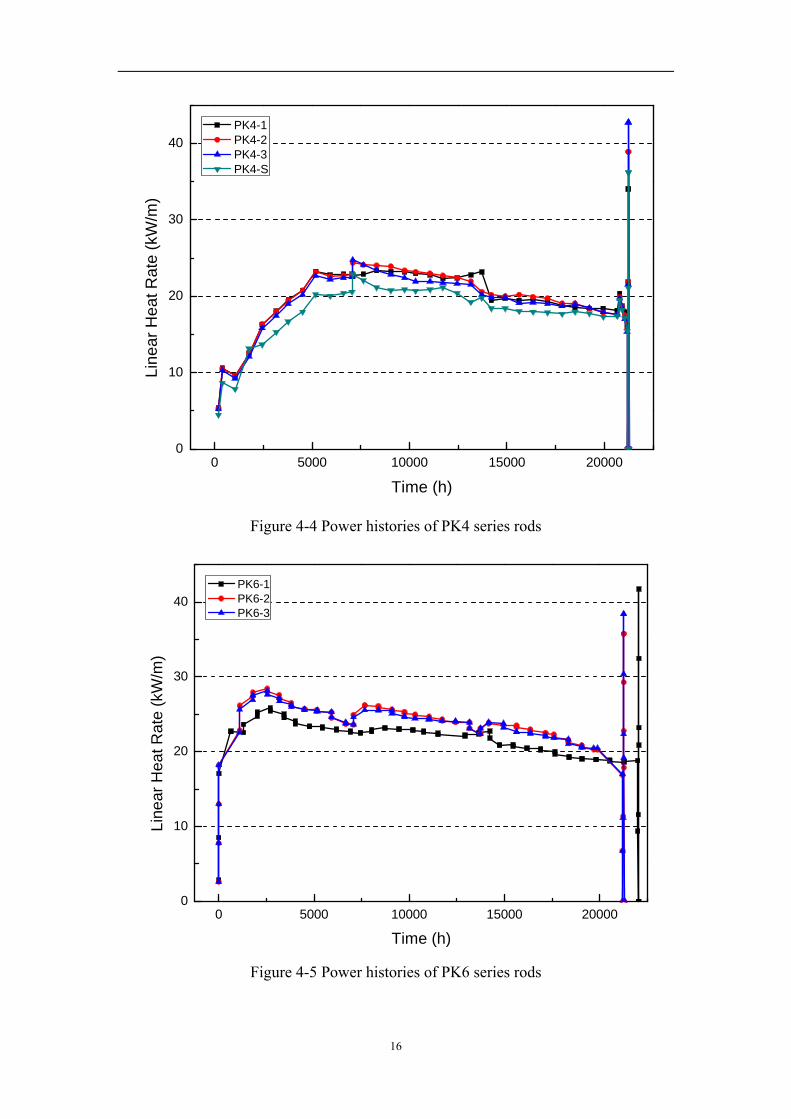
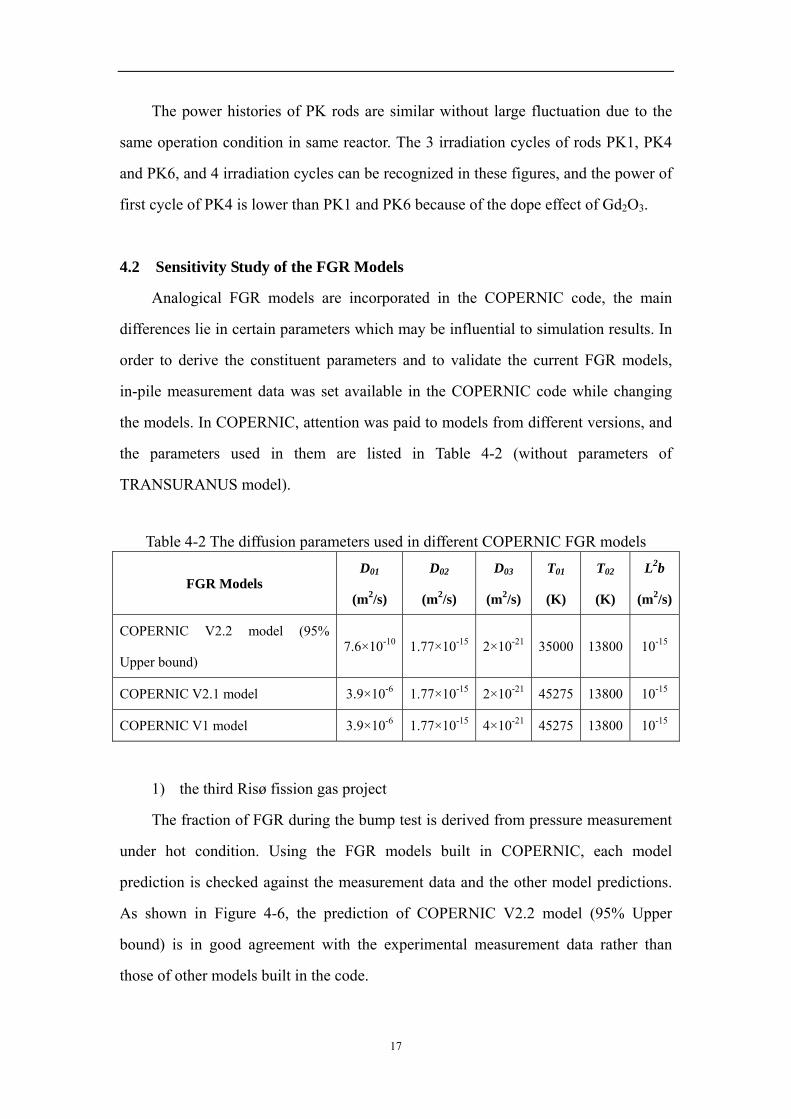
depicted in Figure 4-2 through 4-5.
15
0 5000 10000 15000 200000
10
20
30
40
Line
ar H
eat R
ate
(kW
/m)
Time (h)
PK1-1 PK1-2 PK1-3 PK1-4
Figure 4-2 Power histories of PK1 series rods
0 5000 10000 15000 20000 25000 300000
10
20
30
40
Line
ar H
eat R
ate
(kW
/m)
Time (h)
PK2-1 PK2-2 PK2-3 PK2-4 PK2-S
Figure 4-3 Power histories of PK2 series rods
16
0 5000 10000 15000 200000
10
20
30
40Li
near
Hea
t Rat
e (k
W/m
)
Time (h)
PK4-1 PK4-2 PK4-3 PK4-S
Figure 4-4 Power histories of PK4 series rods
0 5000 10000 15000 200000
10
20
30
40
Line
ar H
eat R
ate
(kW
/m)
Time (h)
PK6-1 PK6-2 PK6-3
Figure 4-5 Power histories of PK6 series rods
17
The power histories of PK rods are similar without large fluctuation due to the
same operation condition in same reactor. The 3 irradiation cycles of rods PK1, PK4
and PK6, and 4 irradiation cycles can be recognized in these figures, and the power of
first cycle of PK4 is lower than PK1 and PK6 because of the dope effect of Gd2O3.
4.2 Sensitivity Study of the FGR Models
Analogical FGR models are incorporated in the COPERNIC code, the main
differences lie in certain parameters which may be influential to simulation results. In
order to derive the constituent parameters and to validate the current FGR models,
in-pile measurement data was set available in the COPERNIC code while changing
the models. In COPERNIC, attention was paid to models from different versions, and
the parameters used in them are listed in Table 4-2 (without parameters of
TRANSURANUS model).
Table 4-2 The diffusion parameters used in different COPERNIC FGR models
FGR Models D01
(m2/s)
D02
(m2/s)
D03
(m2/s)
T01
(K)
T02
(K)
L2b
(m2/s)
COPERNIC V2.2 model (95%
Upper bound) 7.6×10⁻¹⁰ 1.77×10⁻¹⁵ 2×10-21 35000 13800 10-15
COPERNIC V2.1 model 3.9×10⁻⁶ 1.77×10⁻¹⁵ 2×10-21 45275 13800 10-15
COPERNIC V1 model 3.9×10⁻⁶ 1.77×10⁻¹⁵ 4×10-21 45275 13800 10-15
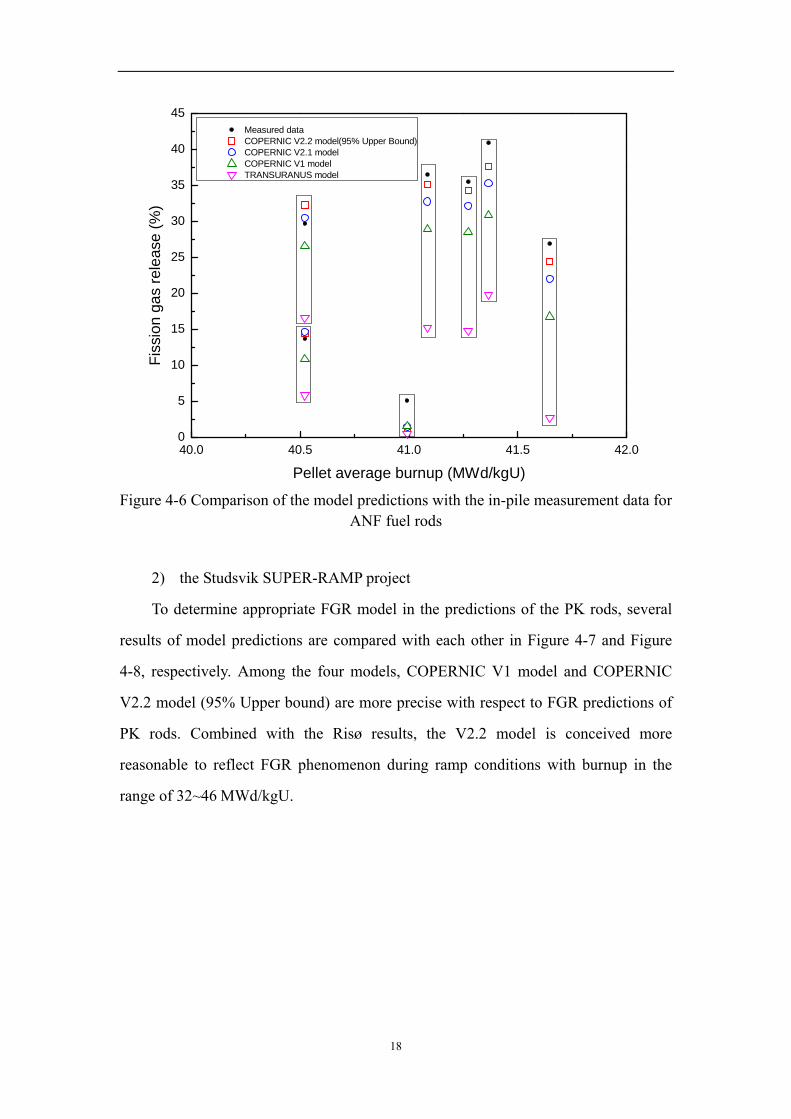
1) the third Risø fission gas project
The fraction of FGR during the bump test is derived from pressure measurement
under hot condition. Using the FGR models built in COPERNIC, each model
prediction is checked against the measurement data and the other model predictions.
As shown in Figure 4-6, the prediction of COPERNIC V2.2 model (95% Upper
bound) is in good agreement with the experimental measurement data rather than
those of other models built in the code.
18
40.0 40.5 41.0 41.5 42.00
5
10
15
20
25
30
35
40
45 Measured data COPERNIC V2.2 model(95% Upper Bound) COPERNIC V2.1 model COPERNIC V1 model TRANSURANUS model
Fiss
ion
gas
rele
ase
(%)
Pellet average burnup (MWd/kgU) Figure 4-6 Comparison of the model predictions with the in-pile measurement data for
ANF fuel rods
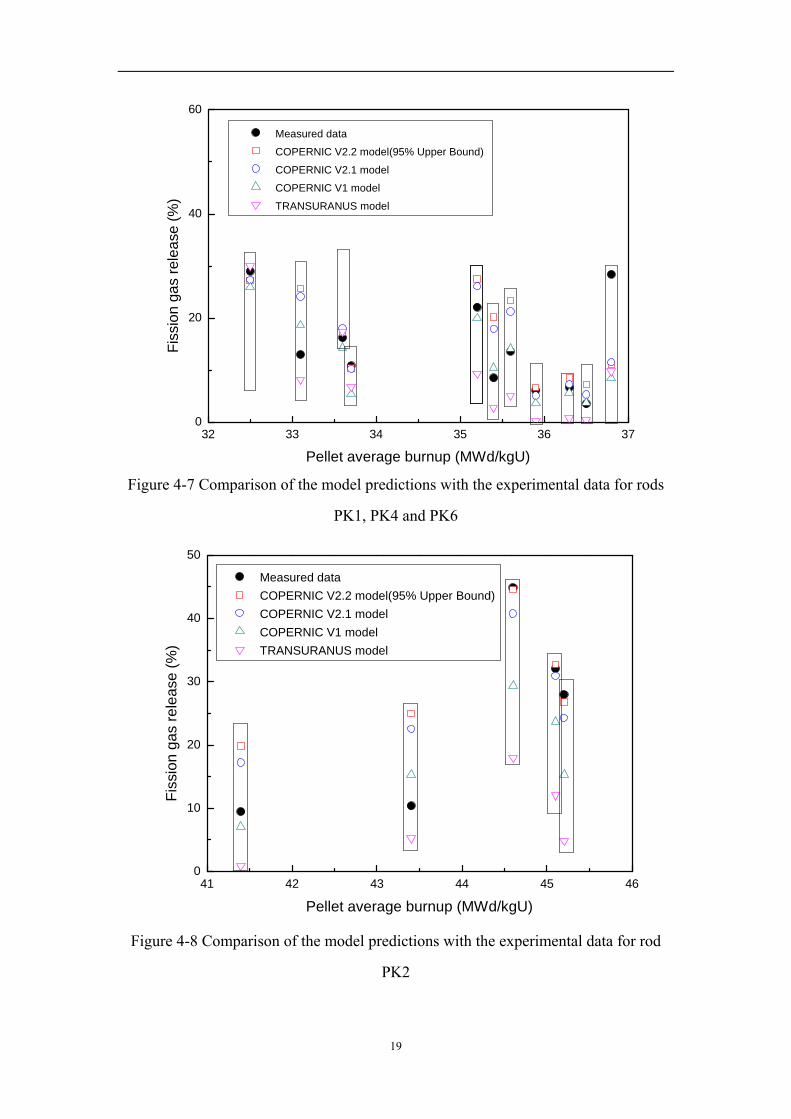
2) the Studsvik SUPER-RAMP project
To determine appropriate FGR model in the predictions of the PK rods, several
results of model predictions are compared with each other in Figure 4-7 and Figure
4-8, respectively. Among the four models, COPERNIC V1 model and COPERNIC
V2.2 model (95% Upper bound) are more precise with respect to FGR predictions of
PK rods. Combined with the Risø results, the V2.2 model is conceived more
reasonable to reflect FGR phenomenon during ramp conditions with burnup in the
range of 32~46 MWd/kgU.
19
32 33 34 35 36 370
20
40
60
Measured data
COPERNIC V2.2 model(95% Upper Bound)
COPERNIC V2.1 model
COPERNIC V1 model
TRANSURANUS model
Fiss
ion
gas
rele
ase
(%)
Pellet average burnup (MWd/kgU) Figure 4-7 Comparison of the model predictions with the experimental data for rods
PK1, PK4 and PK6
41 42 43 44 45 460
10
20
30
40
50
Measured data COPERNIC V2.2 model(95% Upper Bound) COPERNIC V2.1 model COPERNIC V1 model TRANSURANUS model
Fiss
ion
gas
rele
ase
(%)
Pellet average burnup (MWd/kgU)
Figure 4-8 Comparison of the model predictions with the experimental data for rod
PK2
20
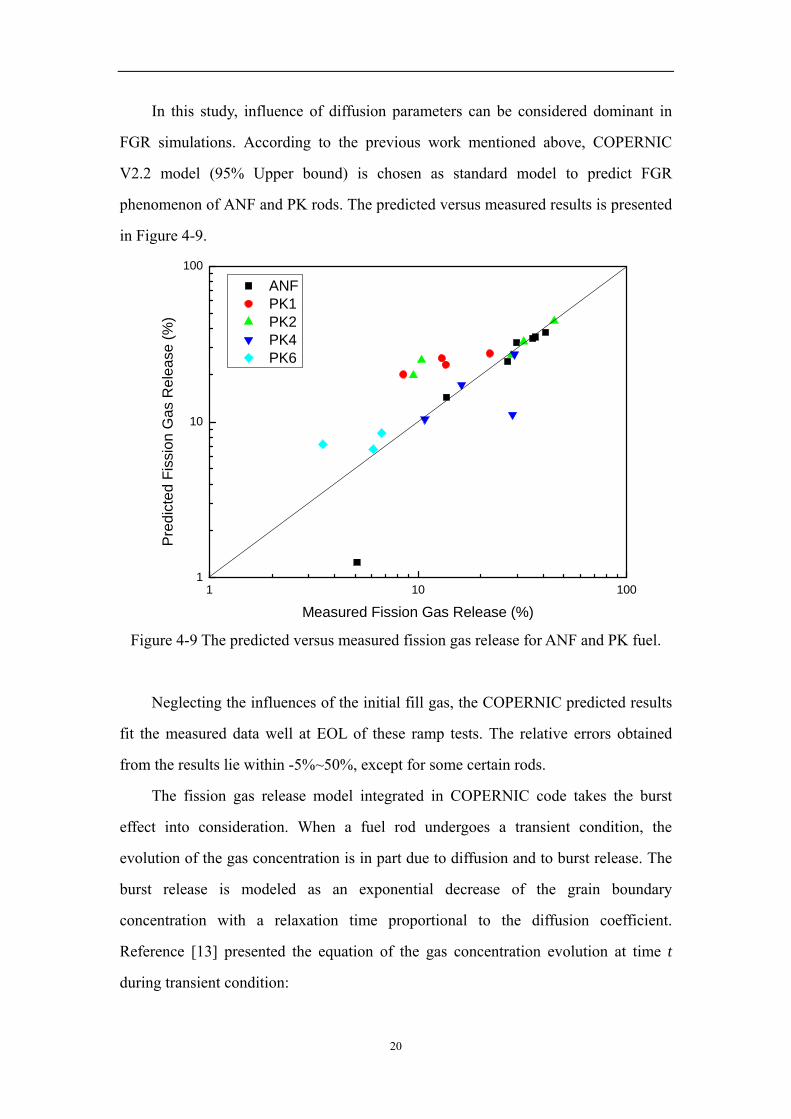
In this study, influence of diffusion parameters can be considered dominant in
FGR simulations. According to the previous work mentioned above, COPERNIC
V2.2 model (95% Upper bound) is chosen as standard model to predict FGR
phenomenon of ANF and PK rods. The predicted versus measured results is presented
in Figure 4-9.
1 10 1001
10
100
ANF PK1 PK2 PK4 PK6
Pre
dict
ed F
issi
on G
as R
elea
se (%
)
Measured Fission Gas Release (%) Figure 4-9 The predicted versus measured fission gas release for ANF and PK fuel.
Neglecting the influences of the initial fill gas, the COPERNIC predicted results
fit the measured data well at EOL of these ramp tests. The relative errors obtained
from the results lie within -5%~50%, except for some certain rods.
The fission gas release model integrated in COPERNIC code takes the burst
effect into consideration. When a fuel rod undergoes a transient condition, the
evolution of the gas concentration is in part due to diffusion and to burst release. The
burst release is modeled as an exponential decrease of the grain boundary
concentration with a relaxation time proportional to the diffusion coefficient.
Reference [13] presented the equation of the gas concentration evolution at time t
during transient condition:
21
( )[ ] ⎟⎟⎠
⎞⎜⎜⎝
⎛ −−−−−=
6
02000 exp1
Ctt
aDcttFcc BTR
where,
0t : Start time of the transient
0c : Total concentration retained in the fuel at time 0t .
0Bc : Grain boundary concentration at time 0t
D : Diffusion coefficient
a : Diameter of the grain
6C : Model parameter fitted from experimental observations.
The first term on the right side of the equation reflects the gas release due to
diffusion, and the second term represents the concentration attenuation caused by the
burst effect. Above all, the equation explains the excess release of gas in the gain
boundary during transient. Then, in the subsequent normal condition, the gain
boundary will be filled with gas until the saturation is reached again.
The calculation strategy of FGR in transient is different from that of the steady
state condition in COPERNIC code. Thus, the FGR calculation of COPERNIC
depends greatly on the accuracy of the input power history. As discussed in chapter
3.3, the power histories form different sources of SuperRamp documents are not
consistent. This deviation may cause the calculation inaccuracy PK rods in Figure 4-9.
22
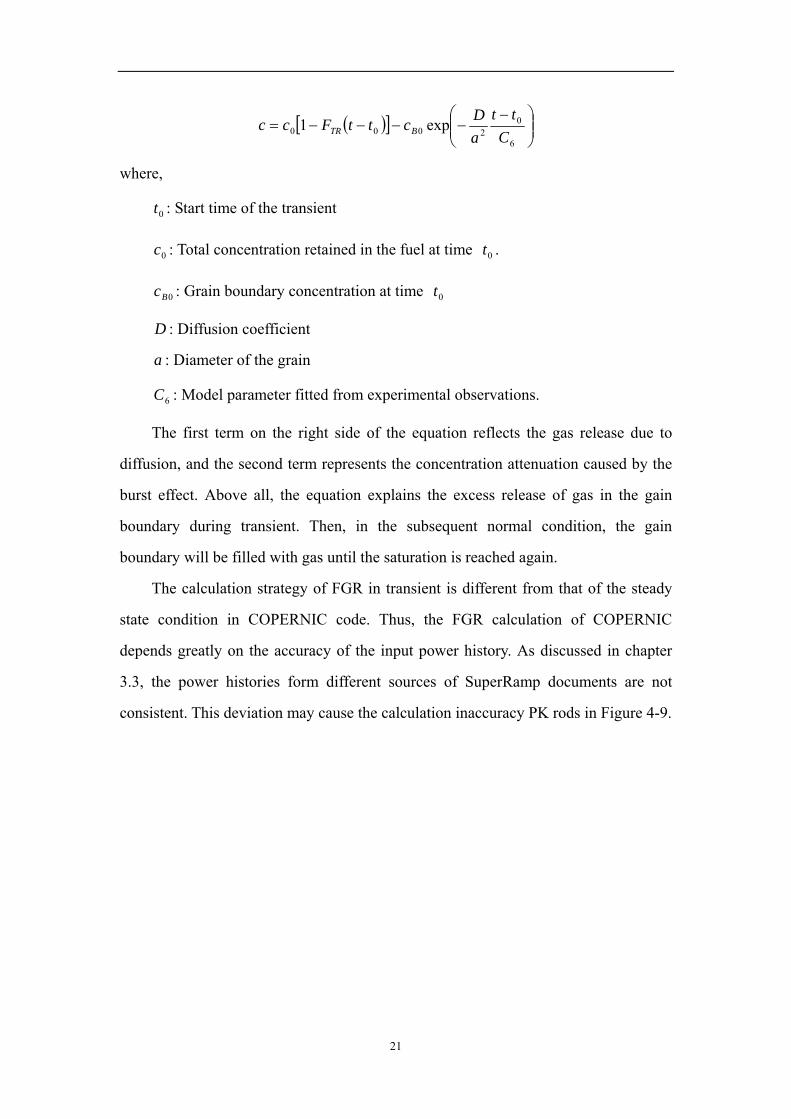
4.3 Application of COPERNIC to Real-time FGR
To make good use of the Risø experimental data, the real-time FGR rate is
employed in extended research on the real-time tracking capability of COPERNIC.
Since there are only four ANF rods which were mounted on the pressure
transducers in the refabrication process, the measured FGR is compared with the
COPERNIC predicted one in Figure 4-10.
0 20 40 60 800
10
20
30
40
50
AN1 Measured AN1 Predicted
FGR
(%)
Time (h)0 20 40 60 80
0
10
20
30
40
50
AN3 Measured AN3 Predicted
FGR
(%)
Time (h)
0 20 40 60 800
10
20
30
40
50
AN4 Measured AN4 Predicted
FGR
(%)
Time (h)0 20 40 60 80
0
10
20
30
40
50
AN10 Measured AN10 Predicted
FGR
(%)
Time (h)
Figure 4-10 Comparison between predicted and measured FGR for rods AN1, AN3,
AN4 and AN10.
23
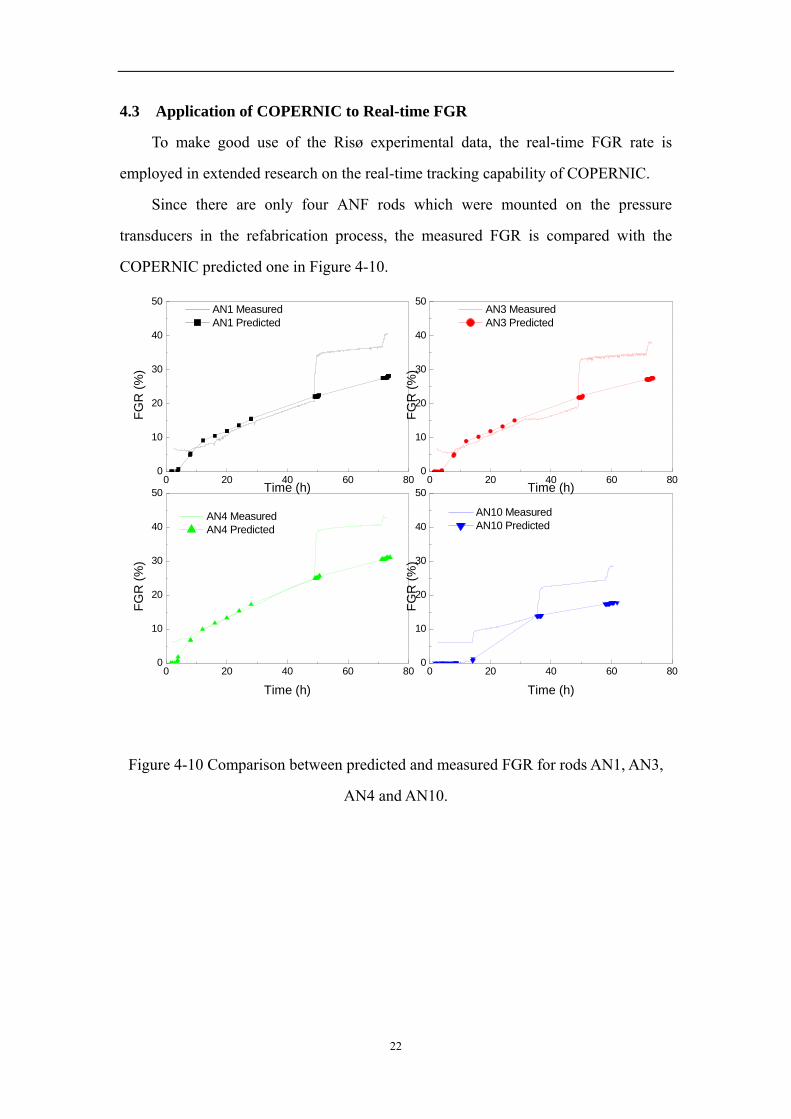
0 20 40 60 800
300
600
900
1200
1500
1800
Cen
terli
ne T
empe
ratu
re (℃
)
Time (h)
AN10 Measured AN10 Predicted AN3 Measured AN3 Predicted
Figure 4-11 Comparison between predicted and measured fuel centerline temperature
of AN3 and AN10.
The measured FGR jumps up rapidly at a certain time which the fuel power and
temperature undergoes noticeable changes (see Figure 4-11).
Firstly, more pellet fragmentation due to excessive stress will occur during
temperature transient. The pellet fragmentation produced in temperature transient will
increase the free surface of fuel pellet by creating more cracks. The interlinked grain
boundaries which have not formed a tunnel to the free surface may connect with the
crack surface, then the fission gas of all the interlinked grains will release.
Secondly, the pellet and cladding may contact more tightly at high temperature
due to the thermal expansion of pellet, then, the tight contact may block the fission
gas convection and cause the maldistribution of fuel rod internal pressure. As can be
seen from the technical report, the measured FGR is derived from local pressure and
the local pressure is proportional to the local fission gas release, that is, proportional
to the local power and temperature. Probably, the pressure in the upper part of the rod
where the pressure transducer is installed is lower than the pressure of the middle part,
24
or lower than the average pressure of the rod. When the temperature of pellet
descends, the contact force between pellet and cladding may decreases, the internal
pressure of the fuel rod will be balanced, that, a part of the gas in the middle section
of the rod will flow into the upper section to increase the pressure rapidly.
The difference between the two possible reasons which cause the steep rise in the
fission gas release is: the former phenomenon may be dominant when the temperature
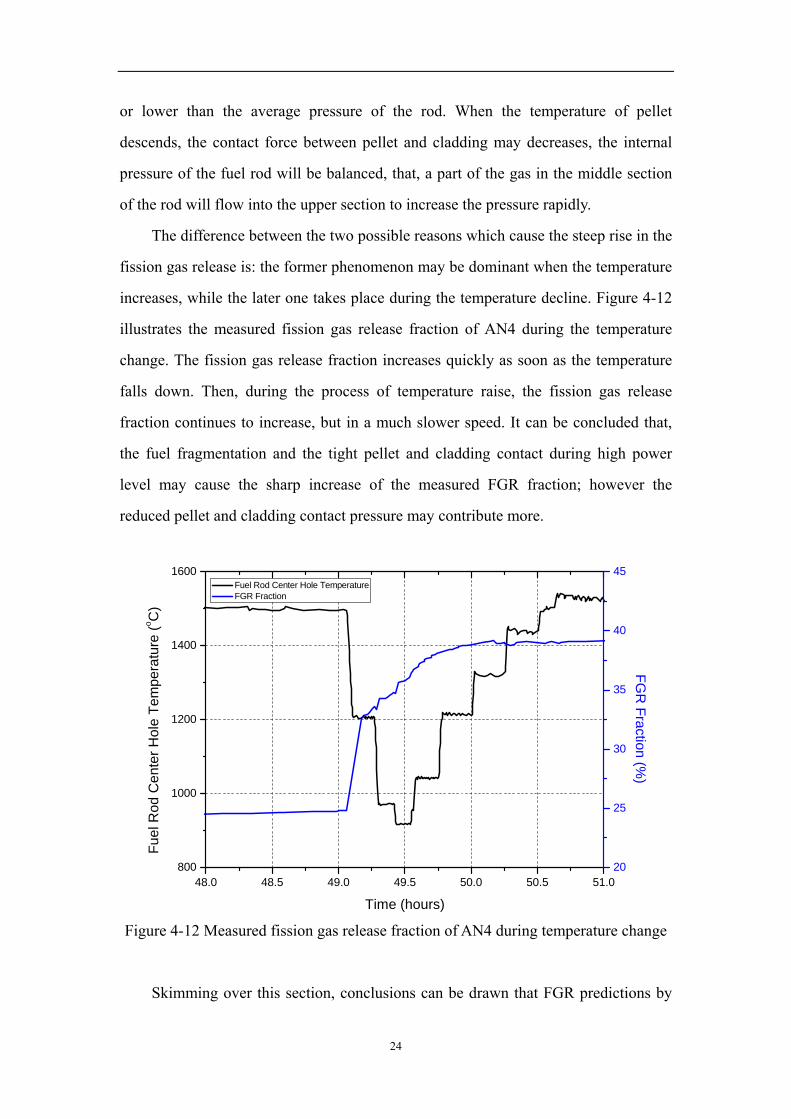
increases, while the later one takes place during the temperature decline. Figure 4-12
illustrates the measured fission gas release fraction of AN4 during the temperature
change. The fission gas release fraction increases quickly as soon as the temperature
falls down. Then, during the process of temperature raise, the fission gas release
fraction continues to increase, but in a much slower speed. It can be concluded that,
the fuel fragmentation and the tight pellet and cladding contact during high power
level may cause the sharp increase of the measured FGR fraction; however the
reduced pellet and cladding contact pressure may contribute more.
48.0 48.5 49.0 49.5 50.0 50.5 51.0800
1000
1200
1400
1600 Fuel Rod Center Hole Temperature FGR Fraction
Time (hours)
Fuel
Rod
Cen
ter H
ole
Tem
pera
ture
(o C)
20
25
30
35
40
45
FGR
Fraction (%)
Figure 4-12 Measured fission gas release fraction of AN4 during temperature change
Skimming over this section, conclusions can be drawn that FGR predictions by

25
COPERNIC only consider the contributions of Xe and Kr, regardless of the influence
of the initial fill gas. In addition, with the limited predicting capacity, real-time
tracking cannot be carried out on abrupt changes of FGR during ramp tests by
COPERNIC, improvement may be necessary to some relevant models taking into
account the gas block effect of pellet and cladding contact and the fission gas release
caused by pellet fragmentation.
26
5. CONCLUSIONS
The feasibility of the COPERNIC code for predicting fuel rod performance
during ramp conditions has been assessed. In the investigation, the tested rods are
base irradiated to high burn-up and then subjected to ramp tests[11][12].The ramp
approach to the bump terminal level (usually around 350-400 W/cm) was mostly
made in small steps to obtain extensive measurement data. The hold time at most of
these steps was several hours. In the process of simulations, several input parameters
are adjusted in accordance with different fuel rod geometric dimensions or power
histories.
To be comprehensive, different FGR models are compared with each other and
tested in the simulations. In order to derive the constituent parameters and to validate
the current FGR models, in-pile measurement data was set available in the
COPERNIC code while attention was paid to models from different versions, and the
parameters used in them are described in the report. With changes of principal model
parameters, the prediction results alter a great deal. By comparison, the COPERNIC
V2.2 model (95% Upper bound) is considered as a more precise one and the
predictions are in good agreement with the experimental data.
According to the results of the research on the real-time tracking capability of
COPERNIC, the measured FGR jumps up rapidly at a certain time which the fuel
power and temperature undergoes noticeable changes. The predicted results are
compared with the measured ones and two possible reasons are proposed to explain
the discrepancies between them. Accordingly, the models are considered to need
improvements on abrupt changes of FGR, at least during ramp tests.
27
REFERENCES
[1] K.Lassmann, A computer programme for the thermal and mechanical analysis of
the fuel rods in a nuclear reactor, Nuclear Engineering and Design, 45 (1978)
325-342.
[2] K.Lassmann, An advanced method for transient temperature calculation in fuel
element structural analysis, Nuclear Technology, 60 (1983) 406-419.
[3] K.Lassmann, TRANSURANUS: a fuel rod analysis code ready for use, Journal
of Nuclear Materials, 188 (1992) 295-302.
[4] K.Lassmann, H.Blank, Modelling of fuel rod behaviour and recent advances of
the TRANSURANUS code, Nuclear Engineering and Design, 106 (1988)
291-313.
[5] D.Lanning, C.Beyer and C.Painter, FRAPCON-3: Modification to fuel rod
material properties and performancer models for high-burnup application,
NUREG/CR-6534, PNNL-11513,1997.
[6] Ch.Garnier, et al., Recent modeling features in the COPERNIC3 AREVA NP fuel
rod performance code, 2006 International meeting on LWR fuel performance,
22-26 October 2006.
[7] M.Suzuki, Light water reactor fuel analysis code FEMAXI-V (ver. 1),
JAERI-Data/Code 2000-030,2000.
[8] Y. Rashid, R.Dunhman and R.Montgomery, FALCON MOD01: Fuel analysis and
licensing code-New, Volume1: Theoretical and numerical bases, ANA-04-0666
Report, EPRI, Palto Alto, CA, and ANATECH Corp., San Diego, CA, 2004.
[9] H.Segura, COPERNIC - FUEL ROD DESIGN CODE USER MANUAL,
FF/DC/01858, FRAMATOME ANP,March 2005.
[10] J.L.Jacoud, Ph.Vesco, Description and qualification of the COPERNIC/
TRANSURANUS (UPDATE OF MAY 2000) FUEL ROD DESIGN CODE,
TF.JC/DC/1556, Rev. A, May 2000.
[11] Seved Djurle, The Super-Ramp Project, STUDSVIK-STSR-32, December 1984
[12] K.R.Merckx, THE THIRD RISØ FISSION GAS PROJECT –

28
CHARACTERIZATION, BASE IRRADIATION HISTORIES AND POOL
INSPECTION REPORTS OF ANF BARRIER CLADDING SEGMENTS,
RISØ-FGP3-ANF,Pt.1, September 1990.
[13] L.C. Bernard, J.l. Jacoud, P. Vesco, An efficient model for the analysis of fission
gas release, Journal of Nuclear Material, 302 (2002) 125-134.


![Jok ~» Anti-Wu u.s. aDd. · A ., -1- 1.'lle Jok ~» Part,y, the Anti-Wu !Aowman~;, an4 a swiftq eroViins U.umbe1' of progl.'essive u.s. poople Gmphatioal]Jr re;Jeov an4 aoorntu113](https://img.pdfslide.net/doc/110x75/5fb85d0bcf270b227550e9d0/jok-anti-wu-us-add-a-1-1lle-jok-party-the-anti-wu-aowman.jpg)