Embed Size (px)
Citation preview

1
Title Page
Title: Altered structural brain asymmetry in autism spectrum disorder: large-scale analysis via
the ENIGMA Consortium
Authors:
Merel C. Postema, MSc1, Daan van Rooij, PhD2, Evdokia Anagnostou, MD3, Celso Arango,
MD, PhD4, Guillaume Auzias, PhD5, Marlene Behrmann, PhD6, Geraldo Busatto Filho, PhD7,
Sara Calderoni, MD,PhD8,35, Rossa Calvo, MD, PhD9, Eileen Daly, PhD10, Christine
Deruelle, PhD11, Adriana Di Martino, PhD12, Ilan Dinstein, PhD13, Fabio Luis S. Duran,
PhD7, Sarah Durston, PhD14, Christine Ecker, PhD15,36, Stefan Ehrlich, MD, PhD 16,37,
Damien Fair, PhD17, Jennifer Fedor, BS18, Xin Feng, MSc34, Jackie Fitzgerald, PhD19,38,
Dorothea L. Floris, PhD2, Christine M. Freitag, PhD15, Louise Gallagher, MD,PhD19,38, David
C. Glahn, PhD20,39, Ilaria Gori, MSc21, Shlomi Haar, PhD22, Liesbeth Hoekstra, MSc2,40, Neda
Jahanshad, PhD23, Neda Jahanshad, PhD24, Maria Jalbrzikowski, PhD19, Joost Janssen, PhD4,
Joseph A. King, PhD16, Luisa L Zaro, MD,PhD25, Jason P. Lerch, PhD26,41, Beatriz Luna,
PhD18, Mauricio M. Martinho, MD27, Jane McGrath, PhD19,38, Sarah E. Medland, PhD28,
Filippo Muratori, PhD8,35, Clodagh M. Murphy, M.R.C.Psych,PhD10, Declan G.M. Murphy,
MD, FRCPsyc29,42, Kirsten O’Hearn, PhD18, Bob Oranje, PhD14, Mara Parellada, MD, PhD4,
Olga Puig, PhD30, Alessandra Retico, PhD21, Pedro Rosa, MD7, Katya Rubia, PhD31, Devon
Shook, PhD14, Margot Taylor, PhD32, Michela Tosetti, PhD8, Gregory L. Wallace, PhD33,
Fengfeng Zhou, PhD34, Paul Thompson, PhD23, Simon E. Fisher, D.Phil1,43, Jan K. Buitelaar,
PhD2, Clyde Francks, D.Phil.1,43*
1 Department of Language & Genetics, Max Planck Institute for Psycholinguistics, Nijmegen, the
Netherlands
.CC-BY-NC-ND 4.0 International licensenot certified by peer review) is the author/funder. It is made available under aThe copyright holder for this preprint (which wasthis version posted March 11, 2019. . https://doi.org/10.1101/570655doi: bioRxiv preprint
2
2 Department of Cognitive Neuroscience, Donders Institute for Brain, Cognition and Behaviour, Donders
Centre for Cognitive Neuroimaging, Radboud University Medical Centre, Nijmegen, The Netherlands
3 Bloorview Research Institute, Holland Bloorview Kids Rehabilitation Hospital and Department of
pediatrics, University of Toronto, Toronto, Canada, USA
4 Child and Adolescent Psychiatry Department, Gregorio Marañón General University Hospital, School of
Medicine, Universidad Complutense, IiSGM, CIBERSAM, Madrid, Spain
5 Institut de Neurosciences de la Timone, UMR 7289, Aix Marseille Université, CNRS, Marseille, France
6 Department of Psychology, Carnegie Mellon University, Pittsburgh, PA, USA
7 Laboratory of Psychiatric Neuroimaging (LIM-21), Departamento e Instituto de Psiquiatria, Hospital das
Clinicas HCFMUSP, Faculdade de Medicina, Universidade de Sao Paulo, Sao Paulo, SP, BR
8 IRCCS Stella Maris Foundation, viale del Tirreno 331, 56128, Pisa, Italy
9 Department of Child and Adolescent Psychiatry and Psychology Hospital Clinic, Barcelona CIBERSAM,
Universitat de Barcelona
10 Department of Forensic and Neurodevelopmental Sciences, Institute of Psychiatry, Psychology &
Neuroscience King's College London, London, UK.
11 Institut de Neurosciences de la Timone, UMR 7289, Aix Marseille Université, CNRS, Marseille, France
12 Institute for Pediatric Neuroscience, NYU Child Study Center, NY, USA
13 Department of Psychology, Ben-Gurion University of the Negev, Beer Sheva, Israel
14 Brain Center Rudolf Magnus, Department of Psychiatry, University Medical Center Utrecht, The
Netherlands
15 Department of Child and Adolescent Psychiatry, Psychosomatics and Psychotherapy, University Hospital,
Goethe University Frankfurt am Main, Frankfurt, Germany
16 Division of Psychological and Social Medicine and Developmental Neurosciences, Faculty of Medicine,
TU Dresden, Germany
17 Department of Behavioral Neuroscience, Oregon Health & Science University, Portland, Oregon, USA
18 Department of Psychiatry, University of Pittsburgh, Pittsburgh, PA, USA
19 Department of Psychiatry, School of Medicine, Trinity College, Dublin, Ireland
20 Department of Psychiatry, Boston Children's Hospital and Harvard Medical School, Boston, MA 02115-
5724, USA
21 National Institute for Nuclear Physics, Pisa Division, Largo B. Pontecorvo 3, 56124, Pisa, Italy
.CC-BY-NC-ND 4.0 International licensenot certified by peer review) is the author/funder. It is made available under aThe copyright holder for this preprint (which wasthis version posted March 11, 2019. . https://doi.org/10.1101/570655doi: bioRxiv preprint
3
22 Department of Bioengineering, Imperial College London, London, United Kingdom
23 University of Sourthern California, Imaging Genetics Center, Mark & Mary Stevens Institution for
Neuroimaging & Informatics
24 Imaging Genetics Center, Mark and Mary Stevens Neuroimaging and Informatics Institute, Keck School of
Medicine of USC, Marina del Rey, CA 90292 USA
25 Department of Child and Adolescent Psychiatry and Psychology Hospital Clinic, Barcelona CIBERSAM,
Universitat de Barcelona, IDIBAPS
26 Neurosciences and Mental Health, The Hospital for Sick Children, Toronto, Canada, USA
27 Department of Neuropsychiatry, Universidade Federal de Santa Maria, Brazil
28 Psychiatric Genetics, QIMR Berghofer Medical Research Institute, Brisbane, Queensland, Australia
29 The Sackler Institute for Translational Neurodevelopment, Institute of Psychiatry, Psychology &
Neuroscience, King's College London, London, UK
30 Department of Child and Adolescent Psychiatry and Psychology Hospital Clinic, Barcelona, 2017SGR881.
CIBERSAM, Spain.
31 Institute of Psychiatry, Psychology and Neuroscience, Kings College London, London, UK
32 Diagnostic Imaging Research, The Hospital for Sick Children, University of Toronto, Canada
33 Department of Speech and Hearing Sciences, The George Washington University, Washington, DC, USA
34 BioKnow Health Informatics Lab, College of Computer Science and Technology, and Key Laboratory of
Symbolic Computation and Knowledge Engineering of Ministry of Education, Jilin University, Changchun,
Jilin, 130012, China.
35 Department of Clinical and Experimental Medicine, University of Pisa, Pisa, Italy
36 Imaging Genetics Center, Mark & Mary Stevens Institution for Neuroimaging & Informatics, University of
Southern California, Marina del Rey, CA, USA
37 Department of Child and Adolescent Psychiatry, Division of Psychological and Social Medicine and
Developmental Neurosciences, Faculty of Medicine, TU Dresden, Germany
38 The Trinity College Institute of Neuroscience, Trinity College, Dublin, Ireland
39 Olin Neuropsychiatric Research Center, Hartford, CT, USA
40 Karakter Child and Adolescent Psychiatry University Centre, Nijmegen, The Netherlands
41 Department of Medical Biophysics, University of Toronto, Toronto, Canada, USA.
.CC-BY-NC-ND 4.0 International licensenot certified by peer review) is the author/funder. It is made available under aThe copyright holder for this preprint (which wasthis version posted March 11, 2019. . https://doi.org/10.1101/570655doi: bioRxiv preprint
4
42 Behavioural Genetics Clinic, Adult Autism Service, Behavioural and Developmental Psychiatry Clinical
Academic Group, South London and Maudsley Foundation NHS Trust, London, UK
43 Donders Institute for Brain, Cognition and Behaviour, Radboud University, Nijmegen, The Netherlands
*Corresponding author:
Clyde Francks, DPhil
Max Planck Institute for Psycholinguistics
Wundtlaan 1, Nijmegen
The Netherlands
+31-24-3521929
Short title: Altered structural brain asymmetry in ASD
Key words: autism, brain asymmetry, brain laterality, mega-analysis, structural imaging,
cortical thickness
Word count abstract: 249
Word count main text: 5,660
Number of figures: 1
Number of tables: 1
Supplemental information: yes
.CC-BY-NC-ND 4.0 International licensenot certified by peer review) is the author/funder. It is made available under aThe copyright holder for this preprint (which wasthis version posted March 11, 2019. . https://doi.org/10.1101/570655doi: bioRxiv preprint
5
Abstract
Background: Left-right asymmetry is an important organizing feature of the healthy brain.
Various studies have reported altered structural brain asymmetry in autism spectrum disorder
(ASD). However, findings have been inconsistent, likely due to limited sample sizes and low
statistical power.
Methods: We investigated 1,774 subjects with ASD and 1,809 controls, from 54 datasets, for
differences in the asymmetry of thickness and surface area of 34 cerebral cortical regions. We
also examined global hemispheric measures of cortical thickness and area asymmetry, and
volumetric asymmetries of subcortical structures. Data were obtained via the ASD Working
Group of the ENIGMA (Enhancing NeuroImaging Genetics through Meta-Analysis)
consortium. T1-weighted MRI data were processed with a single protocol using FreeSurfer and
the Desikan-Killiany atlas.
Results: ASD was significantly associated with reduced leftward asymmetry of total
hemispheric average cortical thickness, compared to controls. Eight regional thickness
asymmetries, distributed over the cortex, also showed significant associations with diagnosis
after correction for multiple comparisons, for which asymmetry was again generally lower in
ASD versus controls. In addition, the medial orbitofrontal surface area was less rightward
asymmetric in ASD than controls, and the putamen volume was more leftward asymmetric in
ASD than controls. The largest effect size had Cohen’s d = 0.15. Most effects did not depend
on age, sex, IQ, or disorder severity.
Conclusion: Altered lateralized neurodevelopment is suggested in ASD, affecting widespread
cortical regions with diverse functions. Large-scale analysis was necessary to reliably detect,
and accurately describe, subtle alterations of structural brain asymmetry in this disorder.
.CC-BY-NC-ND 4.0 International licensenot certified by peer review) is the author/funder. It is made available under aThe copyright holder for this preprint (which wasthis version posted March 11, 2019. . https://doi.org/10.1101/570655doi: bioRxiv preprint
6
Introduction
Autism spectrum disorder (ASD) is an umbrella diagnosis, capturing several previously
separate pervasive developmental disorders with various levels of symptom severity,
including Autistic Disorder, Asperger’s Syndrome, Childhood Disintegrative Disorder, and
Pervasive Developmental Disorder – Not Otherwise Specified (PDD-NOS) (1). According to
the Diagnostic and Statistical Manual of Mental Disorders (DSM) version 5, diagnosis of
ASD requires the presence of at least three symptoms of impaired social communication and
at least two symptoms of repetitive behaviours or restricted interests (1). ASD has a
prevalence of 2-3% in United States children (2).
Characterizing the neurobiology of ASD may eventually lead to improved diagnosis and
clinical subgrouping, and the development of individually targeted treatment programs (3).
While much of the neurobiology of ASD remains unknown, subtle alterations of brain
structure appear to be involved (reviewed by (4, 5)). These include differences in total brain
volume (children with ASD have shown a larger average volume), as well as alterations in the
inferior frontal, superior temporal, and orbitofrontal cortices, and the caudate nucleus.
However, the results of structural MRI studies of ASD have often been inconsistent, due to 1)
small study sample sizes in relation to subtle effects, 2) differences across studies in terms of
clinical characteristics, age, comorbidity and medication use, 3) methodological differences
between studies, such as differences in hardware, software and distinct data processing
pipelines (6), and 4) the etiological and neurobiological heterogeneity of ASD, which exists as
a group of different syndromes rather than a single disease entity (7).
In the ENIGMA (Enhancing Neuro-Imaging Genetics through Meta-Analysis) consortium
(http://enigma.ini.usc.edu), researchers from around the world collaborate to analyse many
separate datasets jointly, and to reduce some of the technical heterogeneity by using
harmonized protocols for MRI data processing. A recent study by the ENIGMA consortium’s
.CC-BY-NC-ND 4.0 International licensenot certified by peer review) is the author/funder. It is made available under aThe copyright holder for this preprint (which wasthis version posted March 11, 2019. . https://doi.org/10.1101/570655doi: bioRxiv preprint
7
ASD working group showed small average differences in bilateral cortical and subcortical
brain measures between 1,571 cases and 1,650 healthy controls, in the largest study of brain
structure in ASD yet performed (8). Relative to controls, ASD patients had significantly lower
volumes of several subcortical structures, as well as greater thickness in various cortical
regions - mostly in the frontal lobes - and lower thickness of temporal regions. No
associations of diagnosis with regional cortical surface areas were found (8).
Left-right asymmetry is an important aspect of human brain organization, which may be
altered in various psychiatric and neurocognitive conditions, including schizophrenia,
dyslexia and ASD (9-11). On a functional level, people with ASD demonstrate reduced
leftward language lateralization more frequently than controls (12-14). Resting state
functional magnetic resonance imaging (MRI) data have also shown a generally rightward
shift of asymmetry involving various functional networks of brain regions (15). In addition,
people with ASD have a higher rate of left-handedness than the general population (14, 16,
17). Furthermore, an electroencephalography study reported that infants at high risk for ASD
showed more rightward than leftward frontal alpha asymmetry at rest (18).
Brain structural imaging studies have also reported altered hemispheric asymmetry in ASD.
Diffusion imaging studies indicated reduced asymmetry of a variety of different white matter
tract metrics (19-21), although in one study males with ASD lacked an age-dependent
decrease in rightward asymmetry of network global efficiency, compared to controls (22). A
structural MRI study investigating grey matter reported lower leftward volume asymmetry of
language-related cortical regions in ASD (i.e., planum temporale, Heschl’s gyrus, posterior
supramarginal gyrus and parietal operculum), as well as greater rightward asymmetry of the
inferior parietal lobule (23). The volume and surface area of the fusiform gyrus also showed
lower rightward asymmetry in ASD (24). However, other studies did not find alterations of
grey matter asymmetries in ASD (21, 25).
.CC-BY-NC-ND 4.0 International licensenot certified by peer review) is the author/funder. It is made available under aThe copyright holder for this preprint (which wasthis version posted March 11, 2019. . https://doi.org/10.1101/570655doi: bioRxiv preprint
8
Prior studies of structural brain asymmetry in ASD had sample sizes less than 128 cases and
127 controls. The previous ENIGMA consortium study of ASD (8) did not perform analyses
of brain asymmetry, but reported bilateral effects only as strong as Cohen’s d = -0.21 (for the
entorhinal thickness bilaterally) (8). Comparable bilateral effect sizes were also found in
ENIGMA consortium studies of other disorders (8, 26-32). If effects on brain asymmetry are
similarly subtle, then prior studies of this aspect of brain structure in ASD were likely
underpowered. Low power not only reduces the chance of detecting true effects, but also the
likelihood that a statistically significant result reflects a true effect (33, 34). Therefore a large
scale analysis was needed to determine whether, and how, structural brain asymmetry might
be altered in ASD, to better describe the neurobiology of the condition.
Here, we made use of MRI data from 54 datasets that were collected across the world by
members of the ENIGMA consortium’s ASD Working Group, to perform the first highly-
powered study of structural brain asymmetry in ASD. Using a single, harmonized protocol for
image analysis, we derived asymmetry indexes, AI= (Left-Right)/(Left+Right), for multiple
brain regional and global hemispheric measures, in up to 1,778 individuals with ASD and
1,829 typically developing controls. The AI is a widely used index in brain asymmetry studies
(35, 36). Regional asymmetry indices that showed significant case-control differences were
tested for age- or sex-specific effects, and also for correlations with IQ or disorder severity,
which serve as key indicators of the clinical heterogeneity in ASD.
Materials and Methods
Datasets
Structural MRI data were available for 57 different datasets (Table S1). Three datasets
comprising either cases only, or controls only, were removed in this study (Table S1), as our
.CC-BY-NC-ND 4.0 International licensenot certified by peer review) is the author/funder. It is made available under aThe copyright holder for this preprint (which wasthis version posted March 11, 2019. . https://doi.org/10.1101/570655doi: bioRxiv preprint
9
analysis model included random intercepts for ‘dataset’ (below), and diagnosis was fully
confounded with dataset for these three. The remaining 54 datasets comprised 1,778 people
with ASD (N = 1,504 males; median age = 13 years; range = 2 to 64 years) and 1,829
typically developing controls (N = 1,400 males; median age = 13 years; range = 2 to 64
years).
Diagnosis was based on clinical assessment according to either DSM version 4 or version 5
criteria (1). In addition, severity measures were available for a majority of cases (see Table
S2), in the form of raw scores according to the Autism Diagnostic Observation Schedule-
Generic (ADOS), a standardized instrument commonly used in autism diagnosis (37). Cases
from the entire ASD spectrum were included, but most cases did not have an intellectual
disability (cases: mean IQ = 104, SD = 19, min = 34, max = 149; controls: mean IQ = 112,
SD = 15, min = 31, max = 149) (see Figure S1C for the distribution plots). The
presence/absence of comorbid conditions had been recorded for 519 of the cases, but only 54
cases showed at least one comorbid condition (which could be attention-deficit hyperactivity
disorder (ADHD), obsessive compulsive disorder (OCD), depression, anxiety, and/or
Tourette’s syndrome (8)).
Structural magnetic resonance imaging
Structural T1-weighted brain MRI scans were acquired at each study site. As shown in
Supplementary Table S1, images were acquired using different field strengths (1.5 T or 3 T)
and scanner types. Each site used harmonized protocols from the ENIGMA consortium
(http://enigma.ini.usc.edu/protocols/imaging-protocols) for data processing and quality
control. The data used in the current study were thickness and surface area measures for each
of 34 bilaterally paired cortical regions, the latter as defined with the Desikan-Killiany atlas
(38), as well as the average cortical thickness and total surface area per entire hemisphere. In
addition, left and right volumes of seven bilaterally paired subcortical structures, plus the
.CC-BY-NC-ND 4.0 International licensenot certified by peer review) is the author/funder. It is made available under aThe copyright holder for this preprint (which wasthis version posted March 11, 2019. . https://doi.org/10.1101/570655doi: bioRxiv preprint

10
lateral ventricles, were analyzed. Cortical parcellations and subcortical segmentations were
performed with the freely available and validated software FreeSurfer (versions 5.1 or 5.3)
(39), using the default ‘recon-all’ pipeline. Parcellations of cortical grey matter regions were
visually inspected following the standardized ENIGMA quality control protocol
(http://enigma.ini.usc.edu/protocols/imaging-protocols). Exclusions on the basis of this
quality control resulted in the sample sizes mentioned above (see Datasets).
Two of the datasets (i.e., FSM and MYAD) included participants as young as 1.5 years of age.
As segmentation of very young brains might be especially challenging for the FreeSurfer
algorithms, we repeated our main analysis (below) excluding these datasets, to check that they
did not impact the findings substantially (although they had passed the same quality control
procedures as all other datasets).
Asymmetry measures
Left (L) and right (R) data for each structural measure and individual subject were loaded into
R (version 3.3.3). For each L and R measure separately, outliers were defined per group
(cases/controls) and per dataset as those values above and below 1.5 times the interquartile
range, and were excluded. There were 159 to 464 outliers removed, depending on the specific
measure. An asymmetry index (AI) was calculated for each subject and each paired L and R
measure using the following formula: (𝐿 − 𝑅)/(𝐿 + 𝑅). Outliers were removed for each AI,
following the same criteria as above (37 to 155 per AI). Primary analysis in this study was
based on AIs, but post hoc analyses were also performed using the separate L and R measures
for some regions(see below). To ensure that the identical set of subjects was used for analyses
based on AI, L and R data, all values that were missing in the AI data were also removed from
the L and R data. Distributions of each of the AIs after outlier removal are plotted in Figure
S2.
.CC-BY-NC-ND 4.0 International licensenot certified by peer review) is the author/funder. It is made available under aThe copyright holder for this preprint (which wasthis version posted March 11, 2019. . https://doi.org/10.1101/570655doi: bioRxiv preprint
11
We removed outliers separately for each AI because analyses were performed separately per
AI (see below), and each AI needed to behave in a robust way in the linear model used.
However, we also repeated the main analyses without removing any outliers from the L, R or
AI measures, to confirm that the results were not overly dependent on outlier removal.
Linear mixed effects model mega-analysis
Model
Linear mixed effects models were fitted separately for each cortical regional surface and
thickness AI, as well as the total hemispheric surface area and mean thickness AI, and the
subcortical volume AIs. This was accomplished by means of mega-analysis incorporating
data from all 54 datasets, using the nlme package in R (40). All models included the same
fixed- and random effects, and had the following formulation:
𝐴𝐼 = 𝑑𝑖𝑎𝑔𝑛𝑜𝑠𝑖𝑠 + 𝑎𝑔𝑒 + 𝑠𝑒𝑥 + 𝑟𝑎𝑛𝑑𝑜𝑚 (= 𝑑𝑎𝑡𝑎𝑠𝑒𝑡)
where 𝐴𝐼 reflects the AI of a given brain structure, and 𝐷𝑖𝑎𝑔𝑛𝑜𝑠𝑖𝑠 (‘controls’ (= reference),
‘ASD’), 𝑠𝑒𝑥 (‘males’ (= reference), ‘females’) and 𝑑𝑎𝑡𝑎𝑠𝑒𝑡 were coded as factor variables,
with dataset having 54 different categories. 𝐴𝑔𝑒 was coded as a numeric variable.
The Maximum Likelihood (ML) method was used to fit the models. Subjects were omitted if
data were missing for any of the predictor variables (method = na.omit). The ggplot2 package
in R was used to visualize residuals (Figures S3-S5). Collinearity of predictor variables was
assessed using the usdm pacakge in R (version 3.3.3.).
The relationships between AIs and age showed no overt non-linearity (Figures S6-S8), so no
polynomials for age were incorporated in the models for primary analysis. However, analyses
were repeated using an additional non-linear term for age, to check whether this choice had
affected the results. As Age and Age2 are highly correlated, we made use of the poly()-
function in R for these two predictors, which created a pair of uncorrelated variables to model
.CC-BY-NC-ND 4.0 International licensenot certified by peer review) is the author/funder. It is made available under aThe copyright holder for this preprint (which wasthis version posted March 11, 2019. . https://doi.org/10.1101/570655doi: bioRxiv preprint
12
age effects (so-called orthogonal polynomials) (41), where one variable was linear and one
non-linear.
Significance
Significance was assessed based on the P-values for the effects of 𝑑𝑖𝑎𝑔𝑛𝑜𝑠𝑖𝑠 on AIs. The
False Discovery Rate (FDR) (42) was estimated separately for the 35 cortical surface area AIs
(i.e., 34 regional AIs and one hemispheric total AI) and the 35 cortical thickness AIs, and
again for the seven subcortical structures plus lateral ventricles, each time with a FDR
threshold of 0.05. Correlations between AI measures were calculated using Pearson’s R and
visualized using the “corrplot” package in R (Figures S9-S11). Most pairwise correlations
between AIs were low, with only 21 pairwise correlations either lower than -0.3 or greater
than 0.3, with a minimum R = -0.362 between the caudal anterior cingulate surface area AI
and superior frontal surface area AI, and maximum R = 0.471 between the rostral middle
frontal thickness AI and superior frontal thickness AI.
Cohen’s d effect sizes
The t-statistic for the factor ‘diagnosis’ in each linear mixed effects model was used to
calculate Cohen’s d, with
𝑑 =t ∗ (n1 + n2)
√(𝑛1 ∗ 𝑛2) ∗ √𝑑𝑓
where 𝑛1 and 𝑛2 are the number of cases and controls, and 𝑑𝑓 the degrees of freedom.
The latter was derived from the lme summary table in R, but can also be calculated using
𝑑𝑓 = 𝑜𝑏𝑠 − (𝑛1 + 𝑛2), where 𝑜𝑏𝑠 equals the number of observations, 𝑛1 the number of
groups and 𝑛2 the number of factors in the model.
The 95% confidence intervals for Cohen's d were calculated using 95% 𝐶𝐼 = 𝑑 ± 1.96 ∗
𝑆𝐸, with the standard error (SE) around Cohen's d calculated according to:
.CC-BY-NC-ND 4.0 International licensenot certified by peer review) is the author/funder. It is made available under aThe copyright holder for this preprint (which wasthis version posted March 11, 2019. . https://doi.org/10.1101/570655doi: bioRxiv preprint
13
𝑆𝐸 = √𝑛1 + 𝑛2
𝑛1 ∗ 𝑛2+
𝑑2
2 ∗ (𝑛1 + 𝑛2 − 2)
For visualization of cerebral cortical results, Cohen’s d values were loaded into Matlab
(version R2016a), and 3D images of left hemisphere inflated cortical and subcortical
structures were obtained using FreeSurfer-derived ply files.
Power analyses
As each linear model included multiple predictor variables, the power to detect an effect of
diagnosis on AI could not be computed exactly, but we obtained an indication of the effect
size that would be needed to provide 80% power, had we been using simple t-tests and
Bonferroni correction for multiple testing, using the ‘pwr’ command in R. For this purpose, a
significance level of 0.0014 (i.e. 0.05/35) was set in the context of multiple testing over the
regional and total cortical surface area AIs (N = 35) or thickness AIs (N = 35), and 0.00625
(i.e., 0.05/8) for seven subcortical volume plus lateral ventricle AIs (N = 8). This showed that
a difference of roughly Cohen’s d = 0.13 would be detectable with 80% power in the cortical
analyses, and Cohen’s d = 0.12 in the subcortical analyses.
Directions of asymmetry changes
For any AIs showing significant effects of diagnosis in the main analysis, linear mixed effects
modelling was also performed on the corresponding L and R measures separately, to
understand the unilateral changes involved. The models included the same terms as were used
in the main analysis of AIs (i.e., diagnosis, age and sex as fixed factors, and dataset as
random factor). Again, the Cohen’s d effect sizes for diagnosis were calculated based on the t-
statistics. The raw mean AI values were calculated separately in controls and cases, to
describe the reference direction of healthy asymmetry in controls, and whether cases showed
reduced, increased, or reversed asymmetry relative to controls.
.CC-BY-NC-ND 4.0 International licensenot certified by peer review) is the author/funder. It is made available under aThe copyright holder for this preprint (which wasthis version posted March 11, 2019. . https://doi.org/10.1101/570655doi: bioRxiv preprint
14
Age- or sex-specific effects
For any AIs having significant effects of diagnosis in the primary analysis, post hoc analyses
were performed including 𝑎𝑔𝑒 ∗ 𝑑𝑖𝑎𝑔𝑛𝑜𝑠𝑖𝑠 and 𝑠𝑒𝑥 ∗ 𝑑𝑖𝑎𝑔𝑛𝑜𝑠𝑖𝑠 interaction terms, in
separate models. For this purpose, age was coded as a binary factor variable (children < 18y
and adults ≥ 18 y) (i.e., using the same criteria as van Rooij et al. 2018). Thus the models
were as follows: 𝐴𝐼 = 𝑑𝑖𝑎𝑔𝑛𝑜𝑠𝑖𝑠 + 𝑓𝑎𝑐𝑡𝑜𝑟(𝑎𝑔𝑒) + 𝑠𝑒𝑥 + 𝑓𝑎𝑐𝑡𝑜𝑟(𝑎𝑔𝑒) ∗ 𝑑𝑖𝑎𝑔 +
𝑟𝑎𝑛𝑑𝑜𝑚 (= 𝑑𝑎𝑡𝑎𝑠𝑒𝑡), and 𝐴𝐼 = 𝑑𝑖𝑎𝑔𝑛𝑜𝑠𝑖𝑠 + 𝑎𝑔𝑒 + 𝑠𝑒𝑥 + 𝑠𝑒𝑥 ∗ 𝑑𝑖𝑎𝑔 + 𝑟𝑎𝑛𝑑𝑜𝑚 (=
𝑑𝑎𝑡𝑎𝑠𝑒𝑡).
Where we identified an age:diagnosis interaction with P < 0.05 (uncorrected), we separated
the data for the relevant AI into two subsets by age (i.e. children, adults), and tested the
following model within each subset separately: 𝐴𝐼 = 𝑑𝑖𝑎𝑔𝑛𝑜𝑠𝑖𝑠 + 𝑠𝑒𝑥 + 𝑟𝑎𝑛𝑑𝑜𝑚 (=
𝑑𝑎𝑡𝑎𝑠𝑒𝑡), to better understand the relation of diagnosis to AI. Likewise, if a sex:diagnosis
interaction was found, then a model was fitted separately within each sex, such that 𝐴𝐼 =
𝑑𝑖𝑎𝑔𝑛𝑜𝑠𝑖𝑠 + 𝑎𝑔𝑒 + 𝑟𝑎𝑛𝑑𝑜𝑚 (= 𝑑𝑎𝑡𝑎𝑠𝑒𝑡).
Case-only analysis of IQ
For each AI showing a significant effect of diagnosis in the main analysis, a within-case-only
analysis was performed, whereby IQ (as a continuous variable) was considered as a predictor
variable for the AI, so that 𝐴𝐼 = 𝐼𝑄 + 𝑎𝑔𝑒 + 𝑠𝑒𝑥 + 𝑟𝑎𝑛𝑑𝑜𝑚 (= 𝑑𝑎𝑡𝑎𝑠𝑒𝑡). This was
done to understand whether asymmetry changes were a feature of high or low IQ, or occurred
regardless of IQ.
Autism Diagnostic Observation Schedule (ADOS) severity score
Likewise, for each AI showing a significant effect of diagnosis in the main analysis, a within-
case-only analysis was performed incorporating symptom severity based on ADOS score as a
predictor variable for AI: 𝐴𝐼 = 𝐴𝐷𝑂𝑆 + 𝑎𝑔𝑒 + 𝑠𝑒𝑥 + 𝑟𝑎𝑛𝑑𝑜𝑚 (= 𝑑𝑎𝑡𝑎𝑠𝑒𝑡). This was
.CC-BY-NC-ND 4.0 International licensenot certified by peer review) is the author/funder. It is made available under aThe copyright holder for this preprint (which wasthis version posted March 11, 2019. . https://doi.org/10.1101/570655doi: bioRxiv preprint
15
to understand whether the observed asymmetry changes in cases were dependent on ASD
severity.
ADOS scores were first normalized using the R package ‘bestNormalize’, which selected the
optimal transformation method, based on the lowest Pearson P test statistic for normality,
among the Yeo-Johnson, exp(x), log10, square-root, arcsinh and orderNorm transformations
(https://github.com/petersonR/bestNormalize). The orderNorm transformation was selected,
which performs ordered quantile normalizing (i.e. ranked normalization) using the following
formula:
𝑔(𝑥) = ɸ−1 (𝑟𝑎𝑛𝑘(𝑥)
𝑙𝑒𝑛𝑔𝑡ℎ(𝑥) + 1)
- where ɸ refers to the standard normal cumulative distribution function, 𝑟𝑎𝑛𝑘(𝑥) to the rank
of each observation, and 𝑙𝑒𝑛𝑔𝑡ℎ(𝑥) to the number of observations.
Results
Main analyses
Significant associations of ASD with brain asymmetry
Out of a total of 78 structural AIs that were investigated (Tables S3-S5), 11 showed a
significant effect of diagnosis which survived multiple testing correction (Table 1). Among
these were the total hemispheric average thickness AI (β =-0.0007, t = -2.6, P = 0.0082)
(Table 1, Table S3), as well as eight regional cortical thickness AIs, including frontal regions
(superior frontal, rostral middle frontal, medial orbitofrontal), temporal regions (fusiform,
inferior temporal, superior temporal), and cingulate regions (rostral anterior, isthmus
cingulate). One cortical regional surface area AI, namely of the medial orbitofrontal cortex,
was significantly associated with diagnosis (β = 0.008, t = 4.2, P = 0.00003) (Table 1, Table
.CC-BY-NC-ND 4.0 International licensenot certified by peer review) is the author/funder. It is made available under aThe copyright holder for this preprint (which wasthis version posted March 11, 2019. . https://doi.org/10.1101/570655doi: bioRxiv preprint
16
S4), and one subcortical volume AI, namely that of the putamen (β = 0.0036, t = 3.6, P =
0.00028) (Table 1, Table S5).
Nominally significant effects of diagnosis on AIs (i.e., with P < 0.05, but which did not
survive multiple comparison correction), were observed for the inferior parietal thickness AI
(β = -0.0017, t = -2.4, P = 0.015) (Table S3), the fusiform surface area AI (β = -0.0040, t = -
2.4, P = 0.016), precentral surface area AI (β = -0.0031, t = -2.5, P = 0.011), lateral
orbitofrontal surface area AI (β = -0.0035, t = -2.5, P = 0.012), and the pars orbitalis surface
area AI (β = 0.0044, t = 2.2, P = 0.025)(Table S4),
When we repeated the analysis without excluding outliers, 7 out of the 11 previously
significant AIs remained significant after FDR correction (AIs of the total average thickness,
isthmus cingulate thickness, superior temporal thickness and medial orbitofrontal surface area
did not survive multiple testing correction (Table S6)). When we repeated the analysis
including a non-linear effect for age, all of the 11 AIs that had shown significant effects of
diagnosis in the main analysis remained significant (Table S6). Finally, when we excluded
the two youngest datasets (i.e., FSM and MYAD) that may have been more difficult for
FreeSurfer to segment, all AIs that had shown significant effects of diagnosis in the main
analysis remained significant, except for the superior temporal thickness AI (Table S6).
Magnitudes and directions of asymmetry changes
Cohen’s d effect sizes of the associations between AIs and diagnosis are visualized per region
in Figure 1, as derived from the main analysis. Effect sizes were small, ranging from -0.16
(superior frontal thickness AI) to 0.15 (medial orbitofrontal surface area AI) (Table 1, Tables
S3-S5).
The raw mean AIs in ASD individuals and controls are listed in Table S7. There was reduced
leftward asymmetry in total hemispheric average cortical thickness (d = -0.094) (Table 1,
.CC-BY-NC-ND 4.0 International licensenot certified by peer review) is the author/funder. It is made available under aThe copyright holder for this preprint (which wasthis version posted March 11, 2019. . https://doi.org/10.1101/570655doi: bioRxiv preprint
17
Figure 1) in ASD compared to controls, driven by a larger decrease in left (d=-0.148) than
right (d=-0.111) thickness (Table S7) in ASD. The difference in superior temporal thickness
asymmetry was also driven by a larger decrease on the left (d = -0.130) than on the right (d =
-0.065) in cases (Table S7), resulting in an increased rightward AI in ASD (d = -0.090)
(Table 1, Figure 1A).
Four regions showed reduced left-side thickness together with increased right-side thickness
in ASD, leading to decreased leftward asymmetry. These were the isthmus cingulate (AI d = -
0.12, left d = -0.027, right d=0.091), rostral anterior cingulate (AI d = -0.140, left d = -0.128,
right d= 0.018), rostral middle frontal (AI d = -0.142, left d = -0.018, right d = 0.061), and
superior frontal (AI d = -0.160, left d = -0.069, right 0.018) (Table 1, Table S7, Figure 1A).
Two regions showed a smaller reduction in left than right sided thickness in ASD, resulting in
reduced rightward asymmetry. These were the fusiform (AI d = 0.141, left d = -0.201, right
d= -0.285) and inferior temporal cortex (AI d = 0.114, left d = -0.143, right d= -0.218) (Table
1, Table S7, Figure 1A).
The thickness of the right medial orbitofrontal cortex was increased in ASD, while being
virtually unchanged on the left, resulting in a reversal in thickness asymmetry from leftward
in controls to rightward in ASD (AI d = -0.135, left d = 0.014, right d = 0.121) (Table 1,
Table S7, Figure 1A). Similarly, surface area asymmetry of this region was significantly
associated with diagnosis, whereby the ASD group had reduced rightward asymmetry, driven
by an increase in left area and a decrease in right area (AI d = 0.15, left d = 0.094, right d = -
0.019) (Table 1, Table S7, Figure 1B).
Notably, all significant changes in cortical thickness asymmetry, with the exception of the
superior temporal cortex, involved a decrease in the magnitude of asymmetry in ASD
compared to controls (Table S7), whether it was reduced leftward, reduced rightward, or
reversed asymmetry.
.CC-BY-NC-ND 4.0 International licensenot certified by peer review) is the author/funder. It is made available under aThe copyright holder for this preprint (which wasthis version posted March 11, 2019. . https://doi.org/10.1101/570655doi: bioRxiv preprint
18
For the putamen, cases showed an increased leftward volume asymmetry compared to
controls (d=0.130) (Table 1, Figure 1C), driven by a larger decrease in right volume (d = -
0.084) than left volume (d = -0.022) in ASD (Table S7).
Age- and sex-limited effects
The distributions of age and sex across all datasets are plotted in Figure S1A,B. None of the
11 AIs with significant case-control differences in the main analysis were associated with a
significant age by diagnosis interaction effect (Table S8). A putative sex by diagnosis
interaction was observed for the rostral anterior cingulate thickness AI (psex*diag = 0.00114)
(Table S8). The AI for this regional thickness was associated with diagnosis in males (p = 9 x
10-7) but not females (p = 0.22) (Table S8).
Analysis of IQ within cases
The distribution of IQ within the ASD group is shown in Figure S1C. Out of the 11 AIs which
showed significant case-control differences in the main analysis, only one showed an
association with IQ (uncorrected P < 0.05), which was the rostral anterior cingulate thickness
AI (β = 0.00024, t = 3.3, p = 0.0009) (Table S9). The positive direction of this effect indicates
that primarily cases with lower IQ show reduced leftward asymmetry of this regional
thickness.
ADOS severity scores
The distribution of ADOS severity scores is plotted in Figure S1D.
Out of the 11 AIs showing significant case-control differences in the main analysis, only the
isthmus cingulate thickness AI showed a significant association with the ADOS severity score
(β =0.0041, t = 2.6, p = 0.011) (Table S2). The positive direction of the effect suggests that
primarily cases with low ASD severity have reduced leftward asymmetry of this regional
thickness.
.CC-BY-NC-ND 4.0 International licensenot certified by peer review) is the author/funder. It is made available under aThe copyright holder for this preprint (which wasthis version posted March 11, 2019. . https://doi.org/10.1101/570655doi: bioRxiv preprint
19
Discussion
In this, the largest study to date of brain asymmetry in ASD, we mapped differences in brain
asymmetry between participants with ASD and typically developing controls, in a collection
of 54 international datasets via the ENIGMA Consortium. We had 80% statistical power to
detect Cohen’s d effect sizes in the range of 0.12 to 0.13. We found an overall decrease in
leftward asymmetry of total average cortical thickness, that is to say, considered at a
hemispheric level over all cortical regions in autistic individuals. Several specific regional
thickness asymmetries - located broadly over the cortex - were also significantly altered in
ASD. These included frontal, temporal and cingulate regions. The magnitude of all regional
thickness asymmetries, with the exception of the superior temporal cortex, was decreased in
ASD compared to controls, whether it was reduced leftward, reduced rightward, or reversed
average asymmetry. Rightward asymmetry of the medial orbitofrontal surface area was also
decreased in cases. In addition, cases showed an increase in leftward asymmetry of putamen
volume, compared to controls.
Previous MRI studies of cerebral cortical asymmetries in ASD, based on much smaller
datasets, and using diverse methods for image analysis, suggested variable differences (23,
24), or no differences (21, 25). Our findings partly support a previously reported, generalized
reduction of leftward asymmetry (23), as most of the significantly altered regional
asymmetries involved right-side thickness increases accompanied by left-side decreases, or
else larger left-side than right-side decreases. However, two of the nine significantly altered
regional thickness asymmetries in our analysis involved shifts leftwards in ASD, driven by
more prominent right- than left-side decreases, i.e., the fusiform and inferior temporal cortex.
.CC-BY-NC-ND 4.0 International licensenot certified by peer review) is the author/funder. It is made available under aThe copyright holder for this preprint (which wasthis version posted March 11, 2019. . https://doi.org/10.1101/570655doi: bioRxiv preprint
20
Thus the directional change of thickness asymmetry can depend on the specific region, albeit
that the overall magnitude of thickness asymmetry is most likely to be reduced in ASD.
The significant associations of diagnosis with asymmetry in the present study were all weak
(Cohen’s d -0.16 to 0.15), indicating that altered structural brain asymmetry is unlikely to be a
useful predictor for ASD. Prior studies using smaller samples were underpowered in this
context. However, the effect sizes were comparable to those reported by recent, large-scale
studies of bilateral disorder-related changes in brain structure, in which asymmetry was not
studied, including for ASD (8) as well as ADHD (32), schizophrenia (31), OCD (26, 27),
posttraumatic stress disorder (28), and major depressive disorder (29, 30). It has become
increasingly clear that anatomical differences between ASD and control groups are very small
relative to the large within-group variability that is observed (43).
Our findings may inform understanding of the neurobiology of ASD. Multi-regional reduction
of cortical thickness asymmetry in ASD fits with the concept that laterality is an important
organizing feature of the healthy human brain for multiple aspects of complex cognition, and
is susceptible to disruption in disorders (e.g. (10, 44)). Left-right asymmetry facilitates the
development of localized and specialized modules in the brain, which can then have dominant
control of behaviour (45, 46). Notably, many of the cortical regions highlighted here are
involved in diverse social cognitive processes, including sensory processing (fusiform and
superior temporal gyri), cognitive and emotional control (anterior cingulate) and reward
evaluation (orbitofrontal cortex, ventral striatum) (47). However, the roles of these brain
structures are by no means restricted to social behaviour. As we found altered asymmetry of
various additional regions, our findings suggest broader disruption of lateralized
neurodevelopment as part of the ASD phenotype.
The medial orbitofrontal cortex was the only region that showed significantly altered
asymmetry of both thickness and surface area in ASD, suggesting that disrupted laterality of
.CC-BY-NC-ND 4.0 International licensenot certified by peer review) is the author/funder. It is made available under aThe copyright holder for this preprint (which wasthis version posted March 11, 2019. . https://doi.org/10.1101/570655doi: bioRxiv preprint
21
this region might be particularly important in ASD. The orbitofrontal cortex may be involved
in repetitive and stereotyped behaviours in ASD, due to its roles in executive functions (48).
Prior studies have reported lower cortical thickness in the left medial orbitofrontal gyrus in
ASD (49), altered patterning of gyri and sulci in the right orbitofrontal cortex (50), and altered
asymmetry in frontal regions globally (19, 25). These studies were in much smaller sample
sizes than used here.
As regards the fusiform cortex, a previous study reported an association between higher ASD
symptom severity and increased rightward grey matter volume asymmetry (24). We found
lower rather than higher rightward thickness asymmetry in ASD in this region The fusiform
gyrus is involved in facial memory among other functions, which is important for social
interactions (51).
The altered volume asymmetry of the putamen in cases may be related to its role in repetitive
and restricted behaviours in ASD. One study reported that differences in striatal growth
trajectories were correlated with circumscribed interests and insistence on sameness (52). The
striatum is connected with lateral and orbitofrontal regions of the cortex via lateral-frontal-
striatal reward circuitry, and this circuitry might be dysfunctional in ASD (53). For example,
boys with ASD (and also boys with OCD), exhibited decreased activation of the ventral
striatum and lateral inferior/orbitofrontal cortex during outcome anticipation compared with
typically developing controls (53).
Although the reasons for asymmetrical alterations in many of the structures implicated here
are unclear, our findings suggest altered neurodevelopment affecting these structures in ASD.
Further research is necessary to clarify the functional relevance and relationships between
altered asymmetry and autism spectrum disorder. The findings we report in this large-scale
study did sometimes not concur with prior, smaller studies. This may be due to limited
statistical power in the earlier studies, which may have resulted in false positive findings.
.CC-BY-NC-ND 4.0 International licensenot certified by peer review) is the author/funder. It is made available under aThe copyright holder for this preprint (which wasthis version posted March 11, 2019. . https://doi.org/10.1101/570655doi: bioRxiv preprint
22
However, the cortical atlas that we used did not have perfect equivalents for regions defined
in many of the earlier studies, and we did not consider gyral/sulcal patterns, or grey matter
volumes as such. Rather, we studied regional cortical thickness and surface areas as distinct
measures, which together drive grey matter volumetric measures, but have been shown to
vary relatively independently (54). As such, separate analyses are well motivated.
Furthermore, discrepancies with earlier studies may be related to age differences, and
differences in clinical features of the disorder arising from case recruitment and diagnosis. We
included subjects from the entire ASD severity spectrum, with a broad range of ages, IQs, and
of both sexes.
Interestingly, post hoc analysis of asymmetries that had shown significant case-control effects
in the main analysis, showed that the effects were not influenced by age (Table S8). Thus
altered asymmetry in ASD appears to have an early neurodevelopmental onset and then
remain stable. Only one effect of diagnosis on regional asymmetry was influenced by sex, i.e.
the rostral anterior cingulate thickness asymmetry, which was altered in males but not
females. This same regional asymmetry was primarily altered in lower versus higher IQ cases.
This may therefore be an alteration of cortical asymmetry that is relatively specific to an ASD
subgroup, i.e., lower-performing males. As regards symptom severity, thickness asymmetry
of the isthmus of the cingulate was associated with the ADOS score, such that the lower
severity cases tended to have the most altered asymmetry. However, these post hoc findings
remain tentative in the context of multiple testing, and are reported here for descriptive
purposes only.
There were additional data available on handedness, medication use and comorbidities for
some datasets, but not all. We did not investigate possible associations of these variables with
asymmetries, due to the reduced sample size and increased multiple testing. As mentioned
above, data on comorbidities were only available for 54 of the ASD subjects, precluding a
.CC-BY-NC-ND 4.0 International licensenot certified by peer review) is the author/funder. It is made available under aThe copyright holder for this preprint (which wasthis version posted March 11, 2019. . https://doi.org/10.1101/570655doi: bioRxiv preprint
23
high-powered analysis of this issue. Handedness had no significant effect on the same brain
asymmetry measures as analyzed here, in a separate study of healthy individuals comprising
more than 15,000 participants (55, 56). The previous ENIGMA study from the ASD working
group did not detect effects of medication use on bilateral brain changes in ASD (8).
In contrast to some prior studies of ASD, we did not adjust for IQ as a covariate effect in our
main, case-control analysis. Rather we carried out post hoc analysis, within cases only, of
possible associations between IQ and brain asymmetries. This was because lower average IQ
was clearly part of the ASD phenotype in our total combined dataset (Figure S1C), so that
including IQ as a confounding factor in case-control analysis might have reduced the power to
detect an association of diagnosis with asymmetry. This would occur if underlying
susceptibility factors contribute both to altered asymmetry and reduced IQ, as part of the ASD
phenotype.
The Desikan atlas (38) was derived from manual segmentations of sets of reference brain
images. Accordingly, the mean regional asymmetries in our samples partly reflect left-right
differences present in the reference dataset used to construct the atlas. For detecting cerebral
asymmetries with automated methods, some groups have chosen to work from artificially
created, left-right symmetrical atlases, e.g. (57). However, our study was focused on
comparing relative asymmetry between groups. The use of a ‘real-world’ asymmetrical atlas
had the advantage that regional identification was likely to be more accurate for structures
that are asymmetrical both in the atlas and, on average, in our datasets. By defining the
regions of interest in each hemisphere based on each hemisphere’s own particular features,
such as its sulcal and gyral geometry, we could then obtain the corresponding relationships
between hemispheres. To this end, we used data from the automated labeling program within
FreeSurfer for subdividing the human cerebral cortex. The labeling system incorporates
hemisphere-specific information on sulcal and gyral geometry with spatial information
.CC-BY-NC-ND 4.0 International licensenot certified by peer review) is the author/funder. It is made available under aThe copyright holder for this preprint (which wasthis version posted March 11, 2019. . https://doi.org/10.1101/570655doi: bioRxiv preprint
24
regarding the locations of brain structures, and shows a high accuracy when compared to
manual labeling results (38). Thus, reliable measures of each region can be extracted for each
subject, and regional asymmetries then accurately assessed.
Although a single image analysis pipeline was applied to all datasets, heterogeneity of
imaging protocols was a limitation of this study. There were substantial differences between
datasets in the average asymmetry measured for some regions, which may be due in part to
different scanner characteristics, as well as differences in patient profiles. Although we
corrected for dataset as a random effect, the between-centre variability may have resulted in
reduced statistical power relative to an equally sized single-centre study. However, no single
centre has been able to collect such large samples alone. In addition, multi-centre studies may
better represent real-world heterogeneity, with more generalizable findings than single-centre
studies (58)
The cross-sectional design limits our capacity to make causal inferences between diagnosis
and asymmetry. ASD is highly heritable, with meta-analytic heritability estimates ranging
from 64% to 91% (59). Likewise, some of the brain asymmetry measures examined here have
heritabilities as high as roughly 25% (55, 56). Future studies are required to investigate shared
genetic contributions to ASD and variation in brain structural asymmetry. These could help to
disentangle cause-effect relations between ASD and brain structural asymmetry. Given the
high comorbidity of ASD with other disorders, such as ADHD, OCD, and schizophrenia (60),
cross-disorder analyses incorporating between-disorder genetic correlations may be
informative.
In conclusion, large-scale analysis of brain asymmetry in ASD revealed primarily cortical
thickness effects, which were significant but small. Our study illustrates how high-powered
and systematic studies can yield much needed clarity in human clinical neuroscience, where
prior smaller and methodologically diverse studies were inconclusive.
.CC-BY-NC-ND 4.0 International licensenot certified by peer review) is the author/funder. It is made available under aThe copyright holder for this preprint (which wasthis version posted March 11, 2019. . https://doi.org/10.1101/570655doi: bioRxiv preprint
25
Acknowledgements
We thank the participants of all studies who have contributed data to the ENIGMA-ASD
working group (http://enigma.ini.usc.edu/ongoing/enigma-asd-working-group/) (8). This
research was funded by the Max Planck Society (Germany). This study was further supported
by the ENIGMA Center for Worldwide Medicine, Imaging & Genomics grant (NIH U54
EB020403) to Paul Thompson, and further supported by the Innovative Medicines Initiative
Joint Undertaking under grant agreement number 115300 (EU-AIMS) and 777394 (AIMS-2-
TRIALS), resources of which are composed of financial contribution from the European
Union's Seventh Framework Programme and Horizon2020 programmes and the European
Federation of Pharmaceutical Industries and Associations (EFPIA) companies' in kind
contribution. The Canadian samples were collected as part of the POND network funded by
the Ontario Brain Institute (grant IDS-I l-02 to Anagnostou / Lerch).
Disclosures
Dr. Anagnostou has served as a consultant or advisory board member for Roche and Takeda;
she has received funding from the Alva Foundation, Autism Speaks, Brain Canada, the
Canadian Institutes of Health Research, the Department of Defense, the National Centers of
Excellence, NIH, the Ontario Brain Institute, the Physicians’ Services Incorporated (PSI)
Foundation, Sanofi-Aventis, and SynapDx, as well as in-kind research support from AMO
Pharma; she receives royalties from American Psychiatric Press and Springer and an editorial
honorarium from Wiley. Her contribution is on behalf of the POND network. Dr. Arango has
served as a consultant for or received honoraria or grants from Acadia, Abbott, Amgen,
CIBERSAM, Fundación Alicia Koplowitz, Instituto de Salud Carlos III, Janssen-Cilag,
Lundbeck, Merck, Instituto de Salud Carlos III (co-financed by the European Regional
Development Fund “A way of making Europe,” CIBERSAM, the Madrid Regional
.CC-BY-NC-ND 4.0 International licensenot certified by peer review) is the author/funder. It is made available under aThe copyright holder for this preprint (which wasthis version posted March 11, 2019. . https://doi.org/10.1101/570655doi: bioRxiv preprint
26
Government [S2010/BMD-2422 AGES], the European Union Structural Funds, and the
European Union Seventh Framework Programmeunder grant agreements FP7-HEALTH-
2009-2.2.1-2-241909, FP7-HEALTH-2009-2.2.1-3-242114, FP7-HEALTH-2013-2.2.1-2-
603196, and FP7-HEALTH-2013-2.2.1-2-602478), Otsuka, Pfizer, Roche, Servier, Shire,
Takeda, and Schering-Plough. Dr. Freitag has served as a consultant for Desitin regarding
issues on ASD. Dr. Di Martino is a coauthor of the Italian version of the Social
Responsiveness Scale, for which she may receive royalties. Her contribution is on behalf of
the ABIDE and ABIDE-II consortia. Dr. Rubia has received speaking honoraria fromEli Lilly,
Medice, and Shire, and a grant from Shire for another project. Dr. Buitelaar has served as a
consultant, advisory board member, or speaker for Eli Lilly, Janssen-Cilag, Lundbeck,
Medice, Novartis, Servier, Shire, and Roche, and he has received research support fromRoche
and Vifor. The other authors report no financial relationships with commercial interests.
.CC-BY-NC-ND 4.0 International licensenot certified by peer review) is the author/funder. It is made available under aThe copyright holder for this preprint (which wasthis version posted March 11, 2019. . https://doi.org/10.1101/570655doi: bioRxiv preprint
27
References
1. American Psychiatric Association (2013): Diagnostic and statistical manual of mental
disorders (5th ed.). Washington, DC.
2. Xu G, Strathearn L, Liu B, O'Brien M, Kopelman TG, Zhu J, et al. (2018): Prevalence and
Treatment Patterns of Autism Spectrum Disorder in the United States, 2016. JAMA pediatrics.
3. Loth E, Murphy DG, Spooren W (2016): Defining Precision Medicine Approaches to Autism
Spectrum Disorders: Concepts and Challenges. Front Psychiatry. 7:188.
4. Li D, Karnath HO, Xu X (2017): Candidate Biomarkers in Children with Autism Spectrum
Disorder: A Review of MRI Studies. Neuroscience bulletin. 33:219-237.
5. Rommelse N, Buitelaar JK, Hartman CA (2017): Structural brain imaging correlates of ASD
and ADHD across the lifespan: a hypothesis-generating review on developmental ASD-ADHD
subtypes. Journal of neural transmission (Vienna, Austria : 1996). 124:259-271.
6. Biberacher V, Schmidt P, Keshavan A, Boucard CC, Righart R, Samann P, et al. (2016): Intra-
and interscanner variability of magnetic resonance imaging based volumetry in multiple sclerosis.
Neuroimage. 142:188-197.
7. Jeste SS, Geschwind DH (2014): Disentangling the heterogeneity of autism spectrum disorder
through genetic findings. Nature reviews Neurology. 10:74-81.
8. van Rooij D, Anagnostou E, Arango C, Auzias G, Behrmann M, Busatto GF, et al. (2018):
Cortical and Subcortical Brain Morphometry Differences Between Patients With Autism Spectrum
Disorder and Healthy Individuals Across the Lifespan: Results From the ENIGMA ASD Working
Group. Am J Psychiatry. 175:359-369.
9. Duboc V, Dufourcq P, Blader P, Roussigne M (2015): Asymmetry of the Brain: Development
and Implications. Annu Rev Genet. 49:647-672.
10. Renteria ME (2012): Cerebral asymmetry: a quantitative, multifactorial, and plastic brain
phenotype. Twin Res Hum Genet. 15:401-413.
11. Toga AW, Thompson PM (2003): Mapping brain asymmetry. Nat Rev Neurosci. 4:37-48.
.CC-BY-NC-ND 4.0 International licensenot certified by peer review) is the author/funder. It is made available under aThe copyright holder for this preprint (which wasthis version posted March 11, 2019. . https://doi.org/10.1101/570655doi: bioRxiv preprint
28
12. Knaus TA, Silver AM, Kennedy M, Lindgren KA, Dominick KC, Siegel J, et al. (2010):
Language laterality in autism spectrum disorder and typical controls: a functional, volumetric, and
diffusion tensor MRI study. Brain and language. 112:113-120.
13. Kleinhans NM, Muller RA, Cohen DN, Courchesne E (2008): Atypical functional
lateralization of language in autism spectrum disorders. Brain research. 1221:115-125.
14. Lindell AK, Hudry K (2013): Atypicalities in cortical structure, handedness, and functional
lateralization for language in autism spectrum disorders. Neuropsychol Rev. 23:257-270.
15. Cardinale RC, Shih P, Fishman I, Ford LM, Muller RA (2013): Pervasive rightward
asymmetry shifts of functional networks in autism spectrum disorder. JAMA Psychiatry. 70:975-982.
16. Markou P, Ahtam B, Papadatou-Pastou M (2017): Elevated Levels of Atypical Handedness in
Autism: Meta-Analyses. Neuropsychol Rev. 27:258-283.
17. Rysstad AL, Pedersen AV (2018): There Are Indeed More Left-Handers Within the Autism
Spectrum Disorder Compared with in the General Population, but the Many Mixed-Handers Is the
More Interesting Finding. J Autism Dev Disord.
18. Gabard-Durnam L, Tierney AL, Vogel-Farley V, Tager-Flusberg H, Nelson CA (2015): Alpha
asymmetry in infants at risk for autism spectrum disorders. J Autism Dev Disord. 45:473-480.
19. Conti E, Calderoni S, Gaglianese A, Pannek K, Mazzotti S, Rose S, et al. (2016):
Lateralization of Brain Networks and Clinical Severity in Toddlers with Autism Spectrum Disorder: A
HARDI Diffusion MRI Study. Autism research : official journal of the International Society for
Autism Research. 9:382-392.
20. Carper RA, Treiber JM, DeJesus SY, Muller RA (2016): Reduced Hemispheric Asymmetry of
White Matter Microstructure in Autism Spectrum Disorder. Journal of the American Academy of
Child and Adolescent Psychiatry. 55:1073-1080.
21. Joseph RM, Fricker Z, Fenoglio A, Lindgren KA, Knaus TA, Tager-Flusberg H (2014):
Structural asymmetries of language-related gray and white matter and their relationship to language
function in young children with ASD. Brain Imaging Behav. 8:60-72.
.CC-BY-NC-ND 4.0 International licensenot certified by peer review) is the author/funder. It is made available under aThe copyright holder for this preprint (which wasthis version posted March 11, 2019. . https://doi.org/10.1101/570655doi: bioRxiv preprint
29
22. Wei L, Zhong S, Nie S, Gong G (2018): Aberrant development of the asymmetry between
hemispheric brain white matter networks in autism spectrum disorder. Eur Neuropsychopharmacol.
28:48-62.
23. Floris DL, Lai MC, Auer T, Lombardo MV, Ecker C, Chakrabarti B, et al. (2016): Atypically
rightward cerebral asymmetry in male adults with autism stratifies individuals with and without
language delay. Hum Brain Mapp. 37:230-253.
24. Dougherty CC, Evans DW, Katuwal GJ, Michael AM (2016): Asymmetry of fusiform
structure in autism spectrum disorder: trajectory and association with symptom severity. Molecular
autism. 7:28.
25. Knaus TA, Tager-Flusberg H, Mock J, Dauterive R, Foundas AL (2012): Prefrontal and
occipital asymmetry and volume in boys with autism spectrum disorder. Cognitive and behavioral
neurology : official journal of the Society for Behavioral and Cognitive Neurology. 25:186-194.
26. Boedhoe, Schmaal L, Abe Y, Ameis SH, Arnold PD, Batistuzzo MC, et al. (2017): Distinct
Subcortical Volume Alterations in Pediatric and Adult OCD: A Worldwide Meta- and Mega-Analysis.
Am J Psychiatry. 174:60-69.
27. Boedhoe, Schmaal L, Abe Y, Alonso P, Ameis SH, Anticevic A, et al. (2018): Cortical
Abnormalities Associated With Pediatric and Adult Obsessive-Compulsive Disorder: Findings From
the ENIGMA Obsessive-Compulsive Disorder Working Group. Am J Psychiatry. 175:453-462.
28. Logue MW, van Rooij SJH, Dennis EL, Davis SL, Hayes JP, Stevens JS, et al. (2018):
Smaller Hippocampal Volume in Posttraumatic Stress Disorder: A Multisite ENIGMA-PGC Study:
Subcortical Volumetry Results From Posttraumatic Stress Disorder Consortia. Biol Psychiatry.
83:244-253.
29. Schmaal L, Hibar DP, Samann PG, Hall GB, Baune BT, Jahanshad N, et al. (2017): Cortical
abnormalities in adults and adolescents with major depression based on brain scans from 20 cohorts
worldwide in the ENIGMA Major Depressive Disorder Working Group. Mol Psychiatry. 22:900-909.
30. Schmaal L, Veltman DJ, van Erp TG, Samann PG, Frodl T, Jahanshad N, et al. (2016):
Subcortical brain alterations in major depressive disorder: findings from the ENIGMA Major
Depressive Disorder working group. Mol Psychiatry. 21:806-812.
.CC-BY-NC-ND 4.0 International licensenot certified by peer review) is the author/funder. It is made available under aThe copyright holder for this preprint (which wasthis version posted March 11, 2019. . https://doi.org/10.1101/570655doi: bioRxiv preprint
30
31. van Erp TGM, Walton E, Hibar DP, Schmaal L, Jiang W, Glahn DC, et al. (2018): Cortical
Brain Abnormalities in 4474 Individuals With Schizophrenia and 5098 Control Subjects via the
Enhancing Neuro Imaging Genetics Through Meta Analysis (ENIGMA) Consortium. Biol Psychiatry.
84:644-654.
32. Hoogman M, Bralten J, Hibar DP, Mennes M, Zwiers MP, Schweren LS, et al. (2017):
Subcortical brain volume differences in participants with attention deficit hyperactivity disorder in
children and adults: a cross-sectional mega-analysis. The lancet Psychiatry. 4:310-319.
33. Munafo MR, Flint J (2010): How reliable are scientific studies? Br J Psychiatry. 197:257-258.
34. Button KS, Ioannidis JP, Mokrysz C, Nosek BA, Flint J, Robinson ES, et al. (2013): Power
failure: why small sample size undermines the reliability of neuroscience. Nat Rev Neurosci. 14:365-
376.
35. Kurth F, Gaser C, Luders E (2015): A 12-step user guide for analyzing voxel-wise gray matter
asymmetries in statistical parametric mapping (SPM). Nature protocols. 10:293-304.
36. Leroy F, Cai Q, Bogart SL, Dubois J, Coulon O, Monzalvo K, et al. (2015): New human-
specific brain landmark: the depth asymmetry of superior temporal sulcus. Proc Natl Acad Sci U S A.
112:1208-1213.
37. Lord C, Risi S, Lambrecht L, Cook EH, Jr., Leventhal BL, DiLavore PC, et al. (2000): The
autism diagnostic observation schedule-generic: a standard measure of social and communication
deficits associated with the spectrum of autism. J Autism Dev Disord. 30:205-223.
38. Desikan RS, Segonne F, Fischl B, Quinn BT, Dickerson BC, Blacker D, et al. (2006): An
automated labeling system for subdividing the human cerebral cortex on MRI scans into gyral based
regions of interest. Neuroimage. 31:968-980.
39. Fischl B (2012): FreeSurfer. Neuroimage. 62:774-781.
40. Pinheiro J BD, DebRoy S, Sarkar D and R Core Team (2018). nlme: Linear and Nonlinear
Mixed Effects Models. R package version 3.1-137, https://CRAN.R-project.org/package=nlme.
41. Chambers JM, Hastie TJ (1992): Statistical models in S. Pacific Grove, California, USA,
Wadsworth & Brooks/Cole.
.CC-BY-NC-ND 4.0 International licensenot certified by peer review) is the author/funder. It is made available under aThe copyright holder for this preprint (which wasthis version posted March 11, 2019. . https://doi.org/10.1101/570655doi: bioRxiv preprint
31
42. Benjamini Y, Hochberg Y (1995): Controlling the False Discovery Rate - A Practical and
Powerful Approach to Multiple Testing. J R Stat Soc Ser B-Methodol. 57:289-300.
43. Haar S, Berman S, Behrmann M, Dinstein I (2016): Anatomical Abnormalities in Autism?
Cereb Cortex. 26:1440-1452.
44. Francks C (2015): Exploring human brain lateralization with molecular genetics and
genomics. Ann N Y Acad Sci. 1359:1-13.
45. Geschwind N, Galaburda AM (1985): Cerebral lateralization: Biological mechanisms,
associations, and pathology: i. a hypothesis and a program for research. Archives of Neurology.
42:428-459.
46. Rogers LJ, Zucca P, Vallortigara G (2004): Advantages of having a lateralized brain. Proc
Biol Sci. 271 Suppl 6:S420-422.
47. Adolphs R (2009): The social brain: neural basis of social knowledge. Annual review of
psychology. 60:693-716.
48. Ecker C, Bookheimer SY, Murphy DG (2015): Neuroimaging in autism spectrum disorder:
brain structure and function across the lifespan. The Lancet Neurology. 14:1121-1134.
49. Jiao Y, Chen R, Ke X, Chu K, Lu Z, Herskovits EH (2010): Predictive models of autism
spectrum disorder based on brain regional cortical thickness. Neuroimage. 50:589-599.
50. Watanabe H, Nakamura M, Ohno T, Itahashi T, Tanaka E, Ohta H, et al. (2014): Altered
orbitofrontal sulcogyral patterns in adult males with high-functioning autism spectrum disorders.
Social cognitive and affective neuroscience. 9:520-528.
51. Trontel HG, Duffield TC, Bigler ED, Froehlich A, Prigge MB, Nielsen JA, et al. (2013):
Fusiform correlates of facial memory in autism. Behavioral sciences (Basel, Switzerland). 3:348-371.
52. Langen M, Bos D, Noordermeer SD, Nederveen H, van Engeland H, Durston S (2014):
Changes in the development of striatum are involved in repetitive behavior in autism. Biol Psychiatry.
76:405-411.
53. Carlisi CO, Norman L, Murphy CM, Christakou A, Chantiluke K, Giampietro V, et al. (2017):
Shared and Disorder-Specific Neurocomputational Mechanisms of Decision-Making in Autism
Spectrum Disorder and Obsessive-Compulsive Disorder. Cereb Cortex. 27:5804-5816.
.CC-BY-NC-ND 4.0 International licensenot certified by peer review) is the author/funder. It is made available under aThe copyright holder for this preprint (which wasthis version posted March 11, 2019. . https://doi.org/10.1101/570655doi: bioRxiv preprint
32
54. Panizzon MS, Fennema-Notestine C, Eyler LT, Jernigan TL, Prom-Wormley E, Neale M, et
al. (2009): Distinct genetic influences on cortical surface area and cortical thickness. Cereb Cortex.
19:2728-2735.
55. Guadalupe T, Mathias SR, vanErp TG, Whelan CD, Zwiers MP, Abe Y, et al. (2016): Human
subcortical brain asymmetries in 15,847 people worldwide reveal effects of age and sex. Brain
Imaging Behav.
56. Kong XZ, Mathias SR, Guadalupe T, Glahn DC, Franke B, Crivello F, et al. (2018): Mapping
cortical brain asymmetry in 17,141 healthy individuals worldwide via the ENIGMA Consortium. Proc
Natl Acad Sci U S A.
57. Kawasaki Y, Suzuki M, Takahashi T, Nohara S, McGuire PK, Seto H, et al. (2008):
Anomalous cerebral asymmetry in patients with schizophrenia demonstrated by voxel-based
morphometry. Biol Psychiatry. 63:793-800.
58. Costafreda SG (2009): Pooling FMRI data: meta-analysis, mega-analysis and multi-center
studies. Frontiers in neuroinformatics. 3:33.
59. Tick B, Bolton P, Happe F, Rutter M, Rijsdijk F (2016): Heritability of autism spectrum
disorders: a meta-analysis of twin studies. Journal of child psychology and psychiatry, and allied
disciplines. 57:585-595.
60. Sharma SR, Gonda X, Tarazi FI (2018): Autism Spectrum Disorder: Classification, diagnosis
and therapy. Pharmacology & therapeutics.
.CC-BY-NC-ND 4.0 International licensenot certified by peer review) is the author/funder. It is made available under aThe copyright holder for this preprint (which wasthis version posted March 11, 2019. . https://doi.org/10.1101/570655doi: bioRxiv preprint
33
Legends for tables and figures
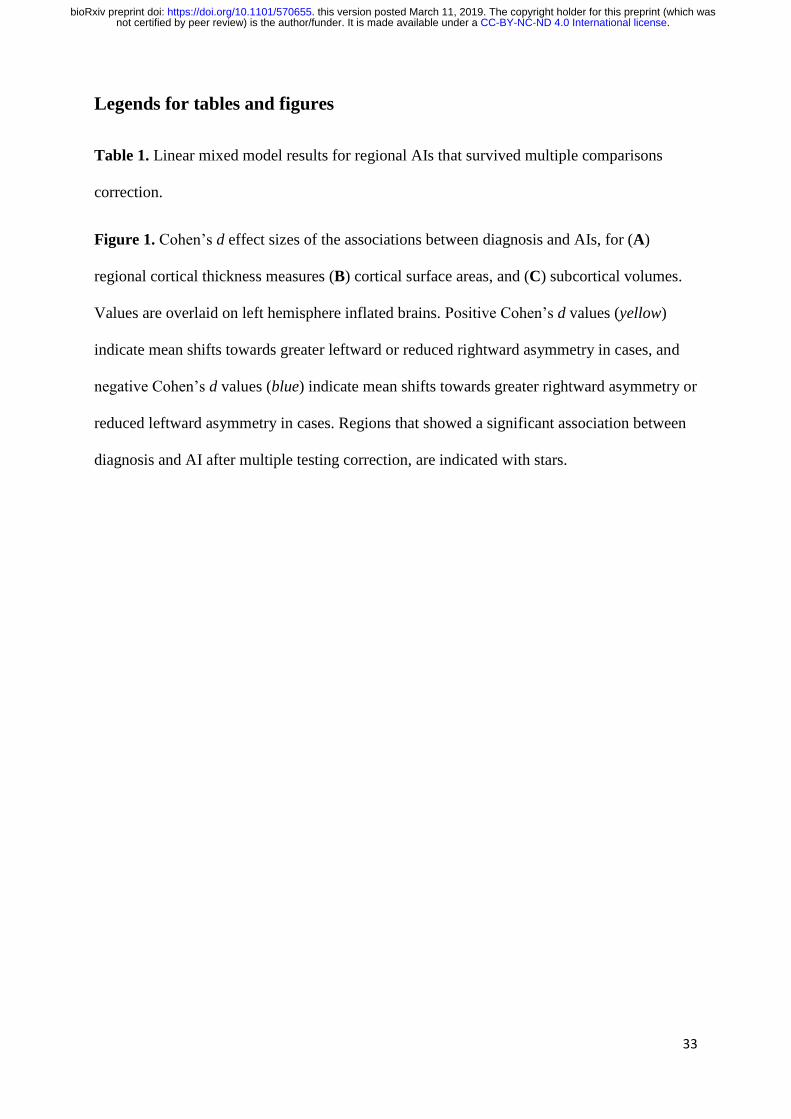
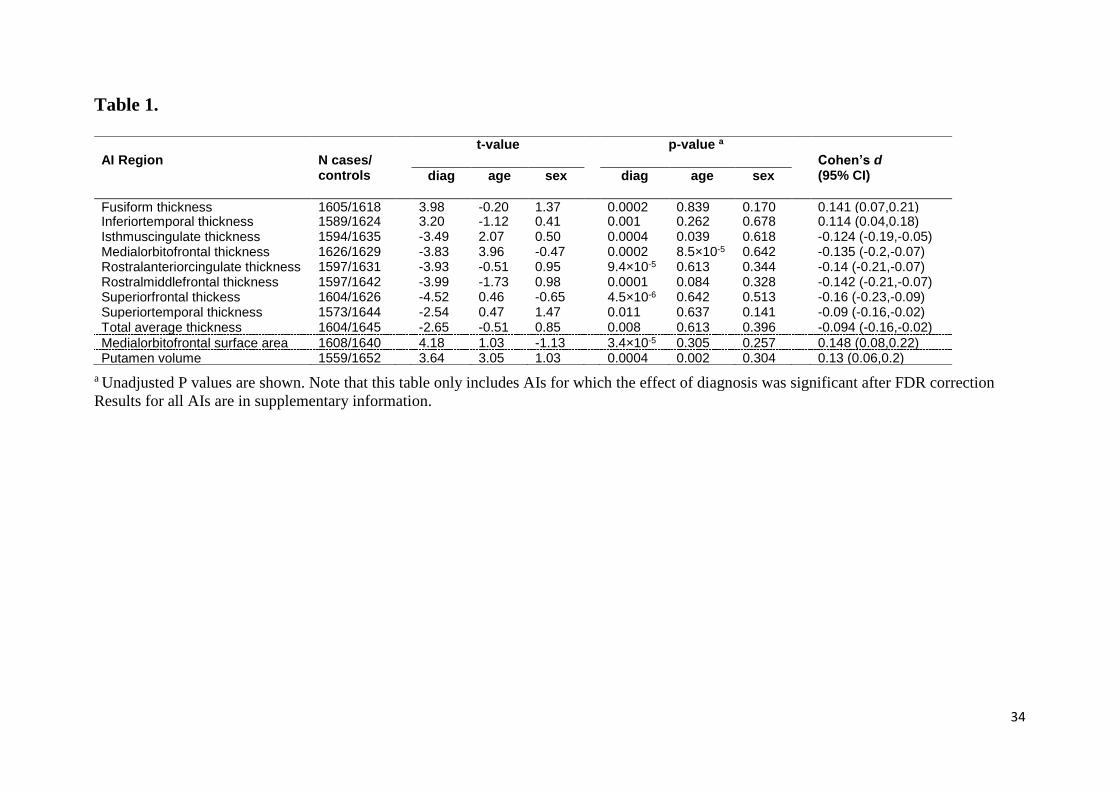
Table 1. Linear mixed model results for regional AIs that survived multiple comparisons
correction.
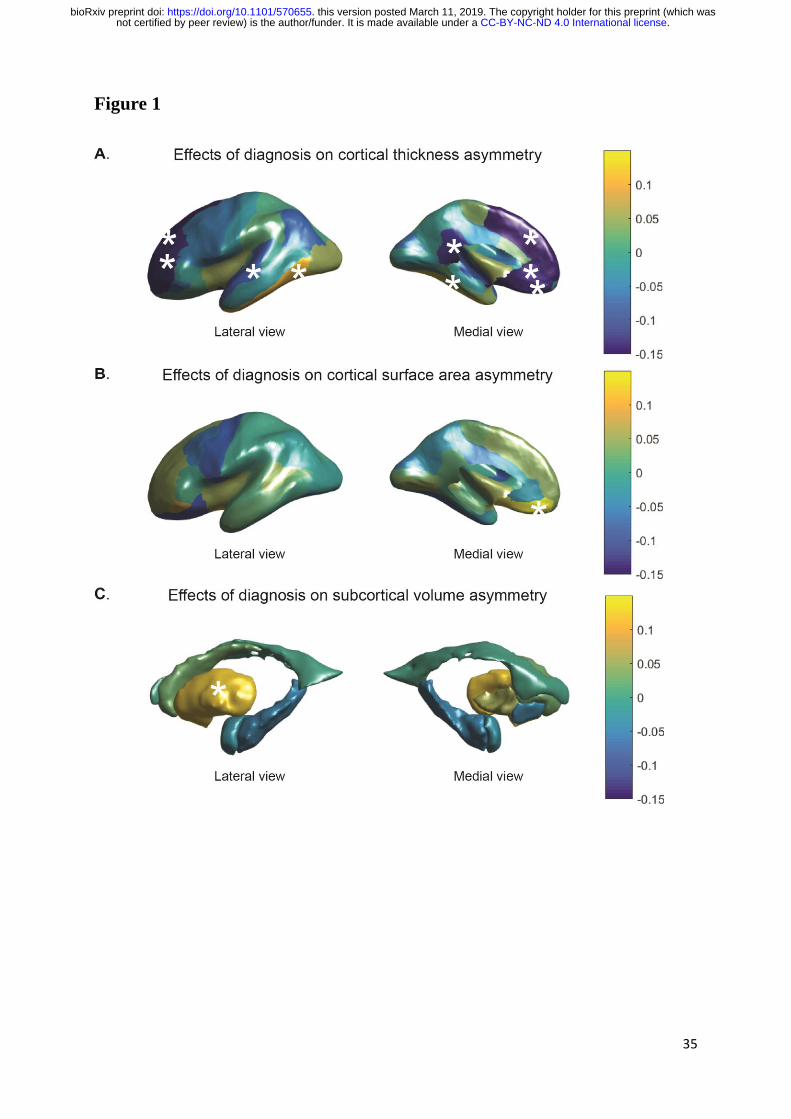
Figure 1. Cohen’s d effect sizes of the associations between diagnosis and AIs, for (A)
regional cortical thickness measures (B) cortical surface areas, and (C) subcortical volumes.
Values are overlaid on left hemisphere inflated brains. Positive Cohen’s d values (yellow)
indicate mean shifts towards greater leftward or reduced rightward asymmetry in cases, and
negative Cohen’s d values (blue) indicate mean shifts towards greater rightward asymmetry or
reduced leftward asymmetry in cases. Regions that showed a significant association between
diagnosis and AI after multiple testing correction, are indicated with stars.
.CC-BY-NC-ND 4.0 International licensenot certified by peer review) is the author/funder. It is made available under aThe copyright holder for this preprint (which wasthis version posted March 11, 2019. . https://doi.org/10.1101/570655doi: bioRxiv preprint
34
Table 1.
a Unadjusted P values are shown. Note that this table only includes AIs for which the effect of diagnosis was significant after FDR correction
Results for all AIs are in supplementary information.
AI Region N cases/ controls
t-value p-value a
Cohen’s d (95% CI) diag age sex diag age sex
Fusiform thickness 1605/1618 3.98 -0.20 1.37 0.0002 0.839 0.170 0.141 (0.07,0.21) Inferiortemporal thickness 1589/1624 3.20 -1.12 0.41 0.001 0.262 0.678 0.114 (0.04,0.18) Isthmuscingulate thickness 1594/1635 -3.49 2.07 0.50 0.0004 0.039 0.618 -0.124 (-0.19,-0.05) Medialorbitofrontal thickness 1626/1629 -3.83 3.96 -0.47 0.0002 8.5×10⁻⁵ 0.642 -0.135 (-0.2,-0.07) Rostralanteriorcingulate thickness 1597/1631 -3.93 -0.51 0.95 9.4×10⁻⁵ 0.613 0.344 -0.14 (-0.21,-0.07) Rostralmiddlefrontal thickness 1597/1642 -3.99 -1.73 0.98 0.0001 0.084 0.328 -0.142 (-0.21,-0.07) Superiorfrontal thickess 1604/1626 -4.52 0.46 -0.65 4.5×10⁻⁶ 0.642 0.513 -0.16 (-0.23,-0.09) Superiortemporal thickness 1573/1644 -2.54 0.47 1.47 0.011 0.637 0.141 -0.09 (-0.16,-0.02) Total average thickness 1604/1645 -2.65 -0.51 0.85 0.008 0.613 0.396 -0.094 (-0.16,-0.02)
Medialorbitofrontal surface area 1608/1640 4.18 1.03 -1.13 3.4×10⁻⁵ 0.305 0.257 0.148 (0.08,0.22) Putamen volume 1559/1652 3.64 3.05 1.03 0.0004 0.002 0.304 0.13 (0.06,0.2)
.CC-BY-NC-ND 4.0 International licensenot certified by peer review) is the author/funder. It is made available under aThe copyright holder for this preprint (which wasthis version posted March 11, 2019. . https://doi.org/10.1101/570655doi: bioRxiv preprint
35
Figure 1
.CC-BY-NC-ND 4.0 International licensenot certified by peer review) is the author/funder. It is made available under aThe copyright holder for this preprint (which wasthis version posted March 11, 2019. . https://doi.org/10.1101/570655doi: bioRxiv preprint