Embed Size (px)
Citation preview
1
4/25/12
• Another great year of consistent top- and bottom-line growth
Key Investment Points
• Great momentum. . .all businesses on track
• Investing in exciting growth vehicles
• Outstanding financial returns and cash generation
2
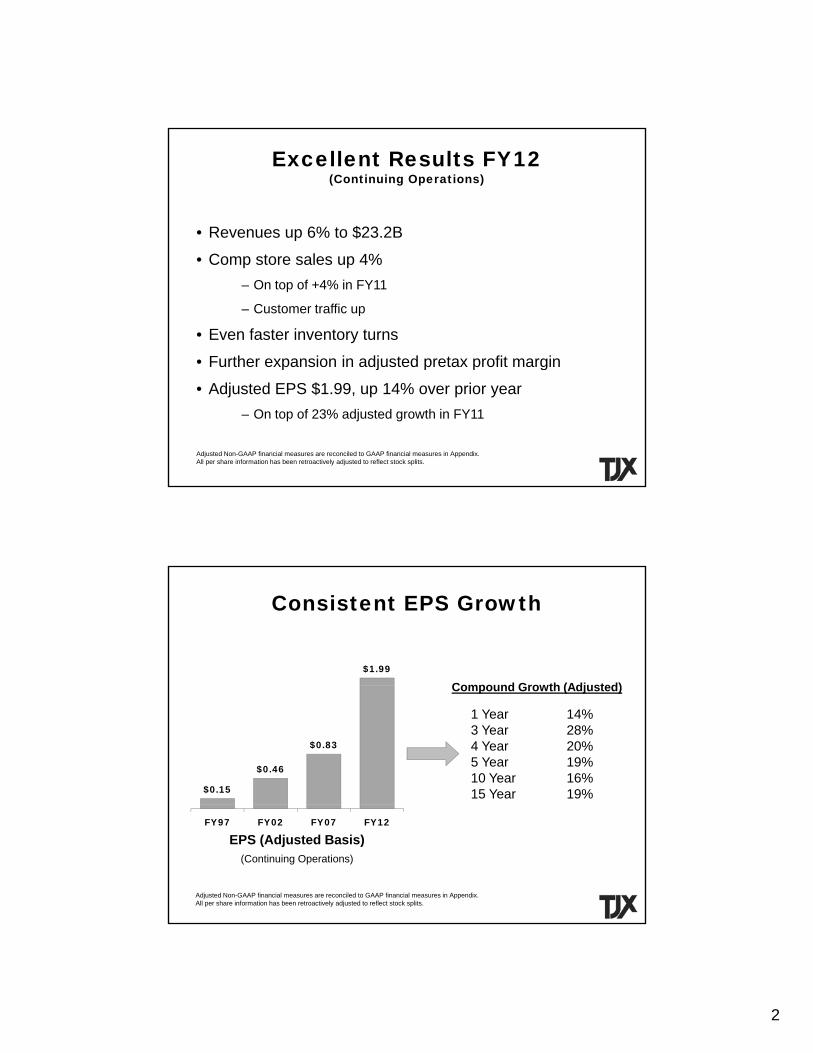
• Revenues up 6% to $23.2B
Excellent Results FY12(Continuing Operations)
• Comp store sales up 4%– On top of +4% in FY11
– Customer traffic up
• Even faster inventory turns
• Further expansion in adjusted pretax profit marginp j p p g
• Adjusted EPS $1.99, up 14% over prior year– On top of 23% adjusted growth in FY11
Adjusted Non-GAAP financial measures are reconciled to GAAP financial measures in Appendix.All per share information has been retroactively adjusted to reflect stock splits.
Compound Growth (Adjusted)
Consistent EPS Growth
$1.99
Compound Growth (Adjusted)
1 Year 14%3 Year 28%4 Year 20% 5 Year 19%10 Year 16%15 Year 19%$0.15
$0.46
$0.83
EPS (Adjusted Basis)(Continuing Operations)
Adjusted Non-GAAP financial measures are reconciled to GAAP financial measures in Appendix.All per share information has been retroactively adjusted to reflect stock splits.
FY97 FY02 FY07 FY12
3
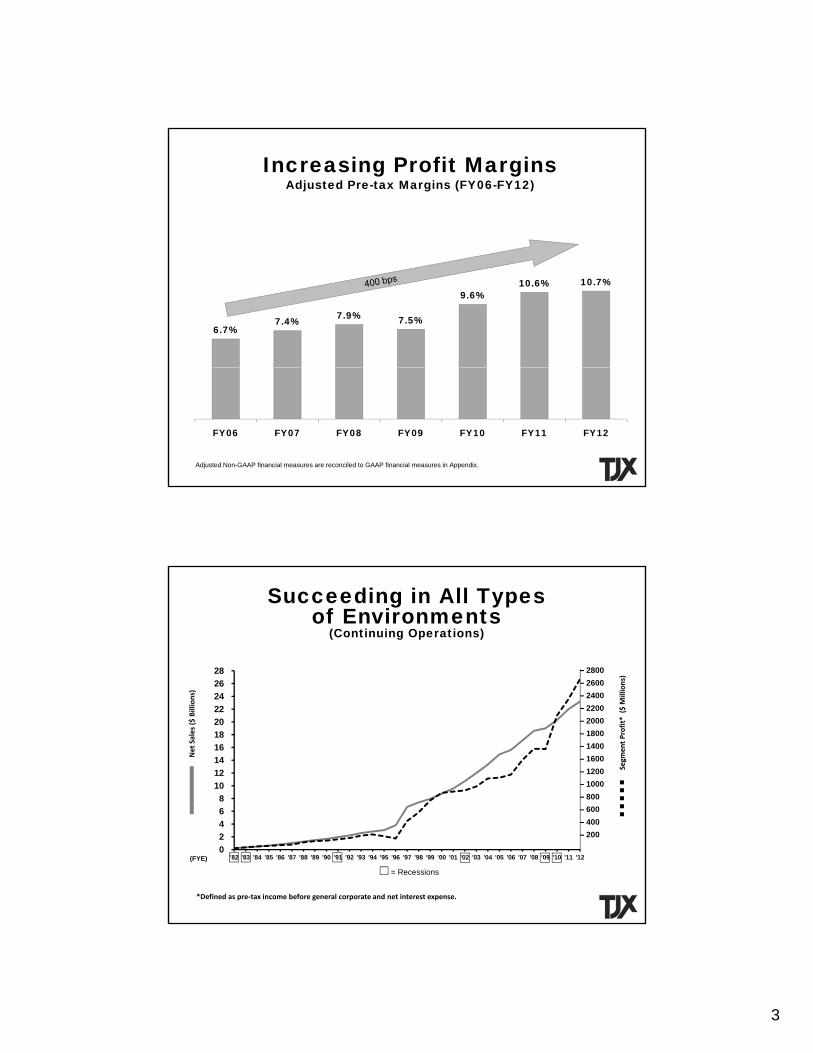
Increasing Profit MarginsAdjusted Pre-tax Margins (FY06-FY12)
6.7%7.4% 7.9% 7.5%
9.6%10.6% 10.7%
FY06 FY07 FY08 FY09 FY10 FY11 FY12
Adjusted Non-GAAP financial measures are reconciled to GAAP financial measures in Appendix.
2628
26002800
ns)
Succeeding in All Typesof Environments
(Continuing Operations)
8 10 12 14 16 18 20 22 24 26
80010001200
1400
2600
1800
1600
200022002400
Net Sales ($
Billions)
Segm
ent Profit* ($
Millio
0 2 4 6
'82 '83 '84 '85 '86 '87 '88 '89 '90 '91 '92 '93 '94 '95 '96 '97 '98 '99 '00 '01 '02 '03 '04 '05 '06 '07 '08 '09 '10 '11 '12
200400600
(FYE)
= Recessions
*Defined as pre‐tax income before general corporate and net interest expense.
4
• Buying “close to need”
G t i ibilit i /f hi
Flexible Business Model
–Great visibility on price/fashion
–React quickly to retail/economic environment/market opportunities
• Flexible store formats/ability to change categories
• Enormous liquidity in inventory position
• Global sourcing from > 15 000 vendors• Global sourcing from > 15,000 vendors
• Real estate flexibility
• Flexibility in supply chain
• “Outrageous value”Four large powerful businesses
Confidence in Profit Growth
• Four large, powerful businesses• Customer traffic increases/attracting new customers• Stronger marketing initiatives• Leaner inventories driving faster turns• Supply chain enhancement opportunities
• Cost containment opportunities: $50-75M in savings planned in FY13
5
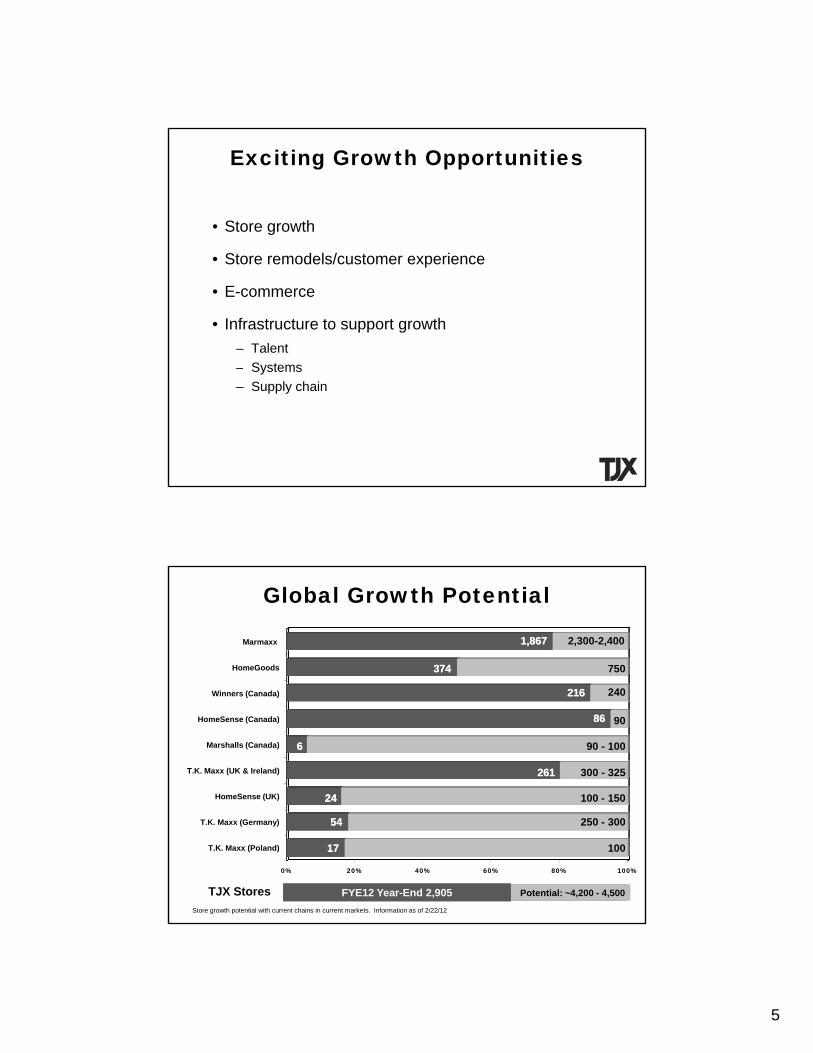
• Store growth
Exciting Growth Opportunities
• Store remodels/customer experience
• E-commerce
• Infrastructure to support growth– Talent
Systems– Systems– Supply chain
HomeGoods
Marmaxx
Global Growth Potential
1,8671,867 2,300-2,400
750374374
HomeSense (UK)
T.K. Maxx (UK & Ireland)
Marshalls (Canada)
HomeSense (Canada)
Winners (Canada)
2424 100 - 150
216216 240
261261 300 - 325
8686 90
66 90 - 100
0% 20% 40% 60% 80% 100%
T.K. Maxx (Poland)
T.K. Maxx (Germany)
Store growth potential with current chains in current markets. Information as of 2/22/12
250 - 3005454
TJX Stores Potential: ~4,200 - 4,500FYE12 Year-End 2,905FYE12 Year-End 2,905
1001717
6
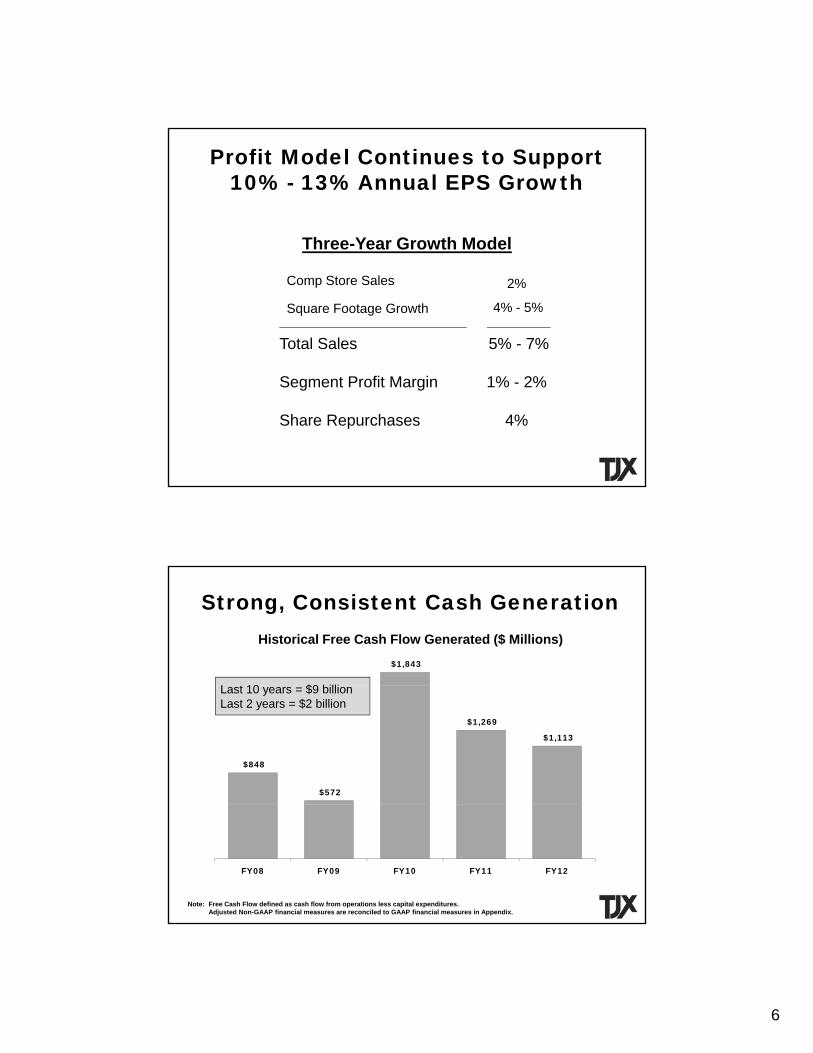
Three-Year Growth Model
Profit Model Continues to Support10% - 13% Annual EPS Growth
Three Year Growth Model
Comp Store Sales
Square Footage Growth
Total Sales
2%
4% - 5%
5% - 7%
Segment Profit Margin
Share Repurchases
1% - 2%
4%
Strong, Consistent Cash GenerationHistorical Free Cash Flow Generated ($ Millions)
L t 10 $9 billi
$1,843
Last 10 years = $9 billionLast 2 years = $2 billion
$848
$572
$1,269
$1,113
Note: Free Cash Flow defined as cash flow from operations less capital expenditures.Adjusted Non-GAAP financial measures are reconciled to GAAP financial measures in Appendix.
FY08 FY09 FY10 FY11 FY12
7
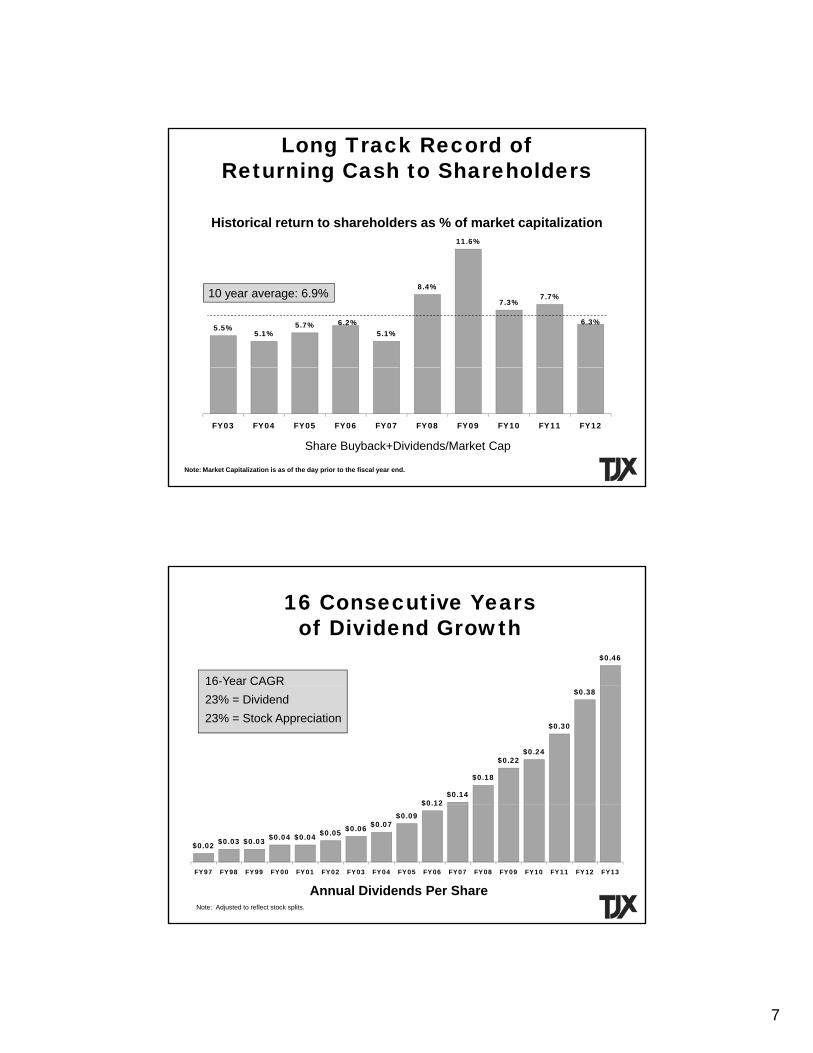
Long Track Record ofReturning Cash to Shareholders
11.6%
Historical return to shareholders as % of market capitalization
5.5%5.1%
5.7% 6.2%5.1%
8.4%
7.3%7.7%
6.3%
10 year average: 6.9%
FY03 FY04 FY05 FY06 FY07 FY08 FY09 FY10 FY11 FY12
Share Buyback+Dividends/Market Cap
Note: Market Capitalization is as of the day prior to the fiscal year end.
16 Consecutive Yearsof Dividend Growth
16-Year CAGR
$0.46
23% = Dividend23% = Stock Appreciation
$0.12 $0.14
$0.18
$0.22 $0.24
$0.30
$0.38
Note: Adjusted to reflect stock splits.
Annual Dividends Per Share
$0.02 $0.03 $0.03 $0.04 $0.04 $0.05 $0.06 $0.07 $0.09
$0.12
FY97 FY98 FY99 FY00 FY01 FY02 FY03 FY04 FY05 FY06 FY07 FY08 FY09 FY10 FY11 FY12 FY13
8
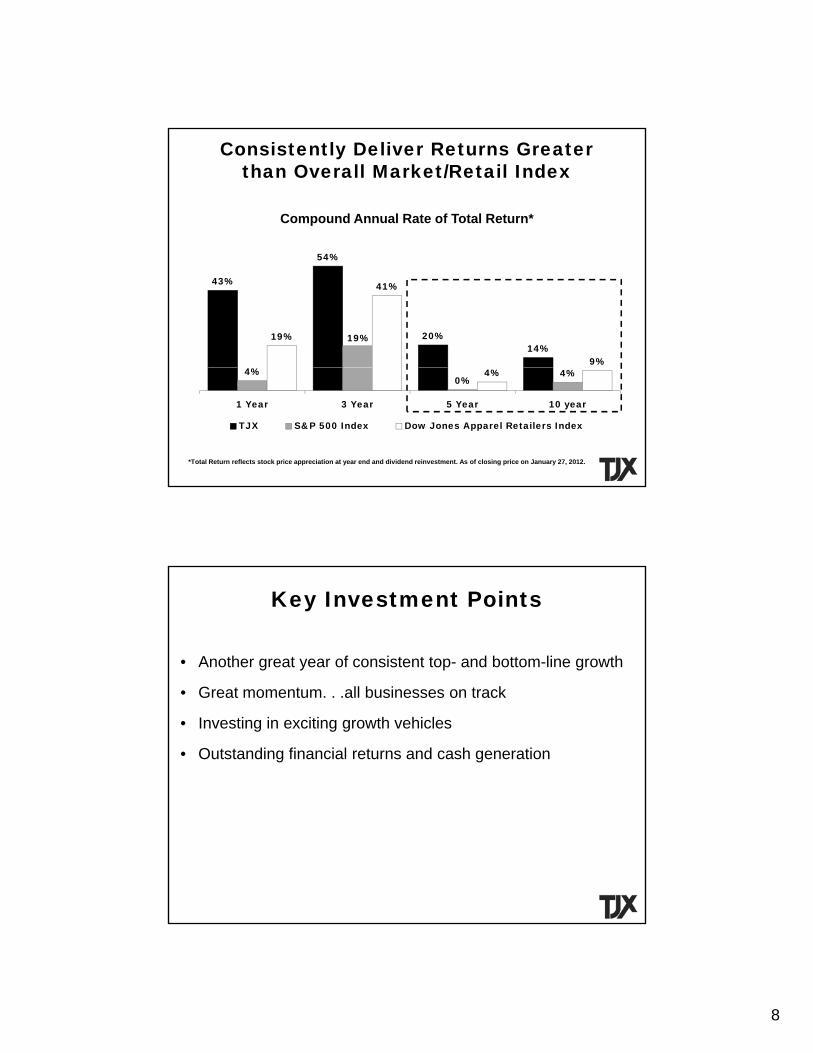
Consistently Deliver Returns Greaterthan Overall Market/Retail Index
Compound Annual Rate of Total Return*Compound Annual Rate of Total Return*
43%
54%
20%14%
19%19%
41%
9%4%
0%4%4%
1 Year 3 Year 5 Year 10 year
TJX S&P 500 Index Dow Jones Apparel Retailers Index
*Total Return reflects stock price appreciation at year end and dividend reinvestment. As of closing price on January 27, 2012.
• Another great year of consistent top- and bottom-line growth
Key Investment Points
• Great momentum. . .all businesses on track
• Investing in exciting growth vehicles
• Outstanding financial returns and cash generation
9
Profit Margin Potential by Business
Segment Profit Margin
FY10 FY11 FY12 FY13E Potential
Marmaxx 12.0% 13.3% 13.6%* 13.6% - 13.9% Maintain
HomeGoods 7.7% 9.5% 10.6%* 10.7% - 10.9% 10%+
TJX Canada 11.8% 14.0% 13.0% 12.9% - 13.1% Maintain
TJX Europe 7.2% 3.0% 2.4% 4.9% - 5.4% 8%+
*FY12 Marmaxx and HomeGoods segment profit margin figures are on an adjusted basis.
Adjusted Non-GAAP financial measures are reconciled to GAAP financial measures in Appendix.
SAFE HARBOR STATEMENT UNDER THE PRIVATE SECURITIES LITIGATION REFORM ACT OF 1995:Various statements made in this release are forward-looking and involve a number of risks and uncertainties. All statements thataddress activities, events or developments that we intend, expect or believe may occur in the future are forward-looking statements. The following are some of the factors that could cause actual results to differ materially from the forward-looking statements: buying and inventory management; operational expansion and management of large size and scale; customer
The TJX Companies, Inc.
trends and preferences; market, banner, geographic and category expansion; marketing, advertising and promotional programs; competition; personnel recruitment and retention; global economic conditions and consumer spending; data security; information systems and technology; seasonal influences; adverse or unseasonable weather; serious disruptions and catastrophic events; corporate and banner reputation; merchandise quality and safety; international operations; merchandise importing; commodity pricing; foreign currency exchange rates; fluctuations in quarterly operating results; market expectations; acquisitions and divestitures; compliance with laws, regulations and orders; changes in laws and regulations; outcomes of litigation, legal matters and proceedings; tax matters; real estate leasing; cash flow and other factors that may be described in our filings with the Securities and Exchange Commission. We do not undertake to publicly update or revise our forward-looking statements even if experience or future changes make it clear that any projected results expressed or implied in such statements will not be realized.
IMPORTANT INFORMATION AT WEBSITE: The Company routinely posts information that may be important to investors in the Investor Information section at www.tjx.com. The Company encourages investors to consult that section of its website regularly.
Reconciliations of Non-GAAP financial measures to GAAP financial measures are available at www.tjx.com under “Reconciliation of Financials.”
OTHER IMPORTANT INFORMATION:All references to sales, pretax margin and EPS are on a continuing operations basis.
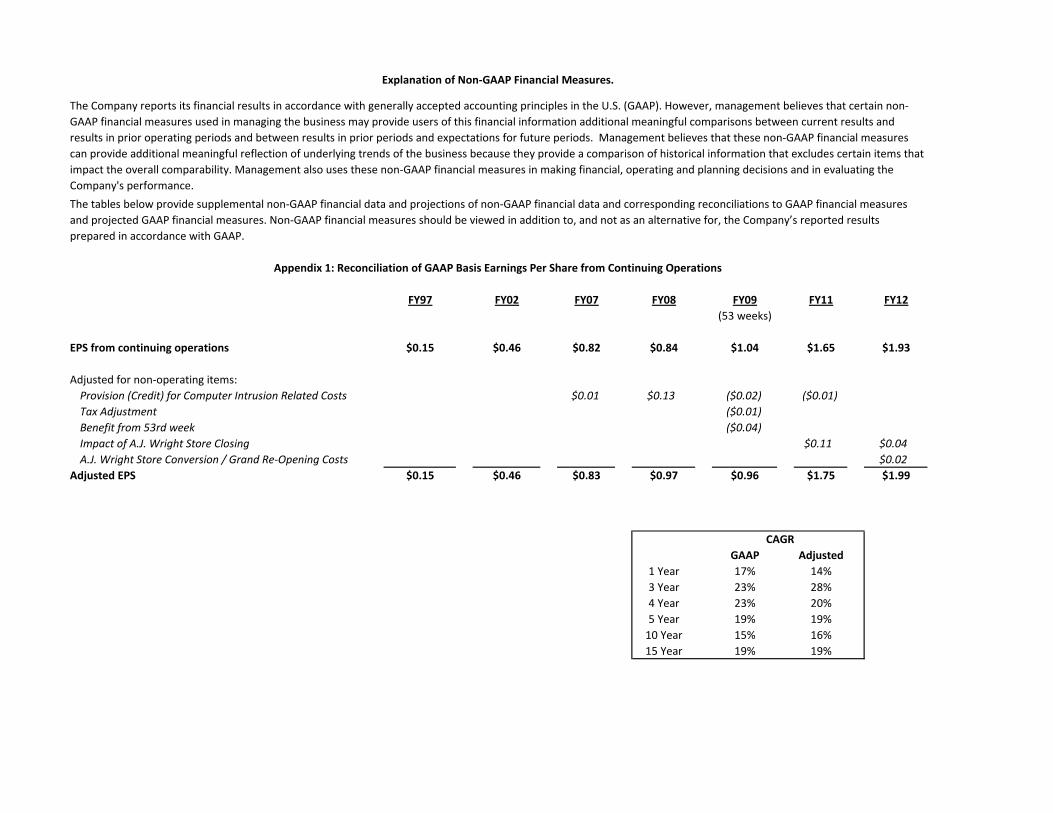
FY97 FY02 FY07 FY08 FY09 FY11 FY12
(53 weeks)
EPS from continuing operations $0.15 $0.46 $0.82 $0.84 $1.04 $1.65 $1.93
Adjusted for non-operating items:
Provision (Credit) for Computer Intrusion Related Costs $0.01 $0.13 ($0.02) ($0.01)
Tax Adjustment ($0.01)
Benefit from 53rd week ($0.04)
Impact of A.J. Wright Store Closing $0.11 $0.04
A.J. Wright Store Conversion / Grand Re-Opening Costs $0.02
Adjusted EPS $0.15 $0.46 $0.83 $0.97 $0.96 $1.75 $1.99
GAAP Adjusted
1 Year 17% 14%
3 Year 23% 28%
4 Year 23% 20%
5 Year 19% 19%
10 Year 15% 16%
15 Year 19% 19%
Appendix 1: Reconciliation of GAAP Basis Earnings Per Share from Continuing Operations
The Company reports its financial results in accordance with generally accepted accounting principles in the U.S. (GAAP). However, management believes that certain non-
GAAP financial measures used in managing the business may provide users of this financial information additional meaningful comparisons between current results and
results in prior operating periods and between results in prior periods and expectations for future periods. Management believes that these non-GAAP financial measures
can provide additional meaningful reflection of underlying trends of the business because they provide a comparison of historical information that excludes certain items that
impact the overall comparability. Management also uses these non-GAAP financial measures in making financial, operating and planning decisions and in evaluating the
Company's performance.
The tables below provide supplemental non-GAAP financial data and projections of non-GAAP financial data and corresponding reconciliations to GAAP financial measures
and projected GAAP financial measures. Non-GAAP financial measures should be viewed in addition to, and not as an alternative for, the Company’s reported results
prepared in accordance with GAAP.
Explanation of Non-GAAP Financial Measures.
CAGR
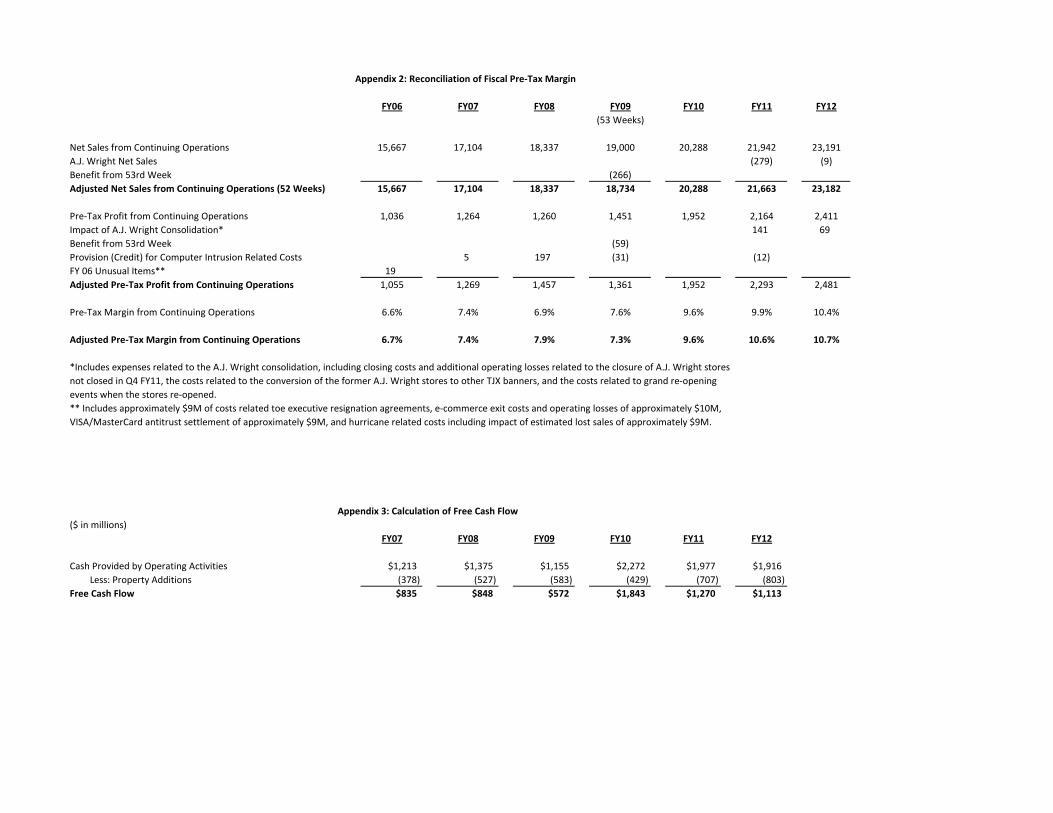
FY06 FY07 FY08 FY09 FY10 FY11 FY12
(53 Weeks)
Net Sales from Continuing Operations 15,667 17,104 18,337 19,000 20,288 21,942 23,191
A.J. Wright Net Sales (279) (9)
Benefit from 53rd Week (266)
Adjusted Net Sales from Continuing Operations (52 Weeks) 15,667 17,104 18,337 18,734 20,288 21,663 23,182
Pre-Tax Profit from Continuing Operations 1,036 1,264 1,260 1,451 1,952 2,164 2,411
Impact of A.J. Wright Consolidation* 141 69
Benefit from 53rd Week (59)
Provision (Credit) for Computer Intrusion Related Costs 5 197 (31) (12)
FY 06 Unusual Items** 19
Adjusted Pre-Tax Profit from Continuing Operations 1,055 1,269 1,457 1,361 1,952 2,293 2,481
Pre-Tax Margin from Continuing Operations 6.6% 7.4% 6.9% 7.6% 9.6% 9.9% 10.4%
Adjusted Pre-Tax Margin from Continuing Operations 6.7% 7.4% 7.9% 7.3% 9.6% 10.6% 10.7%
*Includes expenses related to the A.J. Wright consolidation, including closing costs and additional operating losses related to the closure of A.J. Wright stores
not closed in Q4 FY11, the costs related to the conversion of the former A.J. Wright stores to other TJX banners, and the costs related to grand re-opening
events when the stores re-opened.
** Includes approximately $9M of costs related toe executive resignation agreements, e-commerce exit costs and operating losses of approximately $10M,
VISA/MasterCard antitrust settlement of approximately $9M, and hurricane related costs including impact of estimated lost sales of approximately $9M.
($ in millions)
FY07 FY08 FY09 FY10 FY11 FY12
Cash Provided by Operating Activities $1,213 $1,375 $1,155 $2,272 $1,977 $1,916
Less: Property Additions (378) (527) (583) (429) (707) (803)
Free Cash Flow $835 $848 $572 $1,843 $1,270 $1,113
Appendix 2: Reconciliation of Fiscal Pre-Tax Margin
Appendix 3: Calculation of Free Cash Flow
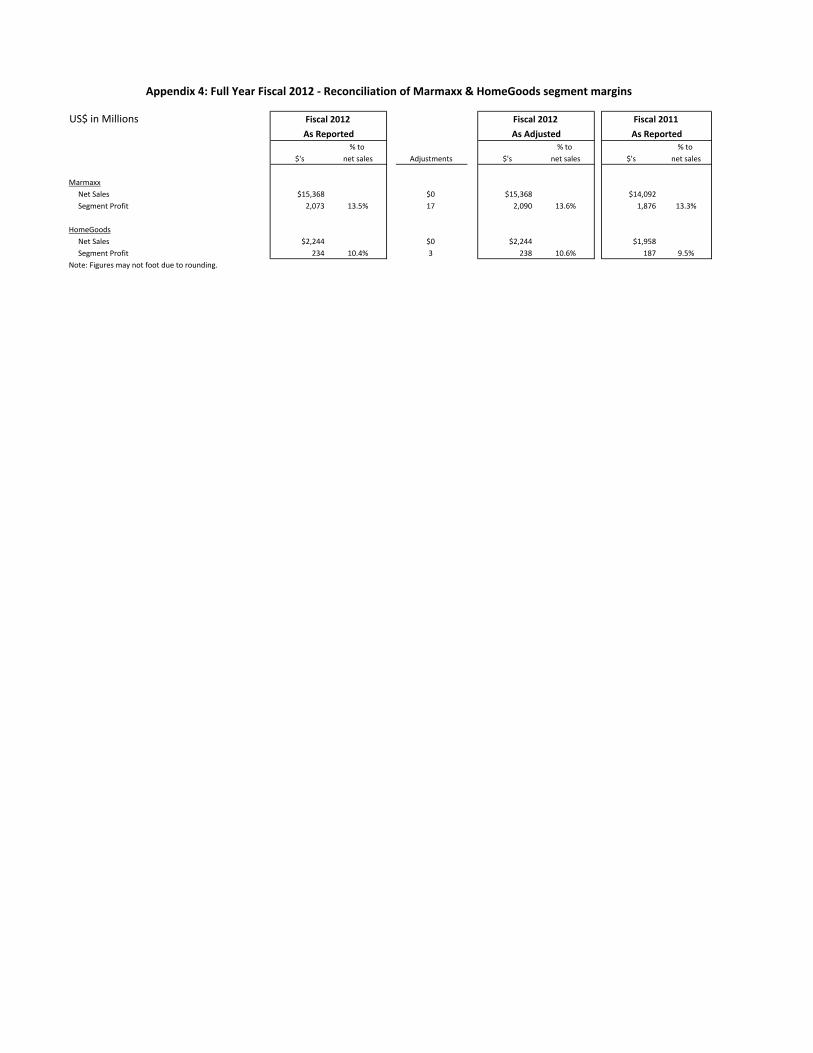
US$ in Millions Fiscal 2012 Fiscal 2012 Fiscal 2011
% to % to % to $'s net sales Adjustments $'s net sales $'s net sales
Marmaxx Net Sales $15,368 $0 $15,368 $14,092 Segment Profit 2,073 13.5% 17 2,090 13.6% 1,876 13.3%
HomeGoods Net Sales $2,244 $0 $2,244 $1,958 Segment Profit 234 10.4% 3 238 10.6% 187 9.5%Note: Figures may not foot due to rounding.
Appendix 4: Full Year Fiscal 2012 ‐ Reconciliation of Marmaxx & HomeGoods segment margins
As Reported As Adjusted As Reported