Embed Size (px)
Citation preview
http://e-flt.nus.edu.sg/
Electronic Journal of Foreign Language Teaching
2014, Vol. 11, Suppl. 1, pp. 165–182
© Centre for Language Studies
National University of Singapore
“To-do-or-not-to-do dilemma” Online: Blog and Essay
Writing Visualizations in a Blended-Format University
English Course
Terumi Miyazoe
Tokyo Denki University, Japan
Terry Anderson ([email protected])
Athabasca University, Canada
Shinichi Sato ([email protected])
Nihon Fukushi University, Japan
Abstract
This study reports on a one-year-and-a-half longitudinal case study that examined students’ behaviors and
learning outcomes under an online learning environment by using a blog visualization technique. Information
visualization is a new area of study that is currently being developed. However, research that examines this
topic in CALL was difficult to find. This study was conducted in a blended-format undergraduate English
course for students who are science majors. Throughout the semester, the students wrote blogs and essays in
English on Moodle. A blog visualization technique was also implemented. Three methods, namely, pre-/post-
writing proficiency tests, text analysis of blogs and essay posts on Moodle, and a post-semester online ques-
tionnaire, were used for the analysis. The students consistently exhibited high work performance throughout
the semester in terms of blog and essay posts. In addition, the students’ average writing proficiency score
improved as a class community. However, two groups, the progressed and the regressed, reacted differently
to the given learning environment, a phenomenon called “the to-do-or-not-to-do dilemma” in this study. Find-
ings show that a learning environment that visually presents students’ work performance can contribute to the
high performance of the entire group in an online learning environment. However, countermeasures against
demoralization and regression should be implemented.
1 Background
Visualization of the online behaviors of learners is a new research area in language education
and online education. Visibility is one component of what Dalsgaard and Paulsen (2009) and oth-
ers refer to as ‘transparency’ or the capacity to visualize one’s online activities and contributions
both individually or in comparison with the contributions of others. Visibility of participants’ con-
tributions in text form has been made possible by learning management systems such as Moodle.
Terumi Miyazoe, Terry Anderson and Shinichi Sato 166
Visualization, which allows students to see their participation as an image, can augment and en-
hance visibility and transparency.
Numerous visualization tools have been reported in specialized journals, such as “Information
Visualization.” These journals focus on the technical aspects of developing these tools. The most
relevant of these concepts for the current study is the concept of visual text analytics (Risch, Kao,
Poteet, & Wu, 2008), which supports the value of visualization of online writing (chat, blogs, fo-
rums, and wikis) to foster online participation and improve course management. Due to space limi-
tations, this study briefly introduces only one visualization tool from each genre (chat, blogs, fo-
rums, and wikis) that represents distinctive features of tools and for which we obtained permission
to reproduce graphics.
Janssen and his colleagues (Janssen, Erkens, & Kanselaar, 2007a; Janssen, Erkensa, Kan-
selaara, & Jaspersa, 2007b) developed a “Participation Tool” that visualizes chat interaction. In
this tool, the distance between a sphere and the group center indicates the number of messages that
a student has sent, and the size of a sphere indicates the average length of these messages (see Fig.
1).
Fig. 1. “Participation Tool” that visualizes chat interaction (Janssen et al., 2007a)
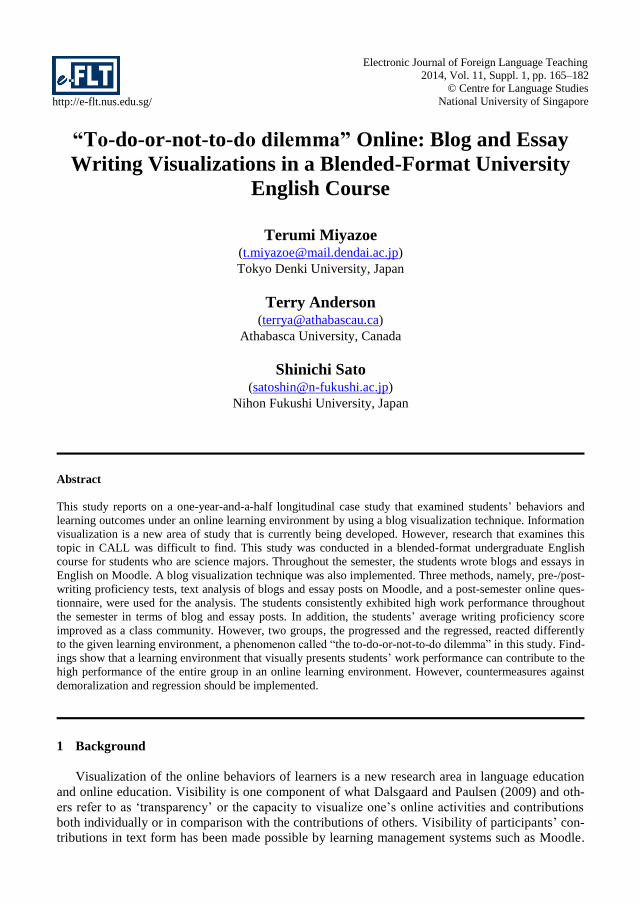
Dawson and his colleagues (Dawson, 2010; Dawson, 2008; Macfadyen & Dawson, 2010; Uni-
versity of Wollongong, 2009) developed a tool to visualize threaded discussions in a network for-
mat, in which the red circles in the upper-left corners represent students who are not participating
and it is argued that they are at risk of dropping out (see Fig. 2).
Blog and Essay Writing Visualizations in a Blended-Format University English Course 167
Fig. 2. Participation visualization in threaded conversations using Snapp (Dawson, 2010)
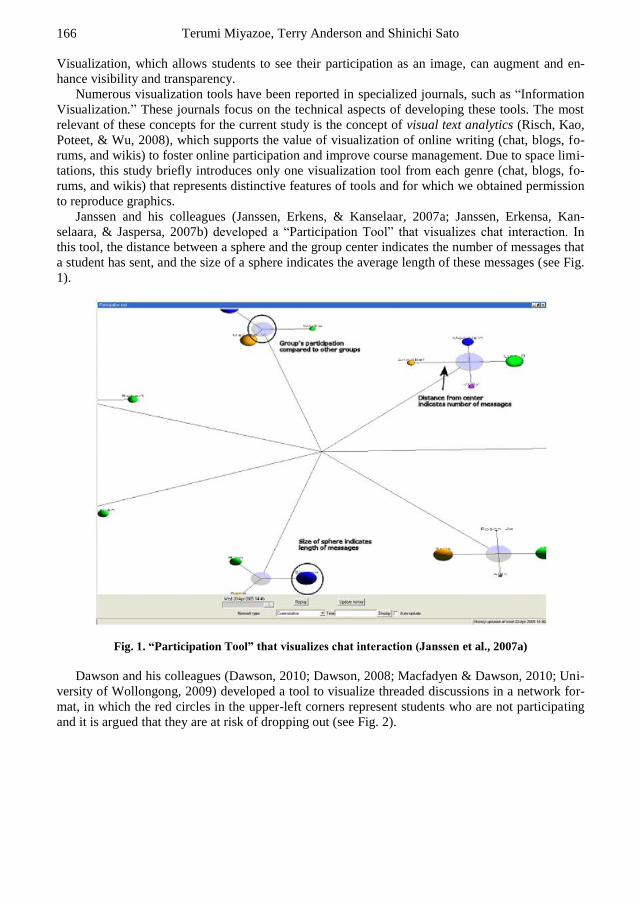
Indratmo and her colleagues (Indratmo, 2010; Indratmo & Vassileva, 2008; Indratmo,
Vassileva, & Gutwin, 2008) attempted to develop a blog visualization tool called iBlogVis that
represents the current status of blog activity. In this tool, the circles in the lower area represent the
number of comments within a topic entry (see Fig. 3).
Fig. 3. Visualization of iBlogVis Blog entries, length, comments and tags (Indratmo et al., 2008)
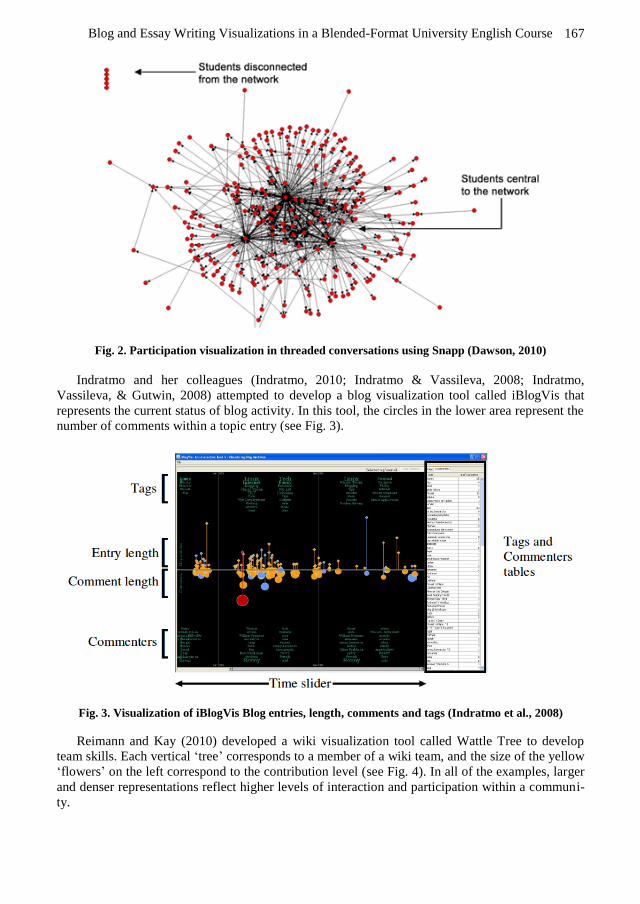
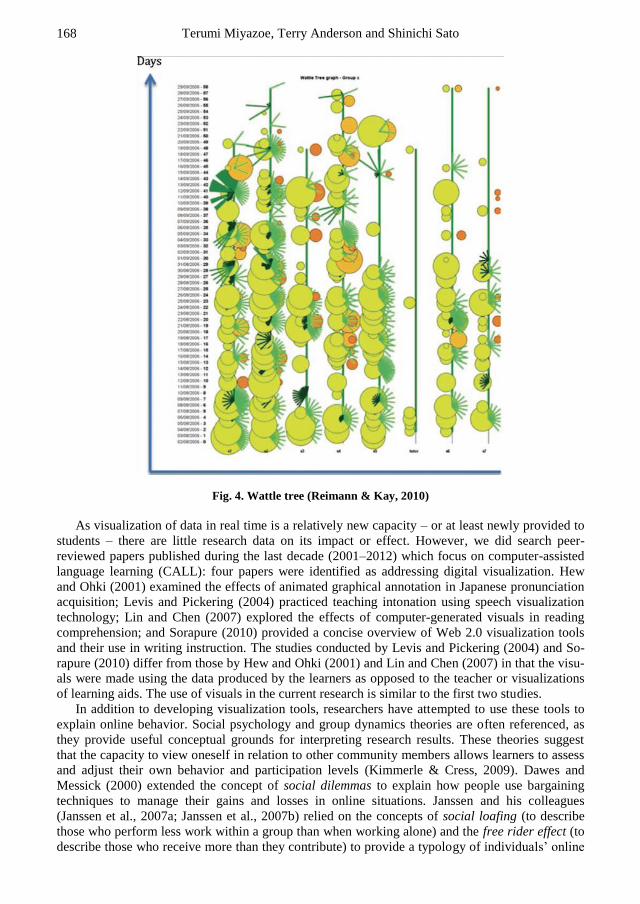
Reimann and Kay (2010) developed a wiki visualization tool called Wattle Tree to develop
team skills. Each vertical ‘tree’ corresponds to a member of a wiki team, and the size of the yellow
‘flowers’ on the left correspond to the contribution level (see Fig. 4). In all of the examples, larger
and denser representations reflect higher levels of interaction and participation within a communi-
ty.
Terumi Miyazoe, Terry Anderson and Shinichi Sato 168
Fig. 4. Wattle tree (Reimann & Kay, 2010)
As visualization of data in real time is a relatively new capacity – or at least newly provided to
students – there are little research data on its impact or effect. However, we did search peer-
reviewed papers published during the last decade (2001–2012) which focus on computer-assisted
language learning (CALL): four papers were identified as addressing digital visualization. Hew
and Ohki (2001) examined the effects of animated graphical annotation in Japanese pronunciation
acquisition; Levis and Pickering (2004) practiced teaching intonation using speech visualization
technology; Lin and Chen (2007) explored the effects of computer-generated visuals in reading
comprehension; and Sorapure (2010) provided a concise overview of Web 2.0 visualization tools
and their use in writing instruction. The studies conducted by Levis and Pickering (2004) and So-
rapure (2010) differ from those by Hew and Ohki (2001) and Lin and Chen (2007) in that the visu-
als were made using the data produced by the learners as opposed to the teacher or visualizations
of learning aids. The use of visuals in the current research is similar to the first two studies.
In addition to developing visualization tools, researchers have attempted to use these tools to
explain online behavior. Social psychology and group dynamics theories are often referenced, as
they provide useful conceptual grounds for interpreting research results. These theories suggest
that the capacity to view oneself in relation to other community members allows learners to assess
and adjust their own behavior and participation levels (Kimmerle & Cress, 2009). Dawes and
Messick (2000) extended the concept of social dilemmas to explain how people use bargaining
techniques to manage their gains and losses in online situations. Janssen and his colleagues
(Janssen et al., 2007a; Janssen et al., 2007b) relied on the concepts of social loafing (to describe
those who perform less work within a group than when working alone) and the free rider effect (to
describe those who receive more than they contribute) to provide a typology of individuals’ online
Blog and Essay Writing Visualizations in a Blended-Format University English Course 169
behaviors. To prevent stagnant online participation, Cress and Kimmerle (2007) referenced the
concept of anchoring effects; an anchor is a psychological term that refers to an initial standard
that guides people’s behavior (Furnhama & Boob, 2011; Tversky & Kahneman, 1974). Their study
suggests that the establishment of clear and high standards fosters productive contributions and
prevents loss of morale.
Research frameworks that link self-regulation and motivation also provide theoretical rationale
for the current study. A study by Chang (2010) on the effects of a web-based self-monitoring sys-
tem that records a learner’s English learning process provides a method of fostering self-regulatory
ability and increasing motivation for learning. The basic concept of self-monitoring involves al-
lowing learners to monitor their own work. In many systems, the teacher can also monitor individ-
ual students’ work as a course manager to gain insight into their work performance, both individu-
ally and holistically and, from this information, engage in appropriate teaching practices to assist
them.
In this study, student work in the form of blog posts is sharable among all participants (teacher
and students) as text and is also visually presented in graphical format (as shown in Figure 2). Vis-
ualization was used as a mirroring tool (Reimann & Kay, 2010; Soller, Martinez, Jermann, &
Muehlenbrock, 2005). That is, the visual information pertaining to a student’s work in relation to
the work of other class members was expected to increase the students’ awareness regarding their
own behaviors and those of their classmates, thereby effecting their locus of control (Rotter, 1966)
according to the level of commitment to the task.
2 Pilot studies
The current research series was patterned as a design-based research study (Anderson, 2005;
Anderson & Shattuck, 2012; Brown, 1992; Collins, 1992) that aimed to develop and integrate the-
ory and practice in natural educational settings. According to the Design-Based Research Collec-
tive (2003), such a study must focus on the design of learning environments in authentic settings,
and development and research must take place through continuous cycles of design, implementa-
tion, analysis, and redesign. The methods used must be able to connect the process with the out-
comes, and the results should lead to sharable design principles or theories. This study aims to
fulfill these criteria as much as possible.
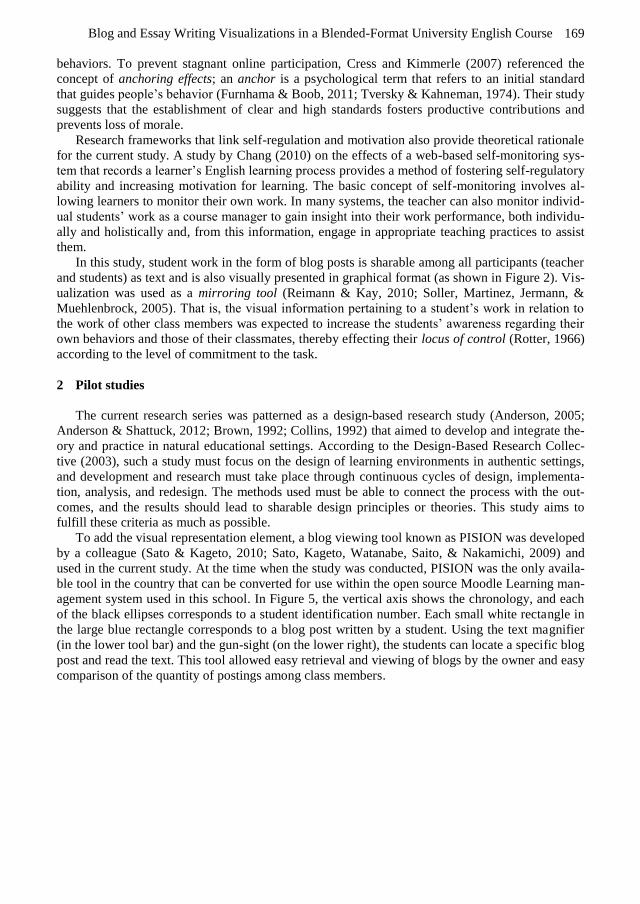
To add the visual representation element, a blog viewing tool known as PISION was developed
by a colleague (Sato & Kageto, 2010; Sato, Kageto, Watanabe, Saito, & Nakamichi, 2009) and
used in the current study. At the time when the study was conducted, PISION was the only availa-
ble tool in the country that can be converted for use within the open source Moodle Learning man-
agement system used in this school. In Figure 5, the vertical axis shows the chronology, and each
of the black ellipses corresponds to a student identification number. Each small white rectangle in
the large blue rectangle corresponds to a blog post written by a student. Using the text magnifier
(in the lower tool bar) and the gun-sight (on the lower right), the students can locate a specific blog
post and read the text. This tool allowed easy retrieval and viewing of blogs by the owner and easy
comparison of the quantity of postings among class members.
Terumi Miyazoe, Terry Anderson and Shinichi Sato 170
Fig. 5. View of Pision Blog Visualization Tool
Pilot 1 study was conducted in the fall semester with two classes containing students with dif-
ferent English abilities. The abilities of one class group (Class A) were observed to exceed those of
the other class group (Class B). These students were classified based on the pre-course placement
test. Visualization was implemented in the middle of the semester. Pilot 2 study was conducted
with one class group (Class C) of students with similar English abilities (at the same level as the
higher-level class in Pilot 1, as classified by the pre-course placement test) in the engineering de-
partment. Visualization was implemented at the beginning of the semester. Pre- and post-course
writing proficiency tests and a post-course online questionnaire were administered in Pilot 2 to
examine learning outcomes and students’ reactions.
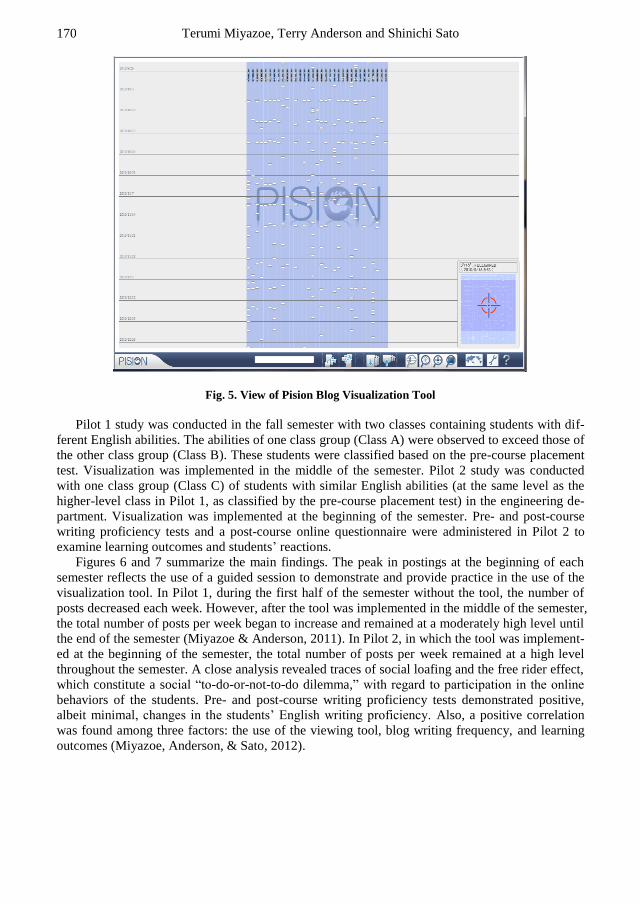
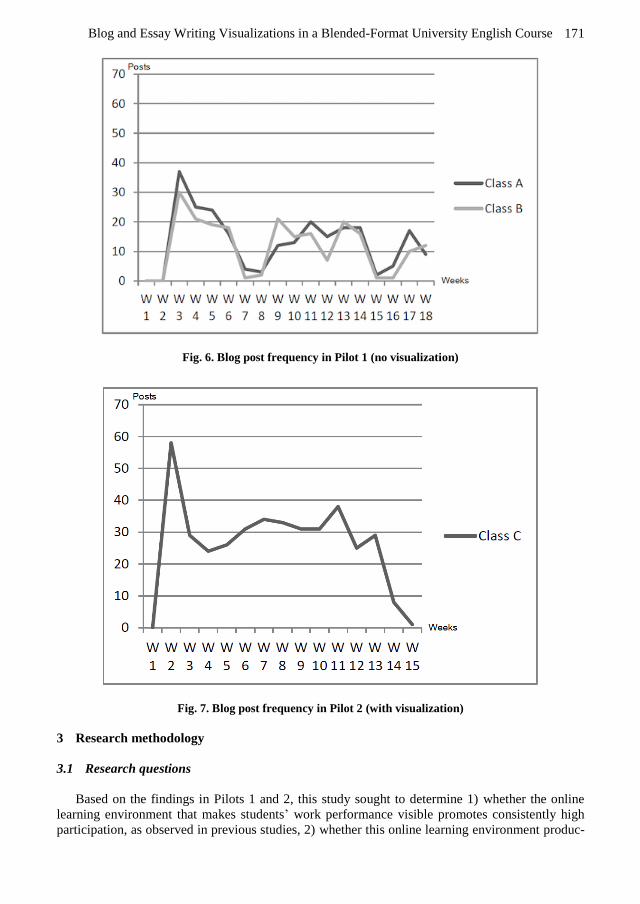
Figures 6 and 7 summarize the main findings. The peak in postings at the beginning of each
semester reflects the use of a guided session to demonstrate and provide practice in the use of the
visualization tool. In Pilot 1, during the first half of the semester without the tool, the number of
posts decreased each week. However, after the tool was implemented in the middle of the semester,
the total number of posts per week began to increase and remained at a moderately high level until
the end of the semester (Miyazoe & Anderson, 2011). In Pilot 2, in which the tool was implement-
ed at the beginning of the semester, the total number of posts per week remained at a high level
throughout the semester. A close analysis revealed traces of social loafing and the free rider effect,
which constitute a social “to-do-or-not-to-do dilemma,” with regard to participation in the online
behaviors of the students. Pre- and post-course writing proficiency tests demonstrated positive,
albeit minimal, changes in the students’ English writing proficiency. Also, a positive correlation
was found among three factors: the use of the viewing tool, blog writing frequency, and learning
outcomes (Miyazoe, Anderson, & Sato, 2012).
Blog and Essay Writing Visualizations in a Blended-Format University English Course 171
Fig. 6. Blog post frequency in Pilot 1 (no visualization)
Fig. 7. Blog post frequency in Pilot 2 (with visualization)
3 Research methodology
3.1 Research questions
Based on the findings in Pilots 1 and 2, this study sought to determine 1) whether the online
learning environment that makes students’ work performance visible promotes consistently high
participation, as observed in previous studies, 2) whether this online learning environment produc-
Terumi Miyazoe, Terry Anderson and Shinichi Sato 172
es positive learning outcomes, and 3) what group mechanism can contribute to increases in learn-
ing outcomes.
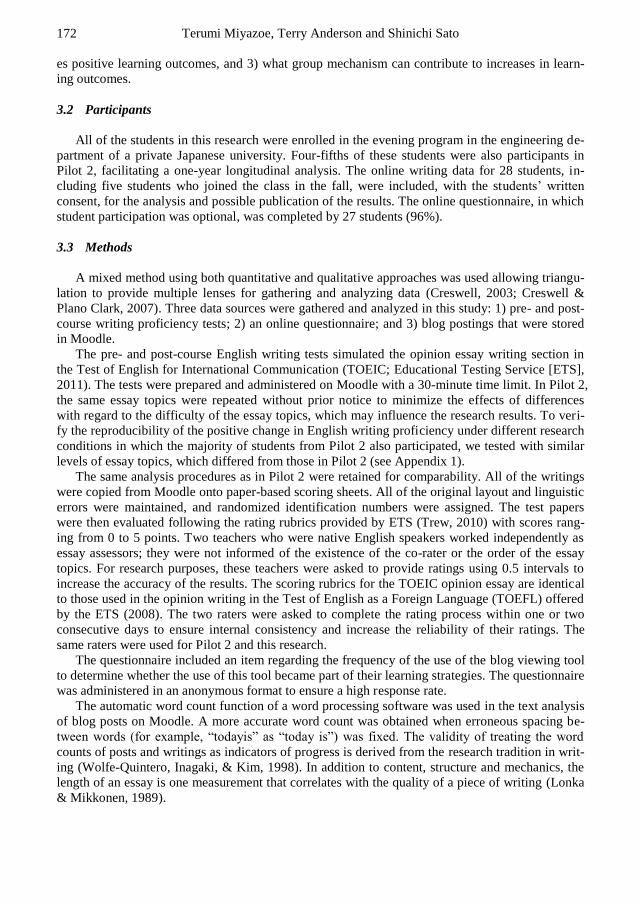
3.2 Participants
All of the students in this research were enrolled in the evening program in the engineering de-
partment of a private Japanese university. Four-fifths of these students were also participants in
Pilot 2, facilitating a one-year longitudinal analysis. The online writing data for 28 students, in-
cluding five students who joined the class in the fall, were included, with the students’ written
consent, for the analysis and possible publication of the results. The online questionnaire, in which
student participation was optional, was completed by 27 students (96%).
3.3 Methods
A mixed method using both quantitative and qualitative approaches was used allowing triangu-
lation to provide multiple lenses for gathering and analyzing data (Creswell, 2003; Creswell &
Plano Clark, 2007). Three data sources were gathered and analyzed in this study: 1) pre- and post-
course writing proficiency tests; 2) an online questionnaire; and 3) blog postings that were stored
in Moodle.
The pre- and post-course English writing tests simulated the opinion essay writing section in
the Test of English for International Communication (TOEIC; Educational Testing Service [ETS],
2011). The tests were prepared and administered on Moodle with a 30-minute time limit. In Pilot 2,
the same essay topics were repeated without prior notice to minimize the effects of differences
with regard to the difficulty of the essay topics, which may influence the research results. To veri-
fy the reproducibility of the positive change in English writing proficiency under different research
conditions in which the majority of students from Pilot 2 also participated, we tested with similar
levels of essay topics, which differed from those in Pilot 2 (see Appendix 1).
The same analysis procedures as in Pilot 2 were retained for comparability. All of the writings
were copied from Moodle onto paper-based scoring sheets. All of the original layout and linguistic
errors were maintained, and randomized identification numbers were assigned. The test papers
were then evaluated following the rating rubrics provided by ETS (Trew, 2010) with scores rang-
ing from 0 to 5 points. Two teachers who were native English speakers worked independently as
essay assessors; they were not informed of the existence of the co-rater or the order of the essay
topics. For research purposes, these teachers were asked to provide ratings using 0.5 intervals to
increase the accuracy of the results. The scoring rubrics for the TOEIC opinion essay are identical
to those used in the opinion writing in the Test of English as a Foreign Language (TOEFL) offered
by the ETS (2008). The two raters were asked to complete the rating process within one or two
consecutive days to ensure internal consistency and increase the reliability of their ratings. The
same raters were used for Pilot 2 and this research.
The questionnaire included an item regarding the frequency of the use of the blog viewing tool
to determine whether the use of this tool became part of their learning strategies. The questionnaire
was administered in an anonymous format to ensure a high response rate.
The automatic word count function of a word processing software was used in the text analysis
of blog posts on Moodle. A more accurate word count was obtained when erroneous spacing be-
tween words (for example, “todayis” as “today is”) was fixed. The validity of treating the word
counts of posts and writings as indicators of progress is derived from the research tradition in writ-
ing (Wolfe-Quintero, Inagaki, & Kim, 1998). In addition to content, structure and mechanics, the
length of an essay is one measurement that correlates with the quality of a piece of writing (Lonka
& Mikkonen, 1989).
Blog and Essay Writing Visualizations in a Blended-Format University English Course 173
3.4 Course design
For comparative purposes, the course design and research conditions were the same as those in
Pilots 1 and 2, including the blog visualization technique, pseudonym use, and the recommenda-
tion (without penalty for not posting) to write at least one blog post per week.
In the two previous studies as well as our study, the course objectives were to improve basic
English for science and technical purposes as necessary for engineering. In terms of curriculum
requirements, four types of skills (i.e. reading, listening, speaking, and writing) were covered and
thus only one-fourth of the course design could be devoted to writing. The courses were designed
in a blended-format with both weekly face-to-face meetings and out-of-class online writing activi-
ties. Other components of the online portion including course readings, gradebook, and so forth,
was developed in Moodle. The students used pseudonyms in this system to reduce the possible
effects of existing social relationships in the face-to-face mode portion of the course (Miyazoe &
Anderson, 2011).
In the current study, in addition to the blog writing assignments, five opinion essays (approxi-
mately one essay every two weeks) were required as part of the one-year course design. This as-
signment was accompanied by a guidance session on the structure of academic writing before the
due date for the second essay assignment – this became the appropriately challenging “anchor”
that was expected as the final outcome for the essay assignments.
4 Results
4.1 Online participation
In this research, the participation of the students was reflected by their online posting frequen-
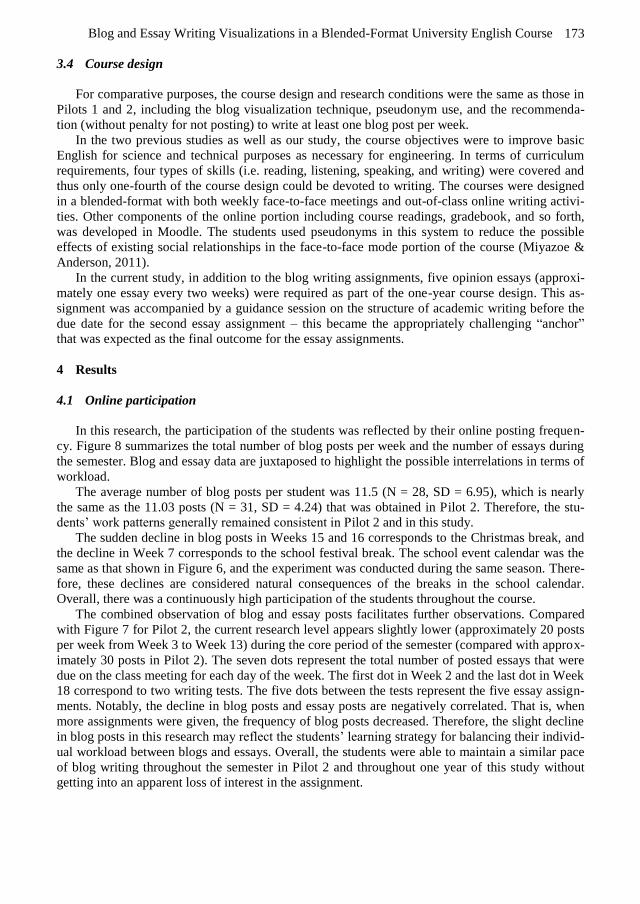
cy. Figure 8 summarizes the total number of blog posts per week and the number of essays during
the semester. Blog and essay data are juxtaposed to highlight the possible interrelations in terms of
workload.
The average number of blog posts per student was 11.5 (N = 28, SD = 6.95), which is nearly
the same as the 11.03 posts (N = 31, SD = 4.24) that was obtained in Pilot 2. Therefore, the stu-
dents’ work patterns generally remained consistent in Pilot 2 and in this study.
The sudden decline in blog posts in Weeks 15 and 16 corresponds to the Christmas break, and
the decline in Week 7 corresponds to the school festival break. The school event calendar was the
same as that shown in Figure 6, and the experiment was conducted during the same season. There-
fore, these declines are considered natural consequences of the breaks in the school calendar.
Overall, there was a continuously high participation of the students throughout the course.
The combined observation of blog and essay posts facilitates further observations. Compared
with Figure 7 for Pilot 2, the current research level appears slightly lower (approximately 20 posts
per week from Week 3 to Week 13) during the core period of the semester (compared with approx-
imately 30 posts in Pilot 2). The seven dots represent the total number of posted essays that were
due on the class meeting for each day of the week. The first dot in Week 2 and the last dot in Week
18 correspond to two writing tests. The five dots between the tests represent the five essay assign-
ments. Notably, the decline in blog posts and essay posts are negatively correlated. That is, when
more assignments were given, the frequency of blog posts decreased. Therefore, the slight decline
in blog posts in this research may reflect the students’ learning strategy for balancing their individ-
ual workload between blogs and essays. Overall, the students were able to maintain a similar pace
of blog writing throughout the semester in Pilot 2 and throughout one year of this study without
getting into an apparent loss of interest in the assignment.
Terumi Miyazoe, Terry Anderson and Shinichi Sato 174
*T – Test; E – Essay assignment
Fig. 8. Total number of posts per week during the semester
4.2 Use of the blog visualization tool
In response to the questionnaire item regarding the frequency of use of the visualization tool,
six students answered “almost never,” 15 students answered “occasionally,” six students answered
“sometimes,” and no students marked “frequently.” In Pilot 2, of the 29 students who provided
consent, 17 students were categorized as rare users, two students were categorized as occasional
users, and 10 students were categorized as frequent users. A direct comparison is not appropriate
because the class composition differs. However, students that participated in this study during the
second semester may have used the tool somewhat less frequently than did the students in Pilot 2
in the first semester.
4.3 Learning outcomes
In this research, learning outcomes are regarded as the acquisition of basic academic English
writing proficiency as assessed by the teacher/markers. First, the reliability of the co-ratings is
examined. Subsequently, the pre- and post-course results over the course of one semester are ex-
amined. Finally, the results for the one-year period, focusing on the data of those students who
participated in both Pilot 2 and this research, are considered the longitudinal effects of the learning
experience.
4.3.1 Reliability of the ratings
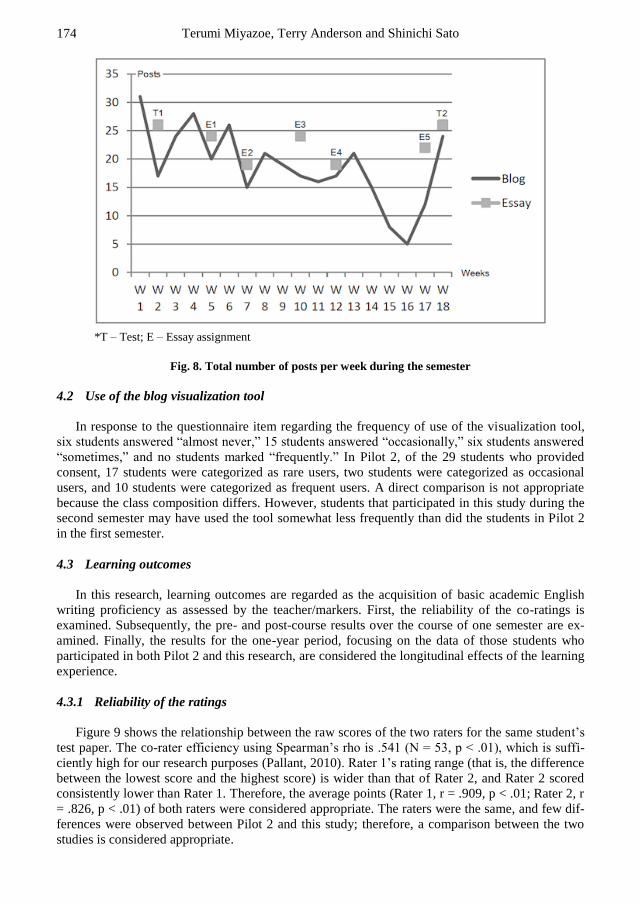
Figure 9 shows the relationship between the raw scores of the two raters for the same student’s
test paper. The co-rater efficiency using Spearman’s rho is .541 (N = 53, p < .01), which is suffi-
ciently high for our research purposes (Pallant, 2010). Rater 1’s rating range (that is, the difference
between the lowest score and the highest score) is wider than that of Rater 2, and Rater 2 scored
consistently lower than Rater 1. Therefore, the average points (Rater 1, r = .909, p < .01; Rater 2, r
= .826, p < .01) of both raters were considered appropriate. The raters were the same, and few dif-
ferences were observed between Pilot 2 and this study; therefore, a comparison between the two
studies is considered appropriate.
Blog and Essay Writing Visualizations in a Blended-Format University English Course 175
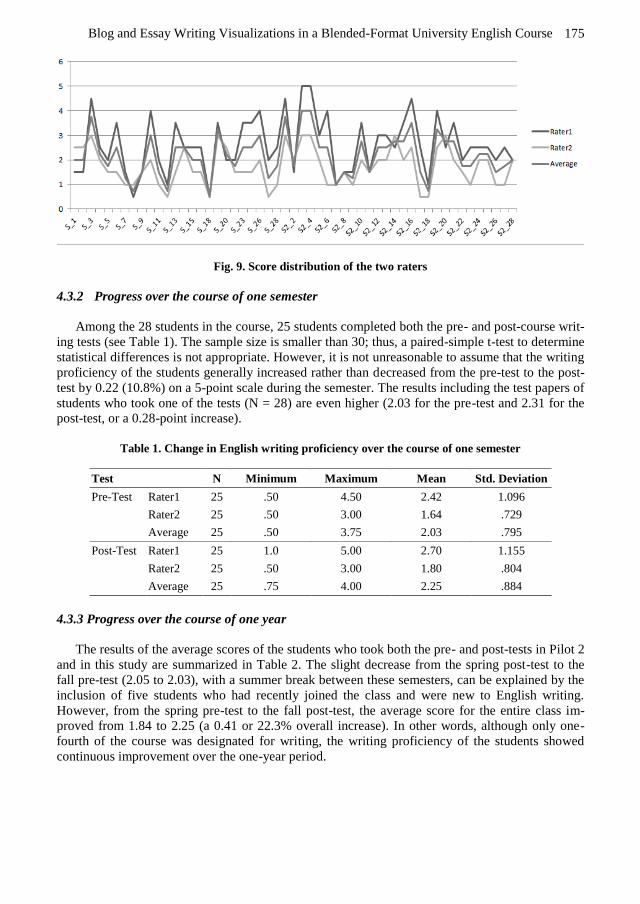
Fig. 9. Score distribution of the two raters
4.3.2 Progress over the course of one semester
Among the 28 students in the course, 25 students completed both the pre- and post-course writ-
ing tests (see Table 1). The sample size is smaller than 30; thus, a paired-simple t-test to determine
statistical differences is not appropriate. However, it is not unreasonable to assume that the writing
proficiency of the students generally increased rather than decreased from the pre-test to the post-
test by 0.22 (10.8%) on a 5-point scale during the semester. The results including the test papers of
students who took one of the tests (N = 28) are even higher (2.03 for the pre-test and 2.31 for the
post-test, or a 0.28-point increase).
Table 1. Change in English writing proficiency over the course of one semester
Test N Minimum Maximum Mean Std. Deviation
Pre-Test Rater1 25 .50 4.50 2.42 1.096
Rater2 25 .50 3.00 1.64 .729
Average 25 .50 3.75 2.03 .795
Post-Test Rater1 25 1.0 5.00 2.70 1.155
Rater2 25 .50 3.00 1.80 .804
Average 25 .75 4.00 2.25 .884
4.3.3 Progress over the course of one year
The results of the average scores of the students who took both the pre- and post-tests in Pilot 2
and in this study are summarized in Table 2. The slight decrease from the spring post-test to the
fall pre-test (2.05 to 2.03), with a summer break between these semesters, can be explained by the
inclusion of five students who had recently joined the class and were new to English writing.
However, from the spring pre-test to the fall post-test, the average score for the entire class im-
proved from 1.84 to 2.25 (a 0.41 or 22.3% overall increase). In other words, although only one-
fourth of the course was designated for writing, the writing proficiency of the students showed
continuous improvement over the one-year period.
Terumi Miyazoe, Terry Anderson and Shinichi Sato 176
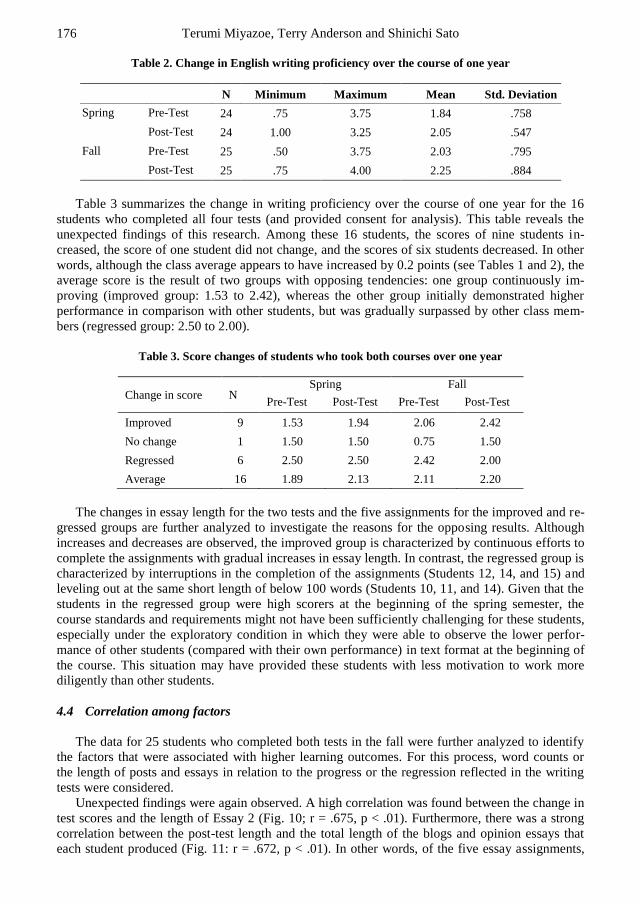
Table 2. Change in English writing proficiency over the course of one year
N Minimum Maximum Mean Std. Deviation
Spring Pre-Test 24 .75 3.75 1.84 .758
Post-Test 24 1.00 3.25 2.05 .547
Fall Pre-Test 25 .50 3.75 2.03 .795
Post-Test 25 .75 4.00 2.25 .884
Table 3 summarizes the change in writing proficiency over the course of one year for the 16
students who completed all four tests (and provided consent for analysis). This table reveals the
unexpected findings of this research. Among these 16 students, the scores of nine students in-
creased, the score of one student did not change, and the scores of six students decreased. In other
words, although the class average appears to have increased by 0.2 points (see Tables 1 and 2), the
average score is the result of two groups with opposing tendencies: one group continuously im-
proving (improved group: 1.53 to 2.42), whereas the other group initially demonstrated higher
performance in comparison with other students, but was gradually surpassed by other class mem-
bers (regressed group: 2.50 to 2.00).
Table 3. Score changes of students who took both courses over one year
Change in score N Spring Fall
Pre-Test Post-Test Pre-Test Post-Test
Improved 9 1.53 1.94 2.06 2.42
No change 1 1.50 1.50 0.75 1.50
Regressed 6 2.50 2.50 2.42 2.00
Average 16 1.89 2.13 2.11 2.20
The changes in essay length for the two tests and the five assignments for the improved and re-
gressed groups are further analyzed to investigate the reasons for the opposing results. Although
increases and decreases are observed, the improved group is characterized by continuous efforts to
complete the assignments with gradual increases in essay length. In contrast, the regressed group is
characterized by interruptions in the completion of the assignments (Students 12, 14, and 15) and
leveling out at the same short length of below 100 words (Students 10, 11, and 14). Given that the
students in the regressed group were high scorers at the beginning of the spring semester, the
course standards and requirements might not have been sufficiently challenging for these students,
especially under the exploratory condition in which they were able to observe the lower perfor-
mance of other students (compared with their own performance) in text format at the beginning of
the course. This situation may have provided these students with less motivation to work more
diligently than other students.
4.4 Correlation among factors
The data for 25 students who completed both tests in the fall were further analyzed to identify
the factors that were associated with higher learning outcomes. For this process, word counts or
the length of posts and essays in relation to the progress or the regression reflected in the writing
tests were considered.
Unexpected findings were again observed. A high correlation was found between the change in
test scores and the length of Essay 2 (Fig. 10; r = .675, p < .01). Furthermore, there was a strong
correlation between the post-test length and the total length of the blogs and opinion essays that
each student produced (Fig. 11: r = .672, p < .01). In other words, of the five essay assignments,
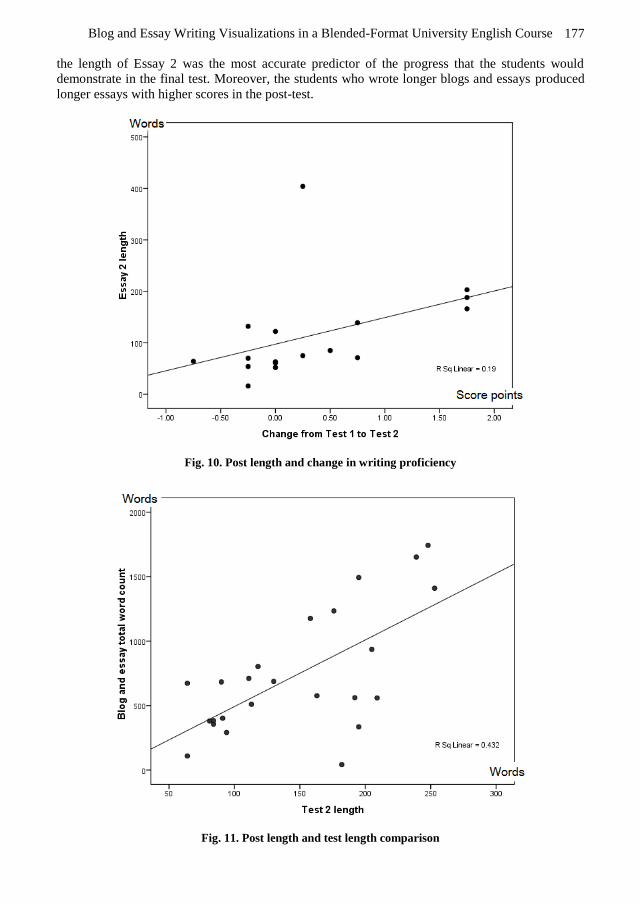
Blog and Essay Writing Visualizations in a Blended-Format University English Course 177
the length of Essay 2 was the most accurate predictor of the progress that the students would
demonstrate in the final test. Moreover, the students who wrote longer blogs and essays produced
longer essays with higher scores in the post-test.
Fig. 10. Post length and change in writing proficiency
Fig. 11. Post length and test length comparison
Terumi Miyazoe, Terry Anderson and Shinichi Sato 178
Table 4 summarizes the average length of all student essays. Further analysis reveals that the
length of Essay 2 was strongly correlated with many other items, such as the length of Essays 3 to
5, the total word count of all essays, total blog length and the average length of blog posts. Accord-
ing to the results in Table 2, the students demonstrated steady progress and internalization of the
target language in terms of the change in length from Essay 1 to Essay 5. Furthermore, the accu-
mulation of blog writing reflected the steady progression of learning outcomes over the semester
in the post-test, that is, improvements in both content and structure were observed.
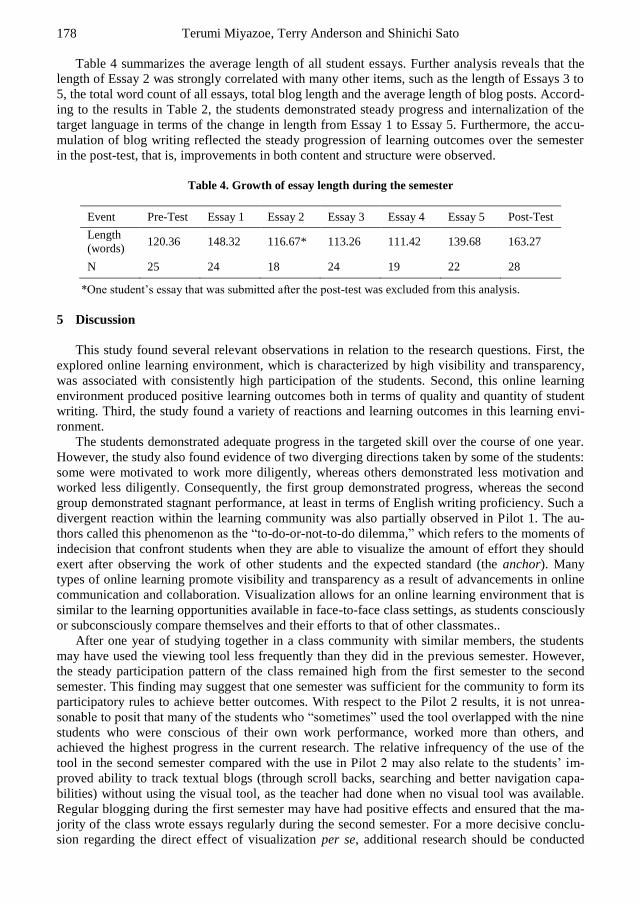
Table 4. Growth of essay length during the semester
Event Pre-Test Essay 1 Essay 2 Essay 3 Essay 4 Essay 5 Post-Test
Length
(words) 120.36 148.32 116.67* 113.26 111.42 139.68 163.27
N 25 24 18 24 19 22 28
*One student’s essay that was submitted after the post-test was excluded from this analysis.
5 Discussion
This study found several relevant observations in relation to the research questions. First, the
explored online learning environment, which is characterized by high visibility and transparency,
was associated with consistently high participation of the students. Second, this online learning
environment produced positive learning outcomes both in terms of quality and quantity of student
writing. Third, the study found a variety of reactions and learning outcomes in this learning envi-
ronment.
The students demonstrated adequate progress in the targeted skill over the course of one year.
However, the study also found evidence of two diverging directions taken by some of the students:
some were motivated to work more diligently, whereas others demonstrated less motivation and
worked less diligently. Consequently, the first group demonstrated progress, whereas the second
group demonstrated stagnant performance, at least in terms of English writing proficiency. Such a
divergent reaction within the learning community was also partially observed in Pilot 1. The au-
thors called this phenomenon as the “to-do-or-not-to-do dilemma,” which refers to the moments of
indecision that confront students when they are able to visualize the amount of effort they should
exert after observing the work of other students and the expected standard (the anchor). Many
types of online learning promote visibility and transparency as a result of advancements in online
communication and collaboration. Visualization allows for an online learning environment that is
similar to the learning opportunities available in face-to-face class settings, as students consciously
or subconsciously compare themselves and their efforts to that of other classmates..
After one year of studying together in a class community with similar members, the students
may have used the viewing tool less frequently than they did in the previous semester. However,
the steady participation pattern of the class remained high from the first semester to the second
semester. This finding may suggest that one semester was sufficient for the community to form its
participatory rules to achieve better outcomes. With respect to the Pilot 2 results, it is not unrea-
sonable to posit that many of the students who “sometimes” used the tool overlapped with the nine
students who were conscious of their own work performance, worked more than others, and
achieved the highest progress in the current research. The relative infrequency of the use of the
tool in the second semester compared with the use in Pilot 2 may also relate to the students’ im-
proved ability to track textual blogs (through scroll backs, searching and better navigation capa-
bilities) without using the visual tool, as the teacher had done when no visual tool was available.
Regular blogging during the first semester may have had positive effects and ensured that the ma-
jority of the class wrote essays regularly during the second semester. For a more decisive conclu-
sion regarding the direct effect of visualization per se, additional research should be conducted
Blog and Essay Writing Visualizations in a Blended-Format University English Course 179
with focus on an environment that provides visualization for both blogs and forum essays, if a
suitable system is available.
Two findings may be alarming with regard to course design when implementing visualization
techniques. The first finding pertains to the six students (Table 3) whose performance showed a
slight regression over the one-year period. The provision of the monitoring system may have
caused students who initially demonstrated higher performance to subsequently exert less effort –
the previously mentioned social loafing – in this learning community. However, the nine students
who initially demonstrated low performance steadily progressed in overtaking the six students who
regressed. If the monitoring system had not been used, these students may not have improved as
readily as observed. The second finding pertains to the large effect of Essay 2 on the remainder of
the progress and the amount of writing that led to success in the post-test. The guidance session
prior to Essay 2 served as the anchor and was conducted to show the students how to approach the
assignments. In other words, decisions regarding individual work patterns in the learning commu-
nity to commit or not commit to the goal may be a critical work performance predictor for the rest
of the course. After the individual members of a class community make decisions regarding their
working mode, small adjustments to the course design may no longer be useful. It may be neces-
sary for teachers to encourage the self-disciplinary ability of the majority (i.e. more than the half of
the class) of the class members at an early stage in the course to ensure that a class chooses to
work diligently, which eventually results in positive outcomes (i.e. improvement in the average
score) for the class.
By using visualization, a new perspective may be revealed by a comparison of different class
behaviors using different leading figures to determine the pace of the work performance of the
entire class. For example, groups could be established with zero, three, and five dummy students
who work regularly and/or demonstrate higher performance than the initial class level. The inclu-
sion of dummy students is possible with the use of pseudonyms. Because this research design in-
cludes “deception” (i.e. not informing participants of the true conditions of the study) in terms of
research ethics (Cohen, Manion, & Morrison, 2007, pp. 66–67), the authors of this paper did not
attempt such a design.
6 Conclusion
This study found that an online learning environment that uses a visual technique that allows
students to compare the quality, length and frequency of their postings with other students can be
an effective intervention that is associated with steady and positive work performance. These data
obviously can be useful for teachers in monitoring the performance of students and in developing
remedial learning activities. However, it also shows the value of sharing visual information on
work performance not only with teachers or administrators, but also with students. This visible and
transparent environment may enhance learning in an online portion of a course, including the
learning strategies and social dilemmas with which a face-to-face mode is associated. This visibil-
ity and transparency of learning (both one’s own and that of others) is one of the benefits associat-
ed with online learning (Dalsgaard & Paulsen, 2009)
Finally, the study points to the need for research that compares different representations of
monitoring systems. In this research, a blog viewing tool was used to observe students online be-
haviors. However, if more precise information such as word count and total number of posts is
also presented visually, an even higher level of self-awareness that encourages self-disciplinary
abilities may be expected. Alternatively, there may be an optimal level of visibility that encourages
the most effective level of participation, beyond which an adverse effect may appear.
Acknowledgements
We would like to thank Shinichi Sato for his kind technical support for the use of the blog-
viewing tool PISION, which was tested in this article. We would like to express gratitude to In-
dratmo and Julita Vassileva for their permission to reproduce iBlogVis graphics, Shane Dawson
Terumi Miyazoe, Terry Anderson and Shinichi Sato 180
and the University of Wollongong for the Social Network Diagram, Peter Reimann for the Wattle
Tree diagram, and Jeroen Janssen for the Participation Tool. The following credits are provided in
accordance with the specific demands from the publishers for their reproduction permissions:
Figure 1 is reprinted from Computers and Education, 49/4, Jeroen Janssen, Gijsbert Erkensa,
Gellof Kanselaara, and Jos Jaspersa, Visualization of participation: Does it contribute to successful
computer-supported collaborative learning?, 1037–1065, Copyright 2007, with permission from
Elsevier.
Figure 4 is reprinted from Peter Reimann, and Judy Kay, 2010. Learning to learn and work in
net-based teams: Supporting emergent collaboration with visualization tools. In Designs for learn-
ing environments of the future., eds. Michael J. Jacobson and Peter Reimann, 143–188, Figure 6.2,
with kind permission from Springer Science+Business Media B.V.
References Anderson, T. (2005). Design-based research and its application to a call centre innovation in distance educa-
tion. Canadian Journal of Learning and Technology, 31(2)
Anderson, T., & Shattuck, J. (2012). Design-based research: A decade of progress in education research?
Educational Researcher, 41(1), 16–25.
Brown, A. L. (1992). Design experiments: Theoretical and methodological challenges in creating complex
interventions in classroom settings. Journal of the Learning Sciences, 2(2), 141–178.
Chang, M. (2010). Effects of self-monitoring on web-based language learnerʼs performance and motivation.
CALICO Journal, 27(2), 298–310.
Cohen, L., Manion, L., & Morrison, K. (2007). Research methods in education. London & New York:
Routledge Taylor & Francis Group.
Collins, A. (1992). Towards a design science of education. In E. Scanlon & T. O'Shea (Eds.), New directions
in educational technology (pp. 15–22). Berlin: Springer.
Cress, U., & Kimmerle, J. (2007). Guidelines and feedback in information exchange: The impact of behavior-
al anchors and descriptive norms in a social dilemma. Group Dynamics: Theory, Research, and Practice,
11(1), 42–53.
Creswell, J. W. (2003). Research design: Qualitative, quantitative, and mixed methods approaches (2nd ed.).
Oaks, London & New Delhi: Saga Publications, Inc.
Creswell, J. W., & Plano Clark, V. L. (2007). Designing and conducting mixed methods research Sage Publi-
cations, Inc.
Dalsgaard, C., & Paulsen, M. (2009). Transparency in cooperative online education. International review of
Research in Open and Distance Learning, 10(3). Retrieved from http://www.irrodl.org/index.php/
irrodl/article/view/671/1267
Dawes, R. M., & Messick, D. M. (2000). Social dilemmas. International Journal of Psychology, 35(2), 111–
116.
Dawson, S. (2010). 'Seeing' the learning community: An exploration of the development of a resource for
monitoring online student networking. British Journal of Educational Technology, 41(5), 736–752.
Dawson, S. (2008). A study of the relationship between student social networks and sense of community.
Educational Technology & Society, 11(3), 224–238.
Design-Based Research Collective. (2003). Design-based research: An emerging paradigm for educational
inquiry. Educational Researcher, 32(1), 5–8.
Educational Testing Service. (2008). TOEFL iBT test independent writing rubrics (scoring standards). Re-
trieved from www.ets.org/Media/Tests/TOEFL/.../Integrated_Writing_Rubrics_2008.pdf
Educational Testing Service. (2011). TOEIC. Retrieved from http://www.ets.org/toeic
Furnhama, A., & Boob, H. C. (2011). A literature review of the anchoring effect. The Journal of Socio-
Economics, 40, 35–42.
Hew, S., & Ohki, M. (2001). A study on the effectiveness and usefulness of animated graphical annotation in
japanese CALL. ReCALL Journal, 13(2), 245–260.
Indratmo, J. (2010). Supporting exploratory browsing with visualization of social interaction history (Un-
published PhD thesis). University of Saskatchewan, Saskatoon, Canada.
Indratmo, J., & Vassileva, J. (2008). iBlogVis: An interactive blog visualization tool. In The Proceedings of
the Sixth Artificial Intelligence for Interactive Digital Entertainment 2008 Conference (pp. 190–191) ,Palo
Alto, CA: AAAI.
Indratmo, J., Vassileva, J., & Gutwin, C. (2008). Exploring blog archives with interactive visualization. Paper
presented at the Working Conference on Advanced Visual Interfaces, Napoli, Italy.
Blog and Essay Writing Visualizations in a Blended-Format University English Course 181
Janssen, J., Erkens, G., & Kanselaar, G. (2007a). Visualization of agreement and discussion processes during
computer-supported collaborative learning. Computers in Human Behavior, 23, 1105–1125.
Janssen, J., Erkensa, G., Kanselaara, G., & Jaspersa, J. (2007b). Visualization of participation: Does it con-
tribute to successful computer-supported collaborative learning? Computers and Education, 49(4), 1037–
1065.
Kimmerle, J., & Cress, U. (2009). Visualization of group membersʼ participation: How information-
presentation formats support information exchange. Social Science Computer Review, 27, 243–261.
Levis, J., & Pickering, L. (2004). Teaching intonation in discourse using speech visualization technology.
System, 32, 505–524.
Lin, H., & Chen, T. (2007). Reading authentic EFL text using visualization and advance organizers in a mul-
timedia learning environment. Language Learning & Technology, 11(3), 83–106.
Lonka, K., & Mikkonen, V. (1989). Why does the length of an essay-type answer contribute to examination
marks? British Journal of Educational Psychology, 59(2), 220–231. Retrieved from http://dx.doi.org/
10.1111/j.2044-8279.1989.tb03093.x
Macfadyen, L., & Dawson, S. (2010). Mining LMS data to develop an “early warning system” for educators:
A proof of concept. Computers & Education, 54(2), 588–599.
Miyazoe, T., & Anderson, T. (2011). Viewing and participating: Blog visualization and its learning outcomes
in blended learning. In The Proceedings of the 2011 International Professional Communication Confer-
ence (IEEE-IPCC; pp. 1–9). Cincinnati, OH: IEEE.
Miyazoe, T., Anderson, T., & Sato, S. (2012). An exploratory study on blog visualization and learners’ reac-
tions in an online learning community. Journal of Educational Media and Research, 19(1), 35–46.
Pallant, J. (2010). SPSS survival manual: A step by step guide to data analysis using the SPSS program. New
York: McGraw Hill.
Reimann, P., & Kay, J. (2010). Learning to learn and work in net-based teams: Supporting emergent collabo-
ration with visualization tools. In M. J. Jacobson & P. Reimann (Eds.), Designs for learning environments
of the future (pp. 143–188). New York: SpringerLink.
Risch, J., Kao, A., Poteet, S. R., & Wu, J. Y.-J. (2008). Text visualization for visual text analytics. Visual
Data Mining: Lecture Notes in Computer Science, 4404, 154–171.
Sato, S., Kageto, M., Watanabe, T., Saito, T., & Nakamichi, M. (2009). Proposal of a system to support
learners' reflection by visualizing data stored in SNS through experiential learning. Proceedings of World
Conference on Educational Multimedia, Hypermedia and Telecommunications (pp. 3457–3466). Honolu-
lu, HI: AACE.
Sato, S., & Kageto, M. (2010). Practice of promoting reflection in problem-based learning by using social
media and its viewer. Proceedings of World Conference on Educational Multimedia, Hypermedia and Tel-
ecommunications 2010 (pp. 3481–3489). Toronto: AACE.
Soller, A., Martinez, A., Jermann, P., & Muehlenbrock, M. (2005). From mirroring to guiding: A review of
state of the art technology for supporting collaborative learning. International Journal of Artificial Intelli-
gence in Education, 15(4), 261–290.
Sorapure, M. (2010). Information visualization, web 2.0, and the teaching of writing. Computers and Compo-
sition, 27, 59–70.
Trew, G. (2010). Tactics for TOEIC speaking and writing tests. Oxford: Oxford University Press.
Tversky, A., & Kahneman, D. (1974). Judgment under uncertainty: Heuristics and biases. Science, 185,
1124–1131.
University of Wollongong. (2009). Seeing networks. Retrieved from http://research.uow.edu.au/
learningnetworks/seeing/about/index.html
Wolfe-Quintero, K., Inagaki, S., & Kim, H.-Y. (1998). Second language development in writing: Measures
of fluency, accuracy & complexity. Honolulu: Second Language Teaching & Curriculum Center, Universi-
ty of Hawaii at Manoa.
Appendix 1
Directions for Blogging Assignment
Directions: In this part of the test, you will write an essay in response to a question that asks you to state,
explain, and support your opinion on an issue. Typically, an effective essay will contain a minimum of 300
words. Your response will be scored on
whether your opinion is supported with reasons and/or examples
Terumi Miyazoe, Terry Anderson and Shinichi Sato 182
grammar
vocabulary, and
organization
You will have 30 minutes to plan, write, and revise your essay.
Pre-test: What are the advantages and disadvantages of eating at a restaurant rather than at your house? Give
reasons and/or examples to support your opinion.
Post-test: When traveling medium distances, some people prefer to fly. Others prefer to take express trains.
Which do you prefer? Give reasons and/or examples to support your opinion.
Essay 2: Some think that people will soon get all of their news over the Internet and newspapers will not be
needed anymore. Do you agree or disagree? Give reasons and/or examples to support your opinion.
(Trew, 2010)