Embed Size (px)
Citation preview
Together, We are
1Craneware plc Interim Report 2021
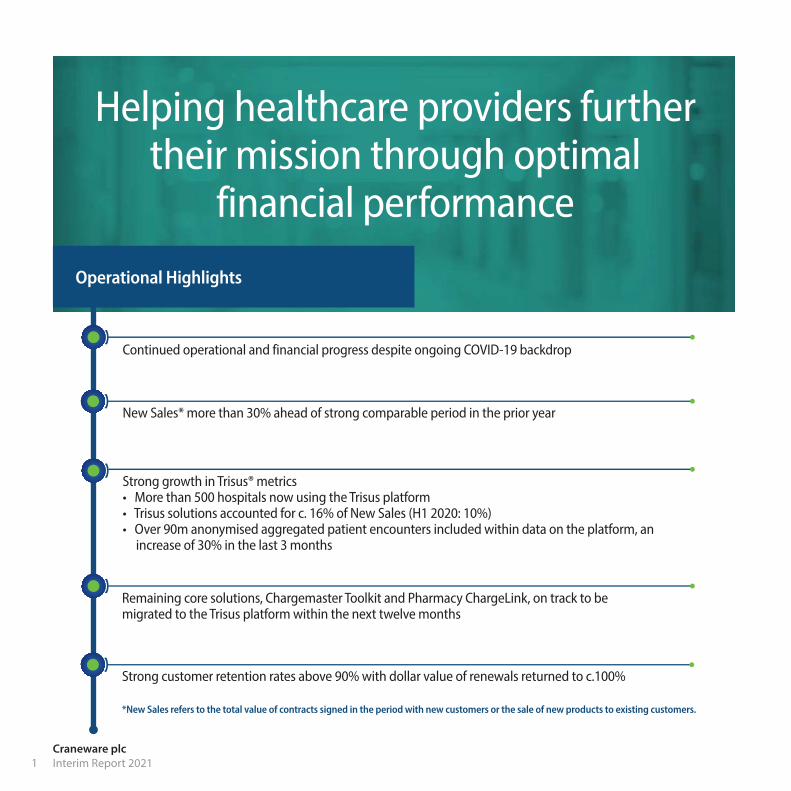
Continued operational and financial progress despite ongoing COVID-19 backdrop
Operational Highlights
Helping healthcare providers further their mission through optimal
financial performance
New Sales* more than 30% ahead of strong comparable period in the prior year
Strong growth in Trisus® metrics • More than 500 hospitals now using the Trisus platform • Trisus solutions accounted for c. 16% of New Sales (H1 2020: 10%) • Over 90m anonymised aggregated patient encounters included within data on the platform, an increase of 30% in the last 3 months
Strong customer retention rates above 90% with dollar value of renewals returned to c.100%
*New Sales refers to the total value of contracts signed in the period with new customers or the sale of new products to existing customers.
Remaining core solutions, Chargemaster Toolkit and Pharmacy ChargeLink, on track to be migrated to the Trisus platform within the next twelve months
2Craneware plc
Interim Report 2021
1 Adjusted EBITDA refers to earnings before interest, tax, depreciation, amortisation, share based payments and acquisition and share transaction related costs 2 Adjusted Earnings per share (EPS) calculations allow for the tax adjusted acquisition costs and share related transactions together with amortisation on acquired intangible assets
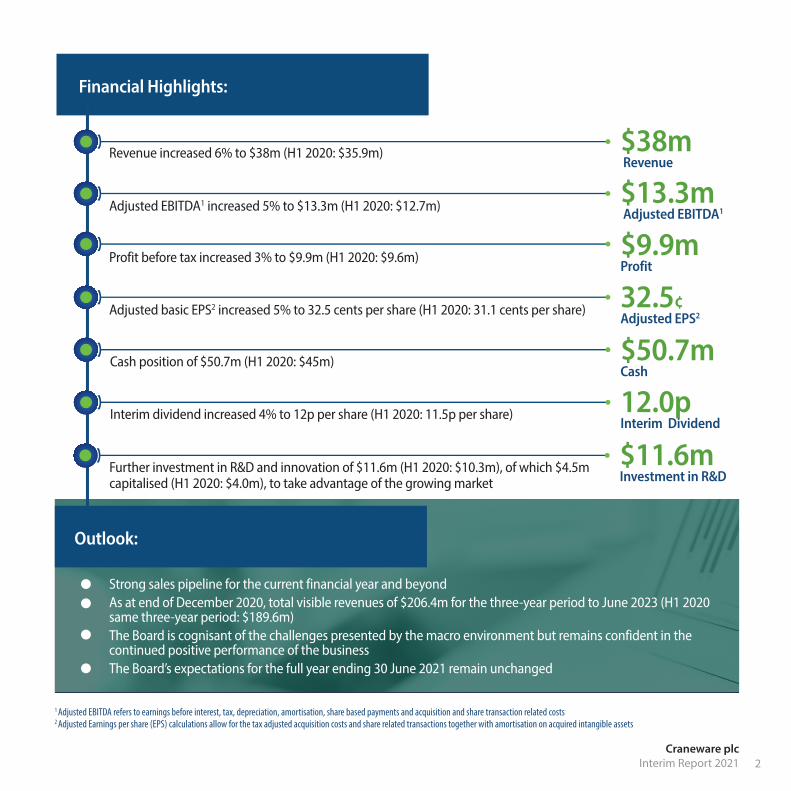
Strong sales pipeline for the current financial year and beyondAs at end of December 2020, total visible revenues of $206.4m for the three-year period to June 2023 (H1 2020 same three-year period: $189.6m) The Board is cognisant of the challenges presented by the macro environment but remains confident in the continued positive performance of the businessThe Board’s expectations for the full year ending 30 June 2021 remain unchanged
Outlook:
Financial Highlights:
$38m Revenue
Revenue increased 6% to $38m (H1 2020: $35.9m)
$13.3m Adjusted EBITDA1Adjusted EBITDA1 increased 5% to $13.3m (H1 2020: $12.7m)
$9.9m Profit
Profit before tax increased 3% to $9.9m (H1 2020: $9.6m)
32.5¢ Adjusted EPS2Adjusted basic EPS2 increased 5% to 32.5 cents per share (H1 2020: 31.1 cents per share)
$50.7m Cash
Cash position of $50.7m (H1 2020: $45m)
12.0p Interim Dividend
Interim dividend increased 4% to 12p per share (H1 2020: 11.5p per share)
$11.6m Investment in R&D
Further investment in R&D and innovation of $11.6m (H1 2020: $10.3m), of which $4.5m capitalised (H1 2020: $4.0m), to take advantage of the growing market
3Craneware plc Interim Report 2021
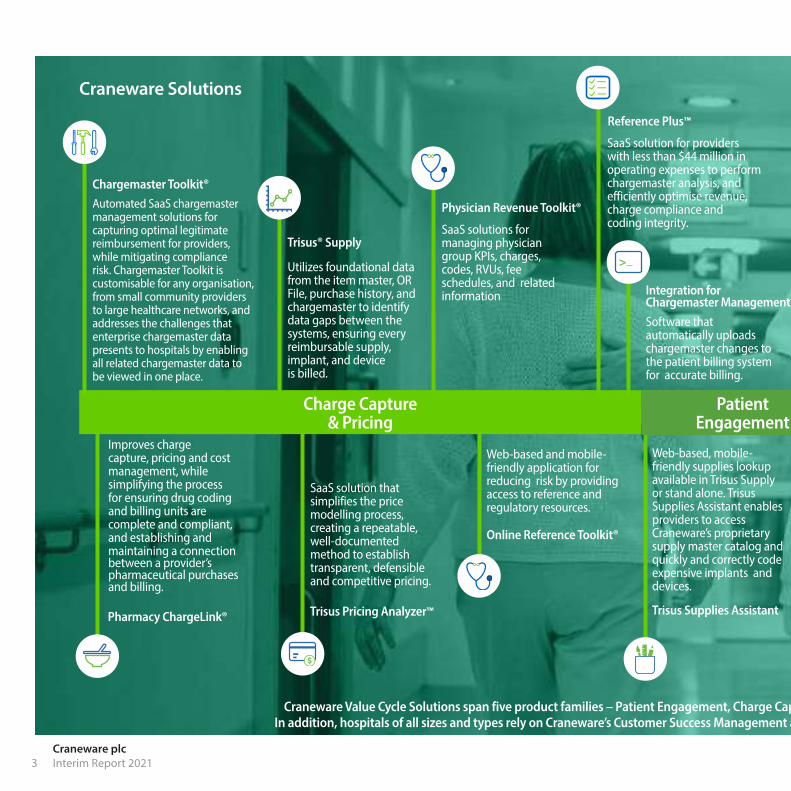
Software that automatically uploads chargemaster changes to the patient billing system for accurate billing.
Integration for Chargemaster Management
>_
Web-based, mobile-friendly supplies lookup available in Trisus Supply or stand alone. Trisus Supplies Assistant enables providers to access Craneware’s proprietary supply master catalog and quickly and correctly code expensive implants and devices.
Trisus Supplies Assistant
SaaS solution for providers with less than $44 million in operating expenses to perform chargemaster analysis, and efficiently optimise revenue, charge compliance and coding integrity.
Reference Plus™
Web-based and mobile-friendly application for reducing risk by providing access to reference and regulatory resources.
Online Reference Toolkit®
SaaS solutions for managing physician group KPIs, charges, codes, RVUs, fee schedules, and related information
Physician Revenue Toolkit®
SaaS solution that simplifies the price modelling process, creating a repeatable, well-documented method to establish transparent, defensible and competitive pricing.
Trisus Pricing Analyzer™
Utilizes foundational data from the item master, OR File, purchase history, and chargemaster to identify data gaps between the systems, ensuring every reimbursable supply, implant, and device is billed.
Trisus® Supply
Improves charge capture, pricing and cost management, while simplifying the process for ensuring drug coding and billing units are complete and compliant, and establishing and maintaining a connection between a provider’s pharmaceutical purchases and billing.
Pharmacy ChargeLink®
Automated SaaS chargemaster management solutions for capturing optimal legitimate reimbursement for providers, while mitigating compliance risk. Chargemaster Toolkit is customisable for any organisation, from small community providers to large healthcare networks, and addresses the challenges that enterprise chargemaster data presents to hospitals by enabling all related chargemaster data to be viewed in one place.
Chargemaster Toolkit®
Craneware Solutions
Patient Engagement
Charge Capture & Pricing
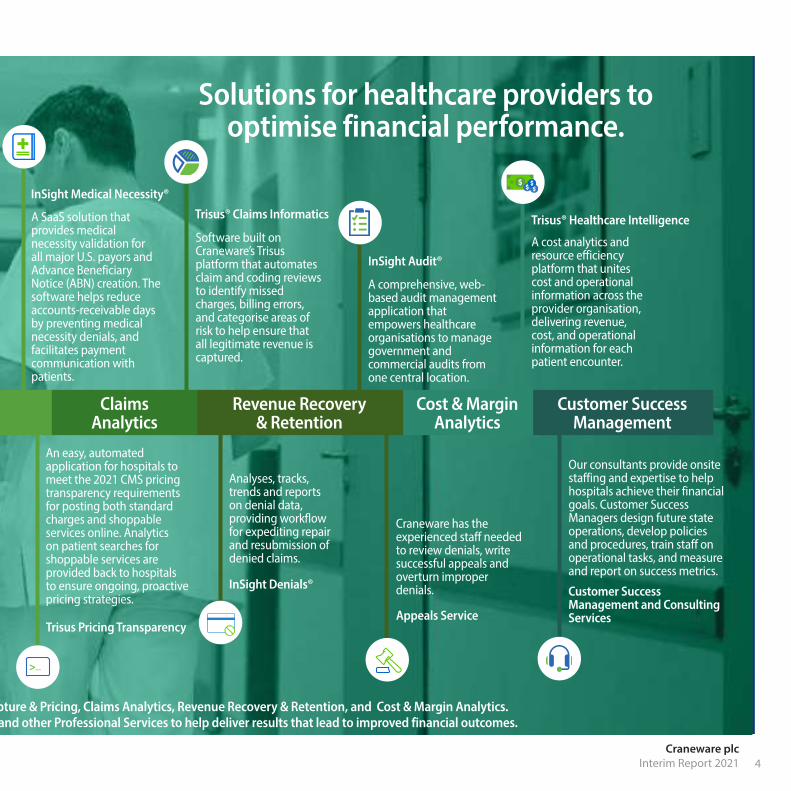
Craneware Value Cycle Solutions span five product families – Patient Engagement, Charge Capture & Pricing, Claims Analytics, Revenue Recovery & Retention, and Cost & Margin Analytics. In addition, hospitals of all sizes and types rely on Craneware’s Customer Success Management and other Professional Services to help deliver results that lead to improved financial outcomes.
4Craneware plc
Interim Report 2021
Integration for Chargemaster Management
Patient Engagement
Our consultants provide onsite staffing and expertise to help hospitals achieve their financial goals. Customer Success Managers design future state operations, develop policies and procedures, train staff on operational tasks, and measure and report on success metrics.
Customer Success Management and Consulting Services
A cost analytics and resource efficiency platform that unites cost and operational information across the provider organisation, delivering revenue, cost, and operational information for each patient encounter.
Trisus® Healthcare Intelligence
Craneware has the experienced staff needed to review denials, write successful appeals and overturn improper denials.
Appeals Service
A comprehensive, web-based audit management application that empowers healthcare organisations to manage government and commercial audits from one central location.
InSight Audit®
Analyses, tracks, trends and reports on denial data, providing workflow for expediting repair and resubmission of denied claims.
InSight Denials®
Software built on Craneware’s Trisus platform that automates claim and coding reviews to identify missed charges, billing errors, and categorise areas of risk to help ensure that all legitimate revenue is captured.
Trisus® Claims Informatics
An easy, automated application for hospitals to meet the 2021 CMS pricing transparency requirements for posting both standard charges and shoppable services online. Analytics on patient searches for shoppable services are provided back to hospitals to ensure ongoing, proactive pricing strategies.
Trisus Pricing Transparency
>_
A SaaS solution that provides medical necessity validation for all major U.S. payors and Advance Beneficiary Notice (ABN) creation. The software helps reduce accounts-receivable days by preventing medical necessity denials, and facilitates payment communication with patients.
InSight Medical Necessity®
Solutions for healthcare providers to optimise financial performance.
Customer Success Management
Cost & Margin Analytics
Revenue Recovery & Retention
Claims Analytics
Craneware Value Cycle Solutions span five product families – Patient Engagement, Charge Capture & Pricing, Claims Analytics, Revenue Recovery & Retention, and Cost & Margin Analytics. In addition, hospitals of all sizes and types rely on Craneware’s Customer Success Management and other Professional Services to help deliver results that lead to improved financial outcomes.
5Craneware plc Interim Report 2021
About Craneware
Craneware enables healthcare providers to improve margins and enhance patient outcomes so they can continue to provide quality outcomes for all.
Craneware is the leader in automated value cycle solutions that help US healthcare provider organisations discover, convert and optimise assets to acheive best clinical outcomes and financial performance.
Founded in 1999, Craneware is headquartered in Edinburgh, Scotland with offices in Atlanta and Pittsburgh employing over 350 staff. Craneware’s value cycle management software suite includes charge capture, strategic pricing, patient engagement, claims analytics, revenue recovery and retention, and cost and margin intelligence solutions.
To learn more, visit craneware.com.
6Craneware plc
Interim Report 2021
Chairman’s Statement
of Trisus applications grew to approximately 16% of New Sales (H1 2020: 10%), demonstrating the potential of these solutions to be catalysts for increased growth rates in the future. Customer retention rates remain high, at above 90% and the dollar value of renewal rate of customers at the end of their multi-year contracts returning to c.100%. Our three-year revenue visibility metric has increased 9% to $206.4m at period end, providing us with the confidence to continue to invest in the expansion of our offering, as we seek to capitalise on our significant market opportunity.
IThe Group maintains healthy cash reserves of $50.7m (H1 2020: $45m), after returning $5.3m to shareholders through dividends and investing $11.6m in R&D (H1 2020: $10.3m). Capitalised R&D at $4.5m represents the same percentage of total R&D spend (H1 2020: $4.0m). The Group delivered positive operating cash conversion in the period of 100%.
As I assess the progress being made, it is clear to me that Craneware has a clear, long-term growth opportunity ahead. With almost a third of its customers taking advantage of the increasingly powerful Trisus cloud-platform and expanding range of applications, that opportunity is now coming more clearly into focus. The positive progress we are seeing across our key metrics provides the Board with confidence in the Group’s ability to a return to double-digit growth in the future.
The Board is cognisant of the challenges presented by the macro environment but remains confident in the continued positive performance of the business and our expectations for the full year ending 30 June 2021 remain unchanged.
Will Whitehorn Chairman 1 March 2021
The on-going professional, personal and emotional pressures being exerted on our customers by the COVID-19 pandemic is changing the way they deliver healthcare. Our teams have remained focused on providing our customers with the data they need today, and the tools they will need tomorrow, to ensure they have the financial confidence to continue to provide the outstanding front-line care being asked of them in this challenging environment. The Board and I are grateful for the continued high levels of commitment and endeavour shown by our teams and those of our customers.
With the majority of our teams continuing to work from home, and all the personal challenges that the pandemic brings, it is particularly pleasing to be in a position to report on a period of continued strategic and financial progress.
Following several quarters of building sales momentum, Craneware has delivered healthy levels of revenue and profit growth along with continued expansion, both of the customer base for Trisus, our next-generation cloud-based platform and its number of applications. Clear progress has been made against each of the Company’s ‘Three Growth Pillars’ with the acceleration of customer adoption of Trisus contributing significantly to this effort as expected.
Revenue has increased 6% to $38.0m (H1 2020: $35.9m), driving growth of 5% in adjusted EBITDA to $13.3m (H1 2020: $12.7m). Encouragingly, New Sales are more than 30% ahead of the strong comparable period in the prior year, with solid demand across our applications, from both new and existing customers. Sales
7Craneware plc Interim Report 2021
Market – the move to value-based care continues at pace Managing the impact of the COVID-19 pandemic has clearly been the top priority for all healthcare-related organisations over the past year and will continue to be so for many months to come. Operationally, healthcare providers have had to adjust to new methods of healthcare delivery, while ensuring their financial operations have the flexibility and agility to charge for those services appropriately, highlighting the importance of usable financial and operational data. Healthcare providers’ requirements for greater insight into cost of care, associated margins and the value being derived is as high, if not higher, than ever. Against that backdrop, the US healthcare market continues to transition from a fee-for-service reimbursement model, towards value-based care, aiming to redress the current imbalance in US healthcare between spend and outcomes. Under value-based care, healthcare providers, including hospitals and physicians, are paid based on patient health outcomes. A hospital’s ability to remain financially secure in a value-based care system is dependent on the collection of granular data and the use of insightful analytics to understand the opportunity to deliver better value. This presents a large, growing opportunity for the Group given Craneware’s specialism in helping hospitals better understand and manage revenue and cost through data-driven solutions.
Our customers continue to take steps to create further resilience across their financial operations. We are committed to partnering with them by providing the platform, regulatory information and data to enable them to do so. We believe that both the Group and our customer base are strongly placed to deal with the future impacts of the pandemic and for our products to be part of the solution in terms of helping hospital preparedness.
With the new administration in the White House we are yet to see any major changes to the political landscape with regards to US healthcare. Both Republicans and Democrats have previously expressed their desire for healthcare reform and the industry widely anticipates that reform will remain a key agenda point moving forward, with the drive to derive greater value from healthcare sitting at its heart.
Growth Strategy – Innovation to profoundly impact US healthcare operations which will drive demand and expand our addressable market.
To date, our growth has been driven through increases in market share and product set penetration (land and expand). In recent years, we have invested in the development of the Trisus platform; a sophisticated cloud data aggregation and intelligence platform which will allow us to migrate our existing products to the
Strategic Report We are pleased to have delivered a good set of financial results in the first six months of the year, with the growth in New Sales and Trisus sales being particularly encouraging indicators of the successes being achieved.
We have seen a considerable increase in the number of hospitals using our next-generation cloud-based Trisus platform, resulting in more than 500 hospitals now using the platform, contributing over 90m individual anonymised patient encounters available within it. With each new hospital that joins the platform, and each new data point recorded, the platform becomes more powerful, providing even greater insight into the ways in which hospital management teams can better manage and protect their financial margin. The mitigated risks, efficiencies and returns on investment being delivered by
our applications will provide the confidence and continuity for our customers to invest in the delivery of quality care to their communities.
Our product innovation has continued at pace, and we are on track for the migration to Trisus of our two remaining core products, Chargemaster Toolkit and Pharmacy ChargeLink. We launched a free-to-use application, Trisus Pricing Transparency, in the period to help hospitals meet the CMS Pricing Transparency Final Rule requirements which came into effect in January 2021. This has been well-received across both existing and new customers, encouraging accelerated migration to the Trisus platform and we have continued the investment in further enhancements across our range of applications.
This positive progress has been achieved against the backdrop of COVID-19. Whilst as a business we continue to be relatively insulated from the direct impacts of the pandemic, our customers are on the front-line. Supporting them and the phenomenal work their teams have done has been, and will continue to be, our top priority through these times. Never has the need for accurate financial data, insight and analytics been more important, and we will continue to do all we can to ensure our customers have the tools they need to maintain the financial health of their organisations.
Strategic Report and Financial Review
8Craneware plc
Interim Report 2021
is a precursor to further applications in the Trisus Pharmacy suite, the complete replacement for the on-premise solution. This will continue to be developed in a modular fashion, allowing customers to select which mix of applications best suits their needs as they become available.
We are continuing to develop the additional functionality of these cloud offerings as we move towards general release.
2. To continue to enhance the capabilities of the platform through the addition of new technology layers and applications, developed through both internal R&D and selective M&A.
During the period we announced the availability of Trisus Pricing Transparency (“TPT”) to all US healthcare providers. This no cost Trisus solution was developed to enable organisations not only to meet CMS Pricing Transparency Final Rule requirements (which came into effect in January 2021) but ensure that organisational pricing data is most accurately represented for patients on an ongoing basis on the new Craneware Patient portal allowing individuals to “shop” for their healthcare needs.
TPT identifies which are a hospital provider’s top 300 ‘shoppable services’, being the bundles of care most frequently delivered to patients, and recommends which services to publish across a variety of payors, meeting and going beyond the needs of the Act. These insights allow hospitals to make valuable business decisions, inform the overall pricing strategy of the hospital, monitor patient search behaviour, and rebalance pricing strategies to ensure compliance and market competitiveness while addressing the pressing problem of transparency of cost for potential patients.
TPT adoption has accelerated migration of existing customers to the Trisus platform and encouraged new users to benefit from the power of the Trisus platform, which provides a clear pathway for wider Trisus application uptake in the future by these new customers.
Through the growth of our Trisus customer base, and the interaction of their data with the Trisus platform, we have in excess of 90m individual anonymised patient encounters recorded on the platform, an increase of 30% in just three months. The greater number of data points, the more powerful the analytics and insights that can be provided to help hospitals in their financial decision-making. These encounters include roughly one fifth of all emergency room visits in the US during the last year and almost one quarter of all hospital admissions.
We will continue to invest in expanding the capabilities of the platform, developing
cloud, leverage our data assets to expand our offering, integrate third party solutions to the platform and benefit from the scalability of cloud-technology. Our software solutions sit at the heart of our customers’ operations, tapping into the aggregated anonymised data held within Trisus to provide greater insight and control to their financial operations and thereby optimise their financial performance.
Three Growth Pillars
Our growth strategy has three fundamental growth pillars:
1. The transition of our customers to cloud-based versions of our existing on-premise solutions, to act as a gateway to the benefits and additional applications on the Trisus platform.
Currently, more than 500 customers, almost a third of our customer base are utilising one or more of the Trisus applications, with almost the entirety of the remainder connecting to the platform via the Trisus Bridge – the first step for significant migration to the platform from within our user base. This is evidence that both our existing customer base and the wider healthcare provider market have responded positively to the technological evolution of the Craneware solution set.
We have started the migration of early adopter customers to the cloud based Trisus versions of our two core product offerings: Trisus Chargemaster, the replatformed version of our Chargemaster Toolkit, and Trisus Pharmacy, a new product, which in phase one, will sit alongside our on-premise Pharmacy ChargeLink, and subsequently be expanded to include all Pharmacy ChargeLink functionality. Customer feedback has been extremely positive, identifying clear additional benefits the platform is delivering, including ease of migration, use and deployment throughout large scale implementations.
The full Trisus Chargemaster solution will be available by the end of calendar 2021. All existing Chargemaster Toolkit customers are now on a hybrid version, with their data synchronised to the Trisus platform, and using a single Trisus sign on, meaning migration to the full cloud version and all its additional functionality with take only minutes once launched. All customers who have signed new contracts for Chargemaster Toolkit in recent periods have an understood migration plan to Trisus Chargemaster, and recognise this as an easy entry to the Trisus platform.
Pharmacy ChargeLink customers are being offered the opportunity to extend their products with the addition of the cloud based Trisus Rx Financial Management, which
Strategic Report and Financial Review [Cont’d.]
9Craneware plc Interim Report 2021
additional applications and tools, to provide further benefits to our customers. We are pleased to confirm that the level of sales of Trisus applications has now exceeded sixty percent (60%) of the amount of capitalised R&D spent on the platform and Trisus applications development to date, already underwriting the majority of the investment made.
M&A
While organic growth remains a priority, we continue to evaluate the market and will continue to pursue strategically aligned companies that will accelerate our growth strategy. This is underpinned by four key acquisition criteria of which target companies must fit into at least one, being: 1. the addition of data sets; 2. the extension of the customer base; 3. the expansion of expertise; and 4. the addition of applications suitable for the US hospital market.
In evaluating acquisition opportunities, the Board implements a strong valuation discipline seeking to maintain its prudent approach to preserving balance sheet strength and efficiency for the long-term.
Targets that are profitable with recurring revenue models that provide earnings accretion within the first 12 months of ownership are prioritised.
3. To grow our customer footprint, through increasing the attractiveness of our offering and acquiring non-overlapping customers, which in turn provides further cross-sale opportunities.
We are pleased with the sales activity during the half, which saw New Sales >30% ahead of the same period in the prior year. 30% of these New Sales were to new customers, expanding our customer footprint. Expansion Sales to existing customers represented 70%, demonstrating Craneware’s ability to continue to cross sell further solutions. All sales have been driven by mitigation of risk, efficiency of operations and compelling ROIs for our customers.
Sales of Trisus products represented 16% of New Sales in the period, with Trisus sales in the six months significantly ahead of both of the previous two six month periods. We also saw our first Trisus renewals in the period.
Customer retention has always been strong, and we continued to see our customer retention rate remain high in the period above 90%, with renewals by dollar value at c.100%.
Strategic Report and Financial Review [Cont’d.]
Financial Review
In our trading update released on 20 January 2021, we confirmed that the group had secured New Sales at a significantly higher level than in the first half of the prior year. Through our Annuity SaaS business model (described below), the vast majority of the revenue from these New Sales will be recognised in future periods. We are pleased to confirm the positive sales performance in prior periods has resulted in an increase in both revenue and adjusted EBITDA in the period. For the six months to 31 December 2020, revenues have increased 6% to $38.0m (H1 2020: $35.9m) and adjusted EBITDA has increased 5% to $13.3m (H1 2020: $12.7m). Adjusted earnings per share has increased 5% to 32.5 cents per share (H1 2020: 31.1 cents per share).
These positive results have been achieved despite the macro-economic uncertainties created by the COVID 19 pandemic. Whilst we are pleased to be able to report this financial success in the period, we have never forgotten that our customers continue to be on the front line. Supporting them and their teams, in the work they have done and continue to do, remains our top priority through these times.
As healthcare organisations look beyond the impact of the pandemic, it is increasingly clear to all that there is a need for accurate financial data, supporting analytics and the insights those analytics can bring. We are committed to partnering with our customers via the ongoing development of the Trisus platform and the applications that sit upon it. To fully deliver on the opportunity we have ahead of us and the impact we can make to our customers’ financial health, it is essential we continue to make the right investments now.
As a result, we have further increased our investment in R&D by 13% to $11.6m (H1 2020: $10.3m). Of this investment $4.5m, being 39%, relates to new product development and enhancements and as such has been capitalised (H1 2020: $4.0m, 39%), the balancing $7.1m (H1 2020: $6.3m) has been expensed as incurred. The amounts we capitalise represent the cash reserves we have utilised in the period, to invest in our future. This is an efficient and cost-effective way to further build out our Value Cycle strategy. We take great care to only capitalise projects that will bring future economic benefit to the Group. One of the ways we ensure this is to monitor the value of contracts sold for these new products once launched against the costs that have been capitalised to date. I am pleased to confirm, in regards to the total costs we have capitalised in this and previous periods relating to our Trisus developments (including applications that have yet to be brought to market) we have sold contracts that already cover over 60% of this total. We continue to maintain healthy cash reserves, which at the period end were $50.7m
10Craneware plc
Interim Report 2021
(H1 2020: $45.0m). We continue to target operating cash conversion of 100% of adjusted EBITDA to operating cash over a 12-month period. This was exceeded in the 12 months prior to 31 December 2020, delivering 100% cash conversion within the six-month period under review. From our cash reserves, we have returned $5.3m to our shareholders through dividends and made the $11.6m investments in R&D detailed above. The Group’s Annuity SaaS business model and associated revenue recognition policy is designed to focus on the long-term growth and stability of the Group. The revenue element of new sales related to software licenses, where performance obligations are met over time, results in revenue being recognised over the period the license is provided to the customer (which for a new hospital sale is an average of over four years). In addition, other revenue generated through new sales relates to consulting services and training which are also satisfied over time as the service is provided or the project is delivered.
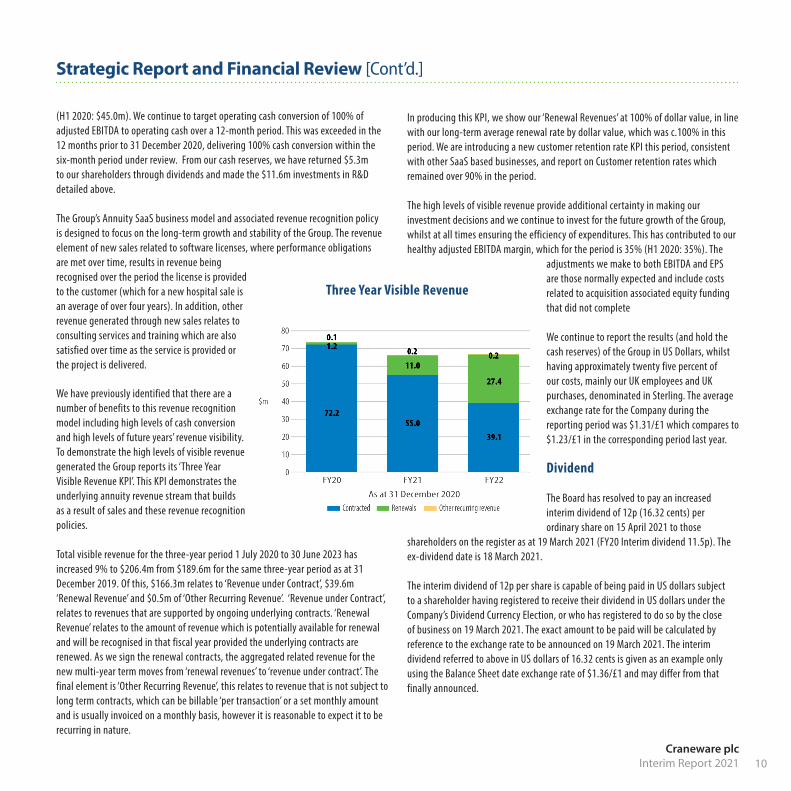
We have previously identified that there are a number of benefits to this revenue recognition model including high levels of cash conversion and high levels of future years’ revenue visibility. To demonstrate the high levels of visible revenue generated the Group reports its ‘Three Year Visible Revenue KPI’. This KPI demonstrates the underlying annuity revenue stream that builds as a result of sales and these revenue recognition policies. Total visible revenue for the three-year period 1 July 2020 to 30 June 2023 has increased 9% to $206.4m from $189.6m for the same three-year period as at 31 December 2019. Of this, $166.3m relates to ‘Revenue under Contract’, $39.6m ‘Renewal Revenue’ and $0.5m of ‘Other Recurring Revenue’. ‘Revenue under Contract’, relates to revenues that are supported by ongoing underlying contracts. ‘Renewal Revenue’ relates to the amount of revenue which is potentially available for renewal and will be recognised in that fiscal year provided the underlying contracts are renewed. As we sign the renewal contracts, the aggregated related revenue for the new multi-year term moves from ‘renewal revenues’ to ‘revenue under contract’. The final element is ‘Other Recurring Revenue’, this relates to revenue that is not subject to long term contracts, which can be billable ‘per transaction’ or a set monthly amount and is usually invoiced on a monthly basis, however it is reasonable to expect it to be recurring in nature.
In producing this KPI, we show our ‘Renewal Revenues’ at 100% of dollar value, in line with our long-term average renewal rate by dollar value, which was c.100% in this period. We are introducing a new customer retention rate KPI this period, consistent with other SaaS based businesses, and report on Customer retention rates which remained over 90% in the period. The high levels of visible revenue provide additional certainty in making our investment decisions and we continue to invest for the future growth of the Group, whilst at all times ensuring the efficiency of expenditures. This has contributed to our healthy adjusted EBITDA margin, which for the period is 35% (H1 2020: 35%). The
adjustments we make to both EBITDA and EPS are those normally expected and include costs related to acquisition associated equity funding that did not complete We continue to report the results (and hold the cash reserves) of the Group in US Dollars, whilst having approximately twenty five percent of our costs, mainly our UK employees and UK purchases, denominated in Sterling. The average exchange rate for the Company during the reporting period was $1.31/£1 which compares to $1.23/£1 in the corresponding period last year. Dividend The Board has resolved to pay an increased interim dividend of 12p (16.32 cents) per ordinary share on 15 April 2021 to those
shareholders on the register as at 19 March 2021 (FY20 Interim dividend 11.5p). The ex-dividend date is 18 March 2021. The interim dividend of 12p per share is capable of being paid in US dollars subject to a shareholder having registered to receive their dividend in US dollars under the Company’s Dividend Currency Election, or who has registered to do so by the close of business on 19 March 2021. The exact amount to be paid will be calculated by reference to the exchange rate to be announced on 19 March 2021. The interim dividend referred to above in US dollars of 16.32 cents is given as an example only using the Balance Sheet date exchange rate of $1.36/£1 and may differ from that finally announced.
Strategic Report and Financial Review [Cont’d.]
Three Year Visible Revenue
11Craneware plc Interim Report 2021
The first half ’s positive sales performance has continued with ongoing pipeline growth, a growing Trisus customer base, expanding offering and clear market need. While cognisant of the challenges presented by the macro environment, we are confident in the continued positive performance of the business and accelerated growth rates moving forward. Keith Neilson, Chief Executive Officer Craig Preston, Chief Financial Officer 1 March 2021
Update to the AGM Following our Annual General Meeting on 17 November 2020, we announced that all resolutions were passed with an over 70% majority, however there was one resolution, resolution 11, that had received a number of votes against. As such, we committed to consult with our shareholders to more fully understand the reasons for these votes against and to carefully reflect on the feedback we received. We understand the voting in relation to resolution 11 (re-appointment of PricewaterhouseCoopers LLP as auditors) was specifically in relation to the expectation that a competitive audit tender for the external audit services takes place where the existing auditors have been in role for a period of 10 years or longer, in line with best corporate governance practice. Whilst the Board and the Audit Committee has been satisfied with PricewaterhouseCoopers’ performance as external auditor, we have concluded it is an appropriate time to review the market and conduct a tender. It is our intent to conclude the tender process in the current financial year. Depending on the success of the tender and the proposed transition plan (if required), this may result in the successful firm being in place for this year’s audit, the financial year ended 30 June 2021. Outlook The positive performance in the first half of the year provides a strong foundation for future growth. We are making considerable progress on our Trisus expansion strategy and seeing accelerated adoption of the cloud-platform by our existing and new customers.
Managing the impact of the COVID-19 pandemic has clearly been the top priority for all healthcare-related organisations over the past year and will continue to be for many months to come, providing front-line care while adjusting to new methods of healthcare delivery and ensuring their financial operations can respond. Our customers continue to take steps to create further resilience across their financial operations and we are committed to providing them with the tools and insight to do so.
Strategic Report and Financial Review [Cont’d.]
12Craneware plc
Interim Report 2021
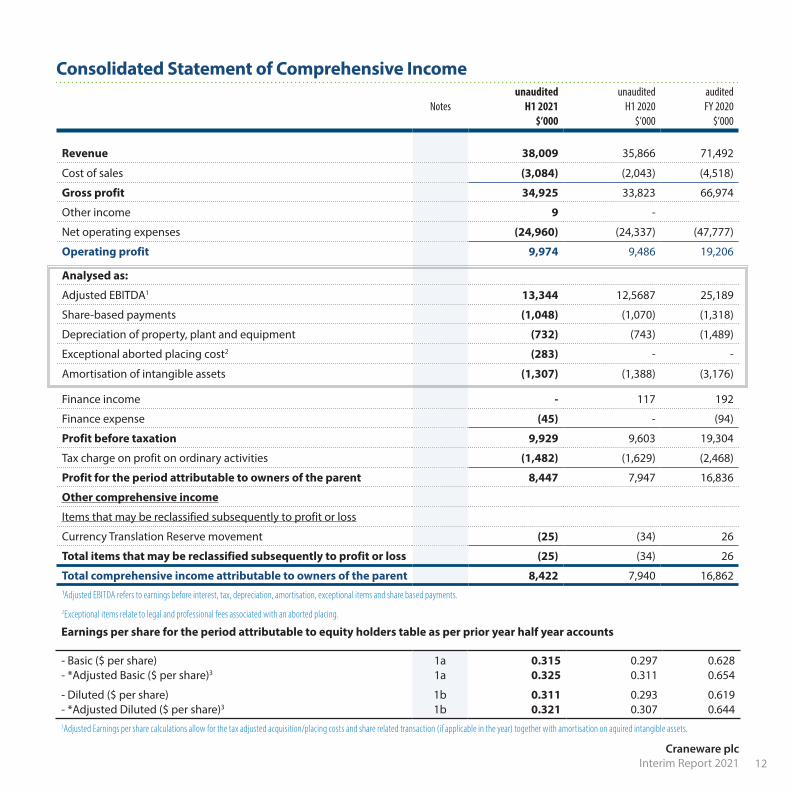
Consolidated Statement of Comprehensive Income
Notesunaudited
H1 2021$’000
unaudited H1 2020
$’000
audited FY 2020
$’000
Revenue 38,009 35,866 71,492
Cost of sales (3,084) (2,043) (4,518)
Gross profit 34,925 33,823 66,974
Other income 9 -
Net operating expenses (24,960) (24,337) (47,777)
Operating profit 9,974 9,486 19,206
Analysed as:
Adjusted EBITDA1 13,344 12,5687 25,189
Share-based payments (1,048) (1,070) (1,318)
Depreciation of property, plant and equipment (732) (743) (1,489)
Exceptional aborted placing cost2 (283) - -
Amortisation of intangible assets (1,307) (1,388) (3,176)
Finance income - 117 192
Finance expense (45) - (94)
Profit before taxation 9,929 9,603 19,304
Tax charge on profit on ordinary activities (1,482) (1,629) (2,468)
Profit for the period attributable to owners of the parent 8,447 7,947 16,836
Other comprehensive income
Items that may be reclassified subsequently to profit or loss
Currency Translation Reserve movement (25) (34) 26
Total items that may be reclassified subsequently to profit or loss (25) (34) 26
Total comprehensive income attributable to owners of the parent 8,422 7,940 16,86211Adjusted EBITDA refers to earnings before interest, tax, depreciation, amortisation, exceptional items and share based payments.
2Exceptional items relate to legal and professional fees associated with an aborted placing.
Earnings per share for the period attributable to equity holders table as per prior year half year accounts
- Basic ($ per share) - *Adjusted Basic ($ per share)3
1a 1a
0.315 0.325
0.297 0.311
0.628 0.654
- Diluted ($ per share)- *Adjusted Diluted ($ per share)3
1b 1b
0.311 0.321
0.293 0.307
0.619 0.644
3Adjusted Earnings per share calculations allow for the tax adjusted acquisition/placing costs and share related transaction (if applicable in the year) together with amortisation on aquired intangible assets.
13Craneware plc Interim Report 2021
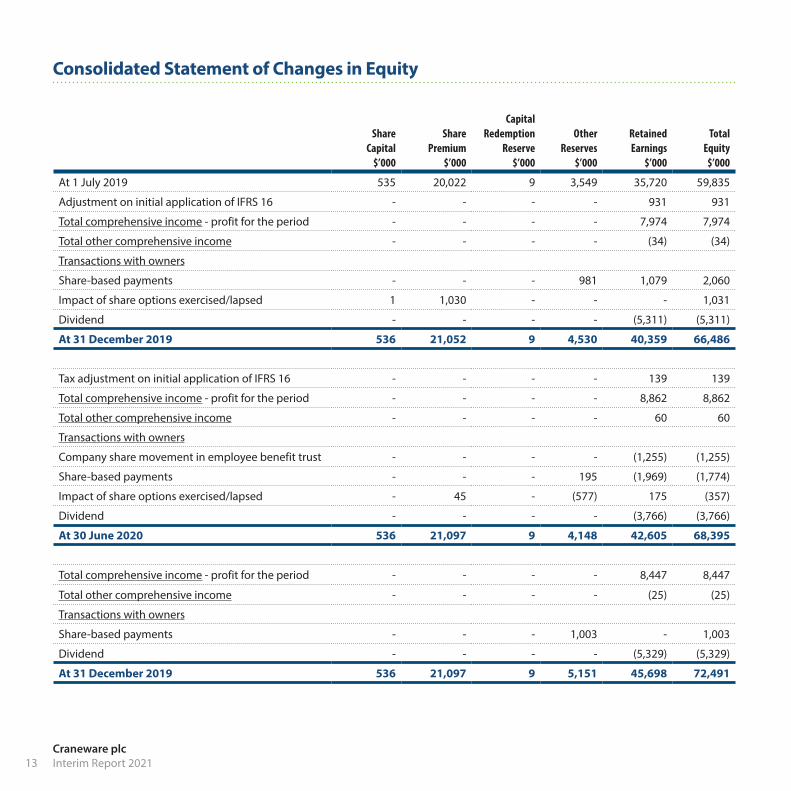
Consolidated Statement of Changes in Equity
Share Capital
$’000
Share Premium
$’000
Capital Redemption
Reserve$’000
Other Reserves
$’000
Retained Earnings
$’000
Total Equity
$’000
At 1 July 2019 535 20,022 9 3,549 35,720 59,835
Adjustment on initial application of IFRS 16 - - - - 931 931
Total comprehensive income - profit for the period - - - - 7,974 7,974
Total other comprehensive income - - - - (34) (34)
Transactions with owners
Share-based payments - - - 981 1,079 2,060
Impact of share options exercised/lapsed 1 1,030 - - - 1,031
Dividend - - - - (5,311) (5,311)
At 31 December 2019 536 21,052 9 4,530 40,359 66,486
Tax adjustment on initial application of IFRS 16 - - - - 139 139
Total comprehensive income - profit for the period - - - - 8,862 8,862
Total other comprehensive income - - - - 60 60
Transactions with owners
Company share movement in employee benefit trust - - - - (1,255) (1,255)
Share-based payments - - - 195 (1,969) (1,774)
Impact of share options exercised/lapsed - 45 - (577) 175 (357)
Dividend - - - - (3,766) (3,766)
At 30 June 2020 536 21,097 9 4,148 42,605 68,395
Total comprehensive income - profit for the period - - - - 8,447 8,447
Total other comprehensive income - - - - (25) (25)
Transactions with owners
Share-based payments - - - 1,003 - 1,003
Dividend - - - - (5,329) (5,329)
At 31 December 2019 536 21,097 9 5,151 45,698 72,491
14Craneware plc
Interim Report 2021
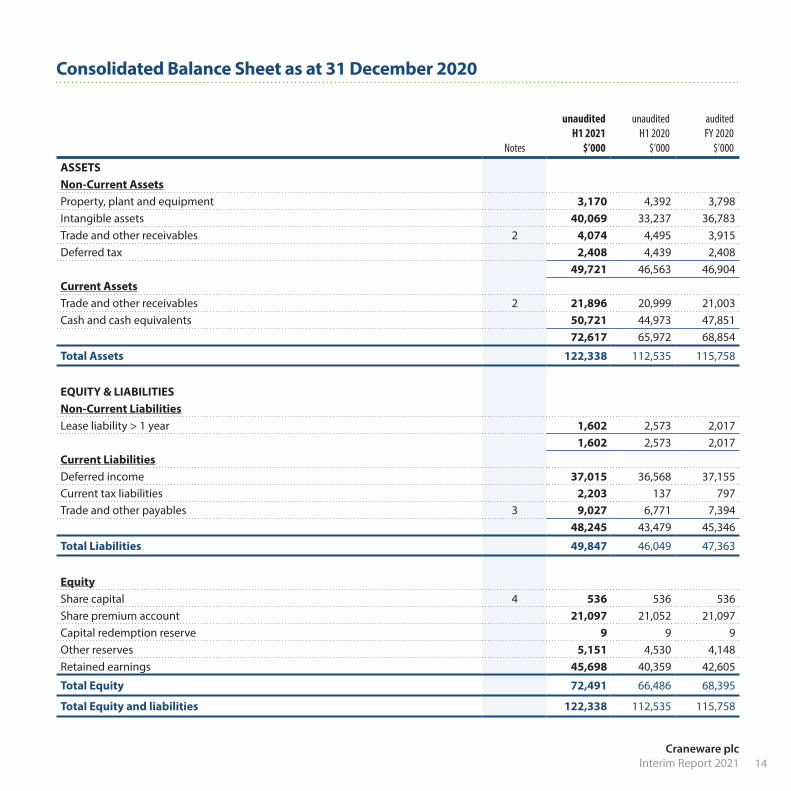
Consolidated Balance Sheet as at 31 December 2020
Notes
unaudited H1 2021
$’000
unaudited H1 2020
$’000
audited FY 2020
$’000
ASSETSNon-Current AssetsProperty, plant and equipment 3,170 4,392 3,798Intangible assets 40,069 33,237 36,783Trade and other receivables 2 4,074 4,495 3,915Deferred tax 2,408 4,439 2,408
49,721 46,563 46,904Current AssetsTrade and other receivables 2 21,896 20,999 21,003Cash and cash equivalents 50,721 44,973 47,851
72,617 65,972 68,854
Total Assets 122,338 112,535 115,758
EQUITY & LIABILITIESNon-Current LiabilitiesLease liability > 1 year 1,602 2,573 2,017
1,602 2,573 2,017 Current LiabilitiesDeferred income 37,015 36,568 37,155Current tax liabilities 2,203 137 797Trade and other payables 3 9,027 6,771 7,394
48,245 43,479 45,346
Total Liabilities 49,847 46,049 47,363
EquityShare capital 4 536 536 536Share premium account 21,097 21,052 21,097Capital redemption reserve 9 9 9 Other reserves 5,151 4,530 4,148Retained earnings 45,698 40,359 42,605
Total Equity 72,491 66,486 68,395
Total Equity and liabilities 122,338 112,535 115,758
15Craneware plc Interim Report 2021
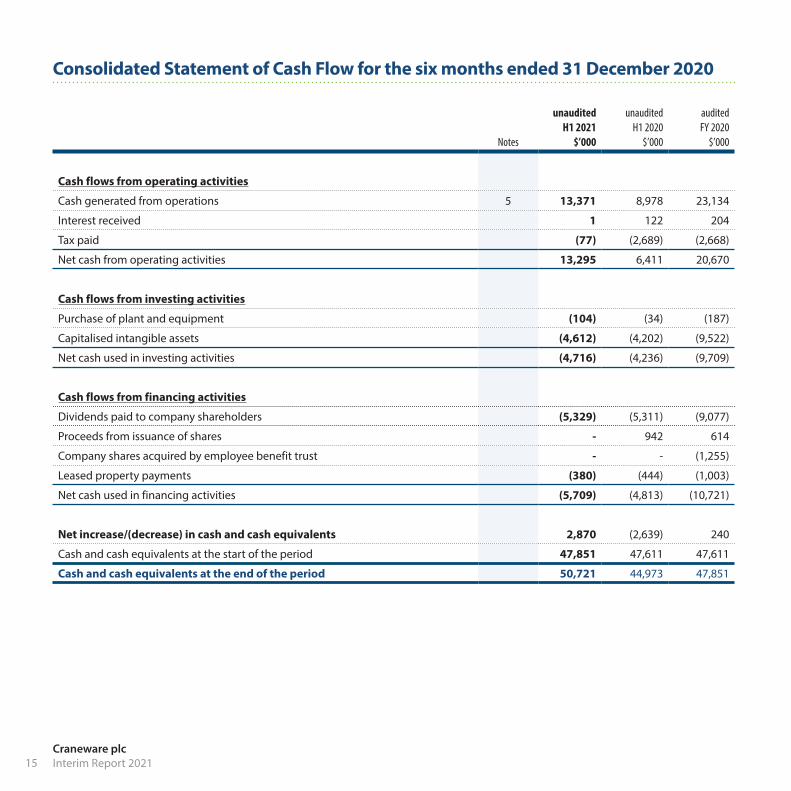
Consolidated Statement of Cash Flow for the six months ended 31 December 2020
Notes
unauditedH1 2021
$’000
unauditedH1 2020
$’000
audited FY 2020
$’000
Cash flows from operating activities
Cash generated from operations 5 13,371 8,978 23,134
Interest received 1 122 204
Tax paid (77) (2,689) (2,668)
Net cash from operating activities 13,295 6,411 20,670
Cash flows from investing activities
Purchase of plant and equipment (104) (34) (187)
Capitalised intangible assets (4,612) (4,202) (9,522)
Net cash used in investing activities (4,716) (4,236) (9,709)
Cash flows from financing activities
Dividends paid to company shareholders (5,329) (5,311) (9,077)
Proceeds from issuance of shares - 942 614
Company shares acquired by employee benefit trust - - (1,255)
Leased property payments (380) (444) (1,003)
Net cash used in financing activities (5,709) (4,813) (10,721)
Net increase/(decrease) in cash and cash equivalents 2,870 (2,639) 240
Cash and cash equivalents at the start of the period 47,851 47,611 47,611
Cash and cash equivalents at the end of the period 50,721 44,973 47,851
16Craneware plc
Interim Report 2021
Notes to the Interim Financial Statements
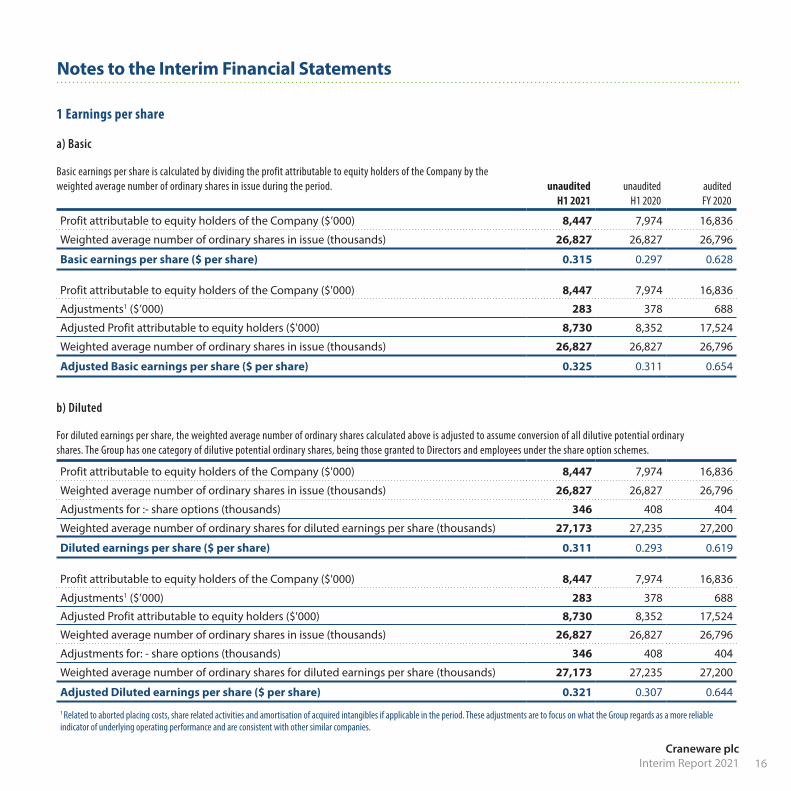
1 Earnings per share
a) Basic
Basic earnings per share is calculated by dividing the profit attributable to equity holders of the Company by the weighted average number of ordinary shares in issue during the period. unaudited
H1 2021unaudited
H1 2020audited FY 2020
Profit attributable to equity holders of the Company ($’000) 8,447 7,974 16,836
Weighted average number of ordinary shares in issue (thousands) 26,827 26,827 26,796
Basic earnings per share ($ per share) 0.315 0.297 0.628
Profit attributable to equity holders of the Company ($'000) 8,447 7,974 16,836
Adjustments1 ($’000) 283 378 688
Adjusted Profit attributable to equity holders ($'000) 8,730 8,352 17,524
Weighted average number of ordinary shares in issue (thousands) 26,827 26,827 26,796
Adjusted Basic earnings per share ($ per share) 0.325 0.311 0.654
b) Diluted
For diluted earnings per share, the weighted average number of ordinary shares calculated above is adjusted to assume conversion of all dilutive potential ordinary shares. The Group has one category of dilutive potential ordinary shares, being those granted to Directors and employees under the share option schemes.
Profit attributable to equity holders of the Company ($'000) 8,447 7,974 16,836
Weighted average number of ordinary shares in issue (thousands) 26,827 26,827 26,796
Adjustments for :- share options (thousands) 346 408 404
Weighted average number of ordinary shares for diluted earnings per share (thousands) 27,173 27,235 27,200
Diluted earnings per share ($ per share) 0.311 0.293 0.619
Profit attributable to equity holders of the Company ($'000) 8,447 7,974 16,836
Adjustments1 ($’000) 283 378 688
Adjusted Profit attributable to equity holders ($'000) 8,730 8,352 17,524
Weighted average number of ordinary shares in issue (thousands) 26,827 26,827 26,796
Adjustments for: - share options (thousands) 346 408 404
Weighted average number of ordinary shares for diluted earnings per share (thousands) 27,173 27,235 27,200
Adjusted Diluted earnings per share ($ per share) 0.321 0.307 0.644
1 Related to aborted placing costs, share related activities and amortisation of acquired intangibles if applicable in the period. These adjustments are to focus on what the Group regards as a more reliable indicator of underlying operating performance and are consistent with other similar companies.
17Craneware plc Interim Report 2021
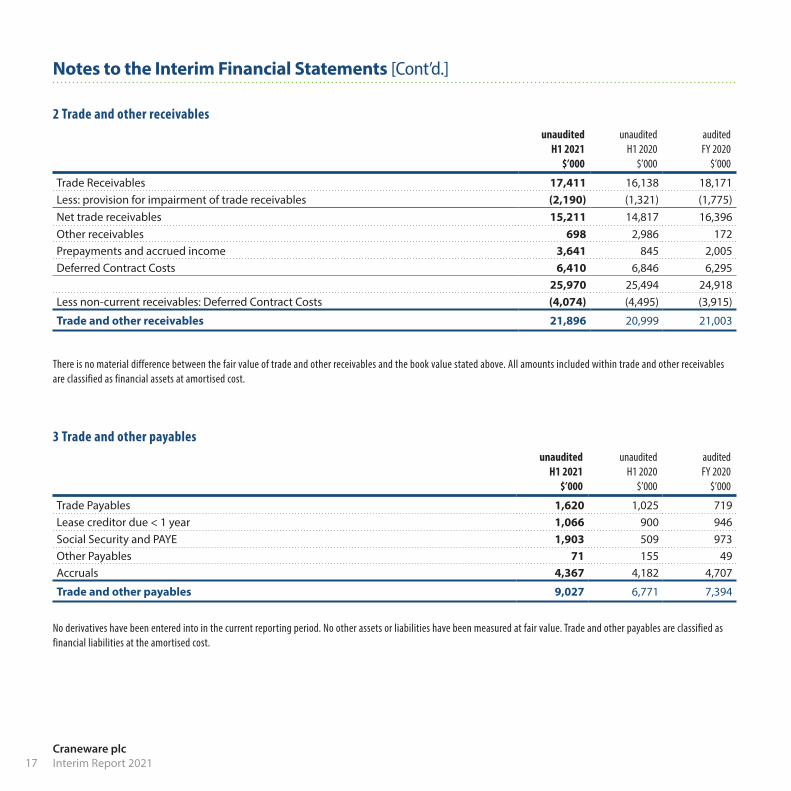
2 Trade and other receivablesunaudited
H1 2021 $’000
unaudited H1 2020
$’000
audited FY 2020
$’000
Trade Receivables 17,411 16,138 18,171Less: provision for impairment of trade receivables (2,190) (1,321) (1,775)Net trade receivables 15,211 14,817 16,396Other receivables 698 2,986 172Prepayments and accrued income 3,641 845 2,005Deferred Contract Costs 6,410 6,846 6,295
25,970 25,494 24,918Less non-current receivables: Deferred Contract Costs (4,074) (4,495) (3,915)
Trade and other receivables 21,896 20,999 21,003
There is no material difference between the fair value of trade and other receivables and the book value stated above. All amounts included within trade and other receivables are classified as financial assets at amortised cost.
3 Trade and other payablesunaudited
H1 2021 $’000
unaudited H1 2020
$’000
audited FY 2020
$’000
Trade Payables 1,620 1,025 719Lease creditor due < 1 year 1,066 900 946Social Security and PAYE 1,903 509 973Other Payables 71 155 49Accruals 4,367 4,182 4,707
Trade and other payables 9,027 6,771 7,394
No derivatives have been entered into in the current reporting period. No other assets or liabilities have been measured at fair value. Trade and other payables are classified as financial liabilities at the amortised cost.
Notes to the Interim Financial Statements [Cont’d.]
18Craneware plc
Interim Report 2021
Notes to the Interim Financial Statements [Cont’d.]
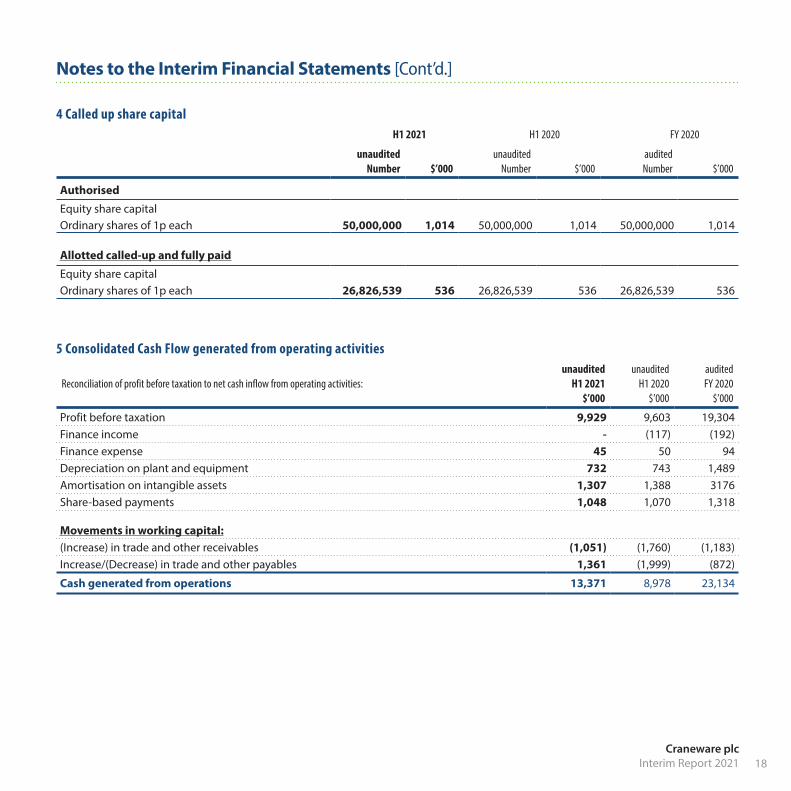
4 Called up share capital H1 2021 H1 2020 FY 2020
unaudited Number
$’000
unaudited Number
$’000
audited Number
$’000
Authorised
Equity share capitalOrdinary shares of 1p each 50,000,000 1,014 50,000,000 1,014 50,000,000 1,014
Allotted called-up and fully paid
Equity share capitalOrdinary shares of 1p each 26,826,539 536 26,826,539 536 26,826,539 536
5 Consolidated Cash Flow generated from operating activities
Reconciliation of profit before taxation to net cash inflow from operating activities:unaudited
H1 2021 $’000
unaudited H1 2020
$’000
audited FY 2020
$’000
Profit before taxation 9,929 9,603 19,304Finance income - (117) (192)Finance expense 45 50 94Depreciation on plant and equipment 732 743 1,489Amortisation on intangible assets 1,307 1,388 3176Share-based payments 1,048 1,070 1,318
Movements in working capital:(Increase) in trade and other receivables (1,051) (1,760) (1,183)Increase/(Decrease) in trade and other payables 1,361 (1,999) (872)
Cash generated from operations 13,371 8,978 23,134
19Craneware plc Interim Report 2021
Notes to the Interim Financial Statements [Cont’d.]
6 Basis of Preparation
The interim financial statements are unaudited and do not constitute statutory accounts as defined in S435 of the Companies Act 2006. These statements have been prepared applying accounting policies that were applied in the preparation of the Group’s consolidated accounts for the year ended 30th June 2020 and the changes noted below in section 8. Those accounts, with an unqualified audit report, have been delivered to the Registrar of Companies.
The interim financial statements have been prepared on a going concern basis. The Group’s activities and an overview of the development of its products, services and the environment in which it operates together with an update on the Group’s financial performance and position are set out in the Financial Review. Despite the ongoing uncertainties and challenges caused by COVID-19 pandemic, the Group is profitable, cash generative and the half year trading results are in line with expectations. An overview of the impact of the COVID-19 pandemic on the Group in the period are contained in the Strategic Report, and details were also contained in the Group’s Annual Report and Financial Statements for the year ended 30 June 2020. The Board continues to carefully monitor the impact of the COVID-19 pandemic on the operations of the Group. The Viability Statement and the Board’s Going Concern assessment were also contained in the Annual Report for the year ended 30 June 2020.
The Directors, having made suitable enquiries and analysis of the interim financial statements, including the consideration of: net cash reserves; continued cash generation; and Annuity SaaS business model; have determined that the Group has adequate resources to continue in business for the foreseeable future and that it is therefore appropriate to adopt the going concern basis in preparing the interim financial statements.
7 Segmental Information
The Directors consider that the Group operates in predominantly one business segment, being the creation of software sold entirely to the US Healthcare Industry, and that there are therefore no additional segmental disclosures to be made in these financial statements.
8 Changes to Significant Accounting Policies
The accounting policies applied in these interim financial statements are the same as those applied in the Group’s consolidated financial statements as at and for the year ended 30 June 2020.
9 Availability of Announcement and Half YearlyReport
Copies of this announcement are available on the Company’s website, www.craneware.com. Copies of the Interim Report will be posted to shareholders, downloadable from the Company’s website and available from the registered office of the Company shortly.
20Craneware plc
Interim Report 2021
Directors, Secretary, Advisors and Subsidiaries
DirectorsW Whitehorn (non-executive, Chairman) K Neilson C T Preston R F Verni (non-executive) C Blye (non-executive) R Rudish (non-executive) A Erskine (non-executive) D Kemp (non-executive)
Company Secretary & Registered OfficeC T Preston1 Tanfield Edinburgh EH3 5DA
Nominated AdvisorsPeel Hunt LLP120 London Wall London EC2Y 5ET
RegistrarsLink Asset Services Ltd10th Floor Central Square 29 Wellington Street Leeds LS1 4DL
BankersBank of ScotlandThe MoundEdinburghEH1 1YZ
The Royal Bank of Scotland plc36 St. Andrew Square Edinburgh EH2 2YB
Clydesdale Bank20 Waterloo Street Glasgow G2 6DB
Barclays Commercial BankAurora House 120 Bothwell Street Glasgow G2 7JT
HSBC Bank plc7 West Nile Street Glasgow G1 2RG
Wells Fargo500 N Magnolia Avenue 8th Floor Orlando, FL 32803
Silicon Valley Bank3003 Tasman Drive Santa Clara, CA 95054
StockbrokersPeel Hunt LLP120 London Wall London EC2Y 5ET
Investec Bank plc30 Gresham Street London EC2V 7QP
Berenberg, Gossler & Co. KG60 Threadneedle Street London EC2R 8HP
Independent AuditorsPricewaterhouseCoopers LLPChartered Accountants & Statutory Auditors Atria One 144 Morrison Street Edinburgh EH3 8EX
SolicitorsPinsent Masons LLPPrinces Exchange 1 Earl Grey Street Edinburgh EH3 9AQ
Subsidiaries and Registered OfficesCraneware, Inc.3340 Peachtree Rd NE Suite 850 Atlanta, GA 30326
Craneware InSight, Inc.3340 Peachtree Rd NE Suite 850 Atlanta, GA 30326
Kestros Ltd t/a Craneware Health1 Tanfield Edinburgh EH3 5DA
Craneware Healthcare Intelligence, LLC12570 Perry Highway Suite 110 Wexford, PA 15090

21Craneware plc Interim Report 2021
Personal Notes

22Craneware plc
Interim Report 2021
Personal Notes


![L’autel et la toge Entrée en matièreL’autel et la toge Entrée en matière Nicole Belayche et Sylvia Estienne « [À Rome, la religion] joue un tel rôle, dans la vie privée](https://img.pdfslide.net/doc/110x75/60da9f772dfd780f07341fa2/laautel-et-la-toge-entre-en-matire-laautel-et-la-toge-entre-en-matire.jpg)