Embed Size (px)
Citation preview

4.8, 4.9, 4.11, 4.12; 6.1 Received 26 April 1965
Tonal Consonance and Critical Bandwidth
R. PLOMP AND W. J. M. LEVELT
Institute for Perec pi ion RVO-TNO, Socstcrberg, Netherlands
firstly, theories are reviewed on the explanation of tonal consonance as the singular nature of tone intervals with frequency ratios corresponding with small integer numbers. An evaluation of these explanations in the light of some experimental studies supports the hypothesis, as promoted by von Helmholtz, that the difference between consonant and dissonant intervals is related to beats of adjacent partials. This relation was studied more fully by experiments in which subjects had to judge simple-tone intervals as a function of lest frequency and interval width. The results may be considered as a modification of von Hclmholtz's conception and indicate that, as a function of frequency, the transition range between consonant and dissonant intervals is related to critical bandwidth. Simple-tone intervals are evaluated as consonant for frequency differences exceeding this bandwith, whereas the most dissonant intervals correspond with frequency differences of about a quarter of this bandwidth. On the base of these results, some properties of consonant intervals consisting of complex tones are explained. To answer the question whether critical bandwidth also plays a role in music, the chords of two compositions (parts of a trio sonata of J. S. Bach and of a string quartet of A. Dvorak) were analyzed by computing interval distributions as a function of frequency and number of harmonics taken into account. The results strongly suggest that, indeed, critical bandwidth plays an important role in music: for a number of harmonics representative for musical instruments, the "density" of simultaneous partials alters as a function of frequency in the same way as critical bandwidth does.
INTRODUCTION
OHM'S acoustical law, as formulated by von Helmholtz,1 states that the human ear is able to
analyze a complex of tones into its sinusoidal components. Jn a previous paper,2 one of the authors reported experiments on the number of distinguishable partials of multitone signals and showed that partials can be "heard out" only if their frequency separation exceeds critical bandwidth.
The fact that there are certain limitations to the validitv of Ohm's law was not overlooked by von Helmholtz. In his opinion, however, the exceptions did manifest themselves mainly in the appearance of beats in the case of small frcquencv differences between two simultaneous tones.:{ On this basis, by taking into account also beats between adjacent harmonics, von Helmholtz was able to explain why the phenomenon of musical consonance is related to simple frequency ratios of the tones involved.4 Though this conception became
1 H. von Helmholtz, Die Lclire von dcr Tonempfindungen ah physiologisehe Grundlage j'iir die Theorie der Musik (Verlag F. Vieweg & Sohn, Braunschweig, 1863), Chap. 2.
2R. Plomp, "The Ear as a Frequency Analyzer," J. Acousl. Soc. Am. 36, 1628-1636 (1964).
3Ref. 1, Chap. 8. 4Ref. 1, Chap. 10.
well-known, it was criticized severely, in particular by psychologists and musicologists.
In this paper, the relation between beats and consonance is studied again.5 To avoid misunderstandings, it may be useful to emphasize in advance that our sole concern is the question of why consonance is related to simple frequency ratio. Though the concept of consonance is rather vague and mav be different for musicians and laymen, this relationship is always involved. In our opinion, consonance refers to the peculiar sensorial experience associated to isolated tone pairs with simple frequency ratios. We use the term tonal consonance to indicate this characteristic experience. As we shall see, experimental results concerning "tonal consonance" support von Hclmholtz's conception, but they also necessitate a number of qualifications in which the concept of critical bandwidth will appear to play an important role.
6 A preliminary report of it was read at the Fourth International Congress on Acoustics, Copenhagen, 1962 : R. Plomp and \Y. J. M. Levelt, "Musical Consonance and Critical Bandwidth," Paper P55 in Proceedings of the Fourth International Congress on Acoustics, J062, Copenhagen (Organization Committee of the 4th ICA and Harlang & Toksvig, Copenhagen, 1963).
548
T O N A L C O N S O N A N C E A N D
I. HISTORICAL REVIEW t
A. Explanations of Consonance
Traditionally, Pythagoras is considered to be the discoverer of the fact that tones produced by a string vibrating in two parts with length ratios of 1:1, 1:2, 2:3, and 3:4, respectively, give much better harmonies than all other ratios. These tone intervals were called consonances, and on their singular character the harmony of Western music has been developed, especially after, in the Middle Ages, other intervals with ratios of 4:5, 3:5, 5:6, and 5:8 were accepted as imperfect consonances.
The question why consonance is related to simple integer ratios of string lengths has occtipied many scholars through the ages. In particular, between about I860 and 1920 numerous studies were devoted to it. Essentially all explanations proposed'"' are based on one or more of the following data.
J. Frequency Ratio
One of the first and most important discoveries in acoustics durini: the rise of modem science in the loth and 17th centuries was the dependence of pitch on frequency.7 The latter implied that consonant intervals are characterized by simple frequency ratios, which suggested an attractive hypothesis concerning the origin of consonance. So Galilei stated: "Agreeable consonances are pairs of tones which strike the ear with a certain regularity; this regularity consists in the fact that the pulses delivered by the two tones, in the same interval of time, shall be commensurable in number, so as not to keep the ear drum in perpetual torment, bending in two different directions in order to yield to the ever-discordant impulses."s Other scientists as Leibniz and Eider refined this explanation, exchanging the eardrum for the unconsciously counting soul that would prefer intervals the more as the vibrations of the constituting tones concur more frequently. Substantially the same idea was promoted and worked out by Lapps9 and Polak,1" whereas the recent "common long pattern theory" of Boomsliter and Creel11 also must be considered as belonging to this group.
0 In this survey, only explanations related to hearing theory are included.
7 A thoroughgoing study of this discovery is given by C. Trues-dell, The Rational Mechanics of Flexible or Elastic Bodies, 1638-1788, Leonhardi Failed Opera Omnia Ser. IX, 11, Ft. 2 (Verlag 0 . Fussli, Ziirich, I960), Pt . 1.
8 Galileo Galilei, Discorsi e dimoslrazioni malematiclie intcnio a due nuove scienze atlencnti alia mecanica ed i movimenli local! (Klsevier, Leiden, 1638). The quotation is from the Knglish translation, Dialogues concerning Two Nciu Sciences, transl. by H. Crew and A. de Salvio (McGraw-Hill Book Co., Inc., New York, 1963), p. 100.
,J Th. Lipps, Psychologische Sludien (Verlag G. Weiss, Heidelberg, 1885), pp. 92-161.
10 A. J. Polak, Vbcr Zeilein/ieil in Beziig auf Konsonanz, llar->nonie und Tonalital (Verlag Breitkopf & Harlcl, Leipzig, 1900).
11 P. Boomsliter and \V. Creel, "The Long Pattern Hypothesis in Harmony and Hearing," j . Music Theory 5, No. 2, 2-30 (1961).
C R I T I C A L B A X D W 1 D T H 549
2. Relationship of Harmonics
The discovery (17th century) that the tones of musical instruments are composed of partials2 gave rise to an alternative explanation of consonance. At first, the mere presence of harmonics with frequency ratios 1:2, 2:3, etc., in every (complex) tone was considered as a sufficient proof of the consonance of these ratios (Rameau). In the 19th century, more-thorough lv formulated implications of the existence of harmonics were presented. Both von Helmholtz12 and Wundtl:!
based the development of melody and harmony on the coinciding harmonics for consonant intervals. The
O
opinion that consonance itself originates in these coincidences was defended more recent lv by Ogden14 and Husmann,15 though from different points of view. Montani10 has tried to give this explanation a physiological base.
3. Beats between Harmonics
The existence of harmonics led also to a quite different hypothesis, in which the phenomenon of consonance was related to beats and roughness, appearing for small frequency differences of simultaneous tones. Though nearly always von Helmholtz is mentioned as the originator of this conception, there are much older statements of a quite similar nature (Sorge17). von Helmholtz"'5 stated that for small frequency differences the beats between two simple tones can be heard individually, but for larger distances this becomes impossible, due to their rapid succession, and the sound obtains a rough and unpleasant character. He ascertained that this roughness has a maximum for a frequency difference of 30—10 cps, independent of frequency, but admitted also that for a constant difference the roughness in-creases with frequency. For larger frequency differences, roughness decreases and the sound becomes consonant and agreeable, independent of frequency ratio. For complex tones, as produced by musical instruments, also beats between harmonics of the lower tone and harmonics of the higher one must be taken into account. In this way, von Helmholtz explained-1 that the smaller that the numbers are in which the frequency ratio can be expressed, the more consonant the interval is. The octave, with a frequency ratio of 1:2, is the most consonant interval because all partials of the higher tone coincide with partials of the lower one and no beats are introduced. The next most consonant interval is the
12 kef. 1, Chaps. 14, 15. la W. YVundt, Grundziige dcr physiolo^ischen Psychologie (Verlag
W. Engelmann, Leipzig, 1880),'2nd ed., Vol. 1, pp. 402-408; Vol. 2, pp. 35-48.
11 R. M. Ogden, "A Contribution to the Theory of Tonal Consonance," Psychol. Bull. 6, 297-303 (1909).
15 H. Husmann, Vom Wescn der Konsonanz (Muller-Thiergarten-Verlag, Heidelberg, 1953).
16 A. Montani, "Outline of a Physiological Theorv of Musical Consonance," Riv. Musicale Ital. 49, 168-176 (1947).
17 G. A. Sorge, Yorgcmach dcr musicalischen Composition (Verlag des Autoris, Lobenslein, 1745-1747), pp. 333, 334.
550 P L O M P A N
fifth (2 :3), for in this case half of the partials coincides, whereas the other ones lie just half-way between partials of the lower tone. He considered it an affirmation of his theory that , in musical practice, thirds and sixths are avoided in the low-frequency range where partials are nearer to each other than at higher frequencies.
4. Difference Tones
Though von Helmhollz had not denied that also beats between difference tones may contribute to dissonance, this aspect was much more emphasized by IVeyer,18 and in particular by Krueger.1!l--" On the basis of detailed experiments on difference tones,21 Krueger concluded that the significance of these tones was strongly underestimated bv von Helmholtz. As the total number of difference tones increases with complexity of frequency ratio, these tones could explain the order of consonant intervals, not only for complex but also for simple primary tones. More recently, Sandig22 compared the character of intervals with both tones presented to the same ear and intervals with one tone presented to the left and the other one to the right ear, respectively, regarding the more neutral character of intervals in the last case as an affirmation of Krueger's theory.
5. Fusion
A quite different point of view was developed by Stumpf.23 In his opinion, neither harmonics nor difference tones are essential to discriminate between consonant and dissonant intervals, whereas he rejected the frequency-ratio theory as mere speculation. Stumpf called attention to the fact, investigated by him before-4 and confirmed by many others after him, that the degree of fusion ("Yerschmelzung") of intervals depends on simple frequency ratio in the same order as consonance does. Bv fusion, he meant the tendency of two simultaneous tones to be perceived as a unity. Stumpf understood the close connection to consonance as a causal relation, fusion being the basis of consonance. However, many years later, he admitted that this conclusion was not justified and that the relation cannot be considered as a satisfacton' explanation of the consonance phenomenon.25
18 W. Prevcr, Akustische Vnlersuchungcn (Verlag G. Fischer, Jena, 1879),'pp. 44-61.
19 F. Krueger, "Differcnztone unci Konsonanz," Arch. Ges. Psychol. 1, 205-275 (1903); 2, 1-80 (1904).
20 F. Krueger, "Die Theorie der Konzonanz," Psvchol. Studied I, 305-387 (1906); 2, 205-255 (1907); 4, 201-282 (1909); 5, 294-411 (1910).
21 A summary of the results of these experiments can he found in R. Plomp, "Dctectabilitv Threshold for Combination Tones," J. Acuust. Soc. Am. 37, 1110-1123 (1965). > 22 H. Sandig, "Beobachtungen an Zweikliingen in getrennt-ohriger und beidohriger Darbietung. Ein Beitrag zur Theorie der Konsonanz," Neue Psychol. Studien 14, 25-131 (1939).
23 C. Stumpf, "Konsonanz und Dissonanz," Jicitr. Akust. Musikwiss. 1, 1-108 (1898).
24 C. Stumpf, Ton psychologic (Verlag S. Hirzcl, Leipzig, 1890), Vol. 2, pp. 127-218.
25 C. Stumpf, Die Sprachlaulc (Verlag J. Springer, Berlin, 1926), p. 281.
D L R V K L T
B. Evaluation of These Explanations
The existence of these divergent theories suggests that consonance is a complex phenomenon and that conclusive experiments on the value of the explanations mentioned arc difficult to find. In contrast with I he-time before about 1920, modern books on hearing pay only little or no attention to consonance.2'' Is this lack of interest justified and must we admit that those investigators are right who considered consonance as determined mainly or exclusively by cultural27-28 or even genetic1429 factors?
In answering this question, we have to realize that our consonance perception is indeed profoundly influenced by the development of Western music and musical training;. This is illustrated in two ways.
1. The primary reason why von Helmholtz's explanation of consonance by beats was rejected by many investigators was that in their opinion the degree of consonance or dissonance of an interval is not altered by removing the harmonics of the component tones. A study of the observations on which this opinion was based shows that, without exception, musically trained subjects were used to judge the intervals. This was not considered as a difficulty but, on the contrary, as an essential condition to obtain relevant responses. Stumpf himself, perhaps the most important critic of the beat theory, may be presented as a good illustration. Hi^ large interest in the psychology of tone was due to the fact that originally he intended to become a musician.30
For him, judgment of a particular tone interval was identical to finding out its musical name, and this knowledge determined entirely the consonance value that he attached to the interval. For this reason, he considered intervals like 8:15 and 7:10 as dissonants, also in cases without audible harmonics and difference tones. Apparently, this approach was so self-evident to him (and many others) that he did not realize that his results had nothing to do with the origin of consonance and dissonance but must be considered only as a demonstration of the success of his musical education and training. The large influence of training was demonstrated bv an investigation bv Moran and Pratt3 1 in
26 This mav be illustrated bv S. S. Stevens and H. Davis, Hearing (John Wiley & Sons, Inc., New York, 1938). Though E. G. Boring in his "Perspective" at the beginning of the book refers to the work of H. von Helmholtz and closes with the words, "Certainly we are ready now for a new Lclirc von den Tonempfin-dungen to orient us among the complexities of the new physiological acoustics which is now so successfully answering questions which Helmholtz posed," this book spends only one paragraph to the phenomenon of consonance, merely mentioning von Helmholtz's expanation without comments.
27 N. Cazden, "Musical Consonance and Dissonance: A Cultural Criterion," J. Aesthet. 4, 3-11 (1945).
28 R. \V. Lundin, "Toward a Cultural Theorv of Consonance," J. Psychol. 23, 45-49 (1947).
2<J H. T. Moore, "The Genetic Aspects of Consonance and Dissonance," Psychol. Monogr. 17, No. 2, 1-68 (1914).
30 C. Stumpf, Tonpsychologie (Verlag S. Hirzel, Leipzig, 1883), Vol. 1, Preface.
31 H. Moran and C. C. Pratt, "Variability of Judgments on Musical Intervals," J. Exptl. Psychol. 9, 492-500 (1926).
T O N A L C O N S O N A N C E A N D C R I T I C A L B A N D W I D T II 551
which 3 observers, who were able to recognize any given musical interval, had to adjust the frequency of one of the tones of each of a series of intervals to the correct value for that interval. The results, obtained for simple tones, indicated that for each of the subjects the average settings were more in agreement with the interval widths after the equally tempered scale, as used in music, than after the natural scale, given by simple frequency ratios. These results show that we have to make a clear distinction between interval recognition and consonance judgment. The ability to recognize frequently used intervals does not explain why the singular nature of the impressions produced by particular intervals is related to simple frequency ratios of the component tones.
2. The influence of music on the judgment of intervals can be shown in another way also. Originally, only 1:1, 1:2, 2:3, and 3 :4 were considered as consonant and agreeable intervals. Nowadays, the situation is much more complex. Asking a jury of musicians and psychologists to ascertain the rank order of consonance of all intervals within the octave, Malmberg32 obtained the order 1:2, 2 :3 , 3:5 , 3:4 and 4 :5 , 5:8, 5:6, 5:7, 5:(), 8:9, 8:15, and 15:16. Guernsey** has confirmed the well-known fact that musicians make a clear distinction between pleasantness and consonance. In this study, it was found that for a group of musicians the ranking of intervals for consonance was about the same as that obtained by Malmberg, but the ordering in terms of pleasantness was quite different: sixths (3:5, 5:8), thirds (4:5, 5 :6), fourth (3 :4), and minor seventh (5 :9) did share the highest rank. For naive subjects, however, consonance and pleasantness are much more similar concepts, as was demonstrated by the authors'14 in an experiment in which 10 subjects had to judge a large number of intervals on 10 different semantic scales. A high correlation between consonance and pleasantness scores was found. In fact "consonance" appeared to be used as an evaluation category. For these subjects, too, the sixths, thirds, and fourth were the most pleasant intervals, but their evaluation of the octave and fifth was much higher than for musicians, as was also the case in Guernsey's experiments.83 From these results, we may conclude that the original concept of consonance has been split up in two opinions: one held by musicians, the other by naive subjects. This development must be seen as a consequence of the fact that , in the course of history, preference did shift from intervals given by 1:2, 2 :3 , and 3:4 to more-complex frequency ratios. For laymen, the meaning of the term consonance followed this shift. Musicians, however, did maintain the traditional rank order of intervals in terms of consonance,
32 C. V. Malmberg, "The Perception of Consonance and Dissonance," Psychol. Monogr. 25, No. 2, 93-133 (1917-1918).
33 M. Guernsey, "The Role of Consonance and Dissonance in Music," Am. J. Psychol. 40, 173-204 (1928).
31 J. P. van de Geer, YV. J. M. Levelt, and R. Plomp, "The Connotation of Musical Consonance," Acta Psychol. 20, 308-319 (1962).
<r
characterized by smoothness and uniform itv, independent from evaluation.
After these two digressions on the relation of con-sonance to music the question can be asked as to how to evaluate the various consonance explanations mentioned in Sec. 1-A. In our attempt to answer this question, we are interested in perception of consonance not so much as a product of musical education and training but as a basis of it. In our opinion, there exists a. typical sensorial phenomenon that is related to simple integer frequency ratios and that is of a general nature, holdin also for subjects without any experience in musical harmony. This particular sensorial phenomenon, which we call "tonal consonance," may be considered to be basic to the relation between the concept of consonance, as held by musicians and laymen, and simple frequency ratios.
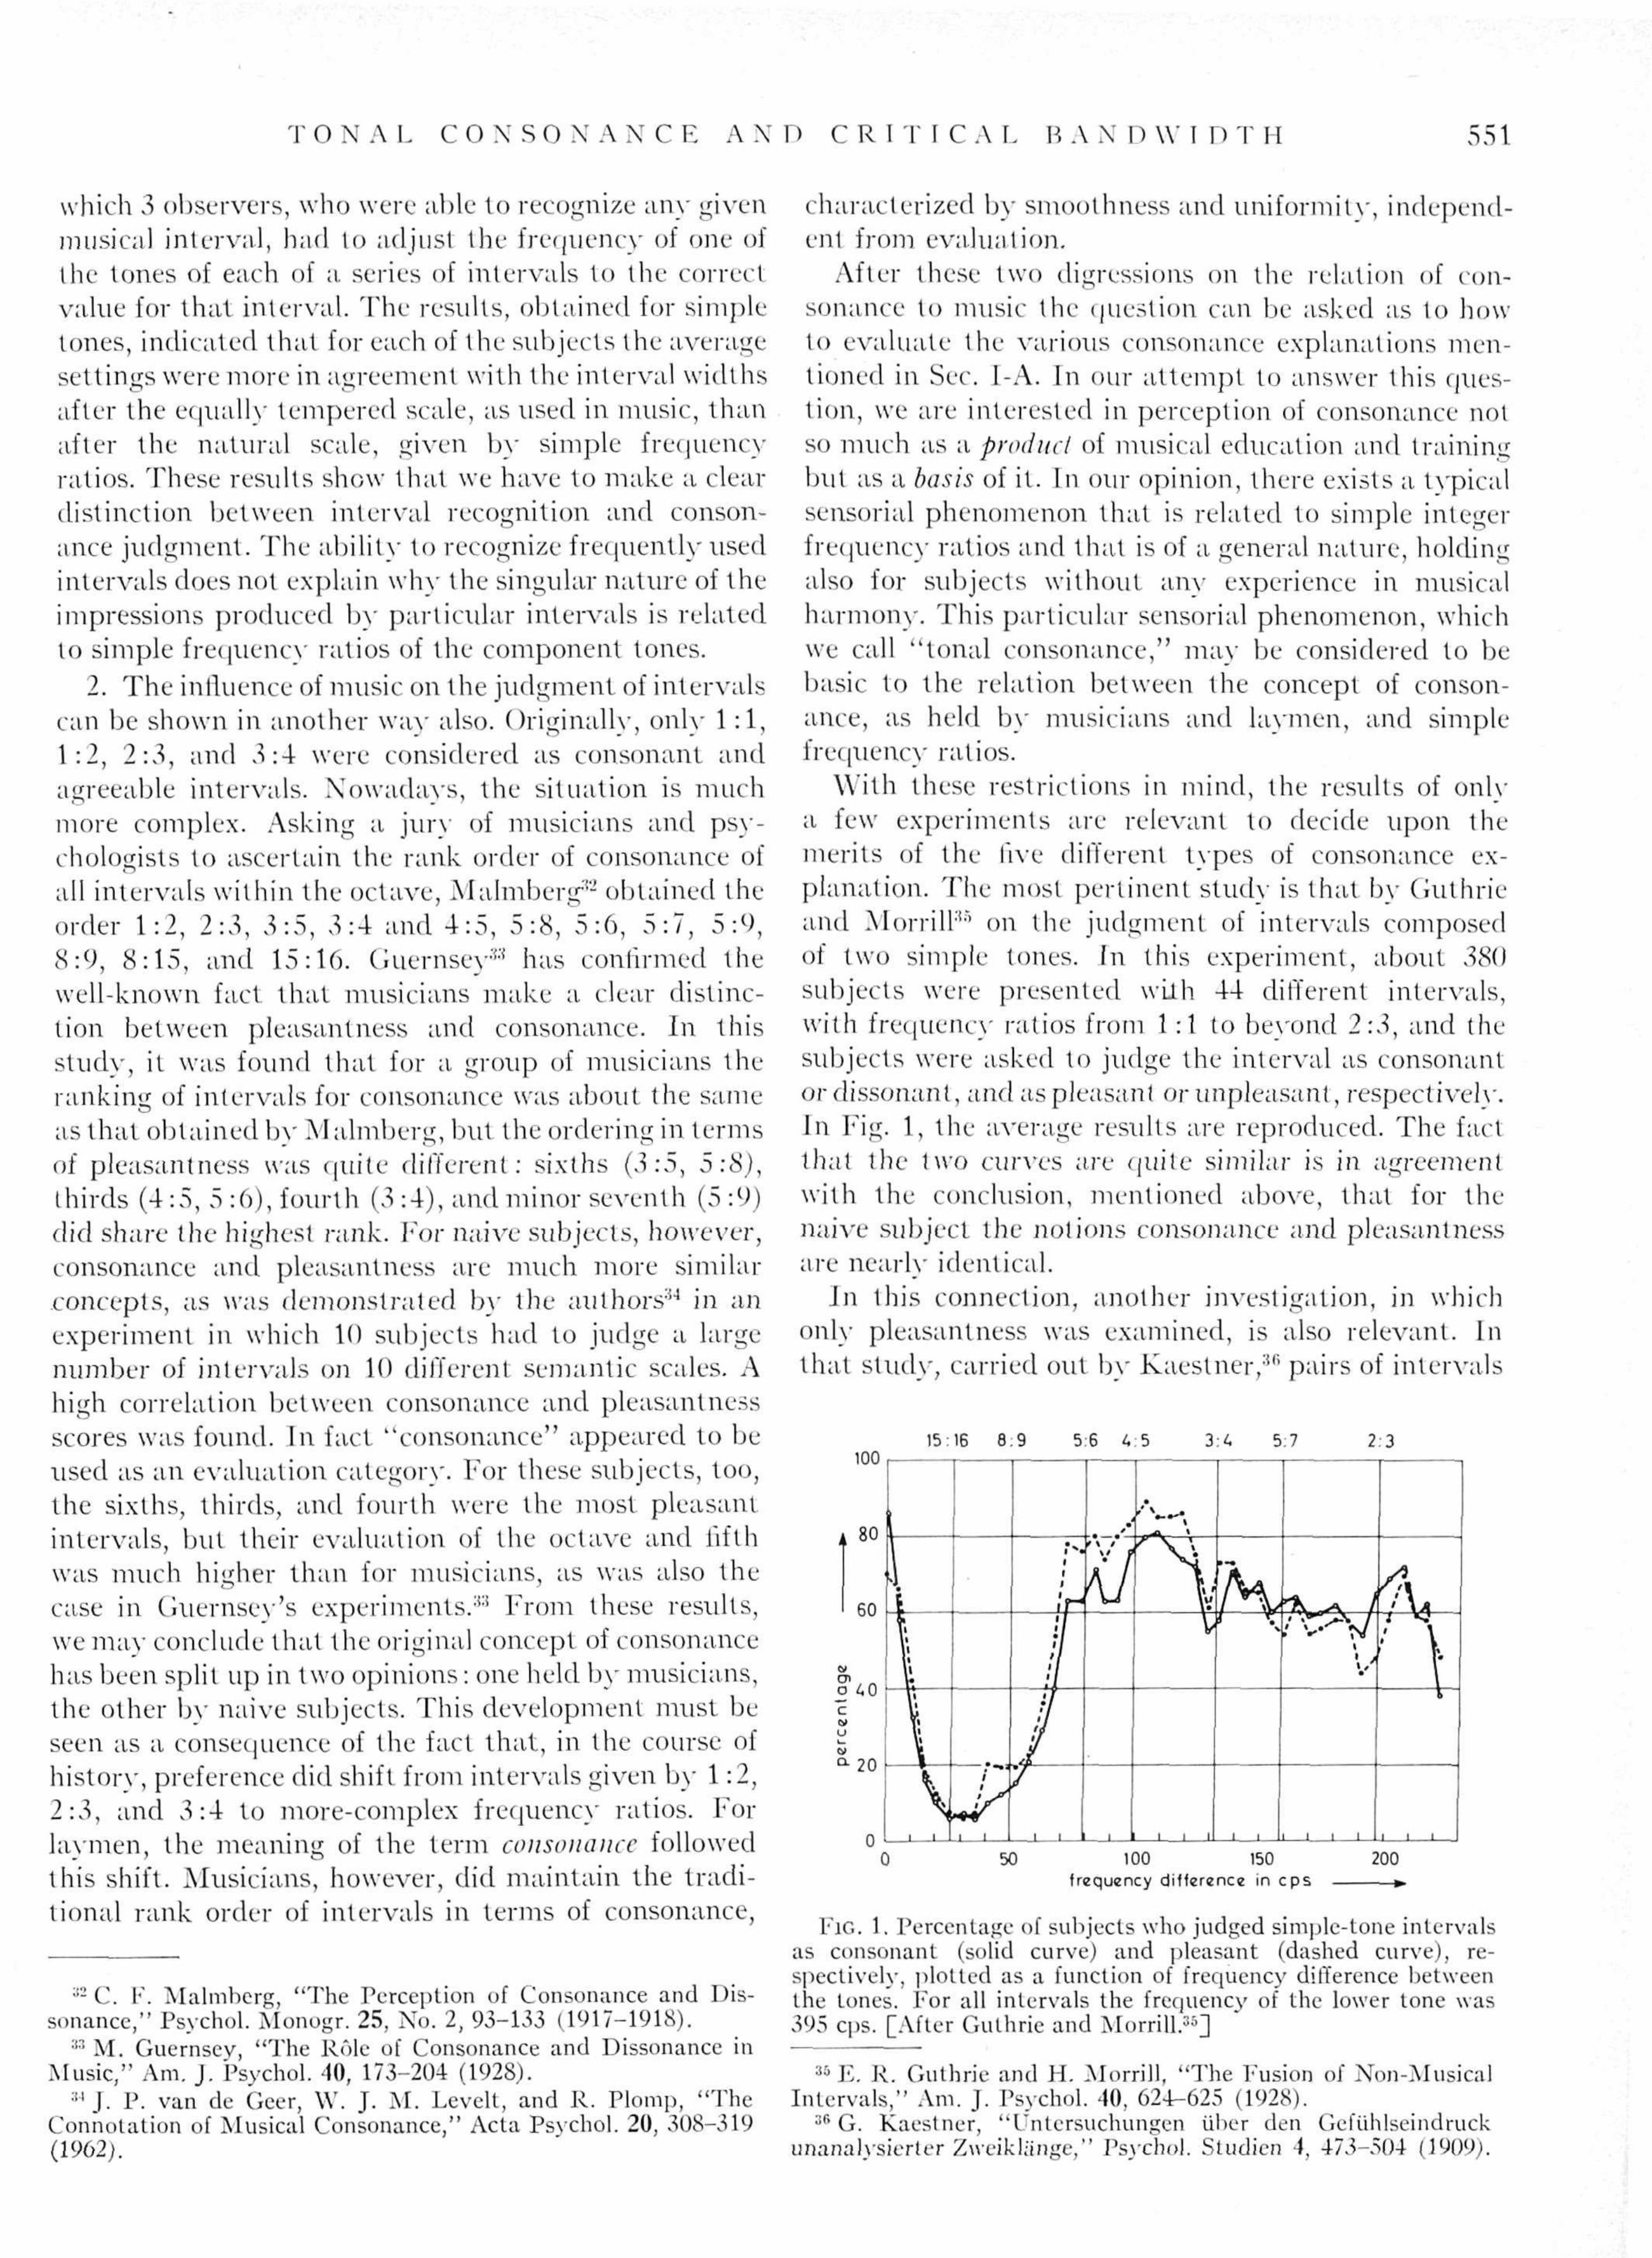
With these restrictions in mind, the results of only a few experiments are relevant to decide upon the merits of the five different types of consonance explanation. The most pertinent stud}- is that by Guthrie and Morrill5 ' on the judgment of intervals composed of two simple tones. In this experiment, about 380 subjects were presented with 44 different intervals, with frequency ratios from 1:1 to beyond 2:3 , and the subjects were asked to judge the interval as consonant or dissonant, and as pleasant or unpleasant, respectively. In Fig. 1, the average results are reproduced. The fact that the two curves are quite similar is in agreement with the conclusion, mentioned above, that for the naive subject the notions consonance and pleasantness are nearly identical.
In this connection, another investigation, in which only pleasantness was examined, is also relevant. In that study, carried out by Kaestner,36 pairs of intervals
100 150 frequency difference in c p s
FIG. 1. Percentage of subjects who judged simple-tone intervals as consonant (solid curve) and pleasant (dashed curve), respectively, plotted as a function of frequency difference between the tones. For all intervals the frequency of the lower tone was 395 cps. [After Guthrie and Morrill.35]
35 E. R. Guthrie and H. Morrill, "The Fusion of Non-Musical Intervals," Am. J. Psychol. 40, 624-625 (1928).
36 G. Kaestner, "Untersuchungen iiber den Gefiihlseindruck unanalysierler Zweikliinge," Psychol. Studicn 4, 473-504 (1909).
552 I ' l . o ; M P A N D L K V K I . T
1516 8 9 5:645 3 4 5:7 2 3 5 8 35 5:9 8 15 1:2
i—in i u—i_i 100 150 200 250
f requency di f ference in cps -
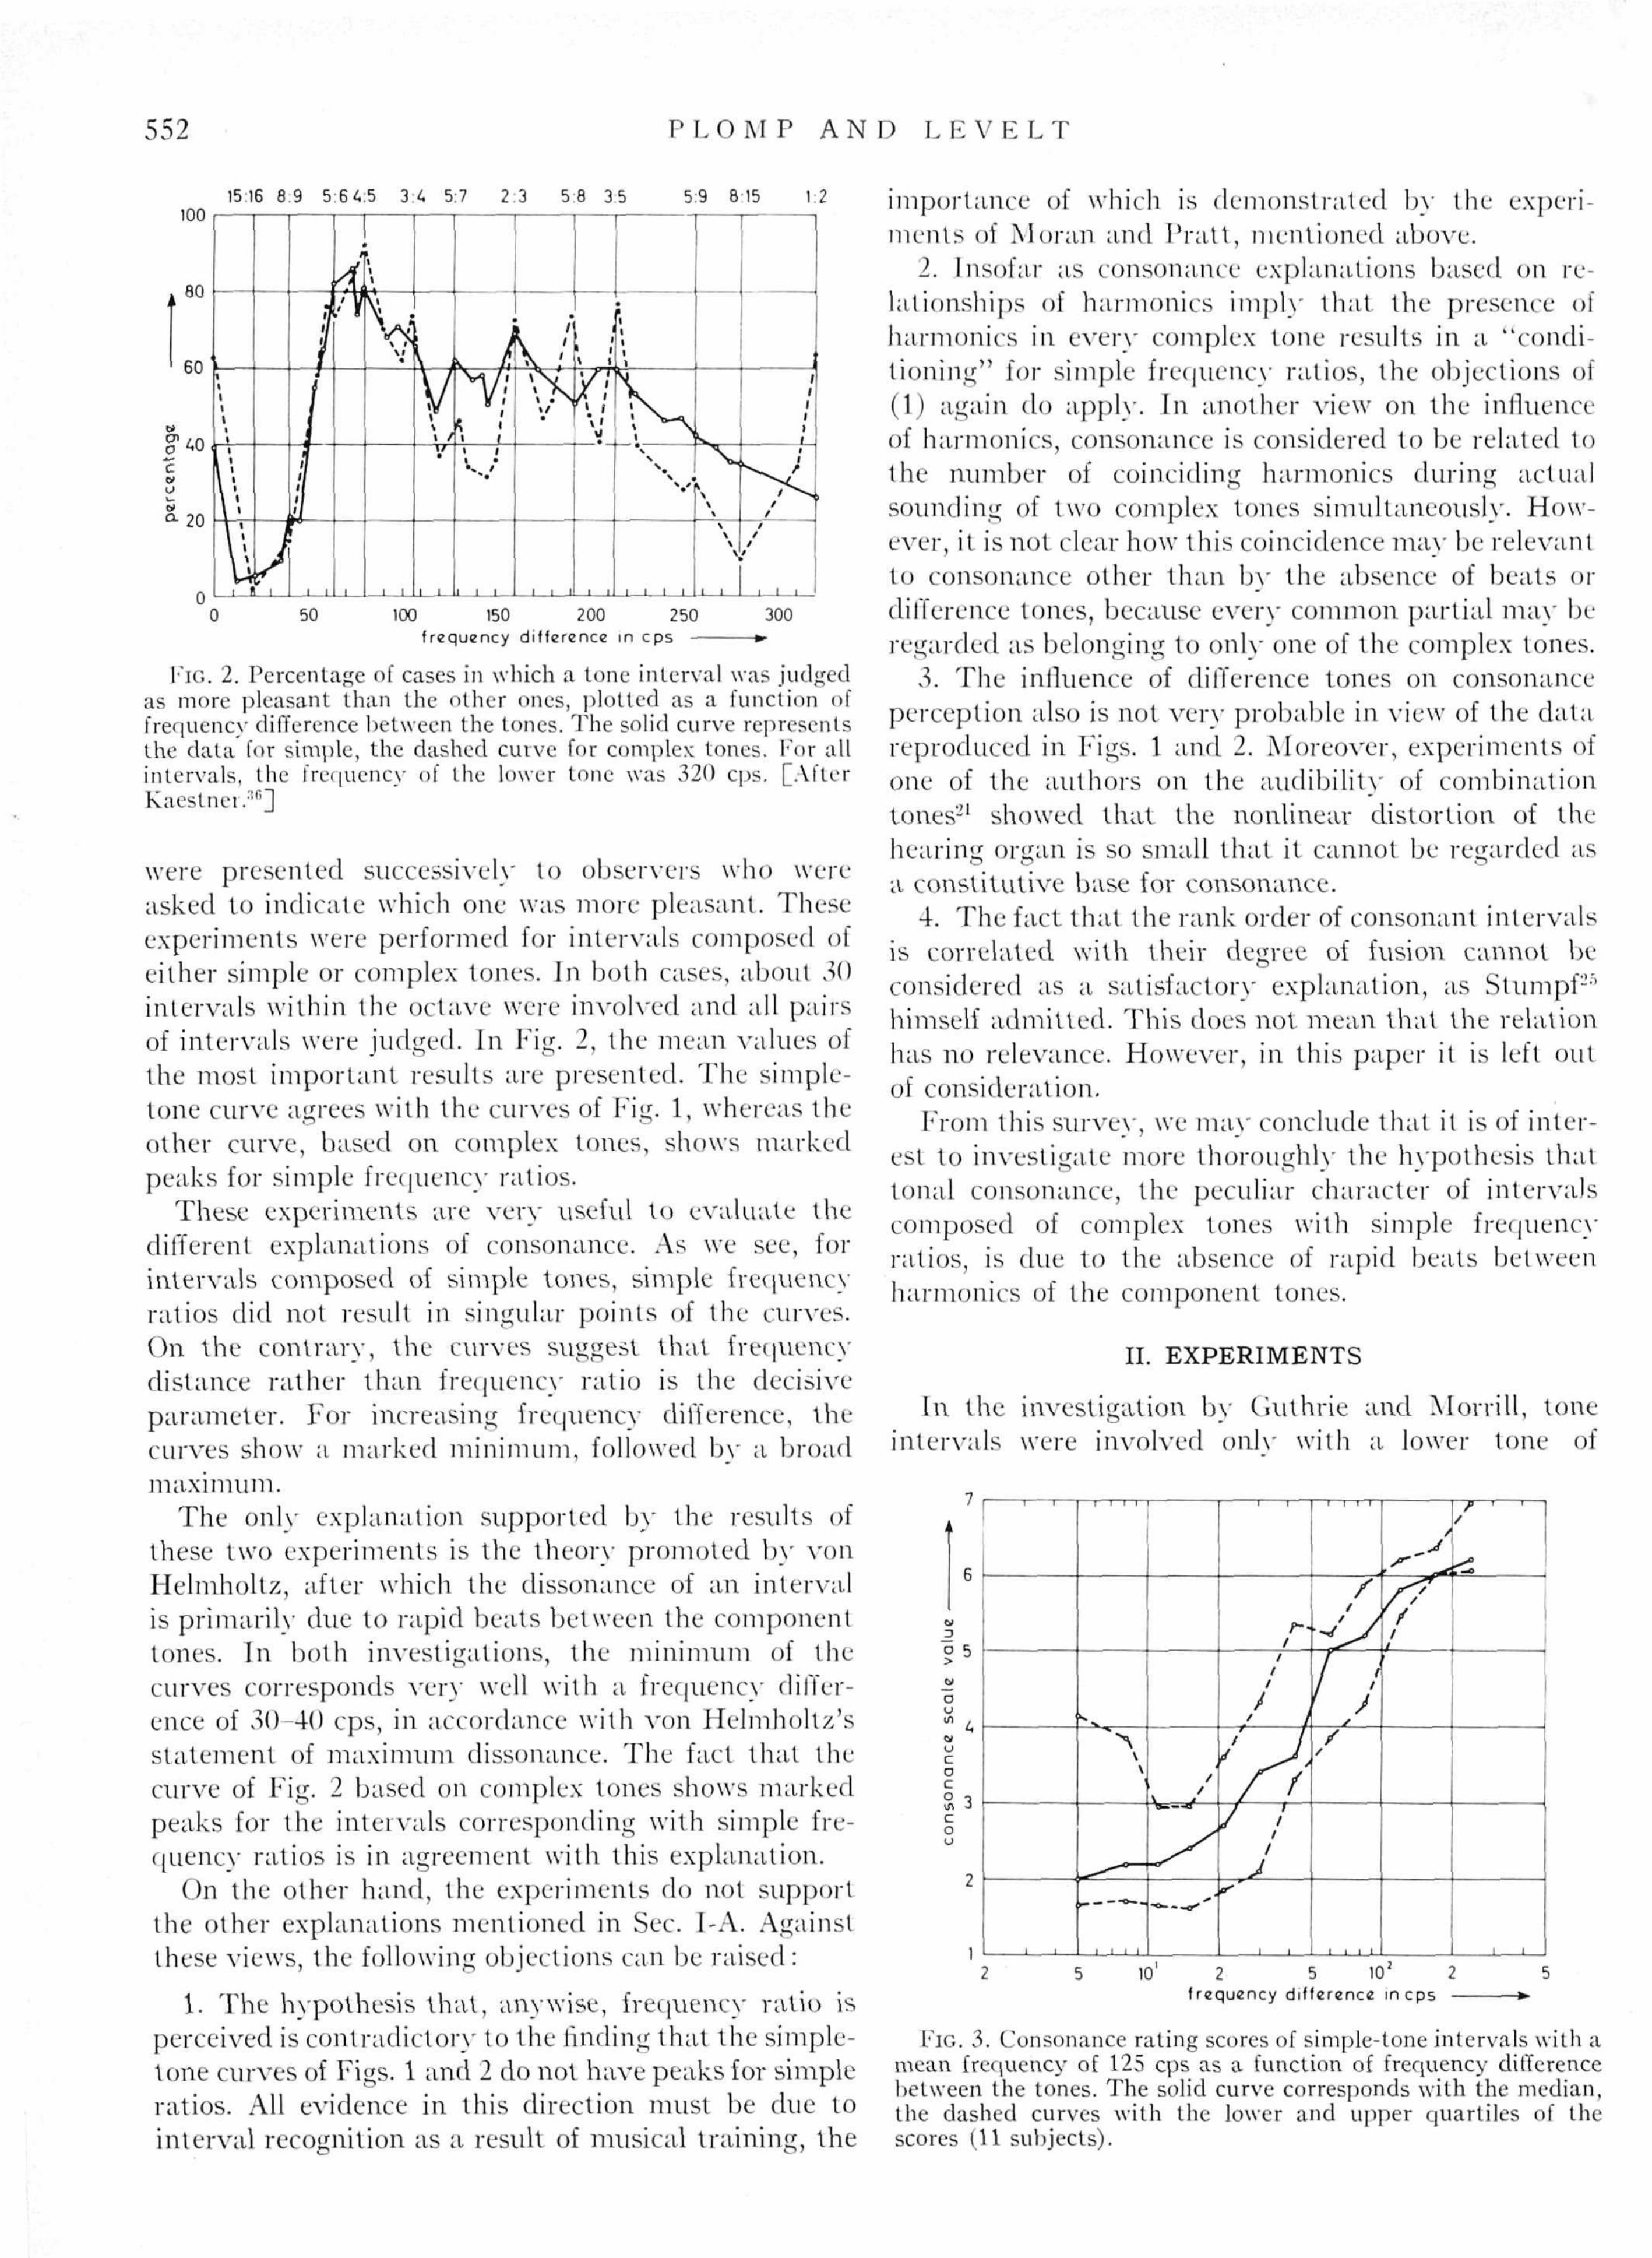
FlG. 2. Percentage of cases in which a tone interval was judged as more pleasant than the other ones, plotted as a fund ion of frequency difference between the tones. The solid curve represents the data for simple, the dashed curve for complex tones. For all intervals, the frequency of the lower tone was 320 cps. [After Kaes trier.36!
were presented successively to observers who were asked to indicate which one was more pleasant. These experiments were performed for intervals composed of either simple or complex tones. In both cases, about 30 intervals within the octave were involved and all pairs of intervals were judged. In Fig. 2, the mean values of the most important results are presented. The simple-tone curve agrees with the curves of Fig. 1, whereas the other curve, based on complex tones, shows marked peaks for simple frequency ratios.
These experiments are very useful to evaluate the different explanations of consonance. As we see, for intervals composed of simple tones, simple frequency ratios did not result in singular points of the curves. On the contrary, the curves stiggest that frequency distance rather than frequency ratio is the decisive parameter. For increasing frequency difference, the curves show a marked minimum, followed by a broad maximum.
The only explanation supported by the results of these two experiments is the theory promoted by von Helmholtz, after which the dissonance of an interval is primarily due to rapid beats between the component tones. In both investigations, the minimum of the curves corresponds very well with a frequency difference of 30-40 cps, in accordance with von Helmholtz's statement of maximum dissonance. The fact that the curve of Fig. 2 based on complex tones shows marked peaks for the intervals corresponding with simple frequency ratios is in agreement with this explanation.
On the other hand, the experiments do not support the other explanations mentioned in Sec. I-A. Against these views, the following objections can be raised:
1. The hypothesis that , anywise, frequency ratio is perceived is contradictory to the finding that the simple-tone curves of Figs. 1 and 2 do not have peaks for simple ratios. All evidence in this direction must be due to interval recognition as a result of musical training, the
importance of which is demonstrated by the experiments of Moran and Pratt , mentioned above.
2. Insofar as consonance explanations based on relationships of harmonics imply that the presence of harmonics in every complex tone results in a "conditioning" for simple frequency ratios, the objections of (1) again do apply. In another view on the influence of harmonics, consonance is considered to be related to the number of coinciding harmonics during actual sounding of two complex tones simultaneously. However, it is not clear how this coincidence may be relevant to consonance other than by the absence of beats or difference tones, because every common partial may be regarded as belonging to only one of the complex tones.
3. The influence of difference tones on consonance perception also is not very probable in view of the data reproduced in Figs. 1 and 2. Moreover, experiments of one of the authors on the audibility of combination tones'21 showed that the nonlinear distortion of the hearing organ is so small that it cannot be regarded as a constitutive base for consonance.
4. The fact that the rank order of consonant intervals is correlated with their degree of fusion cannot be considered as a satisfactory explanation, as Stumpf25
himself admitted. This does not mean that the relation has no relevance. However, in this paper it is left otit of consideration.
From this survey, we may conclude that it is of interest to investigate more thoroughly the hypothesis thai tonal consonance, the peculiar character of intervals composed of complex tones with simple frequency ratios, is due to the absence of rapid beats between harmonics of the component tones.
II. EXPERIMENTS
In the investigation by Guthrie and Morrill, lone intervals were involved onlv with a lower tone of
2
O u 1/1 u c u c o c
c o o
1 1 —
1 1
| — r - T T i •
^
\
\
1 1 1 1
i "
/ /
*
[ 1 1
/
/
/ /
/ ,
f -T / /
/
J r
1 1
T — r — T — 1 — 1
/
/
1 r
/ /
1 1 1 1 1
/ / V /
/
: 1 1
10' 2 5 102 2 f requency di f ference in cps -
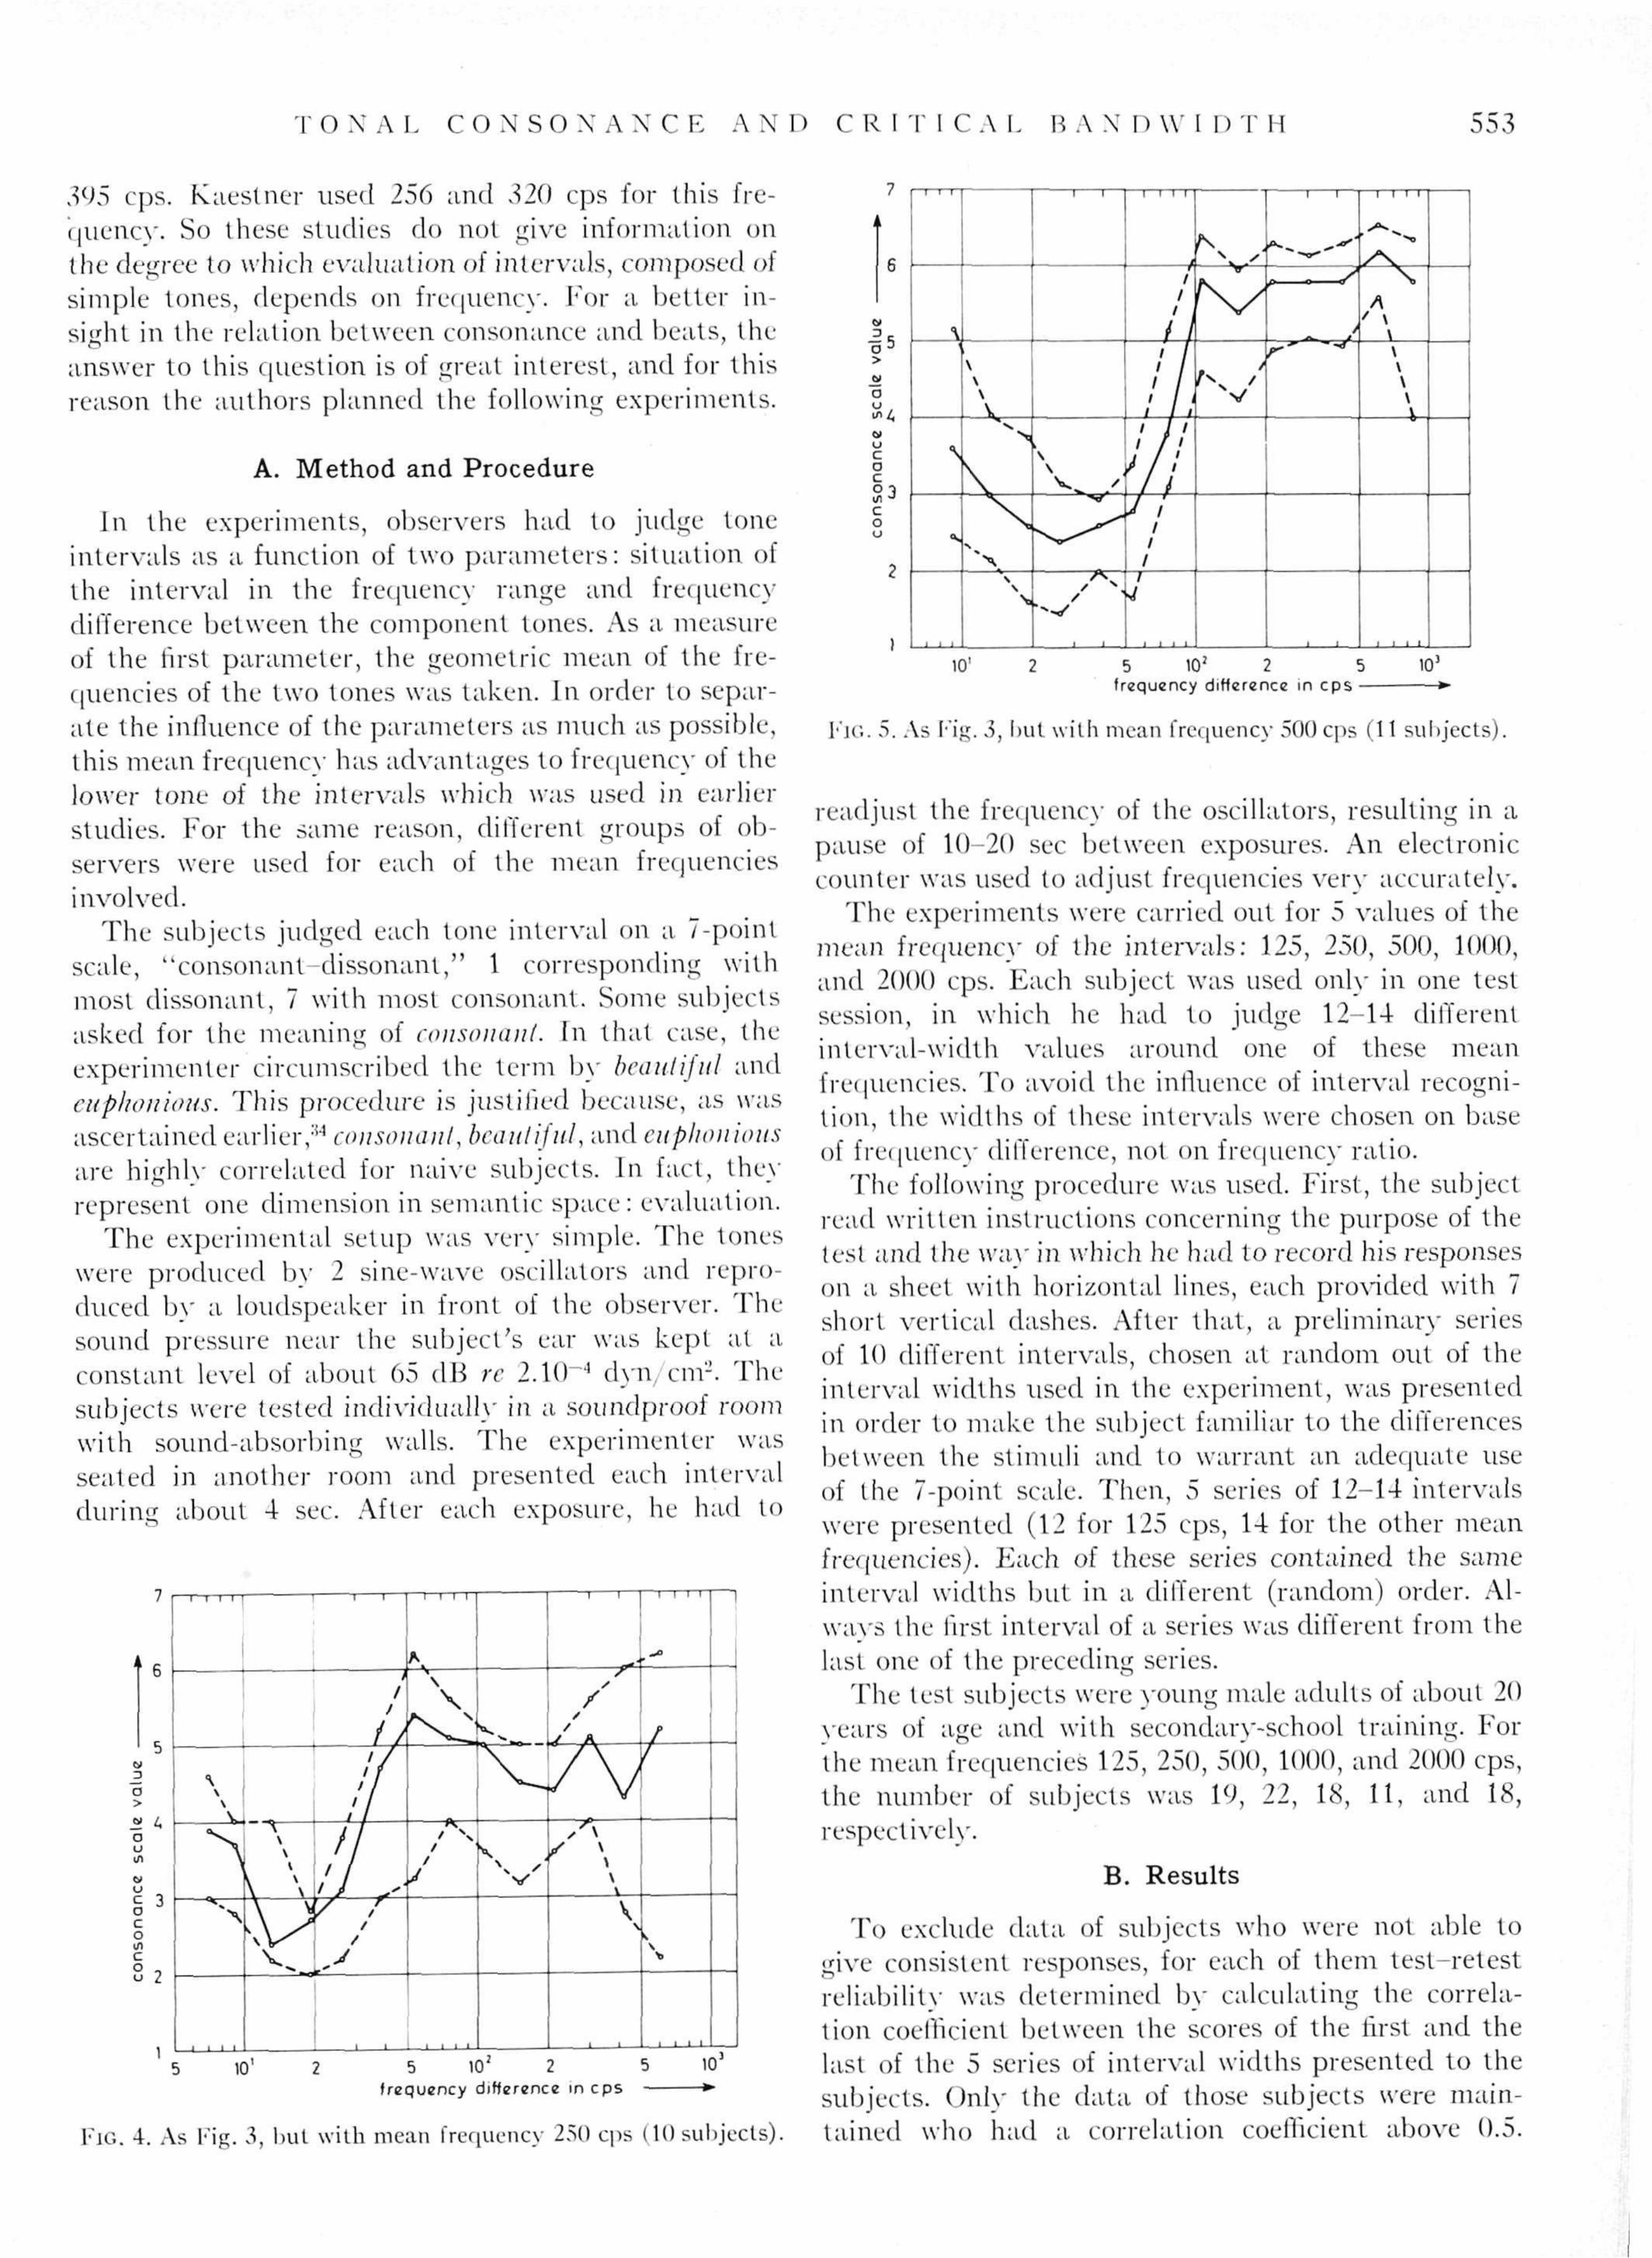
FIG. 3. Consonance rating scores of simple-tone intervals with a mean frequency of 125 cps as a function of frequency difference between the tones. The solid curve corresponds with the median, the dashed curves with the lower and upper quartiles of the scores (11 subjects).
T O N A L C O N S O N A N C E A N D C R I T I C A L B A X D \Y I I) T H 553
395 cps. Kaestner used 256 and 320 cps for this frequency. So these studies do not give information on the degree to which evaluation of intervals, composed of simple tones, depends on frequency. For a. better insight in the relation between consonance and beats, the answer to this question is of great interest, and for this reason the authors planned the following experiments.
A. Method and Procedure
In the experiments, observers had to judge tone intervals as a function of two parameters: situation ol the interval in the frequency range and frequency difference between the component tones. As a measure of the first parameter, the geometric mean of the frequencies of the two tones was taken. In order to separate the influence of the parameters as much as possible, this mean frequency has advantages to frequency oi the lower tone of the intervals which was used in earlier studies. For the same reason, different groups of observers were ttsed for each of the mean frequencies involved.
The subjects judged each tone interval on a 7-point scale, "consonant-dissonant," 1 corresponding with most dissonant, 7 with most consonant. Some subjects asked for the meaning of consonant. In that case, the experimenter circumscribed the term by beautiful and euphonious. This procedure is justified because, as was ascertained earlier,1'5'1 consonant, beautiful, and euphonious are highly correlated for naive subjects. In fact, the}' represent one dimension in semantic space: evaluation.
The experimental setup was very simple. The tones were produced by 2 sine-wave oscillators and reproduced by a loudspeaker in front of the observer. The sound pressure near the subject's ear was kept at a constant level of about 65 (IB re 2.10"4 dyn cm-. The subjects were tested individually in a soundproof room with sound-absorbing walls. The experimenter was seated in another room and presented each interval during about 4- sec. After each exposure, he had to
ex
>
o «A »J C o c o -\ c o o
2
10' 5 102 2 5 frequency difference in cps -
101
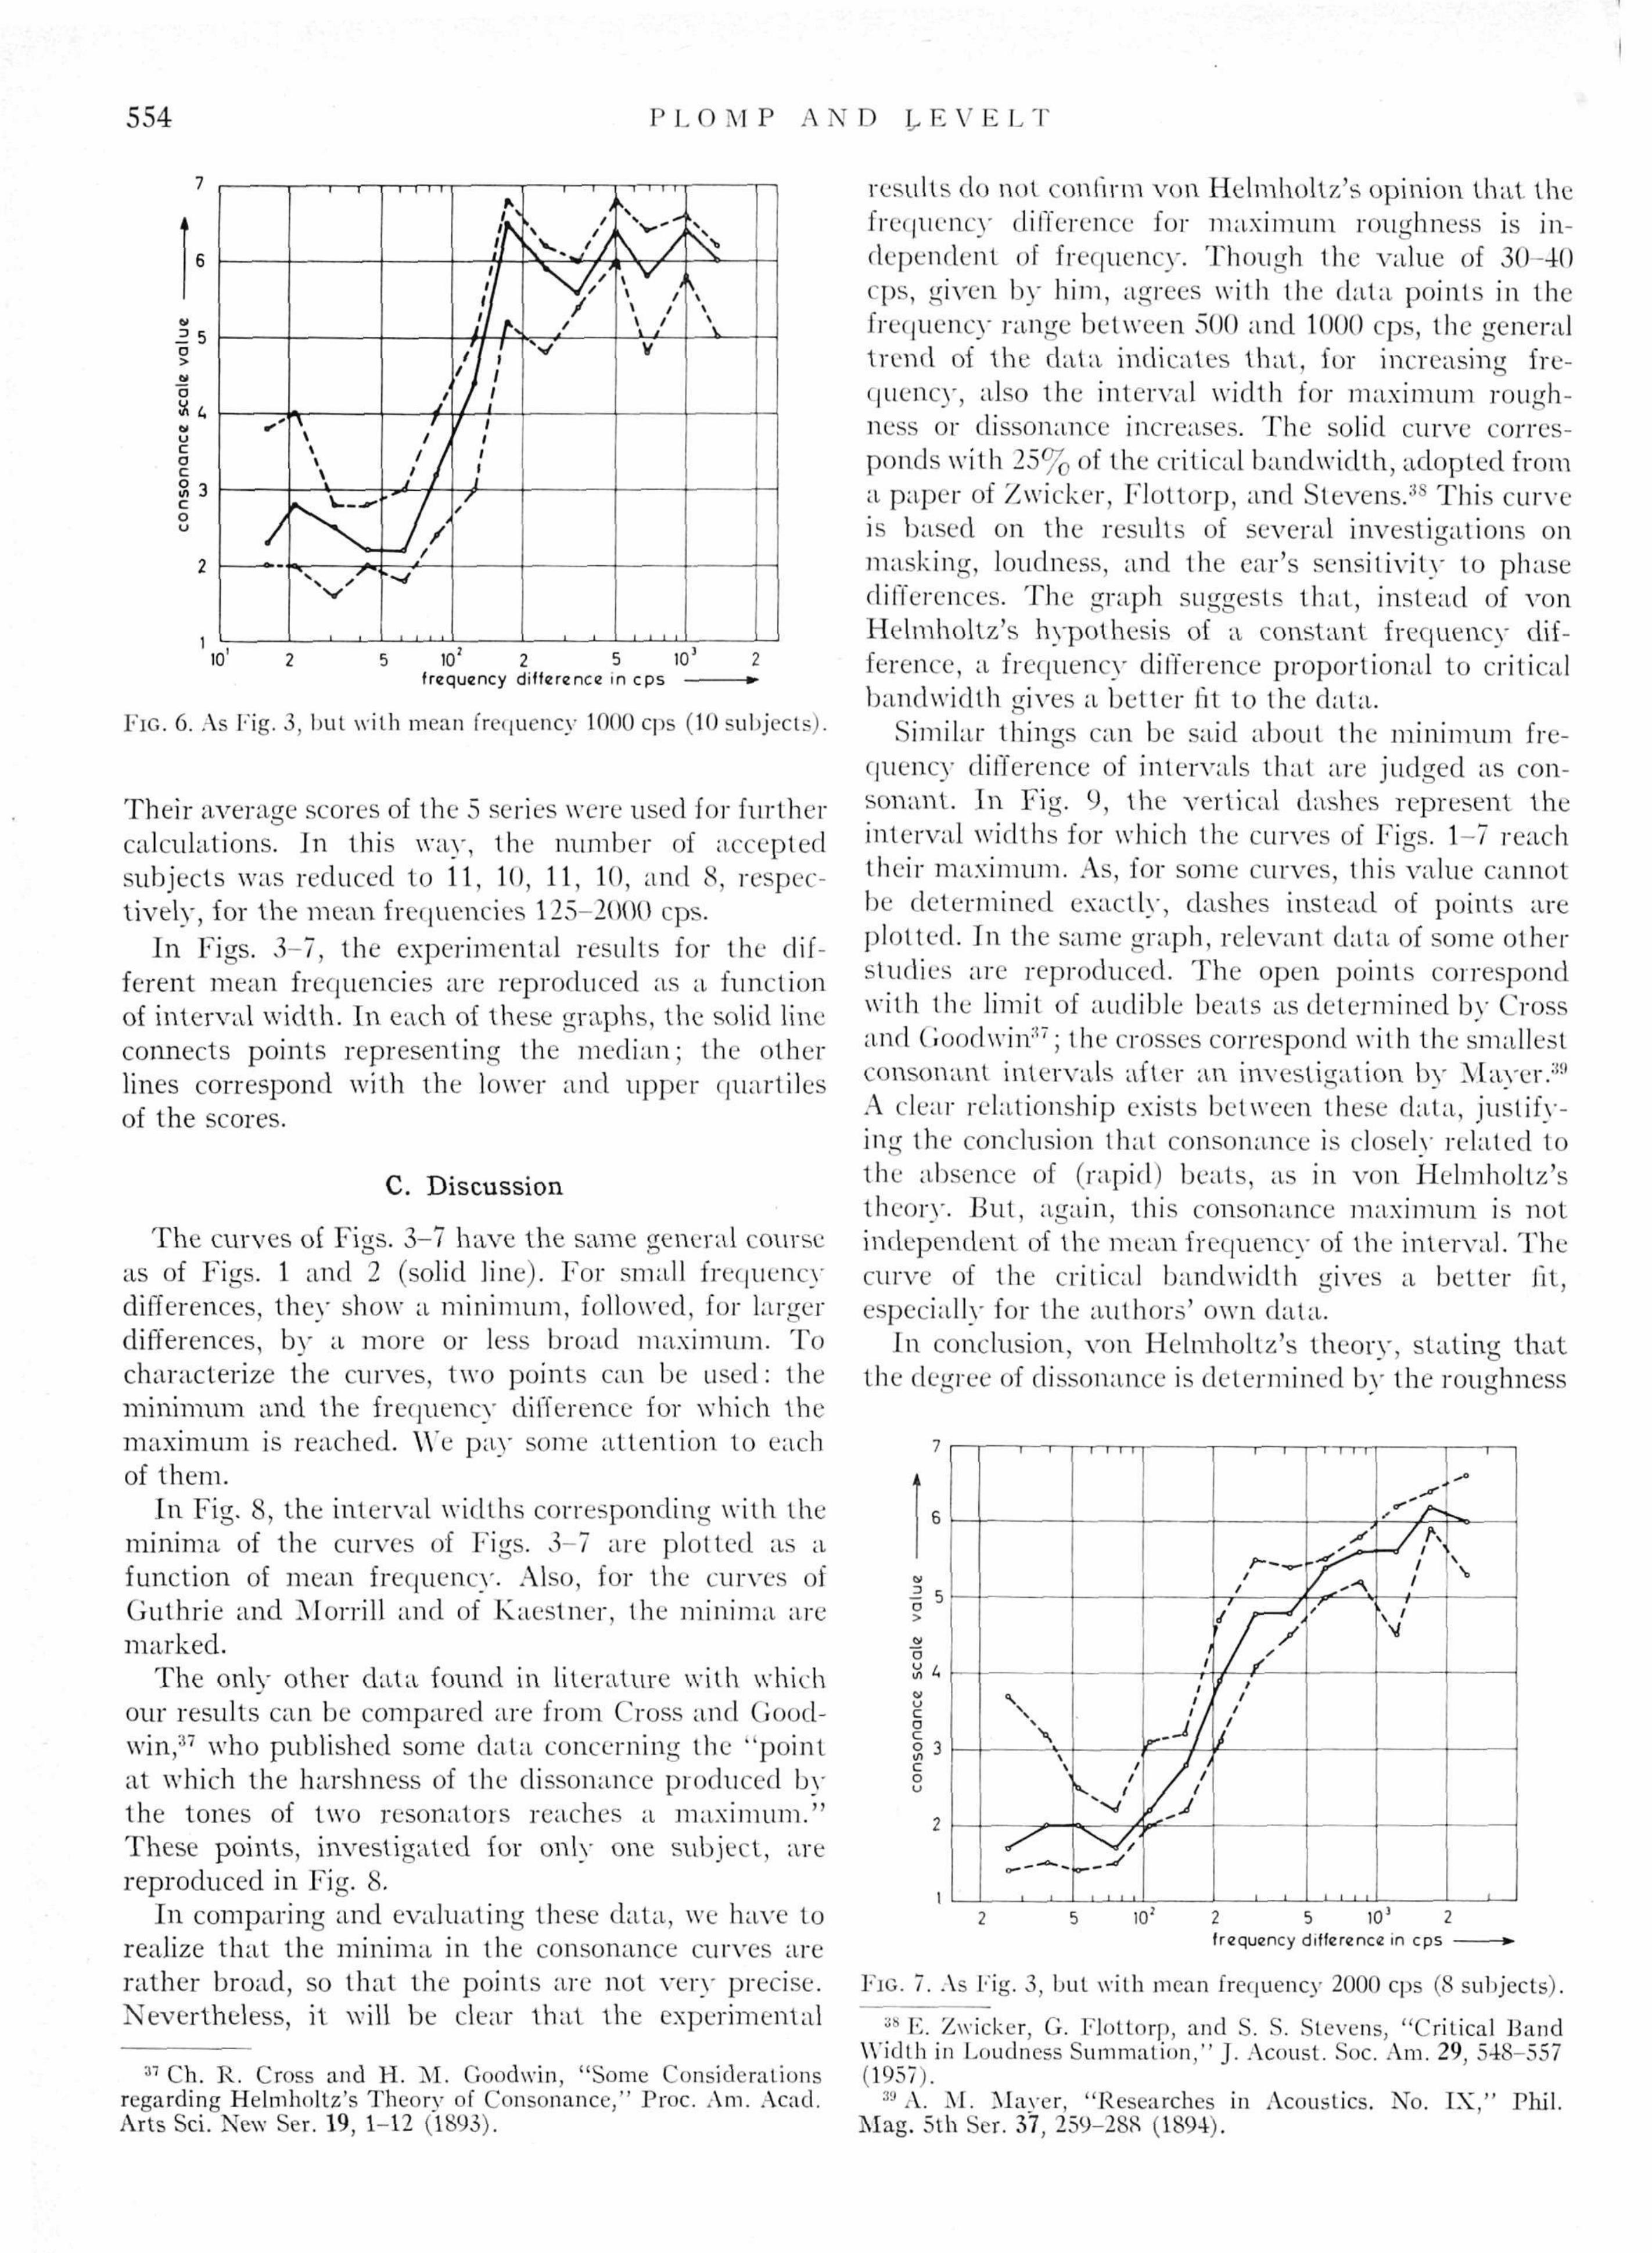
FlG. 5. As Fig. 3, but with mean frequency 500 cps (11 subjects)
5 10' 2 5 frequency difference in cps -
FIG. 4. As Fig. 3, but with mean frequency 250 cps (10 subjects).
readjust the frequency of the oscillators, resulting in a pause of 10-20 sec between exposures. An electronic counter was used to adjust frequencies very accurately.
The experiments were carried out for 5 values of the mean frequency of the intervals: 125, 250, 500, 1000, and 2000 cps. Each subject was used only in one test session, in which he had to judge 12-14 different interval-width values around one of these mean frequencies. To avoid the influence of interval recognition, the widths of these intervals were chosen on base of frequency difference, not on frequency ratio.
The following procedure was used. First, the subject read written instructions concerning the purpose of the test and the way in which he had to record his responses on a sheet with horizontal lines, each provided with 7 short vertical dashes. After that, a preliminary series of 10 different intervals, chosen at random out of the interval widths used in the experiment, was presented in order to make the subject familiar to the differences between the stimuli and to warrant an adequate use of the 7-point scale. Then, 5 series of 12-14 intervals were presented (12 for 125 cps, 14 for the other mean frequencies). Each of these series contained the same interval widths but in a different (random) order. Always the first interval of a series was different from the last one of the preceding series.
The test subjects were young male adults of about 20 years of age and with secondary-school training. For the mean frequencies 125, 250, 500, 1000, and 2000 cps, the number of subjects was 19, 22, 18, 11, and 18, respectively.
B. Results
To exclude data of subjects who were not able to give consistent responses, for each of them test-retest reliability was determined by calculating the correlation coefficient between the scores of the first and the last of the 5 series of interval widths presented to the subjects. Only the data of those subjects were maintained who had a correlation coefficient above 0.5.
I
554 P L O M P A N D L E V E L T
2 5 o
o
m 3 c o
2
10 10' 2 5 10}
frequency difference i n c p s —
FIG. 6. As Fig. 3, but with mean frequency 1000 cps (10 subjects)
Their average scores of the 5 series were used for further calculations. In this way, the number of accepted subjects was reduced to 11, 10, 11, 10, and 8, respectively, for the mean frequencies 125-2000 cps.
In Figs. 3-7, the experimental results for the dif-ferent mean frequencies are reproduced as a function of interval width. In each of these graphs, the solid line connects points representing the median; the other lines correspond with the lower and upper quartiles of the scores.
C. Discussion i
The curves of Figs. 3-7 have the same general course as of Figs. 1 and 2 (solid line). For small frequency differences, the}' show a minimum, followed, for larger differences, by a more or less broad maximum. To characterize the curves, two points can be used: the minimum and the frequency difference for which the maximum is reached. We pay some attention to each of them.
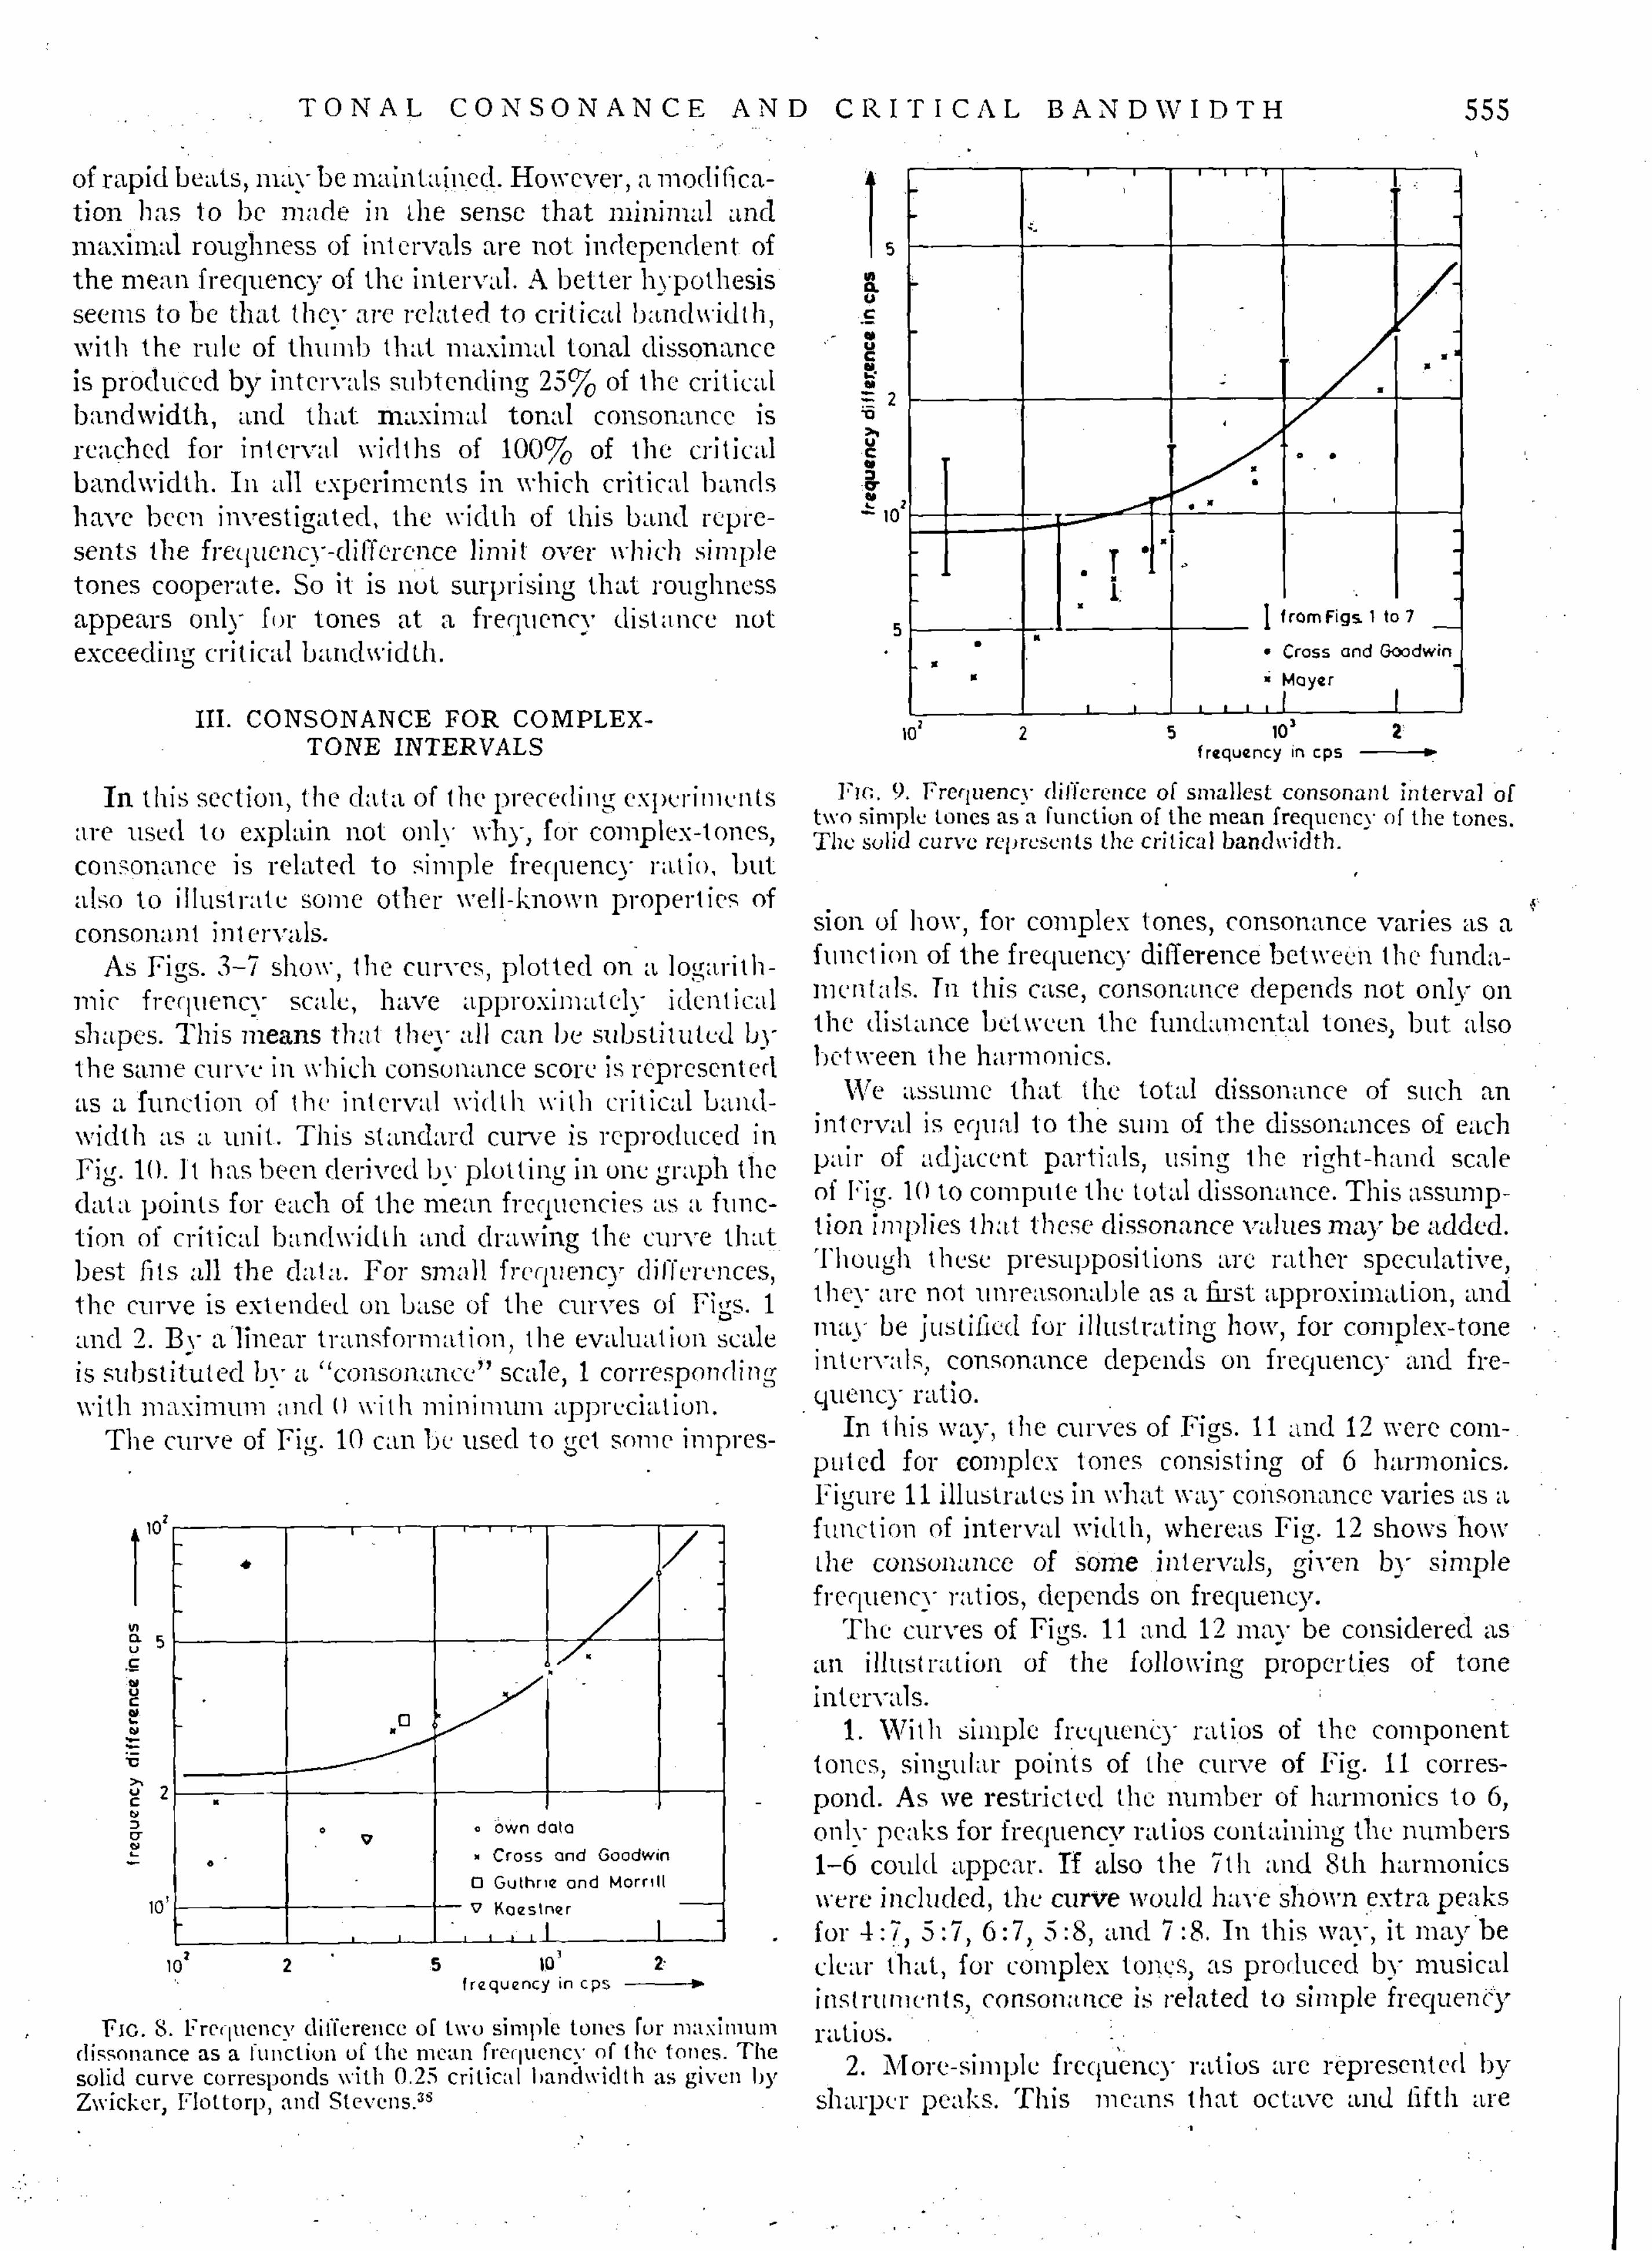
In Fig. 8, the interval widths corresponding with the minima of the curves of Figs. 3-7 are plotted as a function of mean frequency. Also, for the curves of Guthrie and Morrill and of Kaestner, the minima are marked.
The only other data found in literature with which our results can be compared are from Cross and Goodwin,37 who published some data concerning the "point at which the harshness of the dissonance produced by the tones of two resonators reaches a maximum." These points, investigated for only one subject, are reproduced in Fig. 8.
In comparing and evaluating these data, we have to realize that the minima in the consonance curves are rather broad, so that the points are not very precise. Nevertheless, it will be clear that the experimental
results do not confirm von Helmholtz's opinion that the frequency difference for maximum roughness is independent ui frequency. Though the value of 30-40 cps, given by him, agrees with the data points in the frequency range between 500 and 1000 cps, the general trend of the data indicates that, for increasing frequency, also the interval width for maximum roughness or dissonance increases. The solid curve corresponds with 25% of the critical bandwidth, adopted from a paper of Zwicker, Flottorp, and Stevens.38 This curve is based on the results of several investigations on masking, loudness, and the ear's sensitivity to phase differences. The graph suggests that, instead of von Helmholtz's hypothesis of a constant frequency difference, a frequency difference proportional to critical bandwidth gives a better lit to the data.
Similar things can be said about the minimum frequency difference of intervals that are judged as consonant. In Fig. 9, the vertical dashes represent the interval widths for which the curves of Figs. 1-7 reach their maximum. As, for some curves, this value cannot be determined exactly, dashes instead of points are plotted. In the same graph, relevant data of some other studies are reproduced. The open points correspond with the limit of audible beats as determined by Cross and Goodwin37; the crosses correspond with the smallest consonant intervals after an investigation bv Maver.39
A clear relationship exists between these data, justifying the conclusion that consonance is closely related to the absence of (rapid) beats, as in von Helmholtz's theory. But, again, this consonance maximum is not independent of the mean frequency of the interval. The curve of the critical bandwidth gives a better lit, especially for the authors' own data.
In conclusion, von Helmholtz's theory, stating that the degree of dissonance is determined by the roughness
2 5 101 2 frequency difference in cps •
37 Ch. R. Cross and H. M. Goodwin, "Some Considerations regarding Helmholtz's Theory of Consonance," Proc. Am. Acad. Arts Sci. New Ser. 19, 1-12 (1893).
FIG. 7. As Fig. 3, but with mean frequency 2000 cps (8 subjects). as K. Zwicker, G. Flottorp, and S. S. Stevens, "Critical Band
Width in Loudness Summation," J. Acoust. Soc. Am. 29, 548-557 (1957).
39 A. M. Mayer, "Researches in Acoustics. No. IX," Phil. Mag. 5th Ser. 37, 259-288 (1894).
T O N A L C O N S O N A N C E A N D C R I T I C A L B A N D W I D T H 555
of rapid beats, may be maintained. However, a modification has to be made in the sense that minimal and maximal roughness of intervals are not independent of the mean frequency of the interval. A better hypothesis seems to be that the}- are related to critical bandwidth, with the ride of thumb that maximal tonal dissonance is produced by intervals subtending 25% of the critical bandwidth, and that maximal tonal consonance is reached for interval widths of 100% of the critical bandwidth. In all experiments in which critical bands have been investigated, the width of this band represents the frequency-difference limit over which simple-tones cooperate. So it is not surprising that roughness appears only for tones at a frequency distance not exceeding critical bandwidth.
III. CONSONANCE FOR COMPLEX-TONE INTERVALS
In this section, the data of the preceding experiments are used to explain not only why, for complex-tones, consonance is related to simple frequency ratio, but also to illustrate some other well-known properties of consonant intervals.
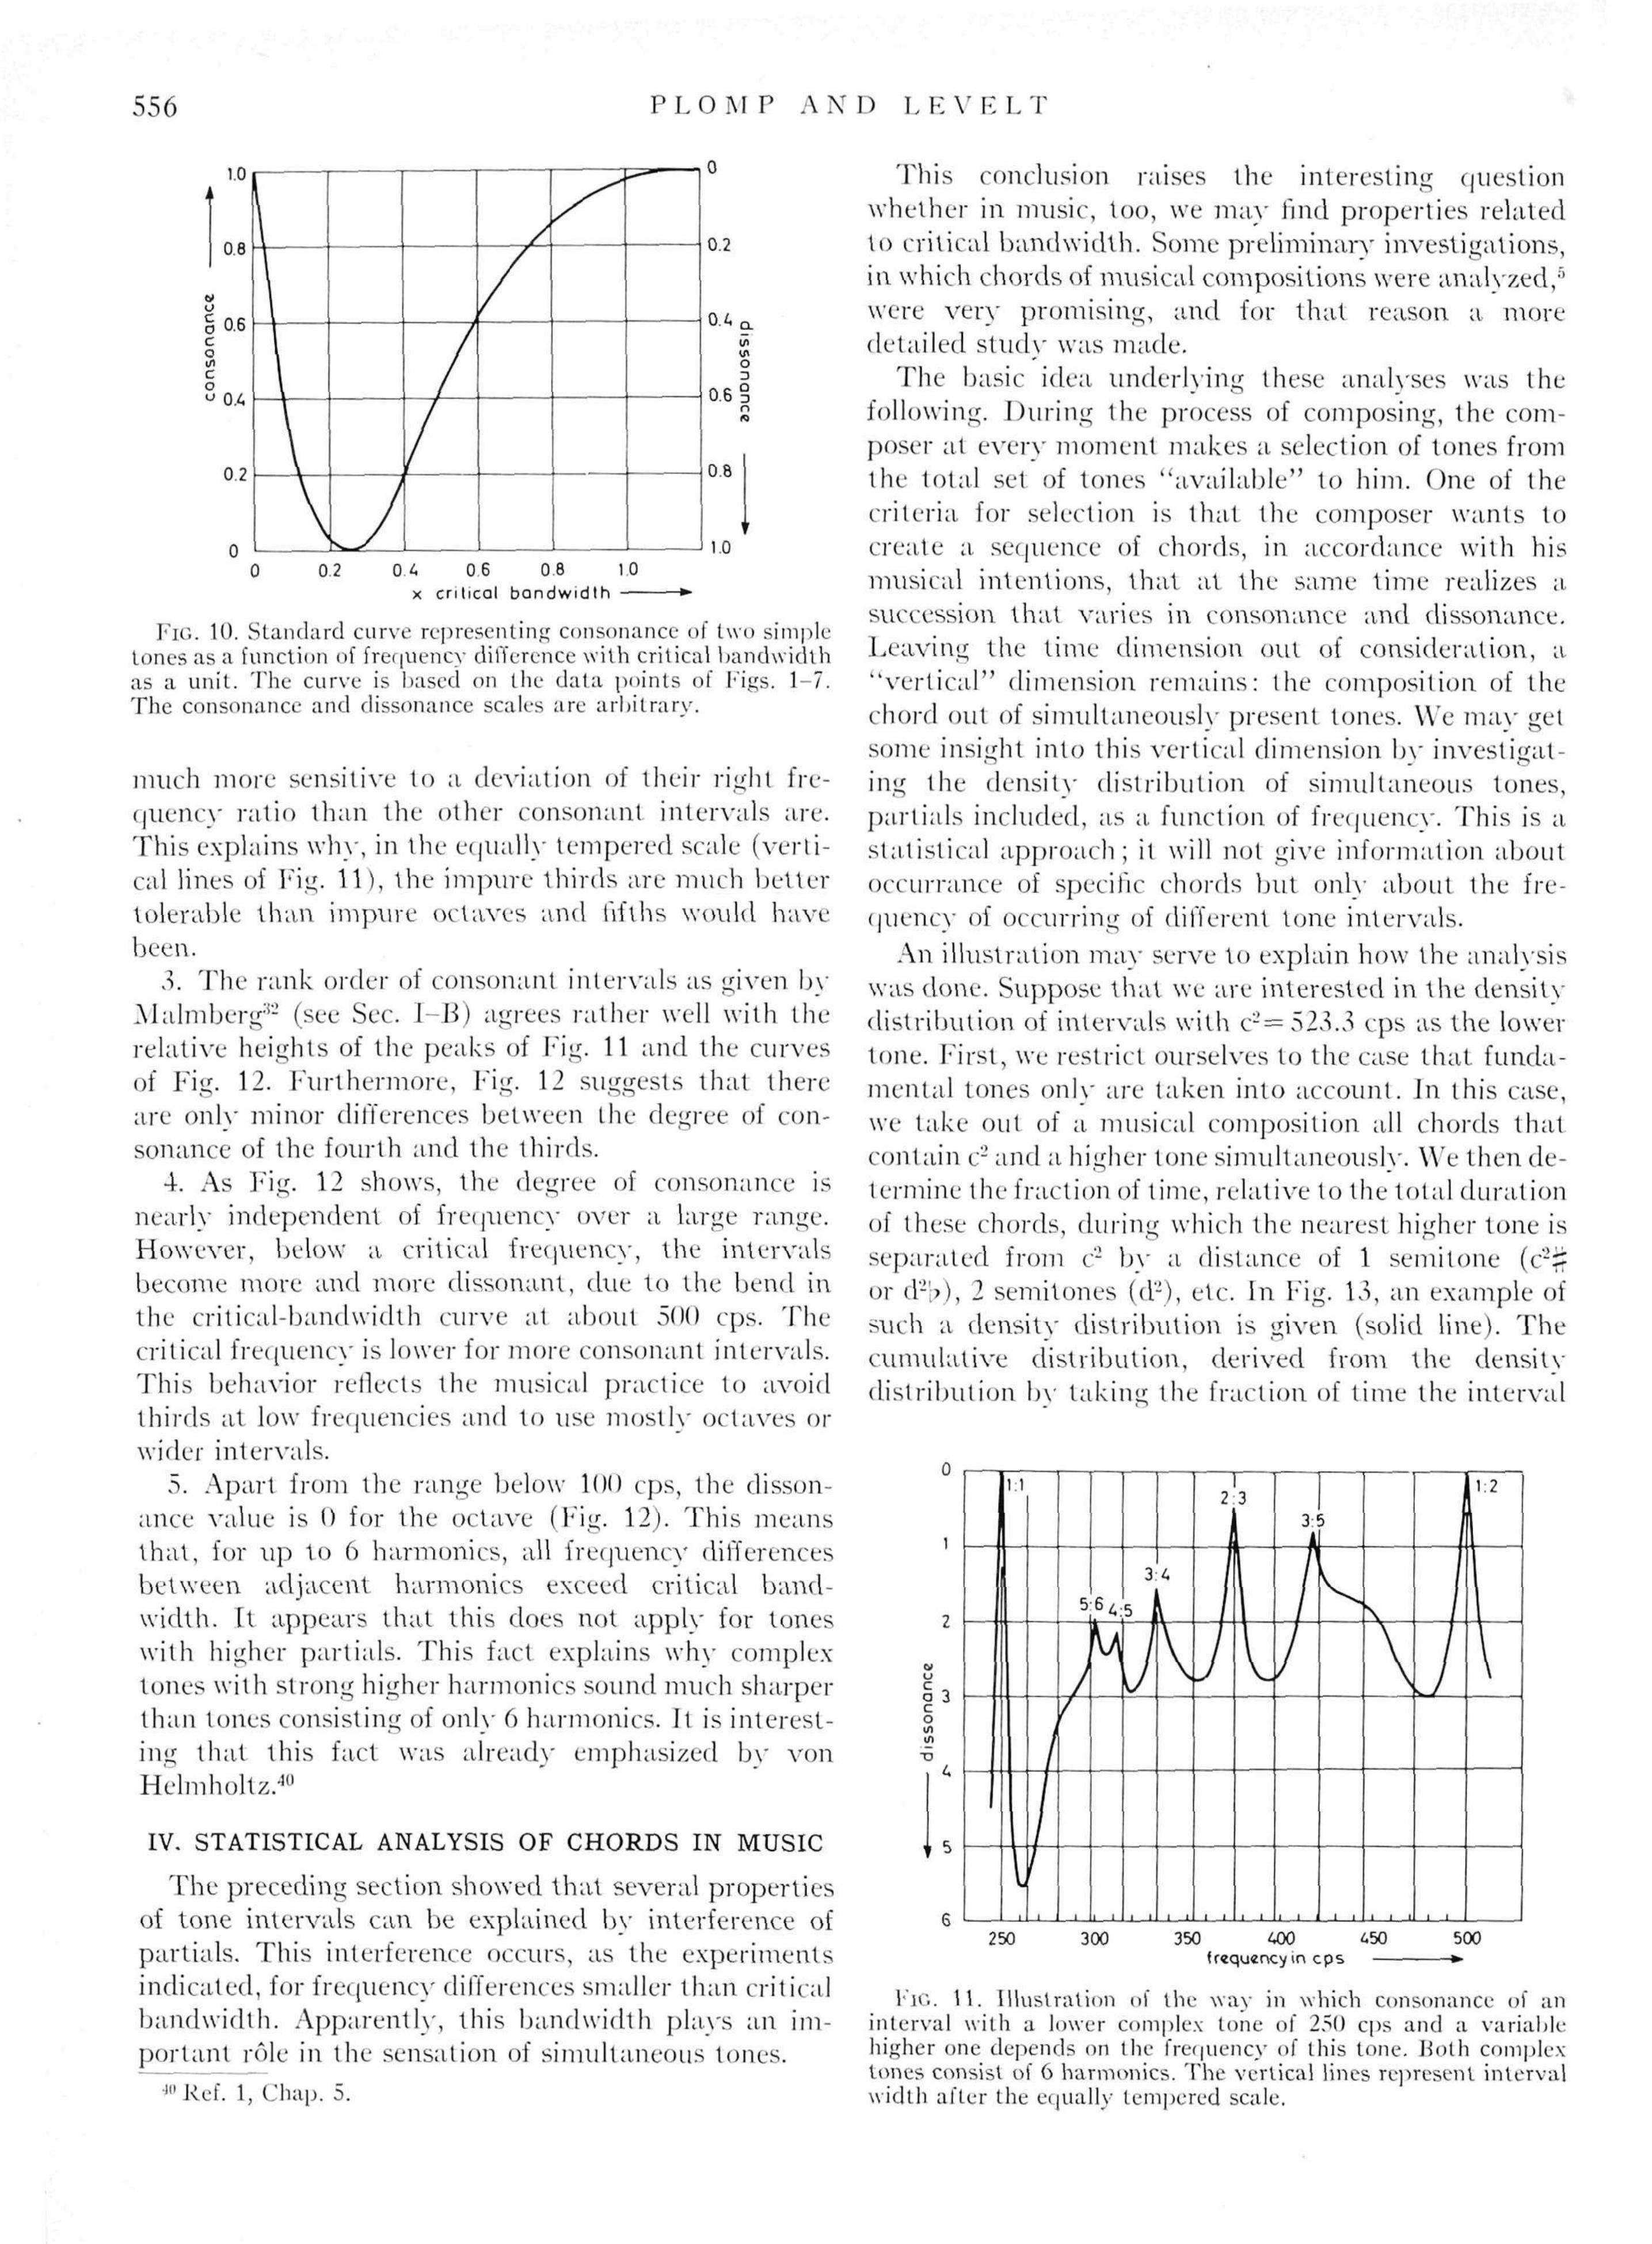
As Figs. 3-7 show, the curves, plotted on a logarithmic frequency scale, have approximately identical shapes. This means that they all can be substituted by the same curve in which consonance score is represented as a function of the interval width with critical bandwidth as a unit. This standard curve is reproduced in Fig. 10. It has been derived by plotting in one graph the data points for each of the mean frequencies as a function of critical bandwidth and drawing the curve that best fits all the data. For small frequency differences, the curve is extended on base of the curves of Figs. 1 and 2. Bv a linear transformation, the evaluation scale is substituted by a. "consonance" scale, 1 corresponding with maximum and 0 with minimum appreciation.
The curve of Fig. 10 can be used to get some impres-
10
in a
u C u
u c
cr
10
^
»,
•«
-
e
N
\
-
r
o
'
1
a M
1
1 1 1 1 1
.
/
/
/
*
-
-
© own data
» Cross and Goodwin
D Guthri
— v Kaesti
, , • , i
e and Morn l
l
ii
1 10
frequency in cps
FIG. 8. Frequency difference of two simple tones for maximum dissonance as a function of the mean frequency of the tones. The solid curve corresponds with 0.25 critical bandwidth as given by Zwicker, Flottorp, and Stevens.38
a u c
s
S 2 • o
o C
&
~V
-
-
-
-
.. *
•
1
n
i
M
1 1
\—r*
• *
1 i
~i—r"|
•
i'
i
* «
o •
_
-
^r
from Figs 1 to 7
• Cross and Goodwin
» Mayer i * i .J 1
10 5 101
frequency in cps
FIG. l .̂ Frequency difference of smallest consonant interval of two simple tones as a function of the mean frequency of the tones. The solid curve represents the critical bandwidth.
si on of how, for complex tones, consonance varies as a function of the frequency difference between the fundamentals. In this case, consonance depends not only on the distance between the fundamental tones, but also between the harmonics.
We assume that the total dissonance of such an interval is equal to the sum of the dissonances of each pair of adjacent partials, using the right-hand scale of Fig. 10 to compute the total dissonance. This assumption implies that these dissonance values may be added. Though these presuppositions are rather speculative, they are not unreasonable as a first approximation, and may be justified for illustrating how, for complex-tone intervals, consonance depends on frequency and frequency ratio.
hi this way, the curves of Figs. 11 and 12 were computed for complex tones consisting of 6 harmonics. Figure 11 illustrates in what way consonance varies as a function of interval width, whereas Fig. 12 shows how the consonance of some intervals, given by simple frequency ratios, depends on frequency.
The curves of Figs. 11 and 12 mav be considered as an illustration of the following properties of tone intervals.
1. With simple frequeue}' ratios of the component tones, singular points of the curve of Fig. 11 correspond. As we restricted the number of harmonics to 6, onlv peaks for frequency ratios containing the numbers 1-6 could appear. If also the 7th and 8th harmonics were included, the curve would have shown extra peaks for 4:7, 5:7, 6:7, 5:8, and 7:8. In this way, it may be clear that, for complex tones, as produced by musical instruments, consonance is related to simple frequency ratios.
2. More-simple frequency ratios are represented by sharper peaks. This means that octave and fifth are
i
556 P L O M P A N D L E V E L !
1.0 1
0.8
o % 0.6 c o in c o
u 0A
02 A
0
0.2
0.4 a
o
0.6 § O
0.8
1.0 02
x 06 0.8 10
crit ical bandwid th —
FIG. 10. Standard curve representing consonance of two simple tones as a function of frequency difference with critical bandwidth as a unit. The curve is based on the dala points of Figs. 1-7. The consonance and dissonance scales are arbitrary.
much more sensitive to a deviation of their light fre-(jiicncv ratio than the other consonant intervals are. This explains why, in the equally tempered scale (vertical lines of Fig. 11), the impure thirds are much better tolerable than impure octaves and fifths would have been.
.3. The rank order of consonant intervals as given bv Malmberg:i- (see Sec. I -B) agrees rather well with the relative heights of the peaks of Fig. 11 and the curves of Fig. 12. Furthermore, Fig. 12 suggests that there are onlv minor differences between the degree of consonance of the fourth and the thirds.
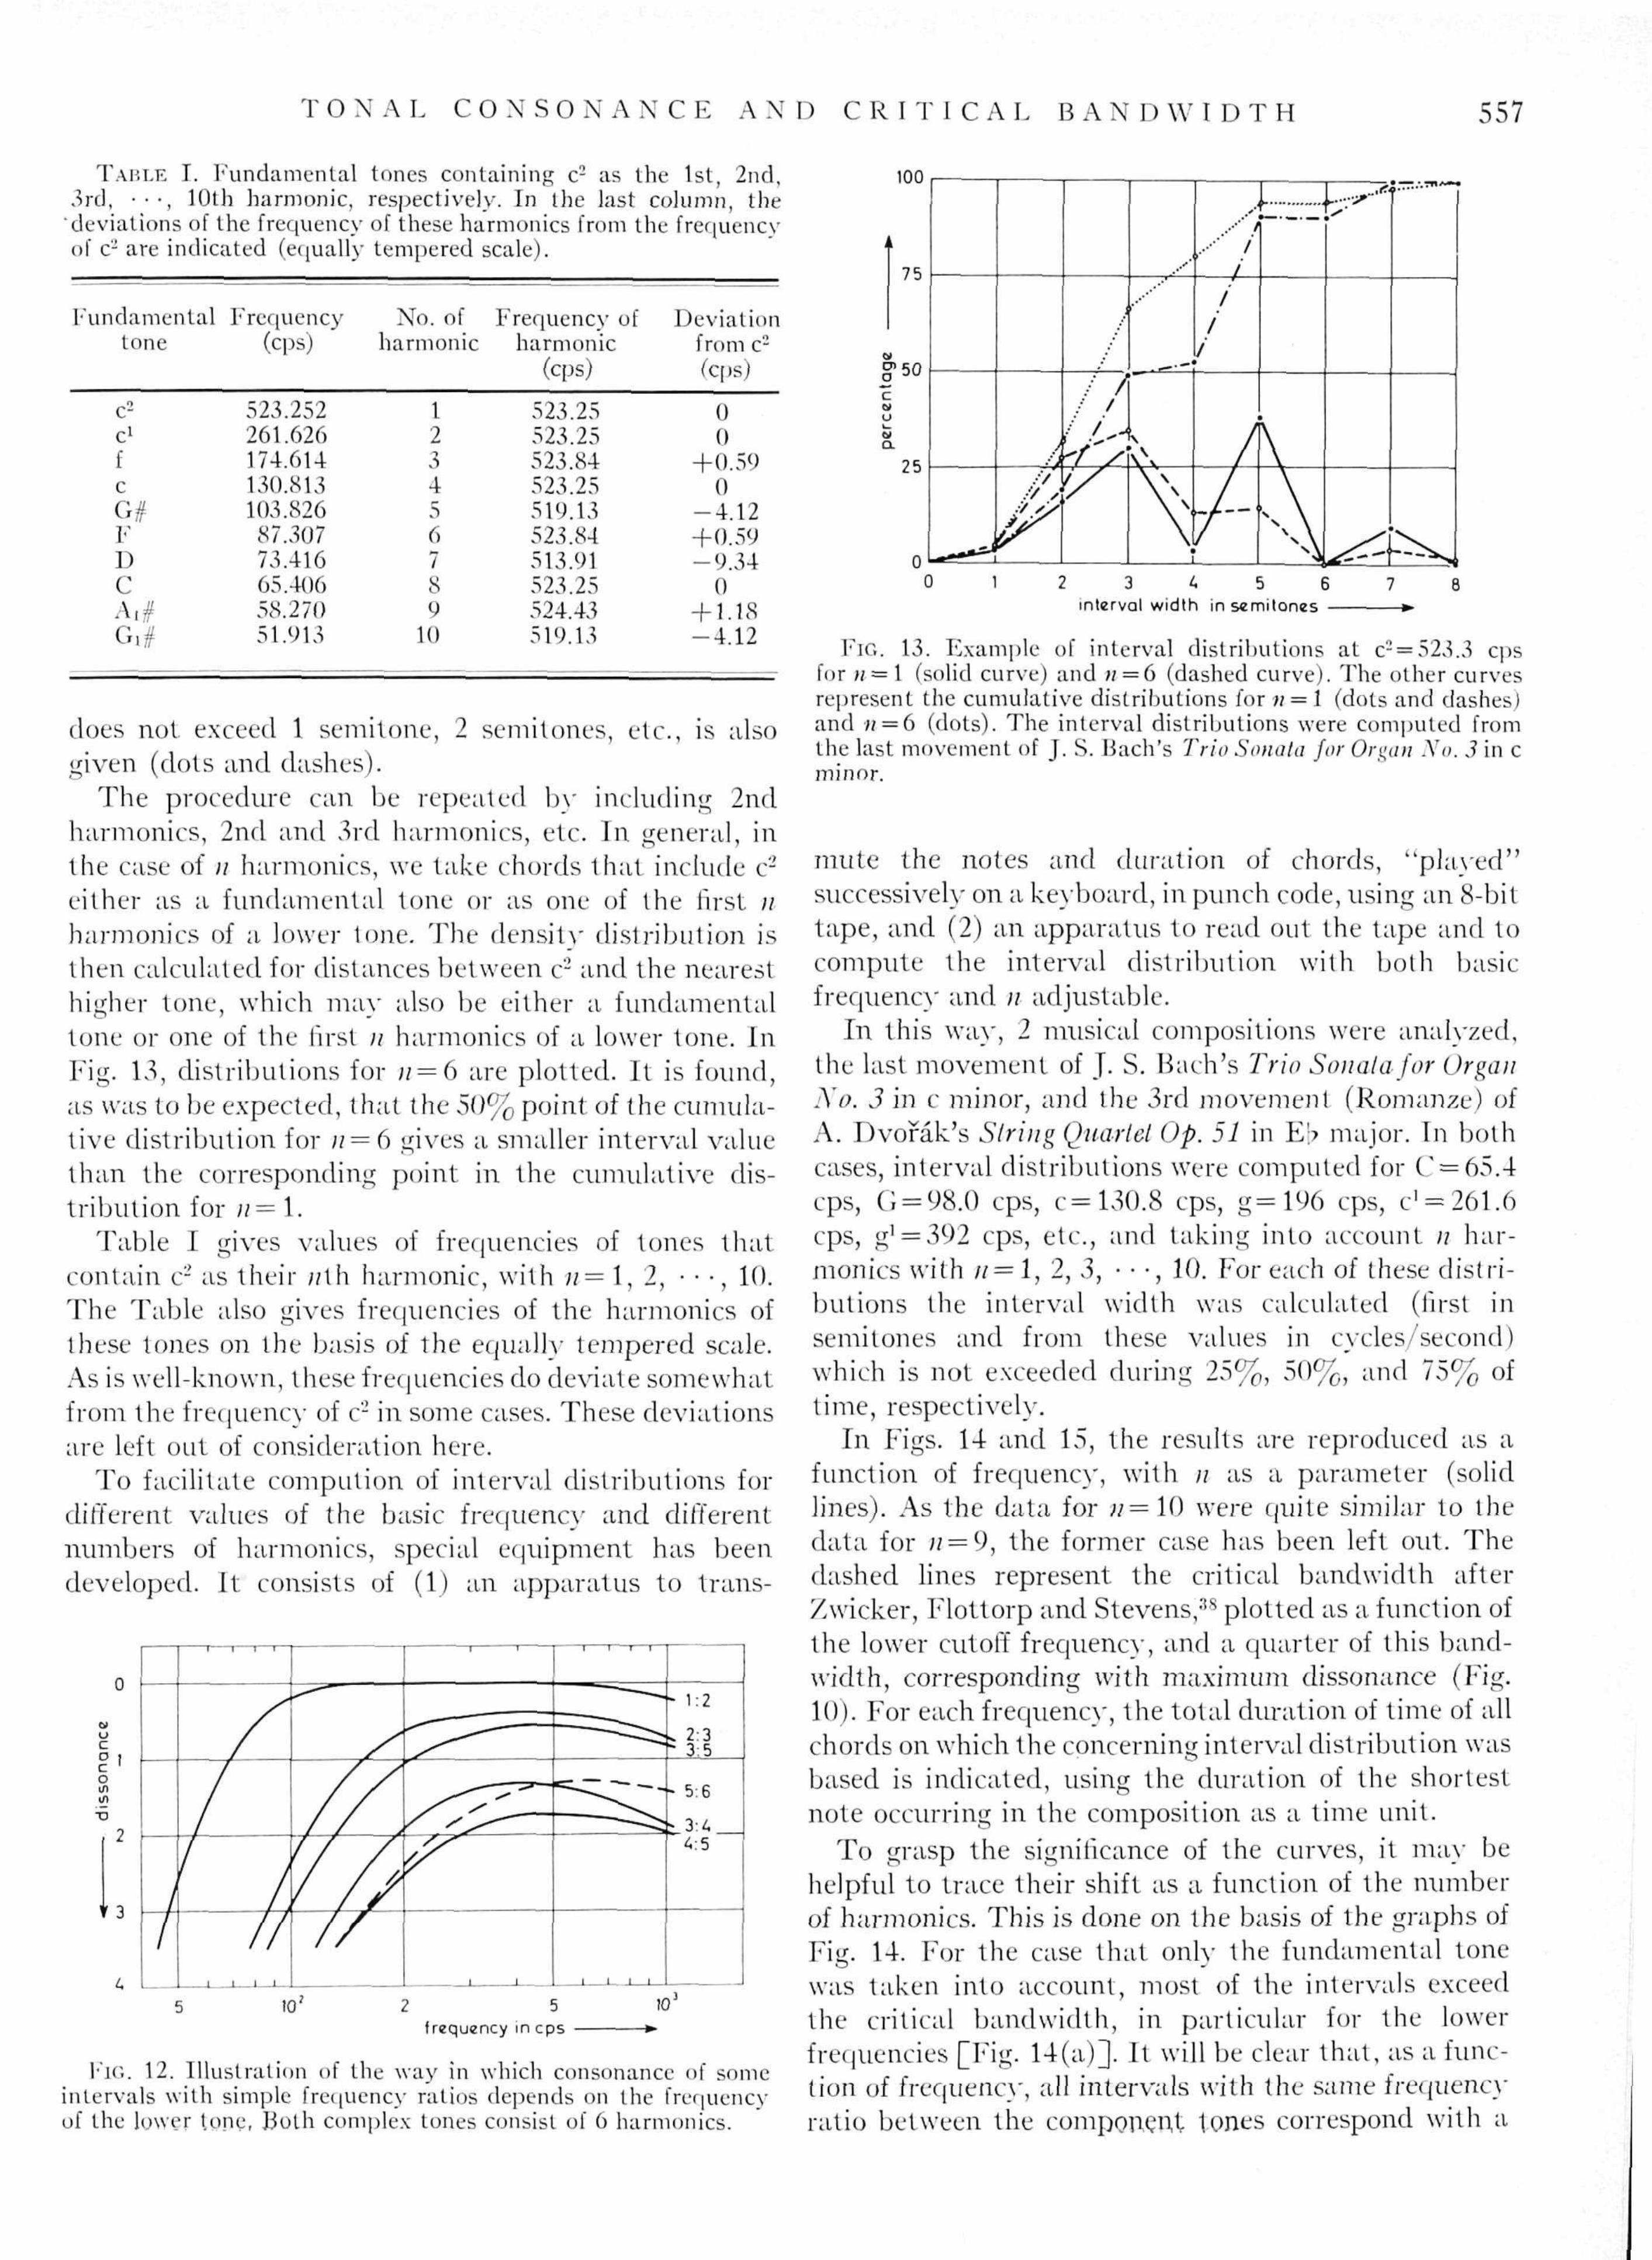
4. As Fig. 12 shows, the degree of consonance is nearly independent of frequency over a large range. However, below a critical frequency, the intervals become more and more dissonant, due to the bend in the critical-bandwidth curve at about 500 cps. The critical frequency is lower for more consonant intervals. This behavior reflects the musical practice to avoid thirds at low frequencies and to use mostly octaves or wider intervals.
5. Apart from the range below 100 cps, the dissonance value is 0 for the octave (Fig. 12). This means that, for up to 6 harmonics, all frequency differences between adjacent harmonics exceed critical band width. It appears that this does not apply for tones with higher partials. This fact explains why complex-tones with strong higher harmonics sound much sharper than tones consisting of only 6 harmonics. It is interesting that this fact was already emphasized by von Helmholtz.40
IV. STATISTICAL ANALYSIS OF CHORDS IN MUSIC
The preceding section showed that several properties of tone intervals can be explained by interference of partials. This interference occurs, as the experiments indicated, for frequency differences smaller than critical bandwidth. Apparently, this bandwidth plays an important role in the sensation of simultaneous tones.
•"•Ref. 1, Chap. 5.
This conclusion raises the interesting question whether in music, too, we may find properties related to critical bandwidth. Some preliminary investigations, in which chords of musical compositions were analyzed/' were very promising, and for that reason a more detailed study was made.
The basic idea, underlying these analyses was the following. During the process of composing, the composer at every moment makes a selection of tones from the total set of tones "available" to him. One of the criteria for selection is that the composer wants to create a sequence of chords, in accordance with his musical intentions, that at the same time realizes a succession that varies in consonance and dissonance. Leaving the time dimension out of consideration, a "vertical" dimension remains: the composition of the chord out of simultaneously present tones. We may get some insight into this vertical dimension bv investiffat-ing the density distribution of simultaneous tones, partials included, as a function of frequency. This is a statistical approach; it will not give information about occurrance of specific chords but only about the frequency of occurring of different tone intervals.
An illustration may serve to explain how the analysis was done. Suppose that we are interested in the density distribution of intervals with c2=523.3 cps as the lower tone. First, we restrict ourselves to the case that fundamental tones only are taken into account. In this case, we take out of a. musical composition all chords that contain c2 and a higher lone simultaneously. We then determine the fraction of time, relative to the total duration of these chords, during which the nearest higher tone is separated from c2 by a distance of 1 semitone (c2# or d2i>), 2 semitones (d2), etc. In Fig. 13, an example of such a density distribution is given (solid line). The cumulative distribution, derived from the density distribution bv taking the fraction of time the interval
0 r
u §3 c o
, 5
1:1
LJ _I 1
5
I_J
if* 3:
5 1
J L. J—L
4
• - i
i 2:3
_i i_ J L_
3:!
J_l
•
__l L_ J l_l _l -i
l l : 2
250 300 350 400 £50 frequency in cps —
500
FIG. 11. Illustration of the way in which consonance of an interval with a lower complex lone of 250 cps and a variable higher one depends on the frequency of this tone. Both complex tones consist of 6 harmonics. The vertical lines represent interval width after the equally tempered scale.
T O N A L C O N S O N A N C E A N D C R I T I C A L B A N D W I D T H 557
TABLE I. Fundamental tones containing c2 as the 1st, 2nd, 3rd, •••, 10th harmonic, respectively. In the last column, the deviations of the frequency of these harmonics from the frequency of c- are indicated (equally tempered scale).
100
Fundamental tone
c2
c1
f c G# F D C A.# Gx#
Frequency (cps)
523.252 261.626 174.614 130.813 103.826 87.307 73.416 65.406 58.270 51.913
No. of harmonic
1 2 3 4 5 6 7 8 9
10
Frequency of harmonic
(cps)
523.25 523.25 523.84 523.25 519.13 523.84 513.91 523.25 524.43 519.13
Deviation from c2
(cps)
0 0
+0.59 0
-4.12 +0.59 -9.34
0 + 1.18 -4.12
does not exceed 1 semitone, 2 semitones, etc., is also given (dots and dashes).
The procedure can be repeated by including 2nd harmonics, 2nd and 3rd harmonics, etc. In general, in the case of ;/ harmonics, we take chords thai include c2
either as a fundamental tone or as one of the first ;/ harmonics of a lower tone. The density distribution is then calculated for distances between c2 and the nearest higher tone, which may also be either a fundamental tone or one of the first n harmonics of a lower tone. In Fig. 13, distributions for // = 6 are plotted. It is found, as was to be expected, that the 5 0 % point of the cumulative distribution for n = 6 gives a smaller interval value than the corresponding point in the cumulative distribution for / /= 1.
Table I gives values of frequencies of tones that contain c2 as their nth harmonic, with n= 1,2, • • •, 10. The Table also gives frequencies of the harmonics of these tones on the basis of the equally tempered scale. As is well-known, these frequencies do deviate somewhat from the frequency of c2 in some cases. These deviations are left out of consideration here.
To facilitate compution of interval distributions for different values of the basic frequency and different numbers of harmonics, special equipment has been developed. I t consists of (1) an apparatus to trans-
o
u c
S
' 3
10' 2 5 frequency in cps
10
FlG. 12. Illustration of the way in which consonance of some intervals with simple frequency ratios depends on the frequency of the lower tone, Both complex tones consist of 6 harmonics.
75
? 5 0
25
0
^ _ — _ _ ^
• * * * " 1
•
• *
/ /
. . • - •
•
m^*i
t ^ ^
/A Y \ \
\ \
i i - - *
,A— • • • • • /
/ •
/ •
/ •
>
i
T" »
>
^ \
X \ \ \
S \
» * • • • * • •
^
0 2 3 U 5 6 interval width in semitones -
8
FIG. 13. Example of interval distributions at c2 = 523.3 cps for ;/ = 1 (solid curve) and n = 6 (dashed curve). The other curves represent the cumulative distributions for n—\ (dots and dashes) and ;/ = 6 (dots). The interval distributions were computed from the last movement of J. S. Bach's Trio Sonata for Organ No. 3 in c minor.
mute the notes and duration of chords, "played" successively on a keyboard, in punch code, using an 8-bit tape, and (2) an apparatus to read out the tape and to compute the interval distribution with both basic frequency and ;/ adjustable.
In this way, 2 musical compositions were analyzed, the last movement of J. S. Bach's Trio Sonata for Organ I\'o. 3 in c minor, and the 3rd movement (Romarize) of A. Dvorak's Siring Quartet Op. 51 in E'> major. In both cases, interval distributions were computed for C = 65.4 cps, G=98 .0 cps, c = 130.8 cps, g = l % cps, c' = 261.6 cps, gx=392 cps, etc., and taking into account // harmonics with ; /= 1, 2, 3, • • •, 10. For each of these distributions the interval width was calculated (first in semitones and from these values in cycles/second) which is not exceeded during 25%, 50%, and 7 5 % of time, respectively.
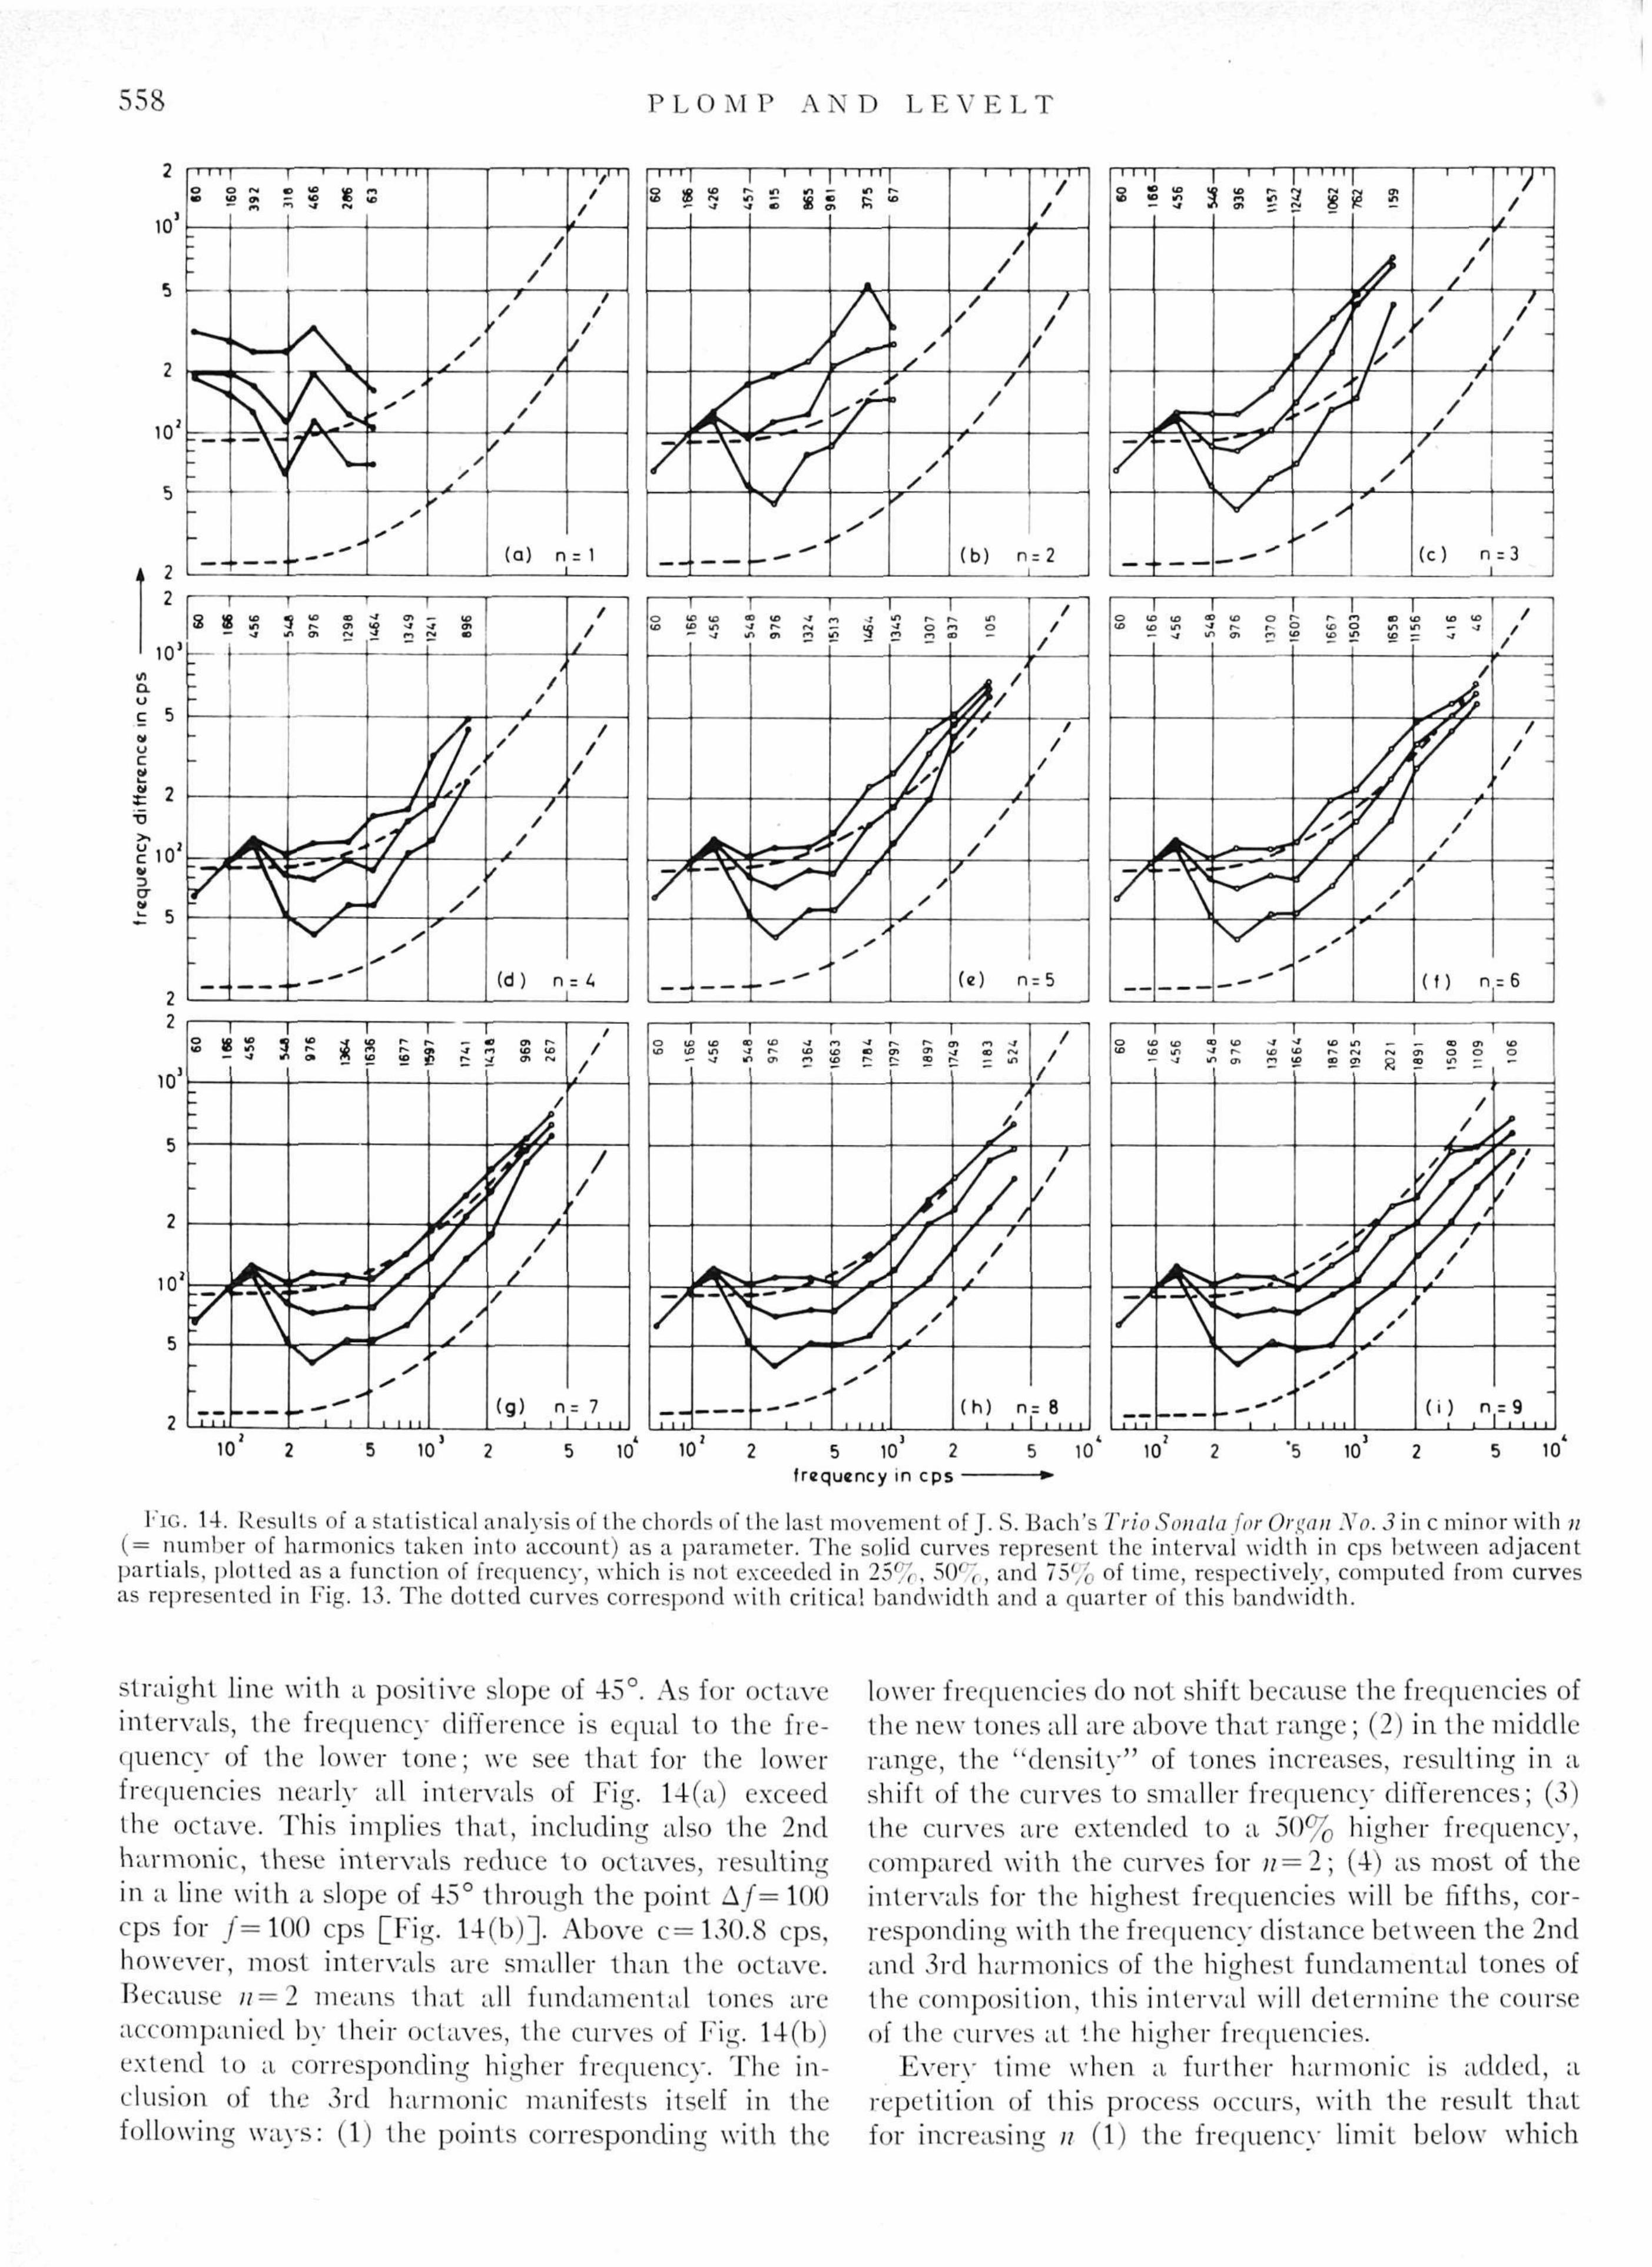
In Figs. 14 and 15, the results are reproduced as a function of frequency, with n as a parameter (solid lines). As the data for n— 10 were quite similar to the data for n = 9, the former case has been left out. The dashed lines represent the critical bandwidth after Zwicker, Flottorp and Stevens,38 plotted as a function of the lower cutoff frequency, and a quarter of this bandwidth, corresponding with maximum dissonance (Fig. 10). For each frequency, the total duration of time of all chords on which the concerning interval distribution was based is indicated, using the duration of the shortest note occurring in the composition as a time unit.
To grasp the significance of the curves, it may be helpful to trace their shift as a function of the number of harmonics. This is done on the basis of the graphs of Fig. 14. For the case that onlv the fundamental tone was taken into account, most of the intervals exceed the critical bandwidth, in particular for the lower frequencies [Fig. 14(a)]. I t will be clear that, as a function of frequency, all intervals with the same frequency ratio between the component tones correspond with a
558 P L O i\ I P A N D L E V E L T
10
A 2 2
M M I f 1 1 — | 1 1 TT 1 O o rs. o UD u> n
-
"
- _ -
-
-
-
_
I
L 4
/ \ [* X \ £ f ~ ^ ^ •
' ~~"\ l / \
^ ^ ^ **
• ^
**
s •
, / /
1 !—'—
/
/
/
/
/
i i . 1 1
/
/
/
/
• / r / /
/ ^
f
'
(a) n = 1 i
102r^.rd
10*1—
a. u c 5
u
c
£ 2
I 5
2 2
1 f
S 8 3 3 £ —
B
•
-
- ^ r \ ^ (
*
-
_
— - — — -4
! — ^ ~ w
- -
T
2 3 - r
r
- * * \ *
— * * "
^
I
r-, c*«
^
L*
<7» A
/ ( /
/
/
t
/
/
/
M
/
/
/
/
/
/
/ /
r
1
(d ) n = U i
10
2
10'
H
-
J
1 1 1
1 1 5 3
1
_ I i
l 1
- *£ J? ^
4
1 I 1 1
/
*
1 1 (O UJ
/
/ * i
r /
/
/
1/
(g) n 1 1 i
/
/
/ 4 ^
/
/
•
= 7 1 1 1 1 i
1 I I if ^ T—i | i i rq o to «i> f ^ - i o * i — i r > r ^
i i
- - ^ "
—1
* >
•
i i
/
/
/
/
/
(b ) n i J
[ I M F
/
/
*
/
*
= 2 .
i 1 O i (0 b
-
1 1 9 *£> -J ,
*
i \ i
r / +1
fyy
_ ^ - '
*
/
S •
/
/
/
A /
V / /
1 r f
/
/
/
(e) n=5 i
n-q f «0 i C
' I ' ' " I T — r I 1 1 1 y
o u>
U3 <0
U> m ^f
(© >J m
u> r--<7>
O f*-m
r̂ o u> <p in
o ID
—
' '
1 I P U3 U> U"»
X
--A
1 CO U3
w— *•
L
f 1 1 * J n ^ * r ^ r ^ c y > O N /
y i / / J v£f / / r / \/ ,
/ / /
>4rJ /\ / F r ^ M ^ / I ^ I J ^ ( ^
^
y
• ' ' •
/ /
* •
/
/
/
'
/ |
/
f
( h ) n = 8 1—i 1 i i i i...
10 10 10 10 5 10 2 f requency in cps
10
FIG. 14. Results of a statistical analysis of the chords of the last movement of T, S. Bach's Trio Sonata for Or van No. 3 in c minor with n (= number of harmonics taken into account) as a parameter. The solid curves represent the interval width in cps between adjacent partials, plotted as a function of frequency, which is not exceeded in 25',', 50' , , and 75', i', of time, respectively, computed from curves as represented in Fig. 13. The dotted curves correspond with critical bandwidth and a quarter of this bandwidth.
straight line with a positive slope of 45°. As for octave intervals, the frequency difference is equal to the frequency of the lower tone; we see that for the lower frequencies nearly all intervals of Fig. 14(a) exceed the octave. This implies that, including also the 2nd harmonic, these intervals reduce to octaves, resulting in a line with a slope of 45° through the point Af= 100 cps for / = 1 0 0 cps [Fig. 14(b)] . Above c = 130.8 cps, however, most intervals are smaller than the octave. Because u=2 means that all fundamental tones are accompanied by their octaves, the curves of Pig. 14(b) extend to a corresponding higher frequency. The inclusion of the 3rd harmonic manifests itself in the following ways: (1) the points corresponding with the
lower frequencies do not shift because the frequencies of the new tones all are above that range; (2) in the middle range, the "densi ty" of tones increases, resulting in a shift of the curves to smaller frequency differences; (3) the curves are extended to a 50% higher frequency, compared wilh the curves for ; / = 2 ; (4) as most of the intervals for the highest frequencies will be fifths, corresponding with the frequency distance between the 2nd and 3rd harmonics of the highest fundamental tones of the composition, this interval will determine the course of the curves at the higher frequencies.
Everv time when a further harmonic is added, a l
repetition of this process occurs, with the result that for increasing n (1) the frequency limit below which
T O N A L C O N S O N A N C E A N D C R I T I C A L B A N D W I D T H 5.V)
10
5
10'
2 2
f T i i | 1 r 1—[ r T i n
S P S 8 *
•
-
—
\
—/—-=
^ * * * "
w
4
/
/
/
1
1 l ' ' 1 1 1 1 1 1 0
/
/
\
/
/
/
/
<
/
/
/
'
*
(a) n
/
/
= 1
1
1 I I 1 | 1 1 1 1 1 1 l l j m o — <* to * * ^ ** K IN c* m ~- n ** r- (
1
M
\ — ~ ' *
s s
\ S
"s$
*
\ '
/
/
/
/ /
/
/ /
/ / /
/ ^
/
/ /
/ /
• /
( b ) n = 2
i
10 a u
•£ 5 u c i _
2 2
g 102
a Of
« c
-
*•
-
i i I I < rs K Q « *r. ID t — <tf x* • • ) <J> |
1
1 j
t£> «N A * 1
f ±£\
''/j/r *
/
S
•
1 O r*
S 2
/ /
/ /
/ /
\ /
1 X r / /
/
/ /
/
(d) n
/
/
/
/
/
/ 1
I
f I N <N rs* h
IN — U
I : 3 3
^ ^ •**'
r 6w
1029
+ y
w *
1 1 r- -i — en »D r^ r* >* —
/ '
•
•
/ft
frl [f/f 1 m
?/ * XI *~ / /
•
f
( e ) n
1
/
/
/
/
/
/ /
- 5
1
T T T • C
1 1 > (TV r
1 — xC
| 1 HI
fc rsj .
A
f 4 / +
V ^ - - • -X^ •
i i > > /
/
I ¥ *
r /^ 1
.y -
— '
1/
>
/
/
/
/
~ /
(c) n
/
/ -
/ _
/
!
= 3 -
L
2 5 10 2 frequtney in cps —
I r i I I T » o o> t ^ ' * l ? « ^ « < n « P P r * * j o » m r ^ r C ? ^ ^ Q w m tf>*f ffi^* in o l ^ f r *
t
m 10 10
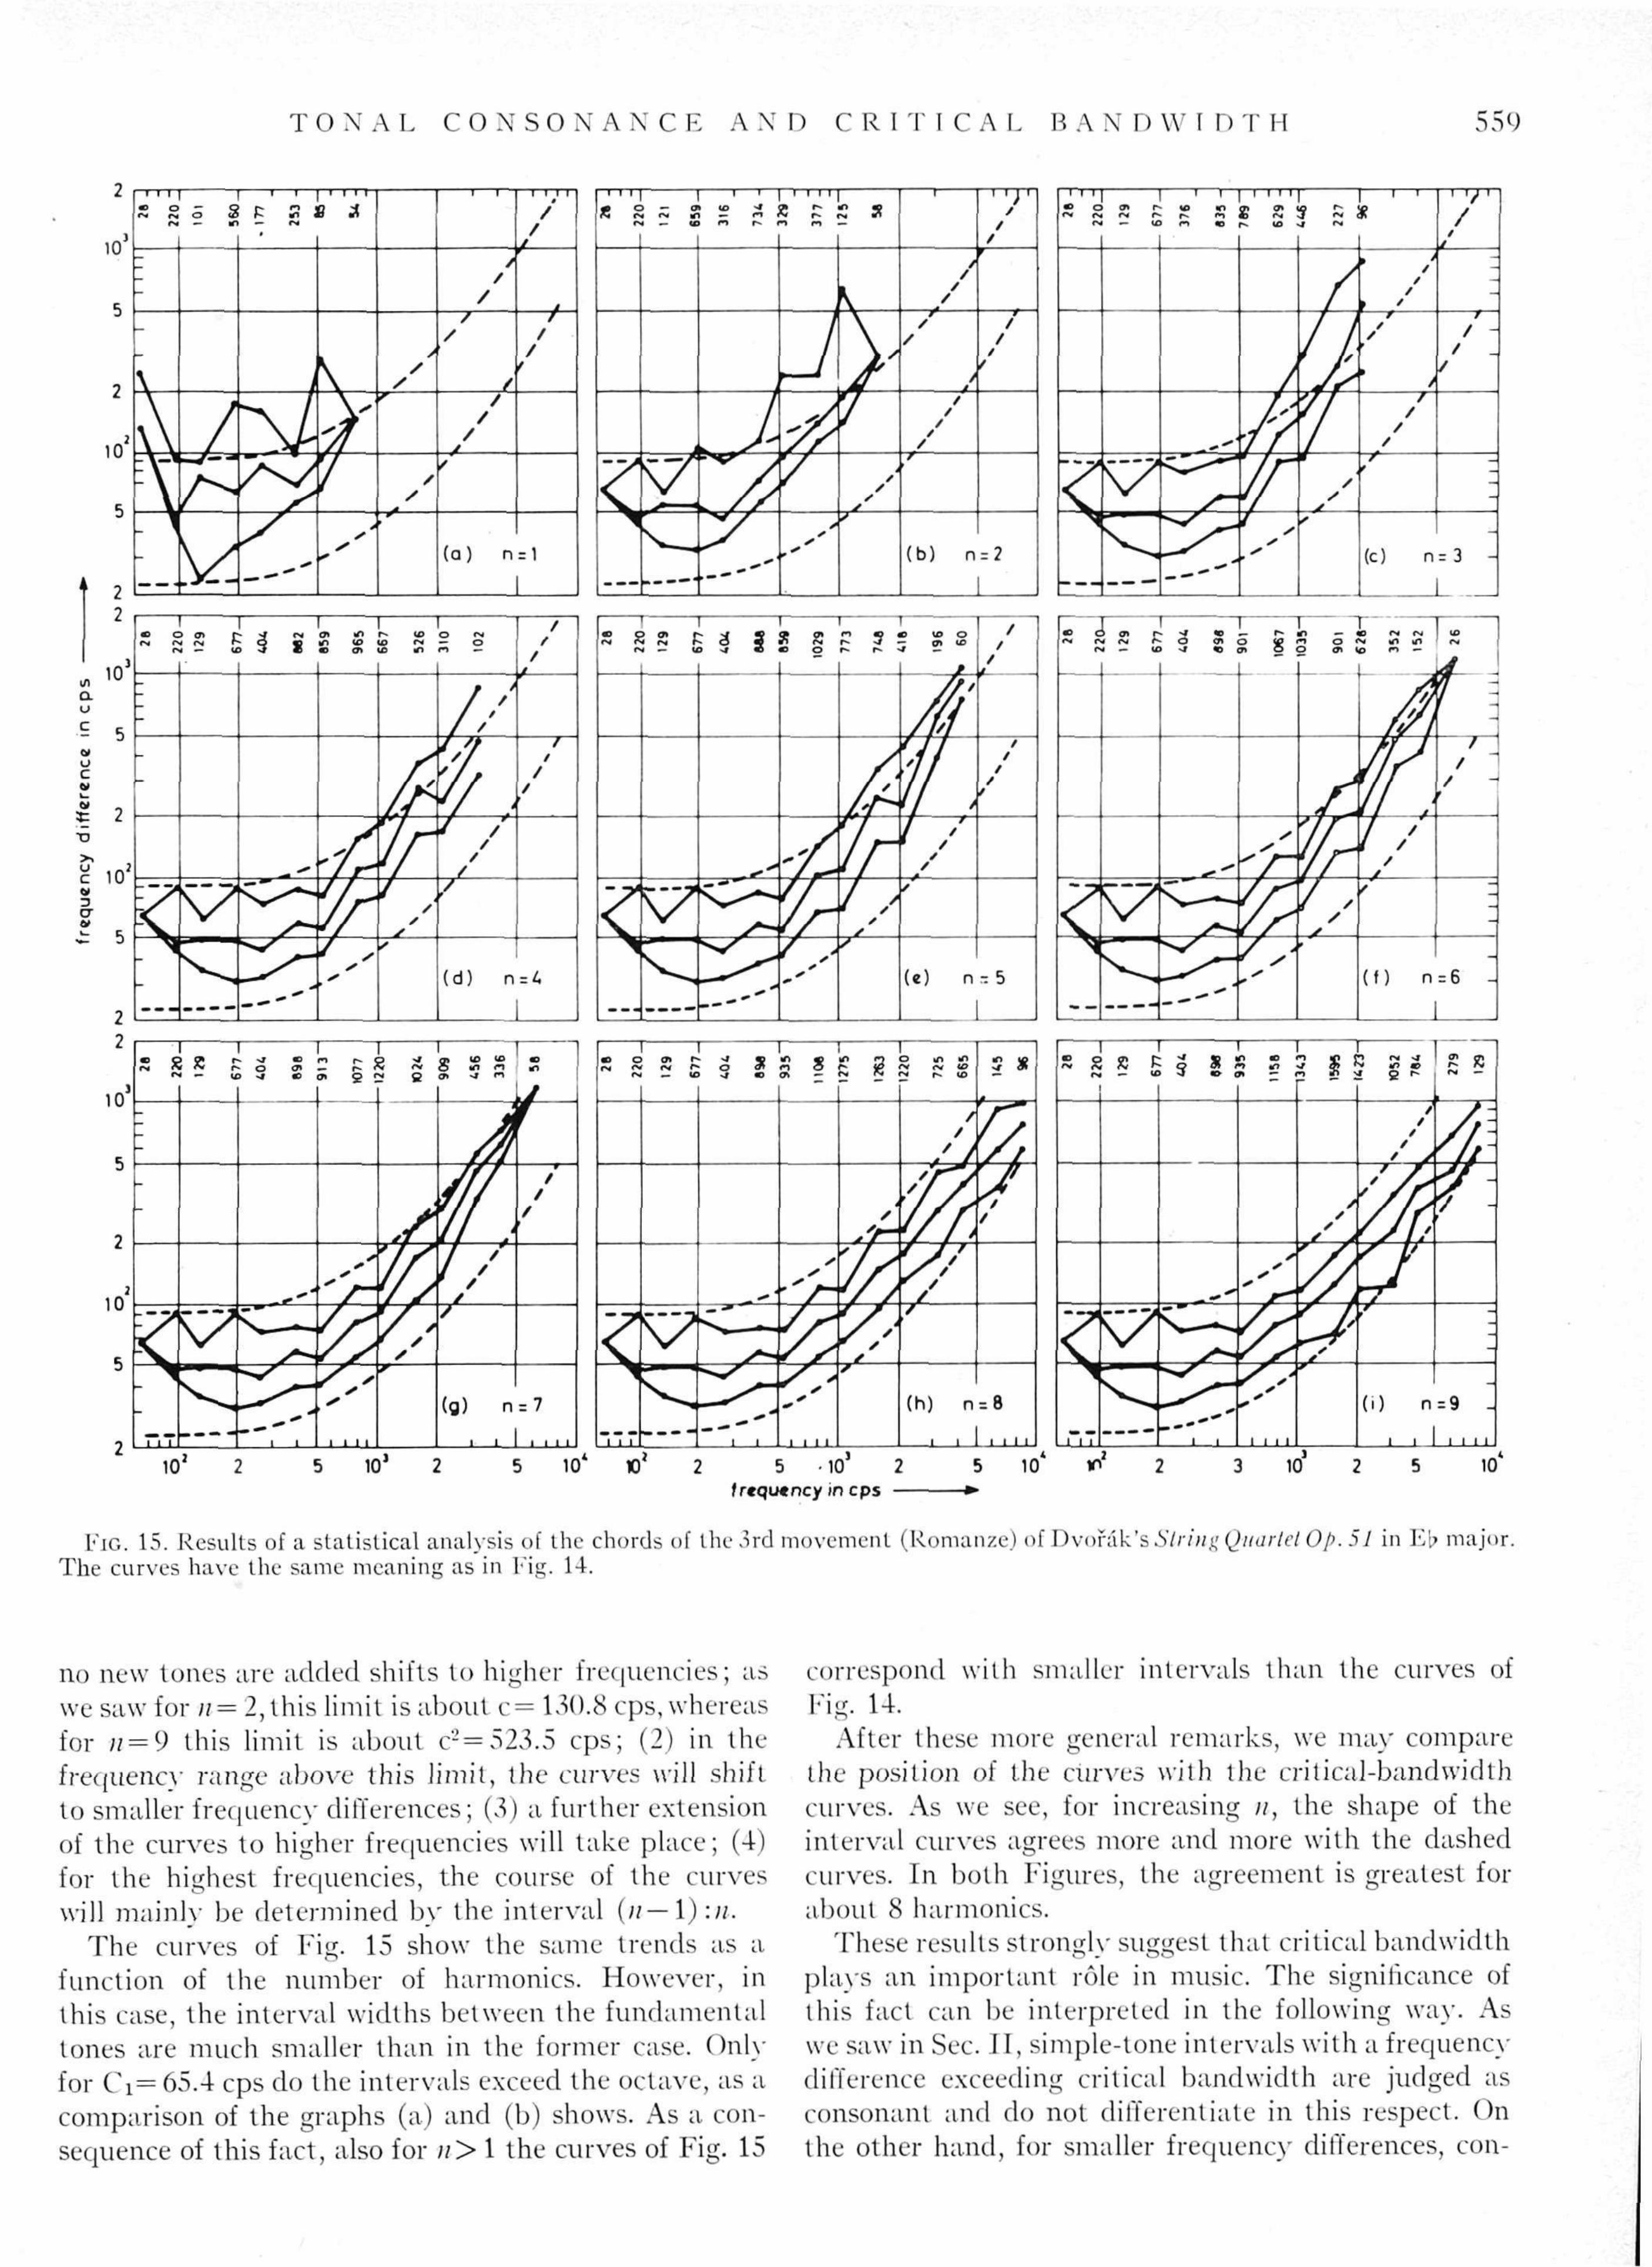
FIG. 15. Results of a statistical analysis of the chords of the 3rd movement (Romanze) of Dvorak's Siring Quartet Op. 51 in Eb major. The curves have the same meaning as in Fig. 14.
no new tones are added shifts to higher frequencies; as we saw for u= 2, this limit is about c = 130.8 cps, whereas for n=9 this limit is about c2= 523.5 cps; (2) in the frequency range above this limit, the curves will shift to smaller frequency differences; (3) a further extension of the curves to higher frequencies will take place; (4) for the highest frequencies, the course of the curves will mainly be determined by the interval (//—1)://.
The curves of Fig. 15 show the same trends as a function of the number of harmonics. However, in this case, the interval widths between the fundamental tones are much smaller than in the former case. Only for C i= 65.4 cps do the intervals exceed the octave, as a comparison of the graphs (a) and (b) shows. As a consequence of this fact, also for n> 1 the curves of Fig. 15
correspond with smaller intervals than the curves of Fig. 14.
After these more general remarks, we may compare the position of the curves with the critical-bandwidth curves. As we see, for increasing //, the shape of the interval curves agrees more and more with the dashed curves. In both Figures, the agreement is greatest for about 8 harmonics.
These results strongly suggest that critical bandwidth plays an important role in music. The significance of this fact can be interpreted in the following way. As we saw in Sec. J I, simple-tone intervals with a frequency difference exceeding critical bandwidth are judged as consonant and do not differentiate in this respect. On the other hand, for smaller frequency differences, con-
560 P L O M P A N D L E V E L T
sonance evaluation strongly depends on interval width, with a minimum for about a quarter of critical bandwidth. So it is not surprising that just this range is used for "modulation" between more-consonant and more-dissonant chords. However, it is surprising indeed that, for a number of harmonics representative of musical instruments, this is achieved in about the same measure over a wide frequency range.
We have to realize that this equally deep "penetration" in the borderland between pronounced consonant and dissonant simple-tone intervals, represented by the upper and lower dashed curves in the graphs, respectively, is a result of many factors. As the most important ones we mav consider:
influence their relation to the dashed curves much more for lower than for higher frequencies.
6.—the number of harmonics produced by the instruments on which the composition is performed. Only the influence of this factor has been studied here, showing that the frequency range over which a typical harmonic modifies the interval distributions shifts to higher ire-quencies for increasing ;/. This implies that the number of harmonics is not very critical. Most musical instruments produce strong harmonics up to a number that may vary from about 6 to 10, though in the last case the tone has a sharp quality and is more suited for solo parts.
Fhe mere enumeration of these factors does not give 1.—the fact that in the tone scale as developed in u s m u c h information about their relative importance.
Western music, a lot of intervals agree with simple frequency ratios, so that harmonics of the different component tones of a chord may coincide; otherwise, the shape of the solid curves of Figs. 14 and 15 would have been more flat, due to more dissonant chords.
2.—the fact that the frequencies of the partials of the tones are multiples of the frequency of the fundamental tone. A deviation from this rule would have the same effect as mentioned under (1). This may be regarded as one of the reasons (there are more!) why instruments with inharmonic partials are not used to produce musical chords.
3.—the way in which, as a function of frequency, the composer selects his intervals. We saw above that in Bach's composition the frequency ratio between fundamental tones is larger at lower than at higher frequencies. As a comparison with Fig. 12 shows, in this way very dissonant chords are avoided. Though to a smaller degree, this is also the case in Dvorak's string quartet [intervals with the same frequency ratio between the component tones correspond with a straight line with a slope of 45° in Fig. 15(a)]].
4.—the number of notes in a chord. It is clear that, generally, for increasing number the mean distance between adjacent partials will decrease. The fact that the solid curves of Fig. 15 correspond with smaller frequency differences than the curves of Fig. 14 may be mainly due to this factor and the 3rd one.
5.—the frequency limits between which the fundamental tones are chosen and their distribution within this range. So a multiplication of all frequencies by a certain factor shifts all curves both horizontallv and
So it would be of interest to know more about the degree to which each factor determines the position of the horizontal and the sloping parts of the curves. Moreover, we should like to have more insight in the way in which their position depends on musical style and on the instruments for which the composition is written. Further investigations are in preparation to answer these questions.
V. CONCLUSIONS
Both the experimental results on the evaluation of simple-tone intervals and on the statistical analysis of chords in musical compositions support the explanation. promoted by von Helmholtz, that the singularity of intervals with frequency ratios determined by small integer numbers is due to interference of adjacent partials finding expression in a roughness sensation. The investigations indicate that, as a function of frequency, the transition range between consonant and dissonant simple-tone intervals is related to critical bandwidth. These intervals are evaluated as consonant for frequency differences exceeding critical bandwidth, whereas the most dissonant intervals correspond with frequency differences of about a quarter of this bandwidth.
ACKNOWLEDGMENTS
The authors wish to express their thanks to A. M. Mimpen, for his cooperation in the experiments, and to J. M. Schipper and E. Agterhuis, for developing the equipment used to compute interval distributions of musical chords.
This work was supported by the Netherlands Organization for the Advancement of Pure Research
vertically to the same degree. As we see, this would (ZWO).