Embed Size (px)
Citation preview
Too Many Markers! Luke Mahe and Chris Broadfoot, Google Geo APIs Team December 2010
Introduction
Some applications are required to display a large number of locations or markers. Despite the v3 JavaScript API's significant improvement to performance, naively plotting thousands of markers on a map can quickly lead to to a degraded user experience. Too many markers on the map cause both visual overload and sluggish interaction with the map. To overcome this poor performance, the information displayed on the map needs to be simplified.
One approach at simplification is to render markers on the server. Google provides two services built into the v3 API that make this easy to achieve: FusionTablesLayer and KmlLayer. If you'd prefer to perform computations on your own server, this can be accomplished by creating a custom overlay from imagery that is pre-rendered, or rendered on the fly.
Another useful optimization technique involves viewport marker management: restricting the markers rendered on the map into only those that exist within the viewable area.
If you still want to display many markers on the map, consider creating a custom overlay that displays markers with minimal functionality. This approach may garner performance improvements over standard markers provided by the API. Alternatively, the Maps API for Flash can render many thousands of markers while retaining a responsive user interface.
Clustering simplifies your data visualization by consolidating data that are nearby each other on the map in an aggregate form.
These varied approaches are outlined in the following sections:
1. Grid-based Clustering 2. Distance-based Clustering 3. Viewport Marker Management 4. Flash 5. Fusion Tables 6. MarkerClusterer 7. MarkerManager
Grid-based Clustering
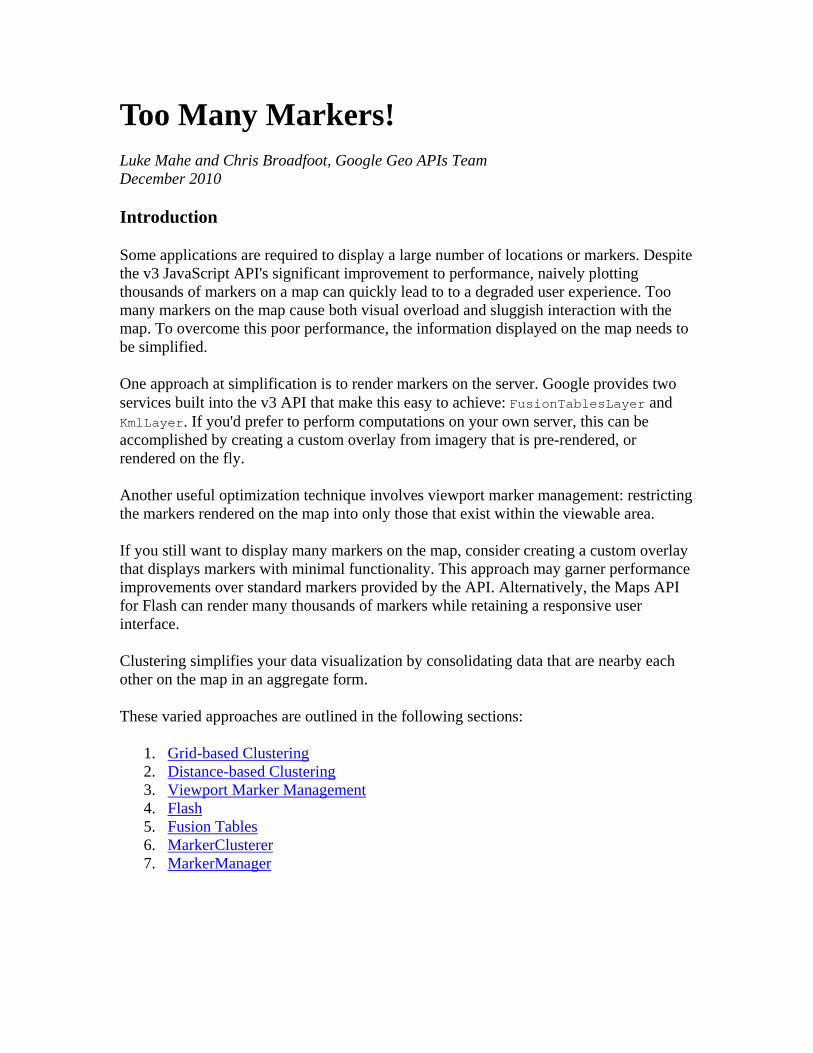
Grid-based clustering works by dividing the map into squares of a certain size (the size changes at each zoom) and then grouping the markers into each grid square.
Before grid-based clustering
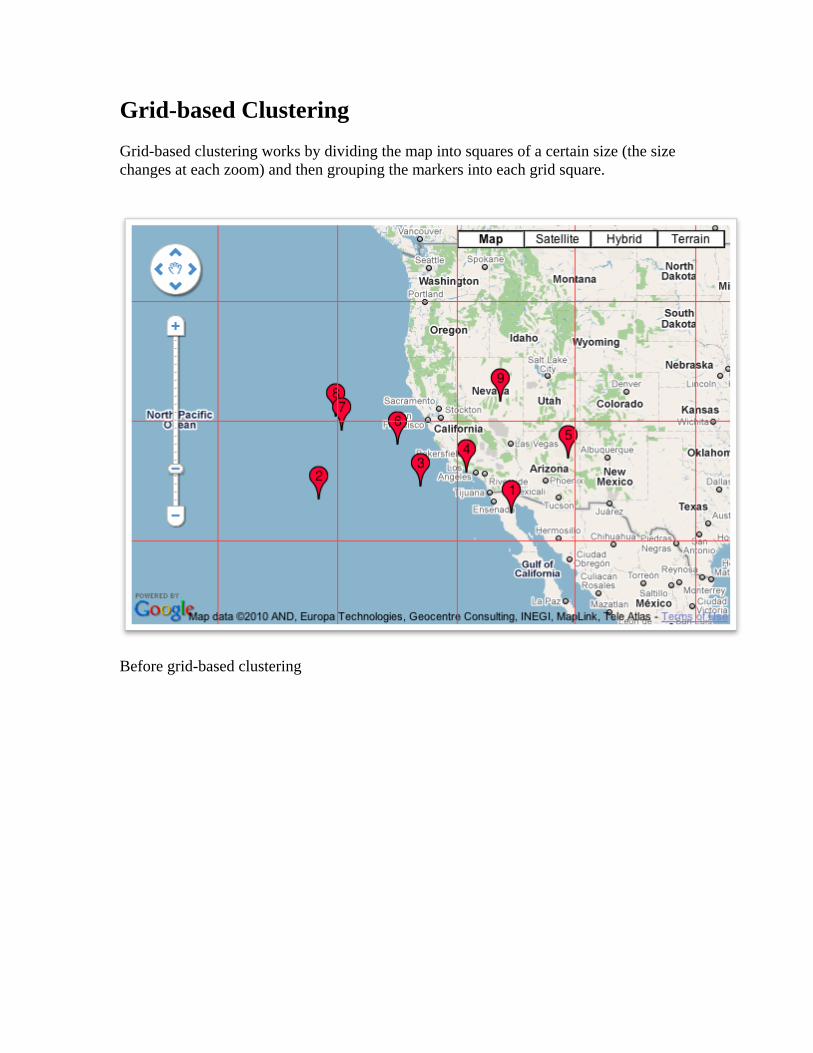
After grid-based clustering
This technique can be rather quick because it only requires iterating through the markers once to see if its position is between a set of coordinates; no complicated distance calculation is needed. It does have some limitations, as you can see marker's 7 and 8 are close together but because they are in separate grids they are not clustered together.
Note that each cluster is at a precise grid coordinate which may cluster, say, 5 markers, but put them all at the center of the grid rather than their centroid. The ending result might not accurately describe the data, so this is something that should be considered.
Distance-based Clustering
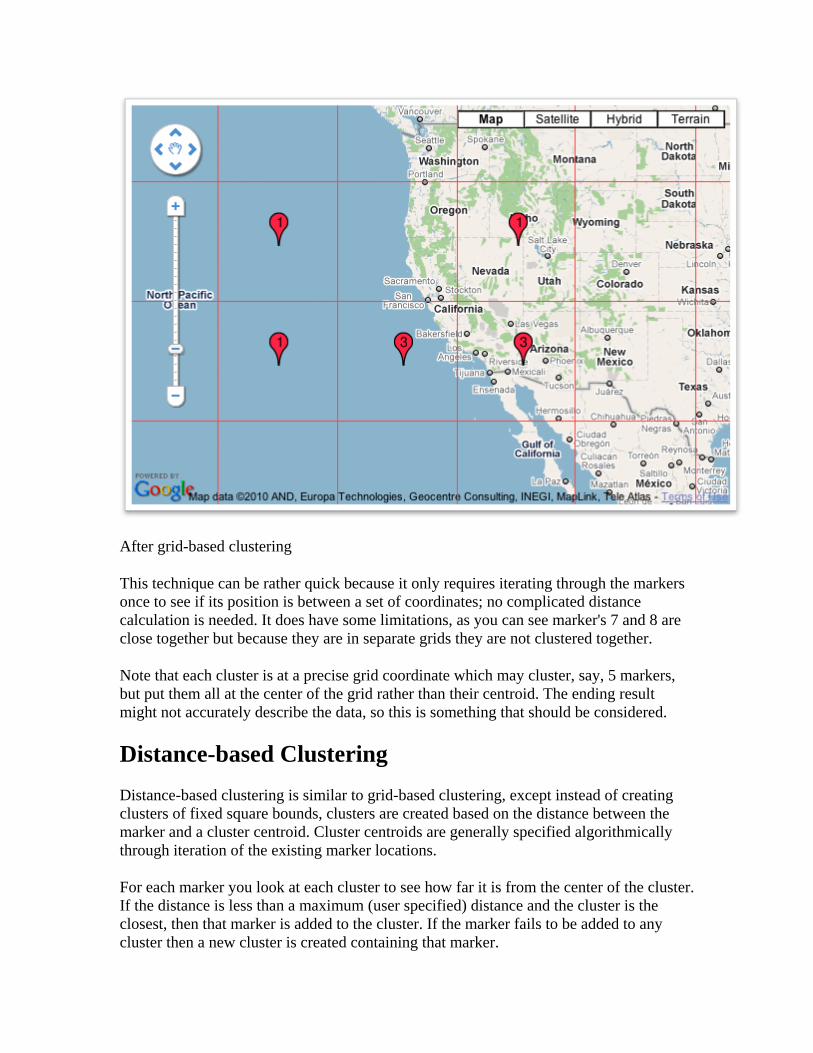
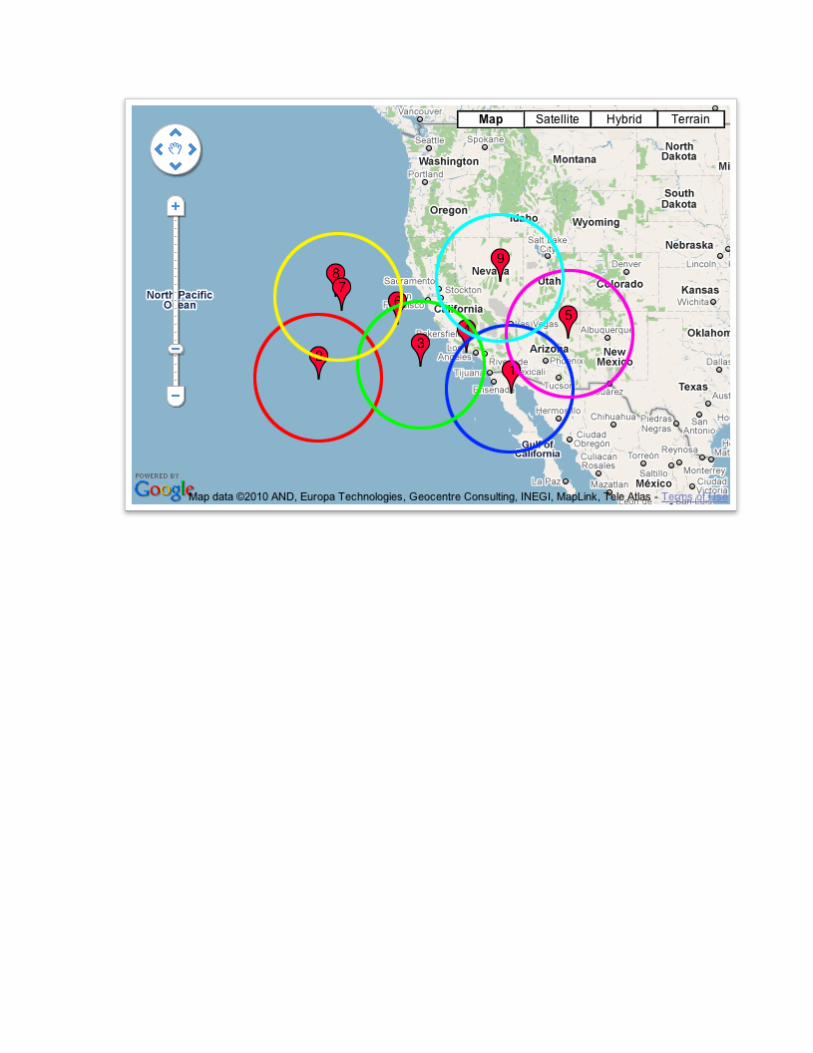
Distance-based clustering is similar to grid-based clustering, except instead of creating clusters of fixed square bounds, clusters are created based on the distance between the marker and a cluster centroid. Cluster centroids are generally specified algorithmically through iteration of the existing marker locations.
For each marker you look at each cluster to see how far it is from the center of the cluster. If the distance is less than a maximum (user specified) distance and the cluster is the closest, then that marker is added to the cluster. If the marker fails to be added to any cluster then a new cluster is created containing that marker.
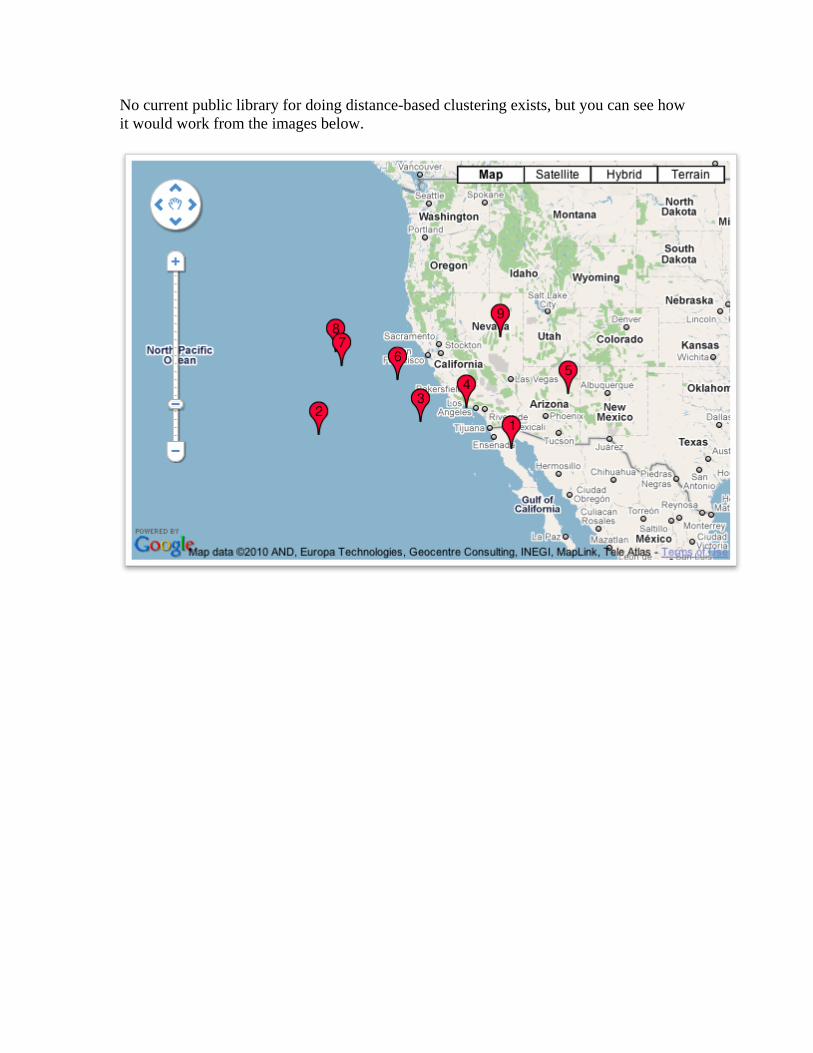
No current public library for doing distance-based clustering exists, but you can see how it would work from the images below.
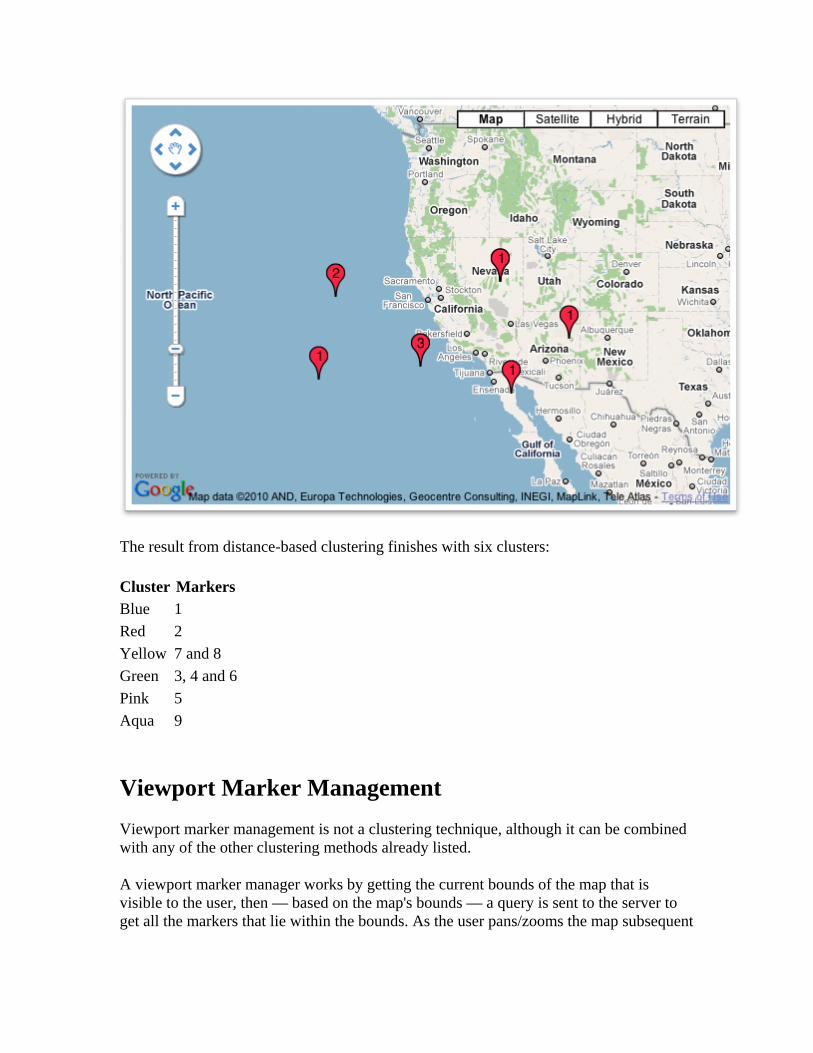
The result from distance-based clustering finishes with six clusters:
Cluster Markers
Blue 1
Red 2
Yellow 7 and 8
Green 3, 4 and 6
Pink 5
Aqua 9
Viewport Marker Management
Viewport marker management is not a clustering technique, although it can be combined with any of the other clustering methods already listed.
A viewport marker manager works by getting the current bounds of the map that is visible to the user, then — based on the map's bounds — a query is sent to the server to get all the markers that lie within the bounds. As the user pans/zooms the map subsequent
requests are sent to the server to get the new markers. All markers that are no longer in view are generally removed to improve map performance.
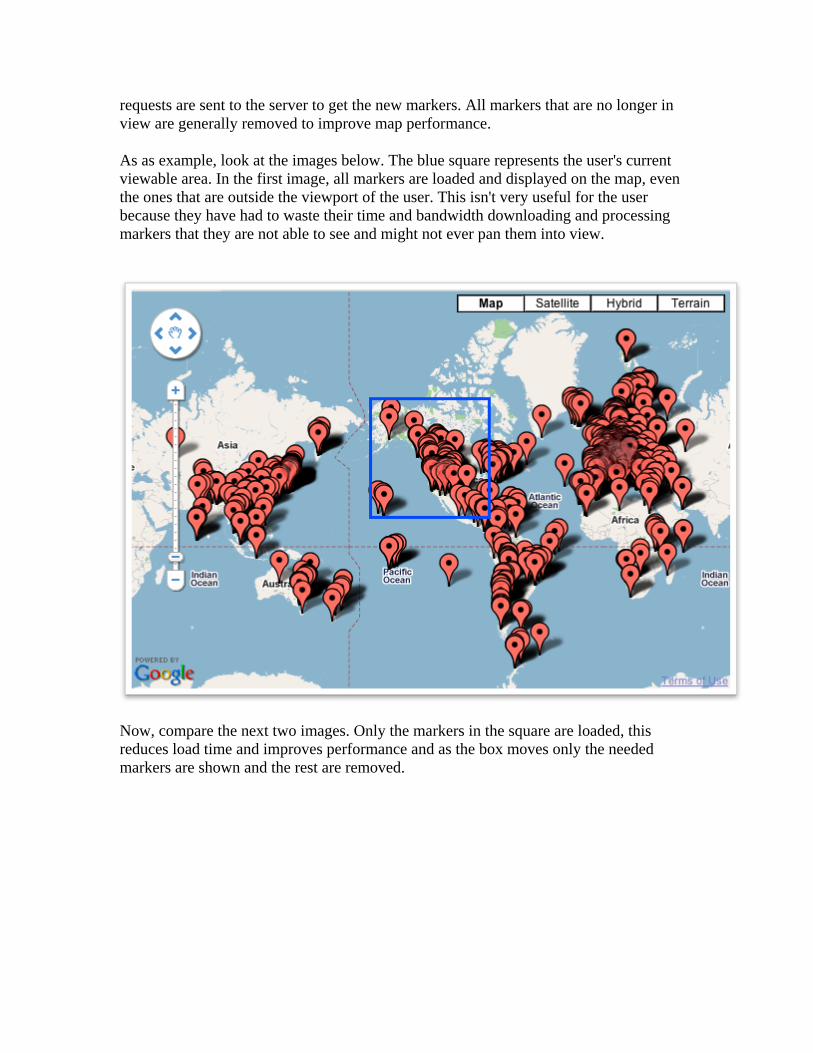
As as example, look at the images below. The blue square represents the user's current viewable area. In the first image, all markers are loaded and displayed on the map, even the ones that are outside the viewport of the user. This isn't very useful for the user because they have had to waste their time and bandwidth downloading and processing markers that they are not able to see and might not ever pan them into view.
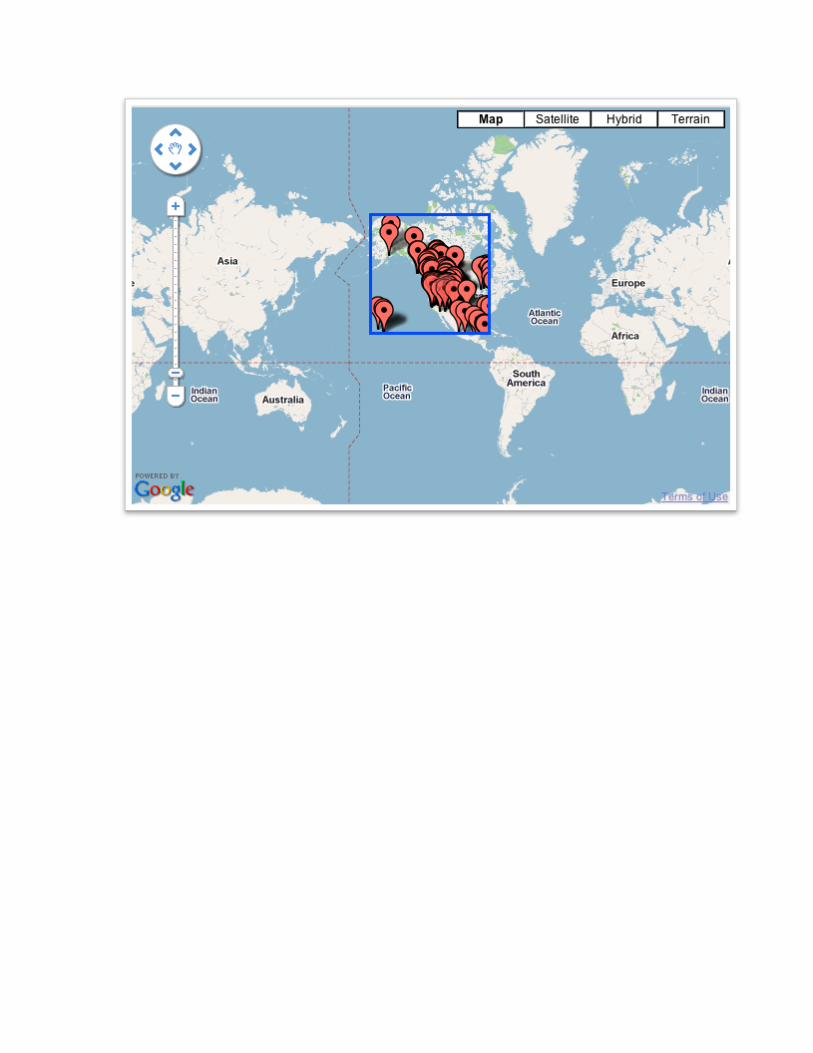
Now, compare the next two images. Only the markers in the square are loaded, this reduces load time and improves performance and as the box moves only the needed markers are shown and the rest are removed.
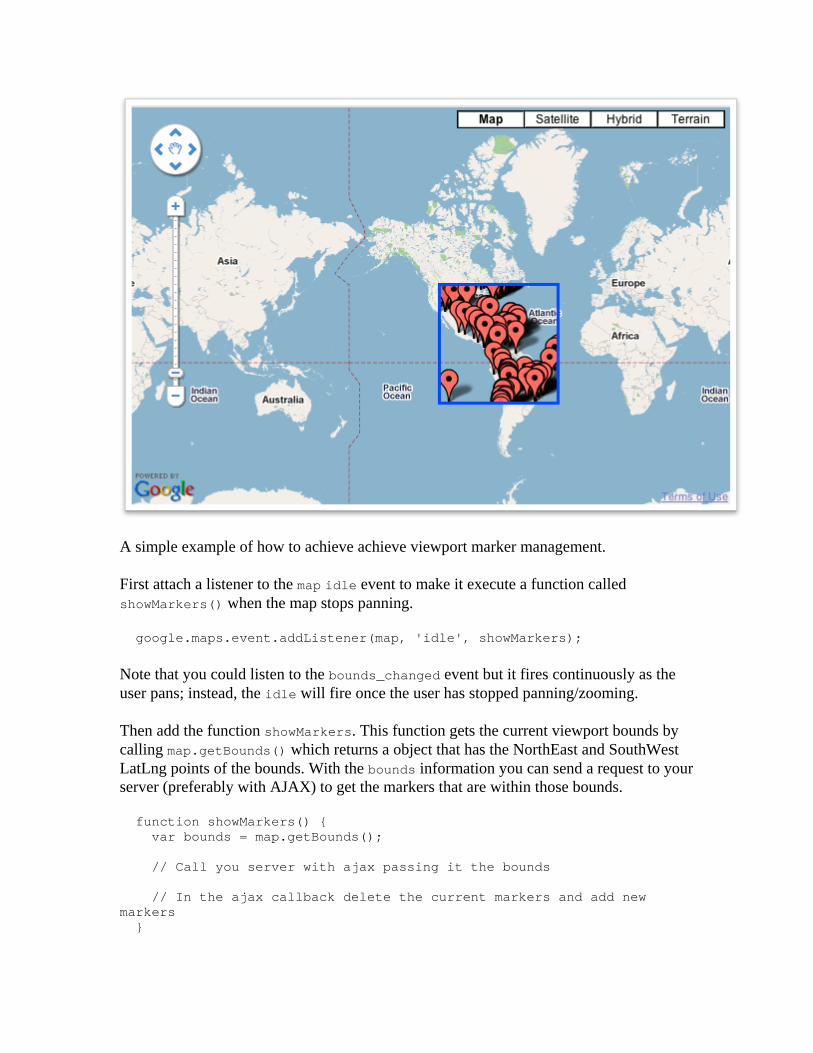
A simple example of how to achieve achieve viewport marker management.
First attach a listener to the map idle event to make it execute a function called showMarkers() when the map stops panning.
google.maps.event.addListener(map, 'idle', showMarkers);
Note that you could listen to the bounds_changed event but it fires continuously as the user pans; instead, the idle will fire once the user has stopped panning/zooming.
Then add the function showMarkers. This function gets the current viewport bounds by calling map.getBounds() which returns a object that has the NorthEast and SouthWest LatLng points of the bounds. With the bounds information you can send a request to your server (preferably with AJAX) to get the markers that are within those bounds.
function showMarkers() { var bounds = map.getBounds(); // Call you server with ajax passing it the bounds // In the ajax callback delete the current markers and add new markers }
With the new list of markers you can remove the current markers (marker.setMap(null)) that are on the map and add the new ones (marker.setMap(map)).
Flash
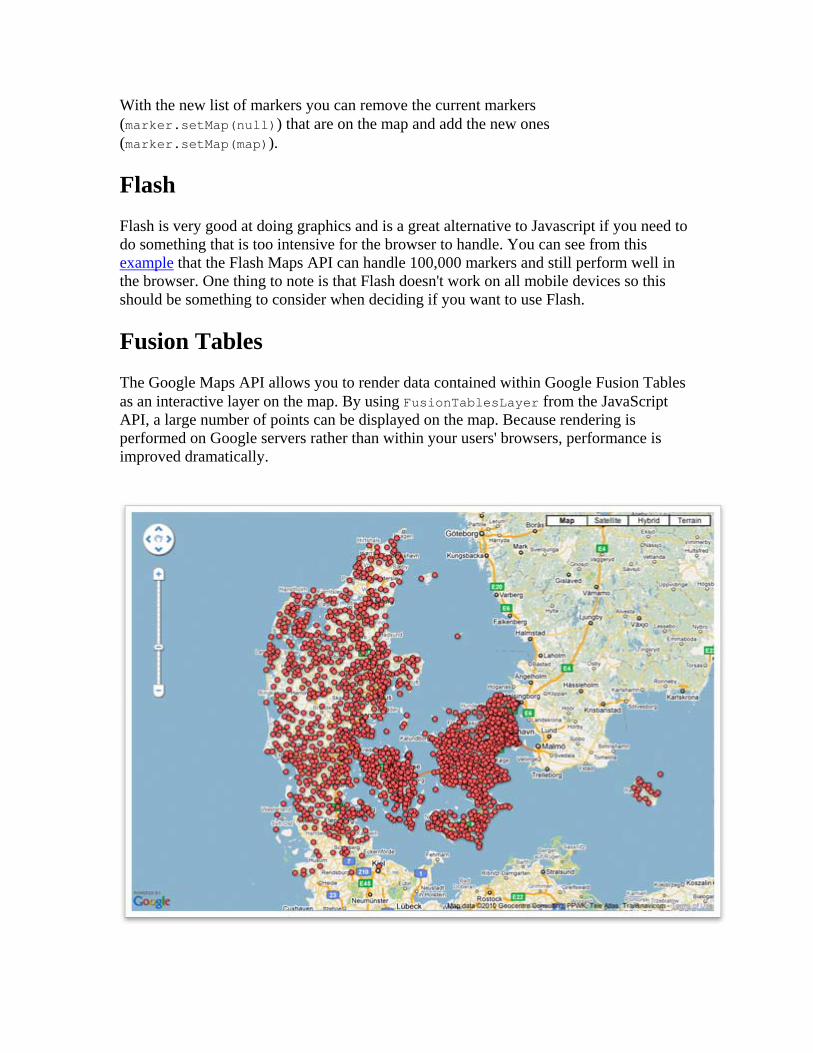
Flash is very good at doing graphics and is a great alternative to Javascript if you need to do something that is too intensive for the browser to handle. You can see from this example that the Flash Maps API can handle 100,000 markers and still perform well in the browser. One thing to note is that Flash doesn't work on all mobile devices so this should be something to consider when deciding if you want to use Flash.
Fusion Tables
The Google Maps API allows you to render data contained within Google Fusion Tables as an interactive layer on the map. By using FusionTablesLayer from the JavaScript API, a large number of points can be displayed on the map. Because rendering is performed on Google servers rather than within your users' browsers, performance is improved dramatically.
Fusion Tables also allows SQL-like queries against the data in the table. New tiles are generated on the fly that represent the data returned in the query. You can see a good example here, as you move the slider it will re-query the fusion table for trails that are less than the specified value.
Fusion Tables Layers are currently listed as experimental. Read more about Fusion Tables to get started, then read our documentation on FusionTablesLayer so you can start using them with your map.
MarkerClusterer
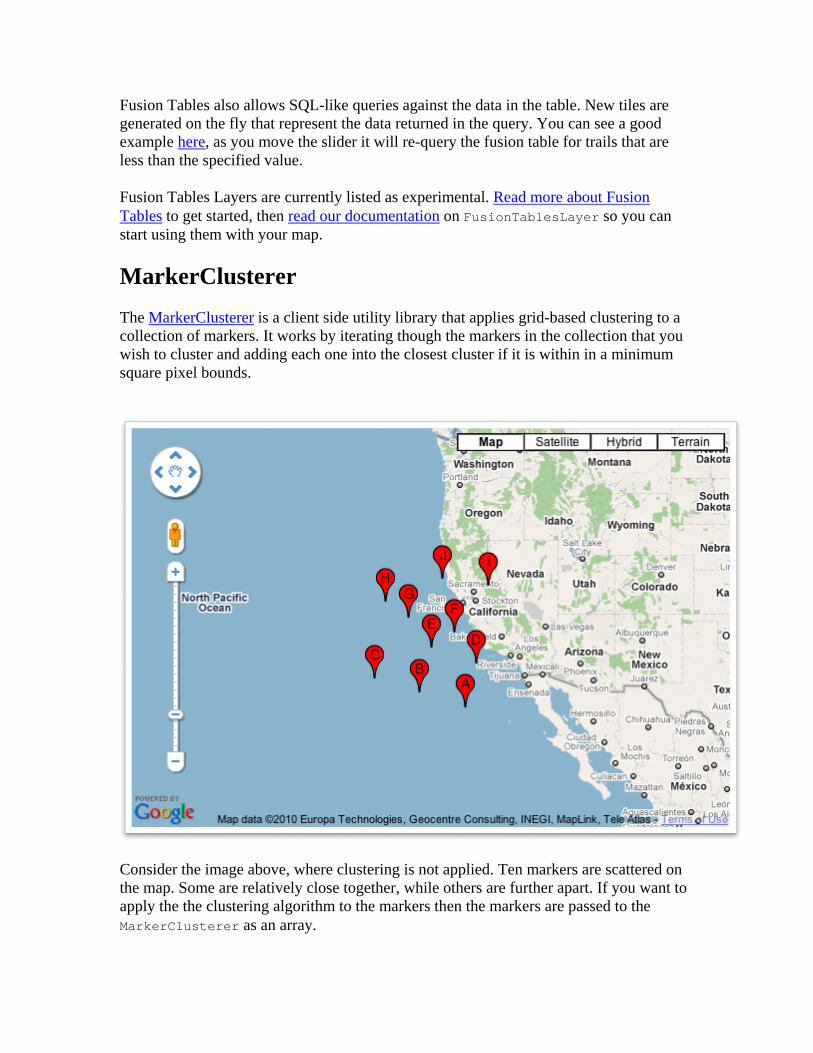
The MarkerClusterer is a client side utility library that applies grid-based clustering to a collection of markers. It works by iterating though the markers in the collection that you wish to cluster and adding each one into the closest cluster if it is within in a minimum square pixel bounds.
Consider the image above, where clustering is not applied. Ten markers are scattered on the map. Some are relatively close together, while others are further apart. If you want to apply the the clustering algorithm to the markers then the markers are passed to the MarkerClusterer as an array.
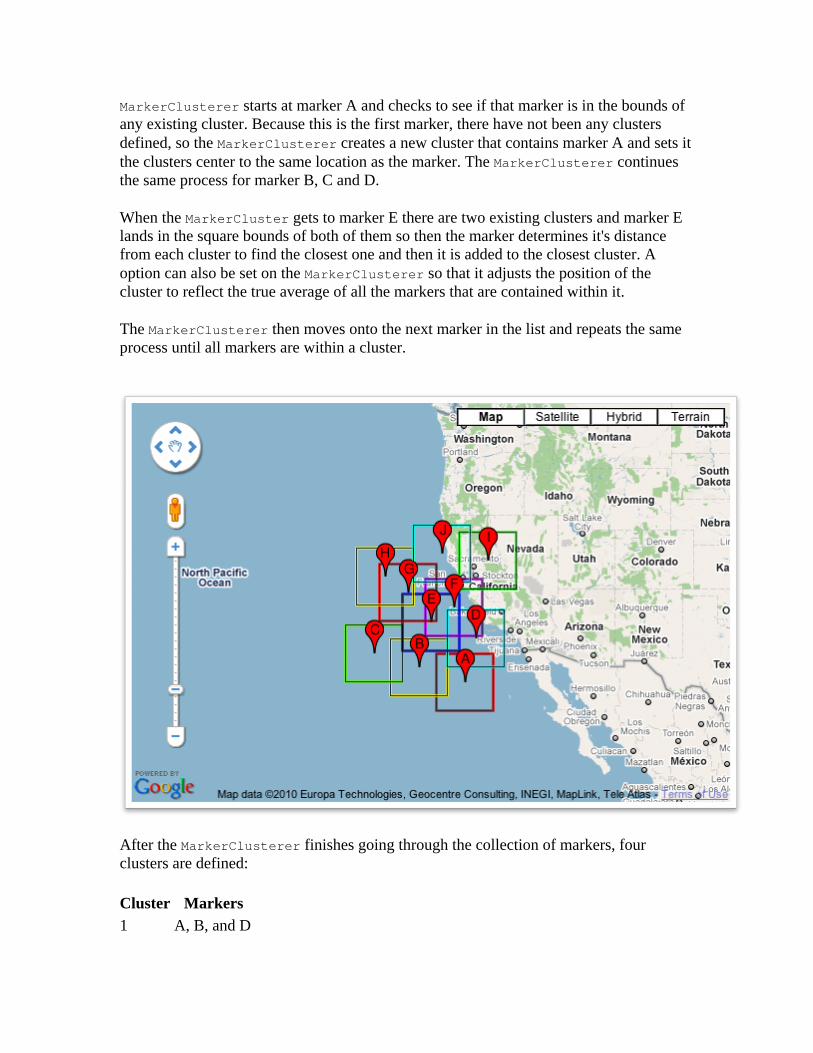
MarkerClusterer starts at marker A and checks to see if that marker is in the bounds of any existing cluster. Because this is the first marker, there have not been any clusters defined, so the MarkerClusterer creates a new cluster that contains marker A and sets it the clusters center to the same location as the marker. The MarkerClusterer continues the same process for marker B, C and D.
When the MarkerCluster gets to marker E there are two existing clusters and marker E lands in the square bounds of both of them so then the marker determines it's distance from each cluster to find the closest one and then it is added to the closest cluster. A option can also be set on the MarkerClusterer so that it adjusts the position of the cluster to reflect the true average of all the markers that are contained within it.
The MarkerClusterer then moves onto the next marker in the list and repeats the same process until all markers are within a cluster.
After the MarkerClusterer finishes going through the collection of markers, four clusters are defined:
Cluster Markers
1 A, B, and D
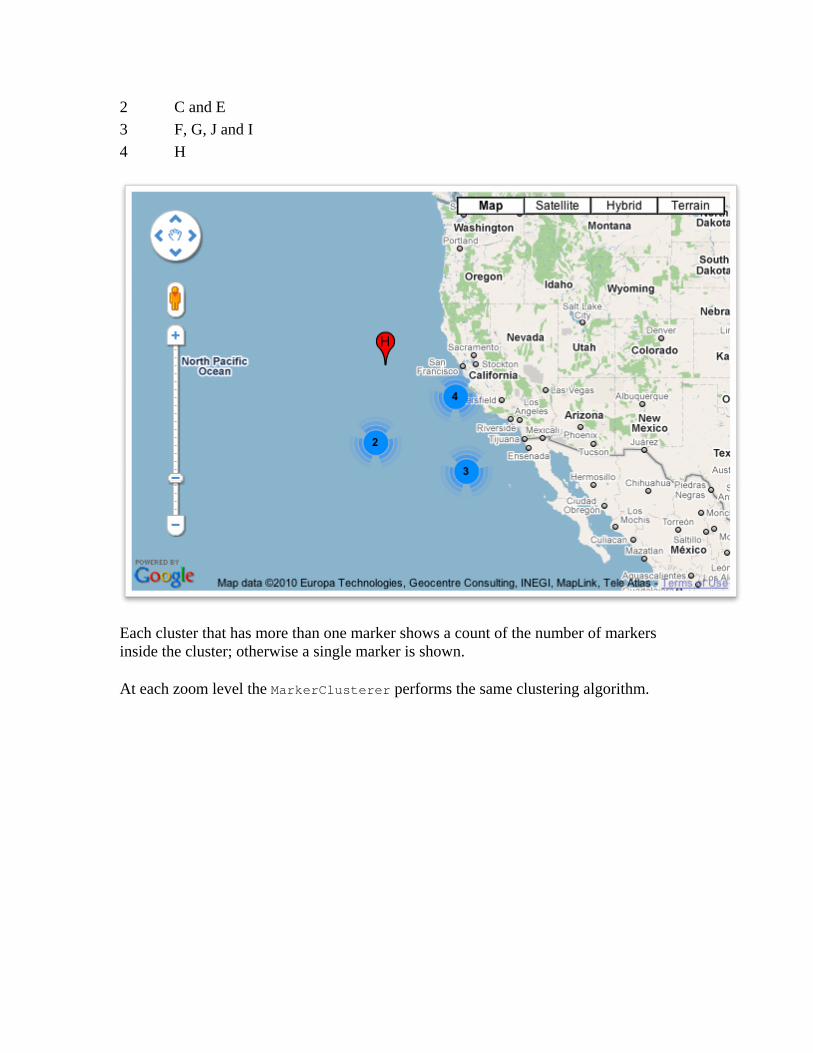
2 C and E
3 F, G, J and I
4 H
Each cluster that has more than one marker shows a count of the number of markers inside the cluster; otherwise a single marker is shown.
At each zoom level the MarkerClusterer performs the same clustering algorithm.
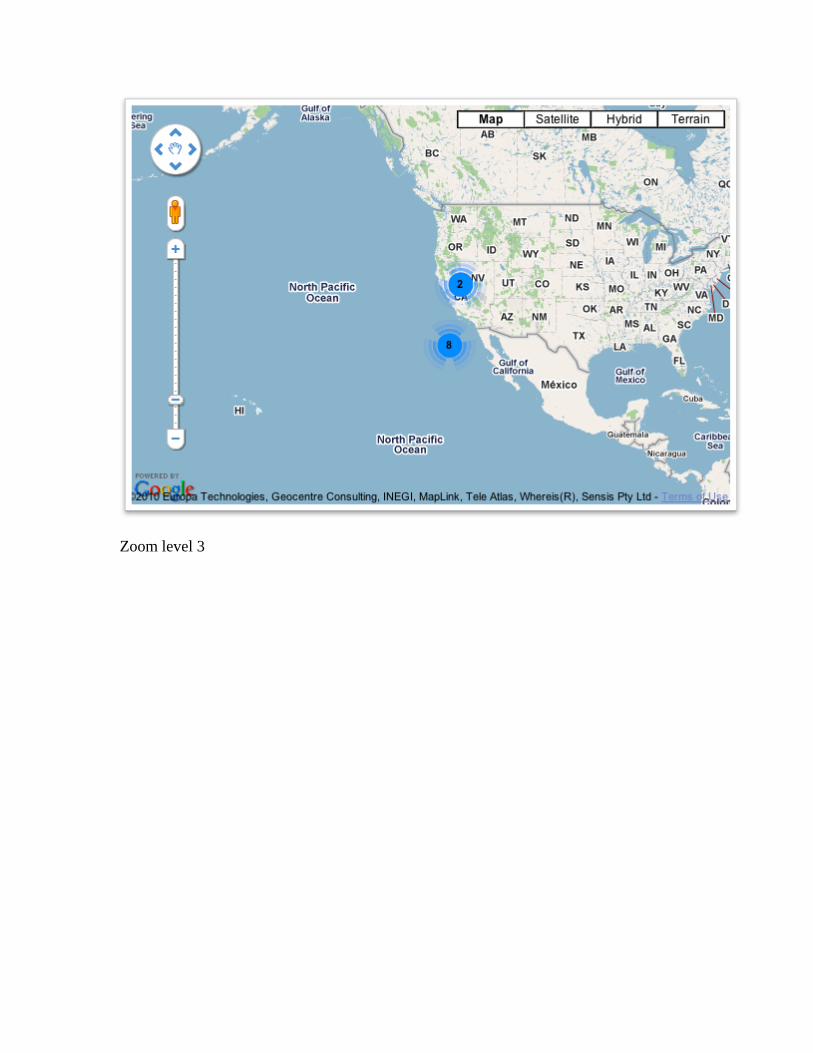
Zoom level 3
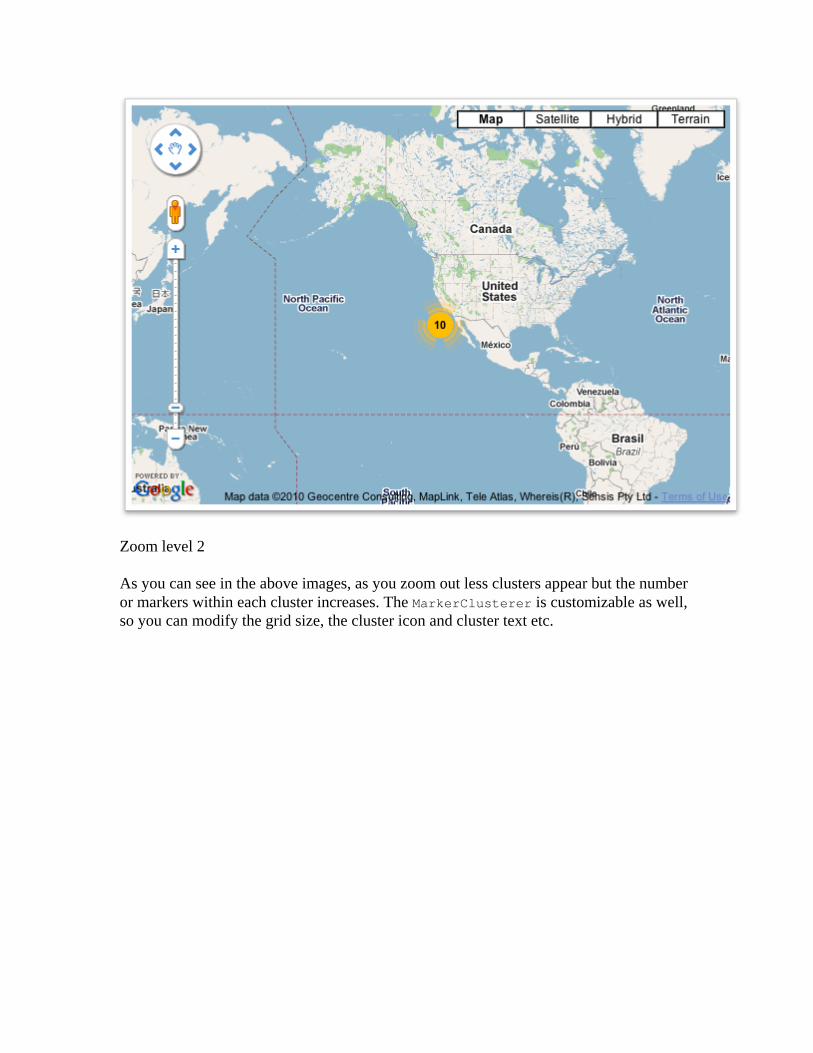
Zoom level 2
As you can see in the above images, as you zoom out less clusters appear but the number or markers within each cluster increases. The MarkerClusterer is customizable as well, so you can modify the grid size, the cluster icon and cluster text etc.
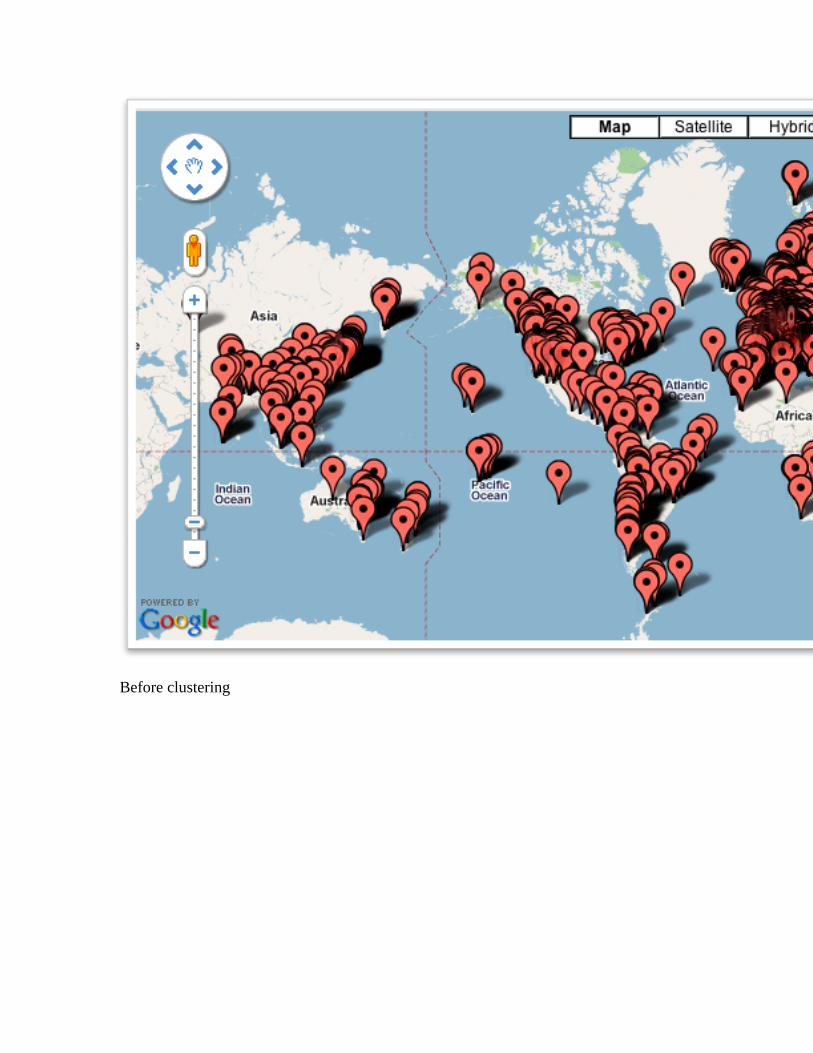
Before clustering
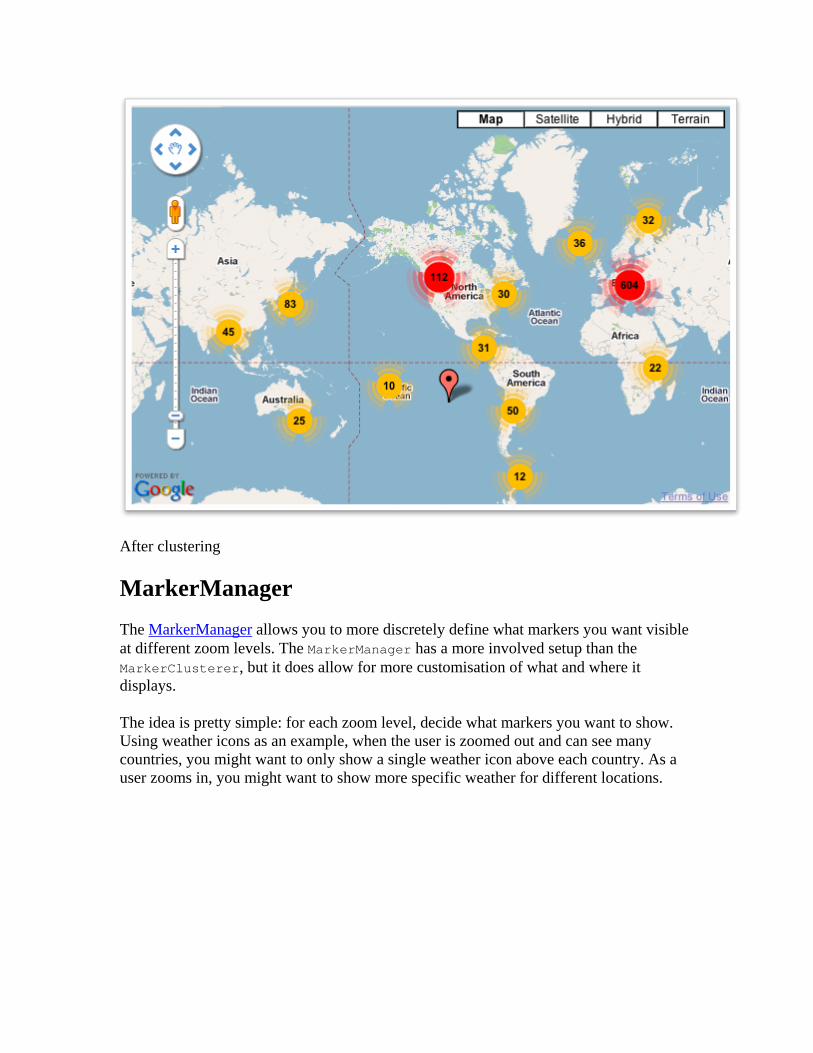
After clustering
MarkerManager
The MarkerManager allows you to more discretely define what markers you want visible at different zoom levels. The MarkerManager has a more involved setup than the MarkerClusterer, but it does allow for more customisation of what and where it displays.
The idea is pretty simple: for each zoom level, decide what markers you want to show. Using weather icons as an example, when the user is zoomed out and can see many countries, you might want to only show a single weather icon above each country. As a user zooms in, you might want to show more specific weather for different locations.
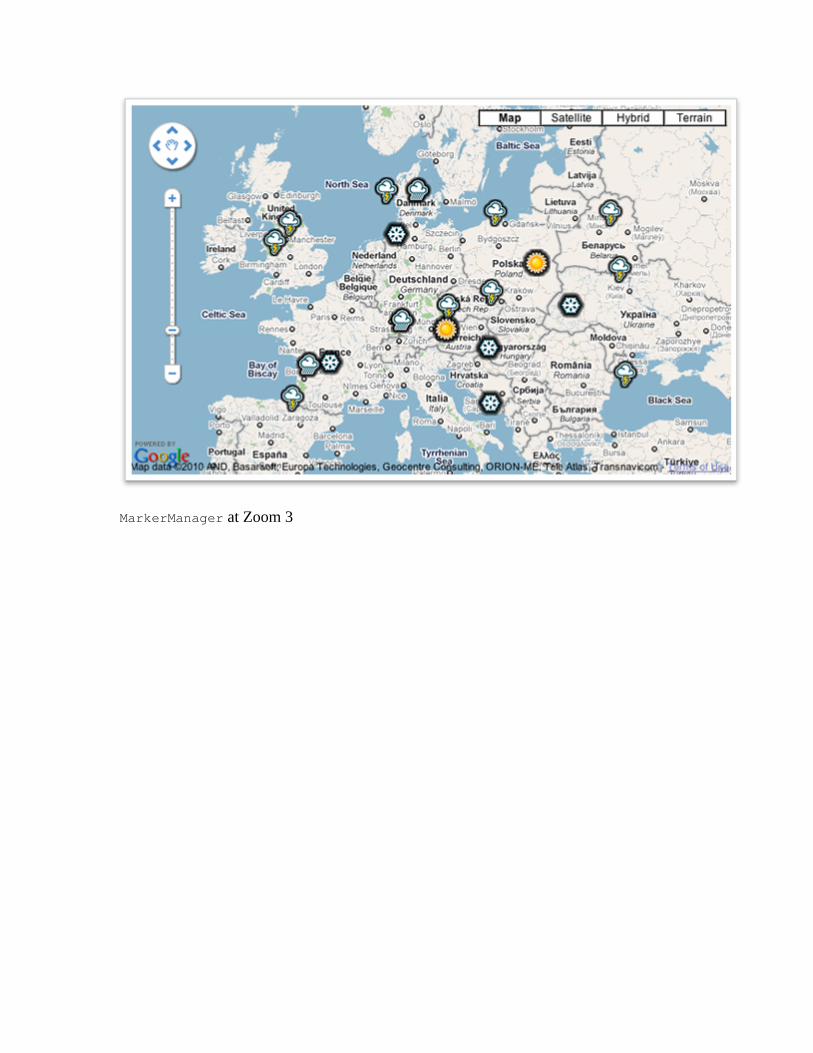
MarkerManager at Zoom 3
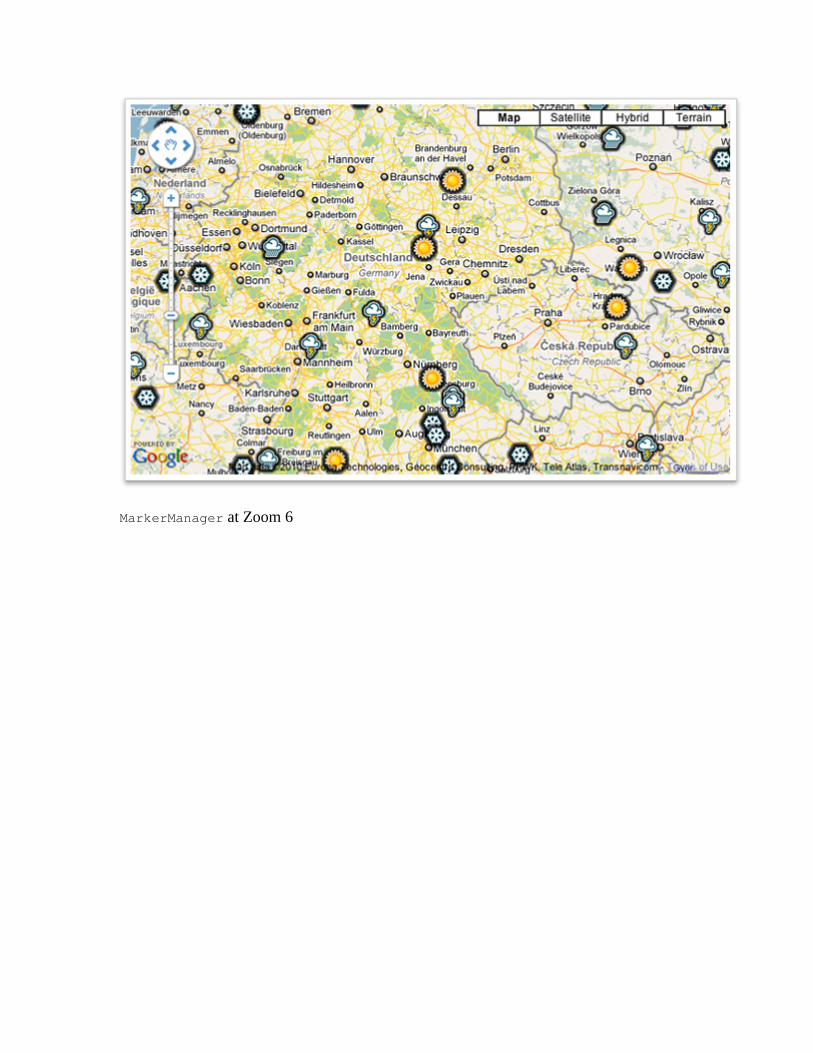
MarkerManager at Zoom 6
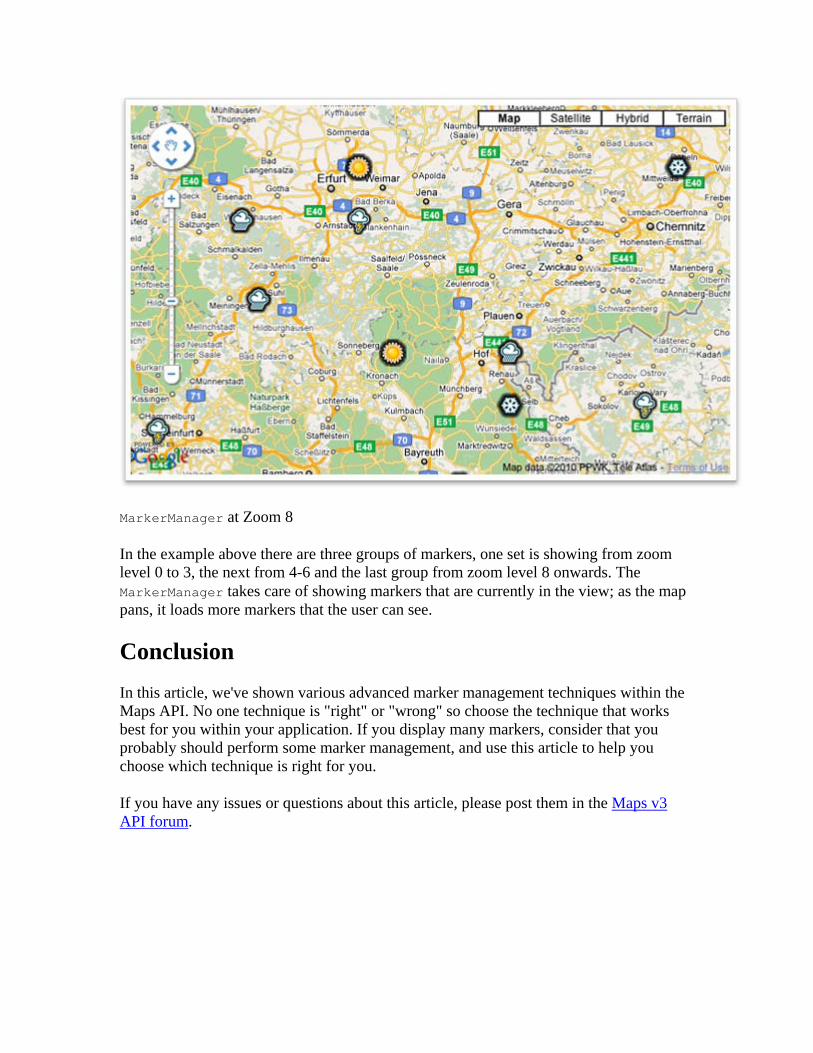
MarkerManager at Zoom 8
In the example above there are three groups of markers, one set is showing from zoom level 0 to 3, the next from 4-6 and the last group from zoom level 8 onwards. The MarkerManager takes care of showing markers that are currently in the view; as the map pans, it loads more markers that the user can see.
Conclusion
In this article, we've shown various advanced marker management techniques within the Maps API. No one technique is "right" or "wrong" so choose the technique that works best for you within your application. If you display many markers, consider that you probably should perform some marker management, and use this article to help you choose which technique is right for you.
If you have any issues or questions about this article, please post them in the Maps v3 API forum.