Embed Size (px)
Citation preview
Catalysis Center for Energy Innovation
CCEI is an Energy Frontier Research Center funded by the U.S. Department of Energy, Office of Basic Energy Sciences
Alexander Mironenko
Jonathan Sutton
Dionisios G. Vlachos
November 4, 2014
Tools for Kinetic Modeling
Catalysis Center for Energy Innovation
2
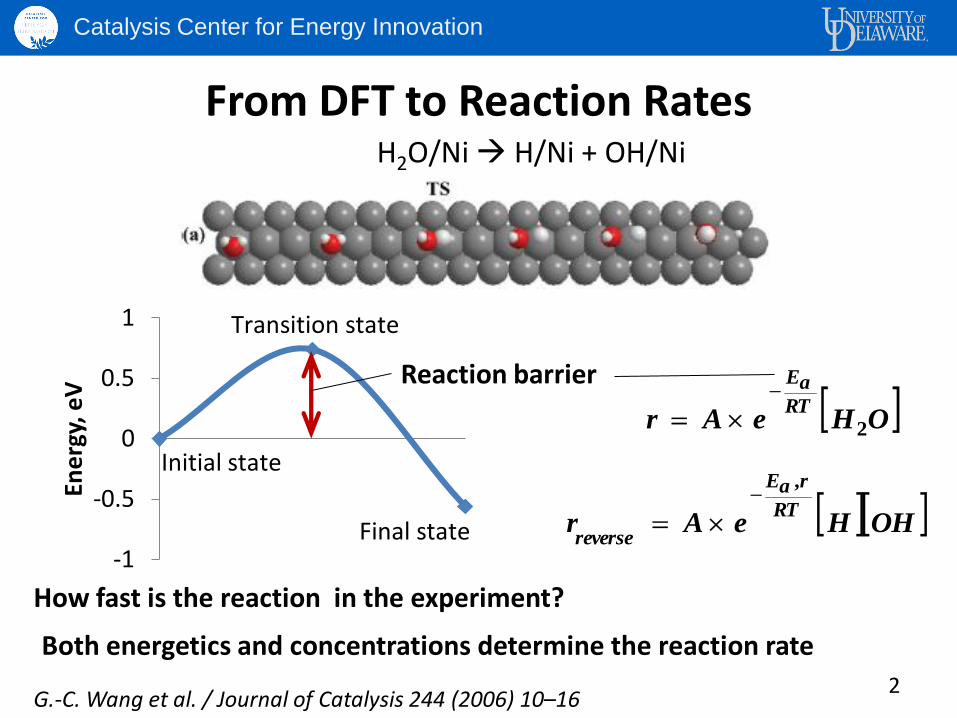
From DFT to Reaction Rates H2O/Ni H/Ni + OH/Ni
-1
-0.5
0
0.5
1
Ene
rgy,
eV
Initial state
Transition state
Final state
Reaction barrier
How fast is the reaction in the experiment?
OHeArRT
aE
2
OHHeArRT
raE
reverse
,
Both energetics and concentrations determine the reaction rate
G.-C. Wang et al. / Journal of Catalysis 244 (2006) 10–16
Catalysis Center for Energy Innovation
3
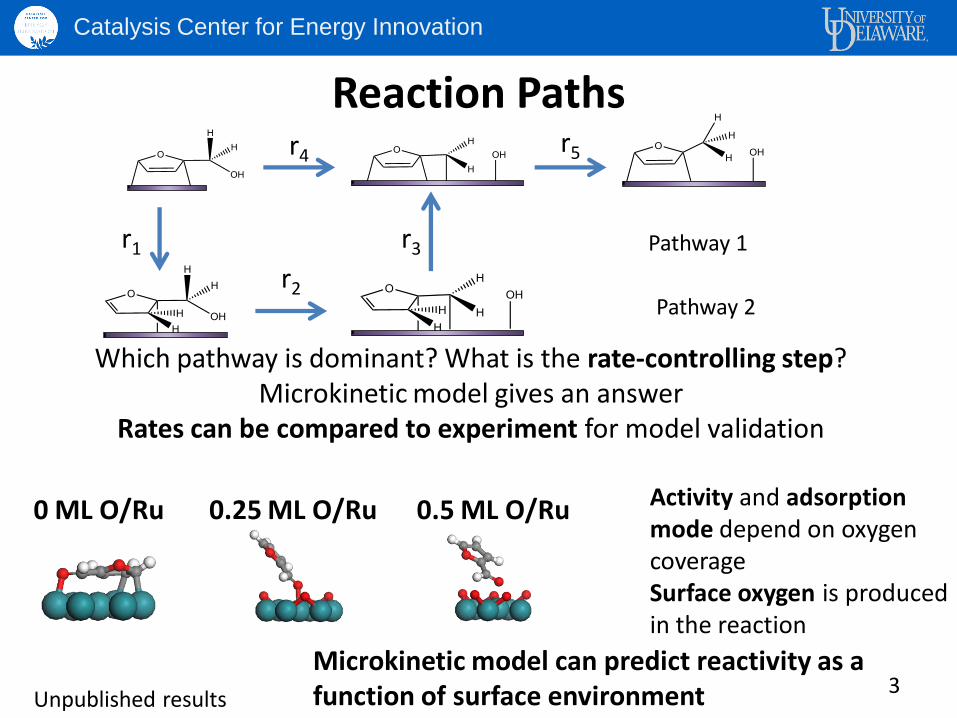
Reaction Paths
Pathway 1
Pathway 2
Which pathway is dominant? What is the rate-controlling step? Microkinetic model gives an answer
Rates can be compared to experiment for model validation
r1
r2
r3
r4 r5
Unpublished results
0 ML O/Ru 0.25 ML O/Ru 0.5 ML O/Ru Activity and adsorption mode depend on oxygen coverage Surface oxygen is produced in the reaction
Microkinetic model can predict reactivity as a function of surface environment
Catalysis Center for Energy Innovation
4
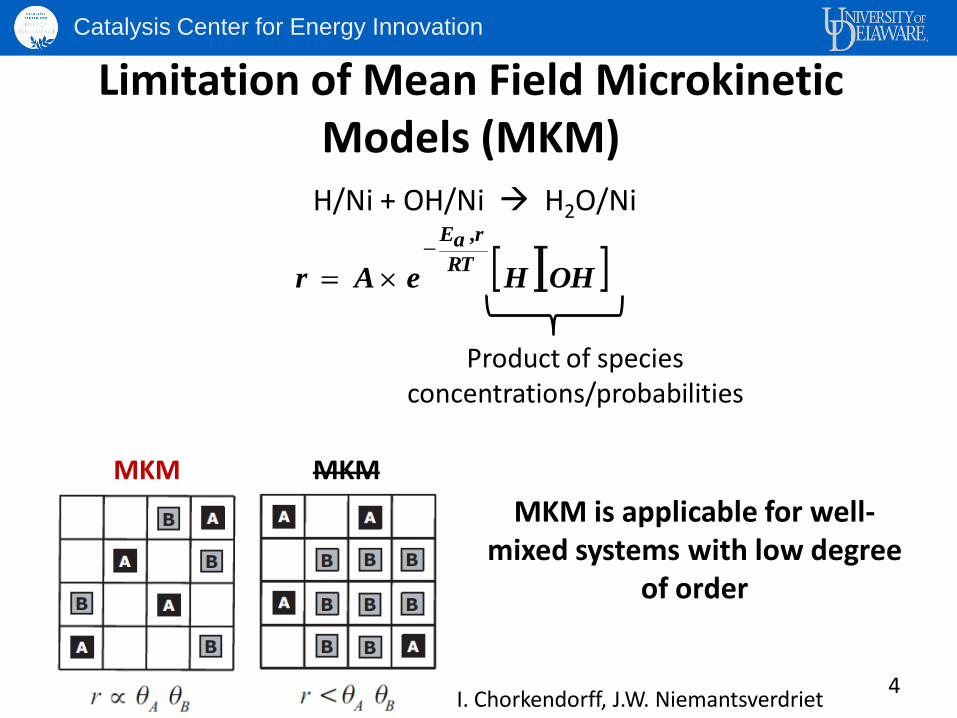
Limitation of Mean Field Microkinetic Models (MKM)
H/Ni + OH/Ni H2O/Ni
OHHeArRT
raE ,
Product of species concentrations/probabilities
MKM MKM
I. Chorkendorff, J.W. Niemantsverdriet
MKM is applicable for well-mixed systems with low degree
of order
Catalysis Center for Energy Innovation
5
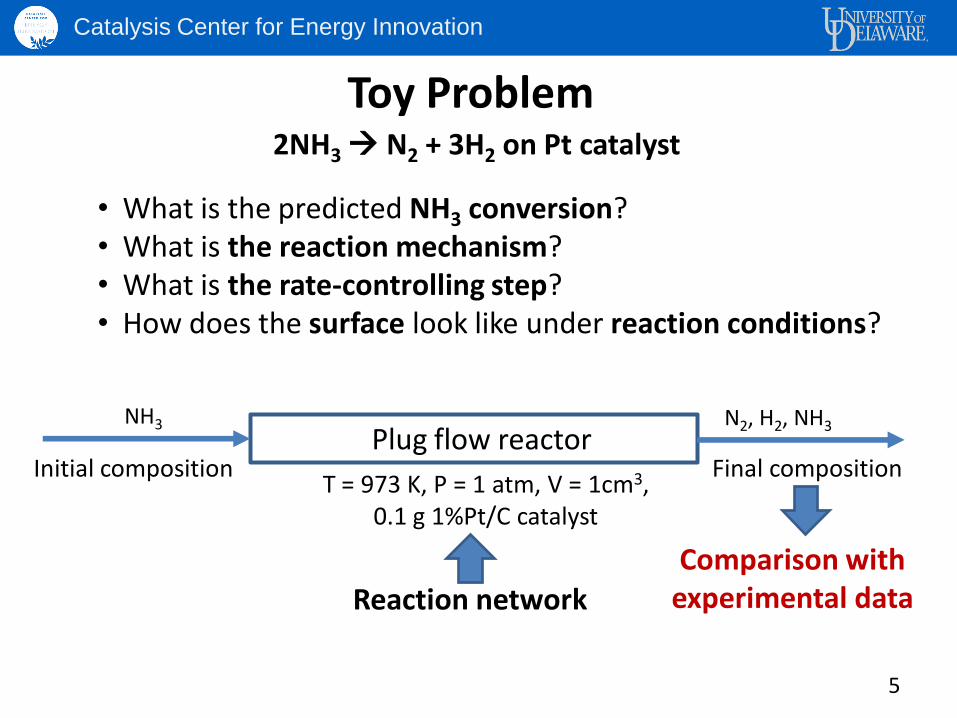
Toy Problem
NH3
Plug flow reactor N2, H2, NH3
T = 973 K, P = 1 atm, V = 1cm3, 0.1 g 1%Pt/C catalyst
Initial composition Final composition
Reaction network
2NH3 N2 + 3H2 on Pt catalyst
Comparison with experimental data
• What is the predicted NH3 conversion?
• What is the reaction mechanism? • What is the rate-controlling step? • How does the surface look like under reaction conditions?
Catalysis Center for Energy Innovation
6
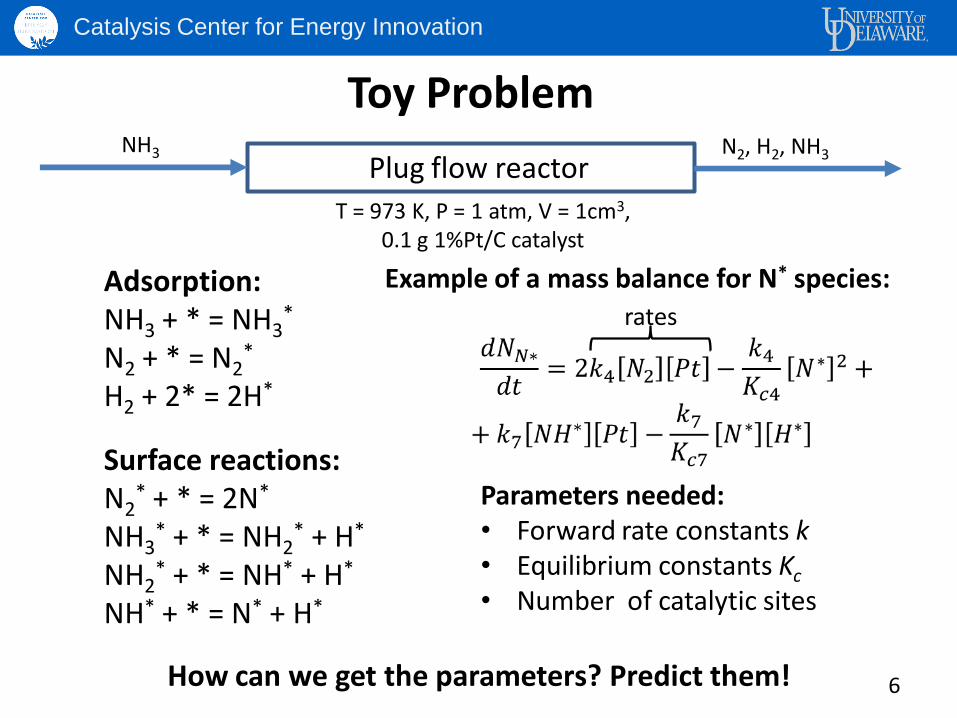
Toy Problem NH3
Plug flow reactor N2, H2, NH3
T = 973 K, P = 1 atm, V = 1cm3, 0.1 g 1%Pt/C catalyst
Adsorption: NH3 + * = NH3
*
N2 + * = N2*
H2 + 2* = 2H*
Surface reactions: N2
* + * = 2N*
NH3* + * = NH2
* + H*
NH2* + * = NH* + H*
NH* + * = N* + H*
Example of a mass balance for N* species:
Parameters needed: • Forward rate constants k • Equilibrium constants Kc • Number of catalytic sites
How can we get the parameters? Predict them!
rates
Catalysis Center for Energy Innovation
7
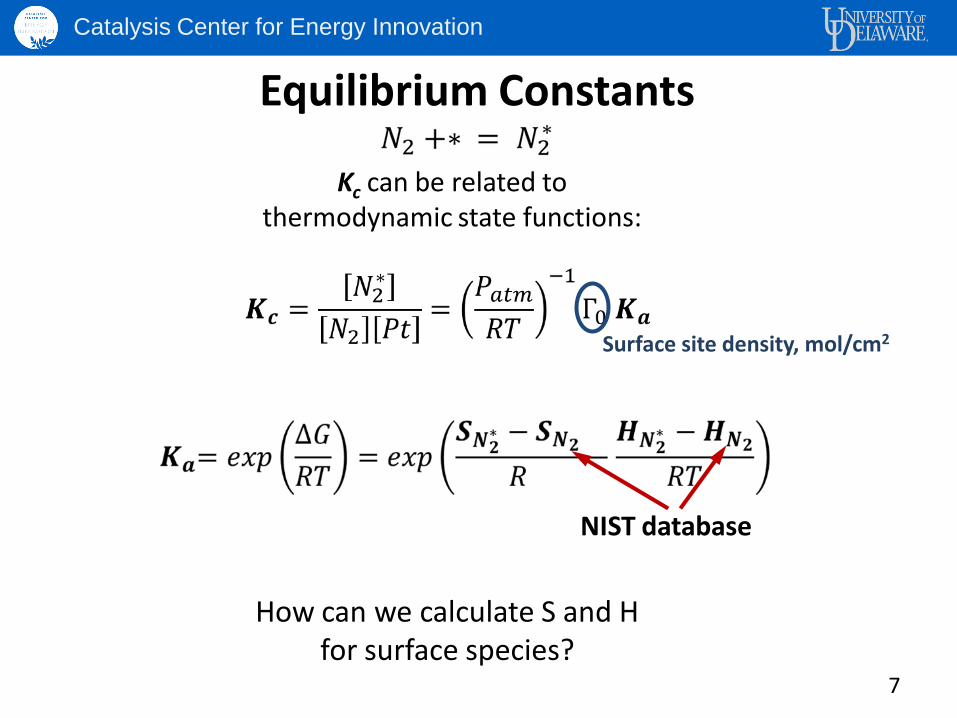
Equilibrium Constants
Kc can be related to thermodynamic state functions:
Surface site density, mol/cm2
NIST database
How can we calculate S and H for surface species?
Catalysis Center for Energy Innovation
8
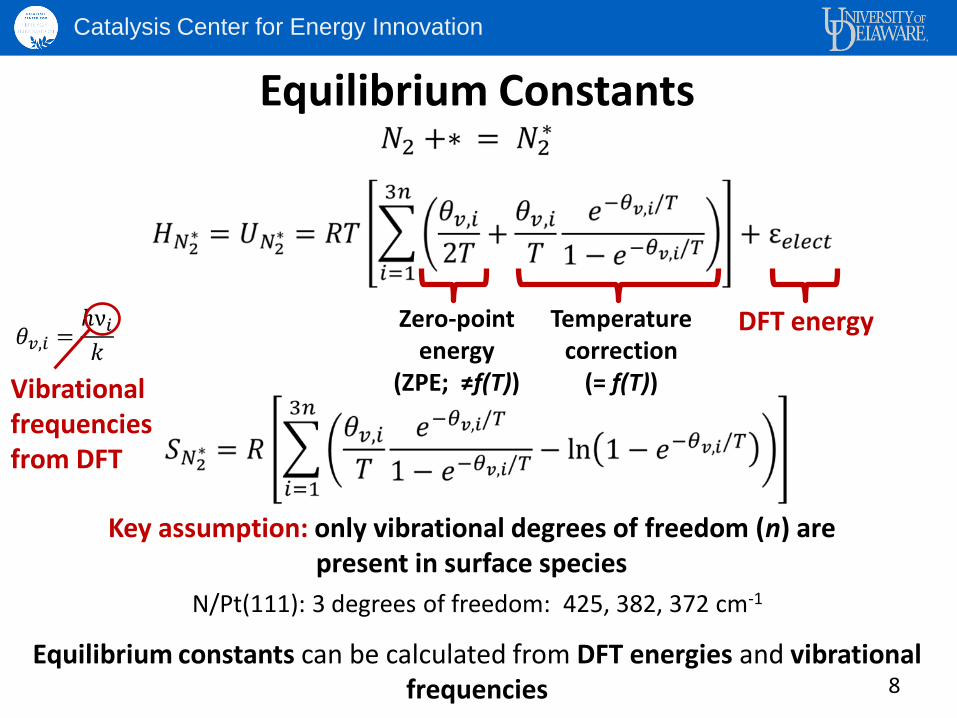
Equilibrium Constants
Equilibrium constants can be calculated from DFT energies and vibrational frequencies
Zero-point energy
(ZPE; ≠f(T))
Temperature correction
(= f(T))
DFT energy
Vibrational frequencies from DFT
Key assumption: only vibrational degrees of freedom (n) are present in surface species
N/Pt(111): 3 degrees of freedom: 425, 382, 372 cm-1
Catalysis Center for Energy Innovation
9
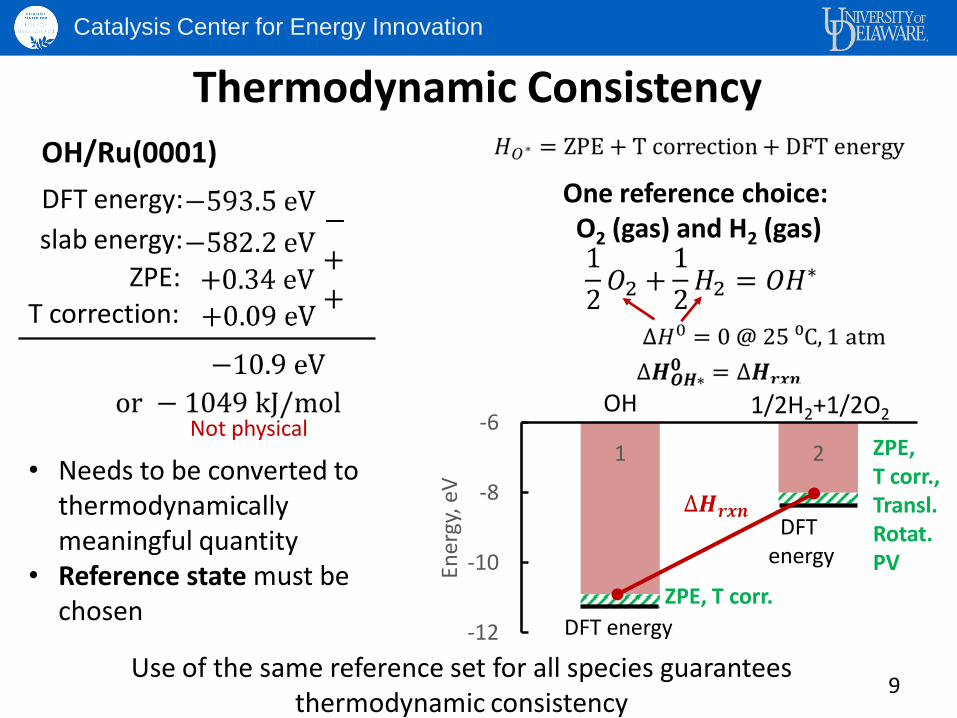
Thermodynamic Consistency
OH/Ru(0001)
DFT energy:
slab energy:
ZPE: T correction:
• Needs to be converted to thermodynamically meaningful quantity
• Reference state must be chosen
One reference choice: O2 (gas) and H2 (gas)
Not physical
Use of the same reference set for all species guarantees thermodynamic consistency
-12
-10
-8
-6
1 2 En
ergy
, eV
1/2H2+1/2O2 OH
DFT energy
DFT energy
ZPE, T corr.
ZPE, T corr., Transl. Rotat. PV
Catalysis Center for Energy Innovation
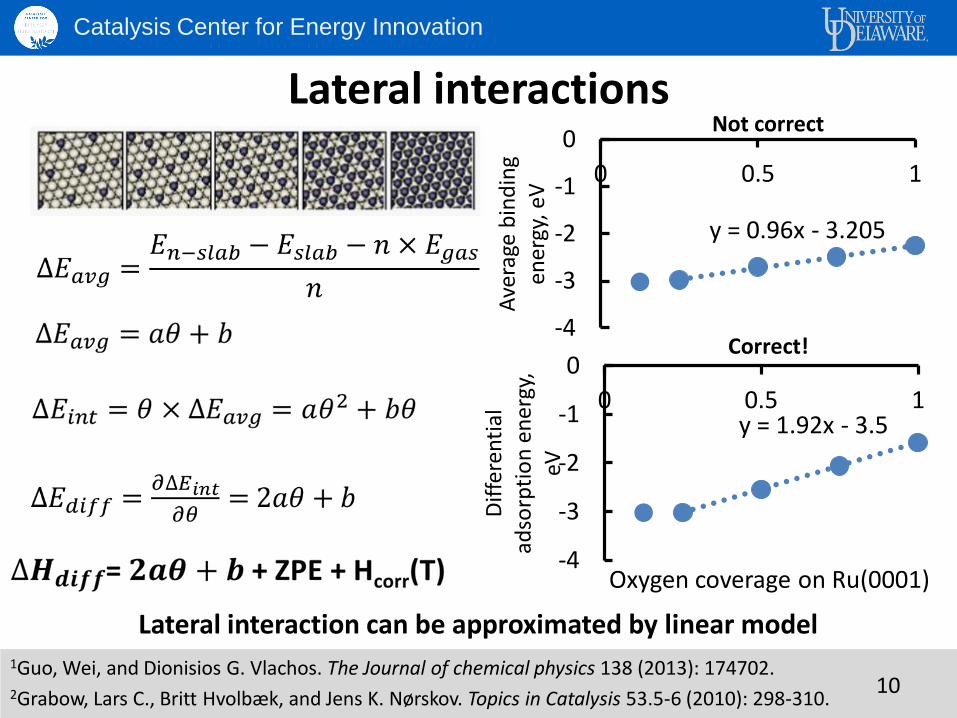
Lateral interactions
1Guo, Wei, and Dionisios G. Vlachos. The Journal of chemical physics 138 (2013): 174702. 2Grabow, Lars C., Britt Hvolbæk, and Jens K. Nørskov. Topics in Catalysis 53.5-6 (2010): 298-310.
10
y = 0.96x - 3.205
-4
-3
-2
-1
0
0 0.5 1
Ave
rage
bin
din
g en
ergy
, eV
y = 1.92x - 3.5
-4
-3
-2
-1
0
0 0.5 1
Dif
fere
nti
al
adso
rpti
on
en
ergy
, eV
Oxygen coverage on Ru(0001)
Not correct
Correct!
Lateral interaction can be approximated by linear model
Catalysis Center for Energy Innovation
11
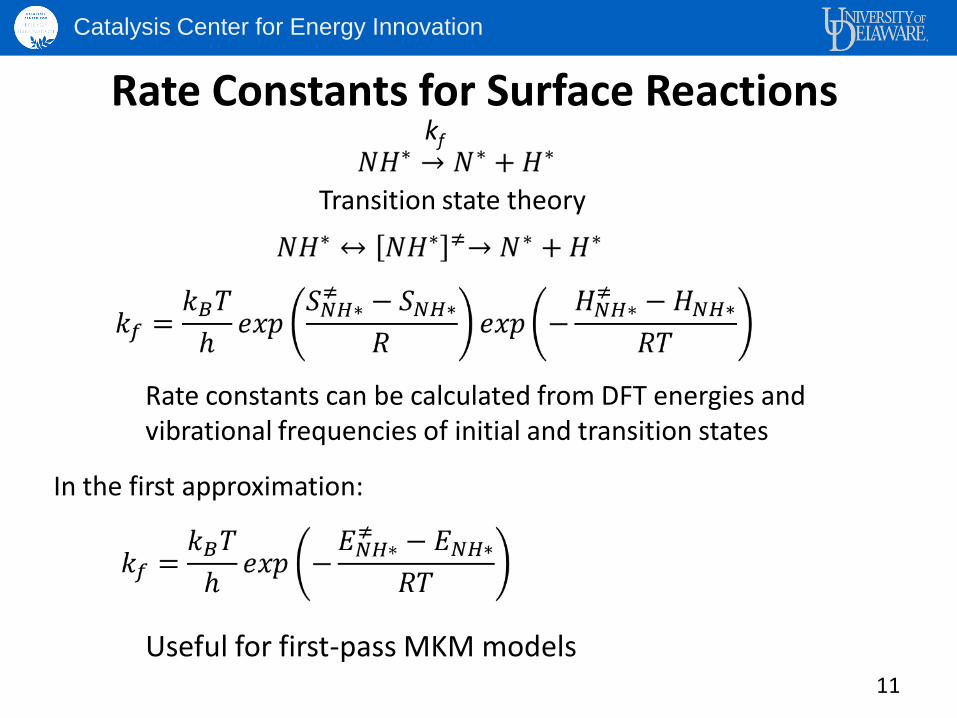
Rate Constants for Surface Reactions
Transition state theory
kf
Rate constants can be calculated from DFT energies and vibrational frequencies of initial and transition states
In the first approximation:
Useful for first-pass MKM models
Catalysis Center for Energy Innovation
12
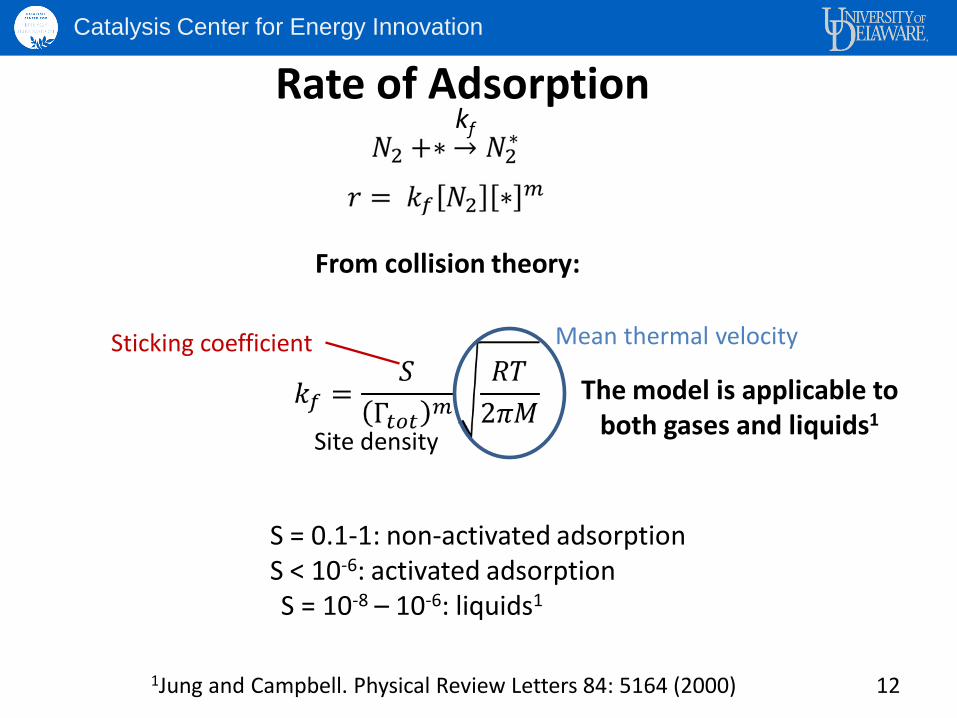
Rate of Adsorption kf
From collision theory:
Mean thermal velocity Sticking coefficient
The model is applicable to both gases and liquids1
1Jung and Campbell. Physical Review Letters 84: 5164 (2000)
S = 0.1-1: non-activated adsorption S < 10-6: activated adsorption S = 10-8 – 10-6: liquids1
Site density
Catalysis Center for Energy Innovation
13
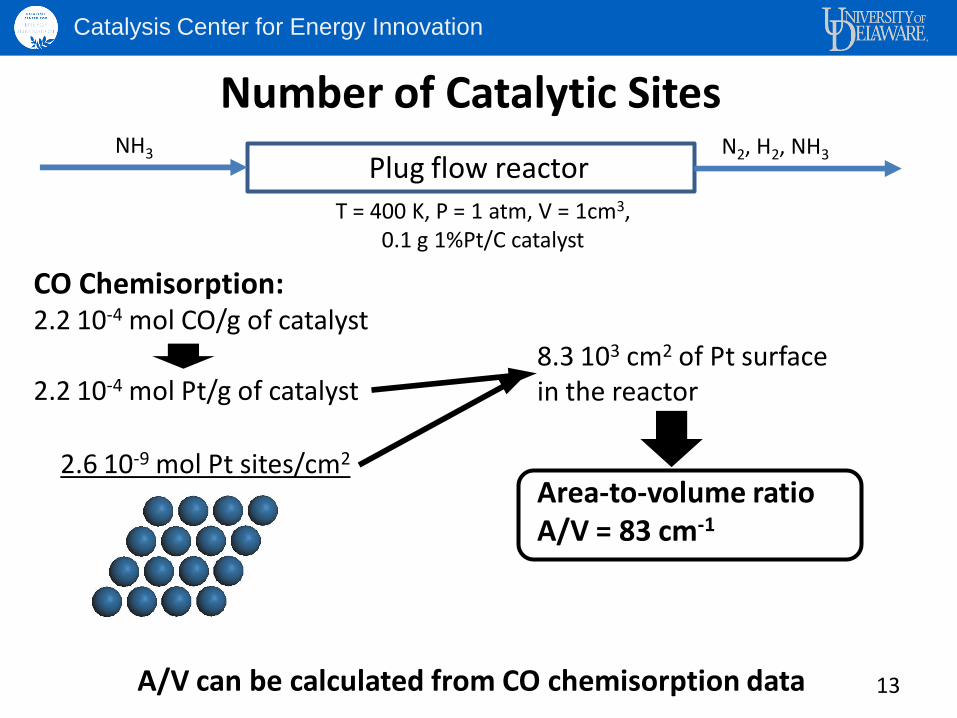
Number of Catalytic Sites NH3
Plug flow reactor N2, H2, NH3
T = 400 K, P = 1 atm, V = 1cm3, 0.1 g 1%Pt/C catalyst
CO Chemisorption: 2.2 10-4 mol CO/g of catalyst
2.2 10-4 mol Pt/g of catalyst
2.6 10-9 mol Pt sites/cm2
8.3 103 cm2 of Pt surface in the reactor
Area-to-volume ratio A/V = 83 cm-1
A/V can be calculated from CO chemisorption data
Catalysis Center for Energy Innovation
14
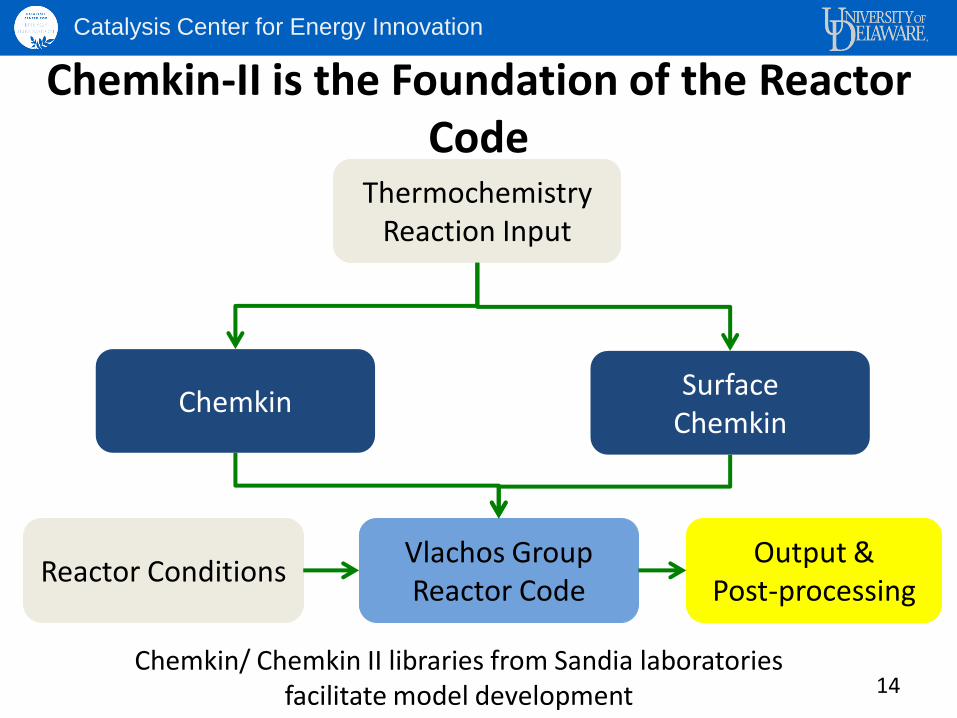
Chemkin-II is the Foundation of the Reactor Code
Chemkin Surface
Chemkin
Thermochemistry Reaction Input
Reactor Conditions Vlachos Group Reactor Code
Output & Post-processing
Chemkin/ Chemkin II libraries from Sandia laboratories facilitate model development
Catalysis Center for Energy Innovation
15
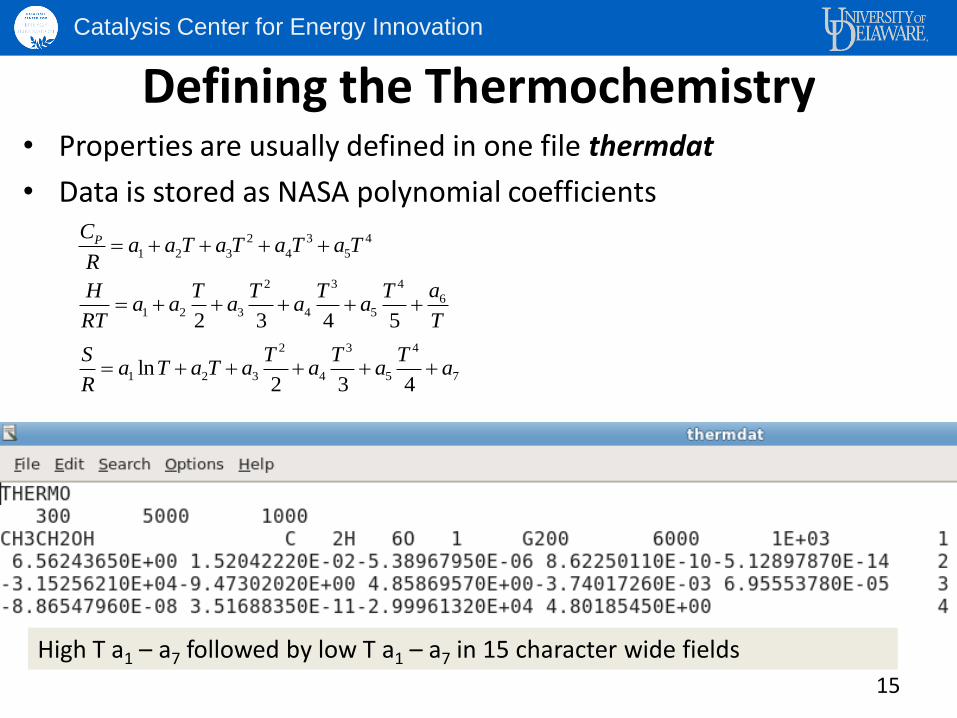
Defining the Thermochemistry • Properties are usually defined in one file thermdat
• Data is stored as NASA polynomial coefficients
2 3 4
1 2 3 4 5PC
a a T a T a T a TR
2 3 4
61 2 3 4 5
2 3 4 5
aH T T T Ta a a a a
RT T
2 3 4
1 2 3 4 5 7ln2 3 4
S T T Ta T a T a a a a
R
High T a1 – a7 followed by low T a1 – a7 in 15 character wide fields
Catalysis Center for Energy Innovation
16
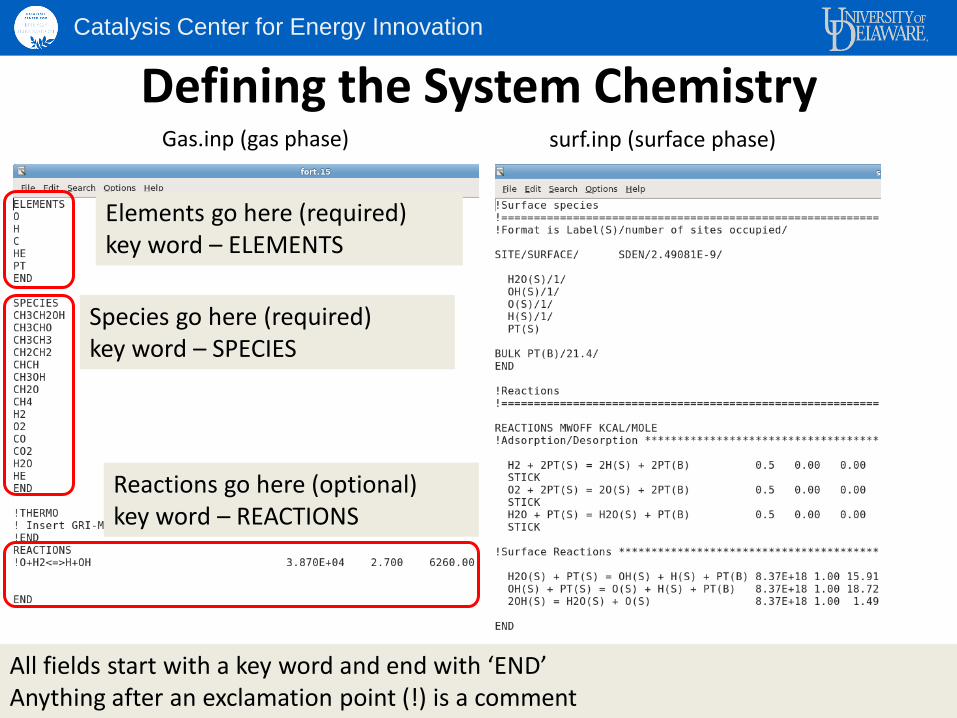
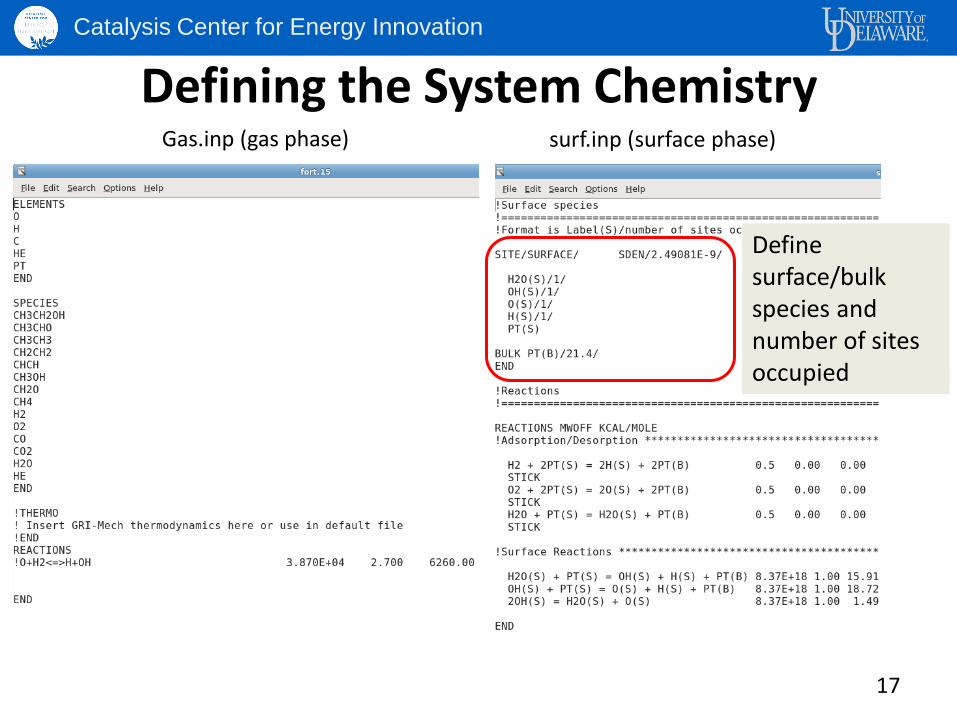
Defining the System Chemistry Gas.inp (gas phase)
Elements go here (required) key word – ELEMENTS
Species go here (required) key word – SPECIES
Reactions go here (optional) key word – REACTIONS
All fields start with a key word and end with ‘END’ Anything after an exclamation point (!) is a comment
surf.inp (surface phase)
Catalysis Center for Energy Innovation
17
Defining the System Chemistry Gas.inp (gas phase) surf.inp (surface phase)
Define surface/bulk species and number of sites occupied
Catalysis Center for Energy Innovation
18
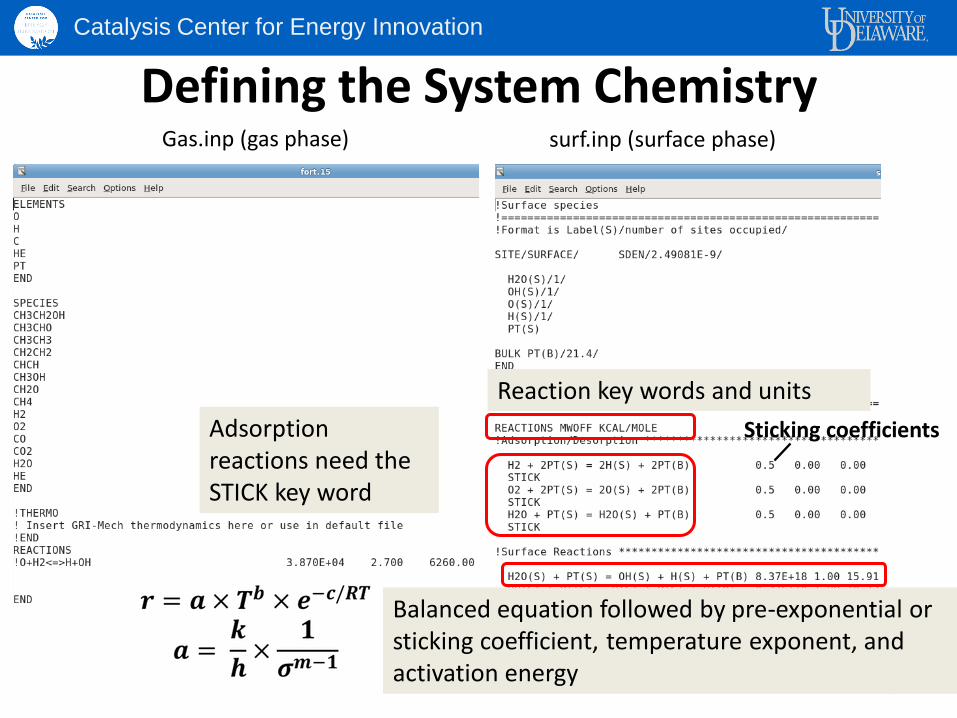
Defining the System Chemistry Gas.inp (gas phase) surf.inp (surface phase)
Adsorption reactions need the STICK key word
Reaction key words and units
Balanced equation followed by pre-exponential or sticking coefficient, temperature exponent, and activation energy
Sticking coefficients
Catalysis Center for Energy Innovation
19
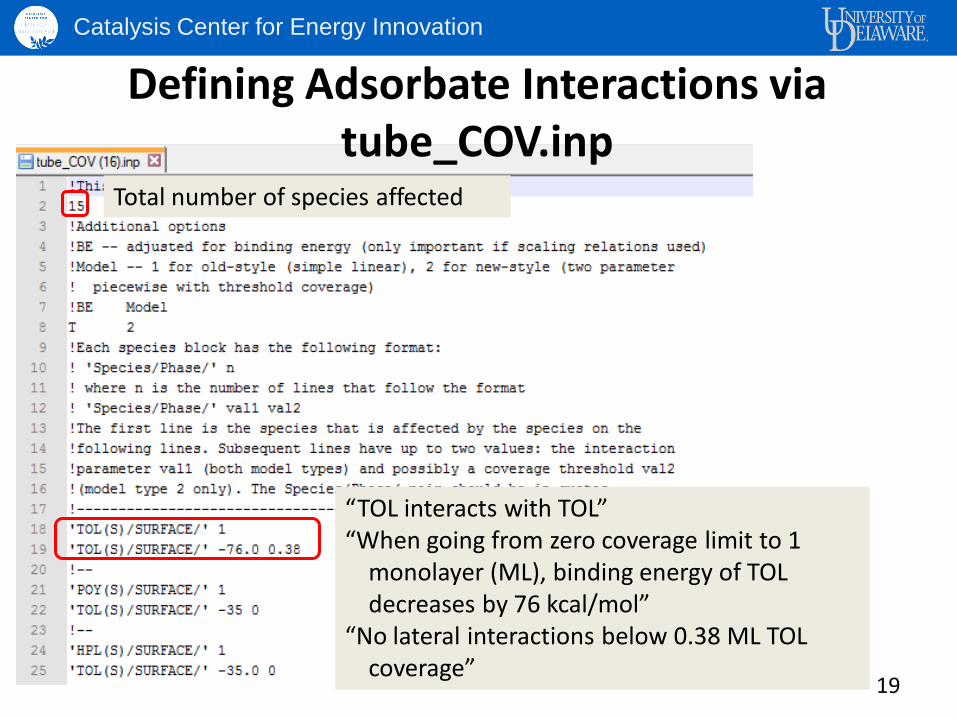
Defining Adsorbate Interactions via tube_COV.inp
Total number of species affected
“TOL interacts with TOL” “When going from zero coverage limit to 1
monolayer (ML), binding energy of TOL decreases by 76 kcal/mol”
“No lateral interactions below 0.38 ML TOL coverage”
Catalysis Center for Energy Innovation
20
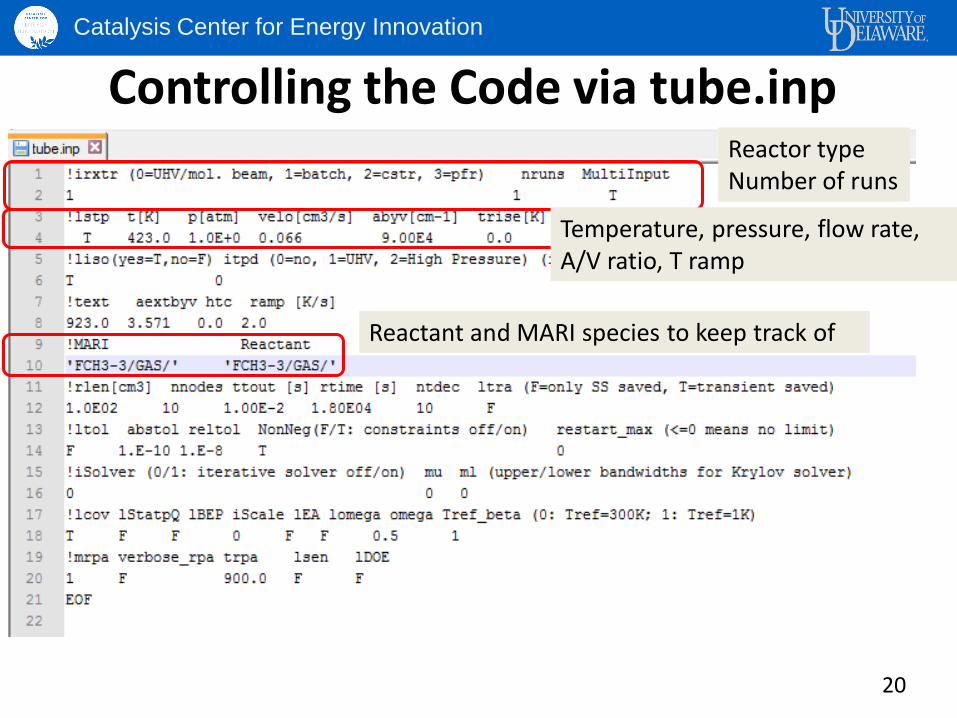
Controlling the Code via tube.inp Reactor type Number of runs
Temperature, pressure, flow rate, A/V ratio, T ramp
Reactant and MARI species to keep track of
Catalysis Center for Energy Innovation
21
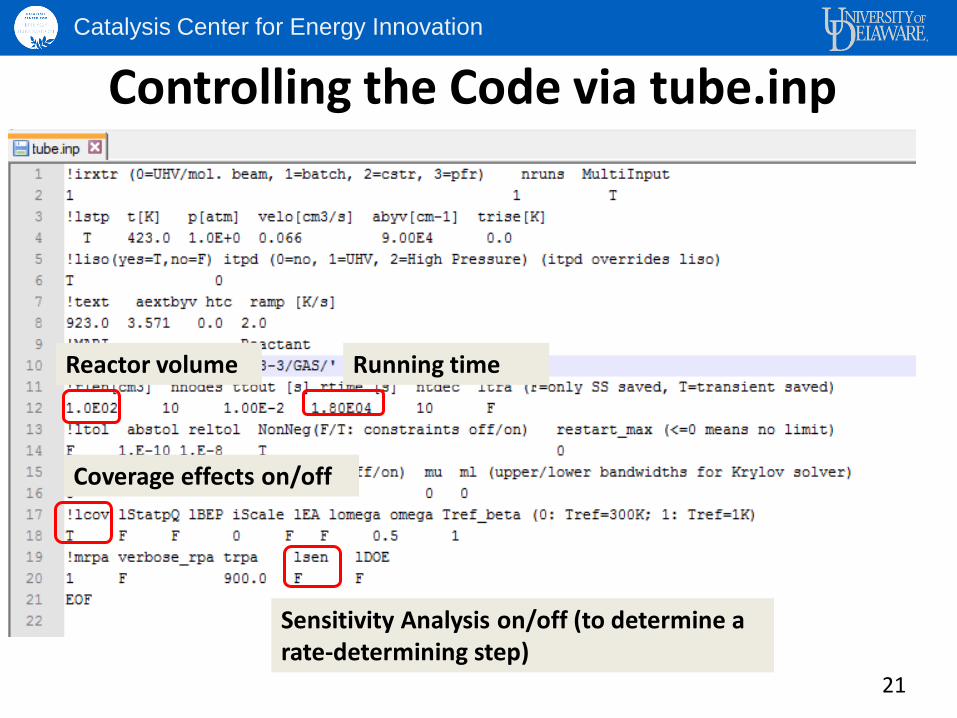
Controlling the Code via tube.inp
Reactor volume Running time
Coverage effects on/off
Sensitivity Analysis on/off (to determine a rate-determining step)
Catalysis Center for Energy Innovation
22
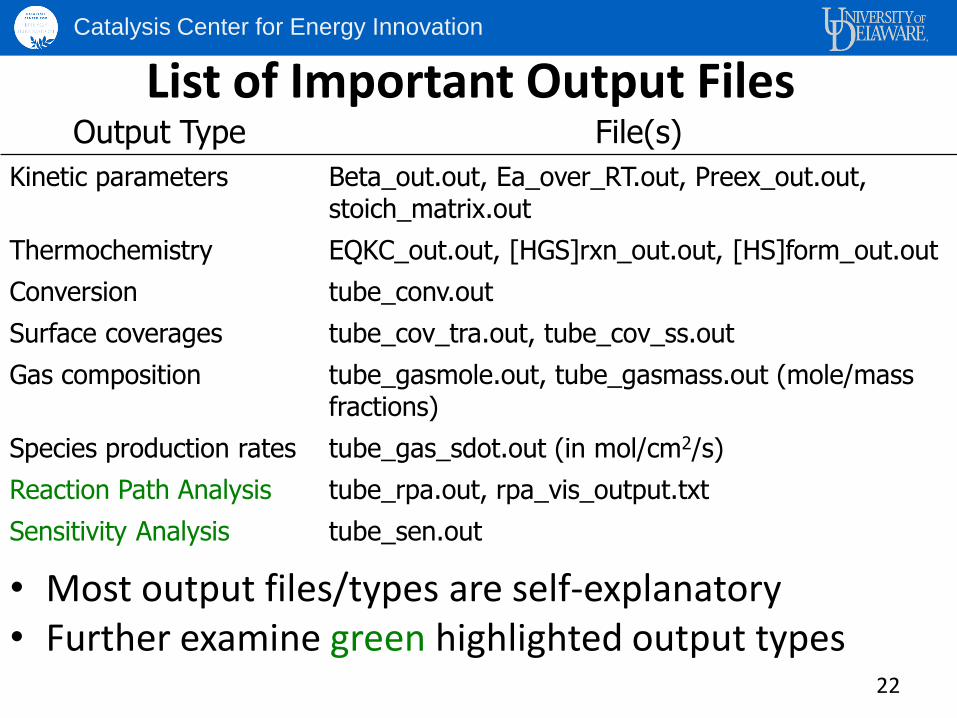
List of Important Output Files
• Most output files/types are self-explanatory • Further examine green highlighted output types
Output Type File(s)
Kinetic parameters Beta_out.out, Ea_over_RT.out, Preex_out.out, stoich_matrix.out
Thermochemistry EQKC_out.out, [HGS]rxn_out.out, [HS]form_out.out
Conversion tube_conv.out
Surface coverages tube_cov_tra.out, tube_cov_ss.out
Gas composition tube_gasmole.out, tube_gasmass.out (mole/mass fractions)
Species production rates tube_gas_sdot.out (in mol/cm2/s)
Reaction Path Analysis tube_rpa.out, rpa_vis_output.txt
Sensitivity Analysis tube_sen.out
Catalysis Center for Energy Innovation
23
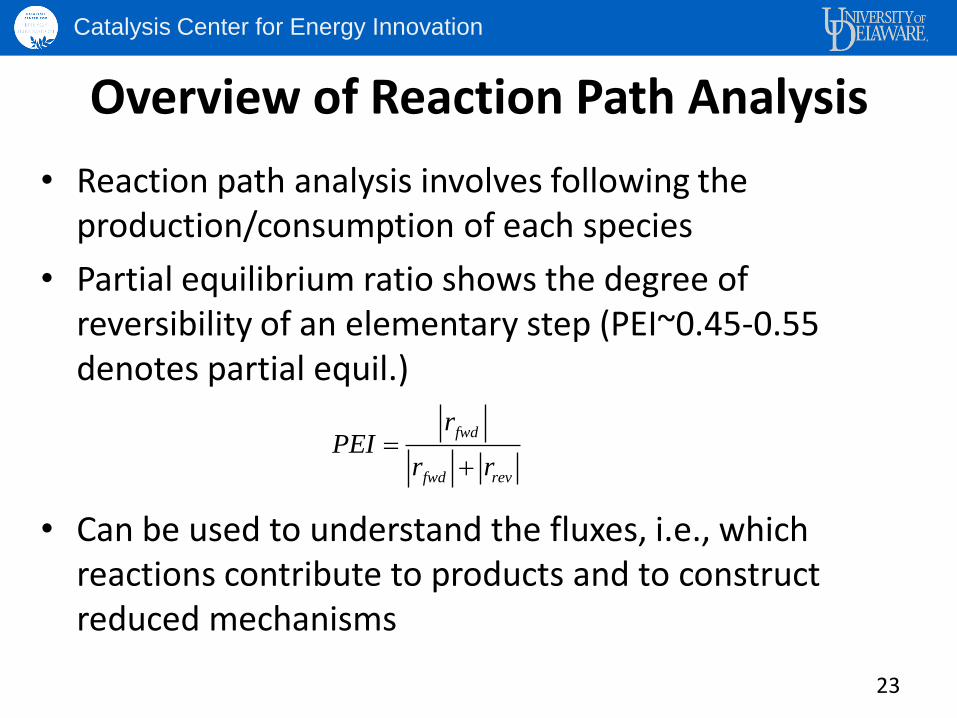
Overview of Reaction Path Analysis
• Reaction path analysis involves following the production/consumption of each species
• Partial equilibrium ratio shows the degree of reversibility of an elementary step (PEI~0.45-0.55 denotes partial equil.)
• Can be used to understand the fluxes, i.e., which reactions contribute to products and to construct reduced mechanisms
fwd
fwd rev
rPEI
r r
Catalysis Center for Energy Innovation
24
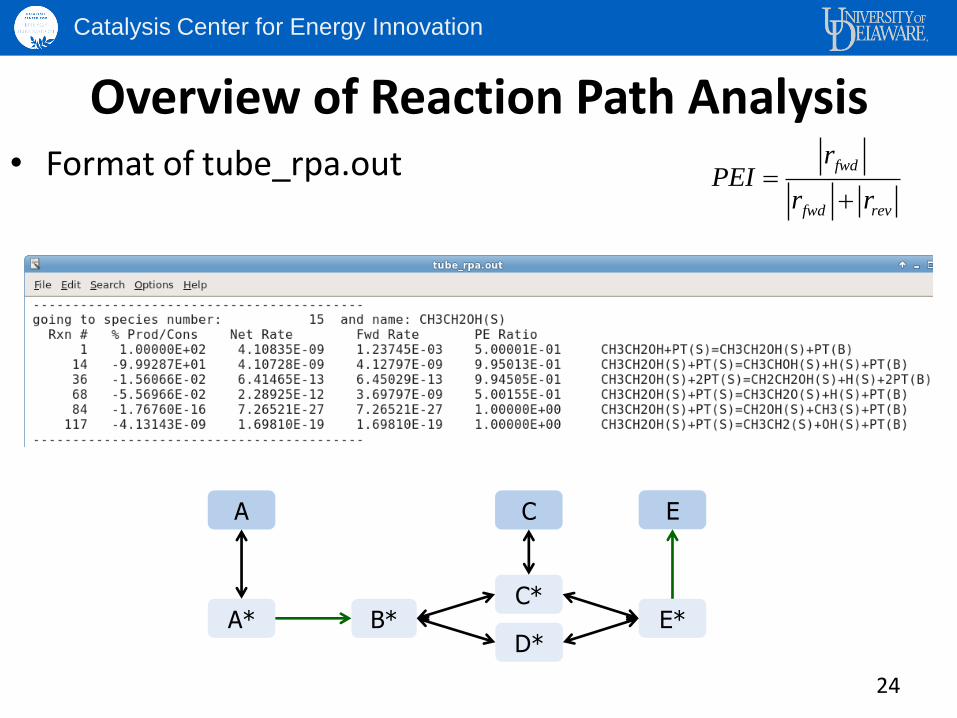
Overview of Reaction Path Analysis • Format of tube_rpa.out
fwd
fwd rev
rPEI
r r
A
A*
C
B* C*
D* E*
E
Catalysis Center for Energy Innovation
-0.05 0 0.05 0.1 0.15 0.2 0.25 0.3 0.35
300 °C340 °C
Normalized Sensitivity Coefficient
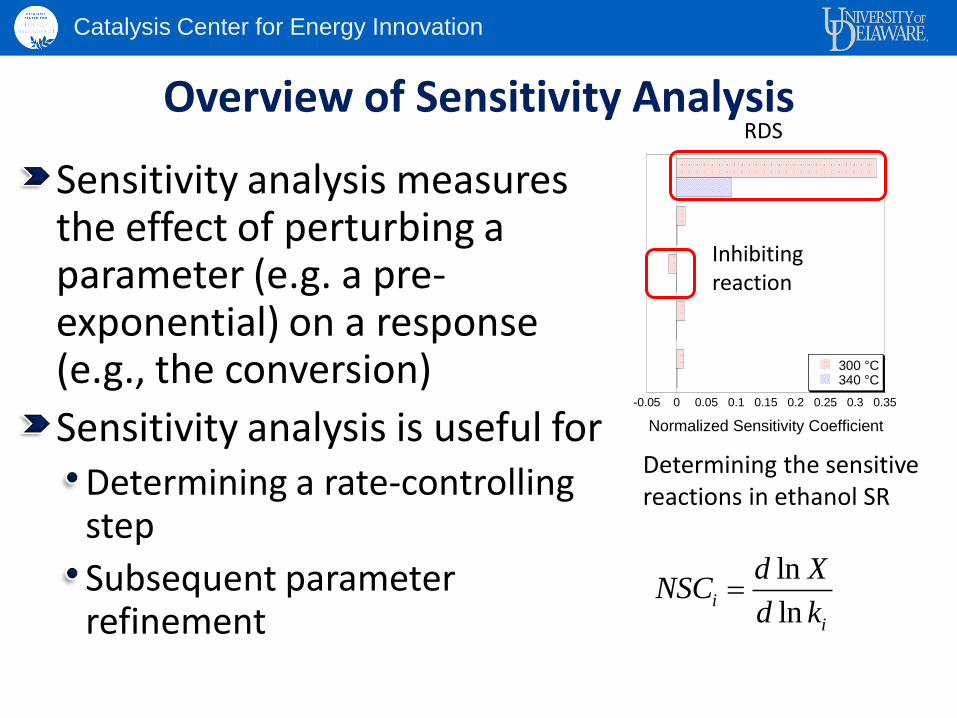
Overview of Sensitivity Analysis
Sensitivity analysis measures the effect of perturbing a parameter (e.g. a pre-exponential) on a response (e.g., the conversion)
Sensitivity analysis is useful for Determining a rate-controlling step
Subsequent parameter refinement
ln
lni
i
d XNSC
d k
Determining the sensitive reactions in ethanol SR
RDS
Inhibiting reaction
Catalysis Center for Energy Innovation
Running chemkin
Copy input files to your machine
cp –r ./software/Workshop14/Tutorials/Tutorial4/chemkin_toy .
Type chmod +x chemkin.sh
Launch chemkin by typing ./chemkin.sh
Catalysis Center for Energy Innovation
Output Files to Look For OUT.d directory
1. tube_conv.out: conversion and reaction rate 2. tube_gasmole_ss.out: gas composition along the reactor 3. tube_cov_ss.out: surface coverages along the reactor 4. tube_rpa.out: Reaction path analysis output
Catalysis Center for Energy Innovation
Running Sensitivity Analysis
1. /INP.d/tube.inp: set lsen = T 2. ../chemkin.sh: run the model 3. /OUT.d/tube_sen.out: output file 4. Find the reactant; the highest absolute value corresponds to
the rate-controlling step
Catalysis Center for Energy Innovation
Things to Play With
1. Vary temperature, pressure, reactor volume and see what effect it has on conversion, rates, and coverages
2. Turn off lateral interactions, reduce the N22N barrier, and increase the pressure. What effect it has on coverages?
3. Change the feed composition; flow rate and see what effect it has on the output.
4. Run the sensitivity analysis and explore the changes in a rate-controlling step, when elementary barriers are perturbed
Catalysis Center for Energy Innovation
Advanced Exercises
1. In a first approximation, energy barriers can be linearly related to reaction energies via BEP relationships. The relationships are given in INP.d/BEP.inp. • Set lBEP = T in tube.inp file, and see how different the
results are compared to fully ab initio, DFT-based case.
2. All reaction energetics can be related to C, H, O, N atomic binding energies, so that reactant convertion can be plotted as a function of only 2 descriptors. In this way, optimal catalyst properties can be predicted. Alter Scaling.inp file following instructions in it, assuming that binding energies of NHx species are linearly related to the N binding energy with the slope (3-x)/3.