Embed Size (px)
Citation preview
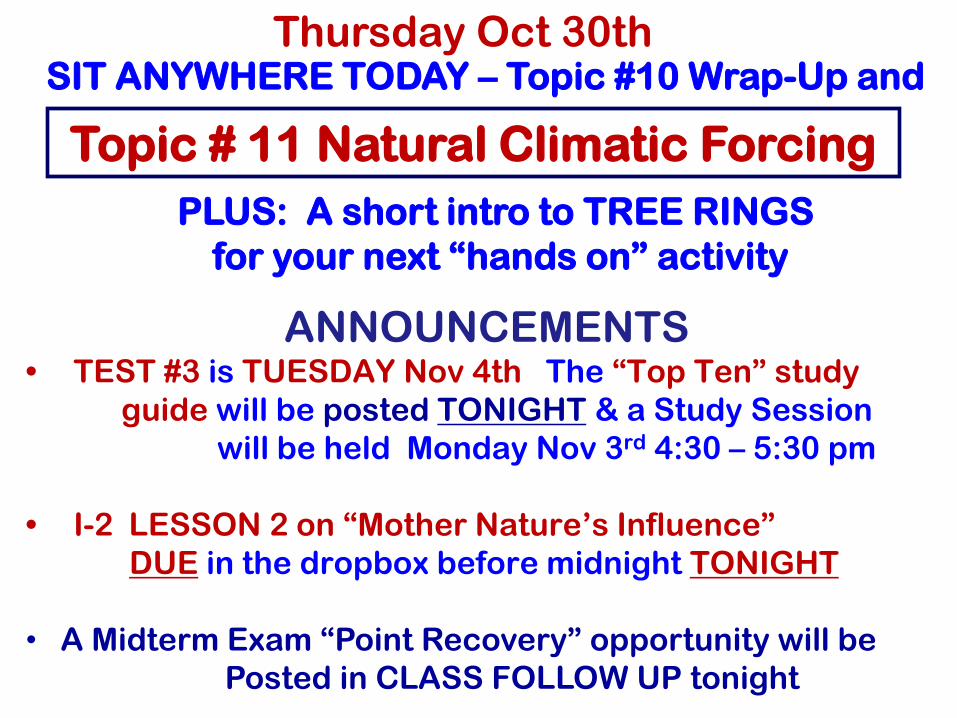
Topic # 11 Natural Climatic Forcing
Thursday Oct 30th SIT ANYWHERE TODAY – Topic #10 Wrap-Up and
ANNOUNCEMENTS • TEST #3 is TUESDAY Nov 4th The “Top Ten” study
guide will be posted TONIGHT & a Study Session
will be held Monday Nov 3rd 4:30 – 5:30 pm
• I-2 LESSON 2 on “Mother Nature’s Influence”
DUE in the dropbox before midnight TONIGHT
• A Midterm Exam “Point Recovery” opportunity will be
Posted in CLASS FOLLOW UP tonight
PLUS: A short intro to TREE RINGS
for your next “hands on” activity
TOPIC #10 (cont.)
“HOW CLIMATE
WORKS”
&
GLOBAL CLIMATE
PATTERNS
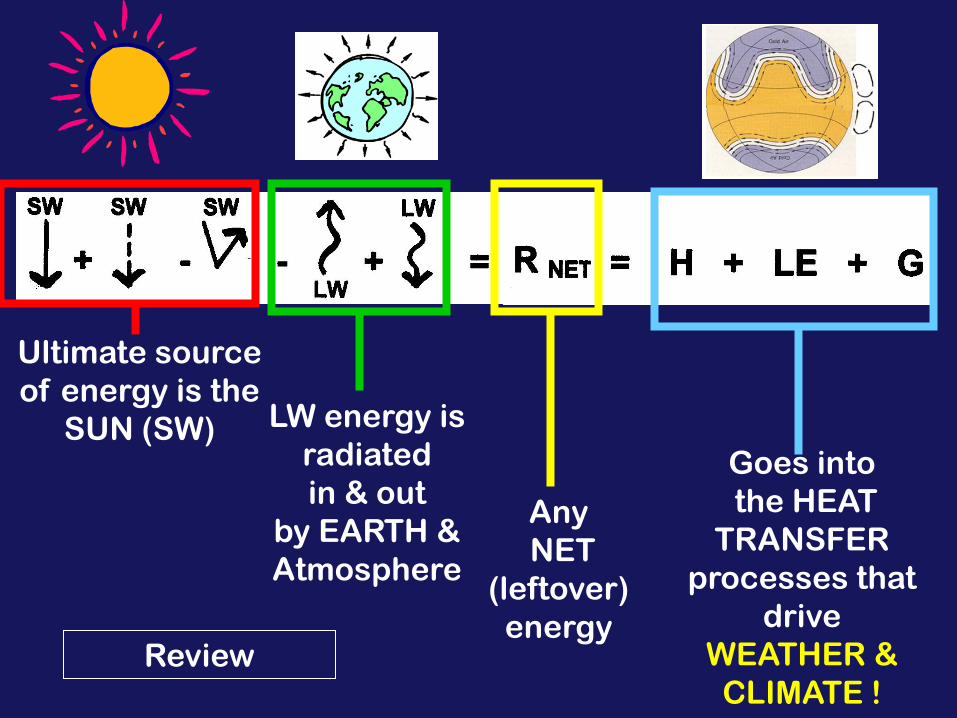
Ultimate source
of energy is the
SUN (SW) LW energy is
radiated
in & out
by EARTH &
Atmosphere
Any
NET
(leftover)
energy
Goes into
the HEAT
TRANSFER
processes that
drive
WEATHER &
CLIMATE ! Review
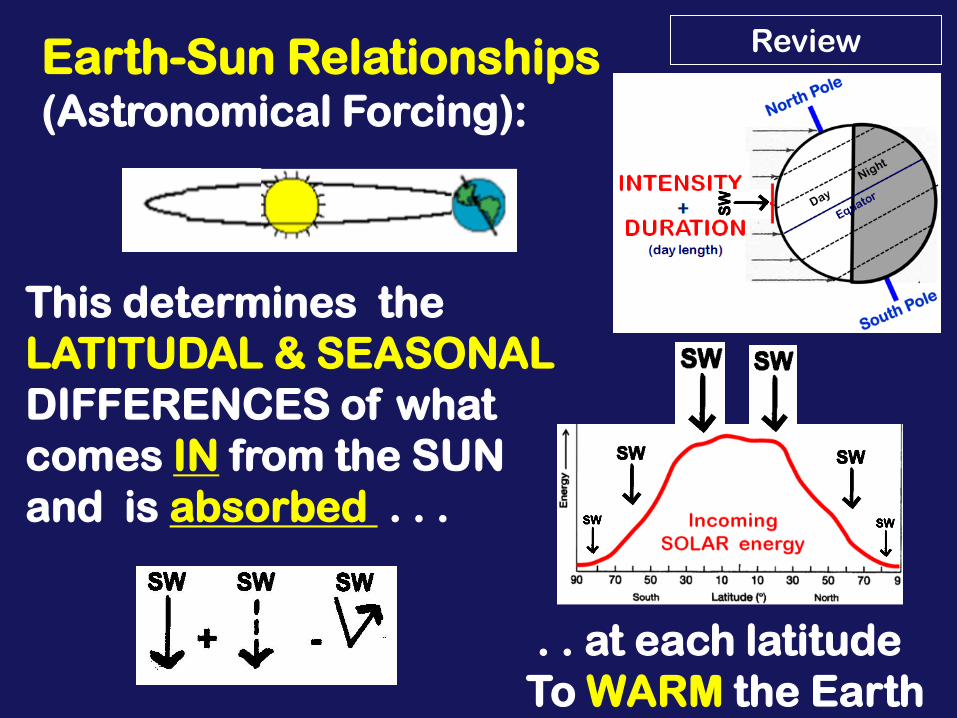
Earth-Sun Relationships (Astronomical Forcing):
Review
This determines the
LATITUDAL & SEASONAL
DIFFERENCES of what
comes IN from the SUN
and is absorbed . . .
. . at each latitude
To WARM the Earth
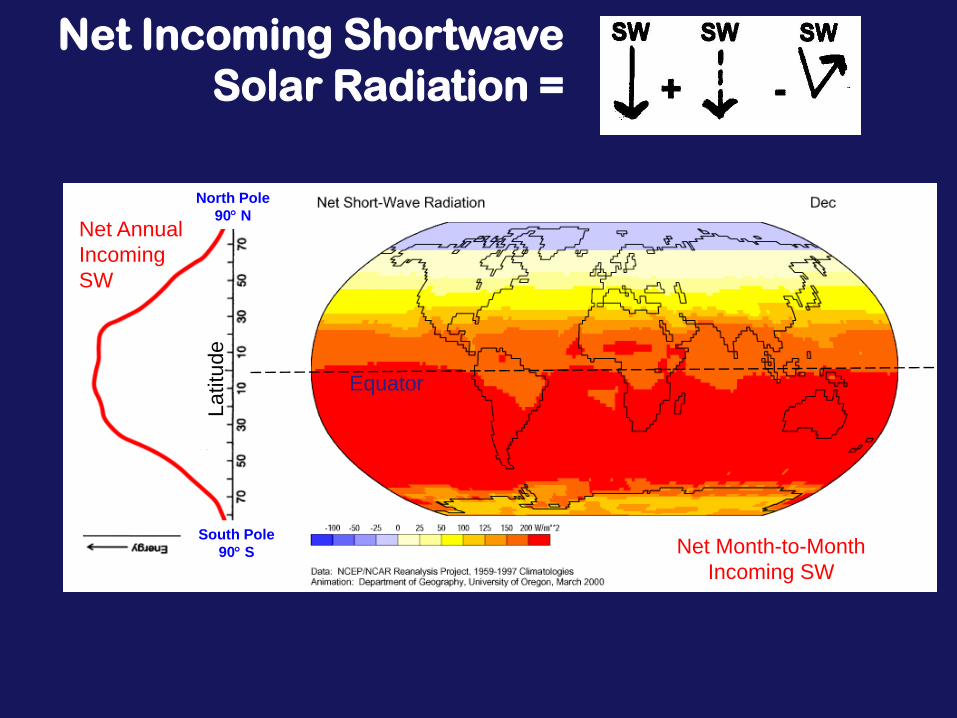
Net Incoming Shortwave
Solar Radiation =
Equator
Net Month-to-Month
Incoming SW
La
titu
de
North Pole
90 N
South Pole
90 S
Net Annual
Incoming
SW
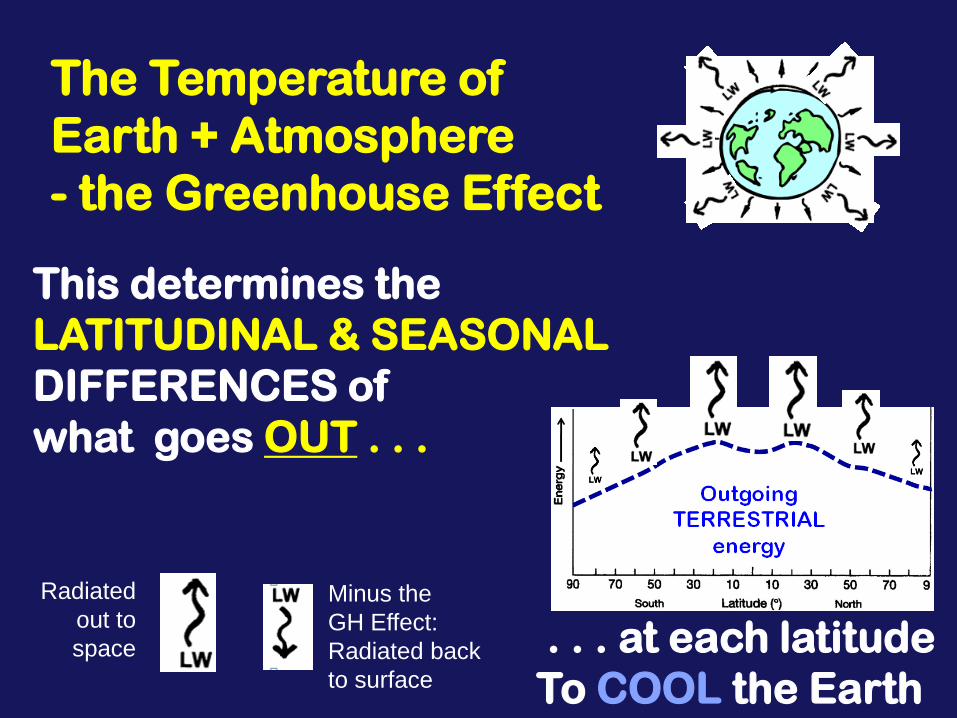
The Temperature of
Earth + Atmosphere
- the Greenhouse Effect
. . . at each latitude
To COOL the Earth
This determines the
LATITUDINAL & SEASONAL
DIFFERENCES of
what goes OUT . . .
Radiated
out to
space
Minus the
GH Effect:
Radiated back
to surface
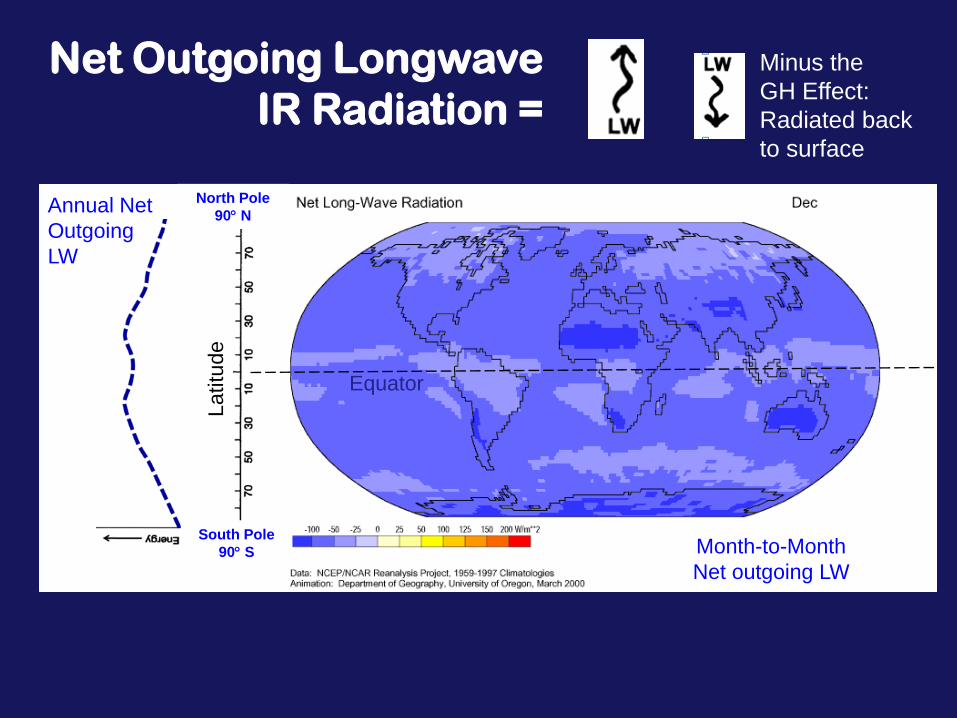
Net Outgoing Longwave
IR Radiation =
Equator
Annual Net
Outgoing
LW
Month-to-Month
Net outgoing LW
La
titu
de
North Pole
90 N
South Pole
90 S
Minus the
GH Effect:
Radiated back
to surface
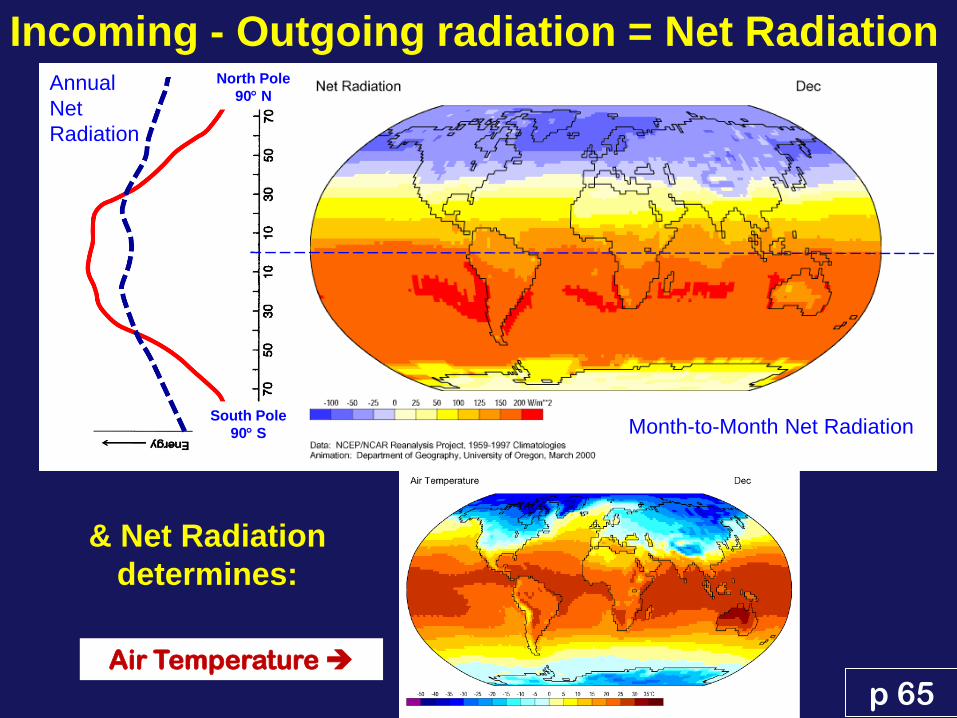
Incoming - Outgoing radiation = Net Radiation
p 65
Equator
Latitu
de
Annual
Net
Radiation
Month-to-Month Net Radiation
North Pole
90 N
South Pole
90 S
Air Temperature
& Net Radiation
determines:
A B
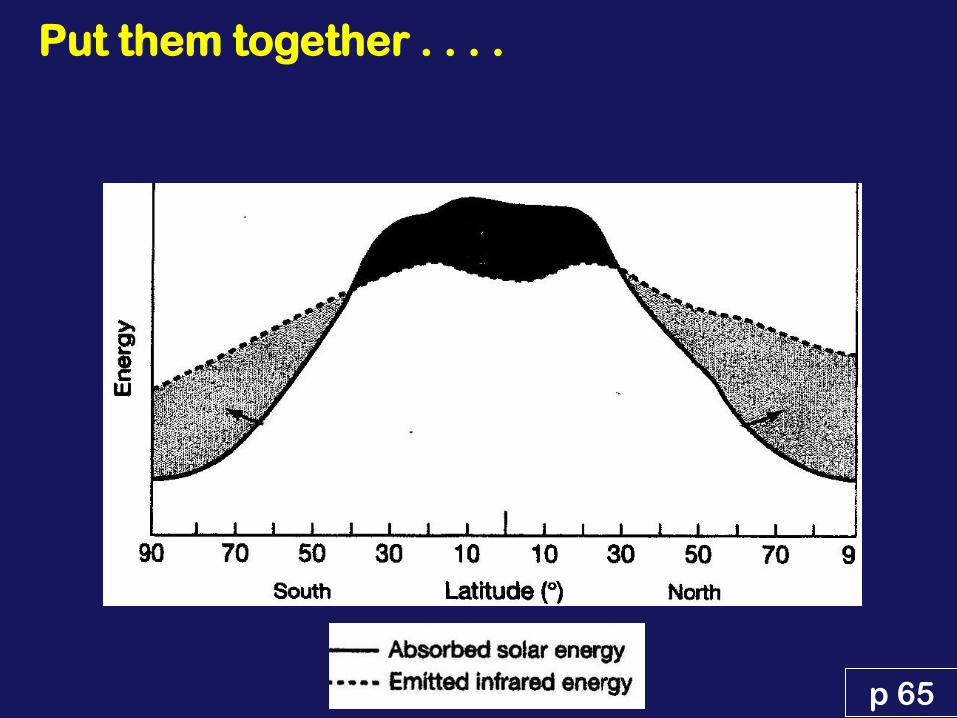
Put them together . . . .
p 65
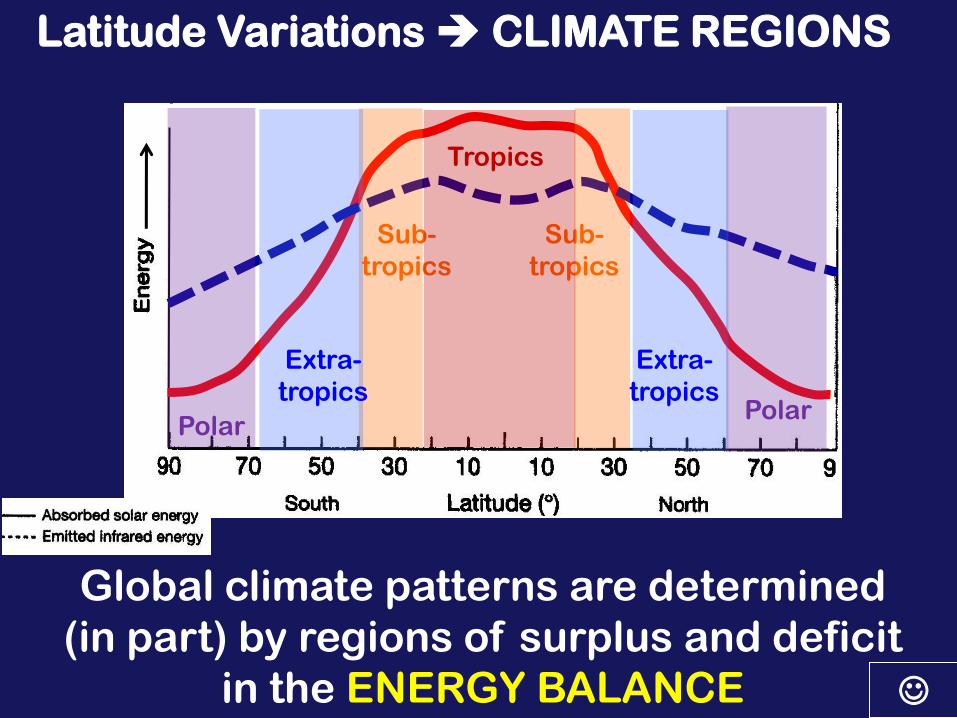
Latitude Variations CLIMATE REGIONS
Global climate patterns are determined
(in part) by regions of surplus and deficit
in the ENERGY BALANCE
Sub-
tropics
Sub-
tropics
Tropics
Extra-
tropics
Extra-
tropics
Polar Polar
p 68
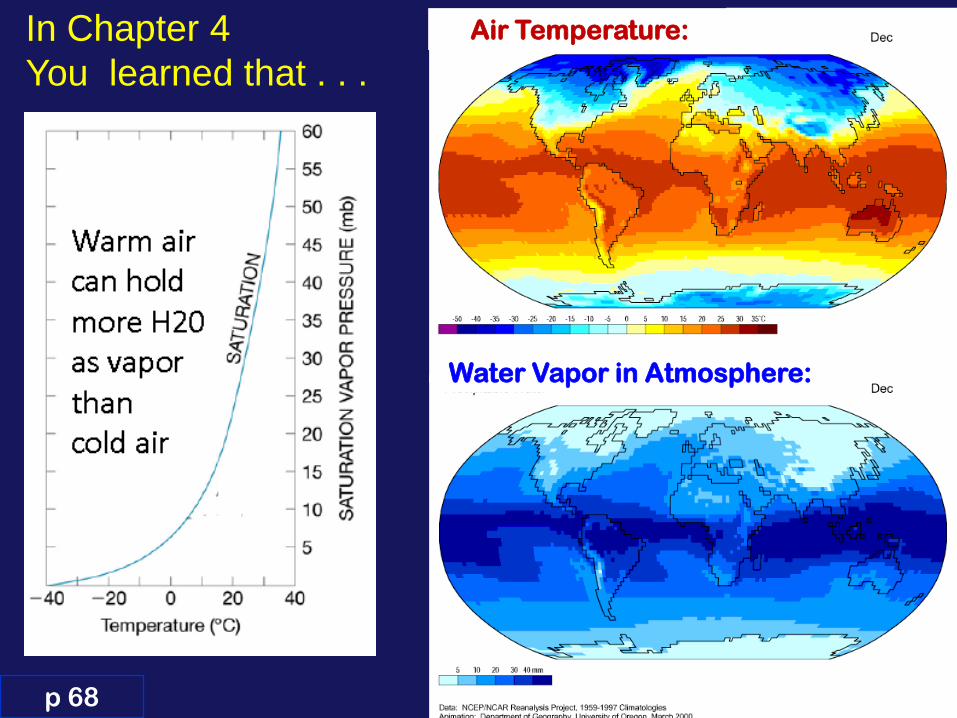
Air Temperature:
Water Vapor in Atmosphere:
In Chapter 4
You learned that . . .
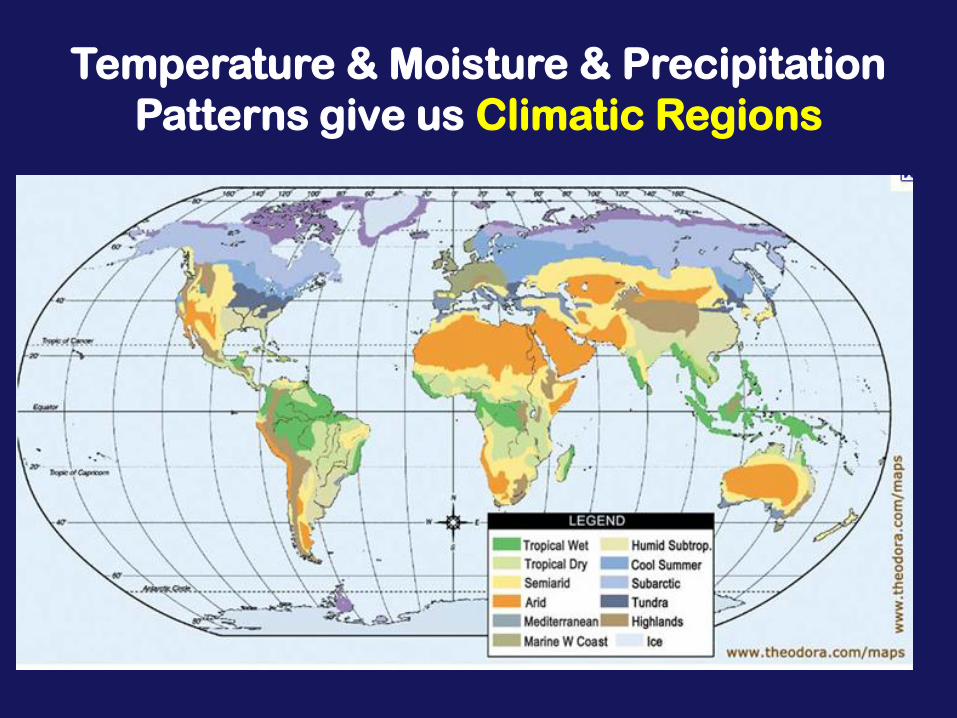
Temperature & Moisture & Precipitation
Patterns give us Climatic Regions
See p 68
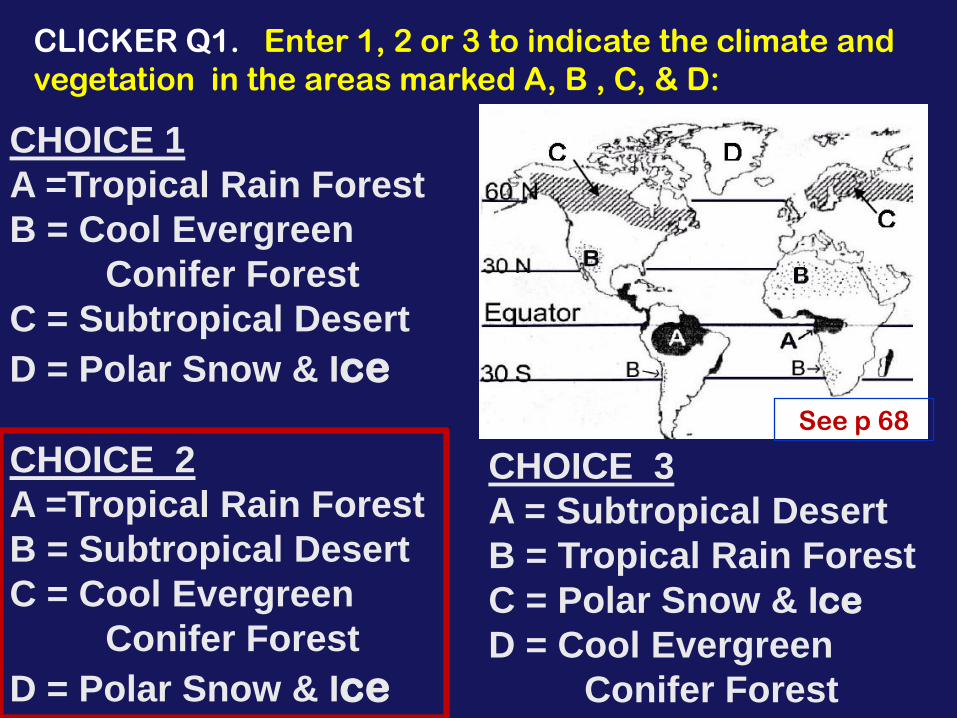
CLICKER Q1. Enter 1, 2 or 3 to indicate the climate and
vegetation in the areas marked A, B , C, & D:
CHOICE 1
A =Tropical Rain Forest
B = Cool Evergreen
Conifer Forest
C = Subtropical Desert
D = Polar Snow & Ice
CHOICE 2
A =Tropical Rain Forest
B = Subtropical Desert
C = Cool Evergreen
Conifer Forest
D = Polar Snow & Ice
CHOICE 3
A = Subtropical Desert
B = Tropical Rain Forest
C = Polar Snow & Ice
D = Cool Evergreen
Conifer Forest
See p 68
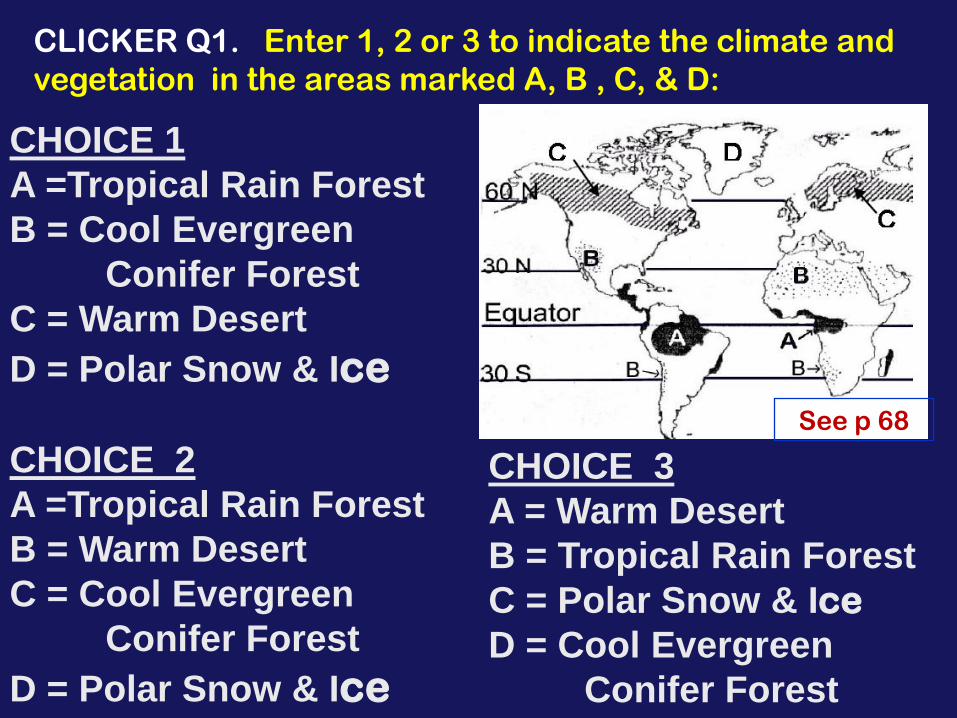
CLICKER Q1. Enter 1, 2 or 3 to indicate the climate and
vegetation in the areas marked A, B , C, & D:
CHOICE 1
A =Tropical Rain Forest
B = Cool Evergreen
Conifer Forest
C = Warm Desert
D = Polar Snow & Ice
CHOICE 2
A =Tropical Rain Forest
B = Warm Desert
C = Cool Evergreen
Conifer Forest
D = Polar Snow & Ice
CHOICE 3
A = Warm Desert
B = Tropical Rain Forest
C = Polar Snow & Ice
D = Cool Evergreen
Conifer Forest
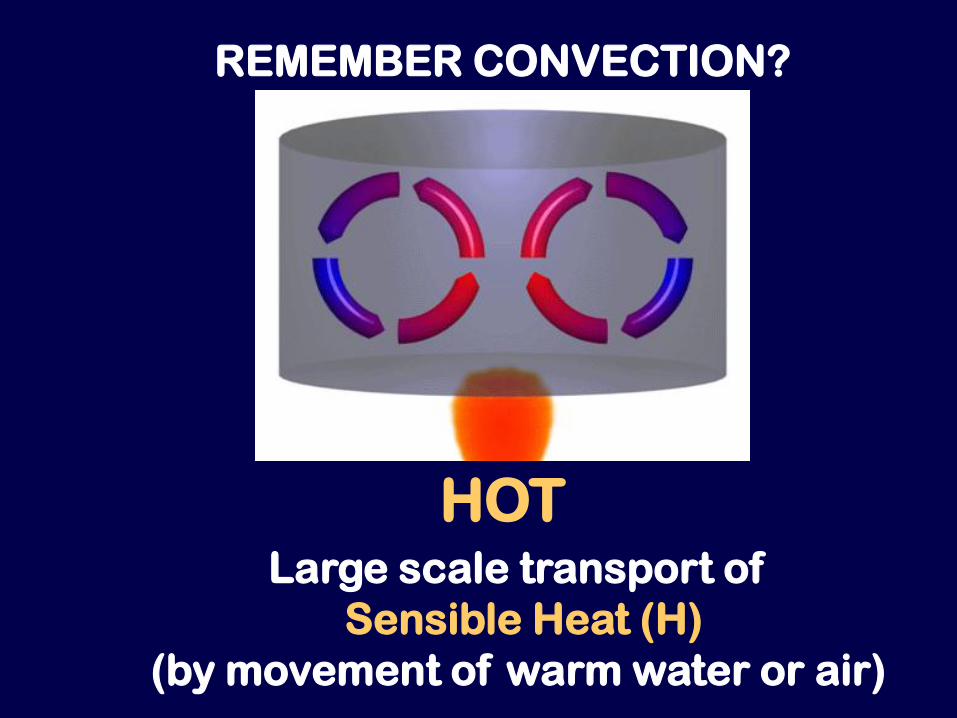
REMEMBER CONVECTION?
HOT Large scale transport of
Sensible Heat (H)
(by movement of warm water or air)
COLD
POLAR
REGIONS
COLD
POLAR
REGIONS
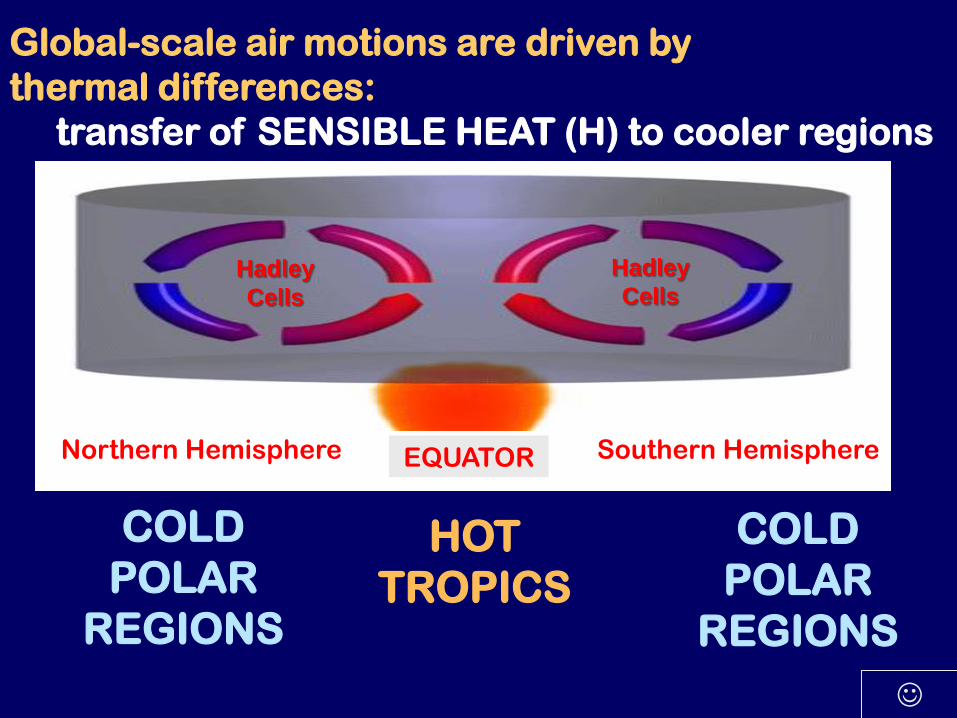
Northern Hemisphere Southern Hemisphere EQUATOR
Global-scale air motions are driven by
thermal differences:
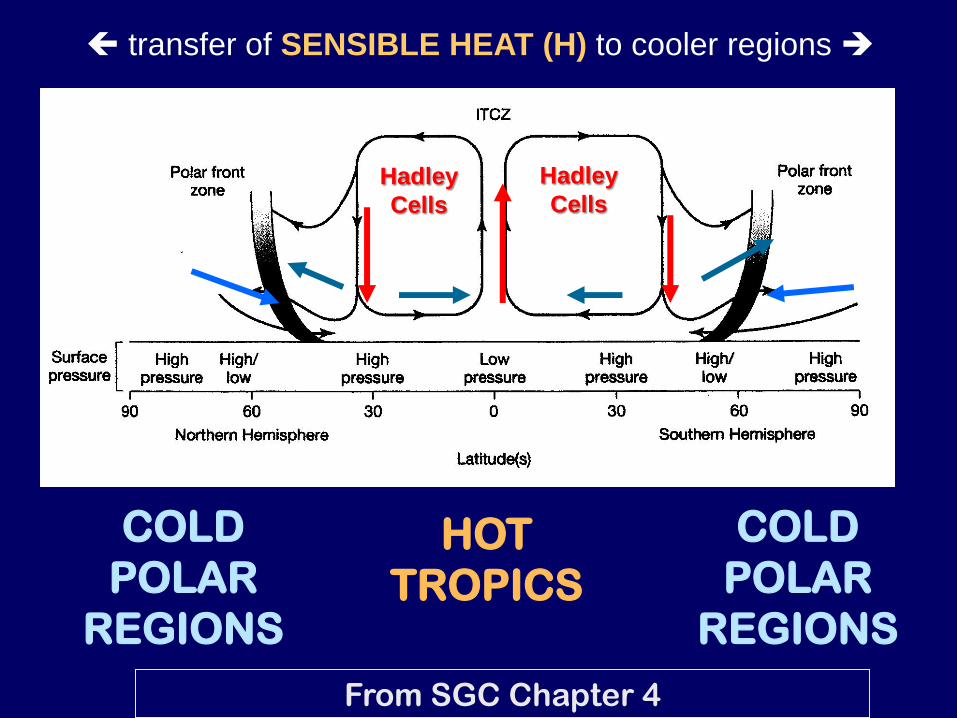
transfer of SENSIBLE HEAT (H) to cooler regions
Hadley
Cells
Hadley
Cells
HOT
TROPICS
HOT
TROPICS
COLD
POLAR
REGIONS
COLD
POLAR
REGIONS
From SGC Chapter 4
Hadley
Cells
Hadley
Cells
transfer of SENSIBLE HEAT (H) to cooler regions
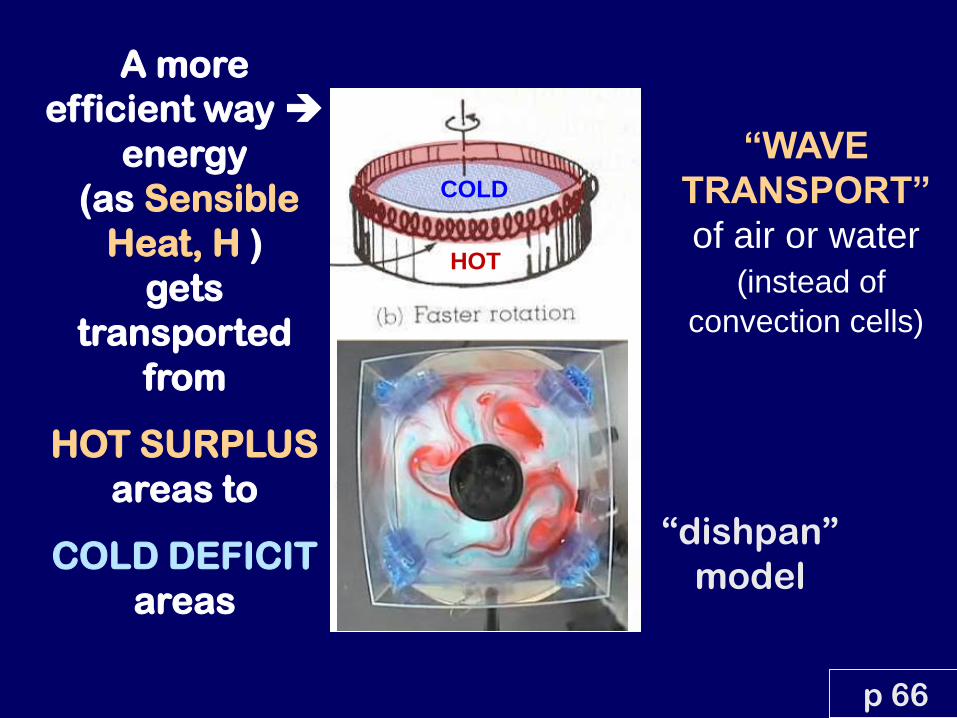
A more
efficient way
energy
(as Sensible
Heat, H )
gets
transported
from
HOT SURPLUS
areas to
COLD DEFICIT
areas
p 66
“dishpan”
model
COLD
HOT
“WAVE
TRANSPORT”
of air or water
(instead of
convection cells)
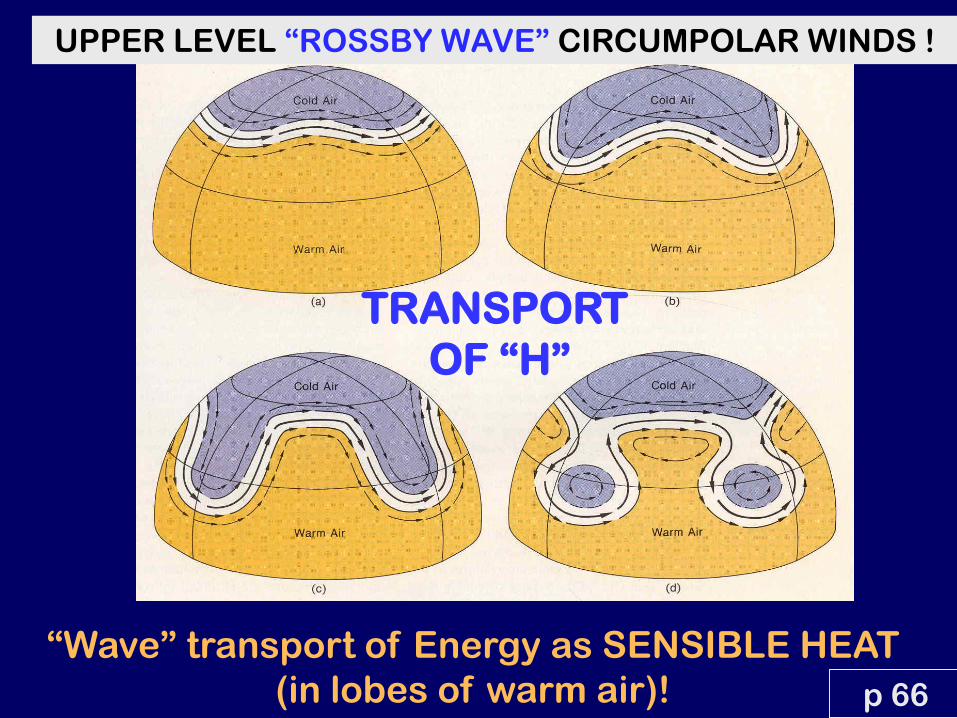
“Wave” transport of Energy as SENSIBLE HEAT
(in lobes of warm air)!
UPPER LEVEL “ROSSBY WAVE” CIRCUMPOLAR WINDS !
p 66
TRANSPORT
OF “H”
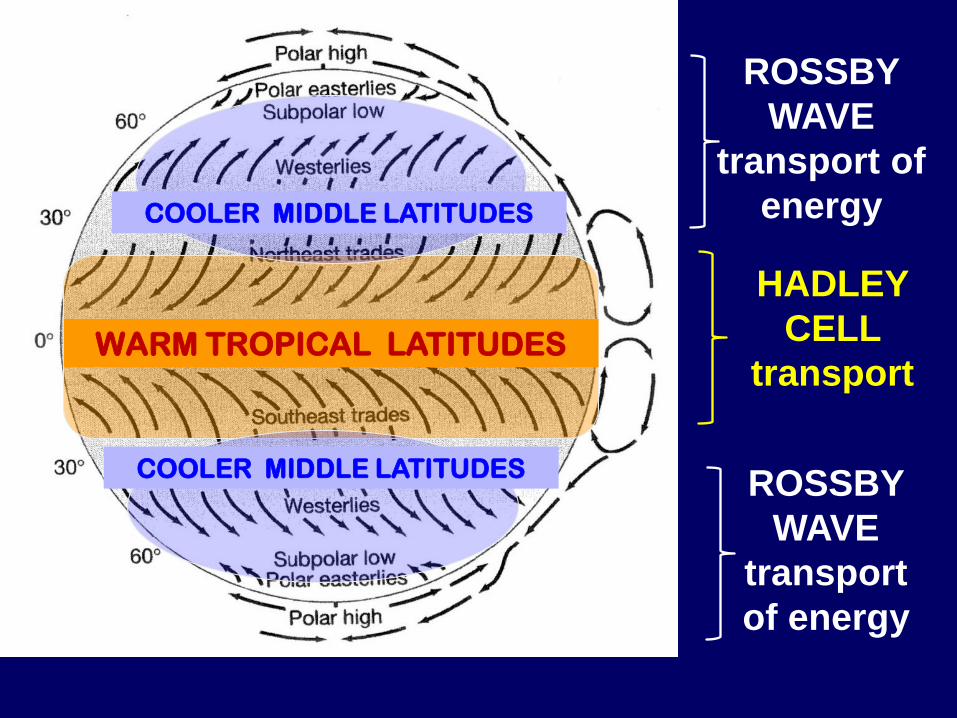
WARM TROPICAL LATITUDES
COOLER MIDDLE LATITUDES
COOLER MIDDLE LATITUDES
HADLEY
CELL
transport
ROSSBY
WAVE
transport of
energy
ROSSBY
WAVE
transport
of energy
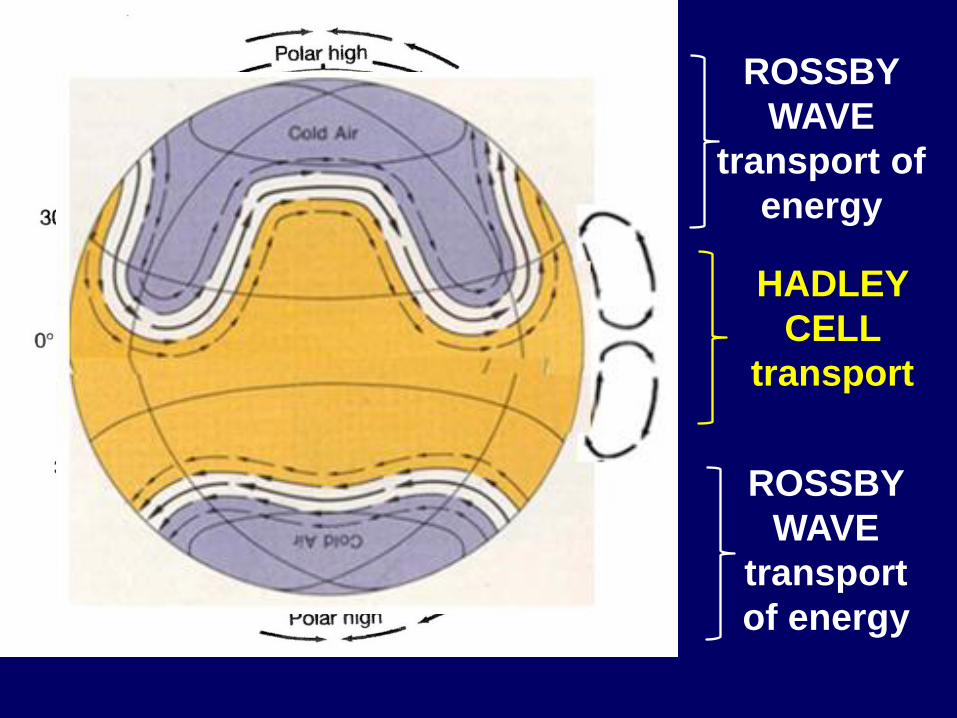
WARM TROPICAL LATITUDES
COOLER MIDDLE LATITUDES
COOLER MIDDLE LATITUDES
HADLEY
CELL
transport
ROSSBY
WAVE
transport of
energy
ROSSBY
WAVE
transport
of energy
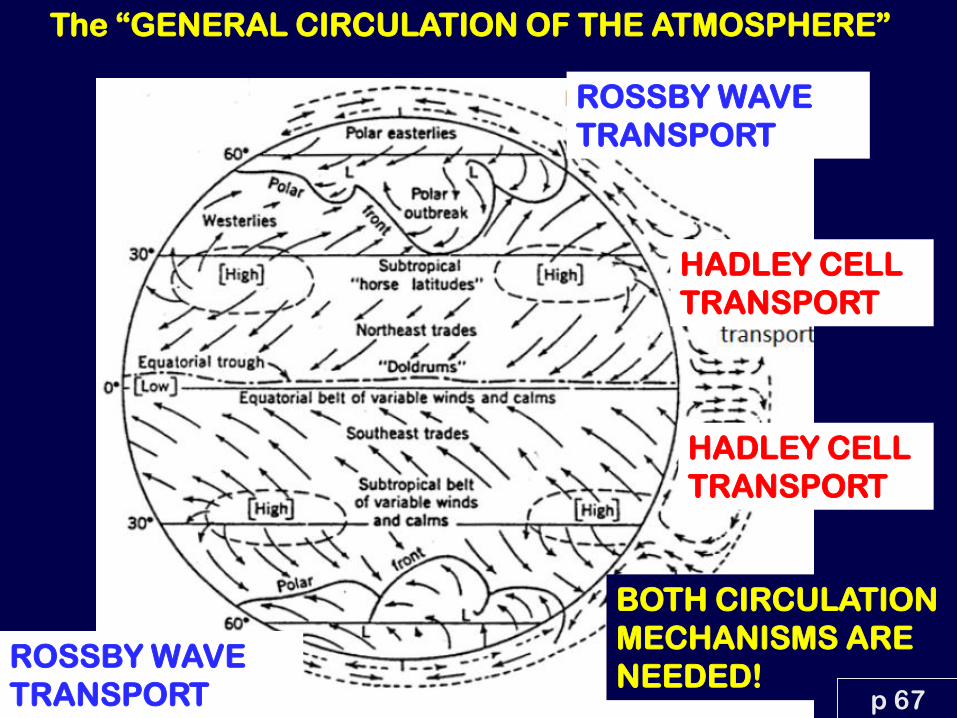
ROSSBY WAVE
TRANSPORT
HADLEY CELL
TRANSPORT
BOTH CIRCULATION
MECHANISMS ARE
NEEDED!
HADLEY CELL
TRANSPORT
ROSSBY WAVE
TRANSPORT p 67
The “GENERAL CIRCULATION OF THE ATMOSPHERE”

G-4 Your next “hands on”
10 pt “Group” Activity
will take place in the Tree-Ring Lab!
A Brief Intro:
TREE RINGS &
DENDROCHRONOLOGY
CLASS NOTES
APPENDIX
p 99
Dendrochronology is the dating
and study of annual rings in trees:
•dendros: from trees, or more specifically the growth rings of trees
•chronos: time, or more specifically events in past time
•ology: the study of . . .
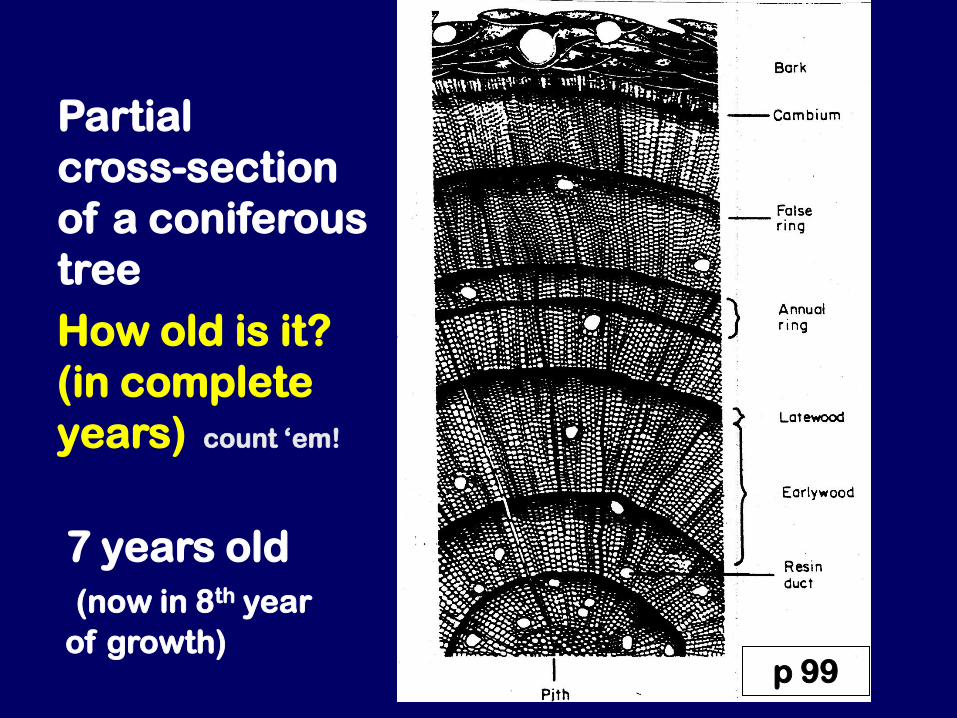
Partial
cross-section
of a coniferous
tree
How old is it?
(in complete
years) count ‘em!
7 years old
(now in 8th year
of growth) p 99
P 99
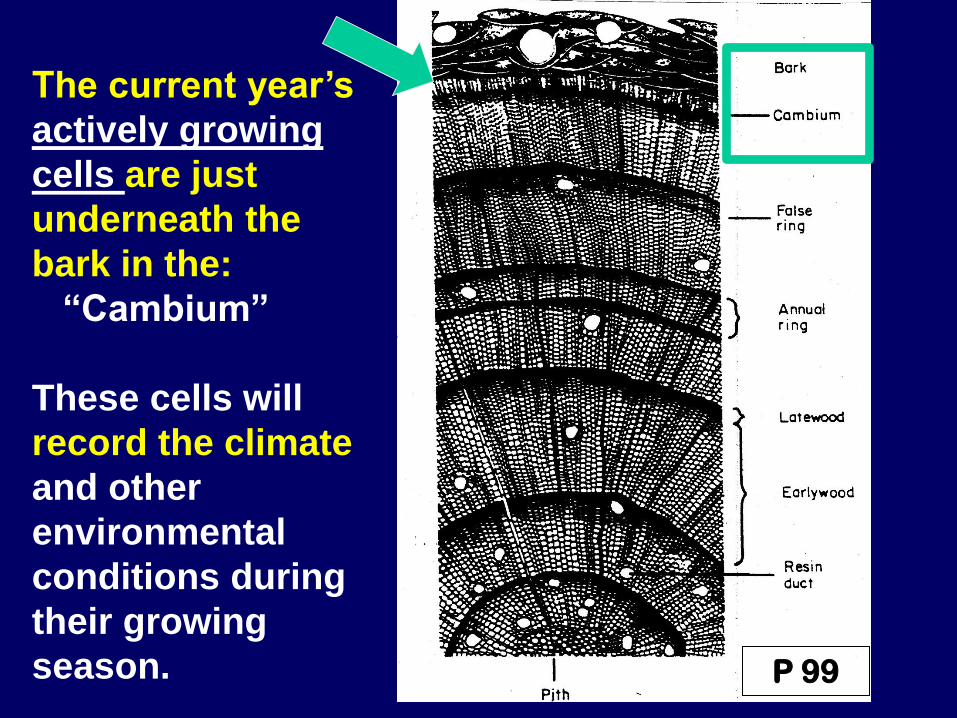
The current year’s
actively growing
cells are just
underneath the
bark in the:
“Cambium”
These cells will
record the climate
and other
environmental
conditions during
their growing
season.
P 51
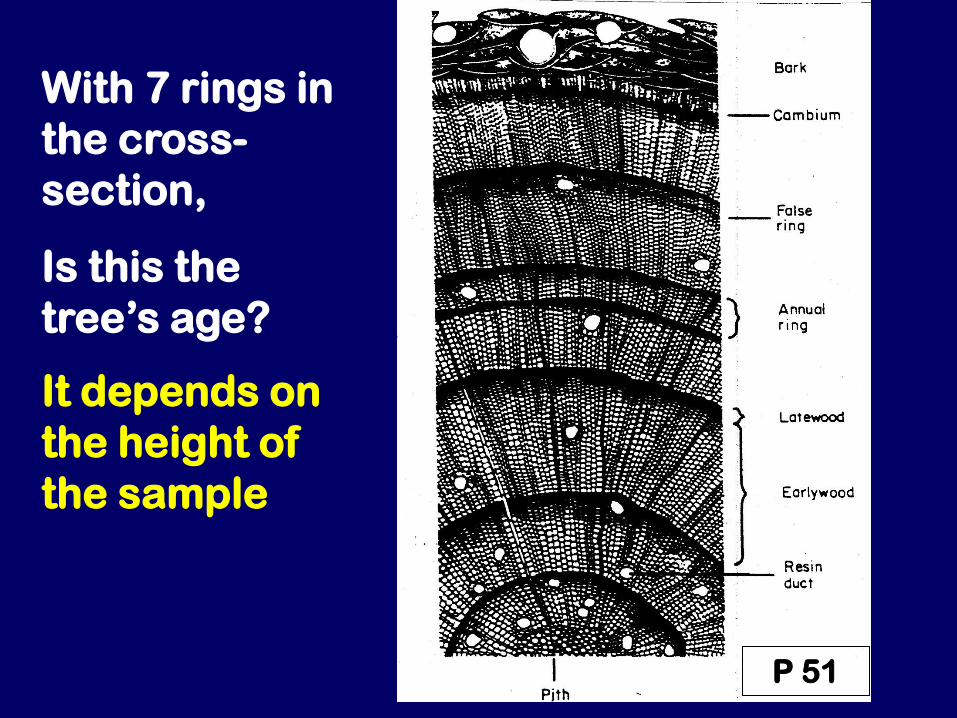
With 7 rings in
the cross-
section,
Is this the
tree’s age?
It depends on
the height of
the sample
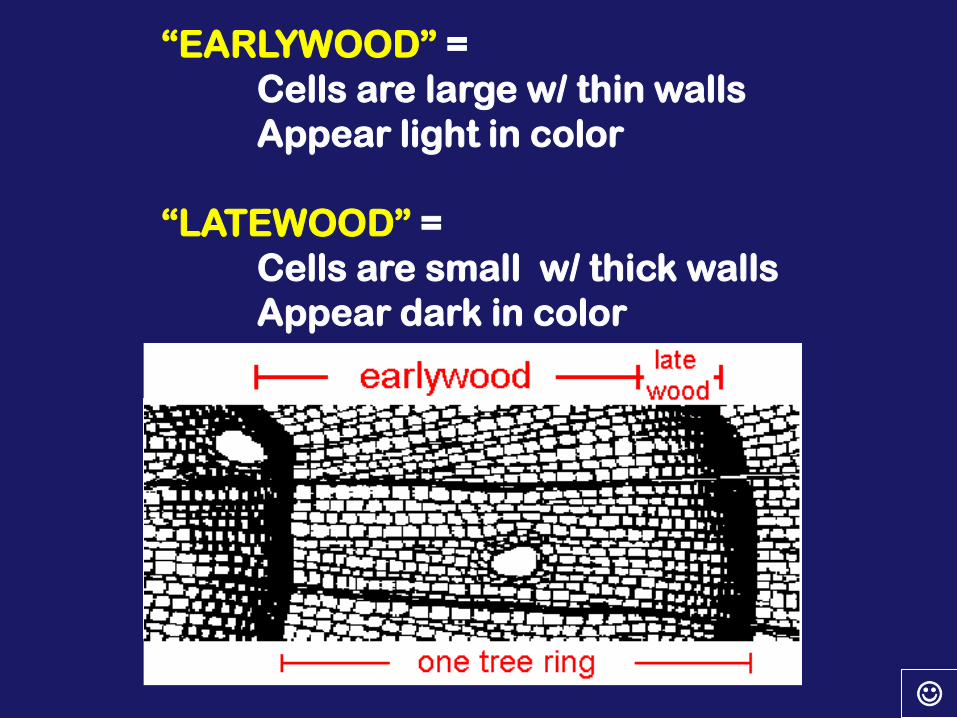
“EARLYWOOD” =
Cells are large w/ thin walls
Appear light in color
“LATEWOOD” =
Cells are small w/ thick walls
Appear dark in color
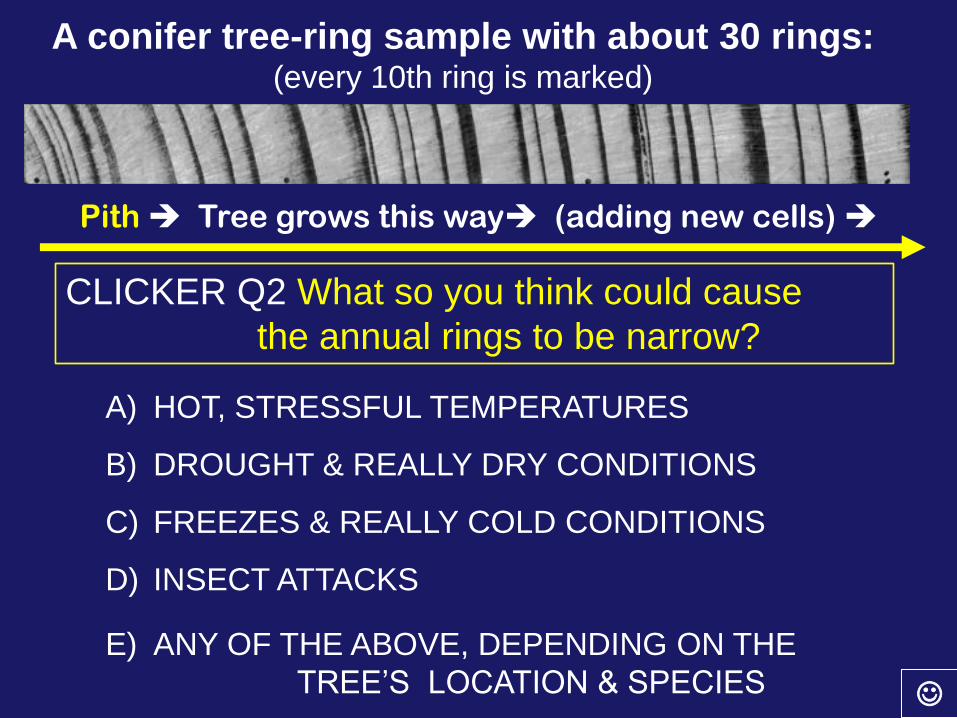
A conifer tree-ring sample with about 30 rings: (every 10th ring is marked)
Pith Tree grows this way (adding new cells)
CLICKER Q2 What so you think could cause
the annual rings to be narrow?
A) HOT, STRESSFUL TEMPERATURES
B) DROUGHT & REALLY DRY CONDITIONS
C) FREEZES & REALLY COLD CONDITIONS
D) INSECT ATTACKS
E) ANY OF THE ABOVE, DEPENDING ON THE
TREE’S LOCATION & SPECIES
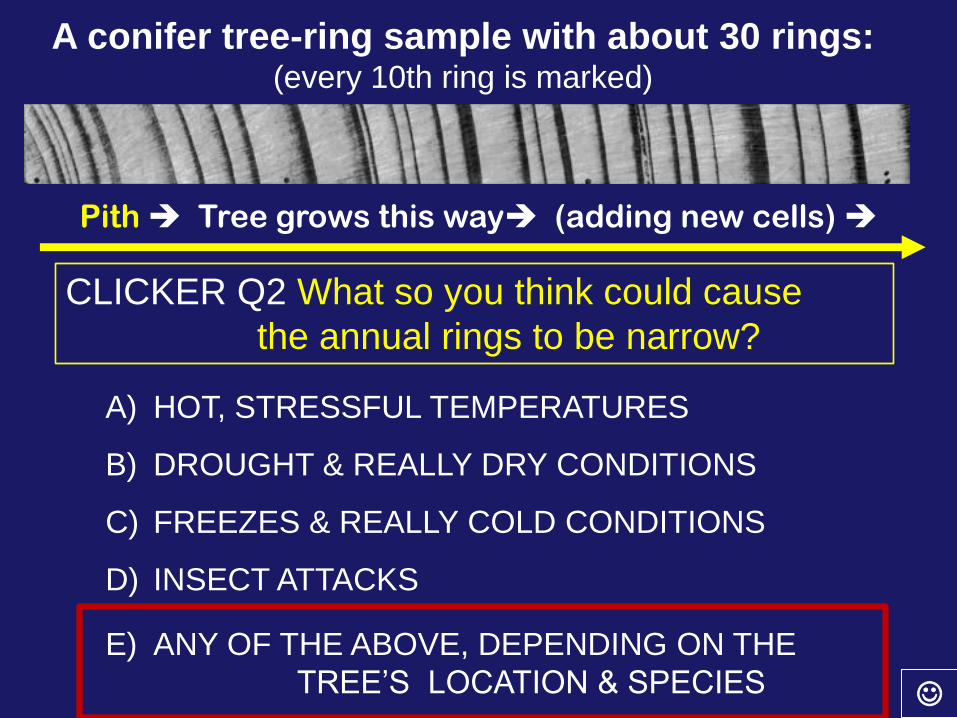
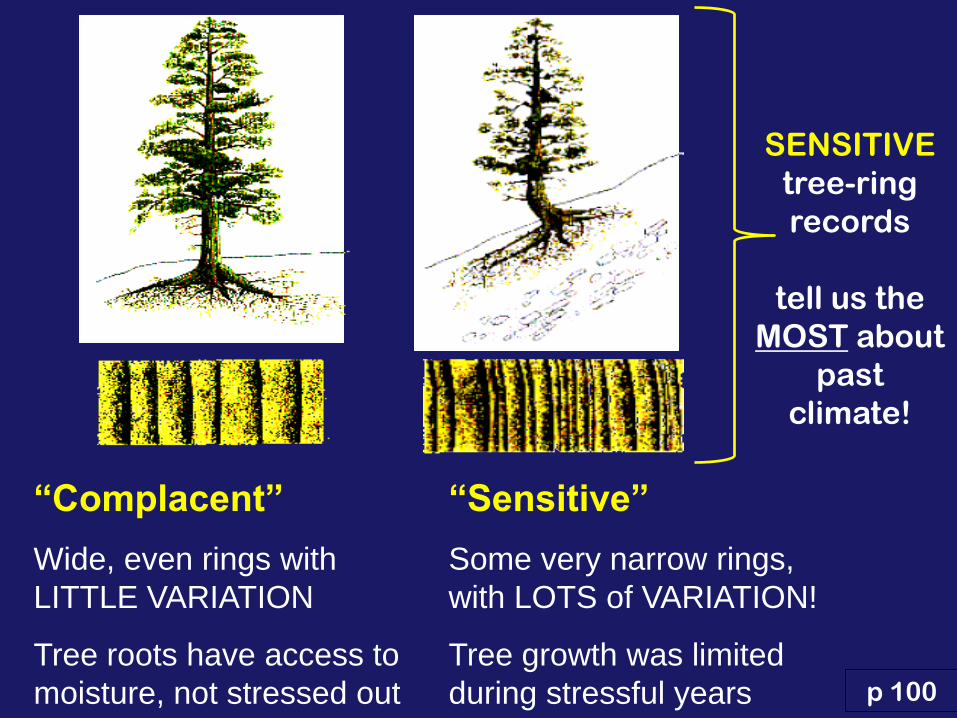
“Complacent”
Wide, even rings with
LITTLE VARIATION
Tree roots have access to
moisture, not stressed out p 100
“Sensitive”
Some very narrow rings,
with LOTS of VARIATION!
Tree growth was limited
during stressful years
SENSITIVE
tree-ring
records
tell us the
MOST about
past
climate!

In the G-4 “Tree-Ring Wood Kit”
Assignment you will look at
wood samples from many
different types of trees
& learn about how
DENDROCHRONOLOGY
IS DONE!
Mini-Film
Break
5 minutes
from:
A.E. Douglass Founded the UA
Laboratory of
Tree-Ring Research

The G-4 Tree Ring Wood Kit Activity
begins tomorrow & is due
before MIDNIGHT on Wed Nov 12th
You will need to visit the Tree-Ring Lab at
one of the posted time slots
to do the activity
Want to get it done early?
The first “hands on” session is tomorrow:
Friday Oct 31 from 2- 3 pm
Come with your CLASS NOTES
to the LOBBY OF THE BANNISTER
TREE-RING BUILDING at 2 pm
NOTE: You don’t need to be in your assigned group – come
with friends from class or on your own!
TOPIC #11
NATURAL CLIMATIC
FORCING
p 71
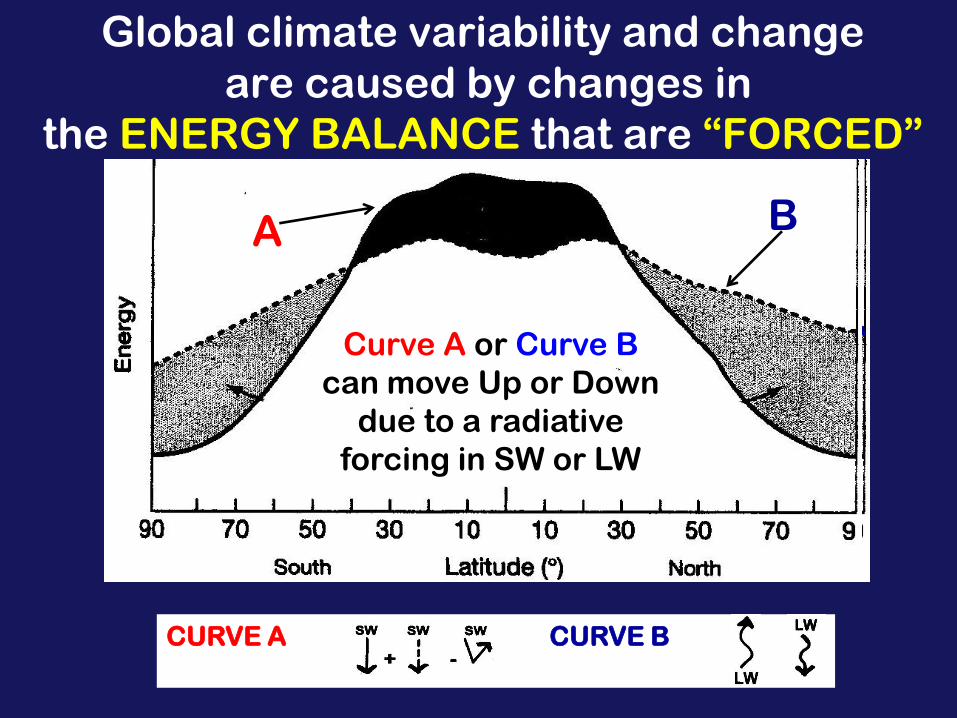
A B
CURVE A CURVE B
is
Curve A or Curve B
can move Up or Down
due to a radiative
forcing in SW or LW
Global climate variability and change
are caused by changes in
the ENERGY BALANCE that are “FORCED”
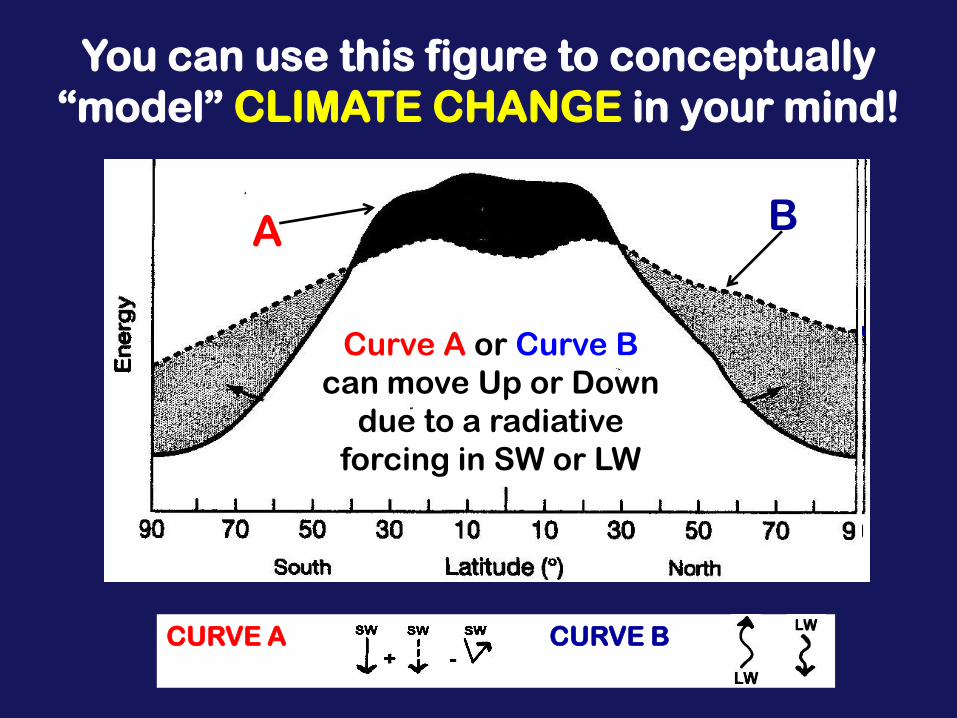
A B
CURVE A CURVE B
is
Curve A or Curve B
can move Up or Down
due to a radiative
forcing in SW or LW
You can use this figure to conceptually
“model” CLIMATE CHANGE in your mind!
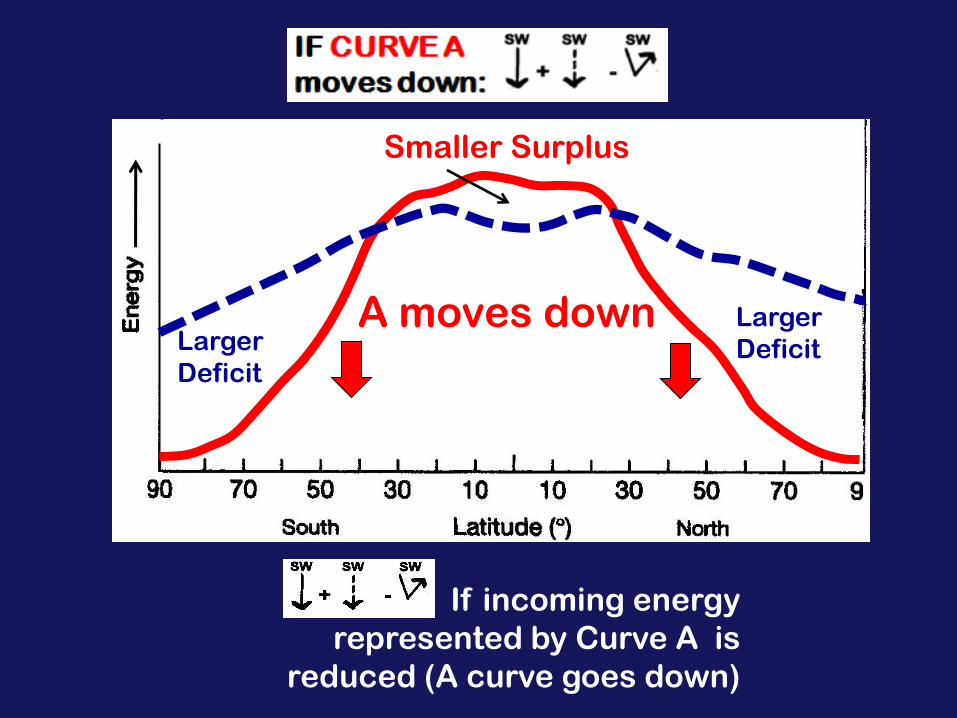
Smaller Surplus
Larger
Deficit
Larger
Deficit
If incoming energy
represented by Curve A is
reduced (A curve goes down)
A moves down
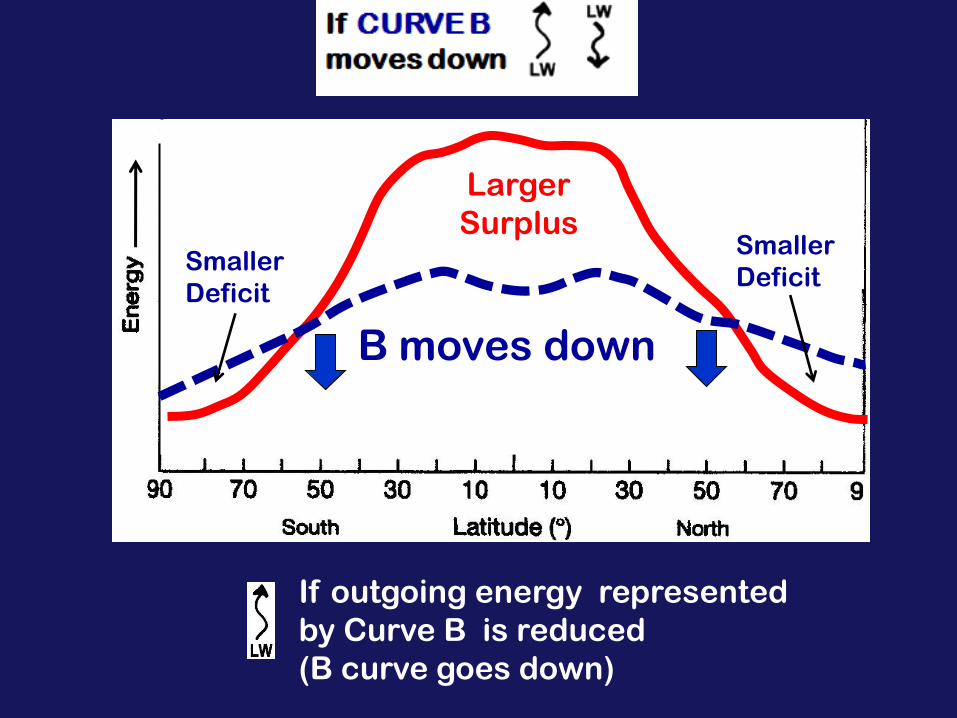
If outgoing energy represented
by Curve B is reduced
(B curve goes down)
Larger
Surplus
Smaller
Deficit
Smaller
Deficit
B moves down
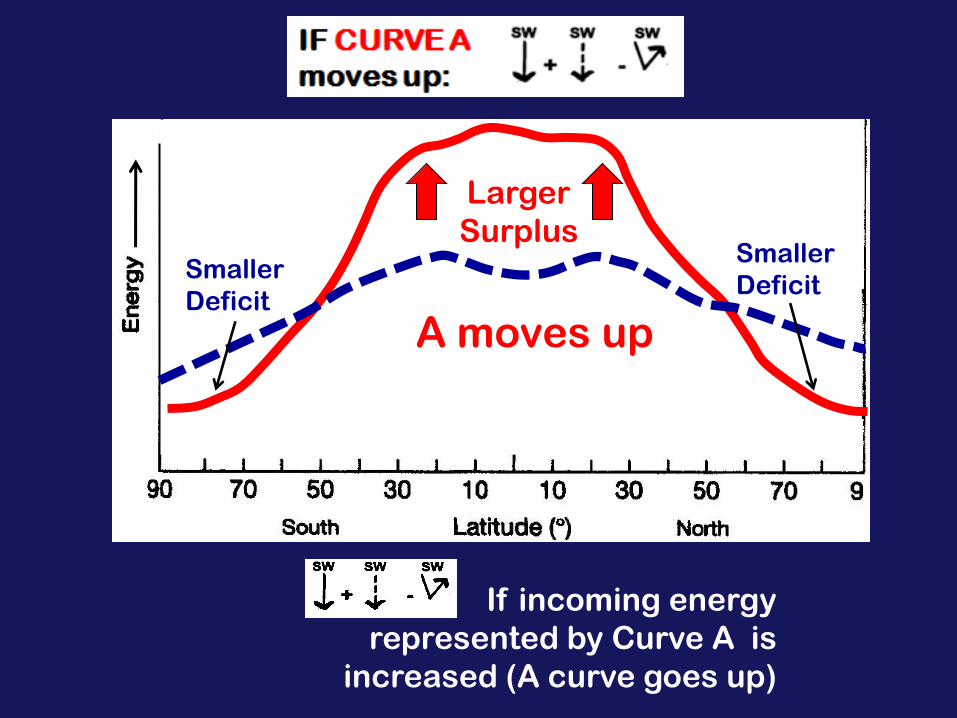
Larger
Surplus
Smaller
Deficit
Smaller
Deficit
If incoming energy
represented by Curve A is
increased (A curve goes up)
A moves up
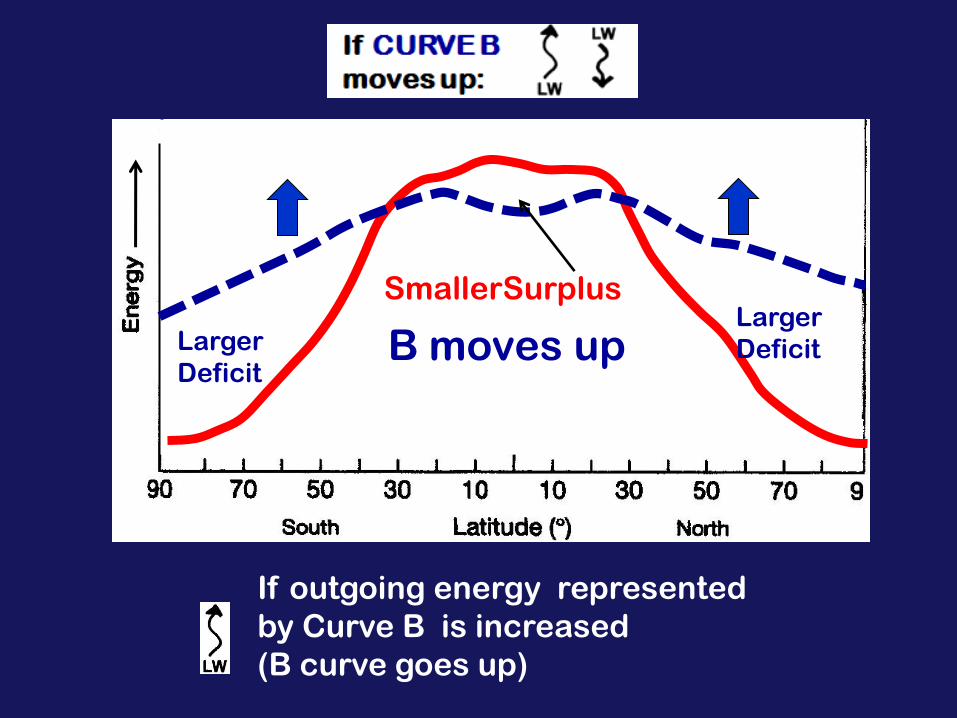
SmallerSurplus
Larger
Deficit
Larger
Deficit
If outgoing energy represented
by Curve B is increased
(B curve goes up)
B moves up
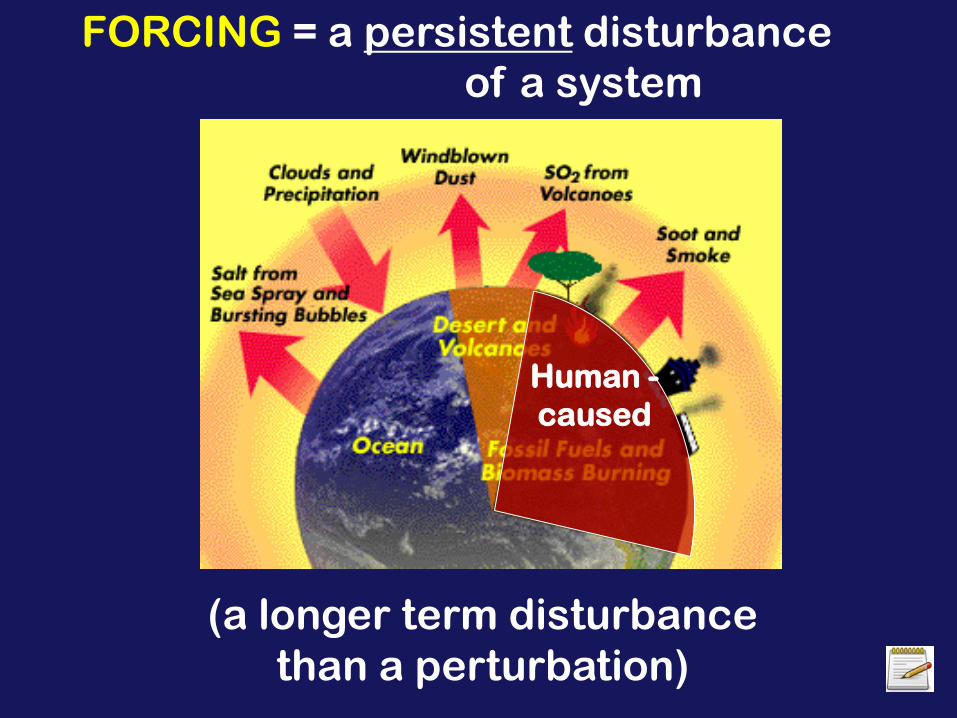
FORCING = a persistent disturbance
of a system
(a longer term disturbance
than a perturbation)
Human -
caused
NATURAL CLIMATIC
FORCING
vs.
ANTHROPOGENIC
FORCING
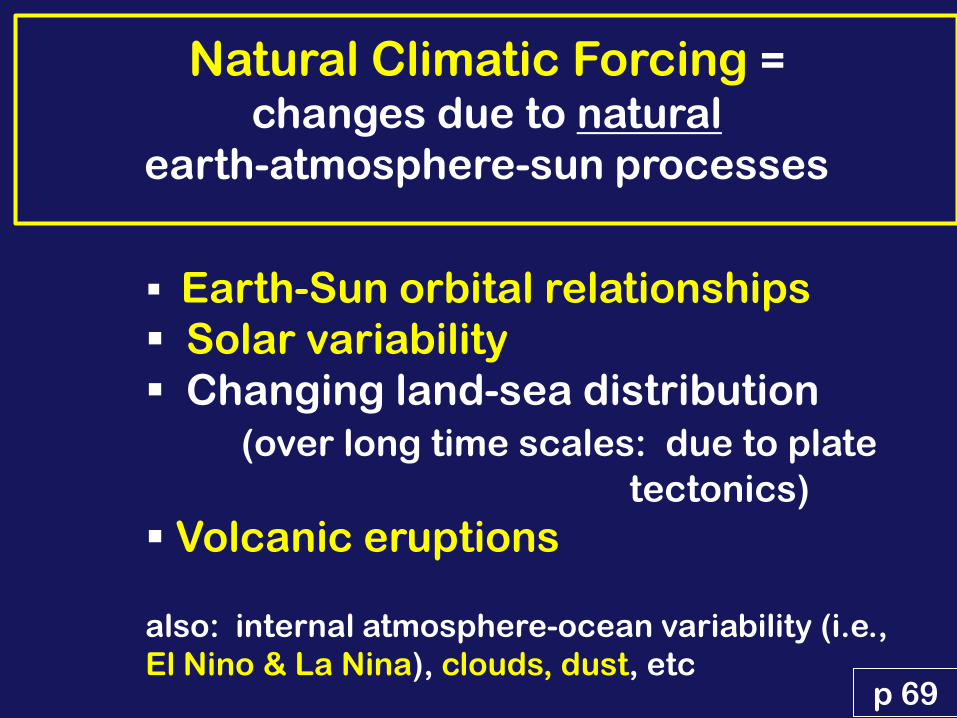
Earth-Sun orbital relationships
Solar variability
Changing land-sea distribution
(over long time scales: due to plate
tectonics)
Volcanic eruptions also: internal atmosphere-ocean variability (i.e.,
El Nino & La Nina), clouds, dust, etc p 69
Natural Climatic Forcing =
changes due to natural
earth-atmosphere-sun processes
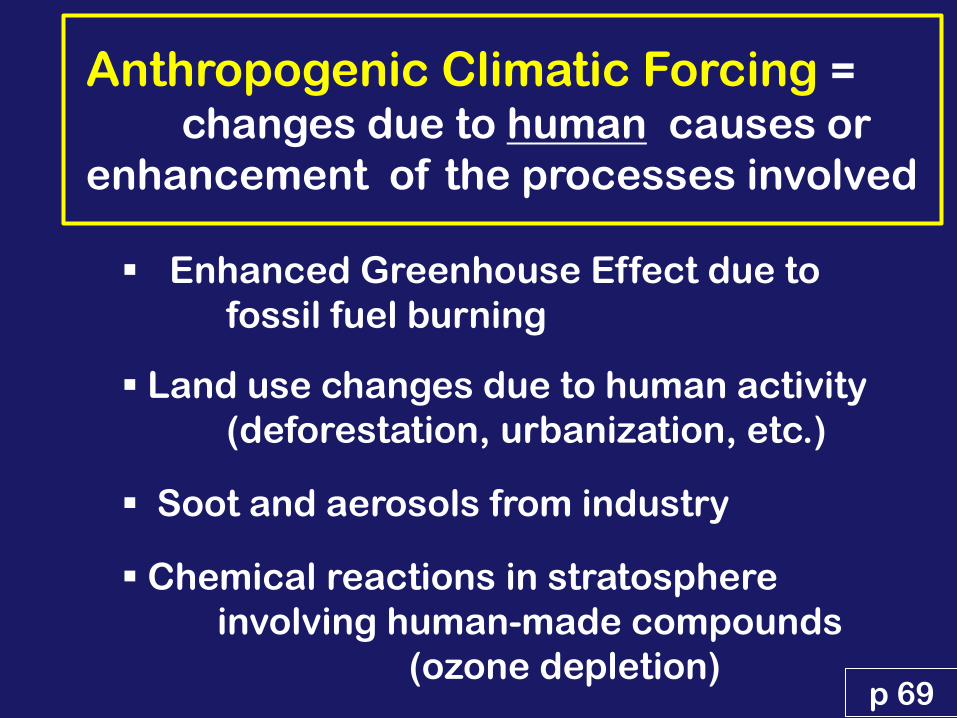
Enhanced Greenhouse Effect due to
fossil fuel burning
Land use changes due to human activity
(deforestation, urbanization, etc.)
Soot and aerosols from industry
Chemical reactions in stratosphere
involving human-made compounds
(ozone depletion) p 69
Anthropogenic Climatic Forcing =
changes due to human causes or
enhancement of the processes involved
All things are connected.
Whatever befalls the earth,
befalls the children of the
earth.
~ Chief Seattle
p 75
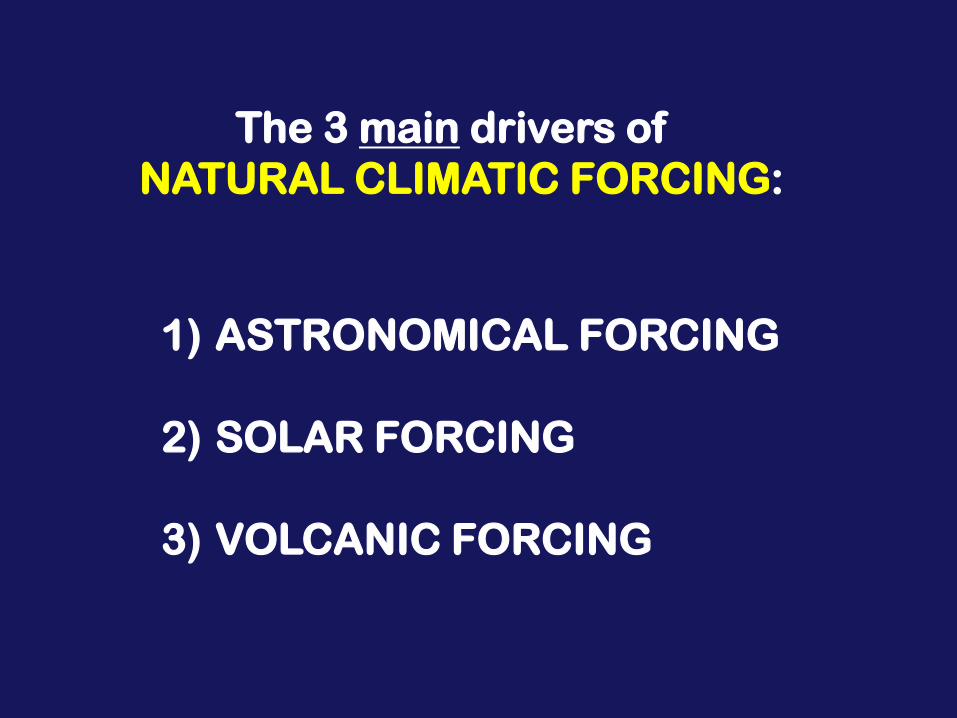
1) ASTRONOMICAL FORCING
2) SOLAR FORCING
3) VOLCANIC FORCING
The 3 main drivers of
NATURAL CLIMATIC FORCING:
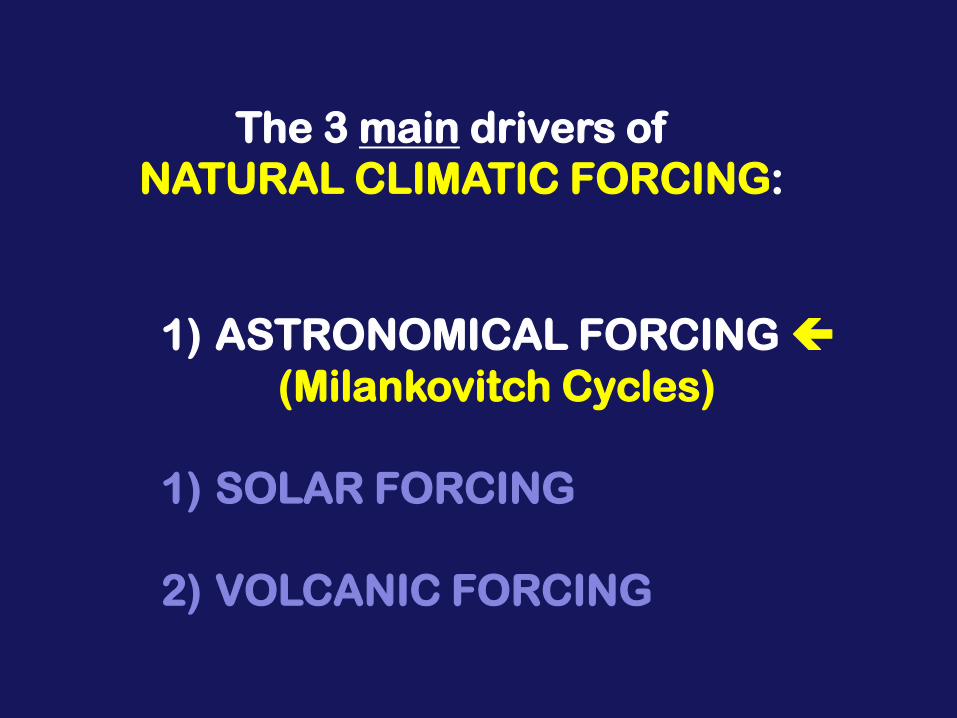
1) ASTRONOMICAL FORCING
(Milankovitch Cycles)
1) SOLAR FORCING
2) VOLCANIC FORCING
The 3 main drivers of
NATURAL CLIMATIC FORCING:
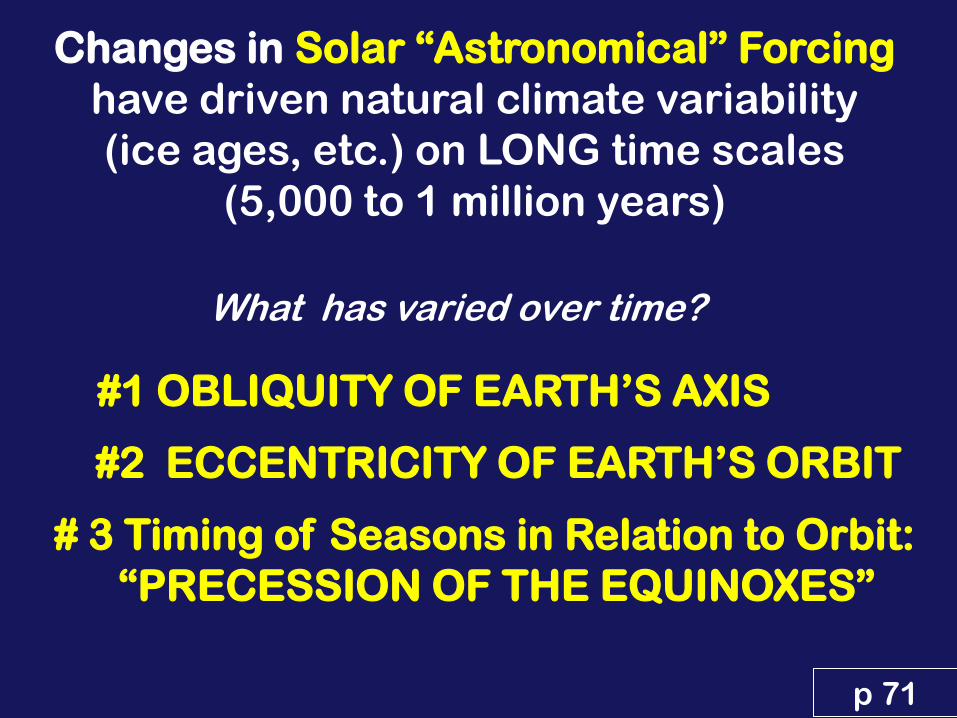
Changes in Solar “Astronomical” Forcing
have driven natural climate variability
(ice ages, etc.) on LONG time scales
(5,000 to 1 million years)
#1 OBLIQUITY OF EARTH’S AXIS
#2 ECCENTRICITY OF EARTH’S ORBIT
# 3 Timing of Seasons in Relation to Orbit:
“PRECESSION OF THE EQUINOXES”
p 71
What has varied over time?
p 71
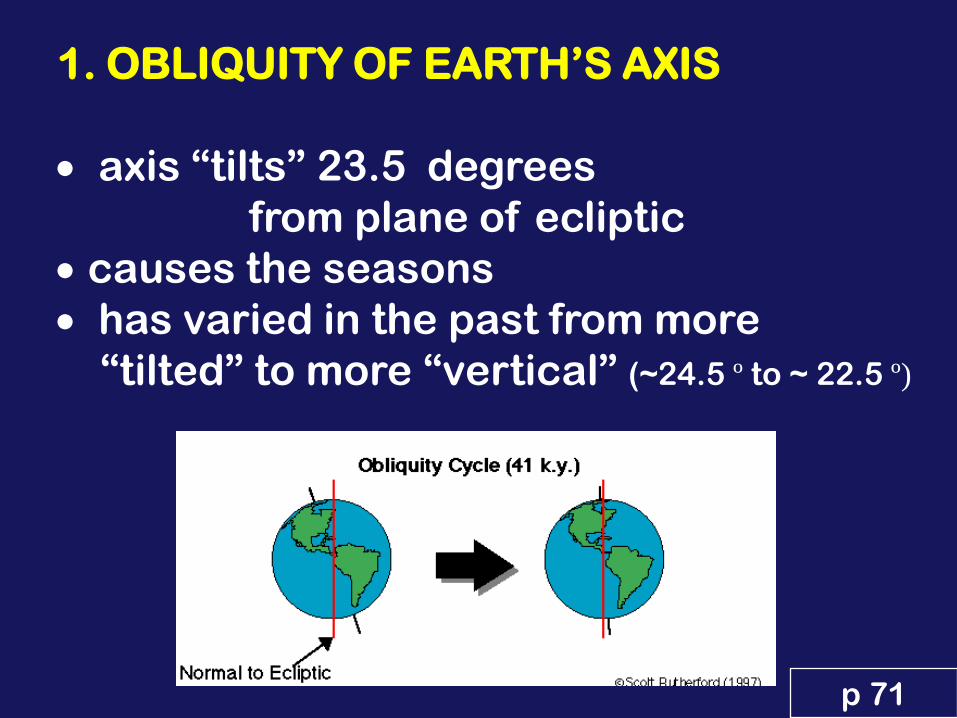
1. OBLIQUITY OF EARTH’S AXIS
axis “tilts” 23.5 degrees
from plane of ecliptic
causes the seasons
has varied in the past from more
“tilted” to more “vertical” (~24.5 º to ~ 22.5 º)
p 71
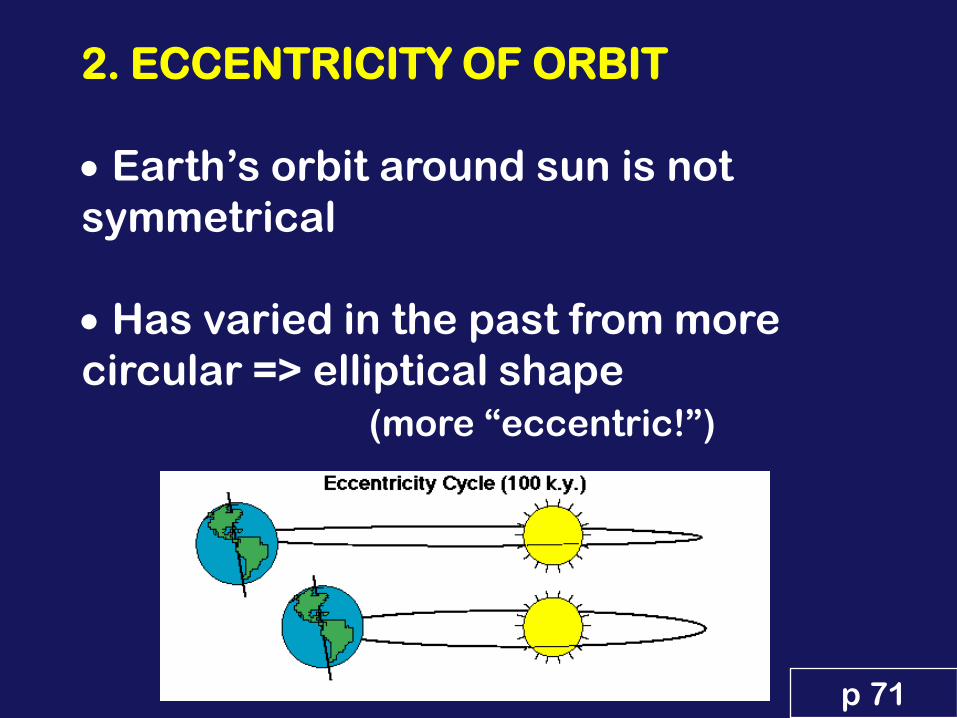
2. ECCENTRICITY OF ORBIT
Earth’s orbit around sun is not
symmetrical
Has varied in the past from more
circular => elliptical shape
(more “eccentric!”)
p 71
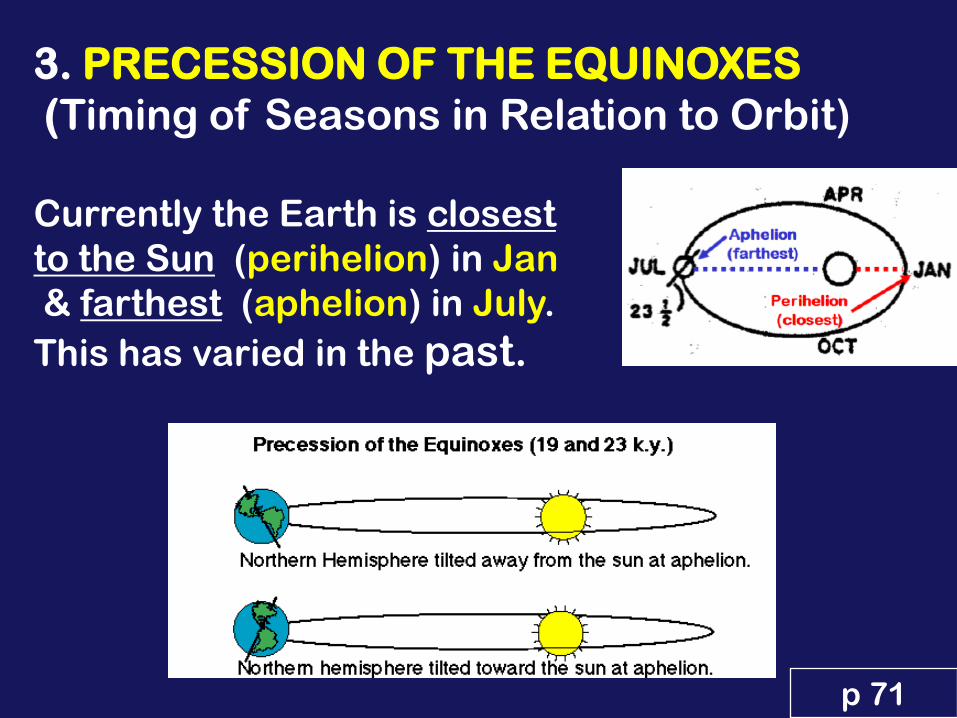
3. PRECESSION OF THE EQUINOXES
(Timing of Seasons in Relation to Orbit)
Currently the Earth is closest
to the Sun (perihelion) in Jan
& farthest (aphelion) in July.
This has varied in the past.
p 71
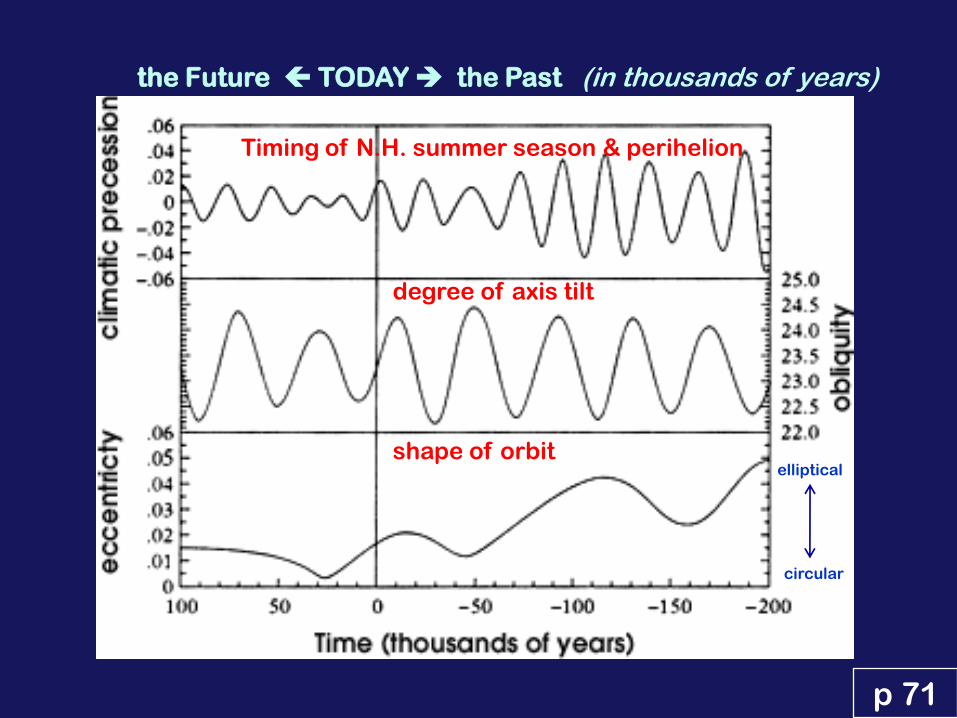
the Future TODAY the Past (in thousands of years)
degree of axis tilt
shape of orbit
Timing of N.H. summer season & perihelion
circular
elliptical
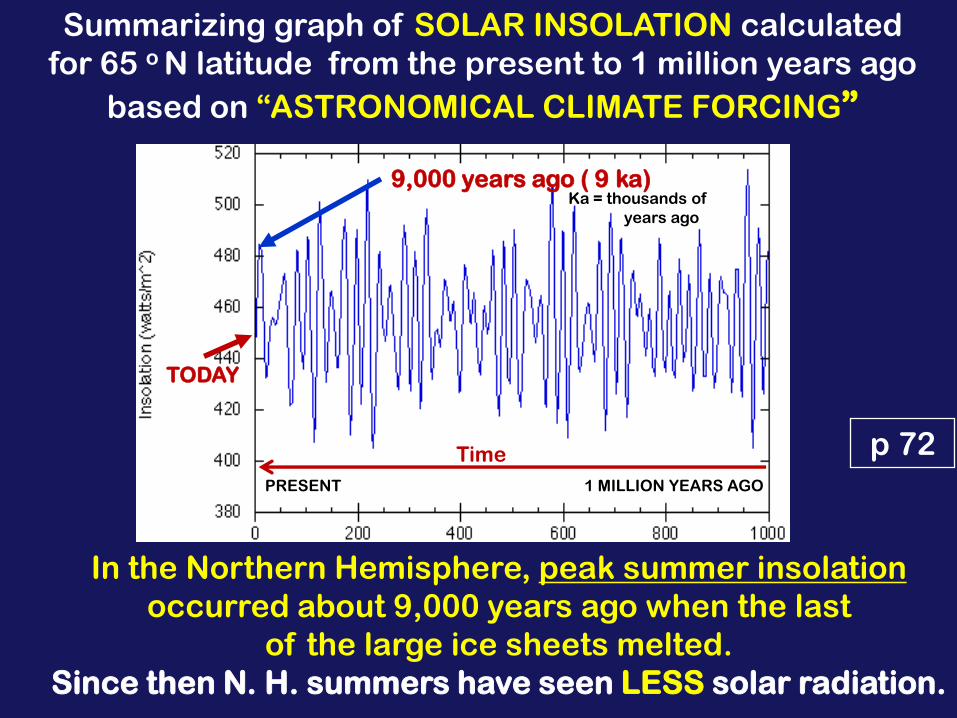
Summarizing graph of SOLAR INSOLATION calculated
for 65 o N latitude from the present to 1 million years ago
based on “ASTRONOMICAL CLIMATE FORCING”
TODAY
9,000 years ago ( 9 ka)
PRESENT 1 MILLION YEARS AGO
In the Northern Hemisphere, peak summer insolation
occurred about 9,000 years ago when the last
of the large ice sheets melted.
Since then N. H. summers have seen LESS solar radiation.
Ka = thousands of
years ago
p 72 Time
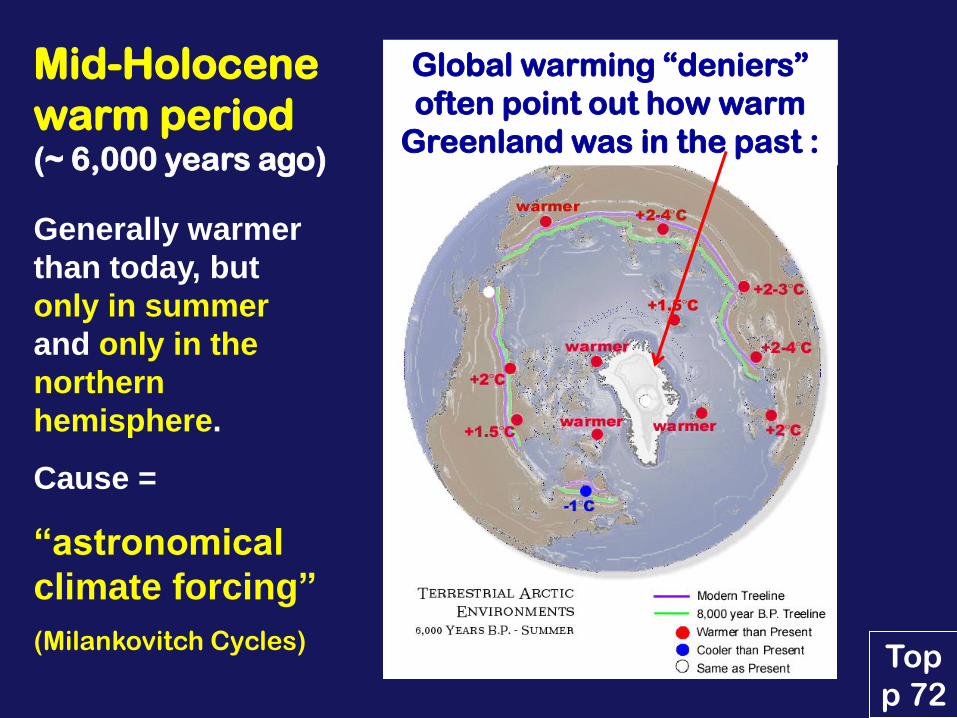
Mid-Holocene
warm period (~ 6,000 years ago)
Generally warmer
than today, but
only in summer
and only in the
northern
hemisphere.
Cause =
“astronomical
climate forcing”
(Milankovitch Cycles)
Global warming “deniers”
often point out how warm
Greenland was in the past :
Top
p 72
1) ASTRONOMICAL FORCING
2) SOLAR FORCING
3) VOLCANIC FORCING
The 3 main drivers of
NATURAL CLIMATIC FORCING:
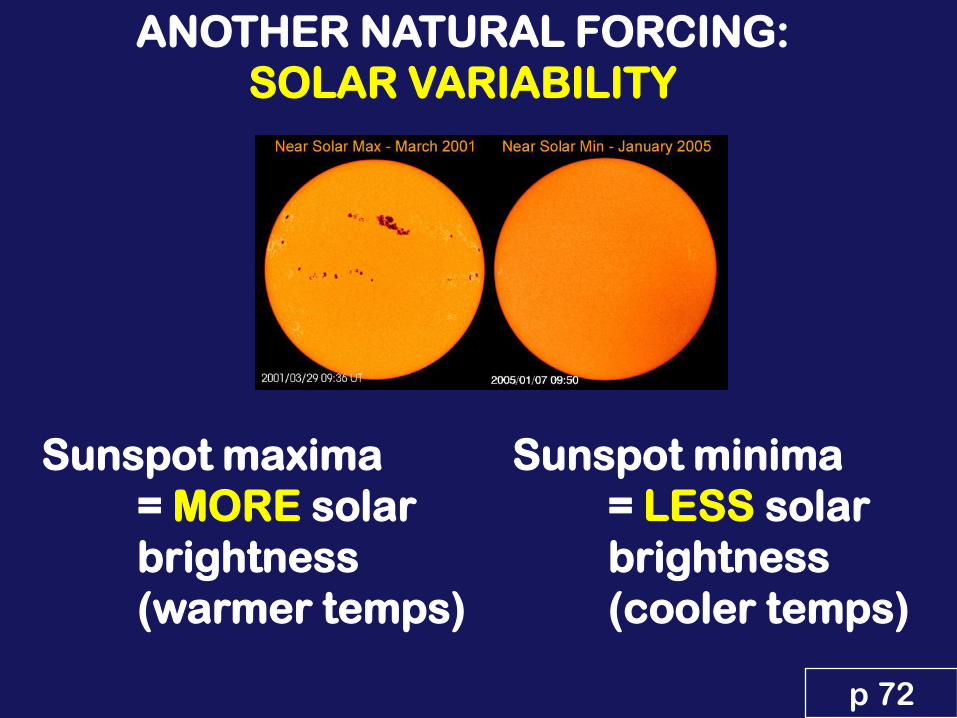
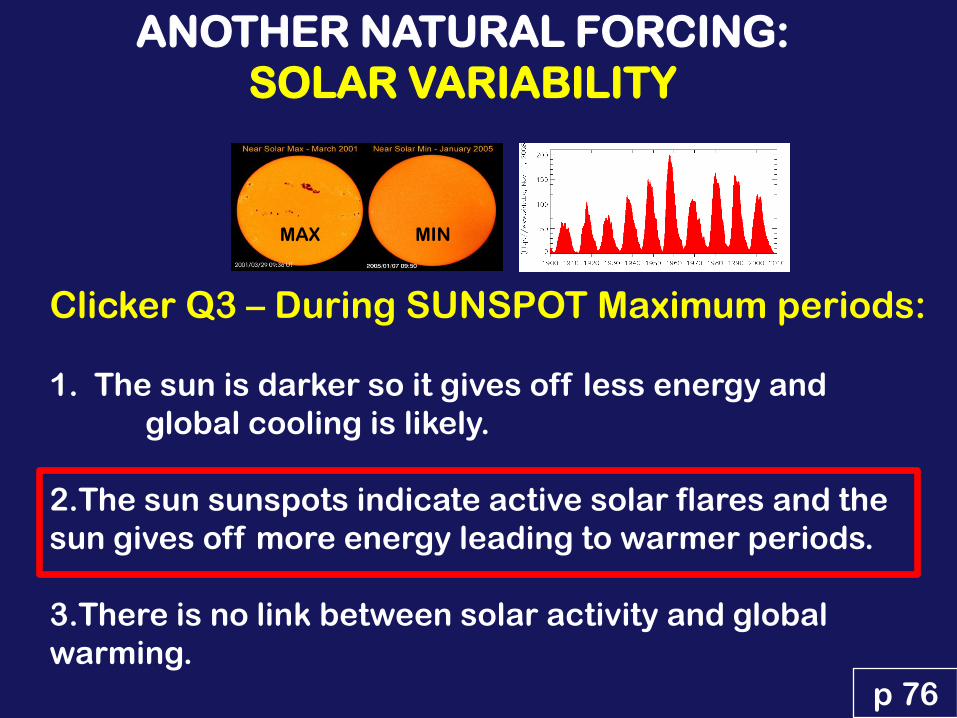
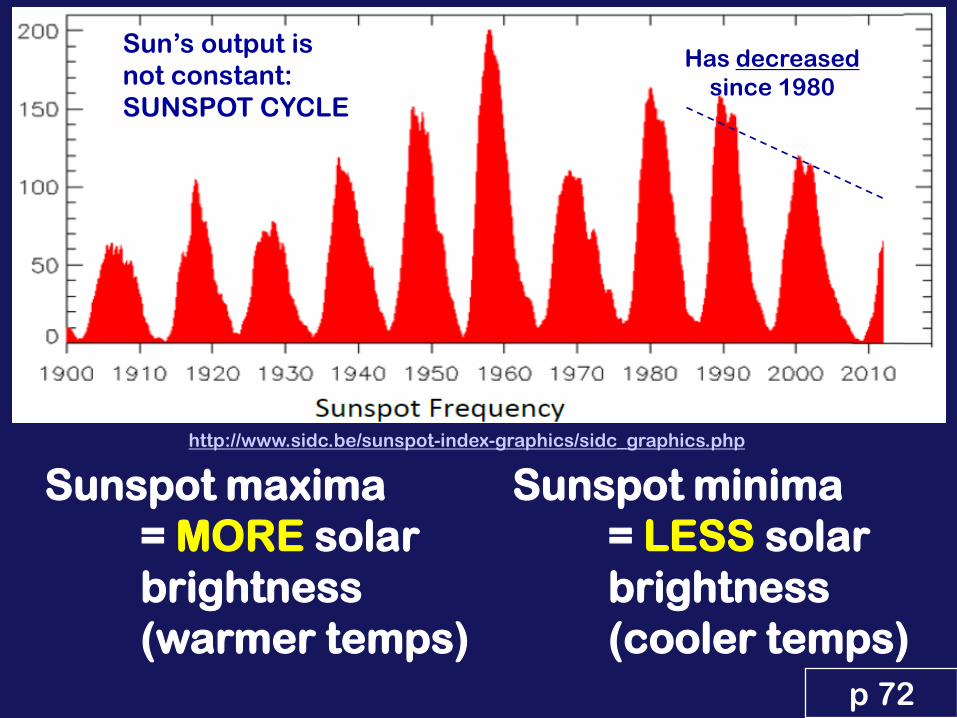
Sunspot minima
= LESS solar
brightness
(cooler temps)
Sunspot maxima
= MORE solar
brightness
(warmer temps)
p 72
ANOTHER NATURAL FORCING:
SOLAR VARIABILITY

p 72
Clicker Q3 – During SUNSPOT Maximum periods:
1. The sun is darker so it gives off less energy and
global cooling is likely.
2.The sun sunspots indicate active solar flares and the
sun gives off more energy leading to warmer periods.
3.There is no link between solar activity and global
warming.
MAX MIN
ANOTHER NATURAL FORCING:
SOLAR VARIABILITY
p 76
Clicker Q3 – During SUNSPOT Maximum periods:
1. The sun is darker so it gives off less energy and
global cooling is likely.
2.The sun sunspots indicate active solar flares and the
sun gives off more energy leading to warmer periods.
3.There is no link between solar activity and global
warming.
MAX MIN
ANOTHER NATURAL FORCING:
SOLAR VARIABILITY
ANOTHER POSSIBLE NATURAL
FORCING: SOLAR VARIABILITY
Sunspot minima
= LESS solar
brightness
(cooler temps)
Sunspot maxima
= MORE solar
brightness
(warmer temps)
p 72
http://www.sidc.be/sunspot-index-graphics/sidc_graphics.php
Sun’s output is
not constant:
SUNSPOT CYCLE
Has decreased
since 1980
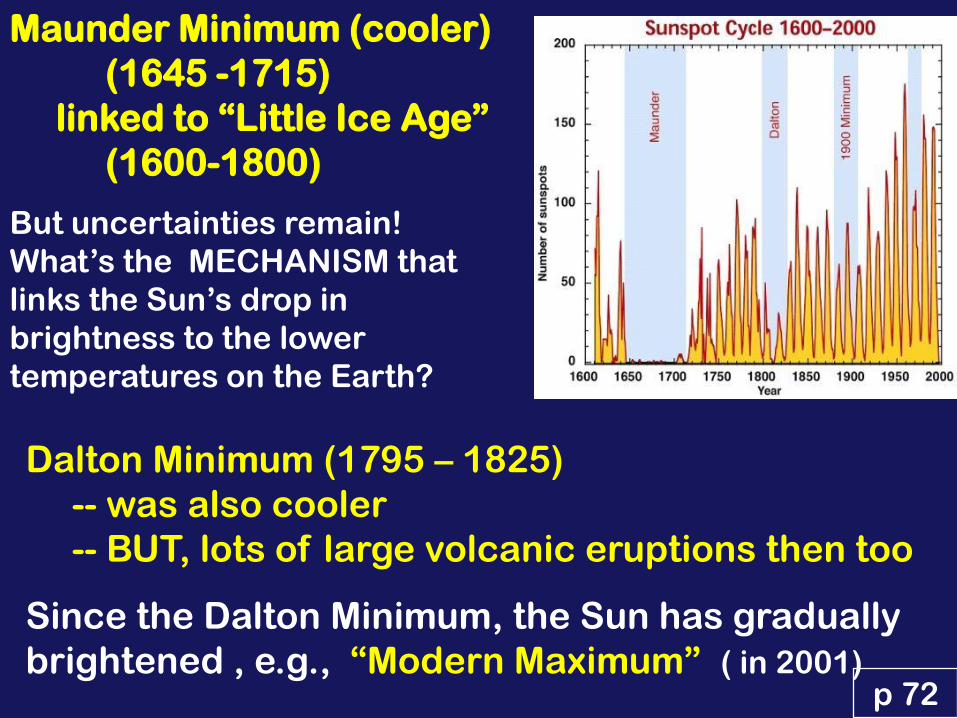
Maunder Minimum (cooler)
(1645 -1715)
linked to “Little Ice Age”
(1600-1800)
But uncertainties remain!
What’s the MECHANISM that
links the Sun’s drop in
brightness to the lower
temperatures on the Earth?
p 72
Dalton Minimum (1795 – 1825)
-- was also cooler
-- BUT, lots of large volcanic eruptions then too
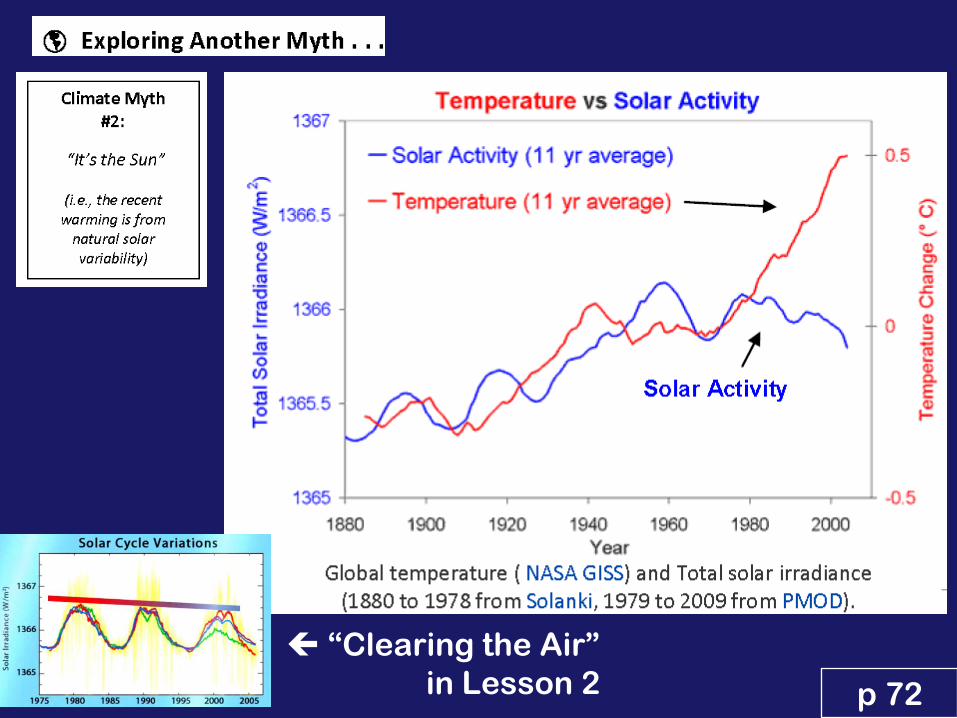
Since the Dalton Minimum, the Sun has gradually
brightened , e.g., “Modern Maximum” ( in 2001)
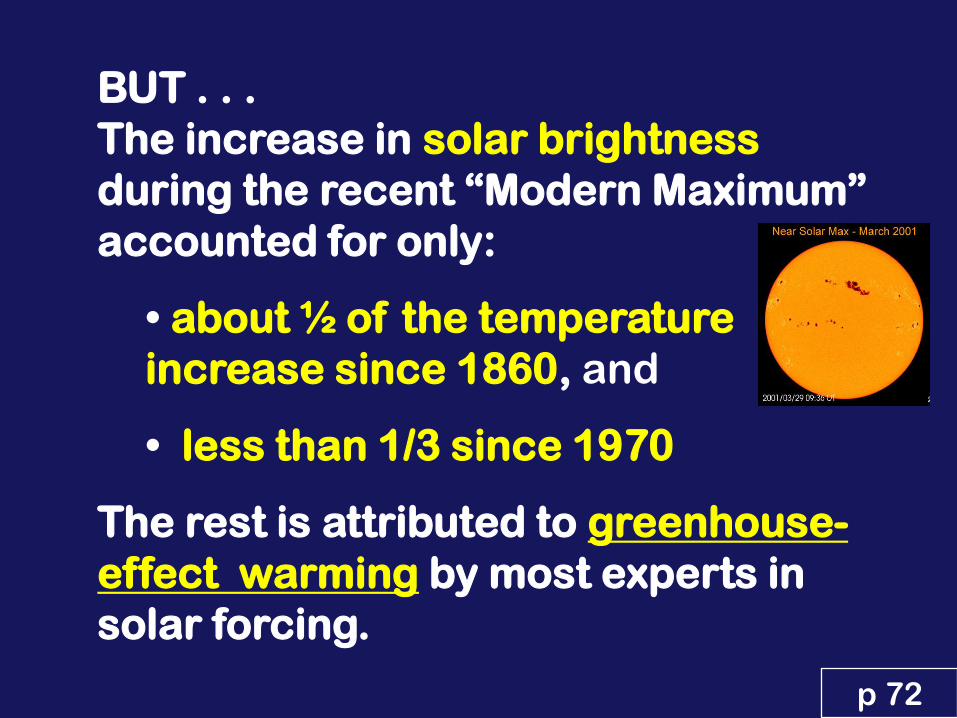
BUT . . .
The increase in solar brightness
during the recent “Modern Maximum”
accounted for only:
• about ½ of the temperature
increase since 1860, and
• less than 1/3 since 1970
The rest is attributed to greenhouse-
effect warming by most experts in
solar forcing.
p 72
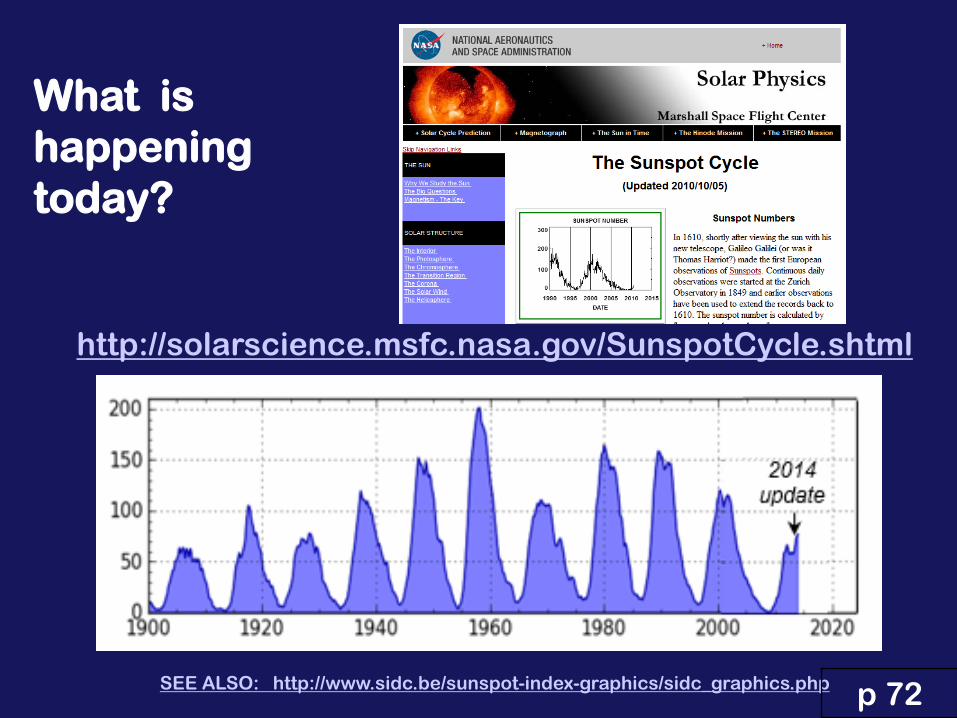
What is
happening
today?
http://solarscience.msfc.nasa.gov/SunspotCycle.shtml
SEE ALSO: http://www.sidc.be/sunspot-index-graphics/sidc_graphics.php p 72
p 72
“Clearing the Air”
in Lesson 2
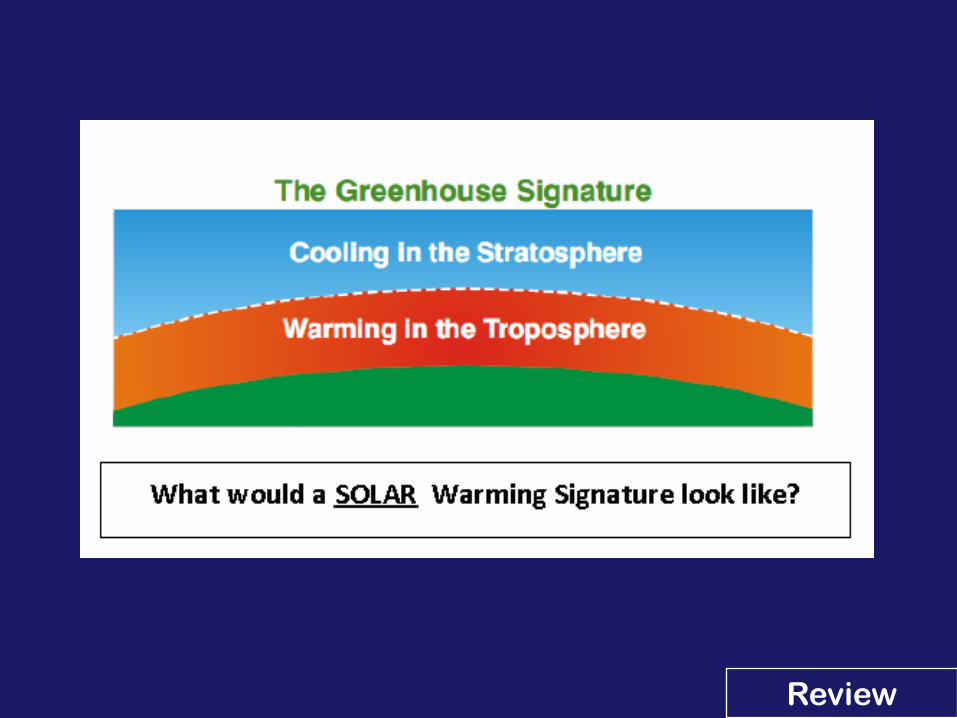
Review
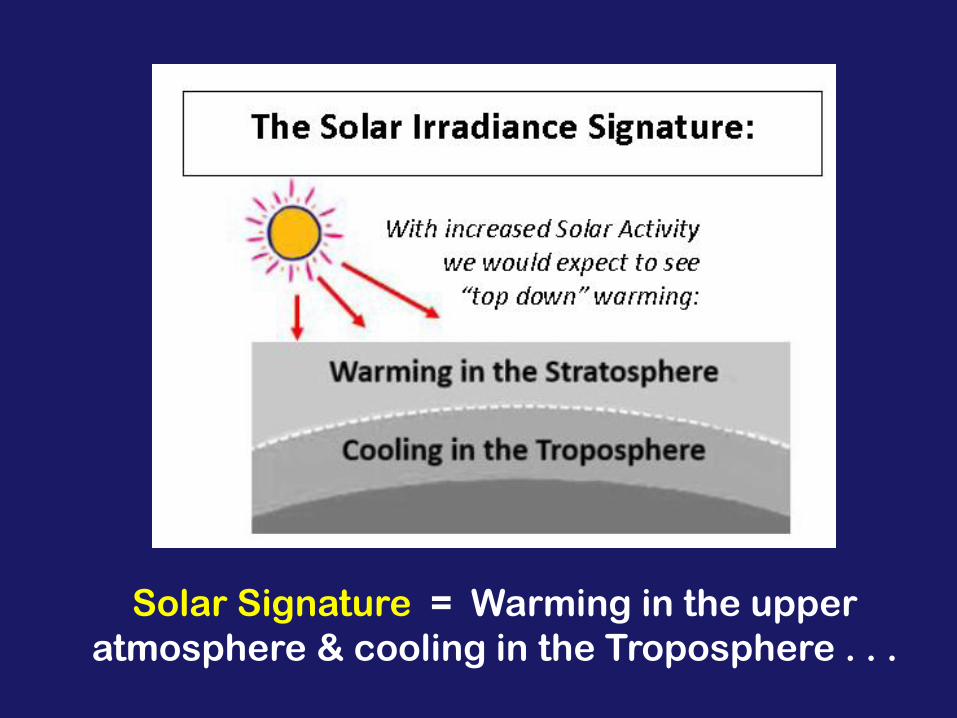
Solar Signature = Warming in the upper
atmosphere & cooling in the Troposphere . . .
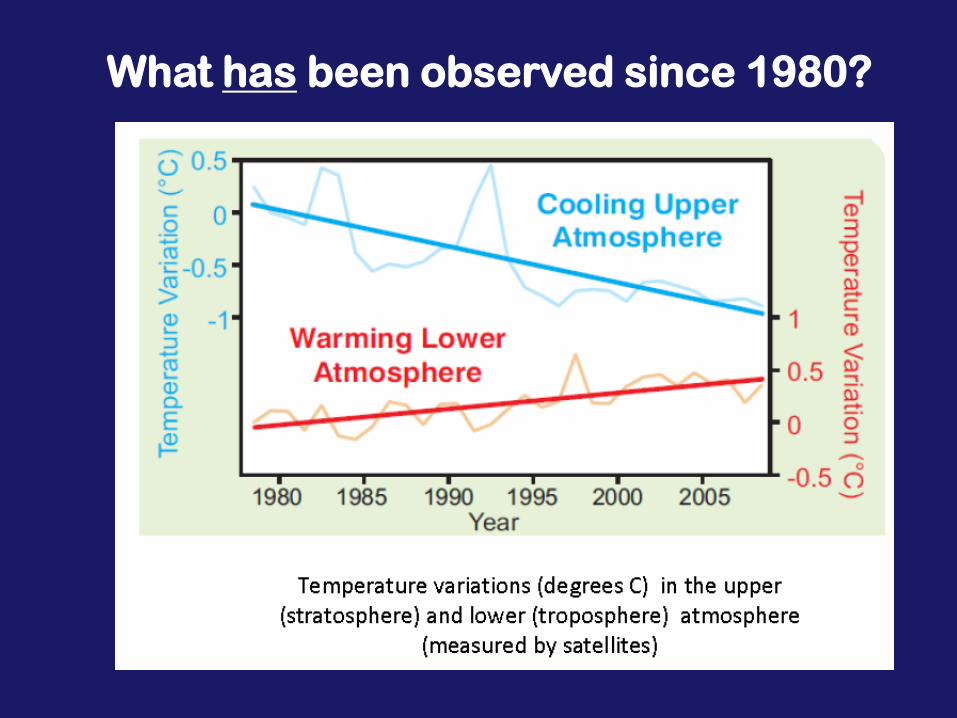
What has been observed since 1980?

Topic # 11
(Volcanic Forcing)
to be continued . . . .
SEE YOU ON TUESDAY!
STUDY HARD FOR
TEST #3 !!
Remember: the first Tree-Ring
Wood Kit Activity Session is
tomorrow afternoon @ 2 pm!!