Embed Size (px)
Citation preview
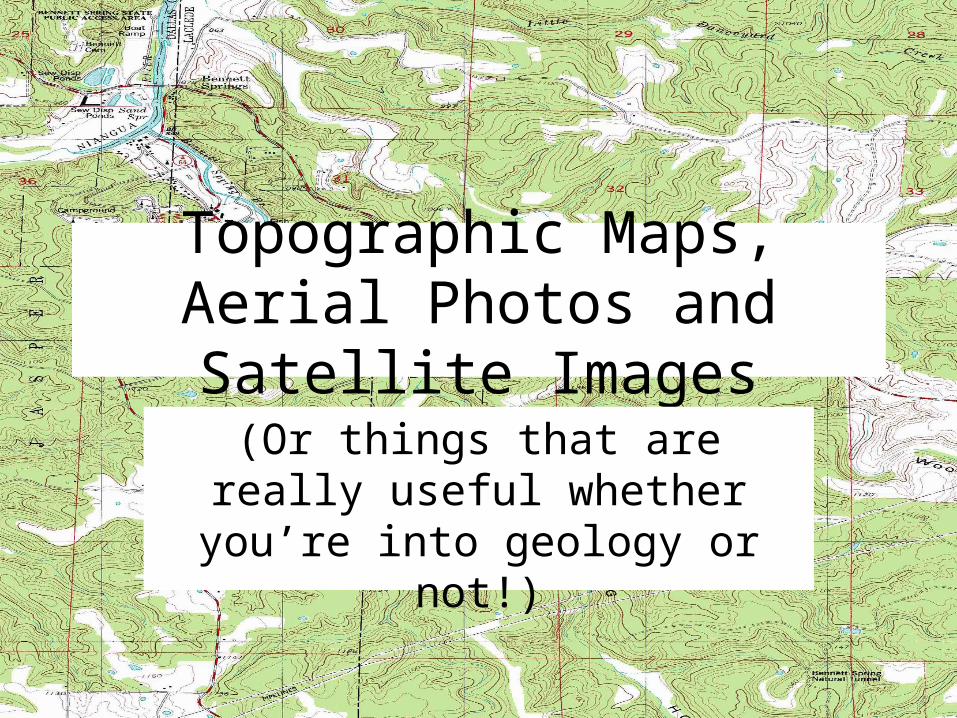
Topographic Maps, Aerial Photos and Satellite Images
(Or things that are really useful whether you’re into geology or not!)
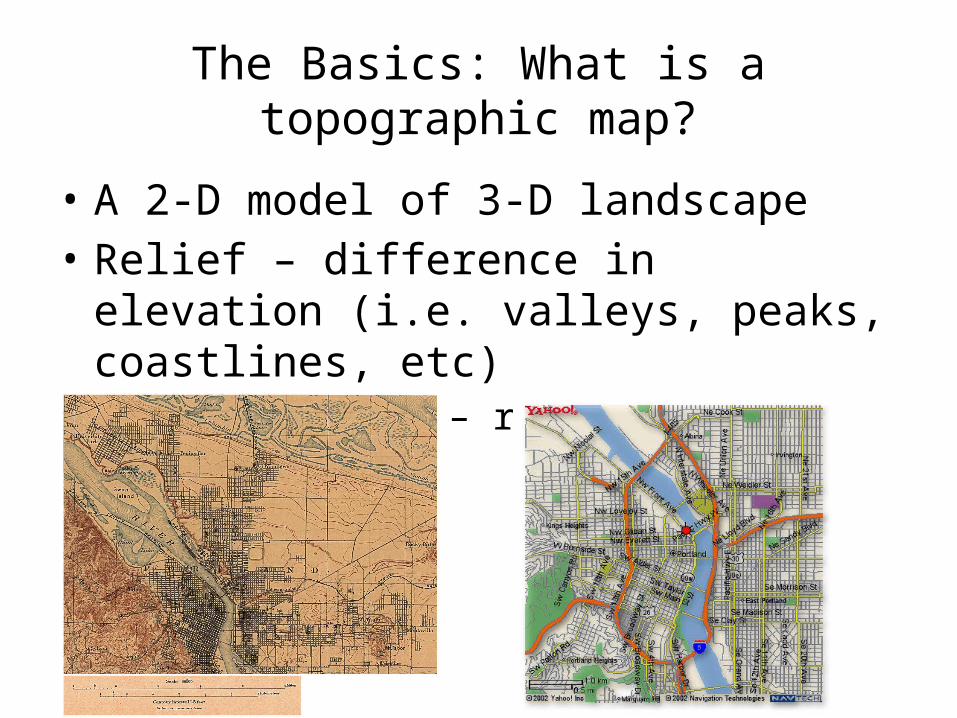
The Basics: What is a topographic map?
• A 2-D model of 3-D landscape• Relief – difference in elevation (i.e. valleys,
peaks, coastlines, etc)– Contour lines – represent elevations
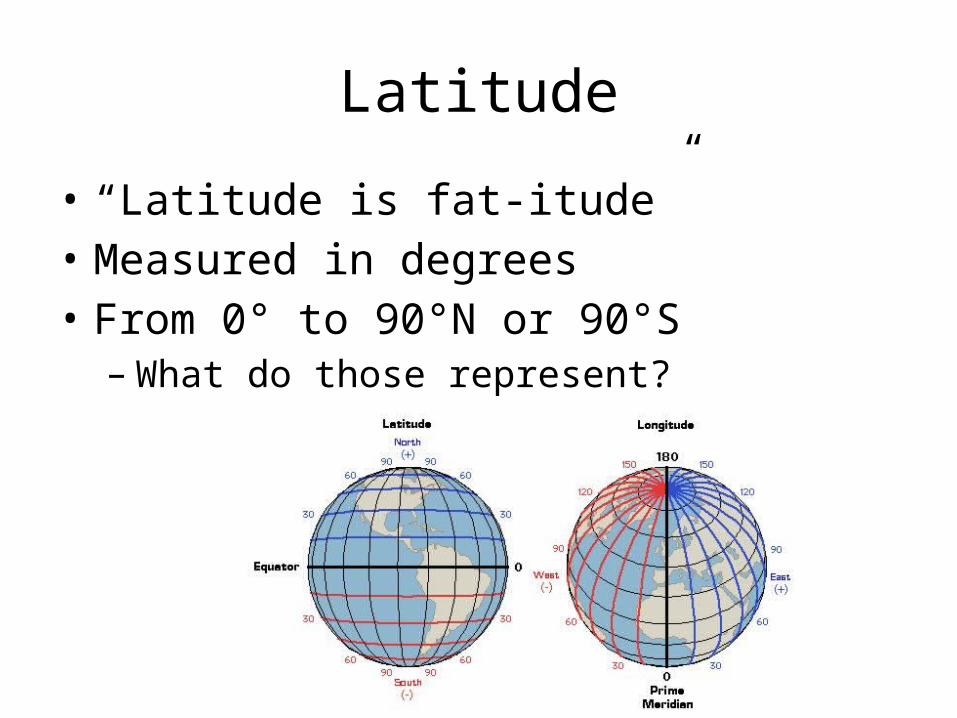
Latitude
• “Latitude is fat-itude”• Measured in degrees• From 0° to 90°N or 90°S– What do those represent?
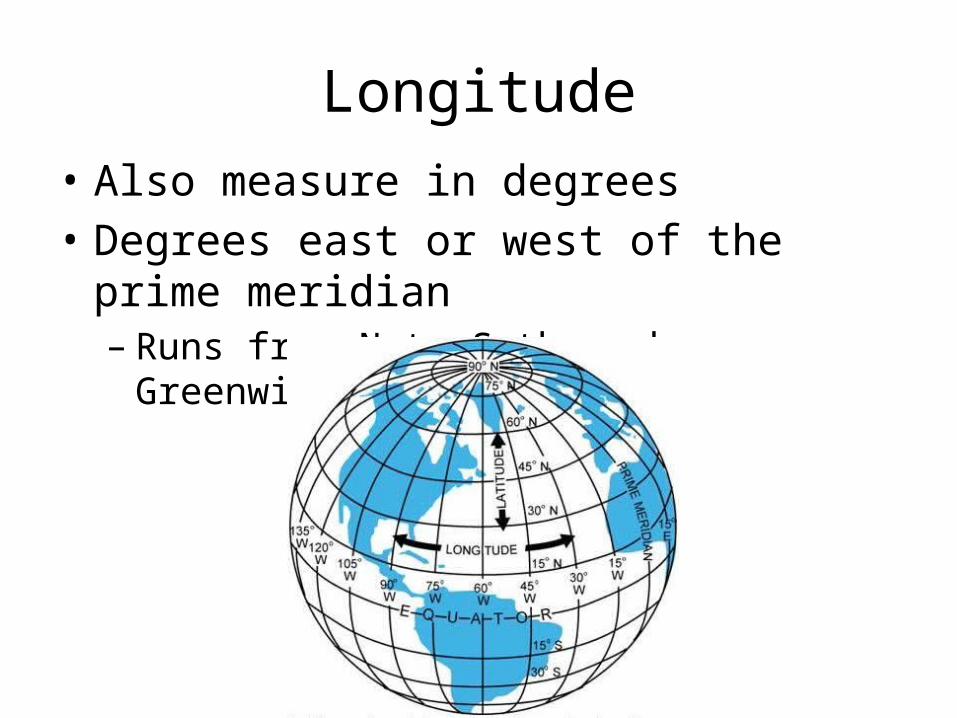
Longitude• Also measure in degrees• Degrees east or west of the prime meridian– Runs from N to S through Greenwich, UK
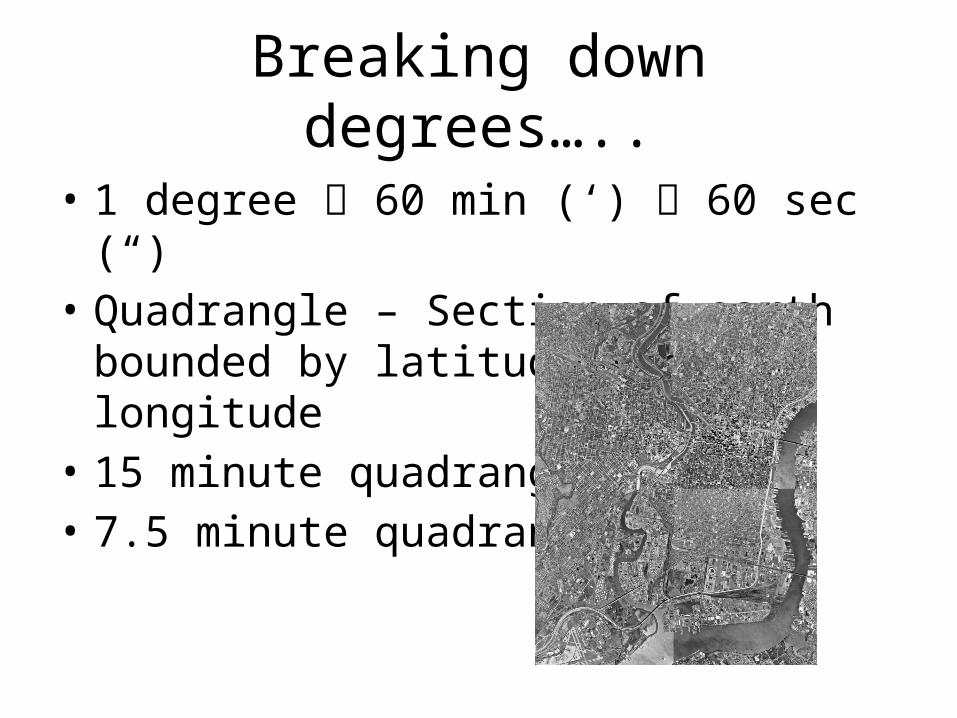
Breaking down degrees…..
• 1 degree 60 min (‘) 60 sec (“)• Quadrangle – Section of earth bounded by
latitude and longitude• 15 minute quadrangle• 7.5 minute quadrangle
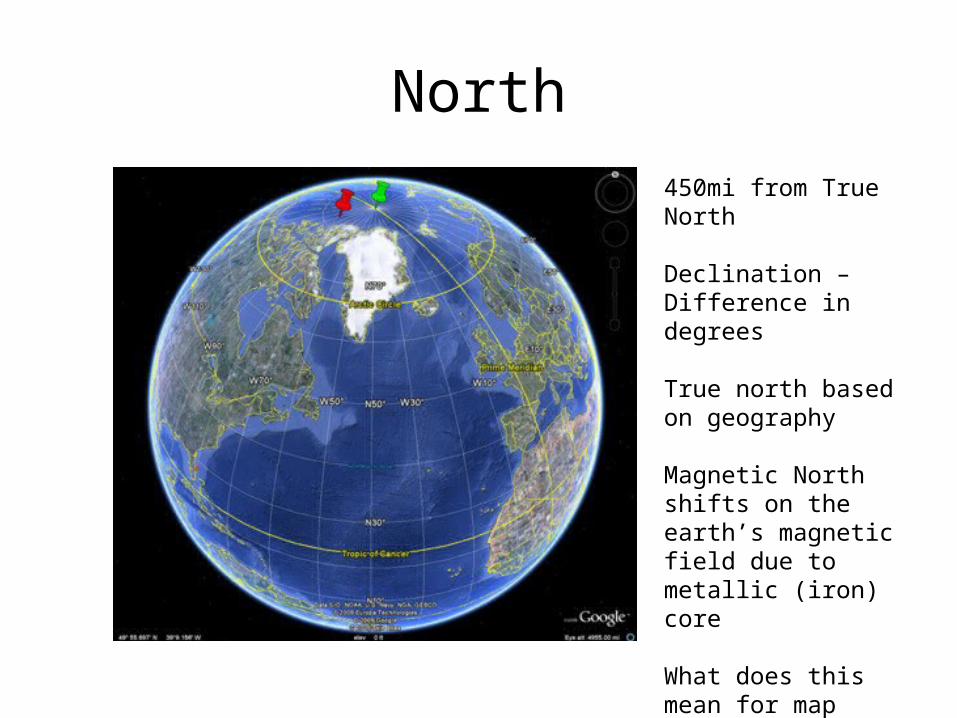
North450mi from True North
Declination – Difference in degrees
True north based on geography
Magnetic North shifts on the earth’s magnetic field due to metallic (iron) core
What does this mean for map accuracy?
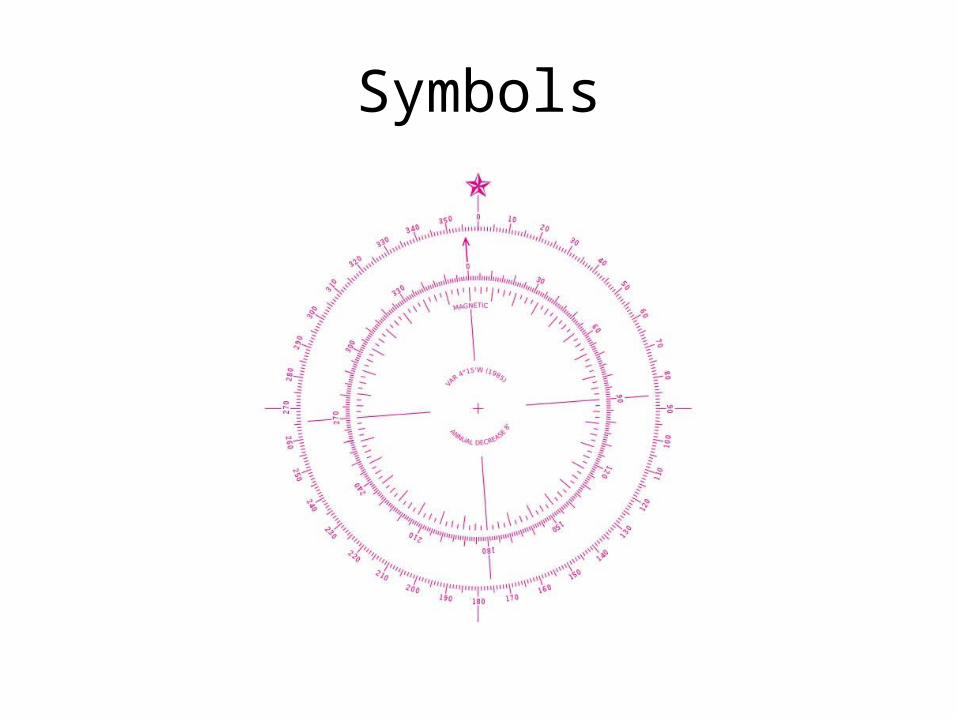
Symbols
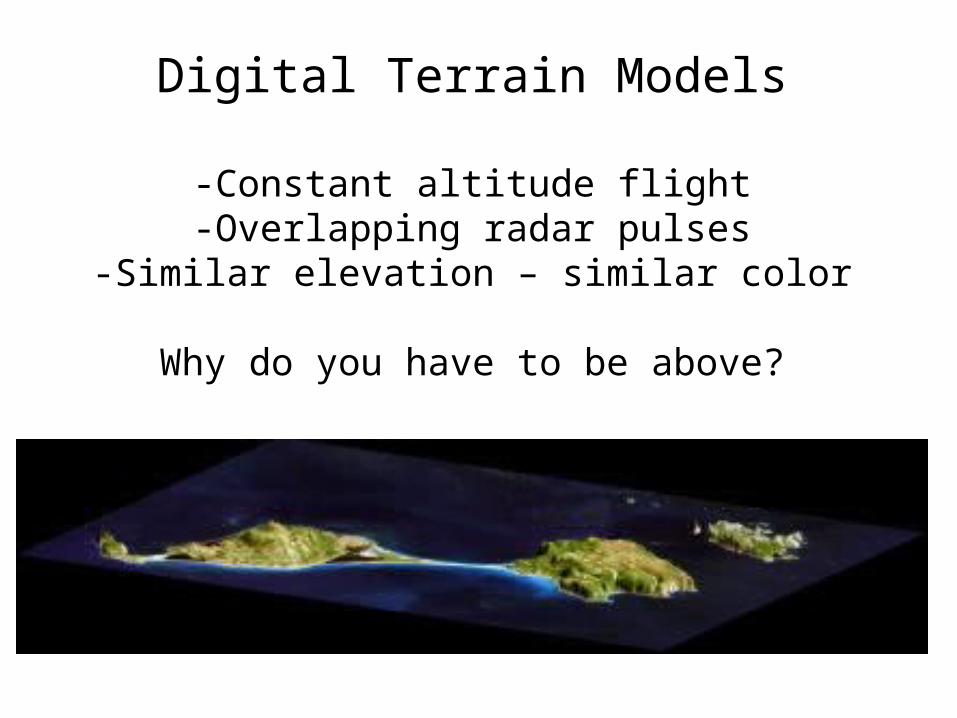
Digital Terrain Models
-Constant altitude flight-Overlapping radar pulses
-Similar elevation – similar color
Why do you have to be above?
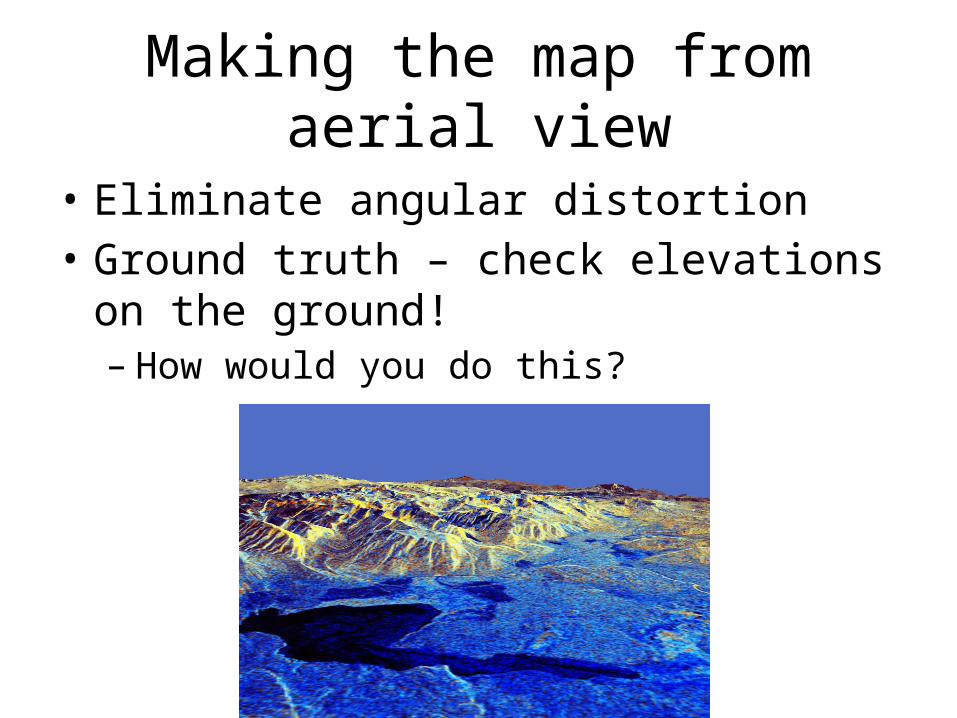
Making the map from aerial view
• Eliminate angular distortion• Ground truth – check elevations on the
ground!– How would you do this?
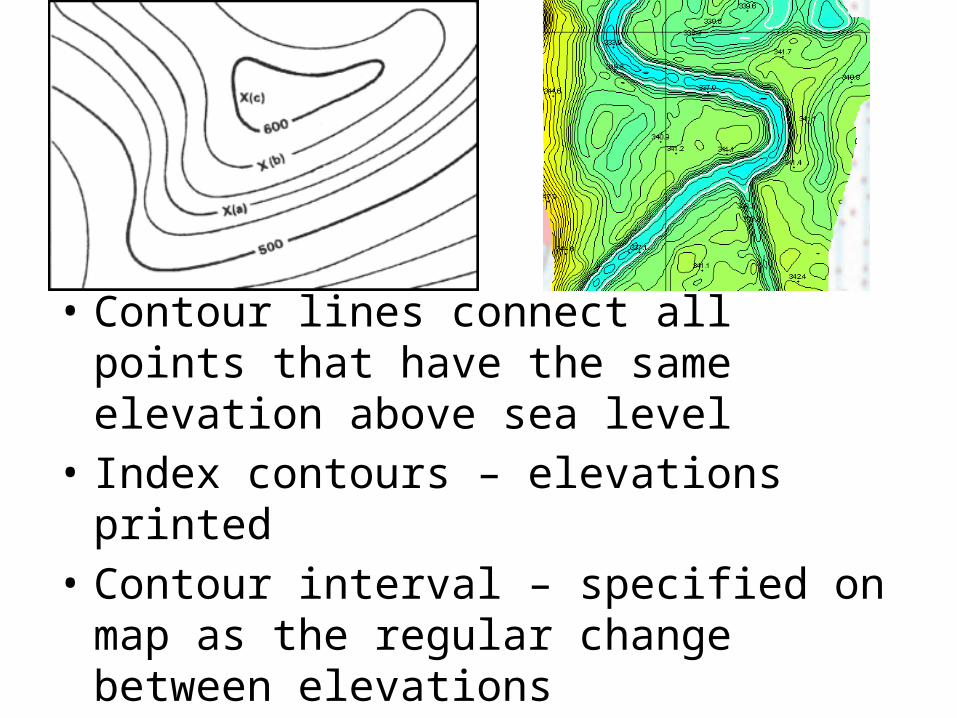
• Contour lines connect all points that have the same elevation above sea level
• Index contours – elevations printed• Contour interval – specified on map as the
regular change between elevations• Fig. 9.3 – What’s the contour interval?
-How will the contour interval change?
RULES! (And guidelines…)
• Contour lines NEVER cross? (Think about why….)
• Contour lines ALWAYS close to form a circle (unless you are going off the map)
• The tip of a V-shaped notched ALWAYS points uphill
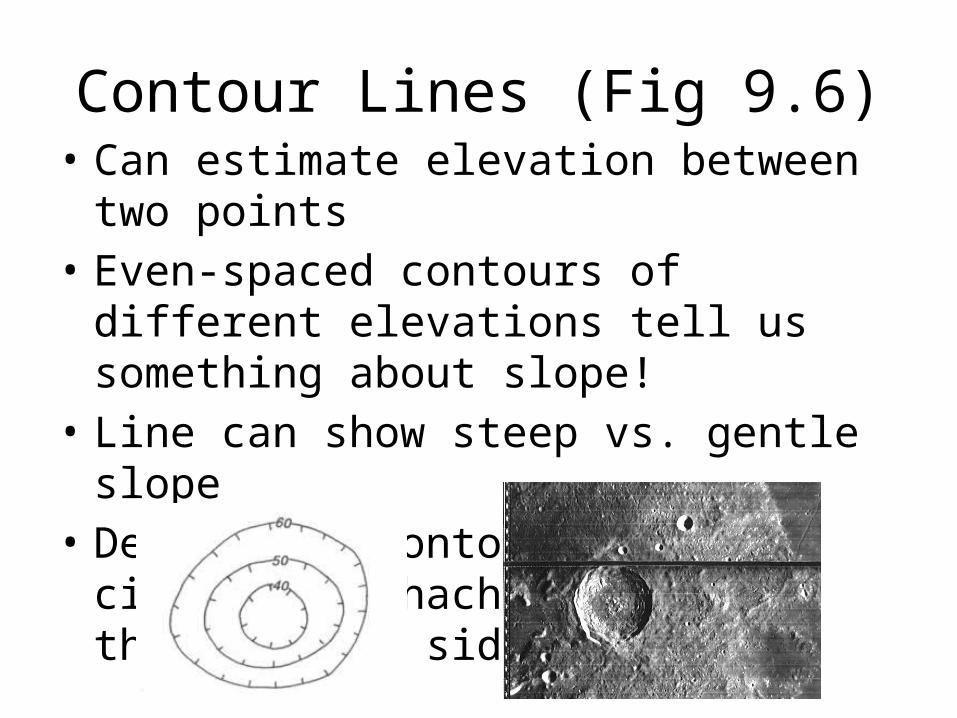
Contour Lines (Fig 9.6)• Can estimate elevation between two points• Even-spaced contours of different elevations
tell us something about slope!• Line can show steep vs. gentle slope• Depression contours – closed circle with
hachure marks on the downhill side
Reading contour lines
• Fig 9.7• What is the elevation of the middle hill?• What cardinal direction is downhill on the
valley river?• What is the easiest route up to the ridge
point?
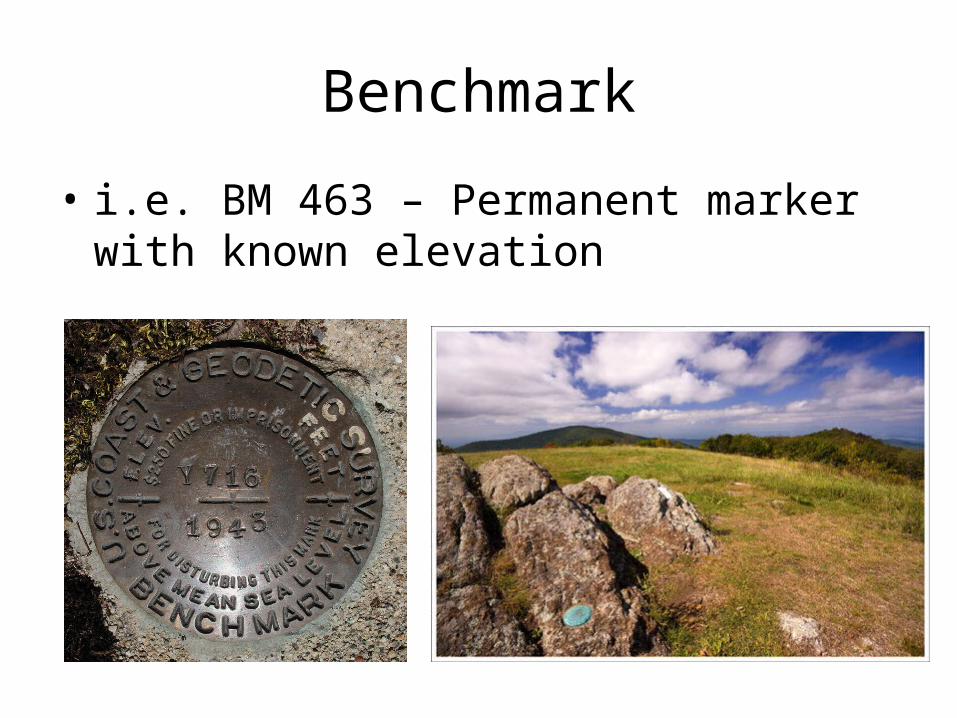
Benchmark
• i.e. BM 463 – Permanent marker with known elevation
Scales of Maps and Models
• Ratio scale• 1:50, 1:24,000, etc (Always same units)• Think of zooming in and out!• Convert!– 1:24,000 – 1in is 24,000in– 24,000in is 2000ft
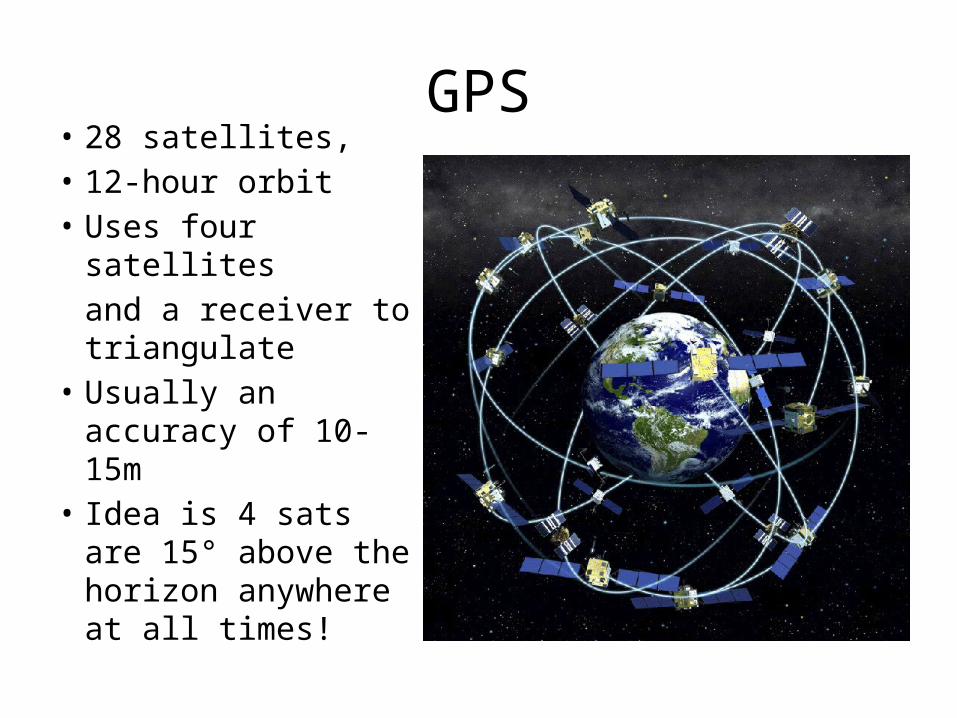
GPS• 28 satellites, • 12-hour orbit• Uses four satellites
and a receiver to triangulate
• Usually an accuracy of 10-15m
• Idea is 4 sats are 15° above the horizon anywhere at all times!
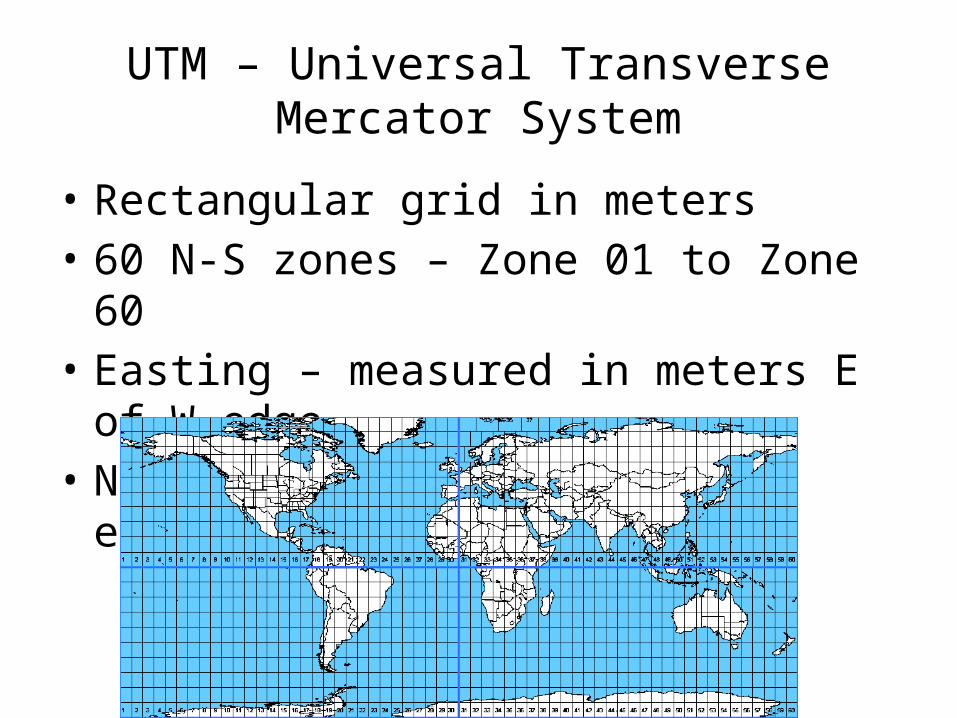
UTM – Universal Transverse Mercator System
• Rectangular grid in meters• 60 N-S zones – Zone 01 to Zone 60• Easting – measured in meters E of W edge• Northing – distance from equator in meters
Today’s Lab…..
• Complete the questions about various topo quadrangles
• Draw your own topo map– PART I– PART II