Embed Size (px)
Citation preview
Tourism, 2011
Report No. 03-51-02 (2011)
Statistics South Africa
Report No. 03-51-02 (2011)
2
Preface This report provides information collected by DHA immigration officers on South African residents and foreign travellers that passed through all South Africa air, land and sea ports of entry/exit in 2011. The report gives some results on the travel characteristics of non-visitors and same day visitors. It further presents detailed information on the mode of travel, seasonal travel patterns, purpose of visit, length of stay per month and demographic characteristics of tourists (foreign) who visited South Africa in 2011.
THE STATISTICIAN-GENERAL - STATISTICS SOUTH AFRICA PRETORIA 2012
Statistics South Africa
Report No. 03-51-02 (2011)
3
Tourism, 2011 / Statistics South Africa Published by Statistics South Africa, Private Bag X44, Pretoria 0001 © Statistics South Africa, 2012 Users may apply or process this data, provided Statistics South Africa (Stats SA) is acknowledged as the original source of the data; that it is specified that the application and/or analysis is the result of the user's independent processing of the data; and that neither the basic data nor any reprocessed version or application thereof may be sold or offered for sale in any form whatsoever without prior permission from Stats SA.
Stats SA Library Cataloguing-in-Publication (CIP) Data Tourism, 2011 / Statistics South Africa. Pretoria: Statistics South Africa, 2012 Report no. 03-51-02 (2011) 57 pp ISBN 978-0-621-40796-9 A complete set of Stats SA publications is available at Stats SA Library and the following libraries:
National Library of South Africa, Pretoria Division National Library of South Africa, Cape Town Division Library of Parliament, Cape Town Bloemfontein Public Library Natal Society Library, Pietermaritzburg Johannesburg Public Library Eastern Cape Library Services, King William’s Town Central Regional Library, Polokwane Central Reference Library, Nelspruit Central Reference Collection, Kimberley Central Reference Library, Mmabatho
This report is available on the Stats SA website: www.statssa.gov.za Copies are obtainable from: Printing and Distribution, Statistics South Africa Tel: (012) 310 8093 (012) 310 8251 (012) 310 8358 (012) 310 8161 Fax: (012) 321 7381 Email: [email protected] [email protected]
Statistics South Africa
Report No. 03-51-02 (2011)
4 CONTENTS 1. KEY FINDINGS...................................................................................................................................................................... 6 1.1 Introduction .................................................................................................................................................................... 6 1.2 Data ........................................................................................................................................................................... 6 1.3 Number of travellers ....................................................................................................................................................... 6 1.4 South African residents .................................................................................................................................................. 6 1.5 Foreign travellers ........................................................................................................................................................... 7 1.6 Same day visitors ........................................................................................................................................................... 7 1.7 Tourists .......................................................................................................................................................................... 7 1.7.1 Region of residence ............................................................................................................................................. 7 1.7.2 Mode of travel ...................................................................................................................................................... 8 1.7.3 Purpose of visit .................................................................................................................................................... 8 1.7.4 Duration of stay .................................................................................................................................................... 9 1.7.5 Sex and age distribution ....................................................................................................................................... 9 1.8 Summary........................................................................................................................................................................ 9 2. FIGURES ......................................................................................................................................................................... 10 Figure 1. Number of arrivals and departures by year of travel, 2000–2011 ..................................................................... 10 Figure 2. Number of arrivals and departures of South African residents by year of travel, 2000–2011 ............................ 11 Figure 3. Number of arrivals and departures of foreign travellers by year of travel, 2000–2011 ...................................... 12 Figure 4. Number of tourists by month and year of travel, 2010 and 2011 ....................................................................... 13 Figure 5. Number of tourists from eight leading overseas countries in 2010 and 2011 .................................................... 14 Figure 6. Number of tourists from eight leading SADC countries in 2010 and 2011 ........................................................ 14 Figure 7. Number of tourists from eight leading ‘other’ African countries in 2010 and 2011 ............................................ 14 Figure 8. Percentage distribution of tourists by region and purpose of visit, 2011 ........................................................... 14 Figure 9a. Percentage distribution of tourists from overseas countries on holiday, 2011 ................................................... 15 Figure 9b. Percentage distribution of tourists from overseas countries on business, 2011 ................................................ 15 Figure 9c. Percentage distribution of tourists from overseas countries on study, 2011 ...................................................... 15 Figure 10a. Percentage distribution of tourists from SADC countries on holiday, 2011 ....................................................... 15 Figure 10b. Percentage distribution of tourists from SADC countries on business, 2011 .................................................... 16 Figure 10c. Percentage distribution of tourists from SADC countries on study, 2011 .......................................................... 16 Figure 11a. Percentage distribution of tourists from ‘other’ African countries on holiday, 2011 ........................................... 16 Figure 11b. Percentage distribution of tourists from ‘other’ African countries on business, 2011 ........................................ 16 Figure 11c. Percentage distribution of tourists from ‘other’ African countries on study, 2011 .............................................. 17 Figure 12. Average (median) number of days tourists spent by month of arrival, 2011 ..................................................... 17 3. TABLES …...................................................................................................................................................................... 18 Table 1. Number of foreign travellers and South African residents by year of travel, 2000–2011 ................................... 18 Table 2. Number of arrivals and departures of South African residents by mode of travel and place of arrival or
departure, 2011 ................................................................................................................................................ 19 Table 3. Number of foreign arrivals by purpose of visit and month of arrival, 2011 ......................................................... 20 Table 4. Number of foreign arrivals and departures by mode of travel and place of arrival or departure, 2011 .............. 21 Table 5. Number of foreign arrivals by type of visitor and month of arrival, 2011 ............................................................ 22 Table 6. Number of same day visitors by mode of travel, region of residence and purpose of visit, 2011 ...................... 23 Table 7. Number of tourists by region of residence and month of arrival, 2011 .............................................................. 24 Table 8. Number of tourists by mode of travel, place and month of arrival, 2011 ........................................................... 25 Table 9. Number of tourists by region of residence and mode of travel, 2011 ................................................................ 26 Table 10. Number of tourists from eight leading overseas countries in 2011 and their percentage change from 2010 .... 27 Table 11. Number of tourists from eight leading SADC countries in 2011 and their percentage change from 2010 ......... 27 Table 12. Number of tourists from eight leading ‘other’ African countries in 2011 and their percentage change from
2010 ................................................................................................................................................................. 27 Table 13. Number of tourists by sex, age group and region of residence, 2011 ............................................................... 28
Statistics South Africa
Report No. 03-51-02 (2011)
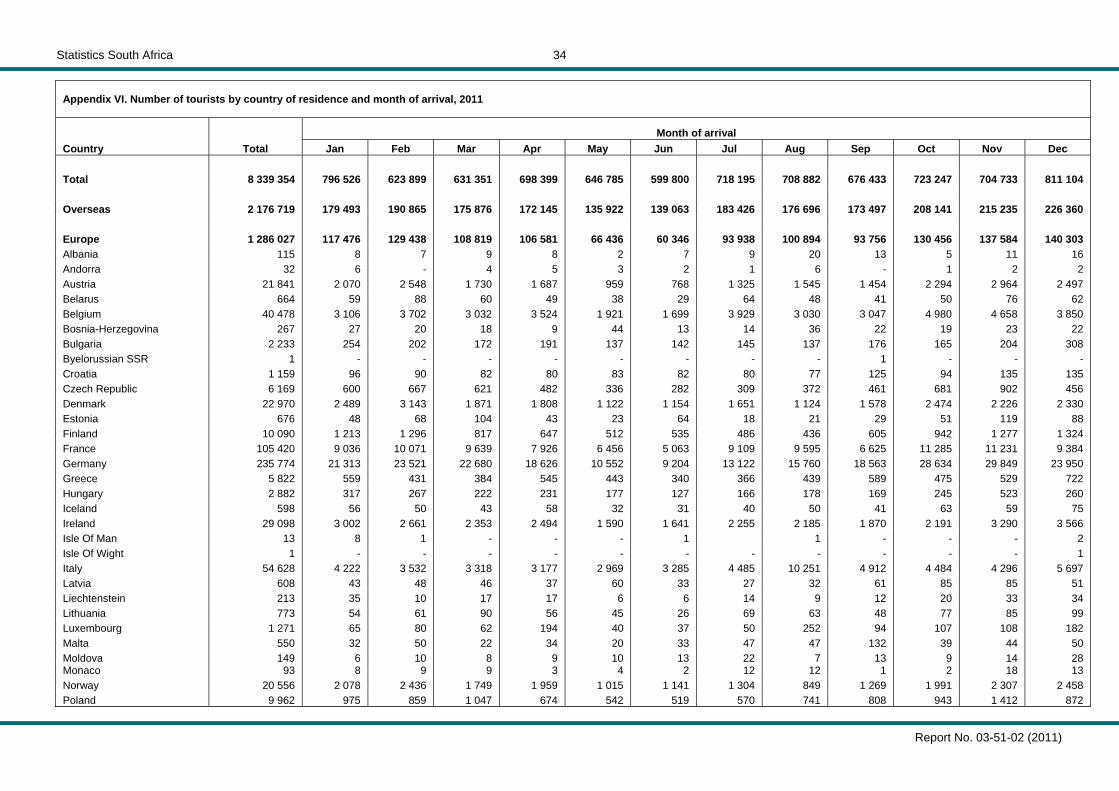
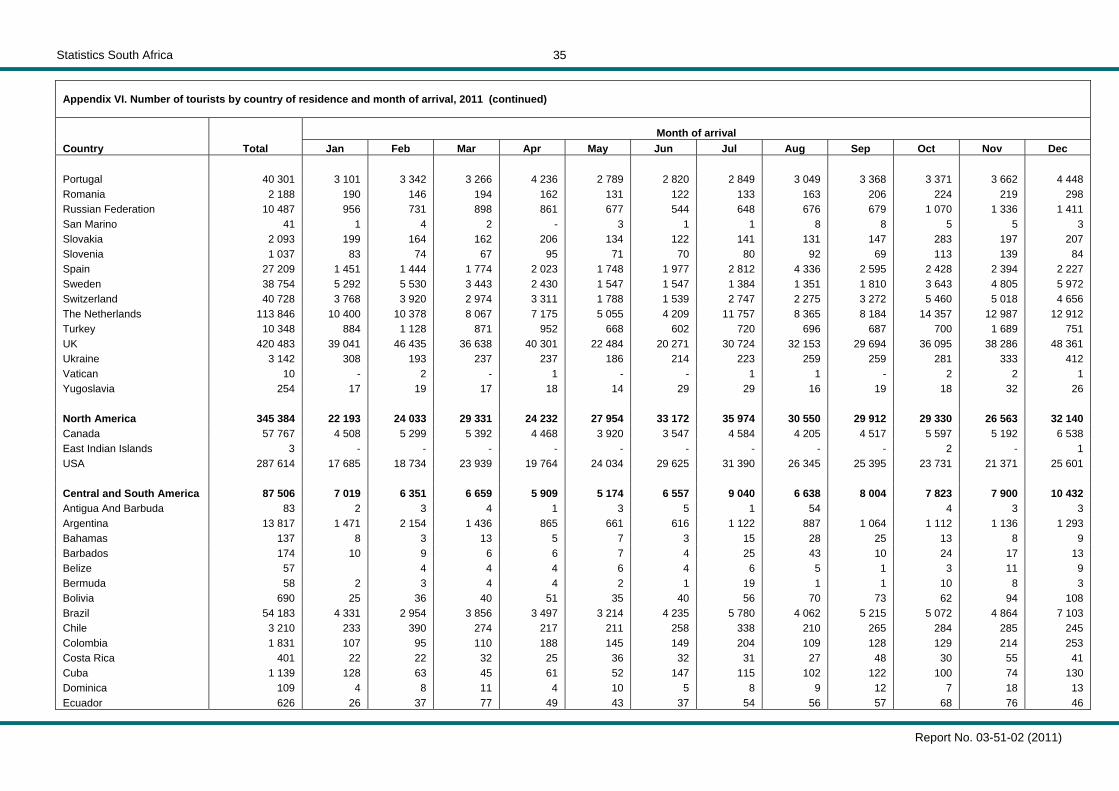
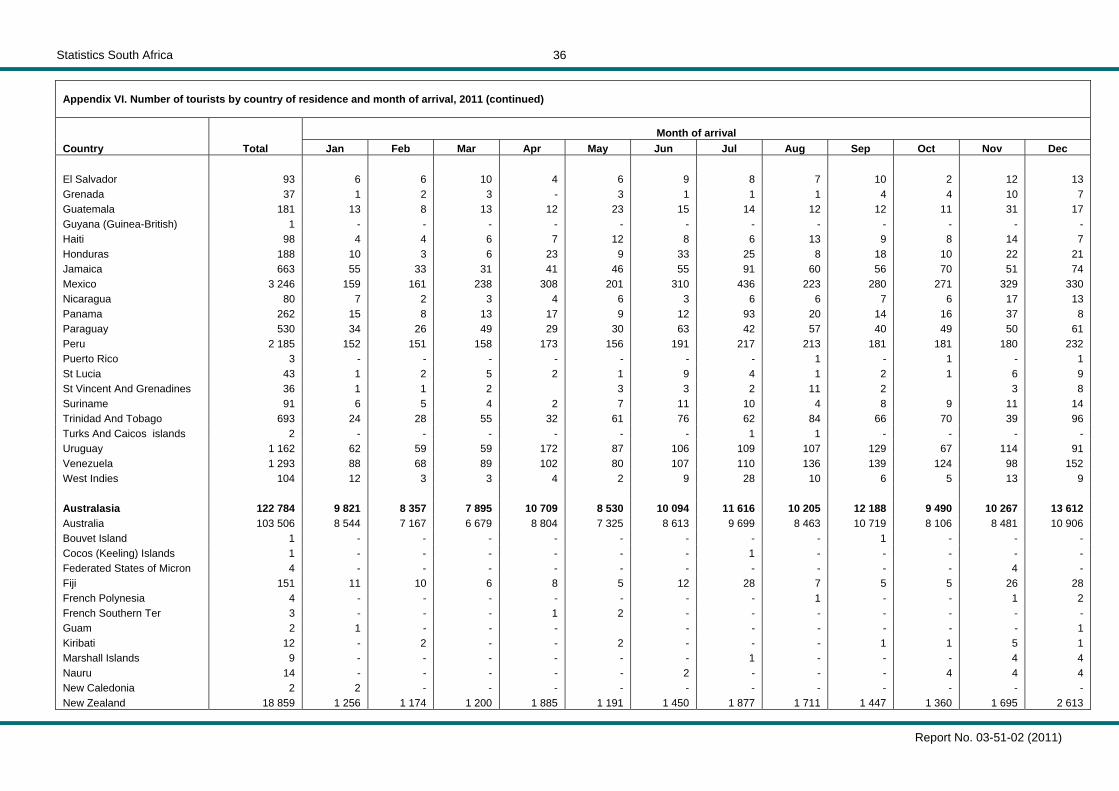
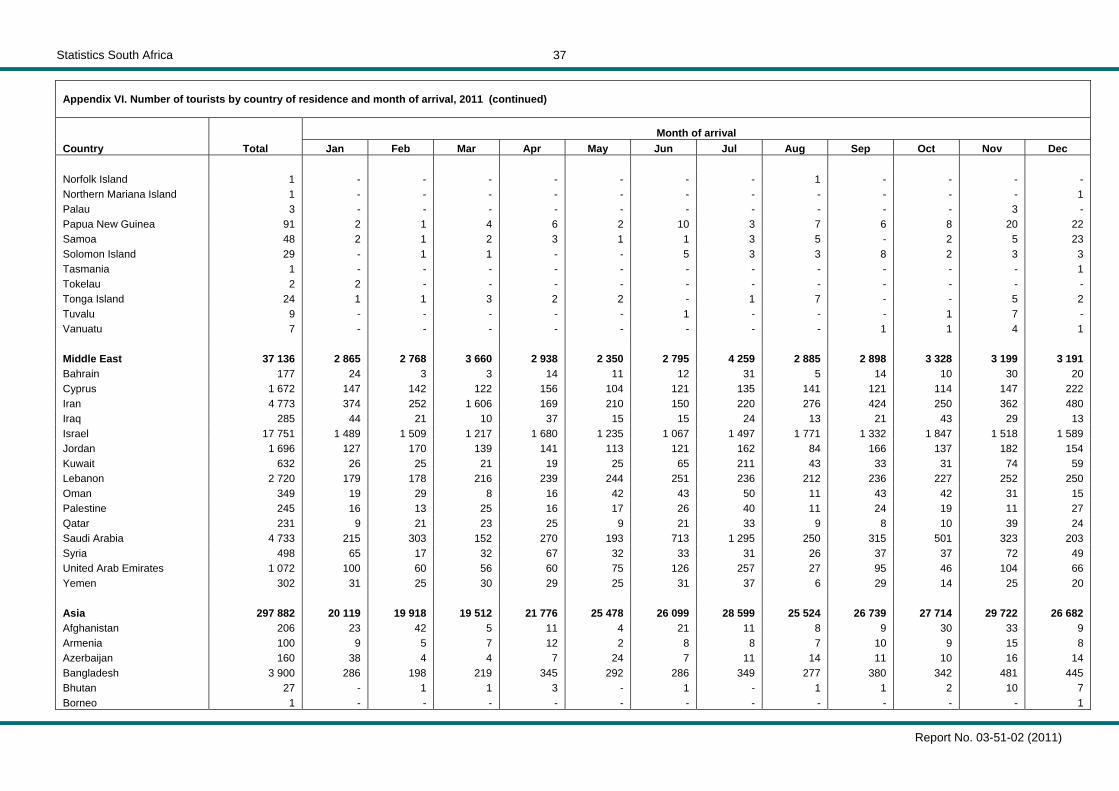
5 4. APPENDICES ...................................................................................................................................................................... 29 Appendix I. Ports of entry/exit in South Africa ................................................................................................................. 29 Appendix II. Number of South African residents by mode of travel, place and month of arrival, 2011 ............................. 30 Appendix III. Number of South African residents by mode of travel, place and month of departure, 2011 ........................ 31 Appendix IV. Number of foreign arrivals by mode of travel, place and month of arrival, 2011 .......................................... 32 Appendix V. Number of foreign departures by mode of travel, place and month of departure, 2011 ............................... 33 Appendix VI. Number of tourists by country of residence and month of arrival, 2011 ....................................................... 34 Appendix VII. Number of tourists by country of residence and mode of travel, 2011 ......................................................... 41 Appendix VIII. Number of tourists by country of residence and purpose of visit, 2011 ........................................................ 48 Appendix IX. Number of tourists by sex, age group and month of arrival, 2011 ................................................................ 55 5. DEFINITION OF TERMS ..................................................................................................................................................... 56 6. OTHER STATS SA REPORTS............................................................................................................................................ 57
Statistics South Africa
Report No. 03-51-02 (2011)
6 1. KEY FINDINGS
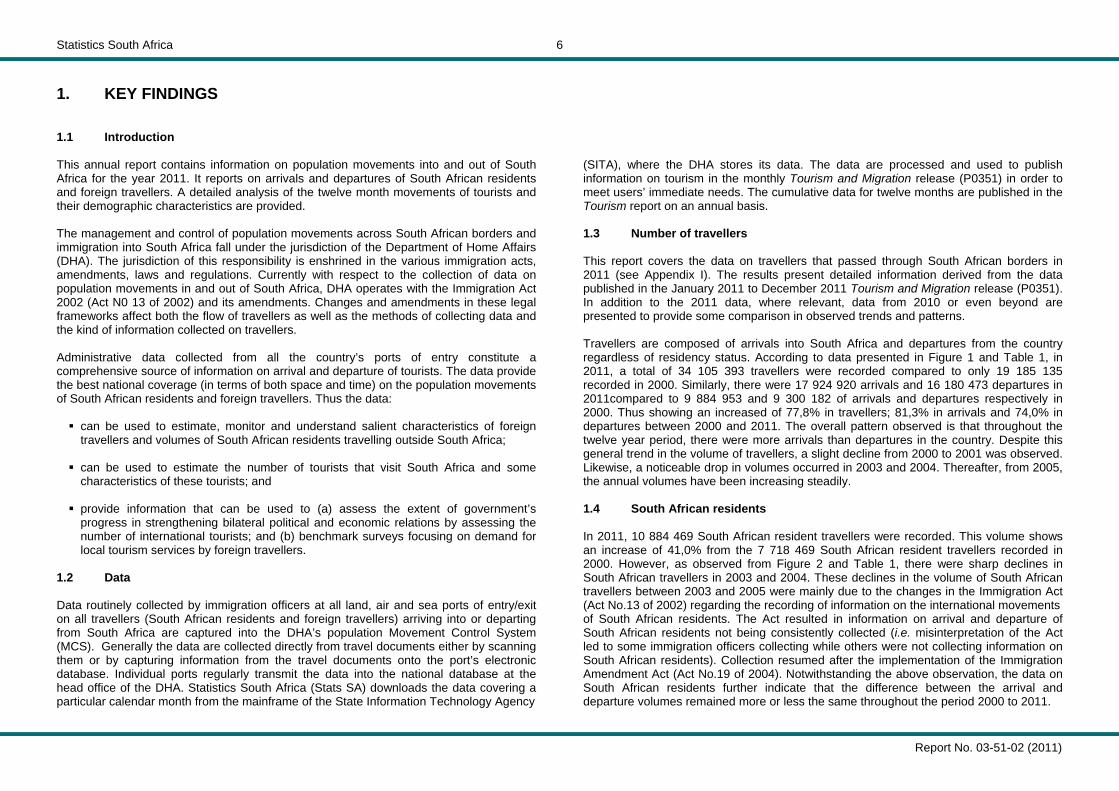
1.1 Introduction This annual report contains information on population movements into and out of South Africa for the year 2011. It reports on arrivals and departures of South African residents and foreign travellers. A detailed analysis of the twelve month movements of tourists and their demographic characteristics are provided. The management and control of population movements across South African borders and immigration into South Africa fall under the jurisdiction of the Department of Home Affairs (DHA). The jurisdiction of this responsibility is enshrined in the various immigration acts, amendments, laws and regulations. Currently with respect to the collection of data on population movements in and out of South Africa, DHA operates with the Immigration Act 2002 (Act N0 13 of 2002) and its amendments. Changes and amendments in these legal frameworks affect both the flow of travellers as well as the methods of collecting data and the kind of information collected on travellers. Administrative data collected from all the country’s ports of entry constitute a comprehensive source of information on arrival and departure of tourists. The data provide the best national coverage (in terms of both space and time) on the population movements of South African residents and foreign travellers. Thus the data:
can be used to estimate, monitor and understand salient characteristics of foreign travellers and volumes of South African residents travelling outside South Africa;
can be used to estimate the number of tourists that visit South Africa and some characteristics of these tourists; and
provide information that can be used to (a) assess the extent of government’s progress in strengthening bilateral political and economic relations by assessing the number of international tourists; and (b) benchmark surveys focusing on demand for local tourism services by foreign travellers.
1.2 Data Data routinely collected by immigration officers at all land, air and sea ports of entry/exit on all travellers (South African residents and foreign travellers) arriving into or departing from South Africa are captured into the DHA’s population Movement Control System (MCS). Generally the data are collected directly from travel documents either by scanning them or by capturing information from the travel documents onto the port’s electronic database. Individual ports regularly transmit the data into the national database at the head office of the DHA. Statistics South Africa (Stats SA) downloads the data covering a particular calendar month from the mainframe of the State Information Technology Agency
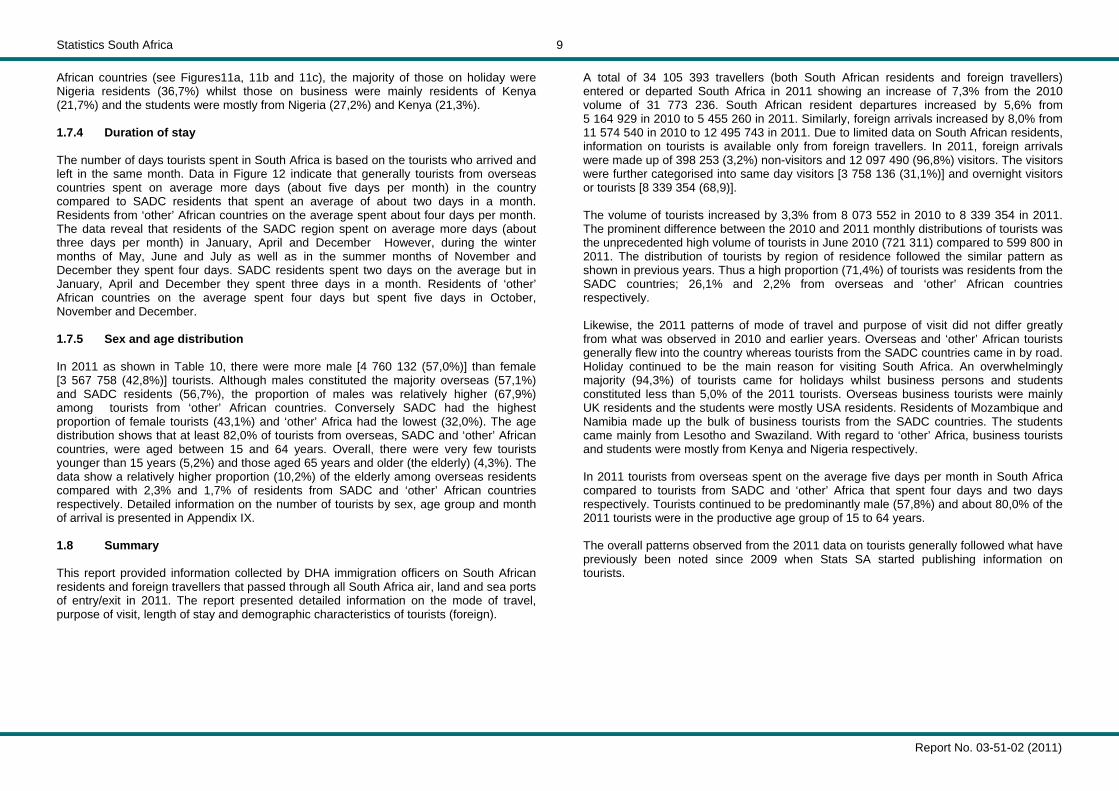
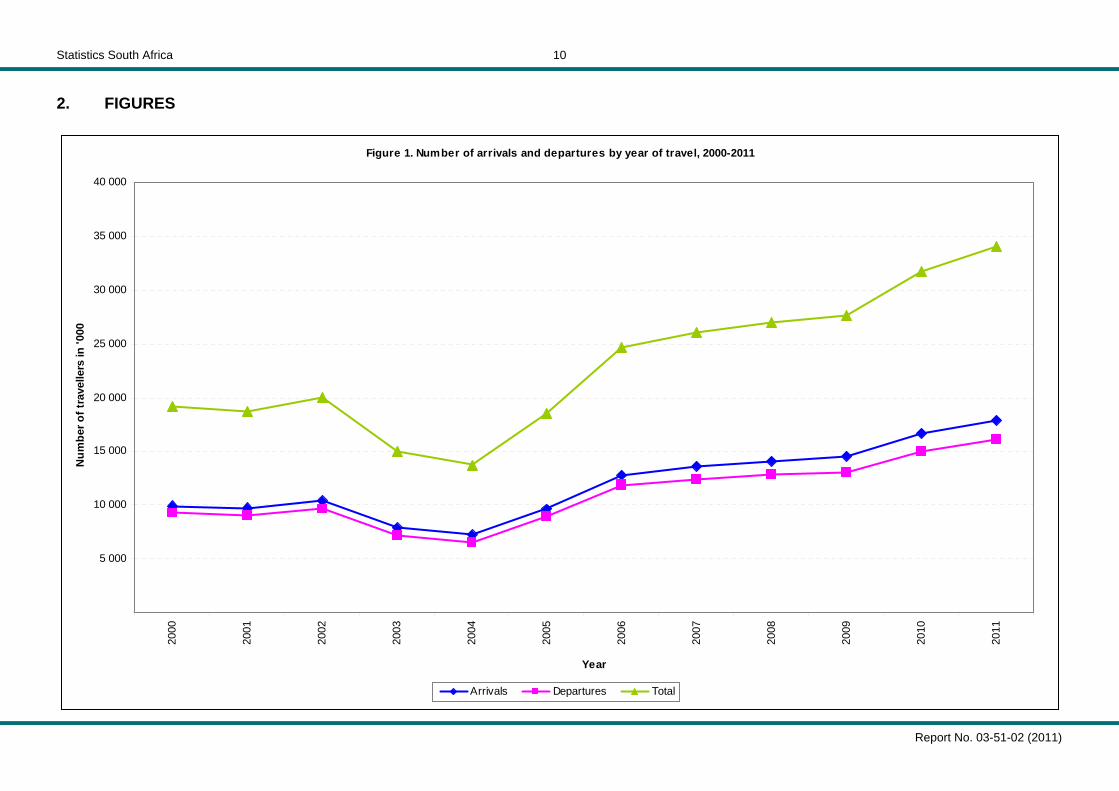
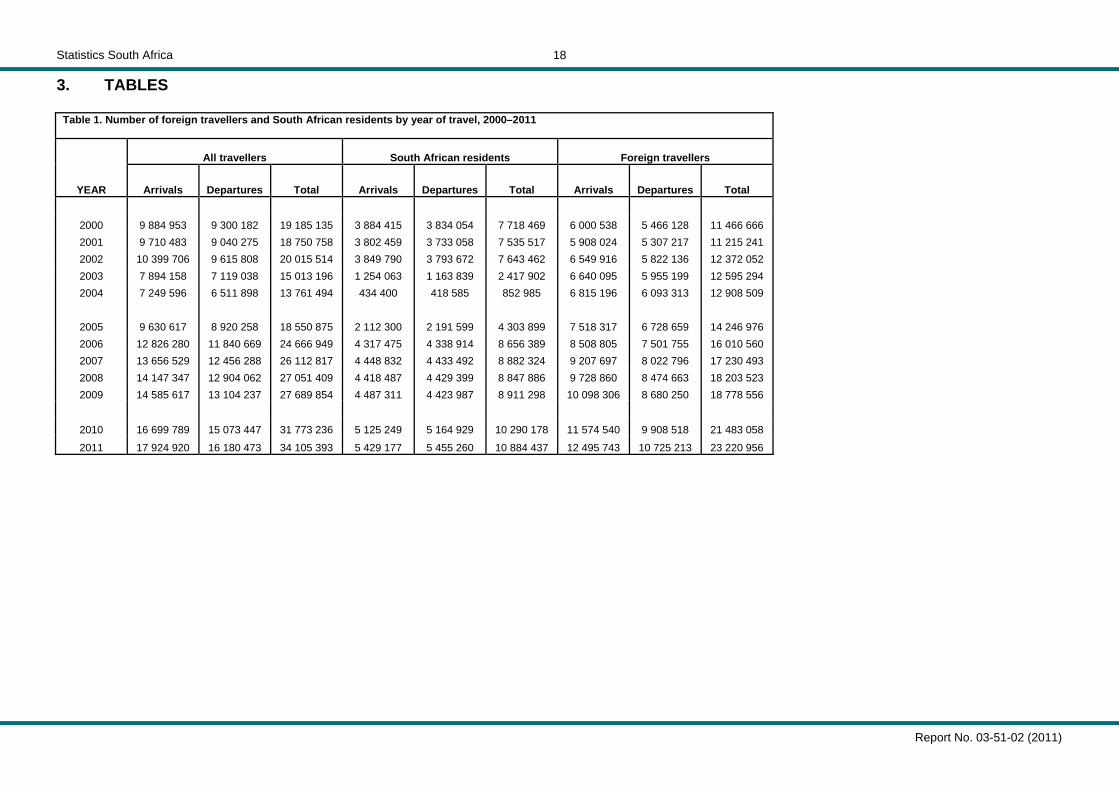
(SITA), where the DHA stores its data. The data are processed and used to publish information on tourism in the monthly Tourism and Migration release (P0351) in order to meet users’ immediate needs. The cumulative data for twelve months are published in the Tourism report on an annual basis. 1.3 Number of travellers This report covers the data on travellers that passed through South African borders in 2011 (see Appendix I). The results present detailed information derived from the data published in the January 2011 to December 2011 Tourism and Migration release (P0351). In addition to the 2011 data, where relevant, data from 2010 or even beyond are presented to provide some comparison in observed trends and patterns. Travellers are composed of arrivals into South Africa and departures from the country regardless of residency status. According to data presented in Figure 1 and Table 1, in 2011, a total of 34 105 393 travellers were recorded compared to only 19 185 135 recorded in 2000. Similarly, there were 17 924 920 arrivals and 16 180 473 departures in 2011compared to 9 884 953 and 9 300 182 of arrivals and departures respectively in 2000. Thus showing an increased of 77,8% in travellers; 81,3% in arrivals and 74,0% in departures between 2000 and 2011. The overall pattern observed is that throughout the twelve year period, there were more arrivals than departures in the country. Despite this general trend in the volume of travellers, a slight decline from 2000 to 2001 was observed. Likewise, a noticeable drop in volumes occurred in 2003 and 2004. Thereafter, from 2005, the annual volumes have been increasing steadily. 1.4 South African residents In 2011, 10 884 469 South African resident travellers were recorded. This volume shows an increase of 41,0% from the 7 718 469 South African resident travellers recorded in 2000. However, as observed from Figure 2 and Table 1, there were sharp declines in South African travellers in 2003 and 2004. These declines in the volume of South African travellers between 2003 and 2005 were mainly due to the changes in the Immigration Act (Act No.13 of 2002) regarding the recording of information on the international movements of South African residents. The Act resulted in information on arrival and departure of South African residents not being consistently collected (i.e. misinterpretation of the Act led to some immigration officers collecting while others were not collecting information on South African residents). Collection resumed after the implementation of the Immigration Amendment Act (Act No.19 of 2004). Notwithstanding the above observation, the data on South African residents further indicate that the difference between the arrival and departure volumes remained more or less the same throughout the period 2000 to 2011.
Statistics South Africa
Report No. 03-51-02 (2011)
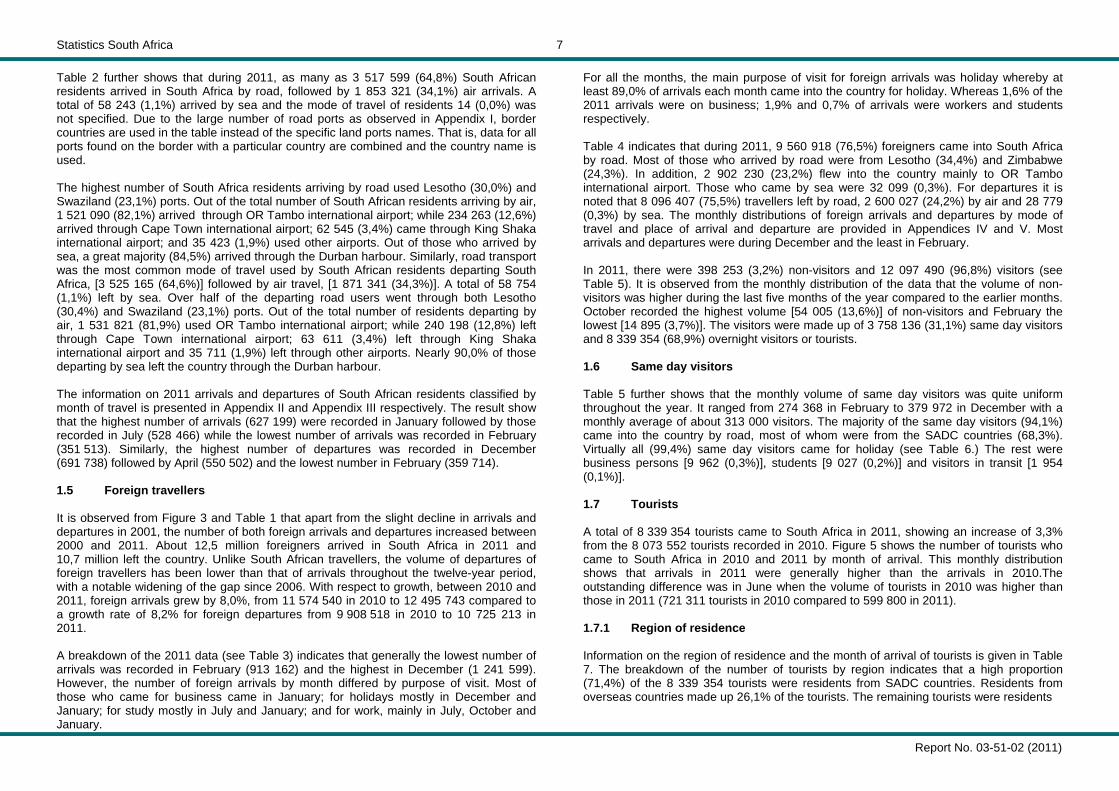
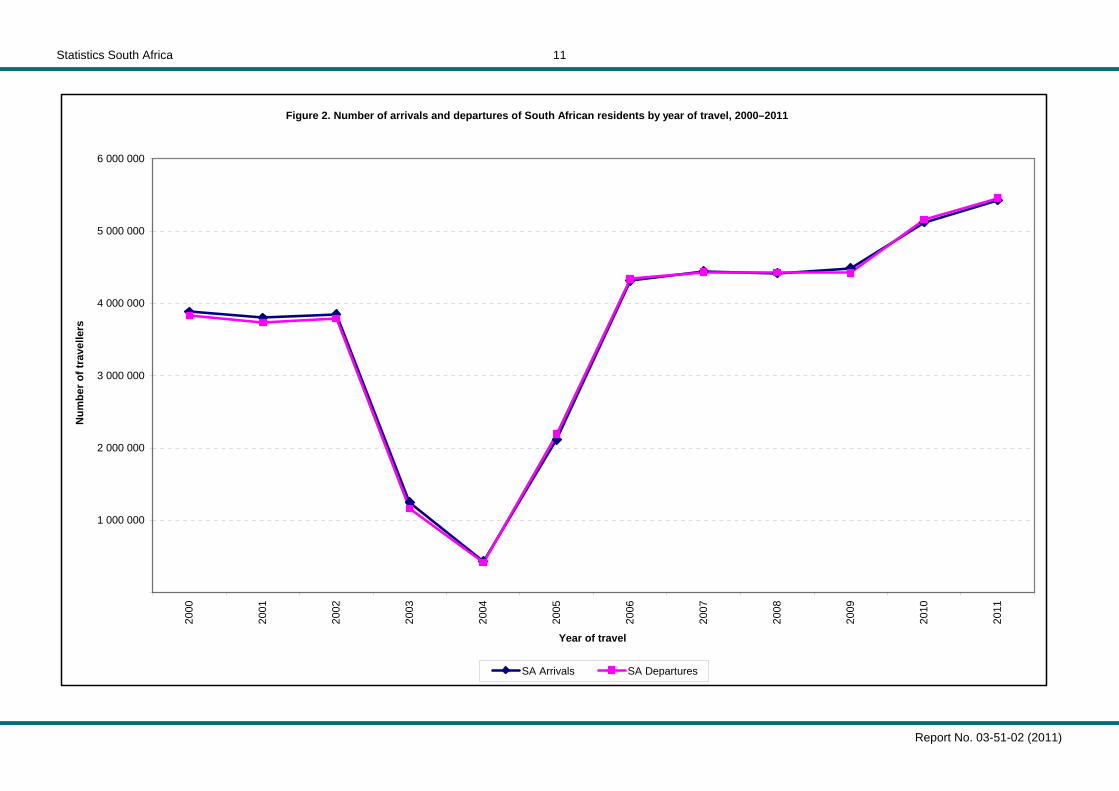
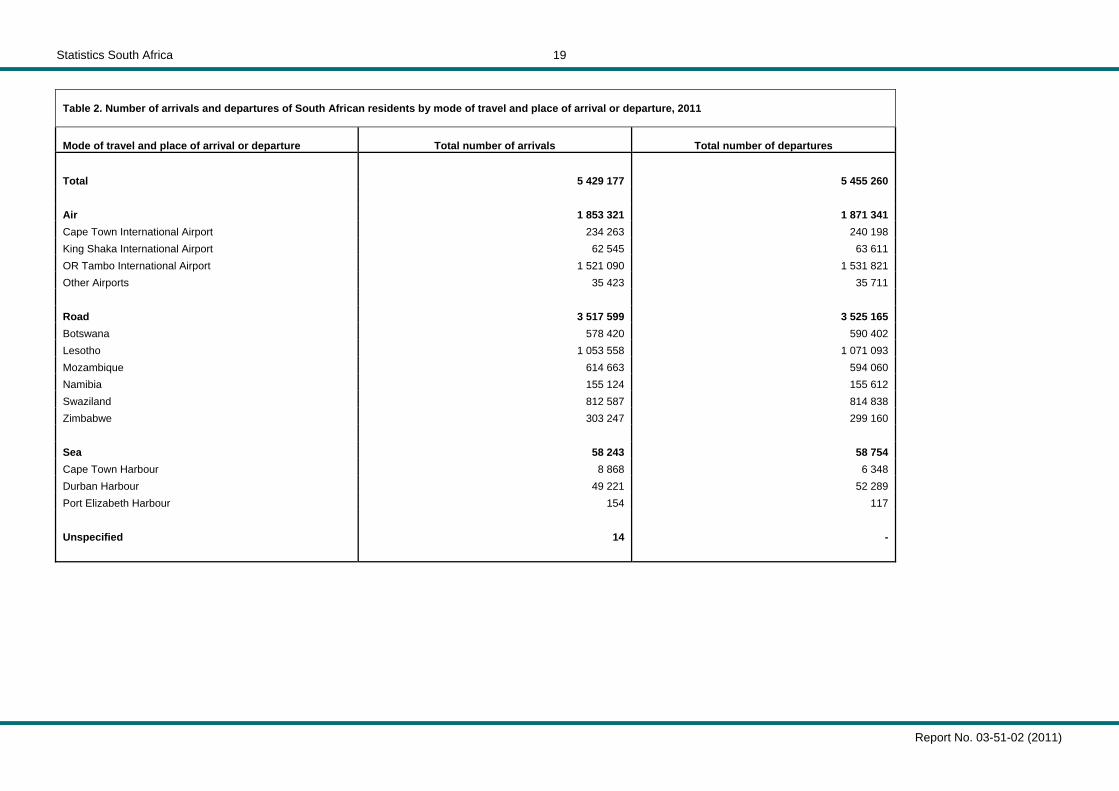
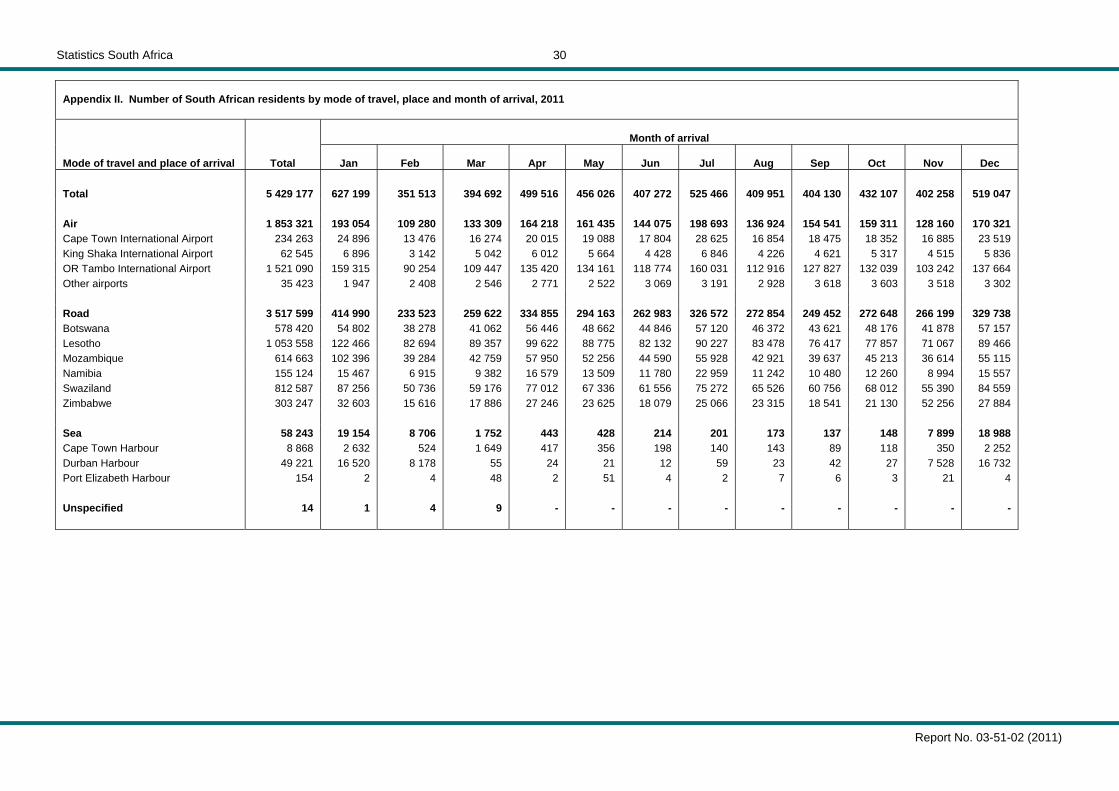
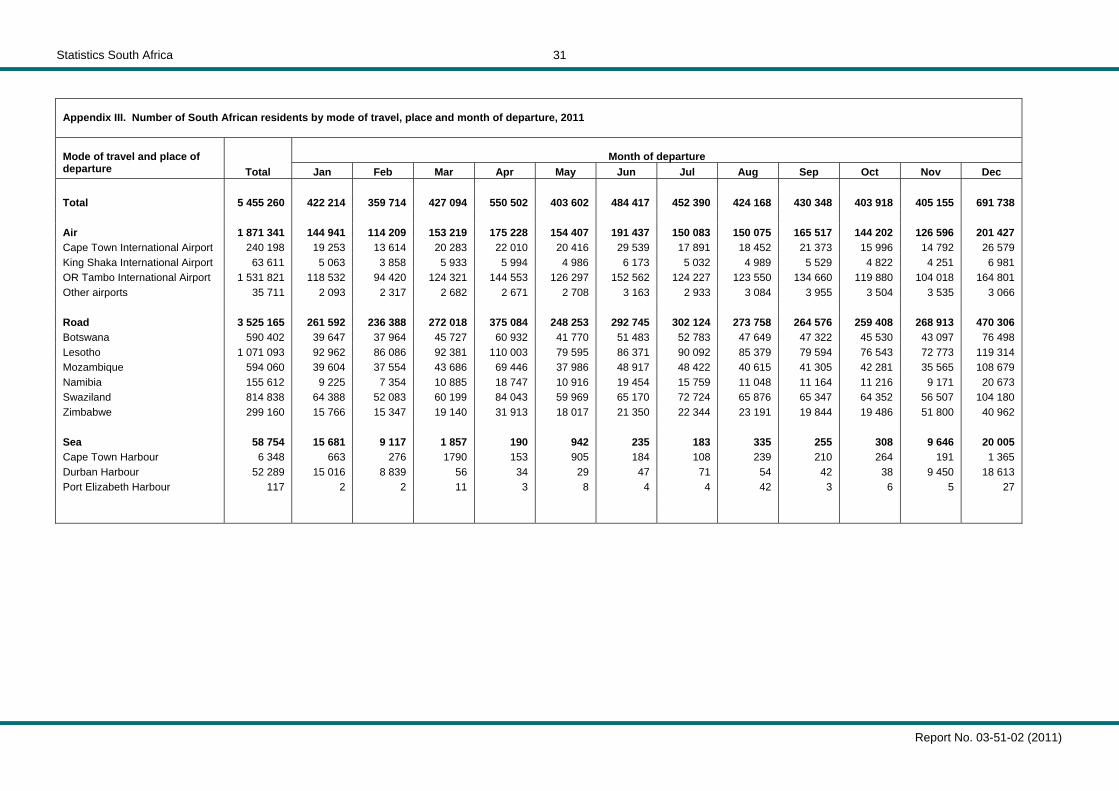
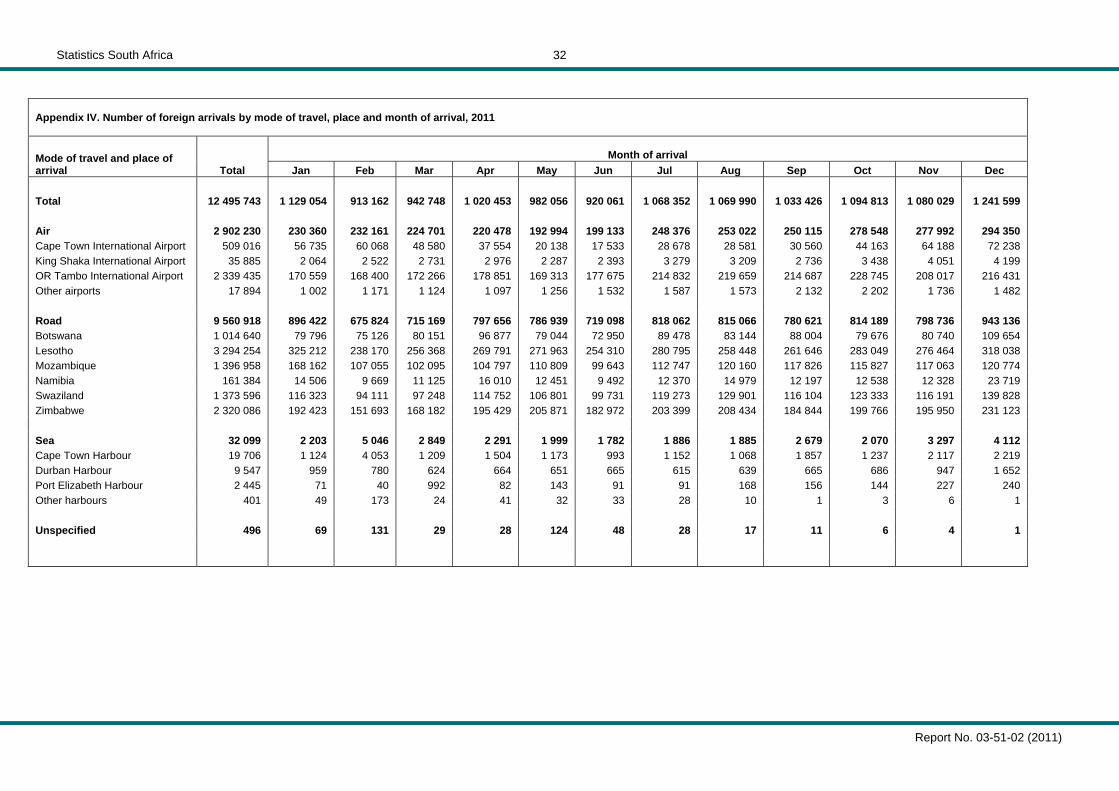
7 Table 2 further shows that during 2011, as many as 3 517 599 (64,8%) South African residents arrived in South Africa by road, followed by 1 853 321 (34,1%) air arrivals. A total of 58 243 (1,1%) arrived by sea and the mode of travel of residents 14 (0,0%) was not specified. Due to the large number of road ports as observed in Appendix I, border countries are used in the table instead of the specific land ports names. That is, data for all ports found on the border with a particular country are combined and the country name is used. The highest number of South Africa residents arriving by road used Lesotho (30,0%) and Swaziland (23,1%) ports. Out of the total number of South African residents arriving by air, 1 521 090 (82,1%) arrived through OR Tambo international airport; while 234 263 (12,6%) arrived through Cape Town international airport; 62 545 (3,4%) came through King Shaka international airport; and 35 423 (1,9%) used other airports. Out of those who arrived by sea, a great majority (84,5%) arrived through the Durban harbour. Similarly, road transport was the most common mode of travel used by South African residents departing South Africa, [3 525 165 (64,6%)] followed by air travel, [1 871 341 (34,3%)]. A total of 58 754 (1,1%) left by sea. Over half of the departing road users went through both Lesotho (30,4%) and Swaziland (23,1%) ports. Out of the total number of residents departing by air, 1 531 821 (81,9%) used OR Tambo international airport; while 240 198 (12,8%) left through Cape Town international airport; 63 611 (3,4%) left through King Shaka international airport and 35 711 (1,9%) left through other airports. Nearly 90,0% of those departing by sea left the country through the Durban harbour. The information on 2011 arrivals and departures of South African residents classified by month of travel is presented in Appendix II and Appendix III respectively. The result show that the highest number of arrivals (627 199) were recorded in January followed by those recorded in July (528 466) while the lowest number of arrivals was recorded in February (351 513). Similarly, the highest number of departures was recorded in December (691 738) followed by April (550 502) and the lowest number in February (359 714). 1.5 Foreign travellers It is observed from Figure 3 and Table 1 that apart from the slight decline in arrivals and departures in 2001, the number of both foreign arrivals and departures increased between 2000 and 2011. About 12,5 million foreigners arrived in South Africa in 2011 and 10,7 million left the country. Unlike South African travellers, the volume of departures of foreign travellers has been lower than that of arrivals throughout the twelve-year period, with a notable widening of the gap since 2006. With respect to growth, between 2010 and 2011, foreign arrivals grew by 8,0%, from 11 574 540 in 2010 to 12 495 743 compared to a growth rate of 8,2% for foreign departures from 9 908 518 in 2010 to 10 725 213 in 2011. A breakdown of the 2011 data (see Table 3) indicates that generally the lowest number of arrivals was recorded in February (913 162) and the highest in December (1 241 599). However, the number of foreign arrivals by month differed by purpose of visit. Most of those who came for business came in January; for holidays mostly in December and January; for study mostly in July and January; and for work, mainly in July, October and January.
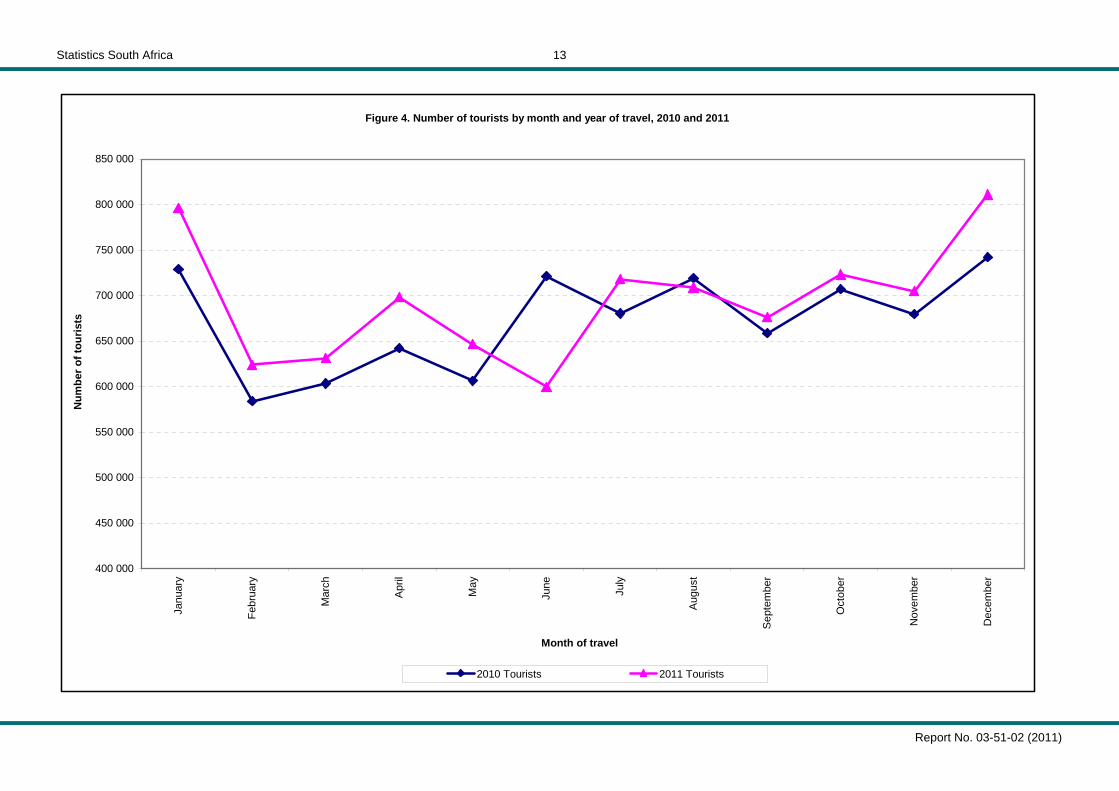
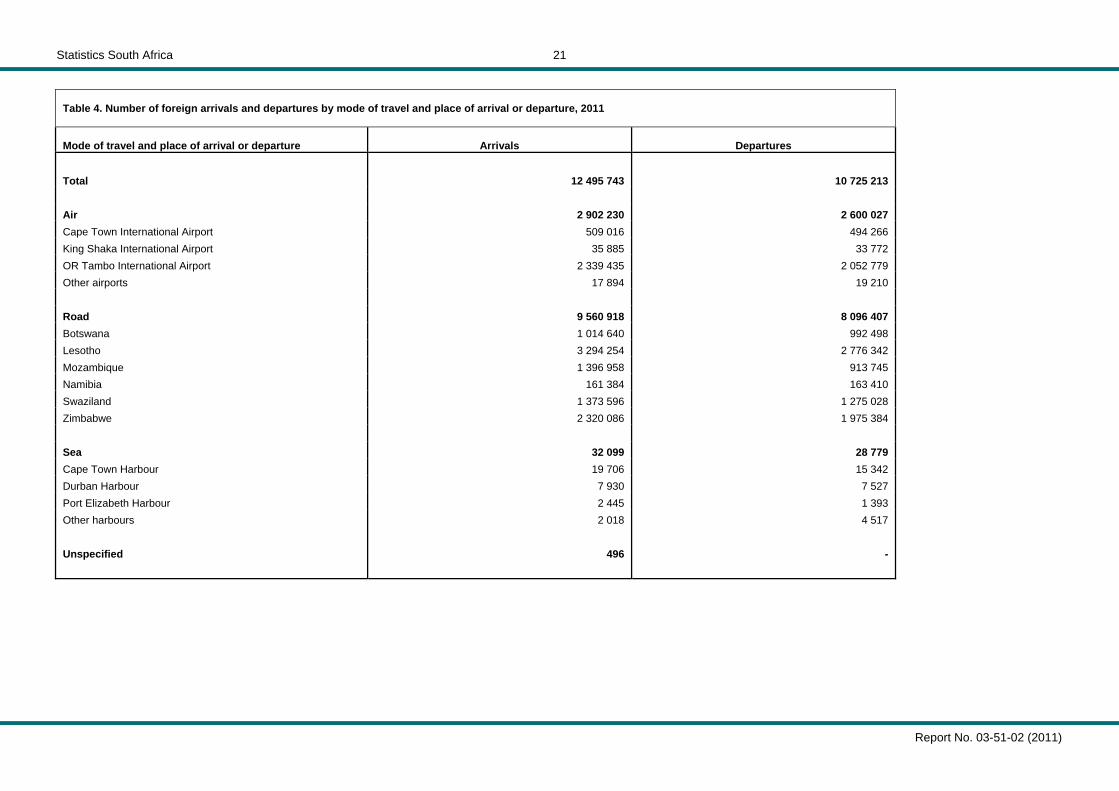
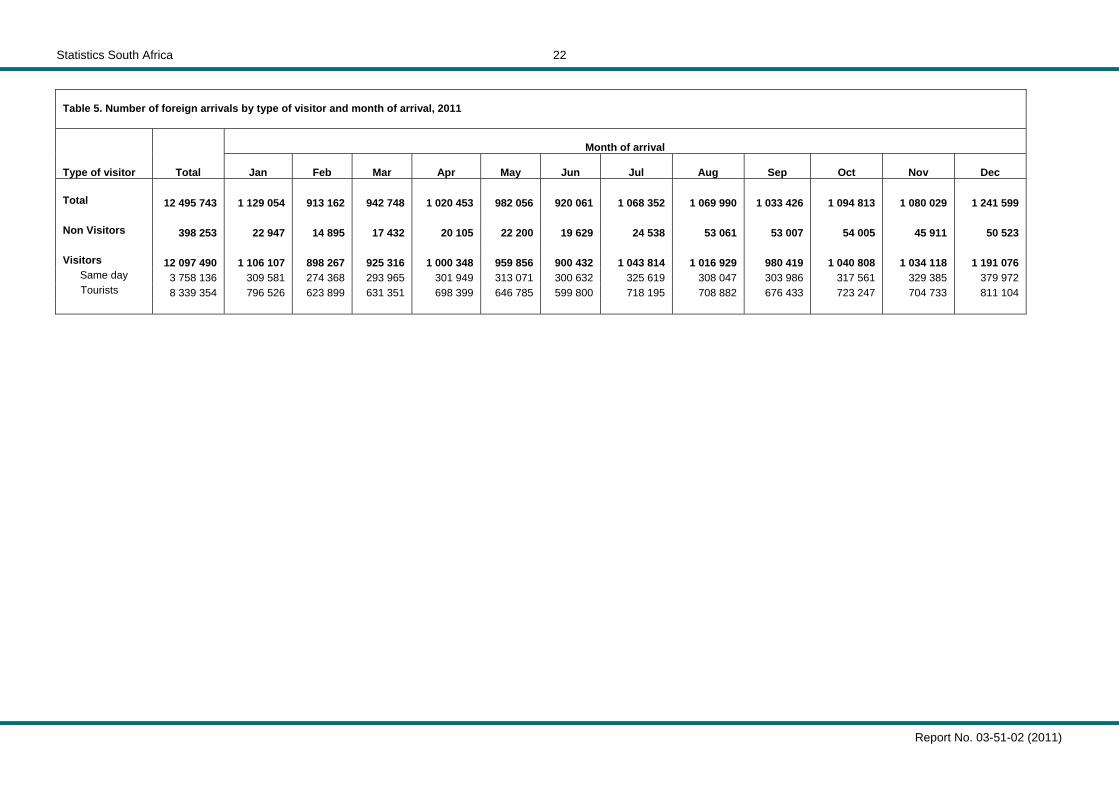
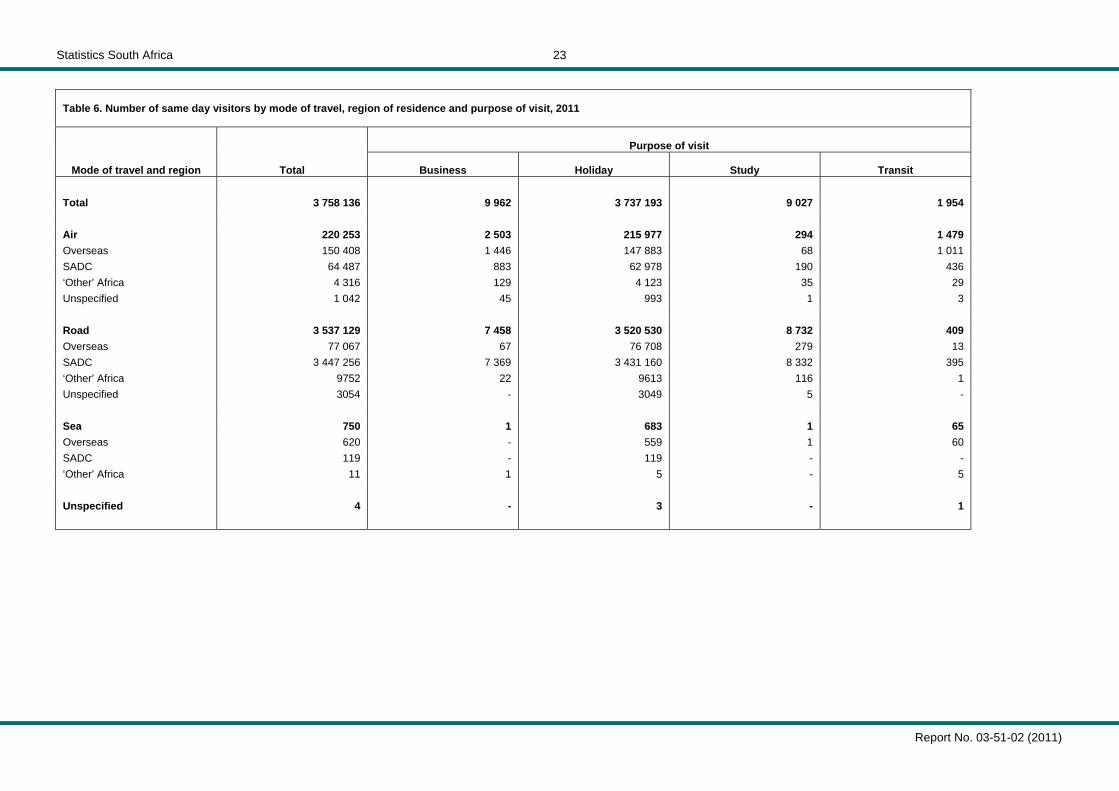
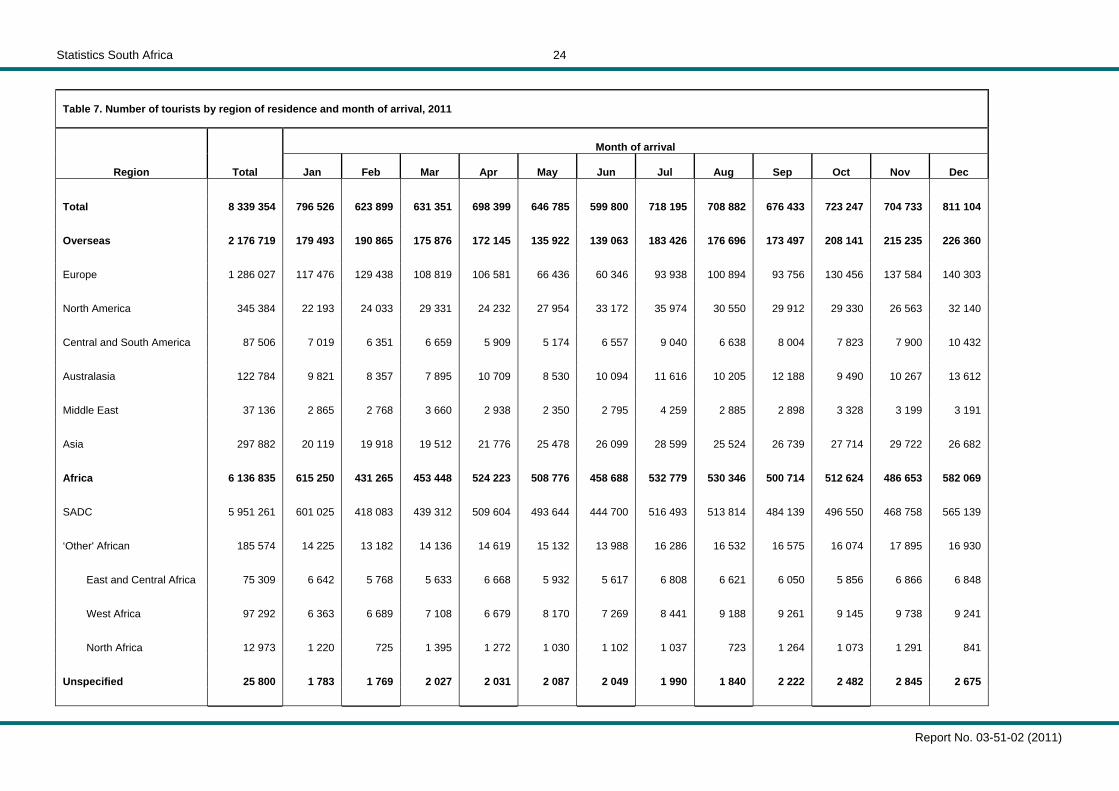
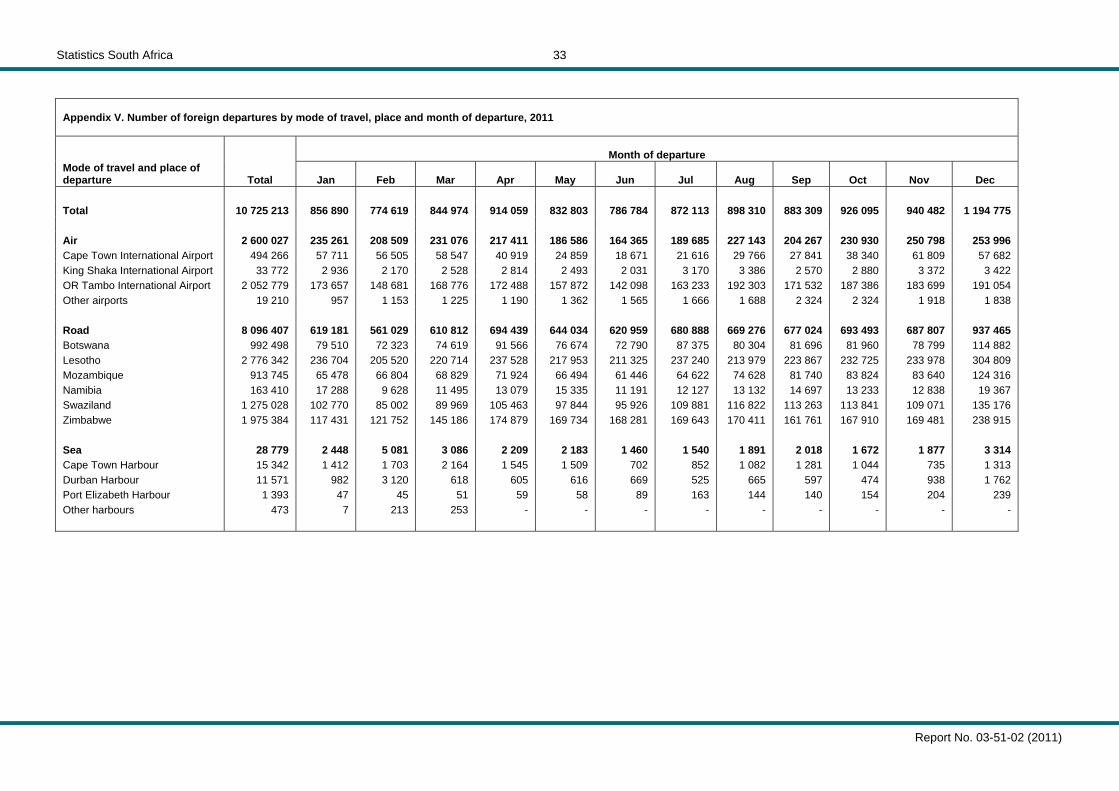
For all the months, the main purpose of visit for foreign arrivals was holiday whereby at least 89,0% of arrivals each month came into the country for holiday. Whereas 1,6% of the 2011 arrivals were on business; 1,9% and 0,7% of arrivals were workers and students respectively. Table 4 indicates that during 2011, 9 560 918 (76,5%) foreigners came into South Africa by road. Most of those who arrived by road were from Lesotho (34,4%) and Zimbabwe (24,3%). In addition, 2 902 230 (23,2%) flew into the country mainly to OR Tambo international airport. Those who came by sea were 32 099 (0,3%). For departures it is noted that 8 096 407 (75,5%) travellers left by road, 2 600 027 (24,2%) by air and 28 779 (0,3%) by sea. The monthly distributions of foreign arrivals and departures by mode of travel and place of arrival and departure are provided in Appendices IV and V. Most arrivals and departures were during December and the least in February. In 2011, there were 398 253 (3,2%) non-visitors and 12 097 490 (96,8%) visitors (see Table 5). It is observed from the monthly distribution of the data that the volume of non- visitors was higher during the last five months of the year compared to the earlier months. October recorded the highest volume [54 005 (13,6%)] of non-visitors and February the lowest [14 895 (3,7%)]. The visitors were made up of 3 758 136 (31,1%) same day visitors and 8 339 354 (68,9%) overnight visitors or tourists. 1.6 Same day visitors Table 5 further shows that the monthly volume of same day visitors was quite uniform throughout the year. It ranged from 274 368 in February to 379 972 in December with a monthly average of about 313 000 visitors. The majority of the same day visitors (94,1%) came into the country by road, most of whom were from the SADC countries (68,3%). Virtually all (99,4%) same day visitors came for holiday (see Table 6.) The rest were business persons [9 962 (0,3%)], students [9 027 (0,2%)] and visitors in transit [1 954 (0,1%)]. 1.7 Tourists A total of 8 339 354 tourists came to South Africa in 2011, showing an increase of 3,3% from the 8 073 552 tourists recorded in 2010. Figure 5 shows the number of tourists who came to South Africa in 2010 and 2011 by month of arrival. This monthly distribution shows that arrivals in 2011 were generally higher than the arrivals in 2010.The outstanding difference was in June when the volume of tourists in 2010 was higher than those in 2011 (721 311 tourists in 2010 compared to 599 800 in 2011). 1.7.1 Region of residence Information on the region of residence and the month of arrival of tourists is given in Table 7. The breakdown of the number of tourists by region indicates that a high proportion (71,4%) of the 8 339 354 tourists were residents from SADC countries. Residents from overseas countries made up 26,1% of the tourists. The remaining tourists were residents
Statistics South Africa
Report No. 03-51-02 (2011)
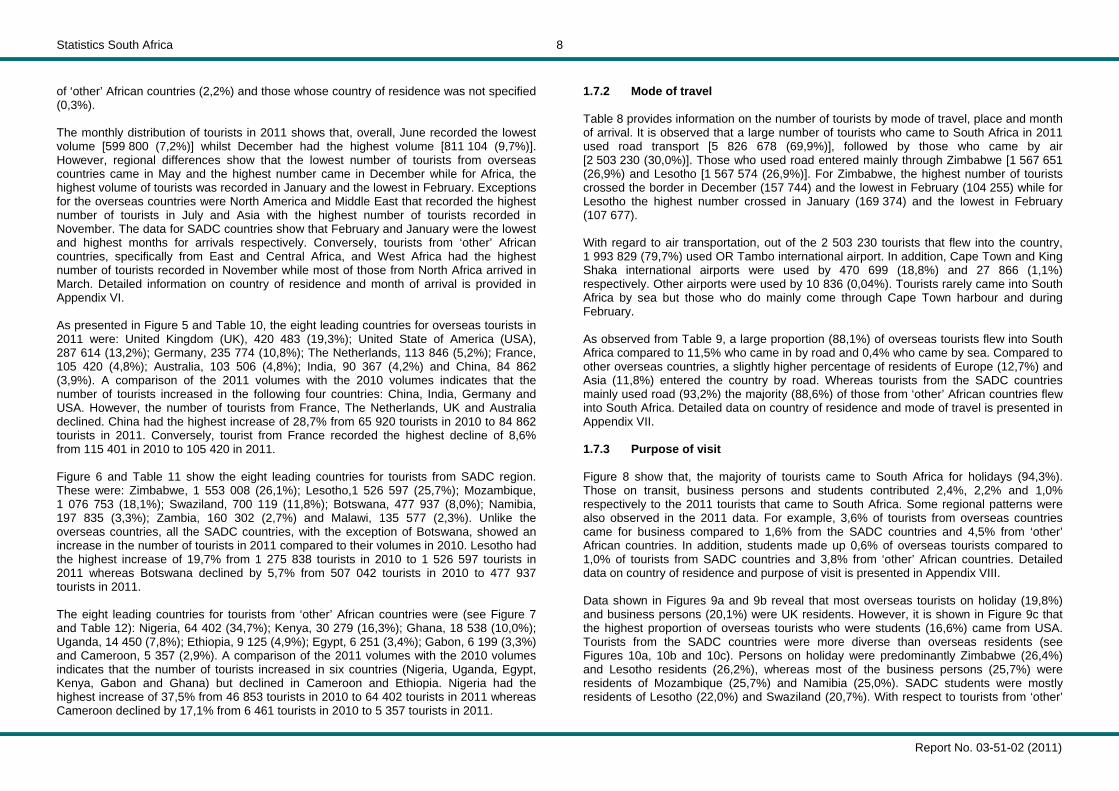
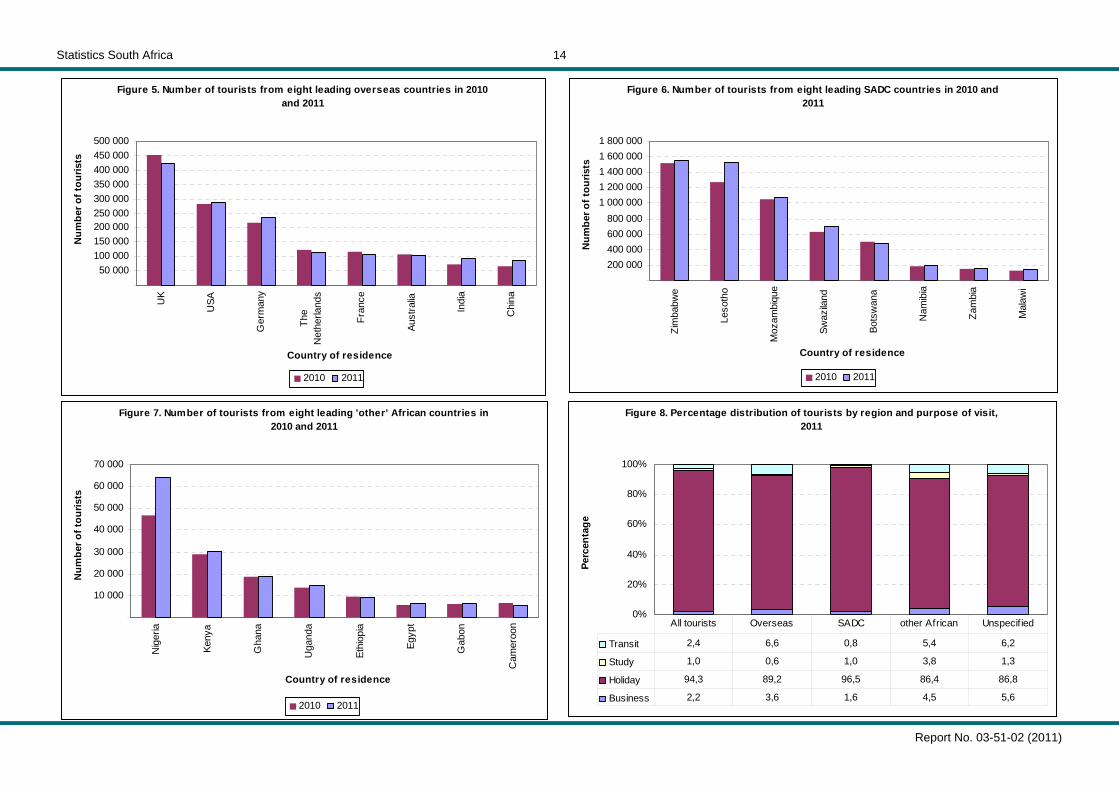
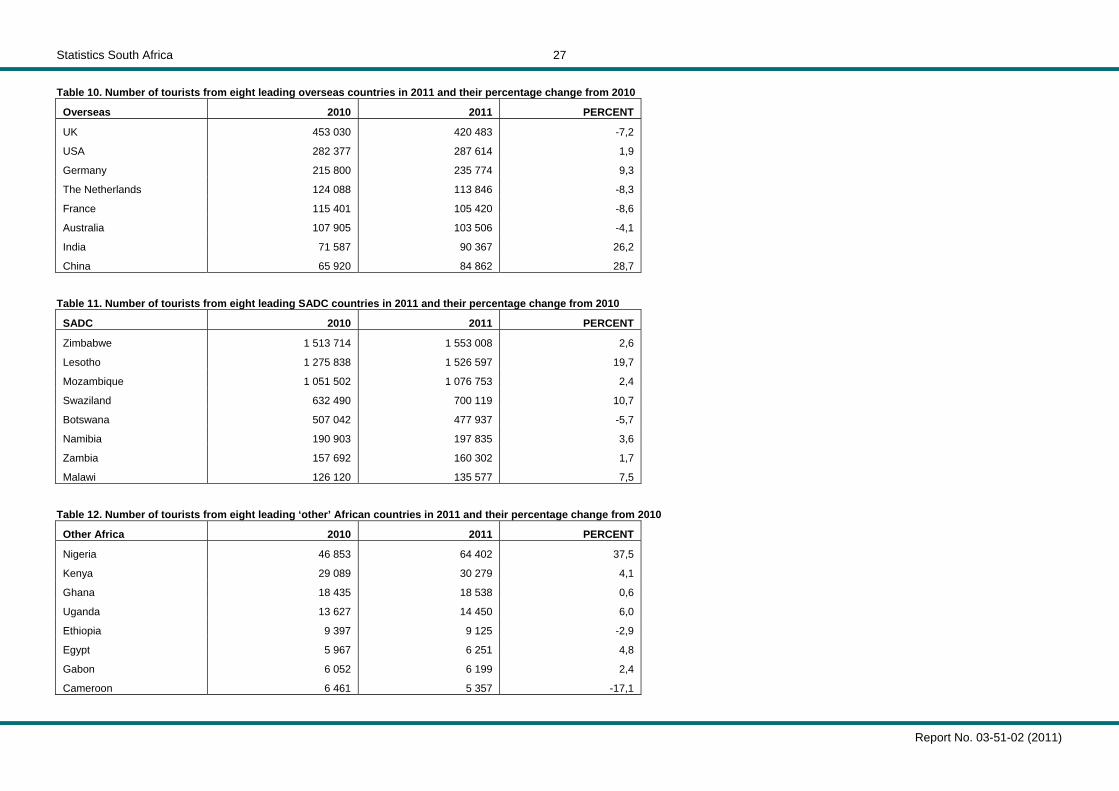
8 of ‘other’ African countries (2,2%) and those whose country of residence was not specified (0,3%). The monthly distribution of tourists in 2011 shows that, overall, June recorded the lowest volume [599 800 (7,2%)] whilst December had the highest volume [811 104 (9,7%)]. However, regional differences show that the lowest number of tourists from overseas countries came in May and the highest number came in December while for Africa, the highest volume of tourists was recorded in January and the lowest in February. Exceptions for the overseas countries were North America and Middle East that recorded the highest number of tourists in July and Asia with the highest number of tourists recorded in November. The data for SADC countries show that February and January were the lowest and highest months for arrivals respectively. Conversely, tourists from ‘other’ African countries, specifically from East and Central Africa, and West Africa had the highest number of tourists recorded in November while most of those from North Africa arrived in March. Detailed information on country of residence and month of arrival is provided in Appendix VI. As presented in Figure 5 and Table 10, the eight leading countries for overseas tourists in 2011 were: United Kingdom (UK), 420 483 (19,3%); United State of America (USA), 287 614 (13,2%); Germany, 235 774 (10,8%); The Netherlands, 113 846 (5,2%); France, 105 420 (4,8%); Australia, 103 506 (4,8%); India, 90 367 (4,2%) and China, 84 862 (3,9%). A comparison of the 2011 volumes with the 2010 volumes indicates that the number of tourists increased in the following four countries: China, India, Germany and USA. However, the number of tourists from France, The Netherlands, UK and Australia declined. China had the highest increase of 28,7% from 65 920 tourists in 2010 to 84 862 tourists in 2011. Conversely, tourist from France recorded the highest decline of 8,6% from 115 401 in 2010 to 105 420 in 2011. Figure 6 and Table 11 show the eight leading countries for tourists from SADC region. These were: Zimbabwe, 1 553 008 (26,1%); Lesotho,1 526 597 (25,7%); Mozambique, 1 076 753 (18,1%); Swaziland, 700 119 (11,8%); Botswana, 477 937 (8,0%); Namibia, 197 835 (3,3%); Zambia, 160 302 (2,7%) and Malawi, 135 577 (2,3%). Unlike the overseas countries, all the SADC countries, with the exception of Botswana, showed an increase in the number of tourists in 2011 compared to their volumes in 2010. Lesotho had the highest increase of 19,7% from 1 275 838 tourists in 2010 to 1 526 597 tourists in 2011 whereas Botswana declined by 5,7% from 507 042 tourists in 2010 to 477 937 tourists in 2011. The eight leading countries for tourists from ‘other’ African countries were (see Figure 7 and Table 12): Nigeria, 64 402 (34,7%); Kenya, 30 279 (16,3%); Ghana, 18 538 (10,0%); Uganda, 14 450 (7,8%); Ethiopia, 9 125 (4,9%); Egypt, 6 251 (3,4%); Gabon, 6 199 (3,3%) and Cameroon, 5 357 (2,9%). A comparison of the 2011 volumes with the 2010 volumes indicates that the number of tourists increased in six countries (Nigeria, Uganda, Egypt, Kenya, Gabon and Ghana) but declined in Cameroon and Ethiopia. Nigeria had the highest increase of 37,5% from 46 853 tourists in 2010 to 64 402 tourists in 2011 whereas Cameroon declined by 17,1% from 6 461 tourists in 2010 to 5 357 tourists in 2011.
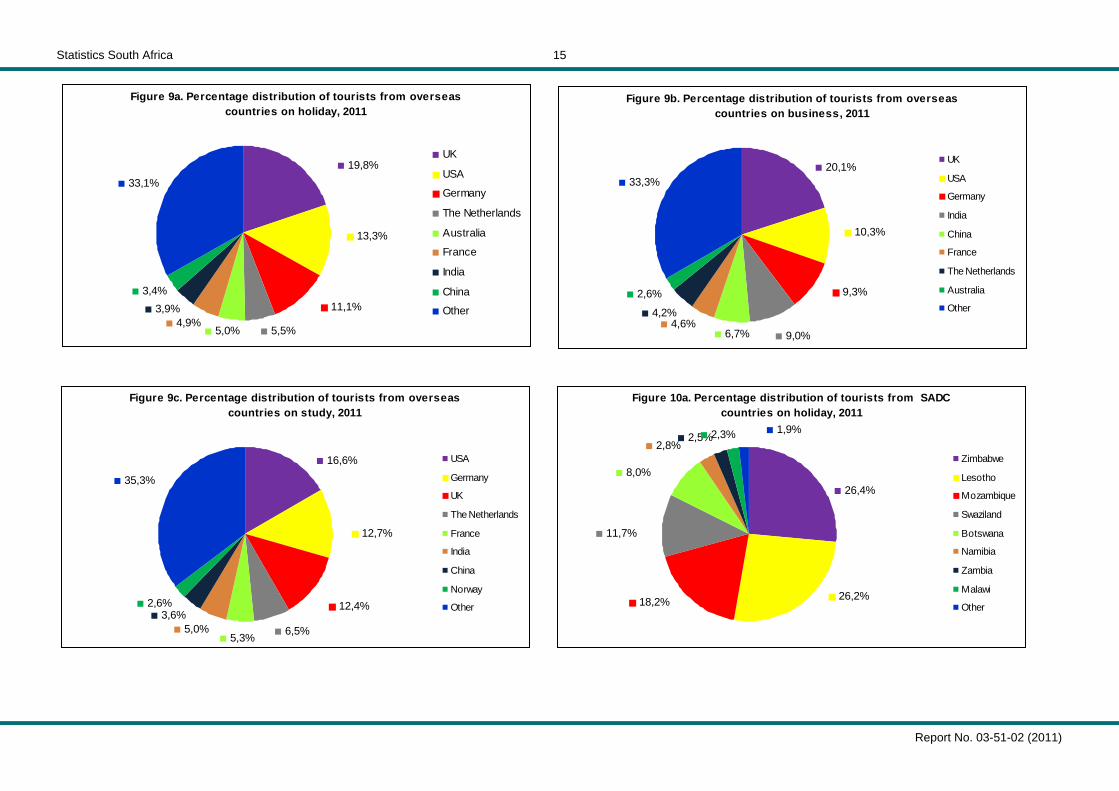
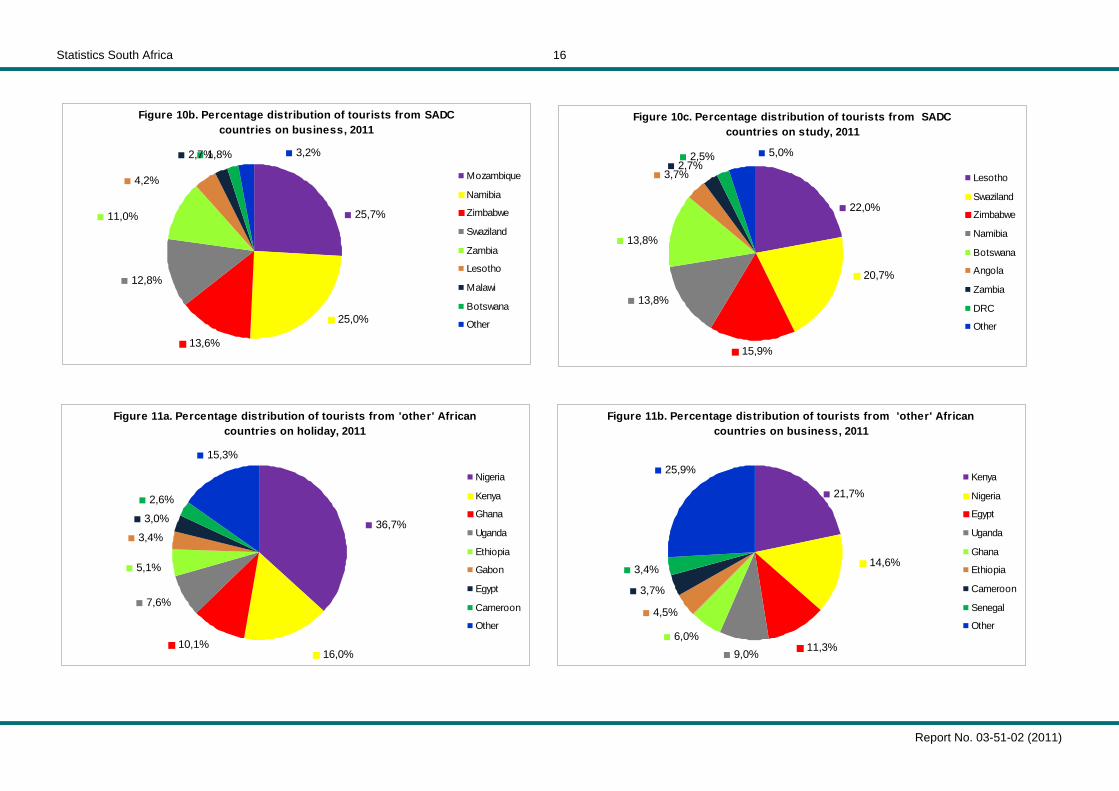
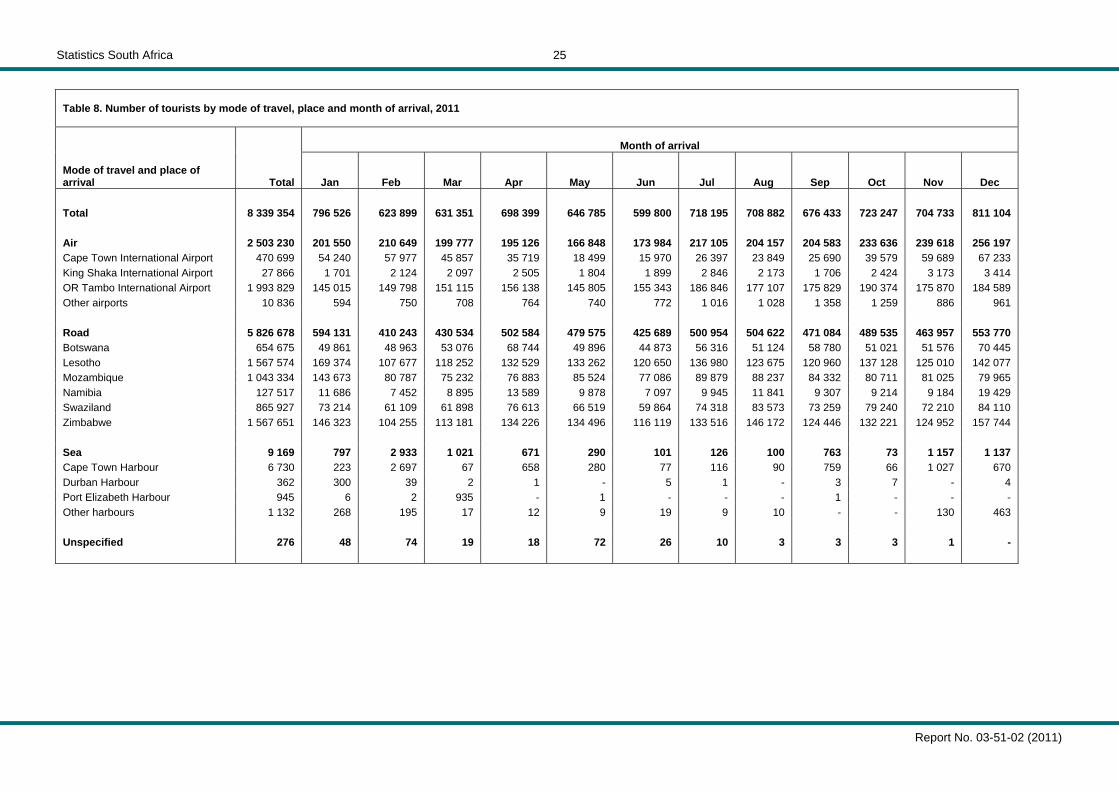
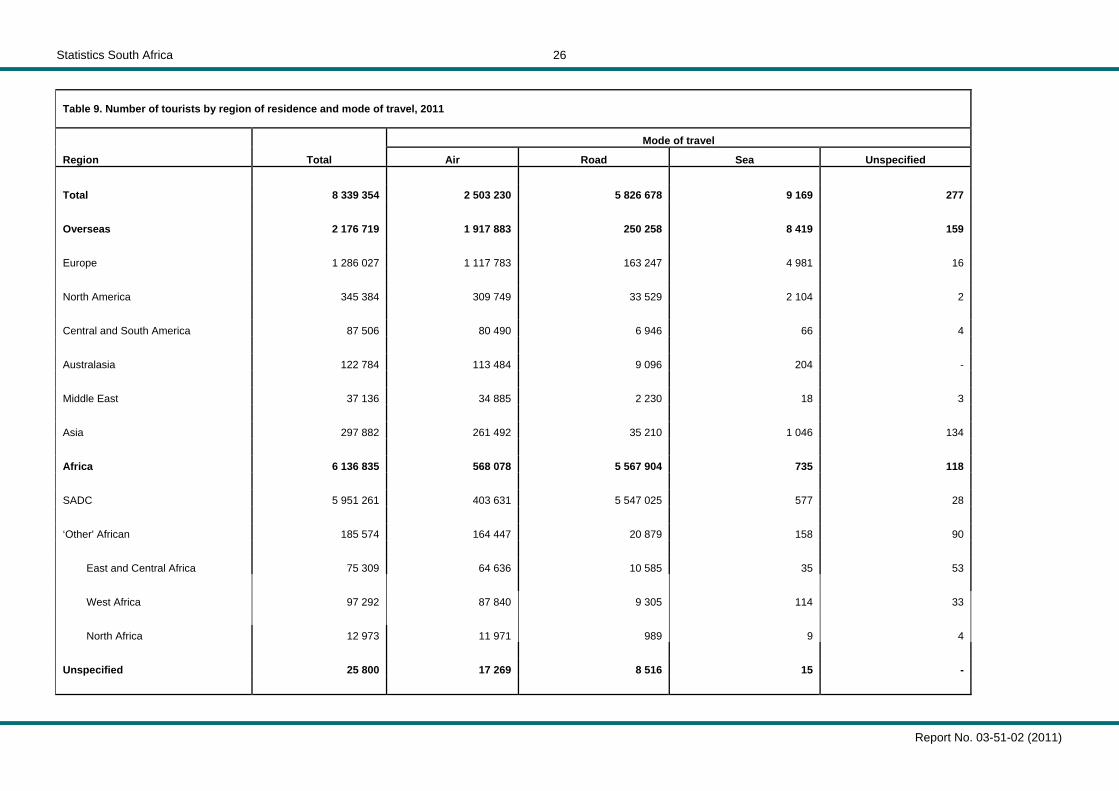
1.7.2 Mode of travel Table 8 provides information on the number of tourists by mode of travel, place and month of arrival. It is observed that a large number of tourists who came to South Africa in 2011 used road transport [5 826 678 (69,9%)], followed by those who came by air [2 503 230 (30,0%)]. Those who used road entered mainly through Zimbabwe [1 567 651 (26,9%) and Lesotho [1 567 574 (26,9%)]. For Zimbabwe, the highest number of tourists crossed the border in December (157 744) and the lowest in February (104 255) while for Lesotho the highest number crossed in January (169 374) and the lowest in February (107 677). With regard to air transportation, out of the 2 503 230 tourists that flew into the country, 1 993 829 (79,7%) used OR Tambo international airport. In addition, Cape Town and King Shaka international airports were used by 470 699 (18,8%) and 27 866 (1,1%) respectively. Other airports were used by 10 836 (0,04%). Tourists rarely came into South Africa by sea but those who do mainly come through Cape Town harbour and during February. As observed from Table 9, a large proportion (88,1%) of overseas tourists flew into South Africa compared to 11,5% who came in by road and 0,4% who came by sea. Compared to other overseas countries, a slightly higher percentage of residents of Europe (12,7%) and Asia (11,8%) entered the country by road. Whereas tourists from the SADC countries mainly used road (93,2%) the majority (88,6%) of those from ‘other’ African countries flew into South Africa. Detailed data on country of residence and mode of travel is presented in Appendix VII. 1.7.3 Purpose of visit Figure 8 show that, the majority of tourists came to South Africa for holidays (94,3%). Those on transit, business persons and students contributed 2,4%, 2,2% and 1,0% respectively to the 2011 tourists that came to South Africa. Some regional patterns were also observed in the 2011 data. For example, 3,6% of tourists from overseas countries came for business compared to 1,6% from the SADC countries and 4,5% from ‘other’ African countries. In addition, students made up 0,6% of overseas tourists compared to 1,0% of tourists from SADC countries and 3,8% from ‘other’ African countries. Detailed data on country of residence and purpose of visit is presented in Appendix VIII. Data shown in Figures 9a and 9b reveal that most overseas tourists on holiday (19,8%) and business persons (20,1%) were UK residents. However, it is shown in Figure 9c that the highest proportion of overseas tourists who were students (16,6%) came from USA. Tourists from the SADC countries were more diverse than overseas residents (see Figures 10a, 10b and 10c). Persons on holiday were predominantly Zimbabwe (26,4%) and Lesotho residents (26,2%), whereas most of the business persons (25,7%) were residents of Mozambique (25,7%) and Namibia (25,0%). SADC students were mostly residents of Lesotho (22,0%) and Swaziland (20,7%). With respect to tourists from ‘other’
Statistics South Africa
Report No. 03-51-02 (2011)
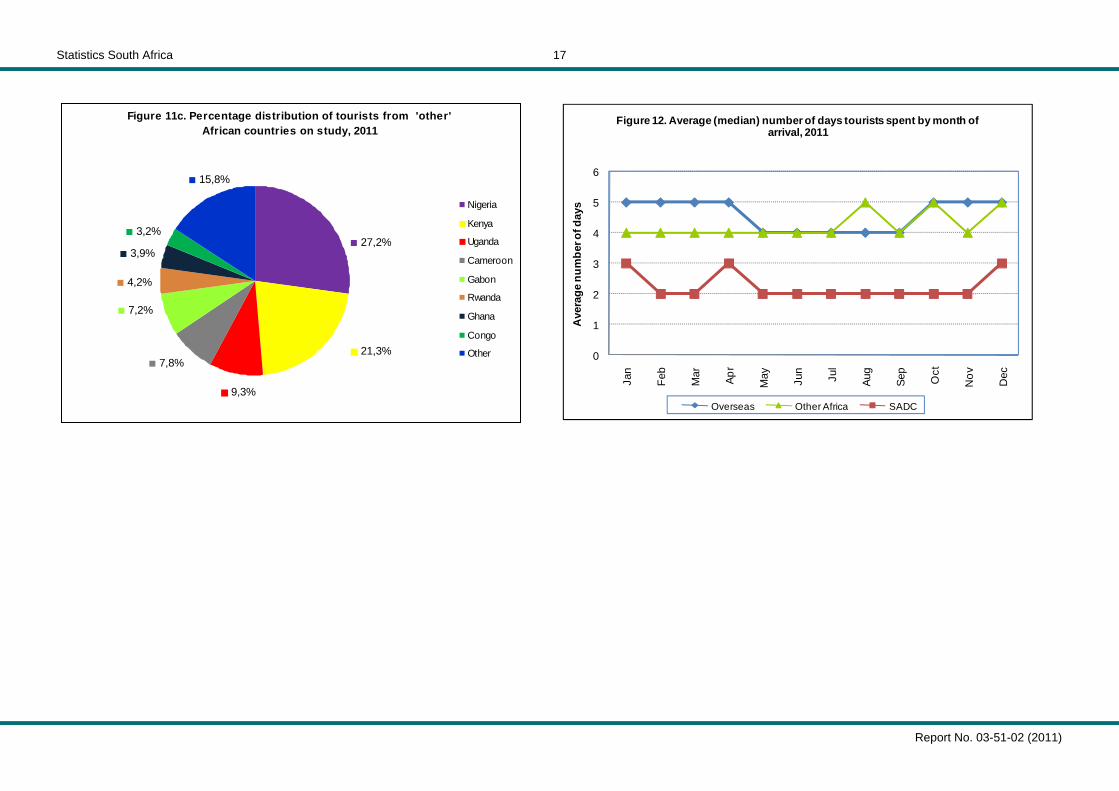
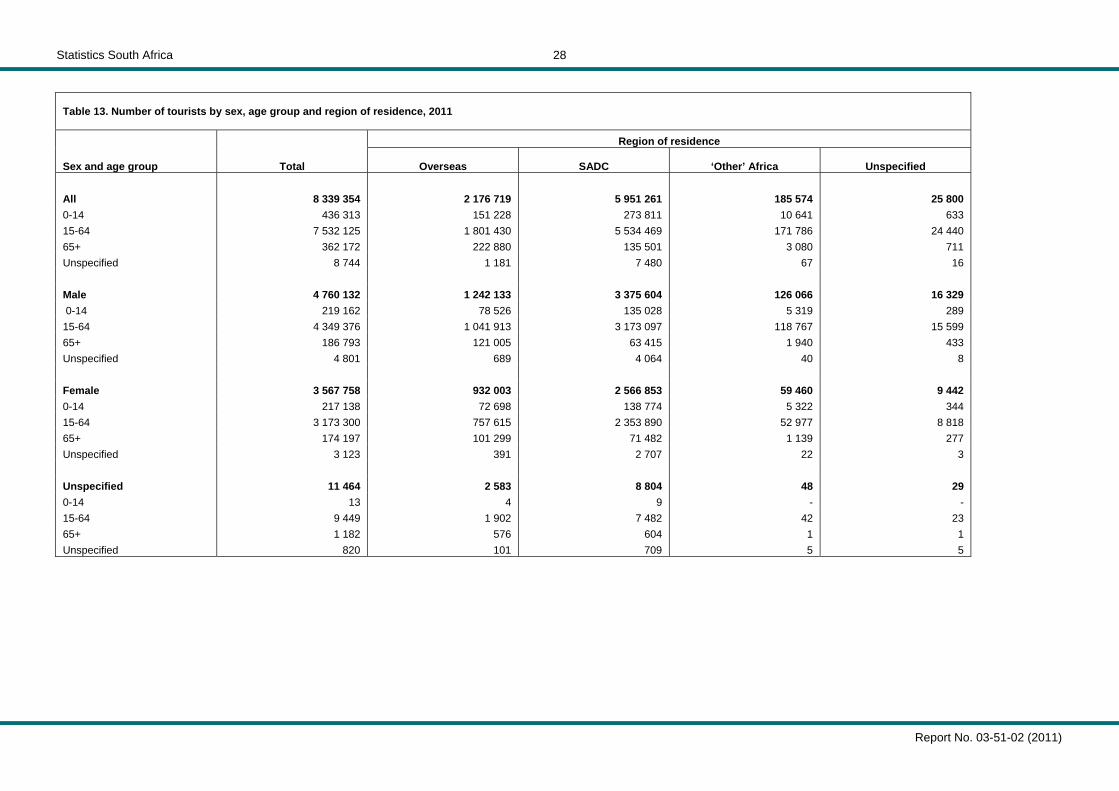
9 African countries (see Figures11a, 11b and 11c), the majority of those on holiday were Nigeria residents (36,7%) whilst those on business were mainly residents of Kenya (21,7%) and the students were mostly from Nigeria (27,2%) and Kenya (21,3%). 1.7.4 Duration of stay The number of days tourists spent in South Africa is based on the tourists who arrived and left in the same month. Data in Figure 12 indicate that generally tourists from overseas countries spent on average more days (about five days per month) in the country compared to SADC residents that spent an average of about two days in a month. Residents from ‘other’ African countries on the average spent about four days per month. The data reveal that residents of the SADC region spent on average more days (about three days per month) in January, April and December However, during the winter months of May, June and July as well as in the summer months of November and December they spent four days. SADC residents spent two days on the average but in January, April and December they spent three days in a month. Residents of ‘other’ African countries on the average spent four days but spent five days in October, November and December. 1.7.5 Sex and age distribution In 2011 as shown in Table 10, there were more male [4 760 132 (57,0%)] than female [3 567 758 (42,8%)] tourists. Although males constituted the majority overseas (57,1%) and SADC residents (56,7%), the proportion of males was relatively higher (67,9%) among tourists from ‘other’ African countries. Conversely SADC had the highest proportion of female tourists (43,1%) and ‘other’ Africa had the lowest (32,0%). The age distribution shows that at least 82,0% of tourists from overseas, SADC and ‘other’ African countries, were aged between 15 and 64 years. Overall, there were very few tourists younger than 15 years (5,2%) and those aged 65 years and older (the elderly) (4,3%). The data show a relatively higher proportion (10,2%) of the elderly among overseas residents compared with 2,3% and 1,7% of residents from SADC and ‘other’ African countries respectively. Detailed information on the number of tourists by sex, age group and month of arrival is presented in Appendix IX. 1.8 Summary This report provided information collected by DHA immigration officers on South African residents and foreign travellers that passed through all South Africa air, land and sea ports of entry/exit in 2011. The report presented detailed information on the mode of travel, purpose of visit, length of stay and demographic characteristics of tourists (foreign).
A total of 34 105 393 travellers (both South African residents and foreign travellers) entered or departed South Africa in 2011 showing an increase of 7,3% from the 2010 volume of 31 773 236. South African resident departures increased by 5,6% from 5 164 929 in 2010 to 5 455 260 in 2011. Similarly, foreign arrivals increased by 8,0% from 11 574 540 in 2010 to 12 495 743 in 2011. Due to limited data on South African residents, information on tourists is available only from foreign travellers. In 2011, foreign arrivals were made up of 398 253 (3,2%) non-visitors and 12 097 490 (96,8%) visitors. The visitors were further categorised into same day visitors [3 758 136 (31,1%)] and overnight visitors or tourists [8 339 354 (68,9)]. The volume of tourists increased by 3,3% from 8 073 552 in 2010 to 8 339 354 in 2011. The prominent difference between the 2010 and 2011 monthly distributions of tourists was the unprecedented high volume of tourists in June 2010 (721 311) compared to 599 800 in 2011. The distribution of tourists by region of residence followed the similar pattern as shown in previous years. Thus a high proportion (71,4%) of tourists was residents from the SADC countries; 26,1% and 2,2% from overseas and ‘other’ African countries respectively. Likewise, the 2011 patterns of mode of travel and purpose of visit did not differ greatly from what was observed in 2010 and earlier years. Overseas and ‘other’ African tourists generally flew into the country whereas tourists from the SADC countries came in by road. Holiday continued to be the main reason for visiting South Africa. An overwhelmingly majority (94,3%) of tourists came for holidays whilst business persons and students constituted less than 5,0% of the 2011 tourists. Overseas business tourists were mainly UK residents and the students were mostly USA residents. Residents of Mozambique and Namibia made up the bulk of business tourists from the SADC countries. The students came mainly from Lesotho and Swaziland. With regard to ‘other’ Africa, business tourists and students were mostly from Kenya and Nigeria respectively. In 2011 tourists from overseas spent on the average five days per month in South Africa compared to tourists from SADC and ‘other’ Africa that spent four days and two days respectively. Tourists continued to be predominantly male (57,8%) and about 80,0% of the 2011 tourists were in the productive age group of 15 to 64 years. The overall patterns observed from the 2011 data on tourists generally followed what have previously been noted since 2009 when Stats SA started publishing information on tourists.
Statistics South Africa
Report No. 03-51-02 (2011)
10 2. FIGURES
Figure 1. Number of arrivals and departures by year of travel, 2000-2011
5 000
10 000
15 000
20 000
25 000
30 000
35 000
40 00020
00
2001
2002
2003
2004
2005
2006
2007
2008
2009
2010
2011
Year
Num
ber o
f tra
velle
rs in
'000
Arrivals Departures Total
Statistics South Africa
Report No. 03-51-02 (2011)
11
Figure 2. Number of arrivals and departures of South African residents by year of travel, 2000–2011
1 000 000
2 000 000
3 000 000
4 000 000
5 000 000
6 000 000
2000
2001
2002
2003
2004
2005
2006
2007
2008
2009
2010
2011
Year of travel
Num
ber o
f tra
velle
rs
SA Arrivals SA Departures
Statistics South Africa
Report No. 03-51-02 (2011)
12
Figure 3. Number of arrivals and departures of foreign travellers by year of travel, 2000–2011
2 000 000
4 000 000
6 000 000
8 000 000
10 000 000
12 000 000
14 000 000
2000
2001
2002
2003
2004
2005
2006
2007
2008
2009
2010
2011
Year of travel
Num
ber o
f tra
velle
rs
Foreign Arrivals Foreign Departures
Statistics South Africa
Report No. 03-51-02 (2011)
13
Figure 4. Number of tourists by month and year of travel, 2010 and 2011
400 000
450 000
500 000
550 000
600 000
650 000
700 000
750 000
800 000
850 000
Janu
ary
Febr
uary
Mar
ch
Apr
il
May
June
July
Aug
ust
Sep
tem
ber
Oct
ober
Nov
embe
r
Dec
embe
r
Month of travel
Num
ber o
f tou
rists
2010 Tourists 2011 Tourists
Statistics South Africa
Report No. 03-51-02 (2011)
14
Figure 5. Number of tourists from eight leading overseas countries in 2010 and 2011
50 000 100 000 150 000 200 000 250 000 300 000 350 000 400 000 450 000 500 000
UK
USA
Ger
man
y
The
Net
herla
nds
Fran
ce
Aust
ralia
Indi
a
Chi
na
Country of residence
Num
ber o
f tou
rists
2010 2011
Figure 6. Number of tourists from eight leading SADC countries in 2010 and 2011
200 000 400 000 600 000 800 000
1 000 0001 200 0001 400 0001 600 0001 800 000
Zim
babw
e
Leso
tho
Moz
ambi
que
Swaz
iland
Bots
wan
a
Nam
ibia
Zam
bia
Mal
awi
Country of residence
Num
ber o
f tou
rists
2010 2011
Figure 7. Number of tourists from eight leading 'other' African countries in 2010 and 2011
10 000
20 000
30 000
40 000
50 000
60 000
70 000
Nig
eria
Keny
a
Gha
na
Uga
nda
Ethi
opia
Egyp
t
Gab
on
Cam
eroo
n
Country of residence
Num
ber o
f tou
rists
2010 2011
Figure 8. Percentage distribution of tourists by region and purpose of visit, 2011
0%
20%
40%
60%
80%
100%
Perc
enta
ge
Transit 2,4 6,6 0,8 5,4 6,2
Study 1,0 0,6 1,0 3,8 1,3
Holiday 94,3 89,2 96,5 86,4 86,8
Business 2,2 3,6 1,6 4,5 5,6
All tourists Overseas SADC other African Unspecif ied
Statistics South Africa
Report No. 03-51-02 (2011)
15
Figure 9c. Percentage distribution of tourists from overseas countries on study, 2011
16,6%
12,7%
12,4%
6,5%5,3%5,0%
3,6%2,6%
35,3%
USA
Germany
UK
The Netherlands
France
India
China
Norway
Other
Figure 10a. Percentage distribution of tourists from SADC countries on holiday, 2011
26,4%
26,2%18,2%
11,7%
8,0%
2,8%2,5%2,3% 1,9%
Zimbabwe
Lesotho
Mozambique
Swaziland
Botswana
Namibia
Zambia
Malawi
Other
Figure 9a. Percentage distribution of tourists from overseas countries on holiday, 2011
5,0%4,9%
3,9%3,4%
33,1%
5,5%
11,1%
13,3%
19,8%UK
USA
Germany
The Netherlands
Australia
France
India
China
Other
Figure 9b. Percentage distribution of tourists from overseas countries on business, 2011
33,3%
2,6%
4,2%4,6%
6,7% 9,0%
9,3%
10,3%
20,1%UK
USA
Germany
India
China
France
The Netherlands
Australia
Other
Statistics South Africa
Report No. 03-51-02 (2011)
16
Figure 10b. Percentage distribution of tourists from SADC countries on business, 2011
3,2%1,8%2,7%
4,2%
11,0%
12,8%
13,6%
25,0%
25,7%
Mozambique
Namibia
Zimbabwe
Swaziland
Zambia
Lesotho
Malawi
Botswana
Other
Figure 10c. Percentage distribution of tourists from SADC countries on study, 2011
5,0%2,5%2,7%
3,7%
13,8%
13,8%
15,9%
20,7%
22,0%
Lesotho
Swaziland
Zimbabwe
Namibia
Botswana
Angola
Zambia
DRC
Other
Figure 11a. Percentage distribution of tourists from 'other' African countries on holiday, 2011
15,3%
2,6%
3,0%
3,4%
5,1%
7,6%
10,1%16,0%
36,7%
Nigeria
Kenya
Ghana
Uganda
Ethiopia
Gabon
Egypt
Cameroon
Other
Figure 11b. Percentage distribution of tourists from 'other' African countries on business, 2011
25,9%
3,4%
3,7%
4,5%
6,0%9,0% 11,3%
14,6%
21,7%Kenya
Nigeria
Egypt
Uganda
Ghana
Ethiopia
Cameroon
Senegal
Other
Statistics South Africa
Report No. 03-51-02 (2011)
17
Figure 11c. Percentage distribution of tourists from 'other' African countries on study, 2011
15,8%
3,2%
3,9%
4,2%
7,2%
7,8%
9,3%
21,3%
27,2%
Nigeria
Kenya
Uganda
Cameroon
Gabon
Rwanda
Ghana
Congo
Other 0
1
2
3
4
5
6
Jan
Feb
Mar Ap
r
May Jun
Jul
Aug
Sep
Oct
Nov Dec
Ave
rage
num
ber o
f day
s
Figure 12. Average (median) number of days tourists spent by month of arrival, 2011
Overseas Other Africa SADC
Statistics South Africa
Report No. 03-51-02 (2011)
18 3. TABLES
Table 1. Number of foreign travellers and South African residents by year of travel, 2000–2011
YEAR
All travellers South African residents Foreign travellers
Arrivals Departures Total Arrivals Departures Total Arrivals Departures Total
2000 9 884 953 9 300 182 19 185 135 3 884 415 3 834 054 7 718 469 6 000 538 5 466 128 11 466 666 2001 9 710 483 9 040 275 18 750 758 3 802 459 3 733 058 7 535 517 5 908 024 5 307 217 11 215 241 2002 10 399 706 9 615 808 20 015 514 3 849 790 3 793 672 7 643 462 6 549 916 5 822 136 12 372 052 2003 7 894 158 7 119 038 15 013 196 1 254 063 1 163 839 2 417 902 6 640 095 5 955 199 12 595 294 2004 7 249 596 6 511 898 13 761 494 434 400 418 585 852 985 6 815 196 6 093 313 12 908 509
2005 9 630 617 8 920 258 18 550 875 2 112 300 2 191 599 4 303 899 7 518 317 6 728 659 14 246 976 2006 12 826 280 11 840 669 24 666 949 4 317 475 4 338 914 8 656 389 8 508 805 7 501 755 16 010 560 2007 13 656 529 12 456 288 26 112 817 4 448 832 4 433 492 8 882 324 9 207 697 8 022 796 17 230 493 2008 14 147 347 12 904 062 27 051 409 4 418 487 4 429 399 8 847 886 9 728 860 8 474 663 18 203 523 2009 14 585 617 13 104 237 27 689 854 4 487 311 4 423 987 8 911 298 10 098 306 8 680 250 18 778 556
2010 16 699 789 15 073 447 31 773 236 5 125 249 5 164 929 10 290 178 11 574 540 9 908 518 21 483 058
2011 17 924 920 16 180 473 34 105 393 5 429 177 5 455 260 10 884 437 12 495 743 10 725 213 23 220 956
Statistics South Africa
Report No. 03-51-02 (2011)
19
Table 2. Number of arrivals and departures of South African residents by mode of travel and place of arrival or departure, 2011 Mode of travel and place of arrival or departure
Total number of arrivals
Total number of departures
Total 5 429 177 5 455 260 Air 1 853 321 1 871 341 Cape Town International Airport 234 263 240 198 King Shaka International Airport 62 545 63 611 OR Tambo International Airport 1 521 090 1 531 821 Other Airports 35 423 35 711 Road 3 517 599 3 525 165 Botswana 578 420 590 402 Lesotho 1 053 558 1 071 093 Mozambique 614 663 594 060 Namibia 155 124 155 612 Swaziland 812 587 814 838 Zimbabwe 303 247 299 160 Sea 58 243 58 754 Cape Town Harbour 8 868 6 348 Durban Harbour 49 221 52 289 Port Elizabeth Harbour 154 117 Unspecified 14 -

Statistics South Africa
Report No. 03-51-02 (2011)
20
Table 3. Number of foreign arrivals by purpose of visit and month of arrival, 2011
Purpose of visit Total
Month of arrival
Jan Feb Mar Apr May Jun Jul Aug Sep Oct Nov Dec
Total 12 495 743 1 129 054 913 162 942 748 1 020 453 982 056 920 061 1 068 352 1 069 990 1 033 426 1 094 813 1 080 029 1 241 599 Business 193 844 27 679 14 839 15 429 12 161 14 792 13 960 15 237 14 283 15 881 17 247 20 220 12 116 Holiday 11 605 231 1 061 978 871 112 898 219 973 333 926 835 844 087 984 339 968 482 926 172 996 665 993 371 1 160 638 Study 92 171 15 086 8 296 5 057 7 452 7 449 5 266 16 011 6 499 6 780 6 760 3 910 3 605 Work 240 588 22 336 14 097 16 269 18 201 21 615 18 993 23 753 21 784 21 572 22 754 19 409 19 805 Border traffic concession 243 55 35 52 29 4 1 13 22 25 1 3 3 Transit 206 242 1 364 4 020 6 611 7 402 10 778 37 119 28 227 27 665 31 586 20 136 16 617 14 717 Unspecified 157 424 556 763 1 111 1 875 583 635 772 31 255 31 410 31 250 26 499 30 715
Statistics South Africa
Report No. 03-51-02 (2011)
21
Table 4. Number of foreign arrivals and departures by mode of travel and place of arrival or departure, 2011 Mode of travel and place of arrival or departure Arrivals Departures Total 12 495 743 10 725 213 Air 2 902 230 2 600 027 Cape Town International Airport 509 016 494 266 King Shaka International Airport 35 885 33 772 OR Tambo International Airport 2 339 435 2 052 779 Other airports 17 894 19 210 Road 9 560 918 8 096 407 Botswana 1 014 640 992 498 Lesotho 3 294 254 2 776 342 Mozambique 1 396 958 913 745 Namibia 161 384 163 410 Swaziland 1 373 596 1 275 028 Zimbabwe 2 320 086 1 975 384 Sea 32 099 28 779 Cape Town Harbour 19 706 15 342 Durban Harbour 7 930 7 527 Port Elizabeth Harbour 2 445 1 393 Other harbours 2 018 4 517 Unspecified 496 -
Statistics South Africa
Report No. 03-51-02 (2011)
22
Table 5. Number of foreign arrivals by type of visitor and month of arrival, 2011
Total
Month of arrival
Type of visitor
Jan
Feb
Mar
Apr
May
Jun
Jul
Aug
Sep
Oct
Nov
Dec
Total 12 495 743 1 129 054 913 162 942 748 1 020 453 982 056 920 061 1 068 352 1 069 990 1 033 426 1 094 813 1 080 029 1 241 599 Non Visitors 398 253 22 947 14 895 17 432 20 105 22 200 19 629 24 538 53 061 53 007 54 005 45 911 50 523 Visitors 12 097 490 1 106 107 898 267 925 316 1 000 348 959 856 900 432 1 043 814 1 016 929 980 419 1 040 808 1 034 118 1 191 076
Same day 3 758 136 309 581 274 368 293 965 301 949 313 071 300 632 325 619 308 047 303 986 317 561 329 385 379 972 Tourists 8 339 354 796 526 623 899 631 351 698 399 646 785 599 800 718 195 708 882 676 433 723 247 704 733 811 104
Statistics South Africa
Report No. 03-51-02 (2011)
23
Table 6. Number of same day visitors by mode of travel, region of residence and purpose of visit, 2011
Mode of travel and region
Total
Purpose of visit
Business Holiday Study Transit Total 3 758 136 9 962 3 737 193 9 027 1 954 Air 220 253 2 503 215 977 294 1 479 Overseas 150 408 1 446 147 883 68 1 011 SADC 64 487 883 62 978 190 436 ‘Other’ Africa 4 316 129 4 123 35 29 Unspecified 1 042 45 993 1 3 Road 3 537 129 7 458 3 520 530 8 732 409 Overseas 77 067 67 76 708 279 13 SADC 3 447 256 7 369 3 431 160 8 332 395 ‘Other’ Africa 9752 22 9613 116 1 Unspecified 3054 - 3049 5 - Sea 750 1 683 1 65 Overseas 620 - 559 1 60 SADC 119 - 119 - - ‘Other’ Africa 11 1 5 - 5 Unspecified 4 - 3 - 1
Statistics South Africa
Report No. 03-51-02 (2011)
24
Table 7. Number of tourists by region of residence and month of arrival, 2011
Region Total
Month of arrival
Jan
Feb
Mar
Apr
May
Jun
Jul
Aug
Sep
Oct
Nov
Dec
Total 8 339 354 796 526 623 899 631 351 698 399 646 785 599 800 718 195 708 882 676 433 723 247 704 733 811 104 Overseas 2 176 719 179 493 190 865 175 876 172 145 135 922 139 063 183 426 176 696 173 497 208 141 215 235 226 360 Europe 1 286 027 117 476 129 438 108 819 106 581 66 436 60 346 93 938 100 894 93 756 130 456 137 584 140 303 North America 345 384 22 193 24 033 29 331 24 232 27 954 33 172 35 974 30 550 29 912 29 330 26 563 32 140 Central and South America 87 506 7 019 6 351 6 659 5 909 5 174 6 557 9 040 6 638 8 004 7 823 7 900 10 432 Australasia 122 784 9 821 8 357 7 895 10 709 8 530 10 094 11 616 10 205 12 188 9 490 10 267 13 612 Middle East 37 136 2 865 2 768 3 660 2 938 2 350 2 795 4 259 2 885 2 898 3 328 3 199 3 191 Asia 297 882 20 119 19 918 19 512 21 776 25 478 26 099 28 599 25 524 26 739 27 714 29 722 26 682 Africa 6 136 835 615 250 431 265 453 448 524 223 508 776 458 688 532 779 530 346 500 714 512 624 486 653 582 069 SADC 5 951 261 601 025 418 083 439 312 509 604 493 644 444 700 516 493 513 814 484 139 496 550 468 758 565 139 ‘Other' African 185 574 14 225 13 182 14 136 14 619 15 132 13 988 16 286 16 532 16 575 16 074 17 895 16 930 East and Central Africa 75 309 6 642 5 768 5 633 6 668 5 932 5 617 6 808 6 621 6 050 5 856 6 866 6 848 West Africa 97 292 6 363 6 689 7 108 6 679 8 170 7 269 8 441 9 188 9 261 9 145 9 738 9 241 North Africa 12 973 1 220 725 1 395 1 272 1 030 1 102 1 037 723 1 264 1 073 1 291 841 Unspecified 25 800 1 783 1 769 2 027 2 031 2 087 2 049 1 990 1 840 2 222 2 482 2 845 2 675
Statistics South Africa
Report No. 03-51-02 (2011)
25
Table 8. Number of tourists by mode of travel, place and month of arrival, 2011 Mode of travel and place of arrival
Total
Month of arrival
Jan Feb Mar Apr May Jun Jul Aug Sep Oct Nov Dec
Total 8 339 354 796 526 623 899 631 351 698 399 646 785 599 800 718 195 708 882 676 433 723 247 704 733 811 104 Air 2 503 230 201 550 210 649 199 777 195 126 166 848 173 984 217 105 204 157 204 583 233 636 239 618 256 197 Cape Town International Airport 470 699 54 240 57 977 45 857 35 719 18 499 15 970 26 397 23 849 25 690 39 579 59 689 67 233 King Shaka International Airport 27 866 1 701 2 124 2 097 2 505 1 804 1 899 2 846 2 173 1 706 2 424 3 173 3 414 OR Tambo International Airport 1 993 829 145 015 149 798 151 115 156 138 145 805 155 343 186 846 177 107 175 829 190 374 175 870 184 589 Other airports 10 836 594 750 708 764 740 772 1 016 1 028 1 358 1 259 886 961 Road 5 826 678 594 131 410 243 430 534 502 584 479 575 425 689 500 954 504 622 471 084 489 535 463 957 553 770 Botswana 654 675 49 861 48 963 53 076 68 744 49 896 44 873 56 316 51 124 58 780 51 021 51 576 70 445 Lesotho 1 567 574 169 374 107 677 118 252 132 529 133 262 120 650 136 980 123 675 120 960 137 128 125 010 142 077 Mozambique 1 043 334 143 673 80 787 75 232 76 883 85 524 77 086 89 879 88 237 84 332 80 711 81 025 79 965 Namibia 127 517 11 686 7 452 8 895 13 589 9 878 7 097 9 945 11 841 9 307 9 214 9 184 19 429 Swaziland 865 927 73 214 61 109 61 898 76 613 66 519 59 864 74 318 83 573 73 259 79 240 72 210 84 110 Zimbabwe 1 567 651 146 323 104 255 113 181 134 226 134 496 116 119 133 516 146 172 124 446 132 221 124 952 157 744 Sea 9 169 797 2 933 1 021 671 290 101 126 100 763 73 1 157 1 137 Cape Town Harbour 6 730 223 2 697 67 658 280 77 116 90 759 66 1 027 670 Durban Harbour 362 300 39 2 1 - 5 1 - 3 7 - 4 Port Elizabeth Harbour 945 6 2 935 - 1 - - - 1 - - - Other harbours 1 132 268 195 17 12 9 19 9 10 - - 130 463 Unspecified 276 48 74 19 18 72 26 10 3 3 3 1 -
Statistics South Africa
Report No. 03-51-02 (2011)
26
Table 9. Number of tourists by region of residence and mode of travel, 2011
Region Total
Mode of travel
Air Road Sea Unspecified
Total 8 339 354 2 503 230 5 826 678 9 169 277 Overseas 2 176 719 1 917 883 250 258 8 419 159 Europe 1 286 027 1 117 783 163 247 4 981 16 North America 345 384 309 749 33 529 2 104 2 Central and South America 87 506 80 490 6 946 66 4 Australasia 122 784 113 484 9 096 204 - Middle East 37 136 34 885 2 230 18 3 Asia 297 882 261 492 35 210 1 046 134 Africa 6 136 835 568 078 5 567 904 735 118 SADC 5 951 261 403 631 5 547 025 577 28 ‘Other' African 185 574 164 447 20 879 158 90 East and Central Africa 75 309 64 636 10 585 35 53 West Africa 97 292 87 840 9 305 114 33 North Africa 12 973 11 971 989 9 4 Unspecified 25 800 17 269 8 516 15 -
Statistics South Africa
Report No. 03-51-02 (2011)
27 Table 10. Number of tourists from eight leading overseas countries in 2011 and their percentage change from 2010
Overseas 2010 2011 PERCENT
UK 453 030 420 483 -7,2
USA 282 377 287 614 1,9
Germany 215 800 235 774 9,3
The Netherlands 124 088 113 846 -8,3
France 115 401 105 420 -8,6
Australia 107 905 103 506 -4,1
India 71 587 90 367 26,2
China 65 920 84 862 28,7 Table 11. Number of tourists from eight leading SADC countries in 2011 and their percentage change from 2010
SADC 2010 2011 PERCENT
Zimbabwe 1 513 714 1 553 008 2,6
Lesotho 1 275 838 1 526 597 19,7
Mozambique 1 051 502 1 076 753 2,4
Swaziland 632 490 700 119 10,7
Botswana 507 042 477 937 -5,7
Namibia 190 903 197 835 3,6
Zambia 157 692 160 302 1,7
Malawi 126 120 135 577 7,5 Table 12. Number of tourists from eight leading ‘other’ African countries in 2011 and their percentage change from 2010
Other Africa 2010 2011 PERCENT
Nigeria 46 853 64 402 37,5
Kenya 29 089 30 279 4,1
Ghana 18 435 18 538 0,6
Uganda 13 627 14 450 6,0
Ethiopia 9 397 9 125 -2,9
Egypt 5 967 6 251 4,8
Gabon 6 052 6 199 2,4
Cameroon 6 461 5 357 -17,1
Statistics South Africa
Report No. 03-51-02 (2011)
28
Table 13. Number of tourists by sex, age group and region of residence, 2011
Sex and age group
Total
Region of residence
Overseas
SADC
‘Other’ Africa
Unspecified All 8 339 354 2 176 719 5 951 261 185 574 25 800 0-14 436 313 151 228 273 811 10 641 633 15-64 7 532 125 1 801 430 5 534 469 171 786 24 440 65+ 362 172 222 880 135 501 3 080 711 Unspecified 8 744 1 181 7 480 67 16 Male 4 760 132 1 242 133 3 375 604 126 066 16 329 0-14 219 162 78 526 135 028 5 319 289 15-64 4 349 376 1 041 913 3 173 097 118 767 15 599 65+ 186 793 121 005 63 415 1 940 433 Unspecified 4 801 689 4 064 40 8 Female 3 567 758 932 003 2 566 853 59 460 9 442 0-14 217 138 72 698 138 774 5 322 344 15-64 3 173 300 757 615 2 353 890 52 977 8 818 65+ 174 197 101 299 71 482 1 139 277 Unspecified 3 123 391 2 707 22 3 Unspecified 11 464 2 583 8 804 48 29 0-14 13 4 9 - - 15-64 9 449 1 902 7 482 42 23 65+ 1 182 576 604 1 1 Unspecified 820 101 709 5 5
Statistics South Africa
Report No. 03-51-02 (2011)
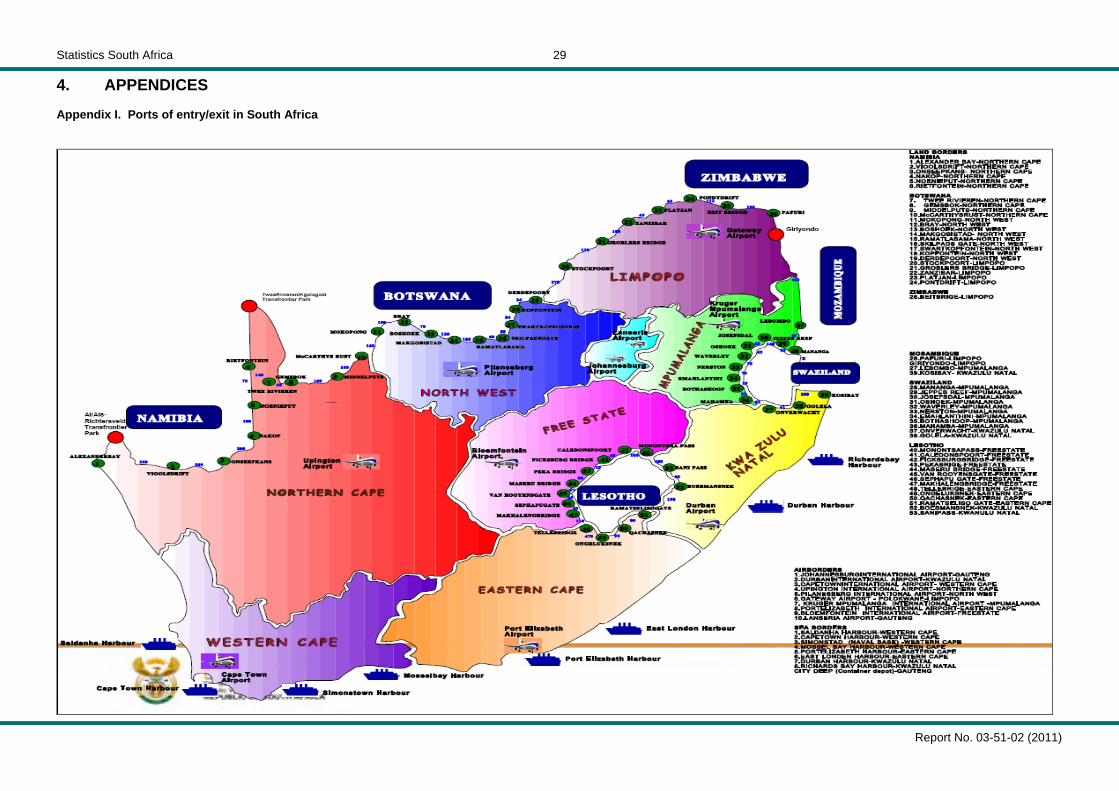
29 4. APPENDICES Appendix I. Ports of entry/exit in South Africa
Statistics South Africa
Report No. 03-51-02 (2011)
30
Appendix II. Number of South African residents by mode of travel, place and month of arrival, 2011
Total
Month of arrival
Mode of travel and place of arrival
Jan Feb Mar Apr May Jun Jul Aug Sep Oct Nov Dec Total 5 429 177 627 199 351 513 394 692 499 516 456 026 407 272 525 466 409 951 404 130 432 107 402 258 519 047 Air 1 853 321 193 054 109 280 133 309 164 218 161 435 144 075 198 693 136 924 154 541 159 311 128 160 170 321 Cape Town International Airport 234 263 24 896 13 476 16 274 20 015 19 088 17 804 28 625 16 854 18 475 18 352 16 885 23 519 King Shaka International Airport 62 545 6 896 3 142 5 042 6 012 5 664 4 428 6 846 4 226 4 621 5 317 4 515 5 836 OR Tambo International Airport 1 521 090 159 315 90 254 109 447 135 420 134 161 118 774 160 031 112 916 127 827 132 039 103 242 137 664 Other airports 35 423 1 947 2 408 2 546 2 771 2 522 3 069 3 191 2 928 3 618 3 603 3 518 3 302 Road 3 517 599 414 990 233 523 259 622 334 855 294 163 262 983 326 572 272 854 249 452 272 648 266 199 329 738 Botswana 578 420 54 802 38 278 41 062 56 446 48 662 44 846 57 120 46 372 43 621 48 176 41 878 57 157 Lesotho 1 053 558 122 466 82 694 89 357 99 622 88 775 82 132 90 227 83 478 76 417 77 857 71 067 89 466 Mozambique 614 663 102 396 39 284 42 759 57 950 52 256 44 590 55 928 42 921 39 637 45 213 36 614 55 115 Namibia 155 124 15 467 6 915 9 382 16 579 13 509 11 780 22 959 11 242 10 480 12 260 8 994 15 557 Swaziland 812 587 87 256 50 736 59 176 77 012 67 336 61 556 75 272 65 526 60 756 68 012 55 390 84 559 Zimbabwe 303 247 32 603 15 616 17 886 27 246 23 625 18 079 25 066 23 315 18 541 21 130 52 256 27 884 Sea 58 243 19 154 8 706 1 752 443 428 214 201 173 137 148 7 899 18 988 Cape Town Harbour 8 868 2 632 524 1 649 417 356 198 140 143 89 118 350 2 252 Durban Harbour 49 221 16 520 8 178 55 24 21 12 59 23 42 27 7 528 16 732 Port Elizabeth Harbour 154 2 4 48 2 51 4 2 7 6 3 21 4 Unspecified 14 1 4 9 - - - - - - - - -
Statistics South Africa
Report No. 03-51-02 (2011)
31
Appendix III. Number of South African residents by mode of travel, place and month of departure, 2011 Mode of travel and place of departure
Total
Month of departure
Jan Feb Mar Apr May Jun Jul Aug Sep Oct Nov Dec Total 5 455 260 422 214 359 714 427 094 550 502 403 602 484 417 452 390 424 168 430 348 403 918 405 155 691 738 Air 1 871 341 144 941 114 209 153 219 175 228 154 407 191 437 150 083 150 075 165 517 144 202 126 596 201 427 Cape Town International Airport 240 198 19 253 13 614 20 283 22 010 20 416 29 539 17 891 18 452 21 373 15 996 14 792 26 579 King Shaka International Airport 63 611 5 063 3 858 5 933 5 994 4 986 6 173 5 032 4 989 5 529 4 822 4 251 6 981 OR Tambo International Airport 1 531 821 118 532 94 420 124 321 144 553 126 297 152 562 124 227 123 550 134 660 119 880 104 018 164 801 Other airports 35 711 2 093 2 317 2 682 2 671 2 708 3 163 2 933 3 084 3 955 3 504 3 535 3 066 Road 3 525 165 261 592 236 388 272 018 375 084 248 253 292 745 302 124 273 758 264 576 259 408 268 913 470 306 Botswana 590 402 39 647 37 964 45 727 60 932 41 770 51 483 52 783 47 649 47 322 45 530 43 097 76 498 Lesotho 1 071 093 92 962 86 086 92 381 110 003 79 595 86 371 90 092 85 379 79 594 76 543 72 773 119 314 Mozambique 594 060 39 604 37 554 43 686 69 446 37 986 48 917 48 422 40 615 41 305 42 281 35 565 108 679 Namibia 155 612 9 225 7 354 10 885 18 747 10 916 19 454 15 759 11 048 11 164 11 216 9 171 20 673 Swaziland 814 838 64 388 52 083 60 199 84 043 59 969 65 170 72 724 65 876 65 347 64 352 56 507 104 180 Zimbabwe 299 160 15 766 15 347 19 140 31 913 18 017 21 350 22 344 23 191 19 844 19 486 51 800 40 962 Sea 58 754 15 681 9 117 1 857 190 942 235 183 335 255 308 9 646 20 005 Cape Town Harbour 6 348 663 276 1790 153 905 184 108 239 210 264 191 1 365 Durban Harbour 52 289 15 016 8 839 56 34 29 47 71 54 42 38 9 450 18 613 Port Elizabeth Harbour 117 2 2 11 3 8 4 4 42 3 6 5 27
Statistics South Africa
Report No. 03-51-02 (2011)
32
Appendix IV. Number of foreign arrivals by mode of travel, place and month of arrival, 2011
Mode of travel and place of arrival
Total
Month of arrival
Jan Feb Mar Apr May Jun Jul Aug Sep Oct Nov Dec Total 12 495 743 1 129 054 913 162 942 748 1 020 453 982 056 920 061 1 068 352 1 069 990 1 033 426 1 094 813 1 080 029 1 241 599 Air 2 902 230 230 360 232 161 224 701 220 478 192 994 199 133 248 376 253 022 250 115 278 548 277 992 294 350 Cape Town International Airport 509 016 56 735 60 068 48 580 37 554 20 138 17 533 28 678 28 581 30 560 44 163 64 188 72 238 King Shaka International Airport 35 885 2 064 2 522 2 731 2 976 2 287 2 393 3 279 3 209 2 736 3 438 4 051 4 199 OR Tambo International Airport 2 339 435 170 559 168 400 172 266 178 851 169 313 177 675 214 832 219 659 214 687 228 745 208 017 216 431 Other airports 17 894 1 002 1 171 1 124 1 097 1 256 1 532 1 587 1 573 2 132 2 202 1 736 1 482 Road 9 560 918 896 422 675 824 715 169 797 656 786 939 719 098 818 062 815 066 780 621 814 189 798 736 943 136 Botswana 1 014 640 79 796 75 126 80 151 96 877 79 044 72 950 89 478 83 144 88 004 79 676 80 740 109 654 Lesotho 3 294 254 325 212 238 170 256 368 269 791 271 963 254 310 280 795 258 448 261 646 283 049 276 464 318 038 Mozambique 1 396 958 168 162 107 055 102 095 104 797 110 809 99 643 112 747 120 160 117 826 115 827 117 063 120 774 Namibia 161 384 14 506 9 669 11 125 16 010 12 451 9 492 12 370 14 979 12 197 12 538 12 328 23 719 Swaziland 1 373 596 116 323 94 111 97 248 114 752 106 801 99 731 119 273 129 901 116 104 123 333 116 191 139 828 Zimbabwe 2 320 086 192 423 151 693 168 182 195 429 205 871 182 972 203 399 208 434 184 844 199 766 195 950 231 123 Sea 32 099 2 203 5 046 2 849 2 291 1 999 1 782 1 886 1 885 2 679 2 070 3 297 4 112 Cape Town Harbour 19 706 1 124 4 053 1 209 1 504 1 173 993 1 152 1 068 1 857 1 237 2 117 2 219 Durban Harbour 9 547 959 780 624 664 651 665 615 639 665 686 947 1 652 Port Elizabeth Harbour 2 445 71 40 992 82 143 91 91 168 156 144 227 240 Other harbours 401 49 173 24 41 32 33 28 10 1 3 6 1 Unspecified 496 69 131 29 28 124 48 28 17 11 6 4 1
Statistics South Africa
Report No. 03-51-02 (2011)
33
Appendix V. Number of foreign departures by mode of travel, place and month of departure, 2011
Mode of travel and place of departure
Total
Month of departure
Jan Feb Mar Apr May Jun Jul Aug Sep Oct Nov Dec
Total 10 725 213 856 890 774 619 844 974 914 059 832 803 786 784 872 113 898 310 883 309 926 095 940 482 1 194 775 Air 2 600 027 235 261 208 509 231 076 217 411 186 586 164 365 189 685 227 143 204 267 230 930 250 798 253 996 Cape Town International Airport 494 266 57 711 56 505 58 547 40 919 24 859 18 671 21 616 29 766 27 841 38 340 61 809 57 682 King Shaka International Airport 33 772 2 936 2 170 2 528 2 814 2 493 2 031 3 170 3 386 2 570 2 880 3 372 3 422 OR Tambo International Airport 2 052 779 173 657 148 681 168 776 172 488 157 872 142 098 163 233 192 303 171 532 187 386 183 699 191 054 Other airports 19 210 957 1 153 1 225 1 190 1 362 1 565 1 666 1 688 2 324 2 324 1 918 1 838 Road 8 096 407 619 181 561 029 610 812 694 439 644 034 620 959 680 888 669 276 677 024 693 493 687 807 937 465 Botswana 992 498 79 510 72 323 74 619 91 566 76 674 72 790 87 375 80 304 81 696 81 960 78 799 114 882 Lesotho 2 776 342 236 704 205 520 220 714 237 528 217 953 211 325 237 240 213 979 223 867 232 725 233 978 304 809 Mozambique 913 745 65 478 66 804 68 829 71 924 66 494 61 446 64 622 74 628 81 740 83 824 83 640 124 316 Namibia 163 410 17 288 9 628 11 495 13 079 15 335 11 191 12 127 13 132 14 697 13 233 12 838 19 367 Swaziland 1 275 028 102 770 85 002 89 969 105 463 97 844 95 926 109 881 116 822 113 263 113 841 109 071 135 176 Zimbabwe 1 975 384 117 431 121 752 145 186 174 879 169 734 168 281 169 643 170 411 161 761 167 910 169 481 238 915 Sea 28 779 2 448 5 081 3 086 2 209 2 183 1 460 1 540 1 891 2 018 1 672 1 877 3 314 Cape Town Harbour 15 342 1 412 1 703 2 164 1 545 1 509 702 852 1 082 1 281 1 044 735 1 313 Durban Harbour 11 571 982 3 120 618 605 616 669 525 665 597 474 938 1 762 Port Elizabeth Harbour 1 393 47 45 51 59 58 89 163 144 140 154 204 239 Other harbours 473 7 213 253 - - - - - - - - -
Statistics South Africa
Report No. 03-51-02 (2011)
34
Appendix VI. Number of tourists by country of residence and month of arrival, 2011
Country
Total Month of arrival
Jan Feb Mar Apr May Jun Jul Aug Sep Oct Nov Dec Total 8 339 354 796 526 623 899 631 351 698 399 646 785 599 800 718 195 708 882 676 433 723 247 704 733 811 104 Overseas 2 176 719 179 493 190 865 175 876 172 145 135 922 139 063 183 426 176 696 173 497 208 141 215 235 226 360 Europe 1 286 027 117 476 129 438 108 819 106 581 66 436 60 346 93 938 100 894 93 756 130 456 137 584 140 303 Albania 115 8 7 9 8 2 7 9 20 13 5 11 16 Andorra 32 6 - 4 5 3 2 1 6 - 1 2 2 Austria 21 841 2 070 2 548 1 730 1 687 959 768 1 325 1 545 1 454 2 294 2 964 2 497 Belarus 664 59 88 60 49 38 29 64 48 41 50 76 62 Belgium 40 478 3 106 3 702 3 032 3 524 1 921 1 699 3 929 3 030 3 047 4 980 4 658 3 850 Bosnia-Herzegovina 267 27 20 18 9 44 13 14 36 22 19 23 22 Bulgaria 2 233 254 202 172 191 137 142 145 137 176 165 204 308 Byelorussian SSR 1 - - - - - - - - 1 - - - Croatia 1 159 96 90 82 80 83 82 80 77 125 94 135 135 Czech Republic 6 169 600 667 621 482 336 282 309 372 461 681 902 456 Denmark 22 970 2 489 3 143 1 871 1 808 1 122 1 154 1 651 1 124 1 578 2 474 2 226 2 330 Estonia 676 48 68 104 43 23 64 18 21 29 51 119 88 Finland 10 090 1 213 1 296 817 647 512 535 486 436 605 942 1 277 1 324 France 105 420 9 036 10 071 9 639 7 926 6 456 5 063 9 109 9 595 6 625 11 285 11 231 9 384 Germany 235 774 21 313 23 521 22 680 18 626 10 552 9 204 13 122 15 760 18 563 28 634 29 849 23 950 Greece 5 822 559 431 384 545 443 340 366 439 589 475 529 722 Hungary 2 882 317 267 222 231 177 127 166 178 169 245 523 260 Iceland 598 56 50 43 58 32 31 40 50 41 63 59 75 Ireland 29 098 3 002 2 661 2 353 2 494 1 590 1 641 2 255 2 185 1 870 2 191 3 290 3 566 Isle Of Man 13 8 1 - - - 1 1 - - - 2 Isle Of Wight 1 - - - - - - - - - - - 1 Italy 54 628 4 222 3 532 3 318 3 177 2 969 3 285 4 485 10 251 4 912 4 484 4 296 5 697 Latvia 608 43 48 46 37 60 33 27 32 61 85 85 51 Liechtenstein 213 35 10 17 17 6 6 14 9 12 20 33 34 Lithuania 773 54 61 90 56 45 26 69 63 48 77 85 99 Luxembourg 1 271 65 80 62 194 40 37 50 252 94 107 108 182 Malta 550 32 50 22 34 20 33 47 47 132 39 44 50 Moldova 149 6 10 8 9 10 13 22 7 13 9 14 28 Monaco 93 8 9 9 3 4 2 12 12 1 2 18 13 Norway 20 556 2 078 2 436 1 749 1 959 1 015 1 141 1 304 849 1 269 1 991 2 307 2 458 Poland 9 962 975 859 1 047 674 542 519 570 741 808 943 1 412 872
Statistics South Africa
Report No. 03-51-02 (2011)
35
Appendix VI. Number of tourists by country of residence and month of arrival, 2011 (continued)
Country
Total
Month of arrival Jan Feb Mar Apr May Jun Jul Aug Sep Oct Nov Dec
Portugal 40 301 3 101 3 342 3 266 4 236 2 789 2 820 2 849 3 049 3 368 3 371 3 662 4 448 Romania 2 188 190 146 194 162 131 122 133 163 206 224 219 298 Russian Federation 10 487 956 731 898 861 677 544 648 676 679 1 070 1 336 1 411 San Marino 41 1 4 2 - 3 1 1 8 8 5 5 3 Slovakia 2 093 199 164 162 206 134 122 141 131 147 283 197 207 Slovenia 1 037 83 74 67 95 71 70 80 92 69 113 139 84 Spain 27 209 1 451 1 444 1 774 2 023 1 748 1 977 2 812 4 336 2 595 2 428 2 394 2 227 Sweden 38 754 5 292 5 530 3 443 2 430 1 547 1 547 1 384 1 351 1 810 3 643 4 805 5 972 Switzerland 40 728 3 768 3 920 2 974 3 311 1 788 1 539 2 747 2 275 3 272 5 460 5 018 4 656 The Netherlands 113 846 10 400 10 378 8 067 7 175 5 055 4 209 11 757 8 365 8 184 14 357 12 987 12 912 Turkey 10 348 884 1 128 871 952 668 602 720 696 687 700 1 689 751 UK 420 483 39 041 46 435 36 638 40 301 22 484 20 271 30 724 32 153 29 694 36 095 38 286 48 361 Ukraine 3 142 308 193 237 237 186 214 223 259 259 281 333 412 Vatican 10 - 2 - 1 - - 1 1 - 2 2 1 Yugoslavia 254 17 19 17 18 14 29 29 16 19 18 32 26 North America 345 384 22 193 24 033 29 331 24 232 27 954 33 172 35 974 30 550 29 912 29 330 26 563 32 140 Canada 57 767 4 508 5 299 5 392 4 468 3 920 3 547 4 584 4 205 4 517 5 597 5 192 6 538 East Indian Islands 3 - - - - - - - - - 2 - 1 USA 287 614 17 685 18 734 23 939 19 764 24 034 29 625 31 390 26 345 25 395 23 731 21 371 25 601 Central and South America 87 506 7 019 6 351 6 659 5 909 5 174 6 557 9 040 6 638 8 004 7 823 7 900 10 432 Antigua And Barbuda 83 2 3 4 1 3 5 1 54 4 3 3 Argentina 13 817 1 471 2 154 1 436 865 661 616 1 122 887 1 064 1 112 1 136 1 293 Bahamas 137 8 3 13 5 7 3 15 28 25 13 8 9 Barbados 174 10 9 6 6 7 4 25 43 10 24 17 13 Belize 57 4 4 4 6 4 6 5 1 3 11 9 Bermuda 58 2 3 4 4 2 1 19 1 1 10 8 3 Bolivia 690 25 36 40 51 35 40 56 70 73 62 94 108 Brazil 54 183 4 331 2 954 3 856 3 497 3 214 4 235 5 780 4 062 5 215 5 072 4 864 7 103 Chile 3 210 233 390 274 217 211 258 338 210 265 284 285 245 Colombia 1 831 107 95 110 188 145 149 204 109 128 129 214 253 Costa Rica 401 22 22 32 25 36 32 31 27 48 30 55 41 Cuba 1 139 128 63 45 61 52 147 115 102 122 100 74 130 Dominica 109 4 8 11 4 10 5 8 9 12 7 18 13 Ecuador 626 26 37 77 49 43 37 54 56 57 68 76 46
Statistics South Africa
Report No. 03-51-02 (2011)
36
Appendix VI. Number of tourists by country of residence and month of arrival, 2011 (continued)
Country
Total
Month of arrival Jan Feb Mar Apr May Jun Jul Aug Sep Oct Nov Dec
El Salvador 93 6 6 10 4 6 9 8 7 10 2 12 13 Grenada 37 1 2 3 - 3 1 1 1 4 4 10 7 Guatemala 181 13 8 13 12 23 15 14 12 12 11 31 17 Guyana (Guinea-British) 1 - - - - - - - - - - - - Haiti 98 4 4 6 7 12 8 6 13 9 8 14 7 Honduras 188 10 3 6 23 9 33 25 8 18 10 22 21 Jamaica 663 55 33 31 41 46 55 91 60 56 70 51 74 Mexico 3 246 159 161 238 308 201 310 436 223 280 271 329 330 Nicaragua 80 7 2 3 4 6 3 6 6 7 6 17 13 Panama 262 15 8 13 17 9 12 93 20 14 16 37 8 Paraguay 530 34 26 49 29 30 63 42 57 40 49 50 61 Peru 2 185 152 151 158 173 156 191 217 213 181 181 180 232 Puerto Rico 3 - - - - - - - 1 - 1 - 1 St Lucia 43 1 2 5 2 1 9 4 1 2 1 6 9 St Vincent And Grenadines 36 1 1 2 3 3 2 11 2 3 8 Suriname 91 6 5 4 2 7 11 10 4 8 9 11 14 Trinidad And Tobago 693 24 28 55 32 61 76 62 84 66 70 39 96 Turks And Caicos islands 2 - - - - - - 1 1 - - - - Uruguay 1 162 62 59 59 172 87 106 109 107 129 67 114 91 Venezuela 1 293 88 68 89 102 80 107 110 136 139 124 98 152 West Indies 104 12 3 3 4 2 9 28 10 6 5 13 9 Australasia 122 784 9 821 8 357 7 895 10 709 8 530 10 094 11 616 10 205 12 188 9 490 10 267 13 612 Australia 103 506 8 544 7 167 6 679 8 804 7 325 8 613 9 699 8 463 10 719 8 106 8 481 10 906 Bouvet Island 1 - - - - - - - - 1 - - - Cocos (Keeling) Islands 1 - - - - - - 1 - - - - - Federated States of Micron 4 - - - - - - - - - - 4 - Fiji 151 11 10 6 8 5 12 28 7 5 5 26 28 French Polynesia 4 - - - - - - - 1 - - 1 2 French Southern Ter 3 - - - 1 2 - - - - - - - Guam 2 1 - - - - - - - - - 1 Kiribati 12 - 2 - - 2 - - - 1 1 5 1 Marshall Islands 9 - - - - - - 1 - - - 4 4 Nauru 14 - - - - - 2 - - - 4 4 4 New Caledonia 2 2 - - - - - - - - - - - New Zealand 18 859 1 256 1 174 1 200 1 885 1 191 1 450 1 877 1 711 1 447 1 360 1 695 2 613
Statistics South Africa
Report No. 03-51-02 (2011)
37
Appendix VI. Number of tourists by country of residence and month of arrival, 2011 (continued)
Country
Total
Month of arrival Jan Feb Mar Apr May Jun Jul Aug Sep Oct Nov Dec
Norfolk Island 1 - - - - - - - 1 - - - - Northern Mariana Island 1 - - - - - - - - - - - 1 Palau 3 - - - - - - - - - - 3 - Papua New Guinea 91 2 1 4 6 2 10 3 7 6 8 20 22 Samoa 48 2 1 2 3 1 1 3 5 - 2 5 23 Solomon Island 29 - 1 1 - - 5 3 3 8 2 3 3 Tasmania 1 - - - - - - - - - - - 1 Tokelau 2 2 - - - - - - - - - - - Tonga Island 24 1 1 3 2 2 - 1 7 - - 5 2 Tuvalu 9 - - - - - 1 - - - 1 7 - Vanuatu 7 - - - - - - - - 1 1 4 1 Middle East 37 136 2 865 2 768 3 660 2 938 2 350 2 795 4 259 2 885 2 898 3 328 3 199 3 191 Bahrain 177 24 3 3 14 11 12 31 5 14 10 30 20 Cyprus 1 672 147 142 122 156 104 121 135 141 121 114 147 222 Iran 4 773 374 252 1 606 169 210 150 220 276 424 250 362 480 Iraq 285 44 21 10 37 15 15 24 13 21 43 29 13 Israel 17 751 1 489 1 509 1 217 1 680 1 235 1 067 1 497 1 771 1 332 1 847 1 518 1 589 Jordan 1 696 127 170 139 141 113 121 162 84 166 137 182 154 Kuwait 632 26 25 21 19 25 65 211 43 33 31 74 59 Lebanon 2 720 179 178 216 239 244 251 236 212 236 227 252 250 Oman 349 19 29 8 16 42 43 50 11 43 42 31 15 Palestine 245 16 13 25 16 17 26 40 11 24 19 11 27 Qatar 231 9 21 23 25 9 21 33 9 8 10 39 24 Saudi Arabia 4 733 215 303 152 270 193 713 1 295 250 315 501 323 203 Syria 498 65 17 32 67 32 33 31 26 37 37 72 49 United Arab Emirates 1 072 100 60 56 60 75 126 257 27 95 46 104 66 Yemen 302 31 25 30 29 25 31 37 6 29 14 25 20 Asia 297 882 20 119 19 918 19 512 21 776 25 478 26 099 28 599 25 524 26 739 27 714 29 722 26 682 Afghanistan 206 23 42 5 11 4 21 11 8 9 30 33 9 Armenia 100 9 5 7 12 2 8 8 7 10 9 15 8 Azerbaijan 160 38 4 4 7 24 7 11 14 11 10 16 14 Bangladesh 3 900 286 198 219 345 292 286 349 277 380 342 481 445 Bhutan 27 - 1 1 3 - 1 - 1 1 2 10 7 Borneo 1 - - - - - - - - - - - 1
Statistics South Africa
Report No. 03-51-02 (2011)
38
Appendix VI. Number of tourists by country of residence and month of arrival, 2011 (continued)
Country
Total
Month of arrival Jan Feb Mar Apr May Jun Jul Aug Sep Oct Nov Dec
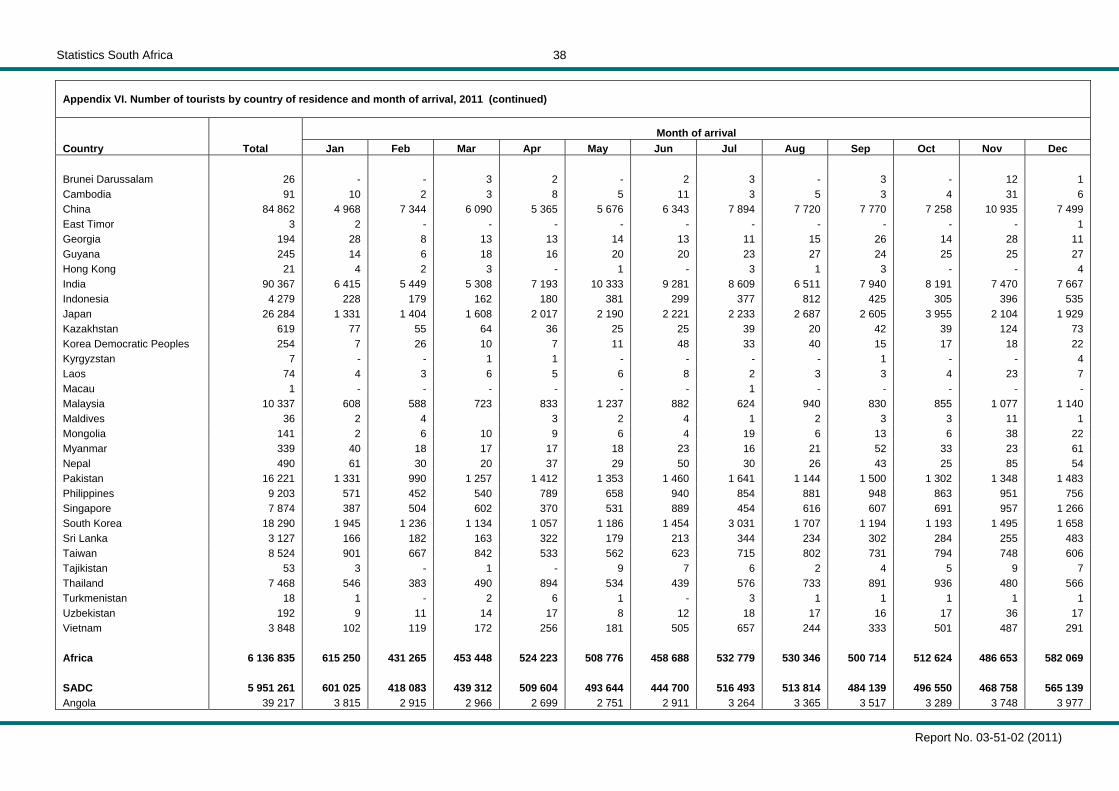
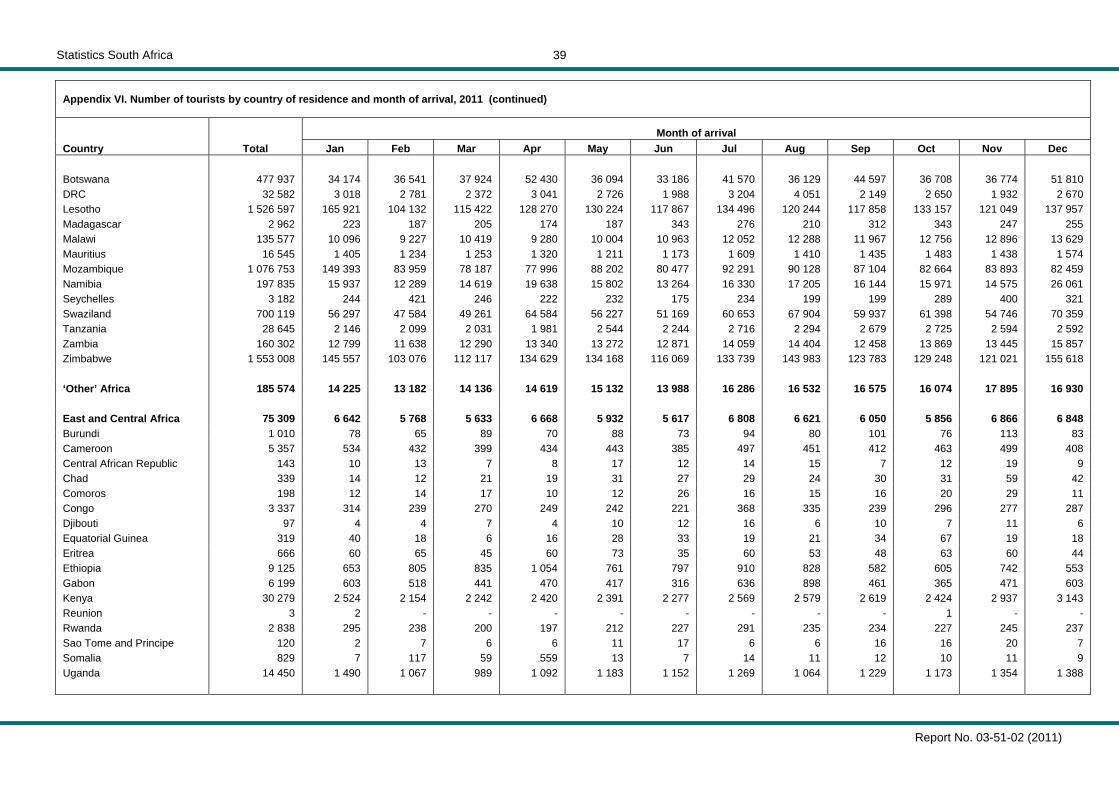
Brunei Darussalam 26 - - 3 2 - 2 3 - 3 - 12 1 Cambodia 91 10 2 3 8 5 11 3 5 3 4 31 6 China 84 862 4 968 7 344 6 090 5 365 5 676 6 343 7 894 7 720 7 770 7 258 10 935 7 499 East Timor 3 2 - - - - - - - - - - 1 Georgia 194 28 8 13 13 14 13 11 15 26 14 28 11 Guyana 245 14 6 18 16 20 20 23 27 24 25 25 27 Hong Kong 21 4 2 3 - 1 - 3 1 3 - - 4 India 90 367 6 415 5 449 5 308 7 193 10 333 9 281 8 609 6 511 7 940 8 191 7 470 7 667 Indonesia 4 279 228 179 162 180 381 299 377 812 425 305 396 535 Japan 26 284 1 331 1 404 1 608 2 017 2 190 2 221 2 233 2 687 2 605 3 955 2 104 1 929 Kazakhstan 619 77 55 64 36 25 25 39 20 42 39 124 73 Korea Democratic Peoples 254 7 26 10 7 11 48 33 40 15 17 18 22 Kyrgyzstan 7 - - 1 1 - - - - 1 - - 4 Laos 74 4 3 6 5 6 8 2 3 3 4 23 7 Macau 1 - - - - - - 1 - - - - - Malaysia 10 337 608 588 723 833 1 237 882 624 940 830 855 1 077 1 140 Maldives 36 2 4 3 2 4 1 2 3 3 11 1 Mongolia 141 2 6 10 9 6 4 19 6 13 6 38 22 Myanmar 339 40 18 17 17 18 23 16 21 52 33 23 61 Nepal 490 61 30 20 37 29 50 30 26 43 25 85 54 Pakistan 16 221 1 331 990 1 257 1 412 1 353 1 460 1 641 1 144 1 500 1 302 1 348 1 483 Philippines 9 203 571 452 540 789 658 940 854 881 948 863 951 756 Singapore 7 874 387 504 602 370 531 889 454 616 607 691 957 1 266 South Korea 18 290 1 945 1 236 1 134 1 057 1 186 1 454 3 031 1 707 1 194 1 193 1 495 1 658 Sri Lanka 3 127 166 182 163 322 179 213 344 234 302 284 255 483 Taiwan 8 524 901 667 842 533 562 623 715 802 731 794 748 606 Tajikistan 53 3 - 1 - 9 7 6 2 4 5 9 7 Thailand 7 468 546 383 490 894 534 439 576 733 891 936 480 566 Turkmenistan 18 1 - 2 6 1 - 3 1 1 1 1 1 Uzbekistan 192 9 11 14 17 8 12 18 17 16 17 36 17 Vietnam 3 848 102 119 172 256 181 505 657 244 333 501 487 291 Africa 6 136 835 615 250 431 265 453 448 524 223 508 776 458 688 532 779 530 346 500 714 512 624 486 653 582 069 SADC 5 951 261 601 025 418 083 439 312 509 604 493 644 444 700 516 493 513 814 484 139 496 550 468 758 565 139 Angola 39 217 3 815 2 915 2 966 2 699 2 751 2 911 3 264 3 365 3 517 3 289 3 748 3 977
Statistics South Africa
Report No. 03-51-02 (2011)
39
Appendix VI. Number of tourists by country of residence and month of arrival, 2011 (continued)
Country
Total
Month of arrival Jan Feb Mar Apr May Jun Jul Aug Sep Oct Nov Dec
Botswana 477 937 34 174 36 541 37 924 52 430 36 094 33 186 41 570 36 129 44 597 36 708 36 774 51 810 DRC 32 582 3 018 2 781 2 372 3 041 2 726 1 988 3 204 4 051 2 149 2 650 1 932 2 670 Lesotho 1 526 597 165 921 104 132 115 422 128 270 130 224 117 867 134 496 120 244 117 858 133 157 121 049 137 957 Madagascar 2 962 223 187 205 174 187 343 276 210 312 343 247 255 Malawi 135 577 10 096 9 227 10 419 9 280 10 004 10 963 12 052 12 288 11 967 12 756 12 896 13 629 Mauritius 16 545 1 405 1 234 1 253 1 320 1 211 1 173 1 609 1 410 1 435 1 483 1 438 1 574 Mozambique 1 076 753 149 393 83 959 78 187 77 996 88 202 80 477 92 291 90 128 87 104 82 664 83 893 82 459 Namibia 197 835 15 937 12 289 14 619 19 638 15 802 13 264 16 330 17 205 16 144 15 971 14 575 26 061 Seychelles 3 182 244 421 246 222 232 175 234 199 199 289 400 321 Swaziland 700 119 56 297 47 584 49 261 64 584 56 227 51 169 60 653 67 904 59 937 61 398 54 746 70 359 Tanzania 28 645 2 146 2 099 2 031 1 981 2 544 2 244 2 716 2 294 2 679 2 725 2 594 2 592 Zambia 160 302 12 799 11 638 12 290 13 340 13 272 12 871 14 059 14 404 12 458 13 869 13 445 15 857 Zimbabwe 1 553 008 145 557 103 076 112 117 134 629 134 168 116 069 133 739 143 983 123 783 129 248 121 021 155 618 ‘Other’ Africa 185 574 14 225 13 182 14 136 14 619 15 132 13 988 16 286 16 532 16 575 16 074 17 895 16 930 East and Central Africa 75 309 6 642 5 768 5 633 6 668 5 932 5 617 6 808 6 621 6 050 5 856 6 866 6 848 Burundi 1 010 78 65 89 70 88 73 94 80 101 76 113 83 Cameroon 5 357 534 432 399 434 443 385 497 451 412 463 499 408 Central African Republic 143 10 13 7 8 17 12 14 15 7 12 19 9 Chad 339 14 12 21 19 31 27 29 24 30 31 59 42 Comoros 198 12 14 17 10 12 26 16 15 16 20 29 11 Congo 3 337 314 239 270 249 242 221 368 335 239 296 277 287 Djibouti 97 4 4 7 4 10 12 16 6 10 7 11 6 Equatorial Guinea 319 40 18 6 16 28 33 19 21 34 67 19 18 Eritrea 666 60 65 45 60 73 35 60 53 48 63 60 44 Ethiopia 9 125 653 805 835 1 054 761 797 910 828 582 605 742 553 Gabon 6 199 603 518 441 470 417 316 636 898 461 365 471 603 Kenya 30 279 2 524 2 154 2 242 2 420 2 391 2 277 2 569 2 579 2 619 2 424 2 937 3 143 Reunion 3 2 - - - - - - - - 1 - - Rwanda 2 838 295 238 200 197 212 227 291 235 234 227 245 237 Sao Tome and Principe 120 2 7 6 6 11 17 6 6 16 16 20 7 Somalia 829 7 117 59 559 13 7 14 11 12 10 11 9 Uganda 14 450 1 490 1 067 989 1 092 1 183 1 152 1 269 1 064 1 229 1 173 1 354 1 388
Statistics South Africa
Report No. 03-51-02 (2011)
40
Appendix VI. Number of tourists by country of residence and month of arrival, 2011 (concluded)
Country
Total
Month of arrival Jan Feb Mar Apr May Jun Jul Aug Sep Oct Nov Dec
West Africa 97 292 6 363 6 689 7 108 6 679 8 170 7 269 8 441 9 188 9 261 9 145 9 738 9 241 Benin 1 299 97 71 74 71 158 141 77 117 112 113 187 81 Burkina Faso 697 34 48 48 32 85 65 56 88 60 62 70 49 Cape Verde Island 534 41 36 39 48 33 48 45 52 57 39 53 43 Cote D'Ivoire 1 781 119 109 116 64 152 149 183 161 205 165 260 98 Gambia 805 28 37 47 74 64 104 81 70 96 88 68 48 Ghana 18 538 1 328 1 332 1 271 1 256 1 412 1 480 1 573 1 833 1 814 1 757 1 830 1 652 Guinea 2 127 133 152 145 141 138 194 238 155 192 217 228 194 Guinea-Bissau 198 11 16 10 12 13 31 16 12 16 30 24 7 Liberia 586 23 39 31 34 50 64 49 58 60 51 68 59 Madeira Islands 1 - - - - - - - - - - - 1 Mali 1 192 54 70 78 94 120 88 119 83 118 146 135 87 Mauritania 269 10 37 18 31 19 30 27 11 17 20 39 10 Niger 296 14 26 22 9 20 24 32 16 25 26 48 34 Nigeria 64 402 4 220 4 426 4 824 4 496 5 480 4 440 5 523 6 180 6 076 5 998 6 226 6 513 Saint Helena 80 14 - 1 10 26 - 16 - - - 6 7 Senegal 2 965 143 183 284 206 259 265 262 235 292 269 316 251 Sierra Leone 930 61 75 52 75 73 93 85 73 70 121 92 60 Togo 592 33 32 48 26 68 53 59 44 51 43 88 47 North Africa 12 973 1 220 725 1 395 1 272 1 030 1 102 1 037 723 1 264 1 073 1 291 841 Algeria 1 259 94 80 154 66 123 92 109 101 97 128 116 99 Egypt 6 251 620 292 699 702 449 522 465 317 640 506 636 403 Libya 977 207 87 82 56 67 73 59 46 81 52 98 69 Morocco 1 364 117 93 170 111 101 81 119 68 123 144 142 95 The Sudan 1 891 125 117 160 199 222 228 142 99 167 165 173 94 Tunisia 1 221 55 56 130 138 68 105 140 92 154 78 126 79 Western Sahara 10 2 - - - - 1 3 - 2 - - 2 Unspecified 25 800 1 783 1 769 2 027 2 031 2 087 2 049 1 990 1 840 2 222 2 482 2 845 2 675
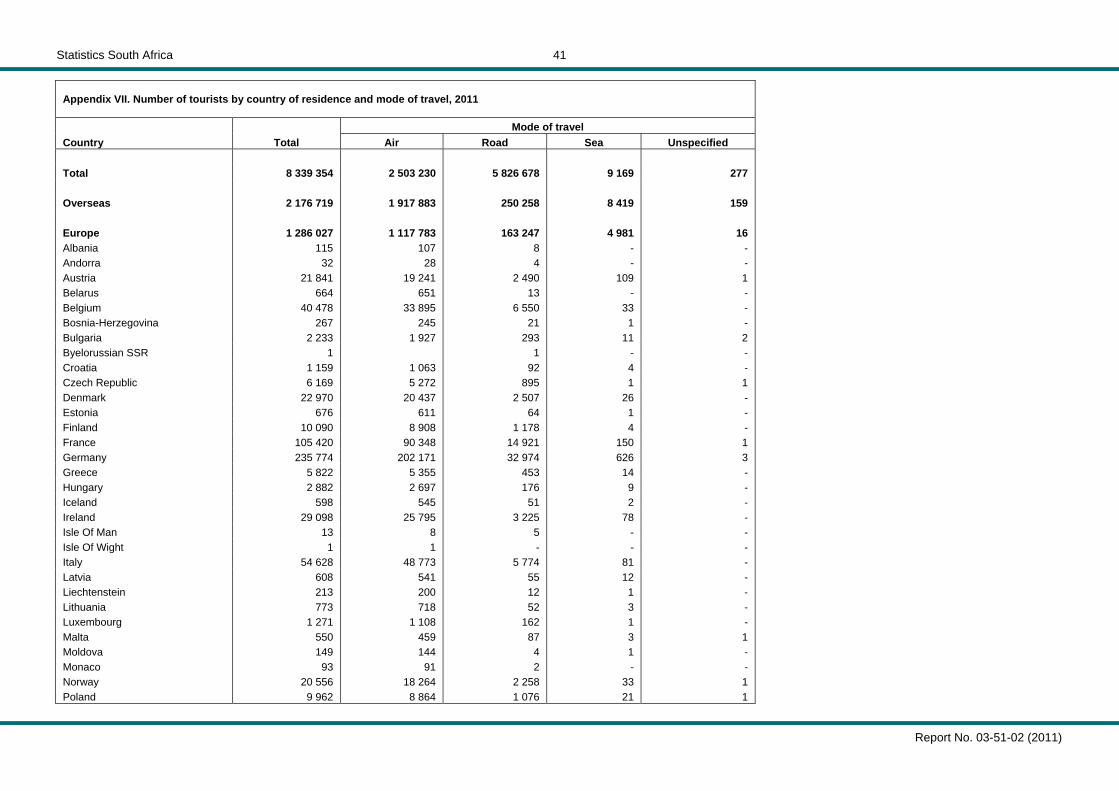
Statistics South Africa
Report No. 03-51-02 (2011)
41
Appendix VII. Number of tourists by country of residence and mode of travel, 2011
Country Total Mode of travel
Air Road Sea Unspecified Total 8 339 354 2 503 230 5 826 678 9 169 277 Overseas 2 176 719 1 917 883 250 258 8 419 159 Europe 1 286 027 1 117 783 163 247 4 981 16 Albania 115 107 8 - - Andorra 32 28 4 - - Austria 21 841 19 241 2 490 109 1 Belarus 664 651 13 - - Belgium 40 478 33 895 6 550 33 - Bosnia-Herzegovina 267 245 21 1 - Bulgaria 2 233 1 927 293 11 2 Byelorussian SSR 1 1 - - Croatia 1 159 1 063 92 4 - Czech Republic 6 169 5 272 895 1 1 Denmark 22 970 20 437 2 507 26 - Estonia 676 611 64 1 - Finland 10 090 8 908 1 178 4 - France 105 420 90 348 14 921 150 1 Germany 235 774 202 171 32 974 626 3 Greece 5 822 5 355 453 14 - Hungary 2 882 2 697 176 9 - Iceland 598 545 51 2 - Ireland 29 098 25 795 3 225 78 - Isle Of Man 13 8 5 - - Isle Of Wight 1 1 - - - Italy 54 628 48 773 5 774 81 - Latvia 608 541 55 12 - Liechtenstein 213 200 12 1 - Lithuania 773 718 52 3 - Luxembourg 1 271 1 108 162 1 - Malta 550 459 87 3 1 Moldova 149 144 4 1 - Monaco 93 91 2 - - Norway 20 556 18 264 2 258 33 1 Poland 9 962 8 864 1 076 21 1
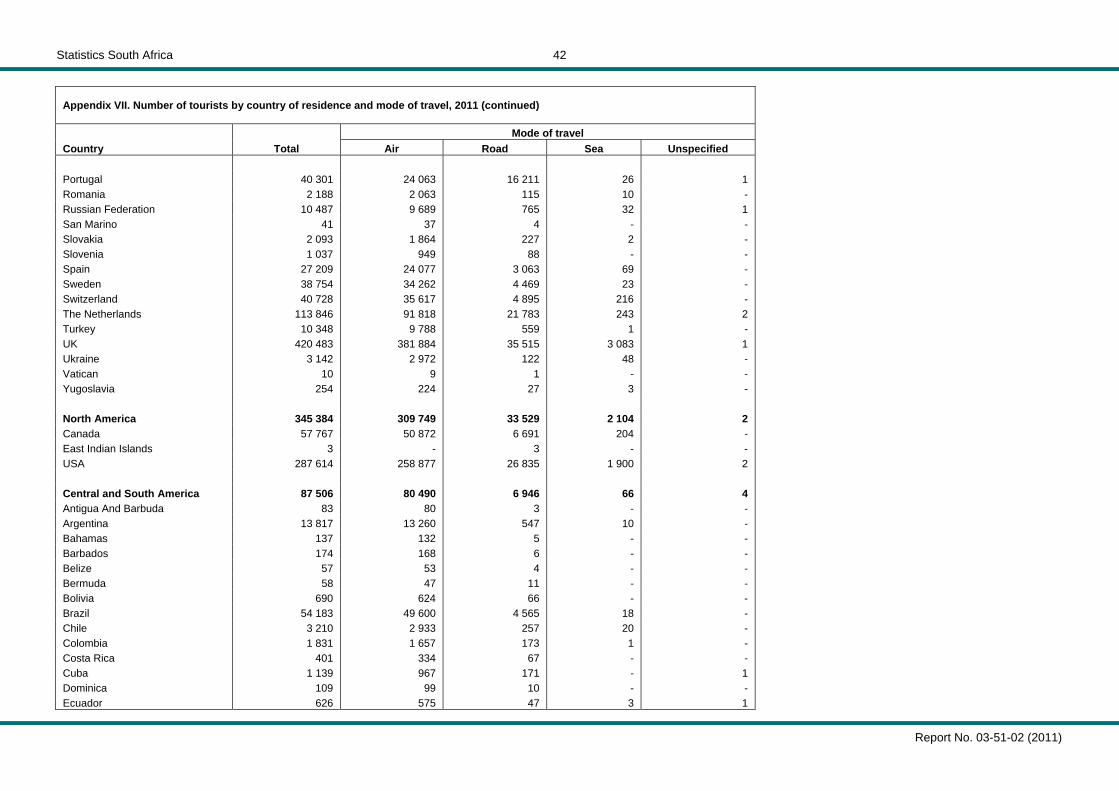
Statistics South Africa
Report No. 03-51-02 (2011)
42
Appendix VII. Number of tourists by country of residence and mode of travel, 2011 (continued)
Country Total Mode of travel
Air Road Sea Unspecified Portugal 40 301 24 063 16 211 26 1 Romania 2 188 2 063 115 10 - Russian Federation 10 487 9 689 765 32 1 San Marino 41 37 4 - - Slovakia 2 093 1 864 227 2 - Slovenia 1 037 949 88 - - Spain 27 209 24 077 3 063 69 - Sweden 38 754 34 262 4 469 23 - Switzerland 40 728 35 617 4 895 216 - The Netherlands 113 846 91 818 21 783 243 2 Turkey 10 348 9 788 559 1 - UK 420 483 381 884 35 515 3 083 1 Ukraine 3 142 2 972 122 48 - Vatican 10 9 1 - - Yugoslavia 254 224 27 3 - North America 345 384 309 749 33 529 2 104 2 Canada 57 767 50 872 6 691 204 - East Indian Islands 3 - 3 - - USA 287 614 258 877 26 835 1 900 2 Central and South America 87 506 80 490 6 946 66 4 Antigua And Barbuda 83 80 3 - - Argentina 13 817 13 260 547 10 - Bahamas 137 132 5 - - Barbados 174 168 6 - - Belize 57 53 4 - - Bermuda 58 47 11 - - Bolivia 690 624 66 - - Brazil 54 183 49 600 4 565 18 - Chile 3 210 2 933 257 20 - Colombia 1 831 1 657 173 1 - Costa Rica 401 334 67 - - Cuba 1 139 967 171 - 1 Dominica 109 99 10 - - Ecuador 626 575 47 3 1
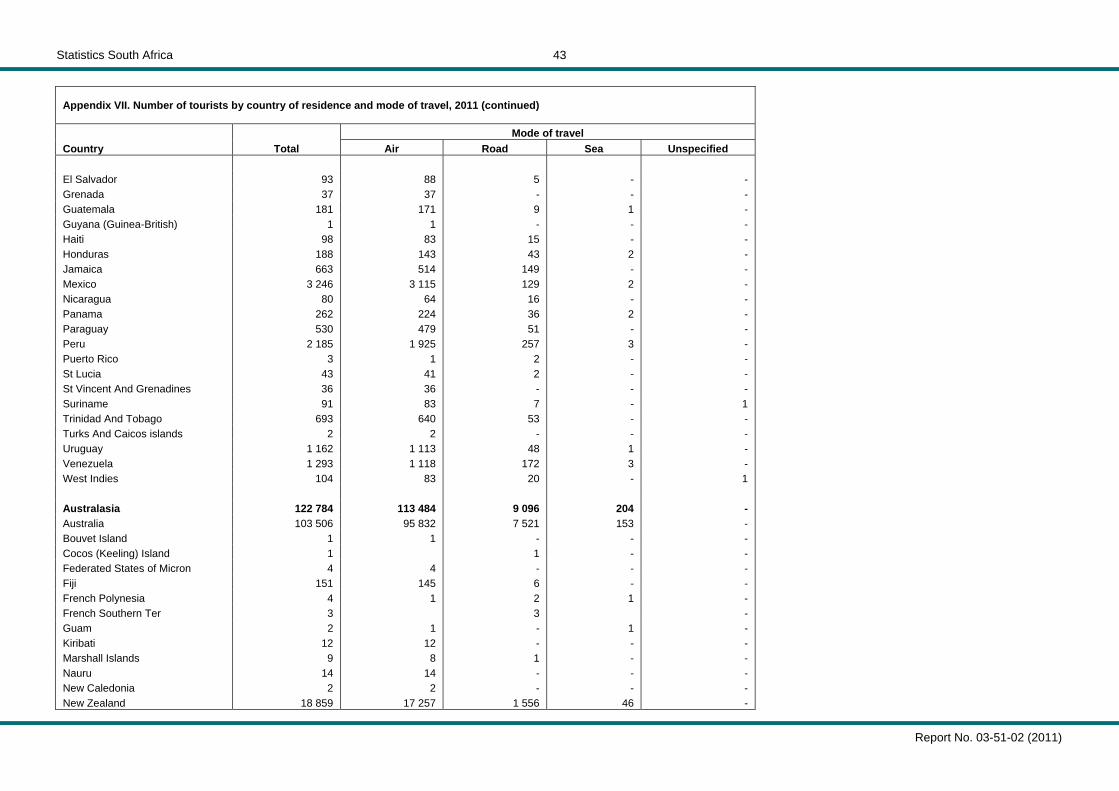
Statistics South Africa
Report No. 03-51-02 (2011)
43
Appendix VII. Number of tourists by country of residence and mode of travel, 2011 (continued)
Country Total Mode of travel
Air Road Sea Unspecified El Salvador 93 88 5 - - Grenada 37 37 - - - Guatemala 181 171 9 1 - Guyana (Guinea-British) 1 1 - - - Haiti 98 83 15 - - Honduras 188 143 43 2 - Jamaica 663 514 149 - - Mexico 3 246 3 115 129 2 - Nicaragua 80 64 16 - - Panama 262 224 36 2 - Paraguay 530 479 51 - - Peru 2 185 1 925 257 3 - Puerto Rico 3 1 2 - - St Lucia 43 41 2 - - St Vincent And Grenadines 36 36 - - - Suriname 91 83 7 - 1 Trinidad And Tobago 693 640 53 - - Turks And Caicos islands 2 2 - - - Uruguay 1 162 1 113 48 1 - Venezuela 1 293 1 118 172 3 - West Indies 104 83 20 - 1 Australasia 122 784 113 484 9 096 204 - Australia 103 506 95 832 7 521 153 - Bouvet Island 1 1 - - - Cocos (Keeling) Island 1 1 - - Federated States of Micron 4 4 - - - Fiji 151 145 6 - - French Polynesia 4 1 2 1 - French Southern Ter 3 3 - Guam 2 1 - 1 - Kiribati 12 12 - - - Marshall Islands 9 8 1 - - Nauru 14 14 - - - New Caledonia 2 2 - - - New Zealand 18 859 17 257 1 556 46 -
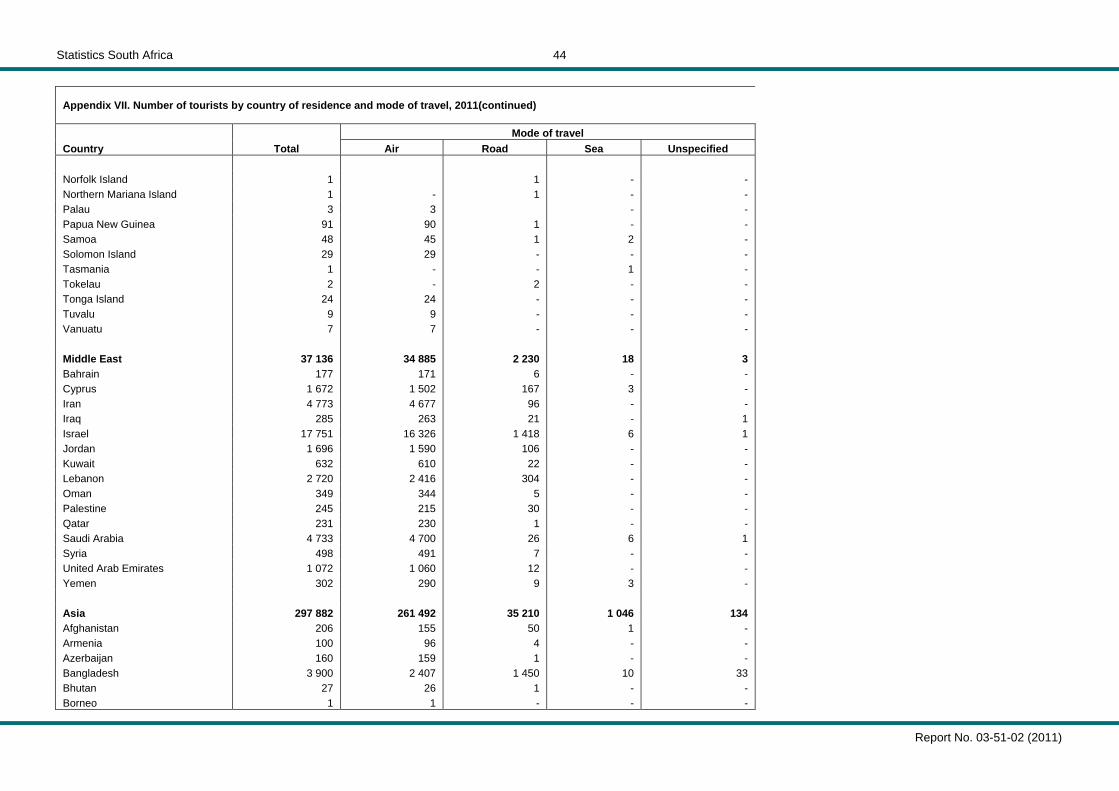
Statistics South Africa
Report No. 03-51-02 (2011)
44
Appendix VII. Number of tourists by country of residence and mode of travel, 2011(continued)
Country Total Mode of travel
Air Road Sea Unspecified Norfolk Island 1 1 - - Northern Mariana Island 1 - 1 - - Palau 3 3 - - Papua New Guinea 91 90 1 - - Samoa 48 45 1 2 - Solomon Island 29 29 - - - Tasmania 1 - - 1 - Tokelau 2 - 2 - - Tonga Island 24 24 - - - Tuvalu 9 9 - - - Vanuatu 7 7 - - - Middle East 37 136 34 885 2 230 18 3 Bahrain 177 171 6 - - Cyprus 1 672 1 502 167 3 - Iran 4 773 4 677 96 - - Iraq 285 263 21 - 1 Israel 17 751 16 326 1 418 6 1 Jordan 1 696 1 590 106 - - Kuwait 632 610 22 - - Lebanon 2 720 2 416 304 - - Oman 349 344 5 - - Palestine 245 215 30 - - Qatar 231 230 1 - - Saudi Arabia 4 733 4 700 26 6 1 Syria 498 491 7 - - United Arab Emirates 1 072 1 060 12 - - Yemen 302 290 9 3 - Asia 297 882 261 492 35 210 1 046 134 Afghanistan 206 155 50 1 - Armenia 100 96 4 - - Azerbaijan 160 159 1 - - Bangladesh 3 900 2 407 1 450 10 33 Bhutan 27 26 1 - - Borneo 1 1 - - -
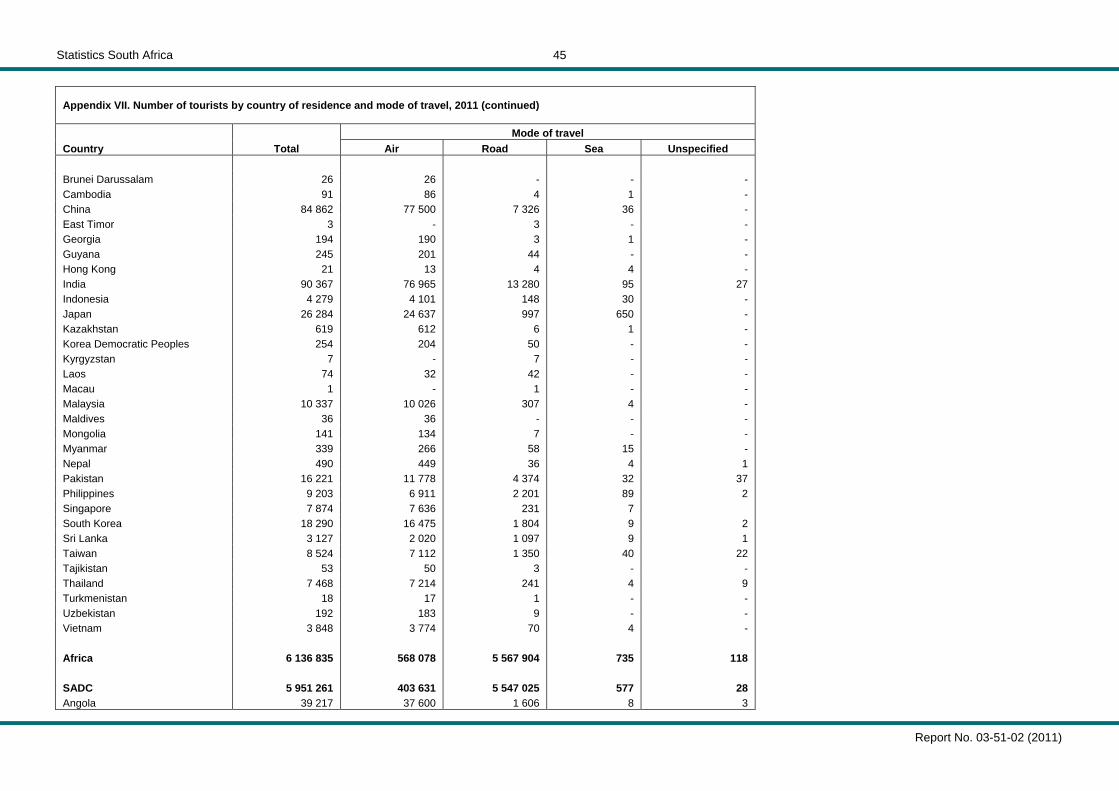
Statistics South Africa
Report No. 03-51-02 (2011)
45
Appendix VII. Number of tourists by country of residence and mode of travel, 2011 (continued)
Country Total Mode of travel
Air Road Sea Unspecified Brunei Darussalam 26 26 - - - Cambodia 91 86 4 1 - China 84 862 77 500 7 326 36 - East Timor 3 - 3 - - Georgia 194 190 3 1 - Guyana 245 201 44 - - Hong Kong 21 13 4 4 - India 90 367 76 965 13 280 95 27 Indonesia 4 279 4 101 148 30 - Japan 26 284 24 637 997 650 - Kazakhstan 619 612 6 1 - Korea Democratic Peoples 254 204 50 - - Kyrgyzstan 7 - 7 - - Laos 74 32 42 - - Macau 1 - 1 - - Malaysia 10 337 10 026 307 4 - Maldives 36 36 - - - Mongolia 141 134 7 - - Myanmar 339 266 58 15 - Nepal 490 449 36 4 1 Pakistan 16 221 11 778 4 374 32 37 Philippines 9 203 6 911 2 201 89 2 Singapore 7 874 7 636 231 7 South Korea 18 290 16 475 1 804 9 2 Sri Lanka 3 127 2 020 1 097 9 1 Taiwan 8 524 7 112 1 350 40 22 Tajikistan 53 50 3 - - Thailand 7 468 7 214 241 4 9 Turkmenistan 18 17 1 - - Uzbekistan 192 183 9 - - Vietnam 3 848 3 774 70 4 - Africa 6 136 835 568 078 5 567 904 735 118 SADC 5 951 261 403 631 5 547 025 577 28 Angola 39 217 37 600 1 606 8 3
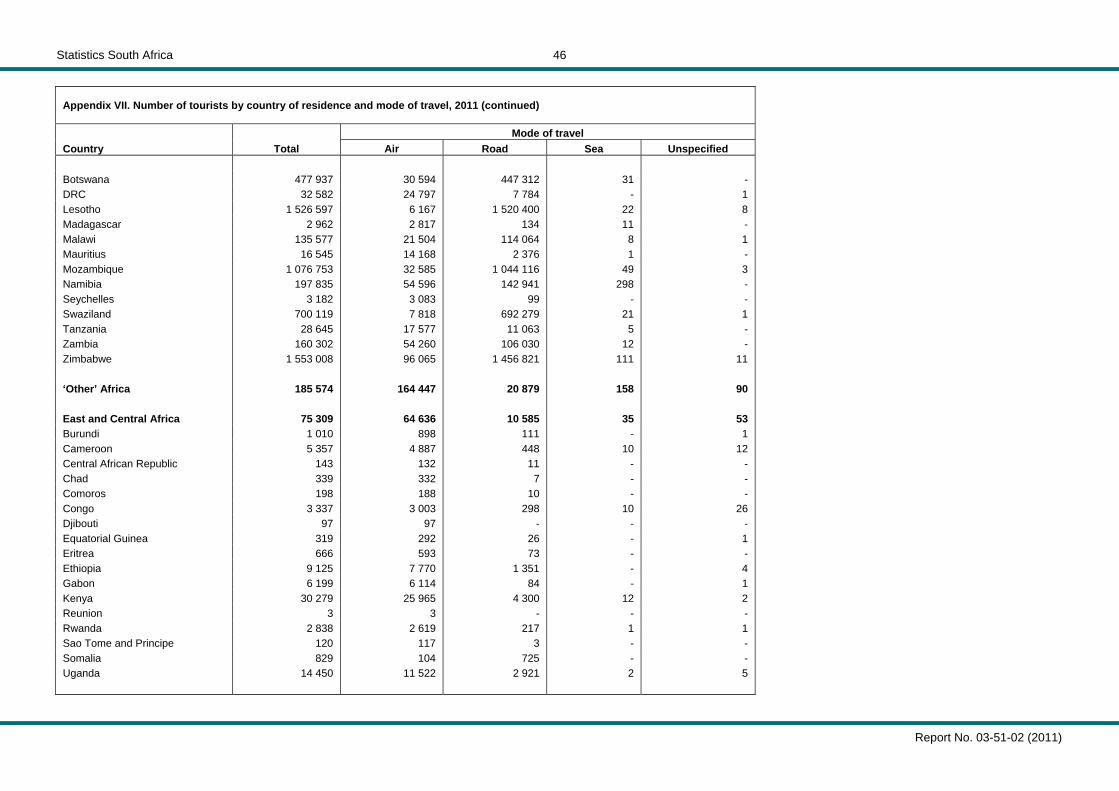
Statistics South Africa
Report No. 03-51-02 (2011)
46
Appendix VII. Number of tourists by country of residence and mode of travel, 2011 (continued)
Country Total Mode of travel
Air Road Sea Unspecified Botswana 477 937 30 594 447 312 31 - DRC 32 582 24 797 7 784 - 1 Lesotho 1 526 597 6 167 1 520 400 22 8 Madagascar 2 962 2 817 134 11 - Malawi 135 577 21 504 114 064 8 1 Mauritius 16 545 14 168 2 376 1 - Mozambique 1 076 753 32 585 1 044 116 49 3 Namibia 197 835 54 596 142 941 298 - Seychelles 3 182 3 083 99 - - Swaziland 700 119 7 818 692 279 21 1 Tanzania 28 645 17 577 11 063 5 - Zambia 160 302 54 260 106 030 12 - Zimbabwe 1 553 008 96 065 1 456 821 111 11 ‘Other’ Africa 185 574 164 447 20 879 158 90 East and Central Africa 75 309 64 636 10 585 35 53 Burundi 1 010 898 111 - 1 Cameroon 5 357 4 887 448 10 12 Central African Republic 143 132 11 - - Chad 339 332 7 - - Comoros 198 188 10 - - Congo 3 337 3 003 298 10 26 Djibouti 97 97 - - - Equatorial Guinea 319 292 26 - 1 Eritrea 666 593 73 - - Ethiopia 9 125 7 770 1 351 - 4 Gabon 6 199 6 114 84 - 1 Kenya 30 279 25 965 4 300 12 2 Reunion 3 3 - - - Rwanda 2 838 2 619 217 1 1 Sao Tome and Principe 120 117 3 - - Somalia 829 104 725 - - Uganda 14 450 11 522 2 921 2 5
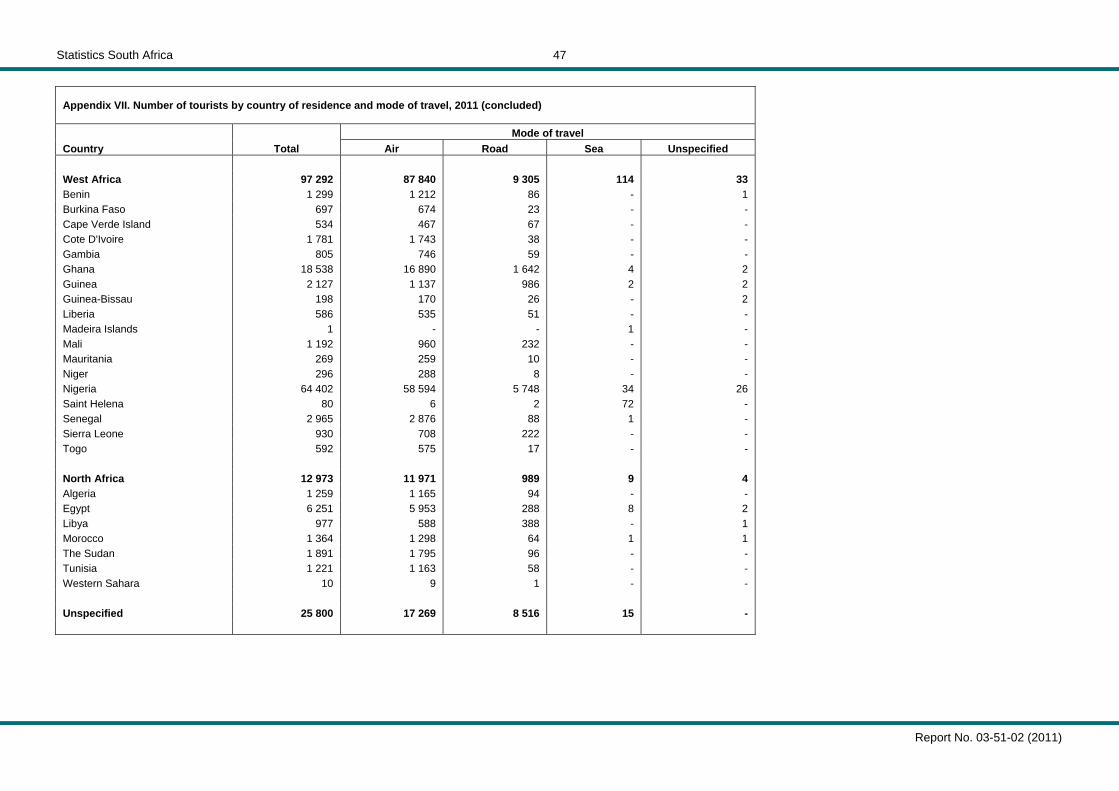
Statistics South Africa
Report No. 03-51-02 (2011)
47
Appendix VII. Number of tourists by country of residence and mode of travel, 2011 (concluded)
Country Total Mode of travel
Air Road Sea Unspecified West Africa 97 292 87 840 9 305 114 33 Benin 1 299 1 212 86 - 1 Burkina Faso 697 674 23 - - Cape Verde Island 534 467 67 - - Cote D'Ivoire 1 781 1 743 38 - - Gambia 805 746 59 - - Ghana 18 538 16 890 1 642 4 2 Guinea 2 127 1 137 986 2 2 Guinea-Bissau 198 170 26 - 2 Liberia 586 535 51 - - Madeira Islands 1 - - 1 - Mali 1 192 960 232 - - Mauritania 269 259 10 - - Niger 296 288 8 - - Nigeria 64 402 58 594 5 748 34 26 Saint Helena 80 6 2 72 - Senegal 2 965 2 876 88 1 - Sierra Leone 930 708 222 - - Togo 592 575 17 - - North Africa 12 973 11 971 989 9 4 Algeria 1 259 1 165 94 - - Egypt 6 251 5 953 288 8 2 Libya 977 588 388 - 1 Morocco 1 364 1 298 64 1 1 The Sudan 1 891 1 795 96 - - Tunisia 1 221 1 163 58 - - Western Sahara 10 9 1 - - Unspecified 25 800 17 269 8 516 15 -
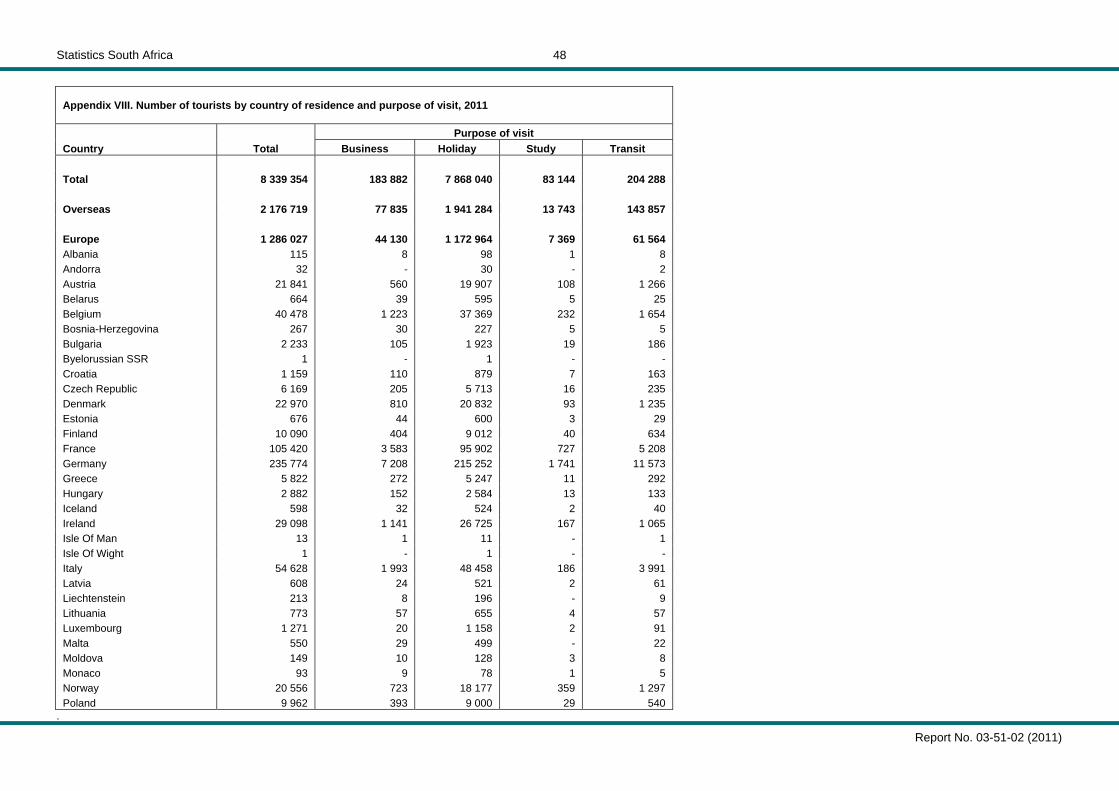
Statistics South Africa
Report No. 03-51-02 (2011)
48
Appendix VIII. Number of tourists by country of residence and purpose of visit, 2011
Country
Total
Purpose of visit Business Holiday Study Transit
Total 8 339 354 183 882 7 868 040 83 144 204 288 Overseas 2 176 719 77 835 1 941 284 13 743 143 857 Europe 1 286 027 44 130 1 172 964 7 369 61 564 Albania 115 8 98 1 8 Andorra 32 - 30 - 2 Austria 21 841 560 19 907 108 1 266 Belarus 664 39 595 5 25 Belgium 40 478 1 223 37 369 232 1 654 Bosnia-Herzegovina 267 30 227 5 5 Bulgaria 2 233 105 1 923 19 186 Byelorussian SSR 1 - 1 - - Croatia 1 159 110 879 7 163 Czech Republic 6 169 205 5 713 16 235 Denmark 22 970 810 20 832 93 1 235 Estonia 676 44 600 3 29 Finland 10 090 404 9 012 40 634 France 105 420 3 583 95 902 727 5 208 Germany 235 774 7 208 215 252 1 741 11 573 Greece 5 822 272 5 247 11 292 Hungary 2 882 152 2 584 13 133 Iceland 598 32 524 2 40 Ireland 29 098 1 141 26 725 167 1 065 Isle Of Man 13 1 11 - 1 Isle Of Wight 1 - 1 - - Italy 54 628 1 993 48 458 186 3 991 Latvia 608 24 521 2 61 Liechtenstein 213 8 196 - 9 Lithuania 773 57 655 4 57 Luxembourg 1 271 20 1 158 2 91 Malta 550 29 499 - 22 Moldova 149 10 128 3 8 Monaco 93 9 78 1 5 Norway 20 556 723 18 177 359 1 297 Poland 9 962 393 9 000 29 540
.
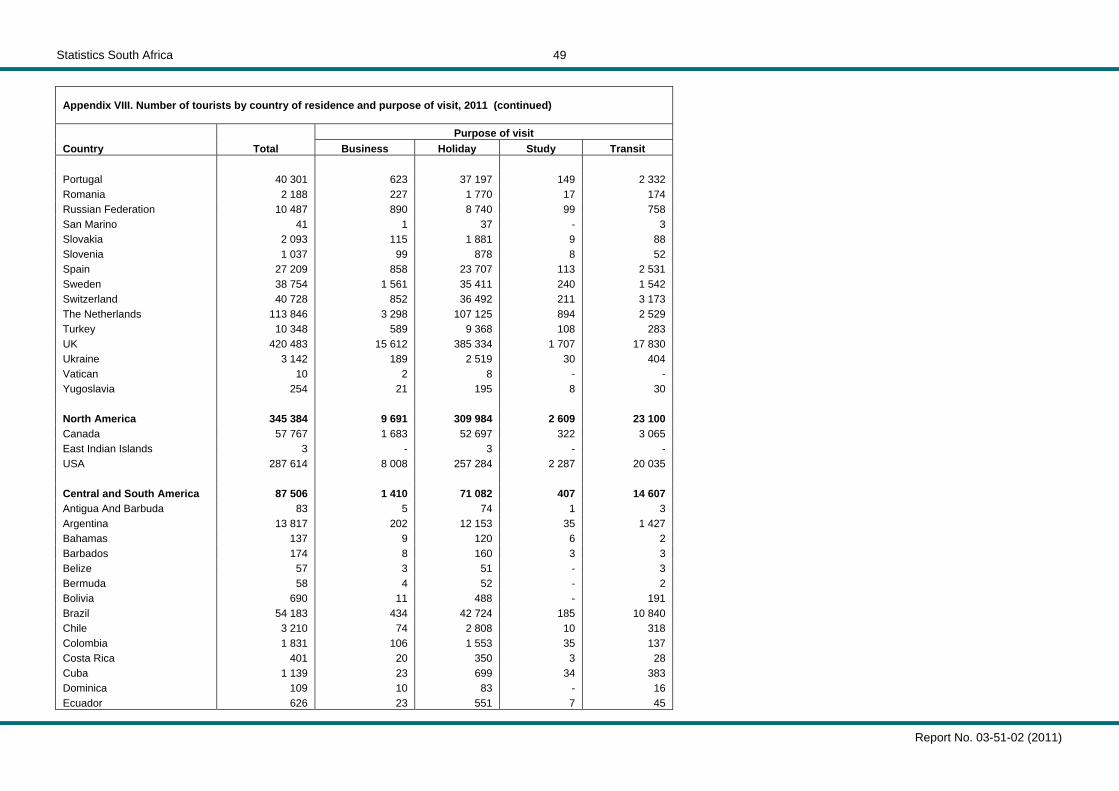
Statistics South Africa
Report No. 03-51-02 (2011)
49
Appendix VIII. Number of tourists by country of residence and purpose of visit, 2011 (continued)
Country
Total
Purpose of visit Business Holiday Study Transit
Portugal 40 301 623 37 197 149 2 332 Romania 2 188 227 1 770 17 174 Russian Federation 10 487 890 8 740 99 758 San Marino 41 1 37 - 3 Slovakia 2 093 115 1 881 9 88 Slovenia 1 037 99 878 8 52 Spain 27 209 858 23 707 113 2 531 Sweden 38 754 1 561 35 411 240 1 542 Switzerland 40 728 852 36 492 211 3 173 The Netherlands 113 846 3 298 107 125 894 2 529 Turkey 10 348 589 9 368 108 283 UK 420 483 15 612 385 334 1 707 17 830 Ukraine 3 142 189 2 519 30 404 Vatican 10 2 8 - - Yugoslavia 254 21 195 8 30 North America 345 384 9 691 309 984 2 609 23 100 Canada 57 767 1 683 52 697 322 3 065 East Indian Islands 3 - 3 - - USA 287 614 8 008 257 284 2 287 20 035 Central and South America 87 506 1 410 71 082 407 14 607 Antigua And Barbuda 83 5 74 1 3 Argentina 13 817 202 12 153 35 1 427 Bahamas 137 9 120 6 2 Barbados 174 8 160 3 3 Belize 57 3 51 - 3 Bermuda 58 4 52 - 2 Bolivia 690 11 488 - 191 Brazil 54 183 434 42 724 185 10 840 Chile 3 210 74 2 808 10 318 Colombia 1 831 106 1 553 35 137 Costa Rica 401 20 350 3 28 Cuba 1 139 23 699 34 383 Dominica 109 10 83 - 16 Ecuador 626 23 551 7 45
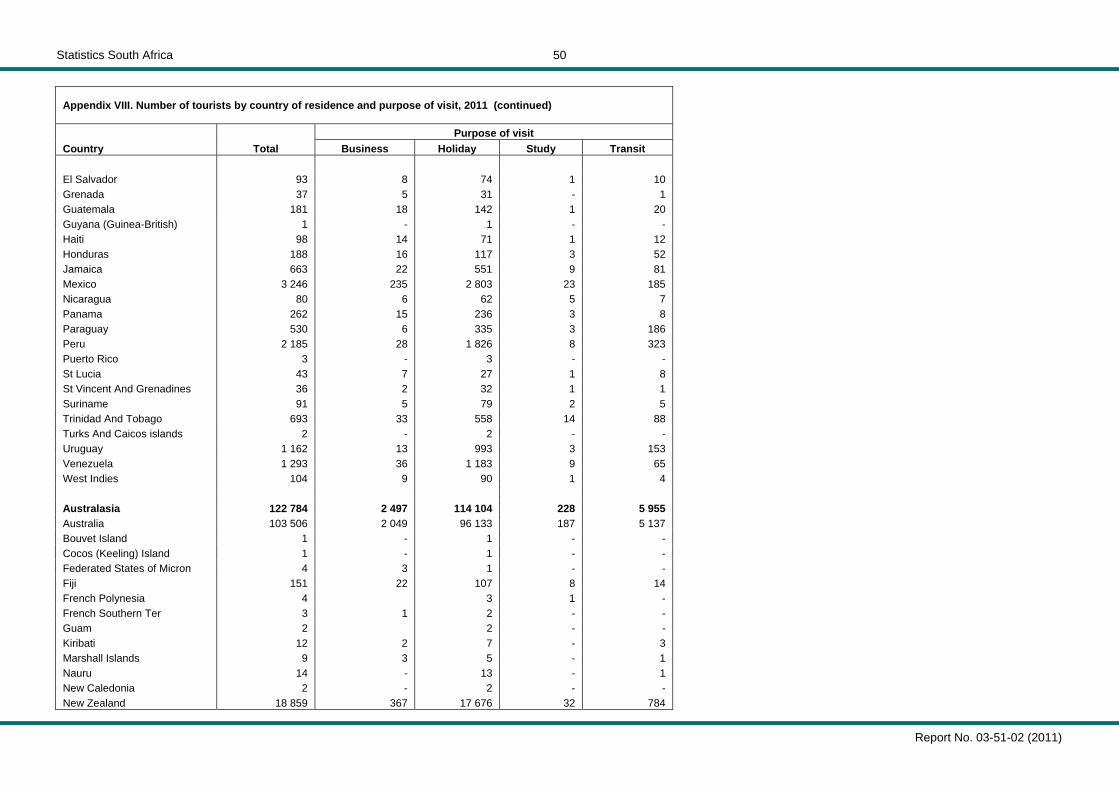
Statistics South Africa
Report No. 03-51-02 (2011)
50
Appendix VIII. Number of tourists by country of residence and purpose of visit, 2011 (continued)
Country
Total
Purpose of visit Business Holiday Study Transit
El Salvador 93 8 74 1 10 Grenada 37 5 31 - 1 Guatemala 181 18 142 1 20 Guyana (Guinea-British) 1 - 1 - - Haiti 98 14 71 1 12 Honduras 188 16 117 3 52 Jamaica 663 22 551 9 81 Mexico 3 246 235 2 803 23 185 Nicaragua 80 6 62 5 7 Panama 262 15 236 3 8 Paraguay 530 6 335 3 186 Peru 2 185 28 1 826 8 323 Puerto Rico 3 - 3 - - St Lucia 43 7 27 1 8 St Vincent And Grenadines 36 2 32 1 1 Suriname 91 5 79 2 5 Trinidad And Tobago 693 33 558 14 88 Turks And Caicos islands 2 - 2 - - Uruguay 1 162 13 993 3 153 Venezuela 1 293 36 1 183 9 65 West Indies 104 9 90 1 4 Australasia 122 784 2 497 114 104 228 5 955 Australia 103 506 2 049 96 133 187 5 137 Bouvet Island 1 - 1 - - Cocos (Keeling) Island 1 - 1 - - Federated States of Micron 4 3 1 - - Fiji 151 22 107 8 14 French Polynesia 4 3 1 - French Southern Ter 3 1 2 - - Guam 2 2 - - Kiribati 12 2 7 - 3 Marshall Islands 9 3 5 - 1 Nauru 14 - 13 - 1 New Caledonia 2 - 2 - - New Zealand 18 859 367 17 676 32 784
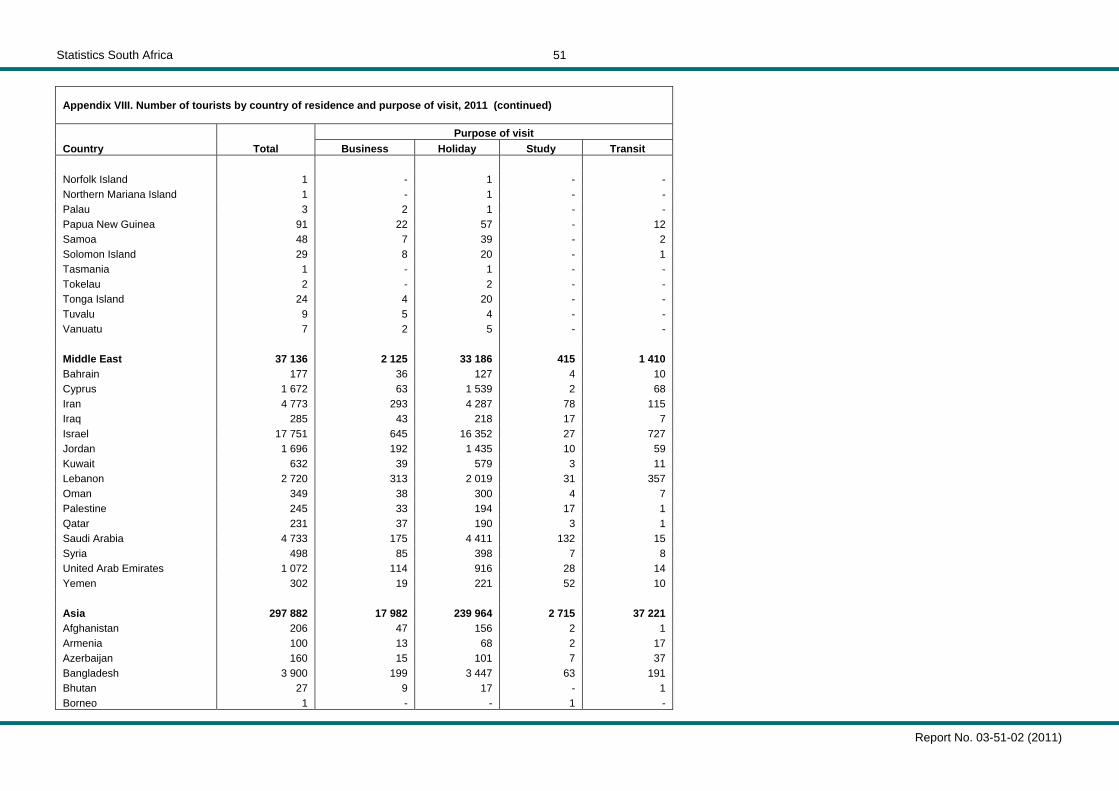
Statistics South Africa
Report No. 03-51-02 (2011)
51
Appendix VIII. Number of tourists by country of residence and purpose of visit, 2011 (continued)
Country
Total
Purpose of visit Business Holiday Study Transit
Norfolk Island 1 - 1 - - Northern Mariana Island 1 - 1 - - Palau 3 2 1 - - Papua New Guinea 91 22 57 - 12 Samoa 48 7 39 - 2 Solomon Island 29 8 20 - 1 Tasmania 1 - 1 - - Tokelau 2 - 2 - - Tonga Island 24 4 20 - - Tuvalu 9 5 4 - - Vanuatu 7 2 5 - - Middle East 37 136 2 125 33 186 415 1 410 Bahrain 177 36 127 4 10 Cyprus 1 672 63 1 539 2 68 Iran 4 773 293 4 287 78 115 Iraq 285 43 218 17 7 Israel 17 751 645 16 352 27 727 Jordan 1 696 192 1 435 10 59 Kuwait 632 39 579 3 11 Lebanon 2 720 313 2 019 31 357 Oman 349 38 300 4 7 Palestine 245 33 194 17 1 Qatar 231 37 190 3 1 Saudi Arabia 4 733 175 4 411 132 15 Syria 498 85 398 7 8 United Arab Emirates 1 072 114 916 28 14 Yemen 302 19 221 52 10 Asia 297 882 17 982 239 964 2 715 37 221 Afghanistan 206 47 156 2 1 Armenia 100 13 68 2 17 Azerbaijan 160 15 101 7 37 Bangladesh 3 900 199 3 447 63 191 Bhutan 27 9 17 - 1 Borneo 1 - - 1 -
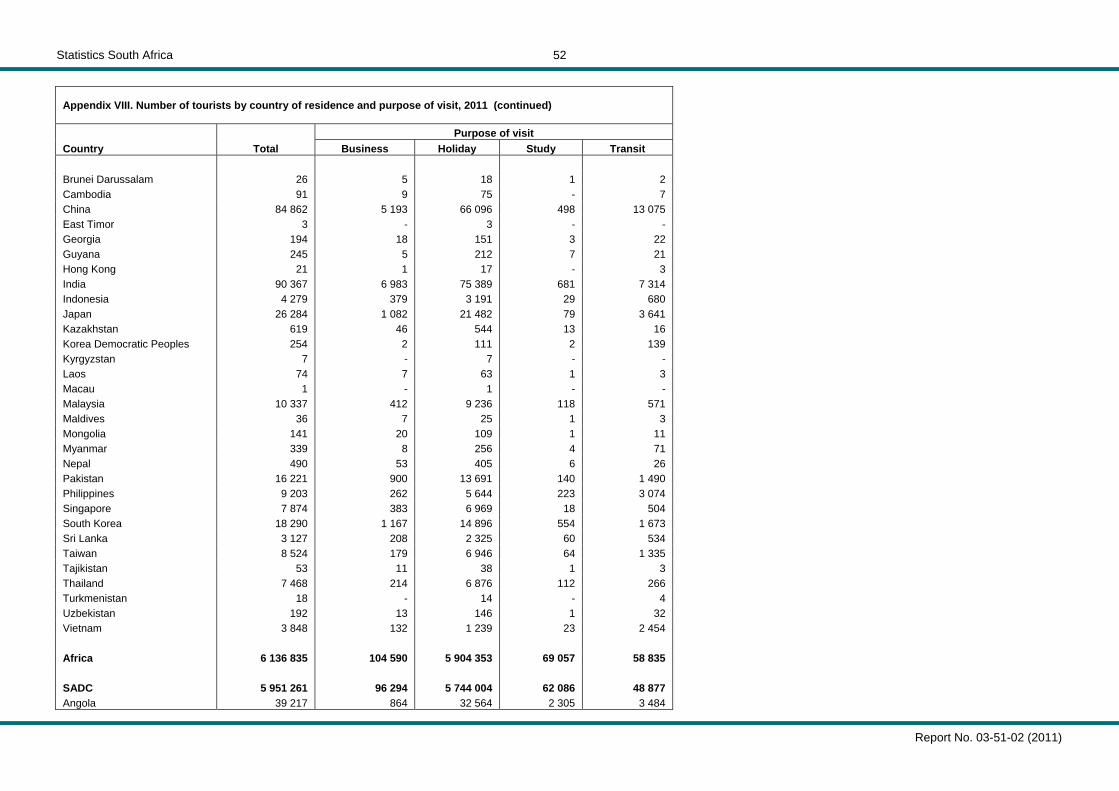
Statistics South Africa
Report No. 03-51-02 (2011)
52
Appendix VIII. Number of tourists by country of residence and purpose of visit, 2011 (continued)
Country
Total
Purpose of visit Business Holiday Study Transit
Brunei Darussalam 26 5 18 1 2 Cambodia 91 9 75 - 7 China 84 862 5 193 66 096 498 13 075 East Timor 3 - 3 - - Georgia 194 18 151 3 22 Guyana 245 5 212 7 21 Hong Kong 21 1 17 - 3 India 90 367 6 983 75 389 681 7 314 Indonesia 4 279 379 3 191 29 680 Japan 26 284 1 082 21 482 79 3 641 Kazakhstan 619 46 544 13 16 Korea Democratic Peoples 254 2 111 2 139 Kyrgyzstan 7 - 7 - - Laos 74 7 63 1 3 Macau 1 - 1 - - Malaysia 10 337 412 9 236 118 571 Maldives 36 7 25 1 3 Mongolia 141 20 109 1 11 Myanmar 339 8 256 4 71 Nepal 490 53 405 6 26 Pakistan 16 221 900 13 691 140 1 490 Philippines 9 203 262 5 644 223 3 074 Singapore 7 874 383 6 969 18 504 South Korea 18 290 1 167 14 896 554 1 673 Sri Lanka 3 127 208 2 325 60 534 Taiwan 8 524 179 6 946 64 1 335 Tajikistan 53 11 38 1 3 Thailand 7 468 214 6 876 112 266 Turkmenistan 18 - 14 - 4 Uzbekistan 192 13 146 1 32 Vietnam 3 848 132 1 239 23 2 454 Africa 6 136 835 104 590 5 904 353 69 057 58 835 SADC 5 951 261 96 294 5 744 004 62 086 48 877 Angola 39 217 864 32 564 2 305 3 484
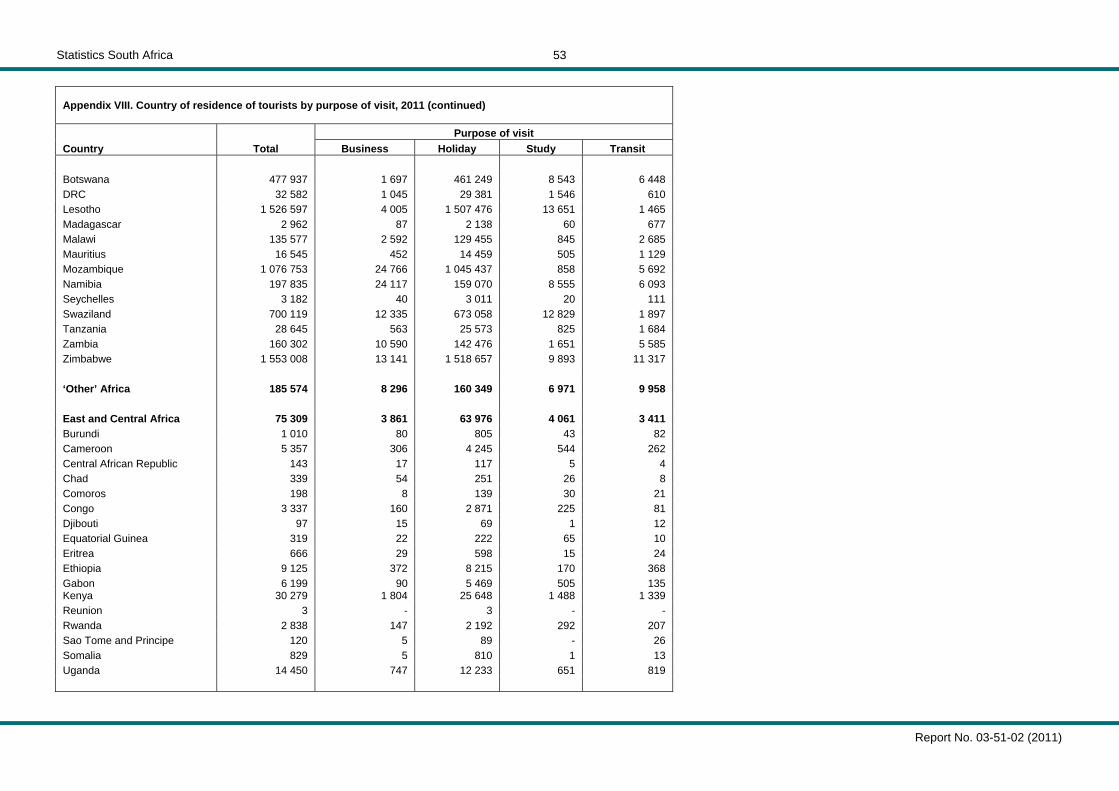
Statistics South Africa
Report No. 03-51-02 (2011)
53
Appendix VIII. Country of residence of tourists by purpose of visit, 2011 (continued)
Country
Total
Purpose of visit Business Holiday Study Transit
Botswana 477 937 1 697 461 249 8 543 6 448 DRC 32 582 1 045 29 381 1 546 610 Lesotho 1 526 597 4 005 1 507 476 13 651 1 465 Madagascar 2 962 87 2 138 60 677 Malawi 135 577 2 592 129 455 845 2 685 Mauritius 16 545 452 14 459 505 1 129 Mozambique 1 076 753 24 766 1 045 437 858 5 692 Namibia 197 835 24 117 159 070 8 555 6 093 Seychelles 3 182 40 3 011 20 111 Swaziland 700 119 12 335 673 058 12 829 1 897 Tanzania 28 645 563 25 573 825 1 684 Zambia 160 302 10 590 142 476 1 651 5 585 Zimbabwe 1 553 008 13 141 1 518 657 9 893 11 317 ‘Other’ Africa 185 574 8 296 160 349 6 971 9 958 East and Central Africa 75 309 3 861 63 976 4 061 3 411 Burundi 1 010 80 805 43 82 Cameroon 5 357 306 4 245 544 262 Central African Republic 143 17 117 5 4 Chad 339 54 251 26 8 Comoros 198 8 139 30 21 Congo 3 337 160 2 871 225 81 Djibouti 97 15 69 1 12 Equatorial Guinea 319 22 222 65 10 Eritrea 666 29 598 15 24 Ethiopia 9 125 372 8 215 170 368 Gabon 6 199 90 5 469 505 135 Kenya 30 279 1 804 25 648 1 488 1 339 Reunion 3 - 3 - - Rwanda 2 838 147 2 192 292 207 Sao Tome and Principe 120 5 89 - 26 Somalia 829 5 810 1 13 Uganda 14 450 747 12 233 651 819
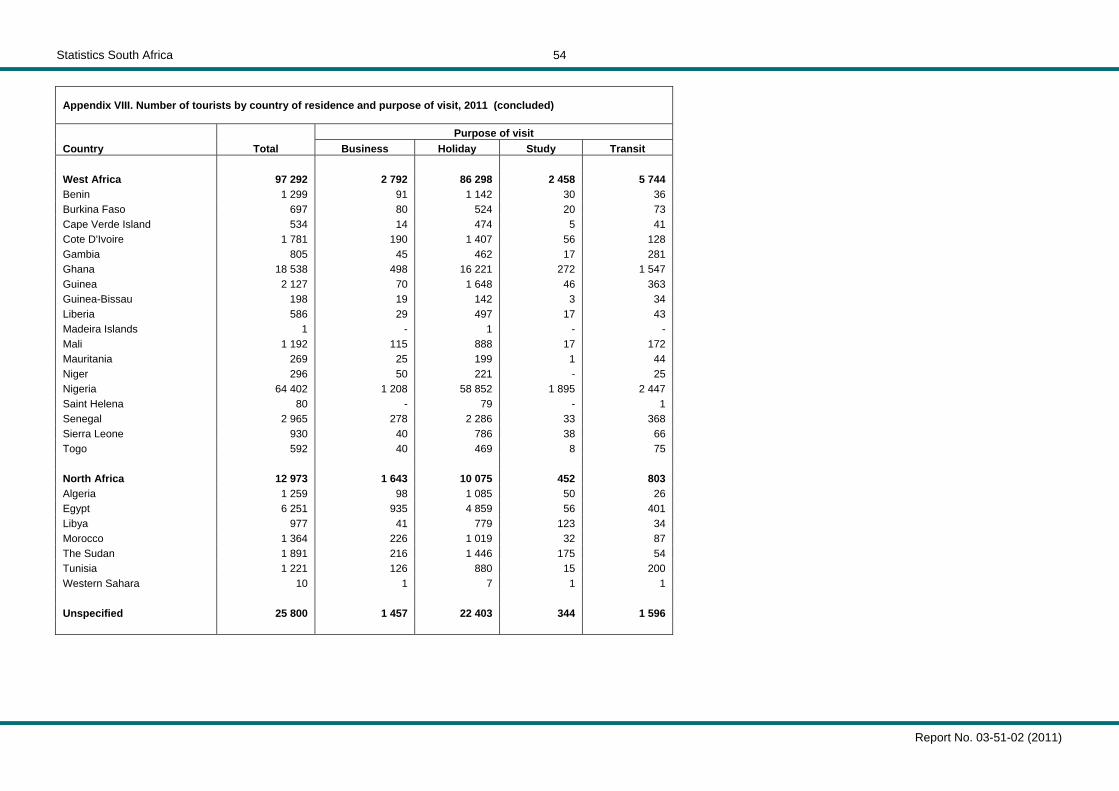
Statistics South Africa
Report No. 03-51-02 (2011)
54
Appendix VIII. Number of tourists by country of residence and purpose of visit, 2011 (concluded)
Country
Total
Purpose of visit Business Holiday Study Transit
West Africa 97 292 2 792 86 298 2 458 5 744 Benin 1 299 91 1 142 30 36 Burkina Faso 697 80 524 20 73 Cape Verde Island 534 14 474 5 41 Cote D'Ivoire 1 781 190 1 407 56 128 Gambia 805 45 462 17 281 Ghana 18 538 498 16 221 272 1 547 Guinea 2 127 70 1 648 46 363 Guinea-Bissau 198 19 142 3 34 Liberia 586 29 497 17 43 Madeira Islands 1 - 1 - - Mali 1 192 115 888 17 172 Mauritania 269 25 199 1 44 Niger 296 50 221 - 25 Nigeria 64 402 1 208 58 852 1 895 2 447 Saint Helena 80 - 79 - 1 Senegal 2 965 278 2 286 33 368 Sierra Leone 930 40 786 38 66 Togo 592 40 469 8 75 North Africa 12 973 1 643 10 075 452 803 Algeria 1 259 98 1 085 50 26 Egypt 6 251 935 4 859 56 401 Libya 977 41 779 123 34 Morocco 1 364 226 1 019 32 87 The Sudan 1 891 216 1 446 175 54 Tunisia 1 221 126 880 15 200 Western Sahara 10 1 7 1 1 Unspecified 25 800 1 457 22 403 344 1 596
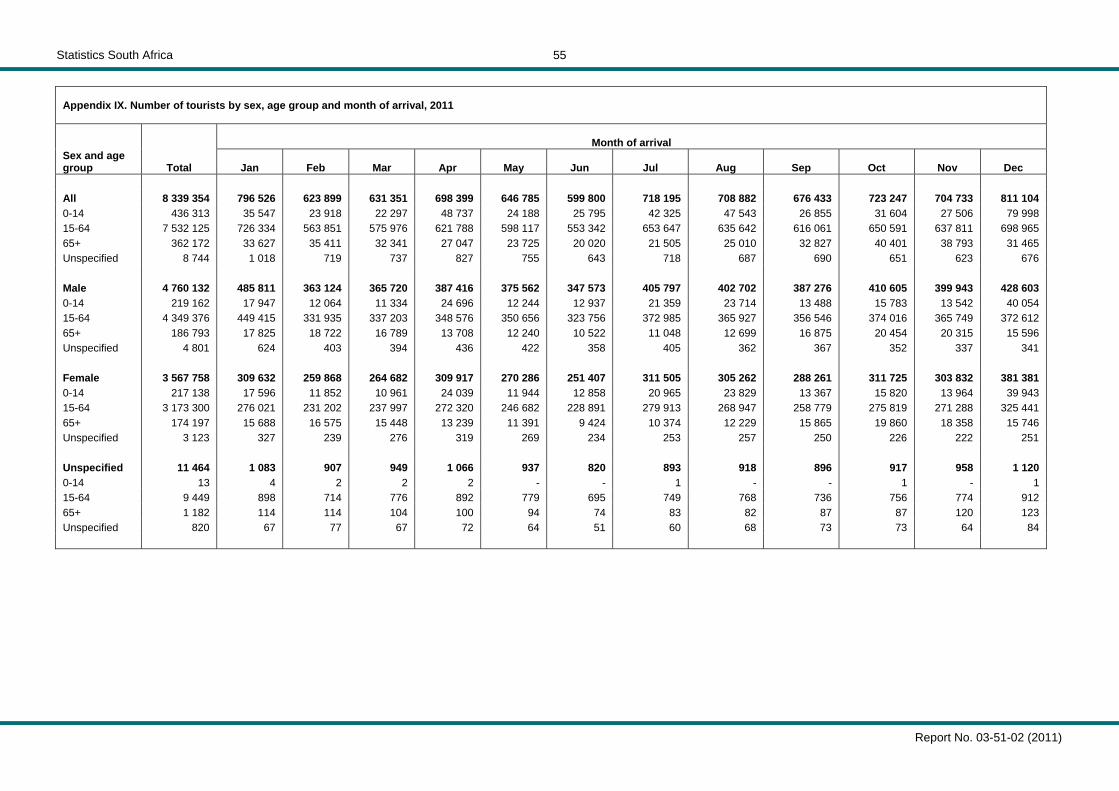
Statistics South Africa
Report No. 03-51-02 (2011)
55
Appendix IX. Number of tourists by sex, age group and month of arrival, 2011
Sex and age group Total
Month of arrival
Jan Feb Mar Apr May Jun Jul Aug Sep Oct Nov Dec
All 8 339 354 796 526 623 899 631 351 698 399 646 785 599 800 718 195 708 882 676 433 723 247 704 733 811 104 0-14 436 313 35 547 23 918 22 297 48 737 24 188 25 795 42 325 47 543 26 855 31 604 27 506 79 998 15-64 7 532 125 726 334 563 851 575 976 621 788 598 117 553 342 653 647 635 642 616 061 650 591 637 811 698 965 65+ 362 172 33 627 35 411 32 341 27 047 23 725 20 020 21 505 25 010 32 827 40 401 38 793 31 465 Unspecified 8 744 1 018 719 737 827 755 643 718 687 690 651 623 676 Male 4 760 132 485 811 363 124 365 720 387 416 375 562 347 573 405 797 402 702 387 276 410 605 399 943 428 603 0-14 219 162 17 947 12 064 11 334 24 696 12 244 12 937 21 359 23 714 13 488 15 783 13 542 40 054 15-64 4 349 376 449 415 331 935 337 203 348 576 350 656 323 756 372 985 365 927 356 546 374 016 365 749 372 612 65+ 186 793 17 825 18 722 16 789 13 708 12 240 10 522 11 048 12 699 16 875 20 454 20 315 15 596 Unspecified 4 801 624 403 394 436 422 358 405 362 367 352 337 341 Female 3 567 758 309 632 259 868 264 682 309 917 270 286 251 407 311 505 305 262 288 261 311 725 303 832 381 381 0-14 217 138 17 596 11 852 10 961 24 039 11 944 12 858 20 965 23 829 13 367 15 820 13 964 39 943 15-64 3 173 300 276 021 231 202 237 997 272 320 246 682 228 891 279 913 268 947 258 779 275 819 271 288 325 441 65+ 174 197 15 688 16 575 15 448 13 239 11 391 9 424 10 374 12 229 15 865 19 860 18 358 15 746 Unspecified 3 123 327 239 276 319 269 234 253 257 250 226 222 251 Unspecified 11 464 1 083 907 949 1 066 937 820 893 918 896 917 958 1 120 0-14 13 4 2 2 2 - - 1 - - 1 - 1 15-64 9 449 898 714 776 892 779 695 749 768 736 756 774 912 65+ 1 182 114 114 104 100 94 74 83 82 87 87 120 123 Unspecified 820 67 77 67 72 64 51 60 68 73 73 64 84
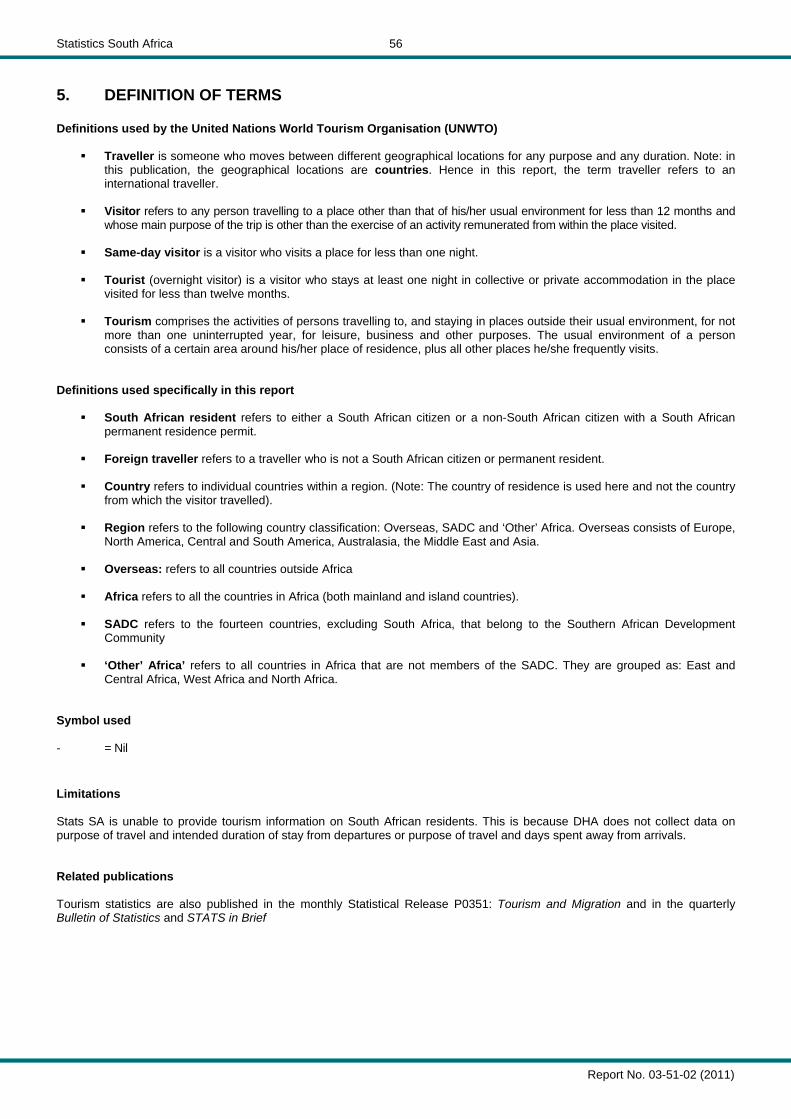
Statistics South Africa
Report No. 03-51-02 (2011)
56
5. DEFINITION OF TERMS Definitions used by the United Nations World Tourism Organisation (UNWTO)
Traveller is someone who moves between different geographical locations for any purpose and any duration. Note: in this publication, the geographical locations are countries. Hence in this report, the term traveller refers to an international traveller.
Visitor refers to any person travelling to a place other than that of his/her usual environment for less than 12 months and
whose main purpose of the trip is other than the exercise of an activity remunerated from within the place visited.
Same-day visitor is a visitor who visits a place for less than one night.
Tourist (overnight visitor) is a visitor who stays at least one night in collective or private accommodation in the place visited for less than twelve months.
Tourism comprises the activities of persons travelling to, and staying in places outside their usual environment, for not
more than one uninterrupted year, for leisure, business and other purposes. The usual environment of a person consists of a certain area around his/her place of residence, plus all other places he/she frequently visits.
Definitions used specifically in this report
South African resident refers to either a South African citizen or a non-South African citizen with a South African permanent residence permit.
Foreign traveller refers to a traveller who is not a South African citizen or permanent resident.
Country refers to individual countries within a region. (Note: The country of residence is used here and not the country
from which the visitor travelled).
Region refers to the following country classification: Overseas, SADC and ‘Other’ Africa. Overseas consists of Europe, North America, Central and South America, Australasia, the Middle East and Asia.
Overseas: refers to all countries outside Africa
Africa refers to all the countries in Africa (both mainland and island countries).
SADC refers to the fourteen countries, excluding South Africa, that belong to the Southern African Development
Community
‘Other’ Africa’ refers to all countries in Africa that are not members of the SADC. They are grouped as: East and Central Africa, West Africa and North Africa.
Symbol used - = Nil Limitations Stats SA is unable to provide tourism information on South African residents. This is because DHA does not collect data on purpose of travel and intended duration of stay from departures or purpose of travel and days spent away from arrivals. Related publications Tourism statistics are also published in the monthly Statistical Release P0351: Tourism and Migration and in the quarterly Bulletin of Statistics and STATS in Brief
Statistics South Africa
Report No. 03-51-02 (2011)
57
6. OTHER STATS SA REPORTS The following reports on tourism and migration have been published: No. 205 - South African residents travelling abroad 1952-1957 No. 286 - Statistics of immigrants and emigrants 1924-1964 No. 297 - Statistics of migration 1963 and earlier years No. 07-20-01 - External migration 1964 No. 07-20-02 - External migration 1965 No. 19-01-01 - Migration Statistics: Immigrants and Emigrants 1966 to 1969 No. 19-02-01 - Migration Statistics: Tourists 1966 to 1969 No. 19-01-02 - Migration Statistics: Tourists Immigrants and Emigrants 1970 and 1971 No. 19-01-03 - Tourism and migration 1972-1975 No. 19-01-04 - Tourism and migration 1976 No. 19-01-05 - Tourism and migration 1977 No. 19-01-06 - Tourism and migration 1978 No. 19-01-07 - Tourism and migration 1979 No. 19-01-08 - Tourism and migration 1980 No. 19-01-09 - Tourism and migration 1981 No. 19-01-10 - Tourism and migration 1982 No. 19-01-11 - Tourism and migration 1983 No. 19-01-12 - Tourism and migration 1984 No. 19-01-13 - Tourism and migration 1985 No. 19-01-14 - Tourism and migration 1986 No. 03-51-02 (1987) - Tourism and migration No. 03-51-02 (1988) - Tourism and migration No. 03-51-02 (1989) - Tourism and migration No. 03-51-02 (1990) - Tourism and migration No. 03-51-02 (1991) - Tourism and migration No. 03-51-02 (1992) - Tourism and migration No. 03-51-02 (1993) - Tourism and migration No. 03-51-02 (1994) - Tourism and migration No. 03-51-02 (1995) - Tourism and migration No. 03-51-02 (1996) - Tourism and migration No. 03-51-02 (1997) - Tourism No. 03-51-02 (1998) - Tourism No. 03-51-02 (1999) - Tourism No. 03-51-02 (2000) - Tourism No. 03-51-02 (2001) - Tourism No. 03-51-02 (2002) -Tourism No. 03-51-02 (2003) -Tourism No. 03-51-02 (2004, 2005 and 2006) –Tourism No. 03-51-02 (2007) -Tourism No. 03-51-02 (2008) -Tourism No. 03-51-02 (2009) - Tourism No. 03-51-02 (2010) -Tourism


![Provincial Profile 2004 - Statistics South AfricaProvincial Profile 2004: Limpopo / Statistics South Africa. Pretoria: Statistics South Africa, 2006 110p. [Report No. 00-91-09(2004)]](https://img.pdfslide.net/doc/110x75/60f89f16f49d1242b4591960/provincial-profile-2004-statistics-south-provincial-profile-2004-limpopo-statistics.jpg)