Embed Size (px)
Citation preview
1 MED1269477
Tourism Data Domain Plan
Ministry of Economic Development
November 2011
2 MED1269477
Table of contents
Foreword ....................................................................................................................................... 3
Introduction ................................................................................................................................... 4
The purpose of the plan .............................................................................................................. 4
Defining tourism .......................................................................................................................... 4
Tourism industry topics – the perennial issues ......................................................................... 5
Topic 1: The value of tourism to New Zealand ............................................................................ 5
Topic 2: The growth, innovation, productivity and efficiency of tourism businesses ..................... 7
Topic 3: The value of government interventions .......................................................................... 8
Topic 4: Global competitiveness .................................................................................................. 9
Topic 5: The sustainability of New Zealand tourism ................................................................... 10
Data sources to inform topics .................................................................................................... 11
Relative importance of topics .................................................................................................... 14
Gap analysis of topics ................................................................................................................ 15
Topic 1 – The value of tourism to New Zealand ........................................................................ 16
Topic 2 – The growth, innovation, productivity and efficiency of tourism businesses ................. 17
Topic 3 – The value of government interventions ...................................................................... 18
Topic 4 – Global competitiveness .............................................................................................. 19
Topic 5 – The sustainability of New Zealand tourism ................................................................. 20
Secondary recommendations .................................................................................................... 20
Prioritising recommendations ................................................................................................... 22
Next steps.................................................................................................................................... 25
Appendix 1: List of acronyms .................................................................................................... 26
Appendix 2: Tourism data sources ............................................................................................ 27
Statistics New Zealand information sources .............................................................................. 33
Tourism Research and Evaluation Group, Ministry of Economic Development ......................... 36
Other tourism sector specific collections ................................................................................... 43
Appendix 3: Table of recommendations and potential initiatives ........................................... 47
Appendix 4: Initiatives sorted by priority score ........................................................................ 63
3 MED1269477
Foreword Tourism is one of the country’s leading export industries. But it still has enormous potential for growth. By increasing its productivity and efficiency and by adding value to existing products and services, tourism will contribute even more value to the New Zealand economy. The availability, to government and to the industry, of better information will play a key part in advancing the growth of the sector. The Tourism Data Domain Plan provides a road-map that will help ensure that information is provided in a relevant, timely and economical way. The Plan was prepared in 2011 by the Tourism Data Review Project Team at the Ministry of Economic Development to guide the compilation, dissemination and use of tourism statistics. It was developed in consultation with stakeholders, including tourism businesses, government agencies and tourism industry bodies. Based on the information and priorities set out in the Tourism Data Domain Plan, the Ministry of Economic Development is preparing an action plan to implement the recommended initiatives. This will happen in a staged way, as time and funds become available. We have also undertaken to continue to engage with stakeholders throughout this process. I am confident that in the coming months and years, as this programme of change unfolds, we will gain significant enhancements in the quality and usefulness of New Zealand’s tourism data and that this will, in turn, help with enhancing tourism’s contribution to our country’s economic growth.
Liz MacPherson Deputy Secretary Tourism, Events and Consumer Affairs Ministry of Economic Development 9 November 2011
4 MED1269477
Tourism Data Domain Plan
Introduction Tourism is crucial to the New Zealand economy. It brings significant revenue into the country and it is a large employer. It is therefore important that any government interventions support the industry to grow and prosper. To this end, any decisions about policy that affect the industry must be based on good evidence and sufficient data must be collected to monitor the impacts.
The purpose of the plan The purpose of the Tourism Data Domain Plan is to achieve clarity and agreement from stakeholders about the main priorities for tourism statistics, and provide the strategy for addressing these priorities over the next five to eight years. The domain plan gives: • a long-term picture of what is required to improve official statistics • a coordinated plan for addressing data issues • a cross-agency approach to long-term priorities. The public availability of the tourism dataset is seen by the industry as part of New Zealand’s ability to compete as a destination. Therefore, improving the data and its accessibility will help New Zealand’s tourism industry to grow.
This plan will inform changes to the collection, analysis and dissemination of data on tourism. It will ensure that the data being collected is relevant, useful and meets future needs.
Defining tourism The United Nations World Tourism Organisation defines tourism in the following way:
Tourism is a social, cultural and economic phenomenon related to the movement of people to places outside their usual place of residence. The activities carried out by a visitor may or may not involve a market transaction, and may be different from, or similar to, those normally carried out in his/her regular routine of life. A visitor is a traveller taking a trip to a main destination outside his/her usual environment, for less than a year, for any main purpose (business, leisure or other personal purpose) other than to be employed by a resident entity in the country or place visited. Tourism refers to the activity of visitors. As a demand-side phenomenon, the economic contribution of tourism is approached as the activities of visitors and their impact on the acquisition of goods and services. It is also viewed from the supply side – this is the set of productive activities that cater mainly to visitors for which an important share of their main output is consumed by visitors. There are three basic forms of tourism: a) Domestic tourism, which comprises the activities of a resident visitor within the country
of reference, either a part of a domestic tourism trip or part of an outbound tourism trip. b) Inbound tourism, which comprises the activities of a non-resident visitor within the
country of reference on an inbound tourism trip.
5 MED1269477
c) Outbound tourism, which comprises the activities of a resident visitor outside the country of reference, either as part of an outbound tourism trip or as part of a domestic tourism trip.1
For the purposes of this document, we will only consider domestic tourism and inbound tourism (“international visitors”). Outbound tourism is out of the scope of this document.
Tourism industry topics – the perennial issues The Tourism Data Domain Plan looks at the information required by organisations and people who use tourism data. The specific needs addressed in this plan are related to policy and to strategic information that enable decisions. This kind of information allows the industry to grow and helps monitor the industry’s progress in meeting its goals. Each topic area discussed in this plan identifies areas of ongoing interest to the tourism industry. The questions asked under each topic typify the information needs required by the industry. To answer any of these questions, the data will almost always need to be a mix of data from normal collection processes and data tailored for that specific study. In this plan, the ratio of this split in data is dependent on the question being addressed. The topics discussed in this plan are: 1. The value of tourism 2. The growth, innovation, productivity and efficiency of tourism businesses 3. The value of government interventions 4. Global competitiveness 5. The sustainability of New Zealand tourism. Within each topic, the plan looks at ways to identify and measure Māori tourism – which the government has recognised as having the potential to increase the value of New Zealand’s tourism as a whole – as well as how to improve economic outcomes for Māori. Māori tourism refers to tourism products, services and experiences reflecting aspects of Māori culture and values. It also refers to tourism businesses owned by Māori. Depending on the context, either or both may need to be measured.
Topic 1: The value of tourism to New Zealand
In order to grow the industry, it is vital to first understand the value of tourism to New Zealand. This topic area explores tourism’s economic, social, cultural and environmental value, and looks at how even more value can be derived from its growth. The specific role of Māori cultural tourism is also taken into account.
Understanding the value of visitors and how they contribute to the New Zealand economy helps the government and industry better understand New Zealand’s key markets. It also assists with marketing decisions, product development, policy decision-making and interventions designed to grow the value of New Zealand tourism in a sustainable way. The direct value of tourism to New Zealand can be estimated from the number and type of visitors, the number of nights they stay, the amount of money they spend, as well as where and what they
1 International Recommendations for Tourism Statistics 2008, United Nations World Tourism Organisation.

6 MED1269477
spend it on. This data helps calculate the impact of tourism on the New Zealand economy at the macro level. Each type of visitor accesses different ranges of products, services and experiences. Therefore, the value of each visitor can be very different. By understanding the kinds of visitors that visit New Zealand and how they spend their money, it is easier to find effective ways of improving revenue from tourism. We also need to understand where there is the potential to increase benefits – for example, by investing in particular areas of tourism, such as Māori cultural tourism or eco-tourism. There are a number of indirect or spill-over benefits that need to be considered when estimating the value of tourism to New Zealand. These include regional employment, sharing the cost of infrastructure (roads, rail, air transport and recreational facilities), support of conservation and heritage sites, building trade and relations through cultural exchange, and influencing skilled migrants. It is increasingly important to understand the value of tourism from an employment perspective. The delivery of tourism has a high labour content and is an important element in regional development and employment. This is of particular significance for Māori and other communities with high unemployment. As the population ages, the available employees and their characteristics will change and this will impact on service delivery. There is a need to consider the skills required to increase productivity and improve customer service for high-value visitors. Another aspect of value that needs to be considered is how much of the visitor spend is retained in New Zealand and whether this alters the perspective on how particular segments are developed. During the development of this plan, a number of questions arose about the value of tourism. These questions will be considered as part of the overall change programme for the way that the Ministry collects and uses data on tourism: • How much does tourism as a whole contribute to the New Zealand economy? • What is the tourism sector’s contribution to New Zealand compared with other sectors? • What is the value of different visitor types and markets to New Zealand? • What do visitors do in New Zealand, what are the high-value activities, and who are the high-
value visitors? • What is the value of tourism sub-sectors? • How much does Māori tourism contribute to the wider New Zealand economy and to Māori
communities? • What is the value of cultural/ethical tourism, such as Māori tourism or eco-tourism? • How does Māori cultural tourism attract visitors and does it add value to the visitor’s
experience? • What is the value of educational tourism? How does it add value to the visitor proposition? • In regard to understanding the interactions between other sectors and sub-sectors:
– What is the value and supply chain? – Where is money spent? – What are the opportunities to increase spending/yield?
• How much of the value from New Zealand tourism is either repatriated or captured offshore? How does this vary between different types of visitors and experiences?
• Where can the most value and growth be extracted from? For example, changing visitor type, market, seasonality, events, experiences, services, or improving the quality and range of tourism offerings, including a greater emphasis on Māori cultural elements.
• Other than through direct visitor expenditure, how does tourism support the economy? Does this vary between visitor types and the types of activities undertaken?
• How does tourism benefit or affect other areas of government interest, such as trade relations or immigration?
7 MED1269477
• Can the indirect benefits of tourism to communities be quantified and maximised? • How do tourism dollars flow around the New Zealand economy? • What is the value of tourism to New Zealand regions? • How does tourism impact on regional development and regional employment? • What are the tourism infrastructure needs? What are the Māori tourism infrastructure needs? • What is the value of the New Zealand Pure brand to exporting, high-tech businesses and the
primary sector? • Do tourism relationships encourage trading relationships? What is the impact of trade
agreements on tourism? • How much does tourism impact on the New Zealand labour market? • Are the skills that are developed in the tourism industry transferable to other industries? • How does the level of employment in the tourism sector impact on the levels of employment in
other sectors? For example, does the tourism sector affect the availability of workers or cause labour to be transferred from other sectors during peaks?
• Does tourism attract skilled migrants? • What is the total value of tourism in terms of its contribution to significant government-owned
infrastructure (e.g. conservation estate, transport)?
Topic 2: The growth, innovation, productivity and efficiency of tourism businesses In order to have an effective and efficient tourism industry, firms must be high performers and employ world-class practices. This means that they must be constantly looking to grow, improve their productivity and innovate to remain competitive. The productivity and profitability of any sector depends on the capability of firms in that sector. By harnessing and improving productivity and profitability, there is potential to lift the standard of living across the whole of New Zealand. In the tourism sector, this can be better understood by looking at the productivity of key sub-sectors (such as accommodation, transport, activities and attractions, cafes and restaurants), and the efficiency of infrastructure (such as training and education, information and communication technology, local services, media, road and rail). Tourism is not a traditional sector – attention must be given to both the horizontal and vertical linkages within the economy. It includes products and services from a range of sectors. To understand its productivity and efficiency requires an understanding of a large number of sectors across New Zealand. It is expected that the role and development of Māori tourism businesses will become increasingly important to the tourism sector. Tourism is one of the potential revenue streams that Māori collectives – who tend to have significant land assets – and other Māori enterprises may consider. The concept of Kaupapa Māori – which can be broadly defined as the aspirations and values of Māori – is an integral part of many Māori enterprises, including Māori tourism businesses. The following questions will need to be answered to gather better data on Māori tourism and its role in the industry. By better understanding the growth, innovation, productivity and efficiency of tourism businesses, we can look at ways to support tourism firms and build their capability so that they can improve their performance and access funding for these activities more easily.

8 MED1269477
The following questions about growth, innovation, productivity and efficiency arose during the development of this plan: • How can higher yields be obtained in the tourism sector? • Are there specific issues and/or opportunities for Māori tourism businesses? • How can tourism businesses be more efficient? • What market segments should we target to achieve growth and value? • How important is innovation in the tourism industry? • Can you increase innovation in the tourism industry? • How many people are employed in tourism? What skills do they have? Where are they
located? • How can we lift tourism productivity? • What are the barriers to improving productivity? • What are the salaries, wages and profitability in the various tourism sectors? • Are there any identifying characteristics of Māori tourism businesses? • What prevents businesses expanding and/or going offshore? • Does exposing a New Zealand firm to international competitors drive adoption of new/best
practices? • What is the rate of investment in the tourism industry in terms of capital, labour, and research
and development? • What is the profitability and return on investment in tourism compared to other sectors? • Are tourism institutional arrangements efficient? • Are firms keeping up with global trends? • How do tourism firms compare nationally and internationally on key performance indicators? • Are firms part of, or linked to, global supply-and-value chains? • Are firms accessing support from non-tourism specific sources (e.g. New Zealand Trade and
Enterprise for business development; Ministry of Science and Innovation for research and development funding and support; and Department of Labour for employment-related issues)?
Topic 3: The value of government interventions It is important to know if the overall level and mix of government spending is optimal and whether there are other mechanisms that could be used to achieve the same or better results. Central government spends over $100 million per year on promoting tourism. This is split between direct spending on destination marketing, border control, events, research and Māori tourism; and indirect spending on conservation, transport, and culture and heritage (including museums and galleries). Local government invests around $902 million a year in i-SITEs, $353 million on regional tourism organisations, and additional funds on regional events and infrastructure. The impact of this investment needs to be able to be measured. For the government to be able to prioritise where to allocate future funding, it has to first understand the return on its current investments (or the negative of not investing). This includes understanding what type of tourists that the investments attracted, and how government interventions impact on the growth, profitability and development of the sector as a whole. The complexity of determining the value of any government intervention in not so much in measuring the direct value (as this is often estimated as the amount of revenue generated), but in determining the indirect value of the investments. The rationale for investment in Māori tourism, for example, includes its potential to increase the value of tourism to the New Zealand economy as
2 Berl – Local Government Economic Indicators Framework, Dec 2010.
3 NZ RTO Benchmark Survey for year ended June 2010, Destination Planning Ltd, Dec 2010.
9 MED1269477
well as improving economic outcomes for Māori. Some of this value comes from cultural exchange with visitors, which may in the medium to long term help to build stronger relationships across trade, skilled migration and other areas. As part of finding out more about the value of government interventions, the following questions must be answered: • What is the return on investment for the government on overseas destination marketing? What
is an acceptable return on any such investment? • How do we know whether the tourism sector is making progress? • Is government intervention in the tourism sector helping or hindering marketing outcomes? • Where does the government need to invest now in order to be ready for how the market will be
in 3-5 years? 10-20 years? For example: – Which, if any, tourism subsectors (including Māori tourism) should the government invest
in? – Is the current level of investment in tourism infrastructure adequate?
• What is the impact of domestic tourism on the return on investment? • Are government services for businesses being accessed by, or made available to, the full
spectrum of tourism businesses? • Does government intervention shelter New Zealand businesses from international competition
and therefore limit competitiveness? • Can the New Zealand Government’s relationship with Australia and the Pacific Islands be
leveraged to increase tourism? • Can the sharing of cultures be leveraged to increase tourism? • Does tourism drive investment? Or does the value of tourism come from capitalising on
assets? • How can the indirect benefits be determined and how can they become part of the calculation
of the return on investment?
Topic 4: Global competitiveness To attract visitors, New Zealand needs to gain a competitive edge over other countries. But what will make it more competitive and how can we influence a visitor’s decision to come to New Zealand? First, we need to understand what we’re selling. Then we can look at how to improve those products. Māori culture is potentially a unique selling proposition for New Zealand. The role of Māori culture needs to be understood as part of the decision-making process – for example, is it a key tipping point for some visitors? Further, does it create expectations or increase the level of satisfaction of a visitor’s experience? Having a better understanding of the role of Māori culture within the overall New Zealand visitor experience could mean products and services are created and tailored to attract high-value visitors and improve satisfaction levels. We also need to identify New Zealand’s biggest competitors and how they might affect the decisions of visitors. Factors that can affect visitors’ decisions can include things within our control (such as perception, quality, and experiences on offer) and things outside of our control (such as the price of oil, exchange rates and weather). Understanding the decision-making process of international travellers is also important. This information could help influence those decisions and thereby encourage more people to come to New Zealand.

10 MED1269477
The barriers to visiting New Zealand need to be identified so that they can be reduced, mitigated or removed entirely. Barriers might include how visitors make travel arrangements or issues around travelling. An understanding is also needed of the trade-offs of reducing barriers to travel – for example, how they might affect entry processes and visas or border security. Areas where government actions might impact on competitiveness include the regulation of flights into New Zealand, access to information, planning and booking facilities, internal transportation (availability and cost), the accessibility of areas of interest, and the level and the quality of service available. Having attracted visitors to New Zealand, we then have to ask the question of whether their expectations are being met or exceeded by the experience. Potential areas to be looked at include the provision and quality of infrastructure, the products and services available, the education and training of suppliers, and quality standards. As part of finding out more about New Zealand’s global competitiveness, the following questions must be answered: • How resilient or responsive is New Zealand tourism to economic and environmental shocks, oil
price changes, changing demographics, changing markets and exchange rates? • Is New Zealand competitive in a global market? Given the small share of the total market, what
are the niches that New Zealand competes in? Are these niches changing over time? • What is New Zealand’s relative competitiveness? • What is the role of Māori and New Zealand culture in our competitive positioning? • What macro effects have an impact on visitor spend and how? • What are the benchmarks for New Zealand’s performance? • What regulations and standards are required to meet the changing visitor mix? Does the
existing staff training meet the quality standard needed? • What are the important features of the New Zealand brand and how does it perform compared
to our competitors? • Are our tourism products meeting visitor demand and expectation? Are Māori tourism products
meeting visitor demands and expectations? • Are tourism products competitive, adaptable and innovative and are they able to meet future
needs? • Who are our competitors and what specifically are we competing with them for? • Are visitors’ preferences or interests changing? • What are the key trends we need to be preparing for over the next five, 10, 25 years? What do
we need to do take advantage of these trends? • How efficient are New Zealand’s tourism supply/value chains? • Is New Zealand tourism able to maintain competiveness in a changing international market? • Is there sufficient connectivity with the international travel market? • Are there regulatory barriers impacting on our visitors’ experience? • What is the impact of taxes/charges on the decision to travel?
• Are visitors protected through consumer policy and other legal/official aspects of their experience?
• How accessible is New Zealand?
Topic 5: The sustainability of New Zealand tourism A good understanding is needed about the sustainability of New Zealand tourism. This includes its impact on the environment (including the cultural environment), the management of natural resources, and the generation of greenhouse gases.

11 MED1269477
However, sustainability goes well beyond environmental issues. The following questions need to be considered. How sustainable are businesses in terms of ownership, skill supply, cultural and heritage development, and changing work practices? How important is this to New Zealand’s tourism products and for New Zealand’s economic growth? How will the sustainability of businesses impact on the future of New Zealand tourism? If tourism is to continue to contribute to the New Zealand economy over the long term, it needs to use resources in a sustainable way and provide a better return than other potential uses of these resources. The role of kaitiakitanga (guardianship) and the protection of intellectual property are concerns for Māori in particular. The relationship between sustainability, Māori cultural values and customary practices need to be considered in the context of tourism’s contribution to the whole economy. The use of natural resources needs to be balanced with preservation and conservation, and the general environmental footprint needs to be considered. However, the positive influences of tourism on sustainability also need to be investigated – for example, generating revenue to contribute toward conservation, looking at the role that tourism plays in creating an awareness of the environment, or exploring the relationship between our environment and quality of life. Communicating Māori cultural values through tourism can also potentially have a positive influence on sustainability and the use of natural resources. The following questions about the sustainability of tourism need to be considered in the development of any future datasets or research: • Does New Zealand use natural resources efficiently and effectively? • What does the balanced scorecard (triple bottom line) for New Zealand tourism look like? • What are the environmental effects of tourism in New Zealand? • How can/should the government manage the negative impacts of tourism on New Zealand? • How can we reconcile international tourism growth with international environmental
commitments? • How can Māori exercise kaitiakitanga while promoting tourism? • What is the most sustainable use of New Zealand’s natural resources – both economically and
environmentally? • How can the carbon emissions associated with the transport sector be reduced or mitigated? • How can the impact of additional visitors be reduced (i.e. energy consumption, rubbish
generation, water usage)? • What is the best use of our natural resources? • What effect does tourism have on the relationship between Māori and the natural environment?
What are the effects of the use of natural resources by Māori (e.g. kai moana)? • How can wahi tapu, customary areas and sites of significance be protected? • Given the changing demographics of the labour market, will tourism be sustainable in the
future? • Can tourism attract the capital and other resources it needs when faced with alternative uses
for those resources in the future?
Data sources to inform topics This plan was developed using data developed in early 2011. The data sources are listed in Appendix 2. Using this data, an assessment was made of what information is currently used to address the issues associated with each topic area. Table 1 summarises the data sources and the topics that they informed.
12 MED1269477
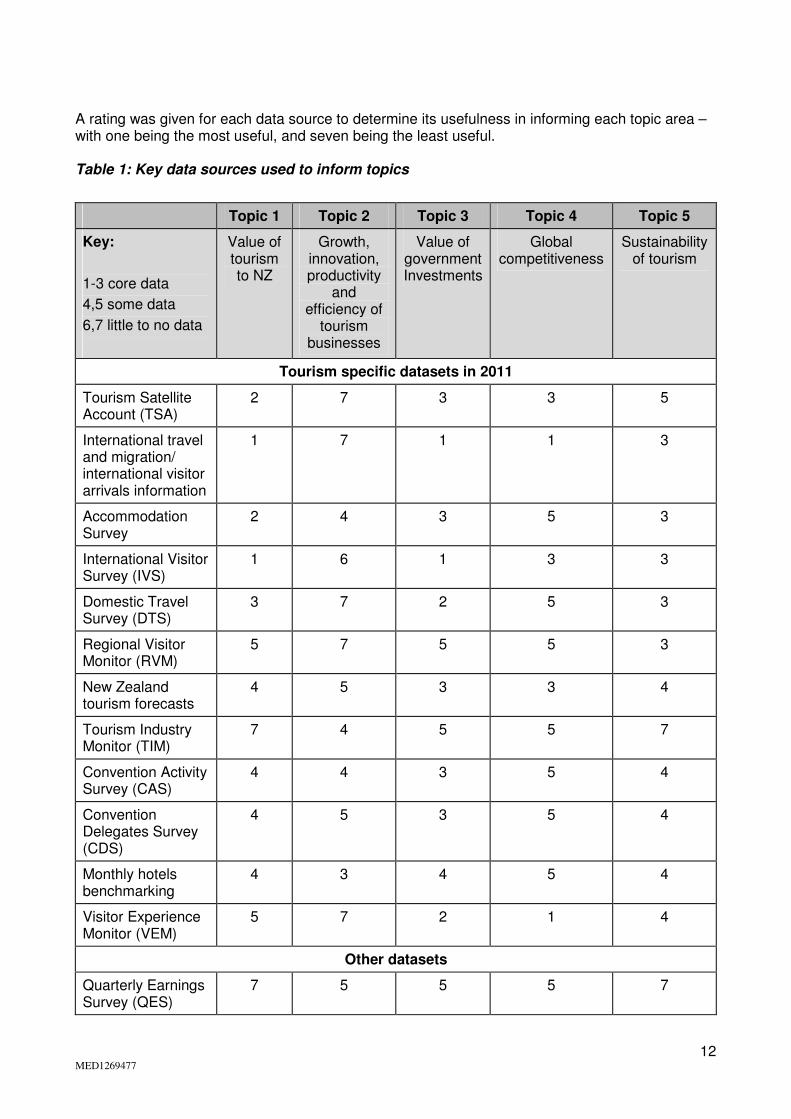
A rating was given for each data source to determine its usefulness in informing each topic area – with one being the most useful, and seven being the least useful. Table 1: Key data sources used to inform topics
Topic 1 Topic 2 Topic 3 Topic 4 Topic 5
Key:
1-3 core data
4,5 some data
6,7 little to no data
Value of tourism to NZ
Growth, innovation, productivity
and efficiency of
tourism businesses
Value of government Investments
Global competitiveness
Sustainability of tourism
Tourism specific datasets in 2011
Tourism Satellite Account (TSA)
2 7 3 3 5
International travel and migration/ international visitor arrivals information
1 7 1 1 3
Accommodation Survey
2 4 3 5 3
International Visitor Survey (IVS)
1 6 1 3 3
Domestic Travel Survey (DTS)
3 7 2 5 3
Regional Visitor Monitor (RVM)
5 7 5 5 3
New Zealand tourism forecasts
4 5 3 3 4
Tourism Industry Monitor (TIM)
7 4 5 5 7
Convention Activity Survey (CAS)
4 4 3 5 4
Convention Delegates Survey (CDS)
4 5 3 5 4
Monthly hotels benchmarking
4 3 4 5 4
Visitor Experience Monitor (VEM)
5 7 2 1 4
Other datasets
Quarterly Earnings Survey (QES)
7 5 5 5 7
13 MED1269477
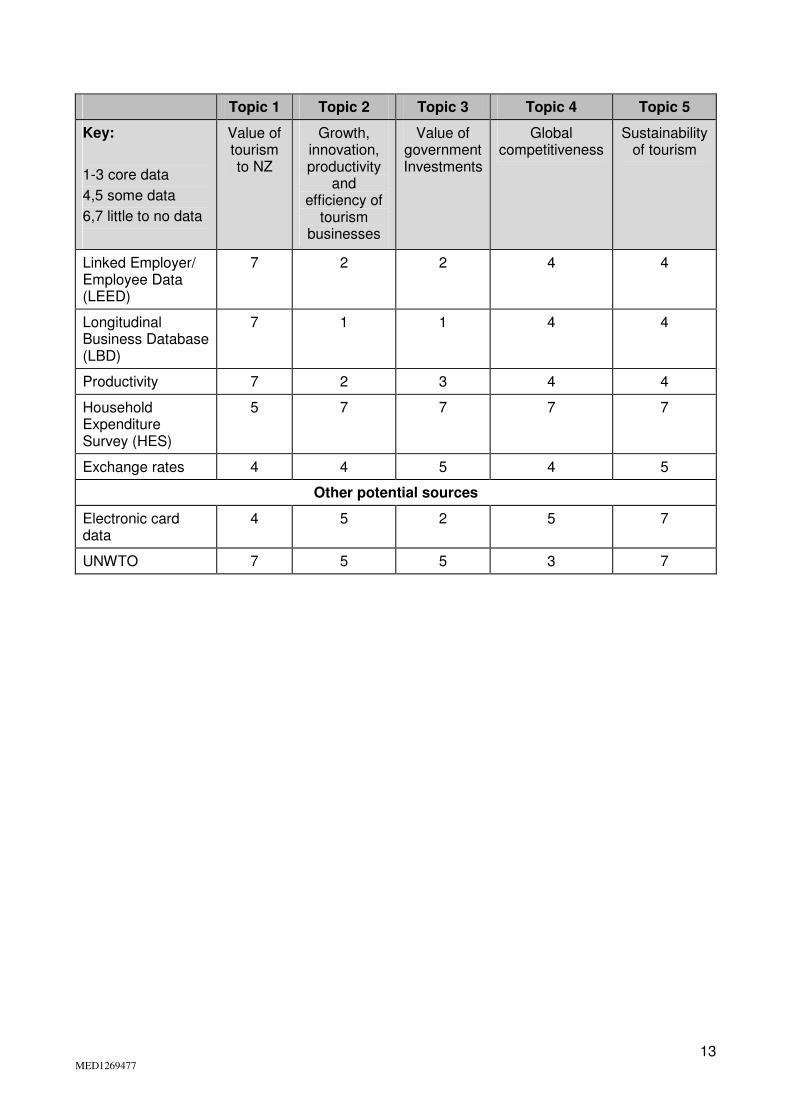
Topic 1 Topic 2 Topic 3 Topic 4 Topic 5
Key:
1-3 core data
4,5 some data
6,7 little to no data
Value of tourism to NZ
Growth, innovation, productivity
and efficiency of
tourism businesses
Value of government Investments
Global competitiveness
Sustainability of tourism
Linked Employer/ Employee Data (LEED)
7 2 2 4 4
Longitudinal Business Database (LBD)
7 1 1 4 4
Productivity 7 2 3 4 4
Household Expenditure Survey (HES)
5 7 7 7 7
Exchange rates 4 4 5 4 5
Other potential sources
Electronic card data
4 5 2 5 7
UNWTO 7 5 5 3 7
14 MED1269477
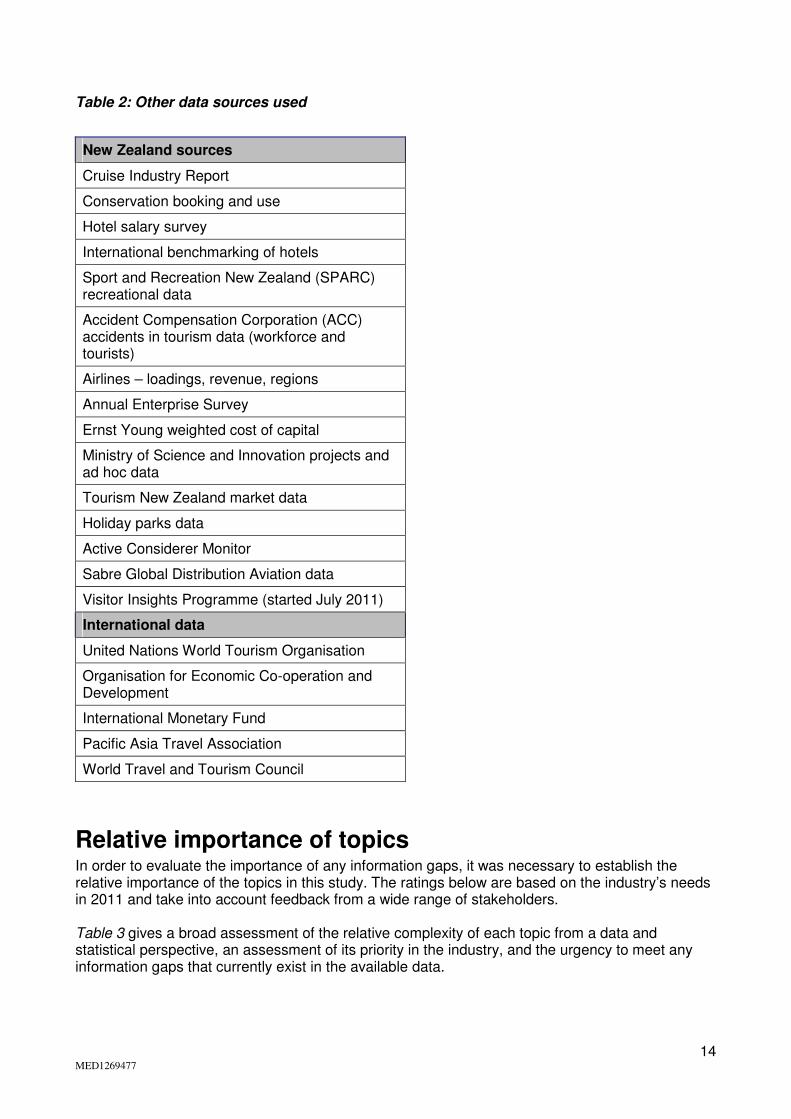
Table 2: Other data sources used
New Zealand sources
Cruise Industry Report
Conservation booking and use
Hotel salary survey
International benchmarking of hotels
Sport and Recreation New Zealand (SPARC) recreational data
Accident Compensation Corporation (ACC) accidents in tourism data (workforce and tourists)
Airlines – loadings, revenue, regions
Annual Enterprise Survey
Ernst Young weighted cost of capital
Ministry of Science and Innovation projects and ad hoc data
Tourism New Zealand market data
Holiday parks data
Active Considerer Monitor
Sabre Global Distribution Aviation data
Visitor Insights Programme (started July 2011)
International data
United Nations World Tourism Organisation
Organisation for Economic Co-operation and Development
International Monetary Fund
Pacific Asia Travel Association
World Travel and Tourism Council
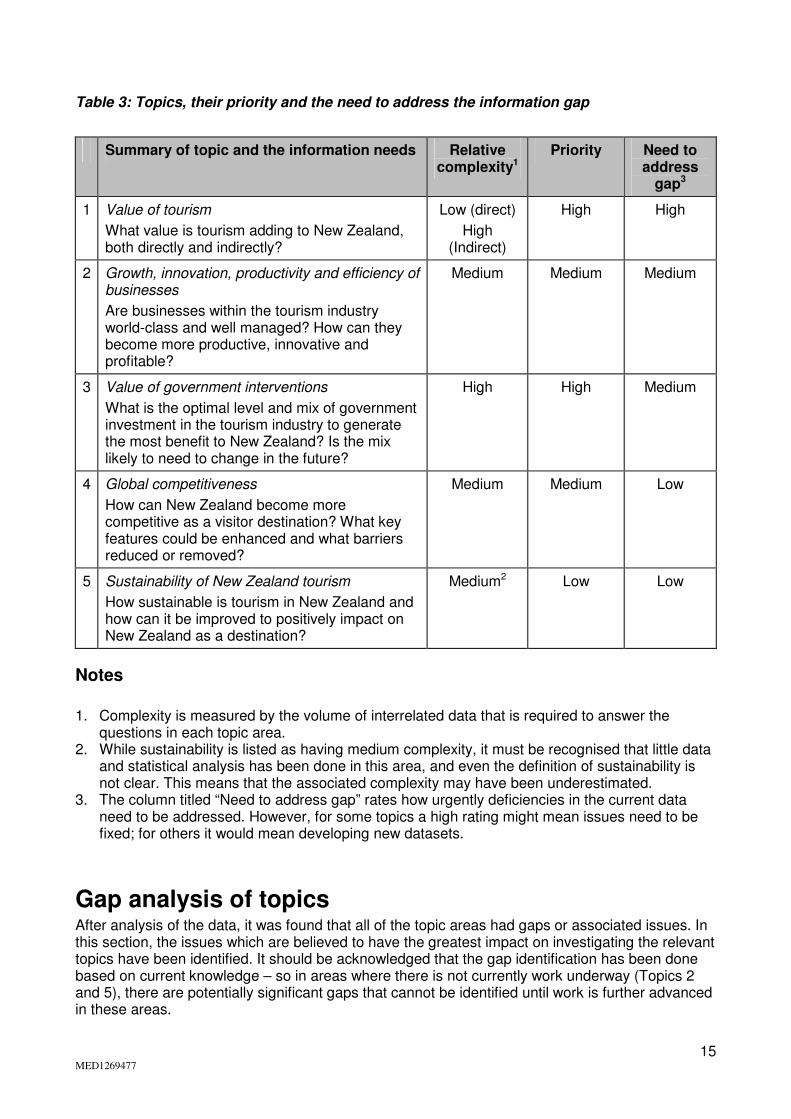
Relative importance of topics In order to evaluate the importance of any information gaps, it was necessary to establish the relative importance of the topics in this study. The ratings below are based on the industry’s needs in 2011 and take into account feedback from a wide range of stakeholders. Table 3 gives a broad assessment of the relative complexity of each topic from a data and statistical perspective, an assessment of its priority in the industry, and the urgency to meet any information gaps that currently exist in the available data.
15 MED1269477
Table 3: Topics, their priority and the need to address the information gap
Summary of topic and the information needs Relative complexity1
Priority Need to address
gap3
1 Value of tourism
What value is tourism adding to New Zealand, both directly and indirectly?
Low (direct)
High (Indirect)
High High
2 Growth, innovation, productivity and efficiency of businesses
Are businesses within the tourism industry world-class and well managed? How can they become more productive, innovative and profitable?
Medium Medium Medium
3 Value of government interventions
What is the optimal level and mix of government investment in the tourism industry to generate the most benefit to New Zealand? Is the mix likely to need to change in the future?
High High Medium
4 Global competitiveness
How can New Zealand become more competitive as a visitor destination? What key features could be enhanced and what barriers reduced or removed?
Medium Medium Low
5 Sustainability of New Zealand tourism
How sustainable is tourism in New Zealand and how can it be improved to positively impact on New Zealand as a destination?
Medium2 Low Low
Notes
1. Complexity is measured by the volume of interrelated data that is required to answer the questions in each topic area.
2. While sustainability is listed as having medium complexity, it must be recognised that little data and statistical analysis has been done in this area, and even the definition of sustainability is not clear. This means that the associated complexity may have been underestimated.
3. The column titled “Need to address gap” rates how urgently deficiencies in the current data need to be addressed. However, for some topics a high rating might mean issues need to be fixed; for others it would mean developing new datasets.
Gap analysis of topics After analysis of the data, it was found that all of the topic areas had gaps or associated issues. In this section, the issues which are believed to have the greatest impact on investigating the relevant topics have been identified. It should be acknowledged that the gap identification has been done based on current knowledge – so in areas where there is not currently work underway (Topics 2 and 5), there are potentially significant gaps that cannot be identified until work is further advanced in these areas.
16 MED1269477
Where there was seen to be a high impact relating to the information available on a topic, some recommendations have been made. A number of other recommendations for addressing gaps were also identified and these are listed in Table 4. To see a complete list of all the recommendations, please refer to Appendix 3. It is outside the scope of the Tourism Data Domain Plan to identify which research questions should take priority. Some of the recommendations are closer to research questions than data issues and these will be considered as part of the research programme rather than the core data review.
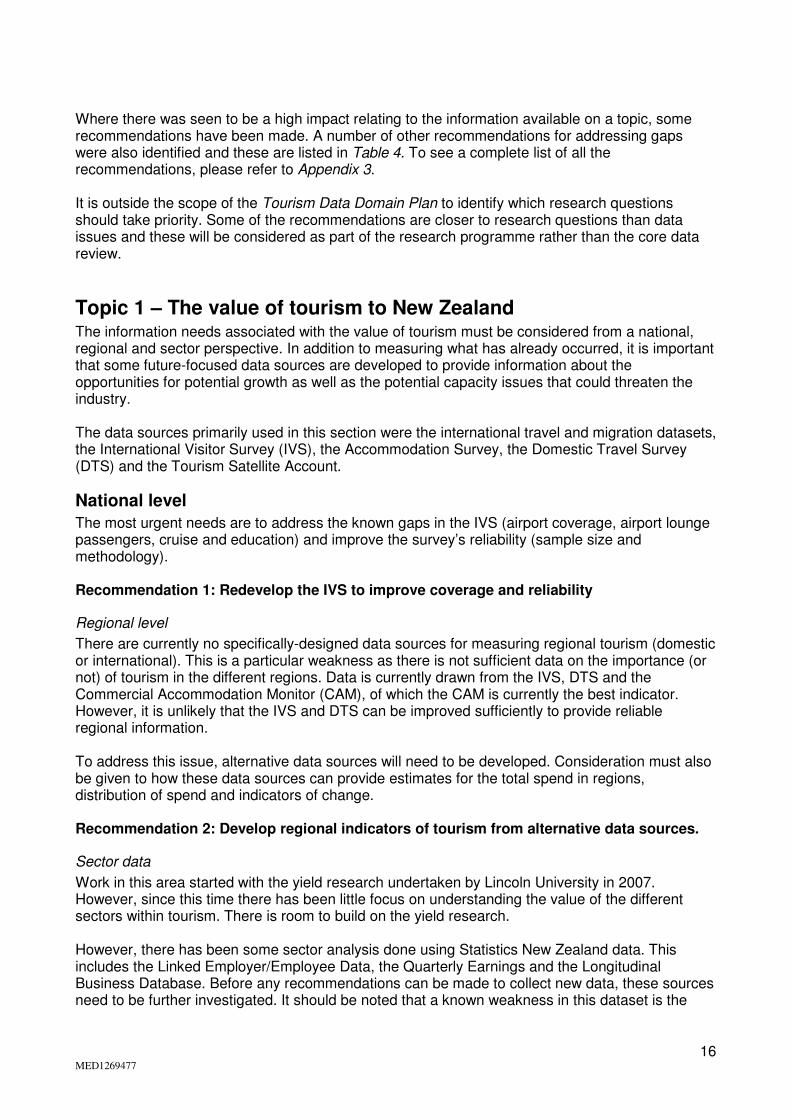
Topic 1 – The value of tourism to New Zealand The information needs associated with the value of tourism must be considered from a national, regional and sector perspective. In addition to measuring what has already occurred, it is important that some future-focused data sources are developed to provide information about the opportunities for potential growth as well as the potential capacity issues that could threaten the industry. The data sources primarily used in this section were the international travel and migration datasets, the International Visitor Survey (IVS), the Accommodation Survey, the Domestic Travel Survey (DTS) and the Tourism Satellite Account.
National level
The most urgent needs are to address the known gaps in the IVS (airport coverage, airport lounge passengers, cruise and education) and improve the survey’s reliability (sample size and methodology). Recommendation 1: Redevelop the IVS to improve coverage and reliability
Regional level
There are currently no specifically-designed data sources for measuring regional tourism (domestic or international). This is a particular weakness as there is not sufficient data on the importance (or not) of tourism in the different regions. Data is currently drawn from the IVS, DTS and the Commercial Accommodation Monitor (CAM), of which the CAM is currently the best indicator. However, it is unlikely that the IVS and DTS can be improved sufficiently to provide reliable regional information. To address this issue, alternative data sources will need to be developed. Consideration must also be given to how these data sources can provide estimates for the total spend in regions, distribution of spend and indicators of change. Recommendation 2: Develop regional indicators of tourism from alternative data sources.
Sector data
Work in this area started with the yield research undertaken by Lincoln University in 2007. However, since this time there has been little focus on understanding the value of the different sectors within tourism. There is room to build on the yield research. However, there has been some sector analysis done using Statistics New Zealand data. This includes the Linked Employer/Employee Data, the Quarterly Earnings and the Longitudinal Business Database. Before any recommendations can be made to collect new data, these sources need to be further investigated. It should be noted that a known weakness in this dataset is the
17 MED1269477
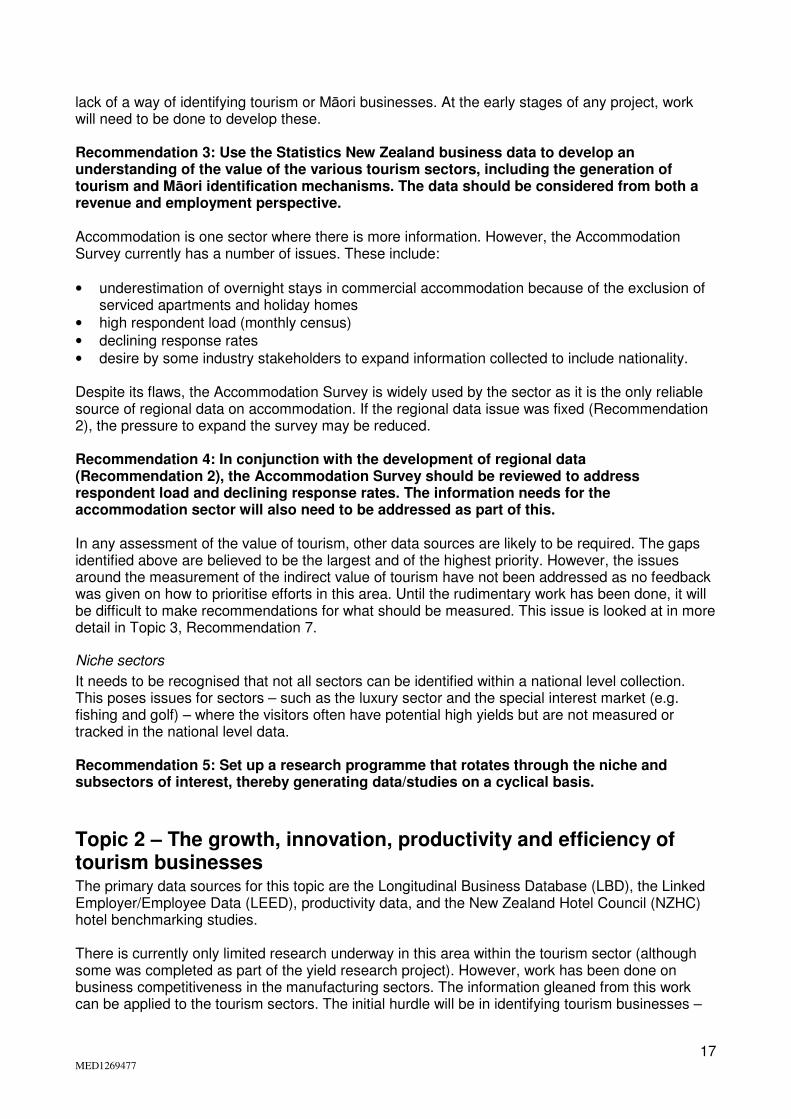
lack of a way of identifying tourism or Māori businesses. At the early stages of any project, work will need to be done to develop these. Recommendation 3: Use the Statistics New Zealand business data to develop an understanding of the value of the various tourism sectors, including the generation of tourism and Māori identification mechanisms. The data should be considered from both a revenue and employment perspective. Accommodation is one sector where there is more information. However, the Accommodation Survey currently has a number of issues. These include: • underestimation of overnight stays in commercial accommodation because of the exclusion of
serviced apartments and holiday homes • high respondent load (monthly census) • declining response rates • desire by some industry stakeholders to expand information collected to include nationality. Despite its flaws, the Accommodation Survey is widely used by the sector as it is the only reliable source of regional data on accommodation. If the regional data issue was fixed (Recommendation 2), the pressure to expand the survey may be reduced. Recommendation 4: In conjunction with the development of regional data (Recommendation 2), the Accommodation Survey should be reviewed to address respondent load and declining response rates. The information needs for the accommodation sector will also need to be addressed as part of this. In any assessment of the value of tourism, other data sources are likely to be required. The gaps identified above are believed to be the largest and of the highest priority. However, the issues around the measurement of the indirect value of tourism have not been addressed as no feedback was given on how to prioritise efforts in this area. Until the rudimentary work has been done, it will be difficult to make recommendations for what should be measured. This issue is looked at in more detail in Topic 3, Recommendation 7.
Niche sectors
It needs to be recognised that not all sectors can be identified within a national level collection. This poses issues for sectors – such as the luxury sector and the special interest market (e.g. fishing and golf) – where the visitors often have potential high yields but are not measured or tracked in the national level data. Recommendation 5: Set up a research programme that rotates through the niche and subsectors of interest, thereby generating data/studies on a cyclical basis.
Topic 2 – The growth, innovation, productivity and efficiency of tourism businesses The primary data sources for this topic are the Longitudinal Business Database (LBD), the Linked Employer/Employee Data (LEED), productivity data, and the New Zealand Hotel Council (NZHC) hotel benchmarking studies. There is currently only limited research underway in this area within the tourism sector (although some was completed as part of the yield research project). However, work has been done on business competitiveness in the manufacturing sectors. The information gleaned from this work can be applied to the tourism sectors. The initial hurdle will be in identifying tourism businesses –

18 MED1269477
i.e. what are their characteristics and what is the best method of identification. As part of this work, consideration will need to be given to identifying Maori tourism businesses, how they are defined, and how to maintain the variable. Once a way to identify the tourism and Maori business has been developed, it is likely that the current data available at Statistics New Zealand will be sufficient in the beginning. Specific collections may be necessary in future if detailed studies are to be done in small segments. To get the most out of any studies done in this area, it will be important that industry experts are involved to ensure that the data is interpreted correctly. Consideration also needs to be given to benchmarking against best practice in other countries. Recommendation 6: Develop a business scorecard which shows relative sector value, productivity and efficiencies (labour and capital). Note that this is related to Recommendation 3 and the scorecard is likely to be developed as a result of its findings.
Topic 3 – The value of government interventions The primary data to assess the value of government investments comes from the International Travel and Migration Survey, the International Visitor Survey, the Longitudinal Business Database, the Tourism Satellite Account, the Domestic Travel Survey, the Visitor Experience Monitor, the Linked Employer/Employee Data and electronic card data. There is no agreed method for determining the return on investment for government interventions that impact on tourism. There are two main issues with generating this information. The first is measuring the indirect benefits of tourism. The second issue is identifying how much of the benefit can be attributed to the investment (compared to what would have happened without the investment). The Department of Conservation, the New Zealand Transport Authority and other agencies have stated that they have difficulty estimating the benefits to New Zealand which come from their investments in the infrastructure that is used by visitors. Answering these questions is an ongoing priority for the government. There are also issues arising from limitations in the available data. For example, there is limited information about tourism sub-sectors, such as Maori tourism, and this diminishes the government’s ability to make informed investment decisions that could contribute to Māori economic development, or lead to benefits flowing from sub-sectors into the whole economy. Recommendation 7: Develop an agreed methodology for determining the return on investment, addressing the issues of indirect returns and estimating any incremental benefit that results from an investment. The value of interventions must also be assessed by the ability of an investment to influence a visitor’s decision. For example, does Tourism New Zealand’s offshore marketing influence overseas visitors to come, to stay longer or to visit more places in New Zealand? Does the level of satisfaction that visitors have during their stay in New Zealand influence other people to visit? More data is required on the factors that influence visitors’ decisions to come to New Zealand and their spending choices. This kind of data would ensure that any investment in this area is targeted and relevant. Recommendation 8: Develop datasets that look at visitor satisfaction and decision-making processes, and ensure that the data is accessible and aligned to other initiatives.

19 MED1269477
While not a topic for this plan as such, it is important that any investments made are coordinated across government – for example, investments in conservation, transport and marketing. A shared methodology for assessing the value of tourism would aid this process.
Topic 4 – Global competitiveness New Zealand’s ability to compete with other markets is not just driven by the value of our dollar or what we have to offer. It involves a complex combination of factors – such as how the country is perceived, the level of awareness of New Zealand, or barriers to travel. To assess New Zealand’s global competitiveness, the primary data sources used are the international travel and migration data, the Visitor Experience Monitor, the Tourism Satellite Account, the International Visitor Survey, New Zealand tourism forecasts and research from the United Nations World Tourism Organization. More analysis of this data is required. More specifically, there needs to be work done to identify, collect and analyse country-of-origin data that will provide more information on current behaviours, attitudes, visitor satisfaction and awareness of New Zealand. To understand New Zealand’s competitive position in the global travel market, it is important to know what influences decision-making (Recommendation 8) and to develop ways to monitor attitudes and perceptions of New Zealand as a visitor destination. Historically, data has been difficult to gather and unreliable as it was primarily based on satisfaction surveys. However, with the growth of social media tools, monitoring and mining this kind of information is now much easier. It would provide new and immediate insights into how a New Zealand travel experience compares to experiences in other countries. Recommendation 9: Investigate the use of social media and user-generated media (e.g. TripAdvisor) to monitor and provide feedback on global comparisons and competitiveness. While the primary reason for collecting information about New Zealand’s competitiveness, visitor satisfaction or how visitors make decisions (Recommendations 8 and 9) is strategic, it would also be extremely useful for the tourism industry to help refine their products and services. Therefore, for this information to be effectively used, it is important that it reaches tourism operators in a form that ensures they can understand the implications for their business. Note that it is not expected that it would include any information about the satisfaction with a specific business – rather it would focus on more general indications or levels of performance across the industry. Recommendation 10: Improve the flow of information about visitor satisfaction and decision-making and ensure it reaches all parts of the tourism industry. To understand what makes New Zealand attractive as a destination, more research must be done on Māori culture and heritage as a potential selling proposition. Any research on this should take into account its role in affecting the decisions of visitors to travel to New Zealand and their subsequent satisfaction of associated products and services. Recommendation 11: Investigate how the role of Māori culture and heritage can be captured in any decision-making and visitor satisfaction data. The perception of competitiveness is market/country specific. It is influenced by factors that are being exerted on visitors in their own countries. Getting useful insights into these influences requires pulling together information from a wide variety of sources. Most operators (unless they are very large) do not have the ability to do this. There is a need for this information to be
20 MED1269477
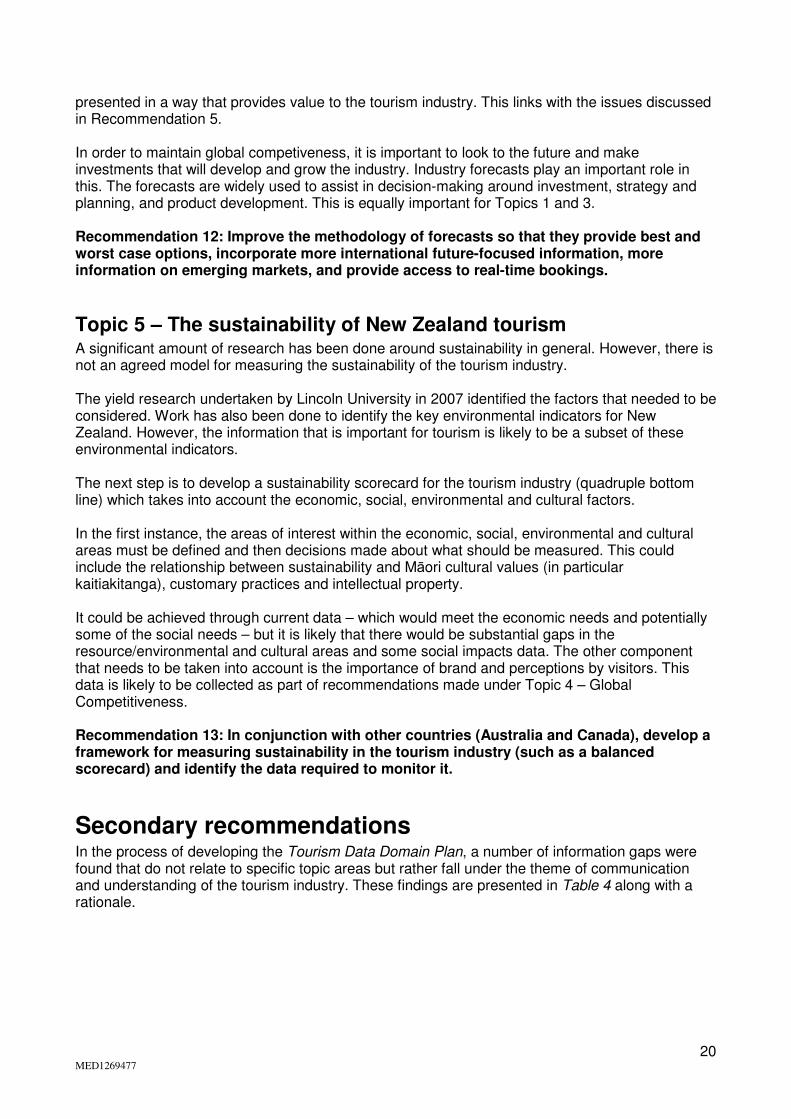
presented in a way that provides value to the tourism industry. This links with the issues discussed in Recommendation 5. In order to maintain global competiveness, it is important to look to the future and make investments that will develop and grow the industry. Industry forecasts play an important role in this. The forecasts are widely used to assist in decision-making around investment, strategy and planning, and product development. This is equally important for Topics 1 and 3. Recommendation 12: Improve the methodology of forecasts so that they provide best and worst case options, incorporate more international future-focused information, more information on emerging markets, and provide access to real-time bookings.
Topic 5 – The sustainability of New Zealand tourism A significant amount of research has been done around sustainability in general. However, there is not an agreed model for measuring the sustainability of the tourism industry. The yield research undertaken by Lincoln University in 2007 identified the factors that needed to be considered. Work has also been done to identify the key environmental indicators for New Zealand. However, the information that is important for tourism is likely to be a subset of these environmental indicators. The next step is to develop a sustainability scorecard for the tourism industry (quadruple bottom line) which takes into account the economic, social, environmental and cultural factors. In the first instance, the areas of interest within the economic, social, environmental and cultural areas must be defined and then decisions made about what should be measured. This could include the relationship between sustainability and Māori cultural values (in particular kaitiakitanga), customary practices and intellectual property. It could be achieved through current data – which would meet the economic needs and potentially some of the social needs – but it is likely that there would be substantial gaps in the resource/environmental and cultural areas and some social impacts data. The other component that needs to be taken into account is the importance of brand and perceptions by visitors. This data is likely to be collected as part of recommendations made under Topic 4 – Global Competitiveness. Recommendation 13: In conjunction with other countries (Australia and Canada), develop a framework for measuring sustainability in the tourism industry (such as a balanced scorecard) and identify the data required to monitor it.
Secondary recommendations In the process of developing the Tourism Data Domain Plan, a number of information gaps were found that do not relate to specific topic areas but rather fall under the theme of communication and understanding of the tourism industry. These findings are presented in Table 4 along with a rationale.
21 MED1269477
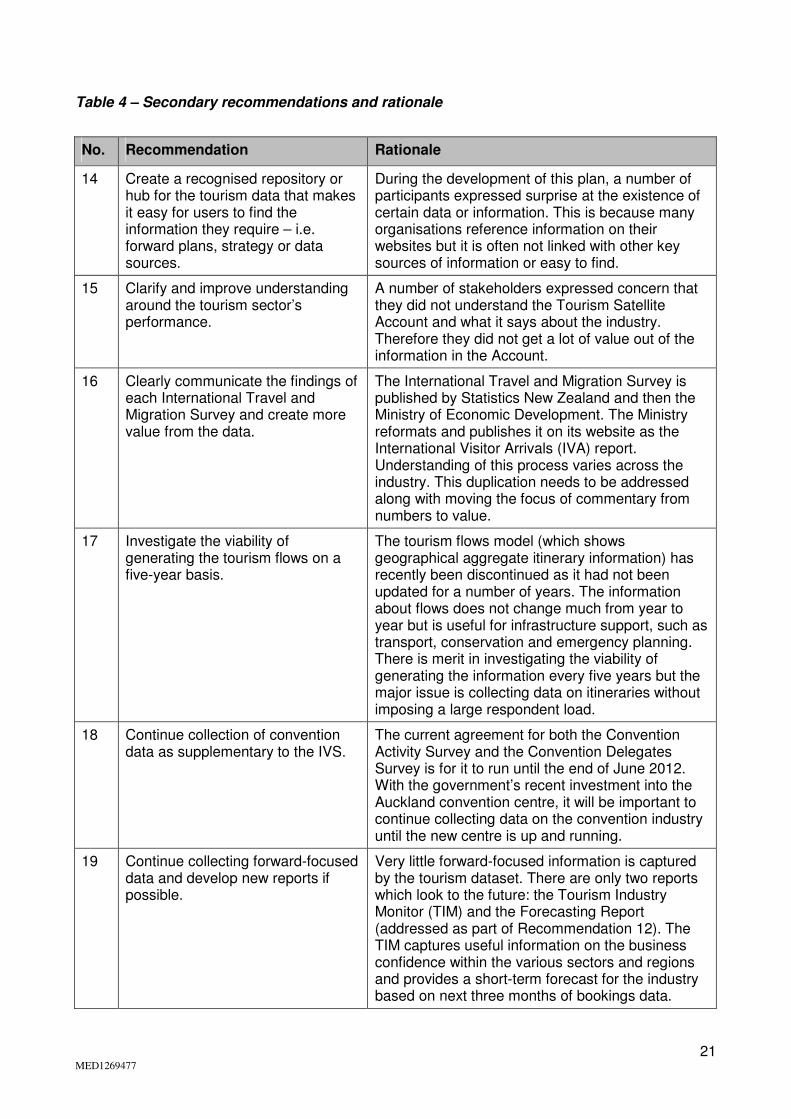
Table 4 – Secondary recommendations and rationale
No. Recommendation Rationale
14 Create a recognised repository or hub for the tourism data that makes it easy for users to find the information they require – i.e. forward plans, strategy or data sources.
During the development of this plan, a number of participants expressed surprise at the existence of certain data or information. This is because many organisations reference information on their websites but it is often not linked with other key sources of information or easy to find.
15 Clarify and improve understanding around the tourism sector’s performance.
A number of stakeholders expressed concern that they did not understand the Tourism Satellite Account and what it says about the industry. Therefore they did not get a lot of value out of the information in the Account.
16 Clearly communicate the findings of each International Travel and Migration Survey and create more value from the data.
The International Travel and Migration Survey is published by Statistics New Zealand and then the Ministry of Economic Development. The Ministry reformats and publishes it on its website as the International Visitor Arrivals (IVA) report. Understanding of this process varies across the industry. This duplication needs to be addressed along with moving the focus of commentary from numbers to value.
17 Investigate the viability of generating the tourism flows on a five-year basis.
The tourism flows model (which shows geographical aggregate itinerary information) has recently been discontinued as it had not been updated for a number of years. The information about flows does not change much from year to year but is useful for infrastructure support, such as transport, conservation and emergency planning. There is merit in investigating the viability of generating the information every five years but the major issue is collecting data on itineraries without imposing a large respondent load.
18 Continue collection of convention data as supplementary to the IVS.
The current agreement for both the Convention Activity Survey and the Convention Delegates Survey is for it to run until the end of June 2012. With the government’s recent investment into the Auckland convention centre, it will be important to continue collecting data on the convention industry until the new centre is up and running.
19 Continue collecting forward-focused data and develop new reports if possible.
Very little forward-focused information is captured by the tourism dataset. There are only two reports which look to the future: the Tourism Industry Monitor (TIM) and the Forecasting Report (addressed as part of Recommendation 12). The TIM captures useful information on the business confidence within the various sectors and regions and provides a short-term forecast for the industry based on next three months of bookings data.
22 MED1269477
No. Recommendation Rationale
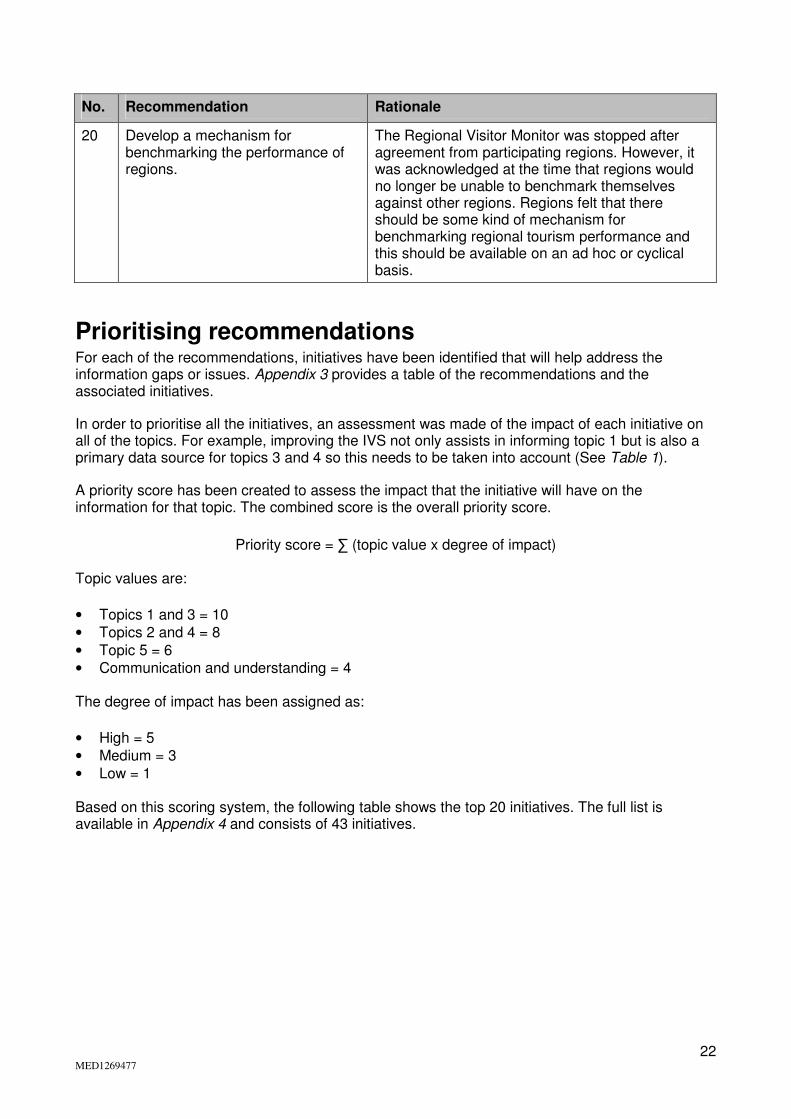
20 Develop a mechanism for benchmarking the performance of regions.
The Regional Visitor Monitor was stopped after agreement from participating regions. However, it was acknowledged at the time that regions would no longer be unable to benchmark themselves against other regions. Regions felt that there should be some kind of mechanism for benchmarking regional tourism performance and this should be available on an ad hoc or cyclical basis.
Prioritising recommendations For each of the recommendations, initiatives have been identified that will help address the information gaps or issues. Appendix 3 provides a table of the recommendations and the associated initiatives.
In order to prioritise all the initiatives, an assessment was made of the impact of each initiative on all of the topics. For example, improving the IVS not only assists in informing topic 1 but is also a primary data source for topics 3 and 4 so this needs to be taken into account (See Table 1).
A priority score has been created to assess the impact that the initiative will have on the information for that topic. The combined score is the overall priority score.
Priority score = ∑ (topic value x degree of impact)
Topic values are:
• Topics 1 and 3 = 10 • Topics 2 and 4 = 8 • Topic 5 = 6 • Communication and understanding = 4 The degree of impact has been assigned as:
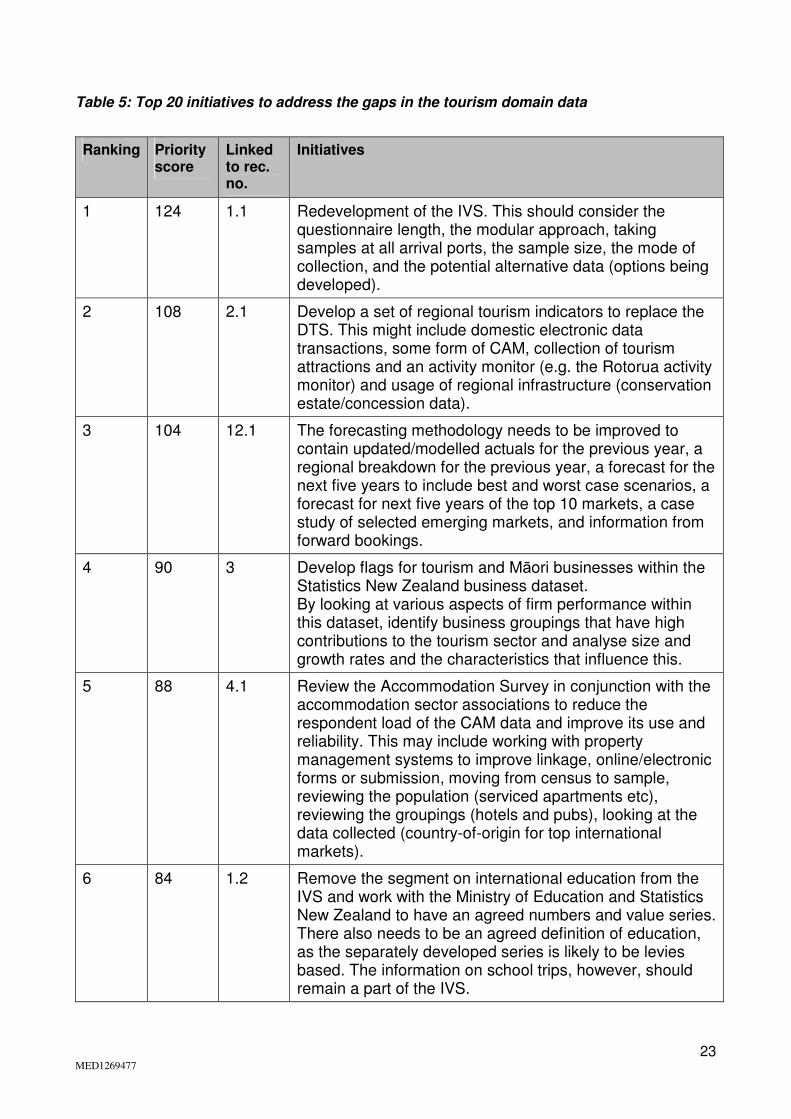
• High = 5 • Medium = 3 • Low = 1 Based on this scoring system, the following table shows the top 20 initiatives. The full list is available in Appendix 4 and consists of 43 initiatives.
23 MED1269477
Table 5: Top 20 initiatives to address the gaps in the tourism domain data
Ranking Priority score
Linked to rec. no.
Initiatives
1 124 1.1 Redevelopment of the IVS. This should consider the questionnaire length, the modular approach, taking samples at all arrival ports, the sample size, the mode of collection, and the potential alternative data (options being developed).
2 108 2.1 Develop a set of regional tourism indicators to replace the DTS. This might include domestic electronic data transactions, some form of CAM, collection of tourism attractions and an activity monitor (e.g. the Rotorua activity monitor) and usage of regional infrastructure (conservation estate/concession data).
3 104 12.1 The forecasting methodology needs to be improved to contain updated/modelled actuals for the previous year, a regional breakdown for the previous year, a forecast for the next five years to include best and worst case scenarios, a forecast for next five years of the top 10 markets, a case study of selected emerging markets, and information from forward bookings.
4 90 3 Develop flags for tourism and Māori businesses within the Statistics New Zealand business dataset. By looking at various aspects of firm performance within this dataset, identify business groupings that have high contributions to the tourism sector and analyse size and growth rates and the characteristics that influence this.
5 88 4.1 Review the Accommodation Survey in conjunction with the accommodation sector associations to reduce the respondent load of the CAM data and improve its use and reliability. This may include working with property management systems to improve linkage, online/electronic forms or submission, moving from census to sample, reviewing the population (serviced apartments etc), reviewing the groupings (hotels and pubs), looking at the data collected (country-of-origin for top international markets).
6 84 1.2 Remove the segment on international education from the IVS and work with the Ministry of Education and Statistics New Zealand to have an agreed numbers and value series. There also needs to be an agreed definition of education, as the separately developed series is likely to be levies based. The information on school trips, however, should remain a part of the IVS.
24 MED1269477
Ranking Priority score
Linked to rec. no.
Initiatives
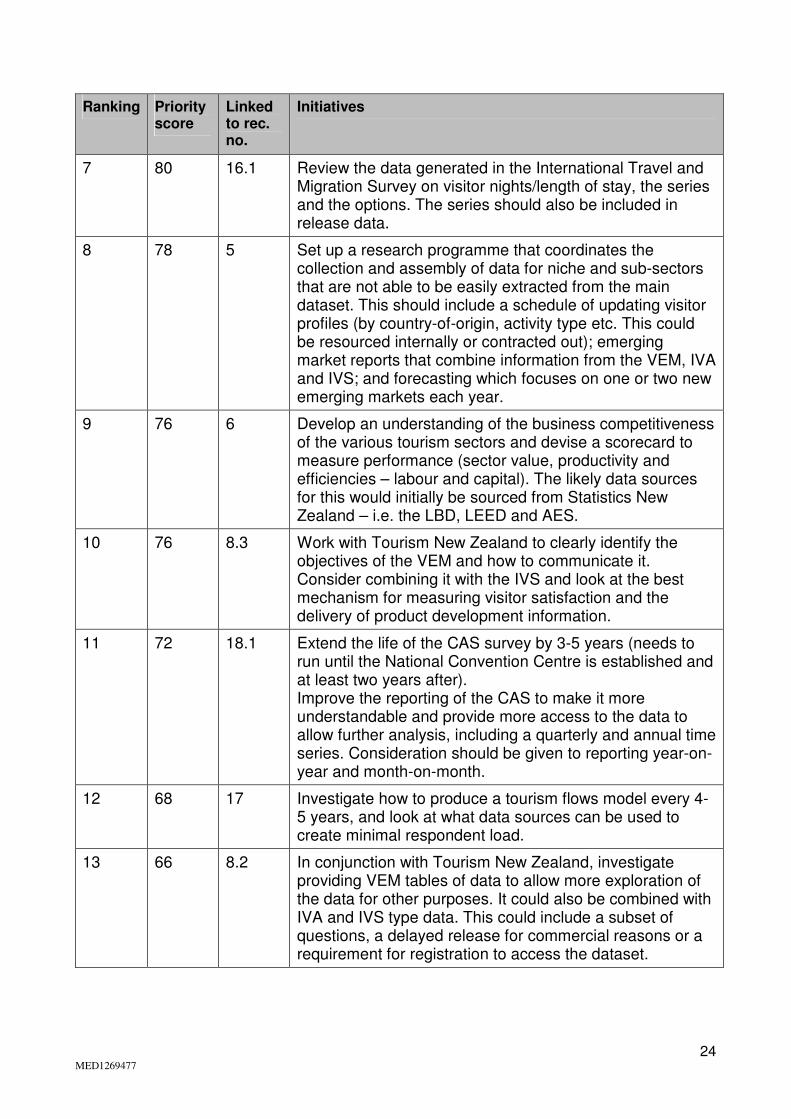
7 80 16.1 Review the data generated in the International Travel and Migration Survey on visitor nights/length of stay, the series and the options. The series should also be included in release data.
8 78 5 Set up a research programme that coordinates the collection and assembly of data for niche and sub-sectors that are not able to be easily extracted from the main dataset. This should include a schedule of updating visitor profiles (by country-of-origin, activity type etc. This could be resourced internally or contracted out); emerging market reports that combine information from the VEM, IVA and IVS; and forecasting which focuses on one or two new emerging markets each year.
9 76 6 Develop an understanding of the business competitiveness of the various tourism sectors and devise a scorecard to measure performance (sector value, productivity and efficiencies – labour and capital). The likely data sources for this would initially be sourced from Statistics New Zealand – i.e. the LBD, LEED and AES.
10 76 8.3 Work with Tourism New Zealand to clearly identify the objectives of the VEM and how to communicate it. Consider combining it with the IVS and look at the best mechanism for measuring visitor satisfaction and the delivery of product development information.
11 72 18.1 Extend the life of the CAS survey by 3-5 years (needs to run until the National Convention Centre is established and at least two years after). Improve the reporting of the CAS to make it more understandable and provide more access to the data to allow further analysis, including a quarterly and annual time series. Consideration should be given to reporting year-on-year and month-on-month.
12 68 17 Investigate how to produce a tourism flows model every 4-5 years, and look at what data sources can be used to create minimal respondent load.
13 66 8.2 In conjunction with Tourism New Zealand, investigate providing VEM tables of data to allow more exploration of the data for other purposes. It could also be combined with IVA and IVS type data. This could include a subset of questions, a delayed release for commercial reasons or a requirement for registration to access the dataset.
25 MED1269477
Ranking Priority score
Linked to rec. no.
Initiatives
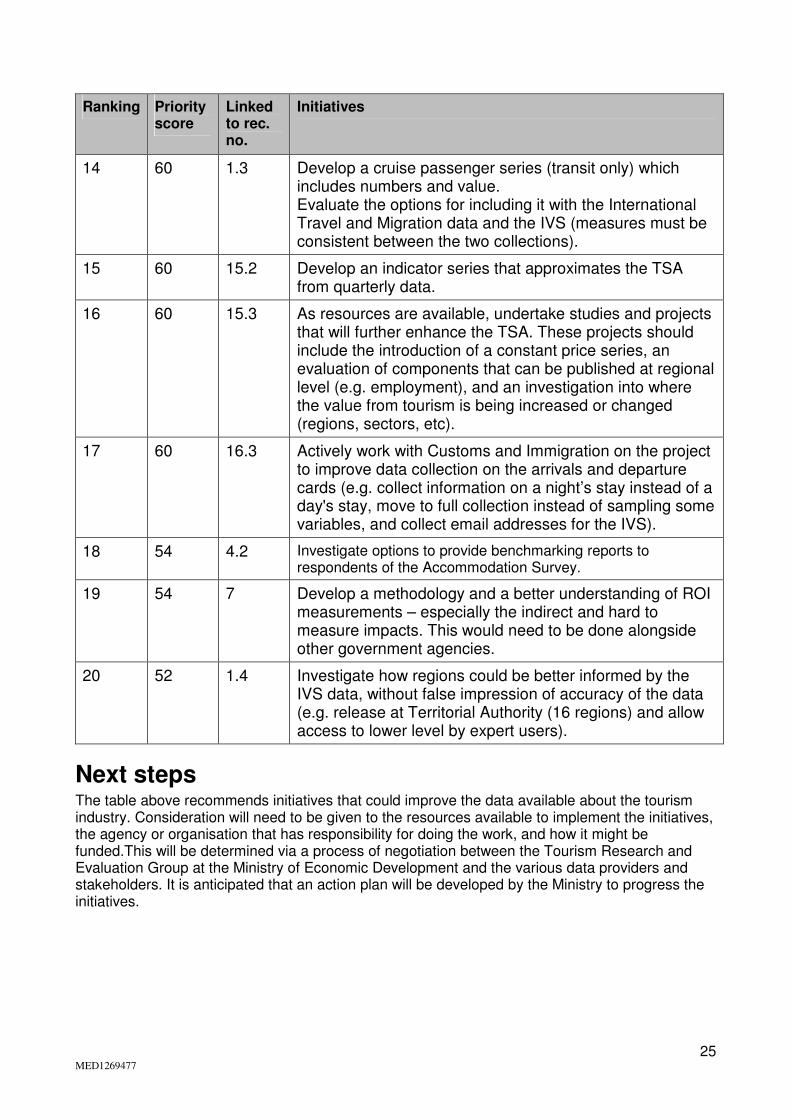
14 60 1.3 Develop a cruise passenger series (transit only) which includes numbers and value. Evaluate the options for including it with the International Travel and Migration data and the IVS (measures must be consistent between the two collections).
15 60 15.2 Develop an indicator series that approximates the TSA from quarterly data.
16 60 15.3 As resources are available, undertake studies and projects that will further enhance the TSA. These projects should include the introduction of a constant price series, an evaluation of components that can be published at regional level (e.g. employment), and an investigation into where the value from tourism is being increased or changed (regions, sectors, etc).
17 60 16.3 Actively work with Customs and Immigration on the project to improve data collection on the arrivals and departure cards (e.g. collect information on a night’s stay instead of a day's stay, move to full collection instead of sampling some variables, and collect email addresses for the IVS).
18 54 4.2 Investigate options to provide benchmarking reports to respondents of the Accommodation Survey.
19 54 7 Develop a methodology and a better understanding of ROI measurements – especially the indirect and hard to measure impacts. This would need to be done alongside other government agencies.
20 52 1.4 Investigate how regions could be better informed by the IVS data, without false impression of accuracy of the data (e.g. release at Territorial Authority (16 regions) and allow access to lower level by expert users).
Next steps The table above recommends initiatives that could improve the data available about the tourism industry. Consideration will need to be given to the resources available to implement the initiatives, the agency or organisation that has responsibility for doing the work, and how it might be funded.This will be determined via a process of negotiation between the Tourism Research and Evaluation Group at the Ministry of Economic Development and the various data providers and stakeholders. It is anticipated that an action plan will be developed by the Ministry to progress the initiatives.
26 MED1269477
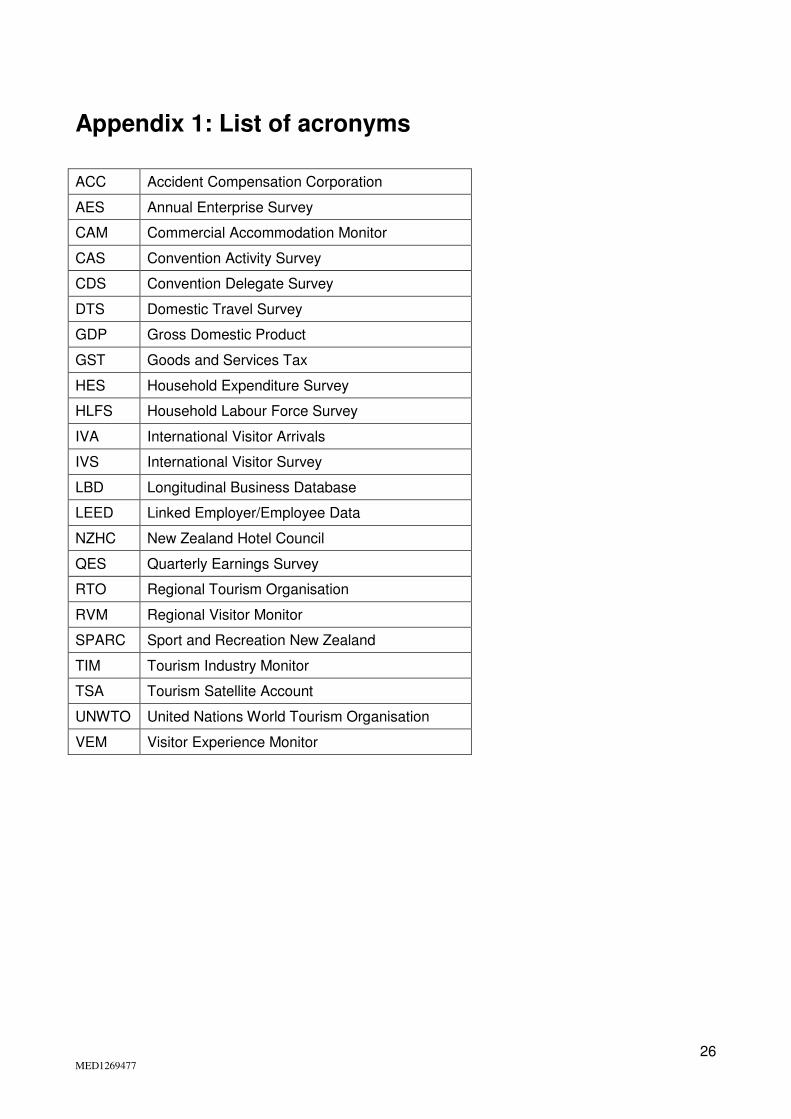
Appendix 1: List of acronyms ACC Accident Compensation Corporation
AES Annual Enterprise Survey
CAM Commercial Accommodation Monitor
CAS Convention Activity Survey
CDS Convention Delegate Survey
DTS Domestic Travel Survey
GDP Gross Domestic Product
GST Goods and Services Tax
HES Household Expenditure Survey
HLFS Household Labour Force Survey
IVA International Visitor Arrivals
IVS International Visitor Survey
LBD Longitudinal Business Database
LEED Linked Employer/Employee Data
NZHC New Zealand Hotel Council
QES Quarterly Earnings Survey
RTO Regional Tourism Organisation
RVM Regional Visitor Monitor
SPARC Sport and Recreation New Zealand
TIM Tourism Industry Monitor
TSA Tourism Satellite Account
UNWTO United Nations World Tourism Organisation
VEM Visitor Experience Monitor

27 MED1269477
Appendix 2: Tourism data sources
The following summary tables provide an overview of the tourism statistics and related datasets that are available from the Tourism Strategy Group at the Ministry of Economic Development as well as Statistics New Zealand and other external agencies. This analysis will be used to inform policy and research, and to implement the initiatives recommended in this report.
Summary Table: Direct tourism data – ongoing collections
Name Acronym Publishing agency Contributing parties
Comments
Tourism Satellite Account
TSA Statistics New Zealand
Ministry of Economic Development
No data collected as part of this
International Travel and Migration
Statistics New Zealand
Ministry of Economic Development, Department of Labour, Ministry of Transport
Called International Visitor Arrivals (IVA) on the Ministry’s tourism research website
Accommodation Survey
Statistics New Zealand
Ministry of Economic Development
Called Commercial Accommodation Monitor (CAM) on the Ministry’s tourism research website
International Visitors Survey
IVS Ministry of Economic Development
Covec collect data
Domestic Travel Survey
DTS Ministry of Economic Development
OCIS collect data
Regional Visitor Monitor
RVM Ministry of Economic Development
Angus & Associates collect data
Finished at the end of the June 2011 quarter
New Zealand Visitor Forecasts
Ministry of Economic Development
Covec produce forecasts
Uses existing data sources and modelling
Tourism Industry Monitor
TIM Ministry of Economic Development
Covec collect and analyse data
Convention Activity Survey
CAS Ministry of Economic Development
CINZ, Regional convention Bureau, plus 10 regions
Two more regions joined in July 2011

28 MED1269477
Name Acronym Publishing agency Contributing parties
Comments
Covec collect and analyse data
Convention Delegates Survey
CDS Ministry of Economic Development
CINZ, Regional Convention Bureau, plus 10 regions
Covec collect and analyse data
Two more regions joined in July 2011
Monthly Hotels Benchmarking Survey
New Zealand Hotels Council
Covec collect and analyse data
Industry funded and owned survey
Visitor Experience Monitor
VEM Tourism New Zealand
TNS Conversa collect and analyse the data

29 MED1269477
Summary table: Ongoing collections (contains tourism data as a subset)
Name Acronym Publishing agency Comments
Quarterly Earnings and Employment Survey
QES Statistics New Zealand Employment via ANZSIC
Linked Employer/ Employee Data
LEED Statistics New Zealand Employment variables by ANZSIC – only high level information is published. More detailed information and analysis is available via the data laboratory
Longitudinal Business Database
LBD Statistics New Zealand Access is available via the data laboratory. Information on all New Zealand businesses is primarily sourced from AES, tax, business frame and other business datasets. Industry analysis would need to occur via ANZSIC
Productivity Statistics New Zealand Available via sector
Household Expenditure Survey
HES Statistics New Zealand Contains spending by NZHEC classification
Exchange rates
Reserve Bank of New Zealand
Prices data Statistics New Zealand
International data
OECD
Census Statistics New Zealand
Household Labour Force Survey
HLFS Statistics New Zealand
Cultural Experience Survey 2002
Statistics New Zealand A one-off survey conducted in 2002 in conjunction with the Ministry of Cultural Affairs
30 MED1269477
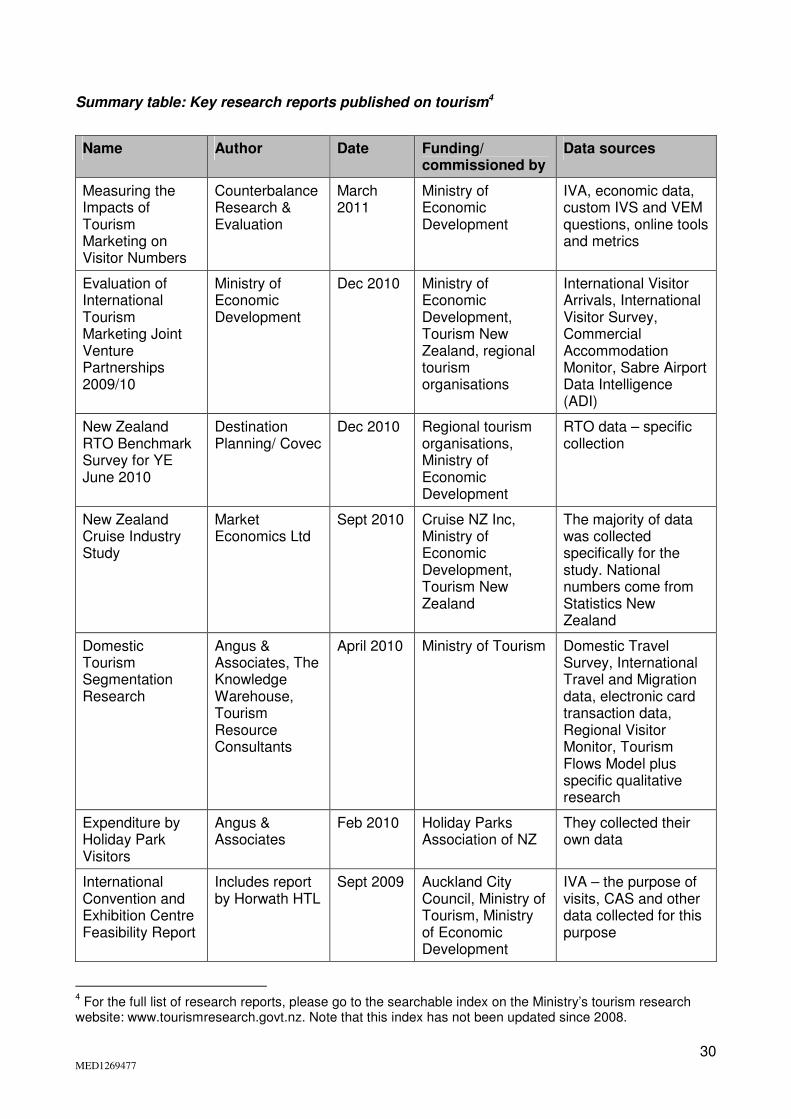
Summary table: Key research reports published on tourism4
Name Author Date Funding/ commissioned by
Data sources
Measuring the Impacts of Tourism Marketing on Visitor Numbers
Counterbalance Research & Evaluation
March 2011
Ministry of Economic Development
IVA, economic data, custom IVS and VEM questions, online tools and metrics
Evaluation of International Tourism Marketing Joint Venture Partnerships 2009/10
Ministry of Economic Development
Dec 2010 Ministry of Economic Development, Tourism New Zealand, regional tourism organisations
International Visitor Arrivals, International Visitor Survey, Commercial Accommodation Monitor, Sabre Airport Data Intelligence (ADI)
New Zealand RTO Benchmark Survey for YE June 2010
Destination Planning/ Covec
Dec 2010 Regional tourism organisations, Ministry of Economic Development
RTO data – specific collection
New Zealand Cruise Industry Study
Market Economics Ltd
Sept 2010 Cruise NZ Inc, Ministry of Economic Development, Tourism New Zealand
The majority of data was collected specifically for the study. National numbers come from Statistics New Zealand
Domestic Tourism Segmentation Research
Angus & Associates, The Knowledge Warehouse, Tourism Resource Consultants
April 2010 Ministry of Tourism Domestic Travel Survey, International Travel and Migration data, electronic card transaction data, Regional Visitor Monitor, Tourism Flows Model plus specific qualitative research
Expenditure by Holiday Park Visitors
Angus & Associates
Feb 2010 Holiday Parks Association of NZ
They collected their own data
International Convention and Exhibition Centre Feasibility Report
Includes report by Horwath HTL
Sept 2009 Auckland City Council, Ministry of Tourism, Ministry of Economic Development
IVA – the purpose of visits, CAS and other data collected for this purpose
4 For the full list of research reports, please go to the searchable index on the Ministry’s tourism research
website: www.tourismresearch.govt.nz. Note that this index has not been updated since 2008.
31 MED1269477
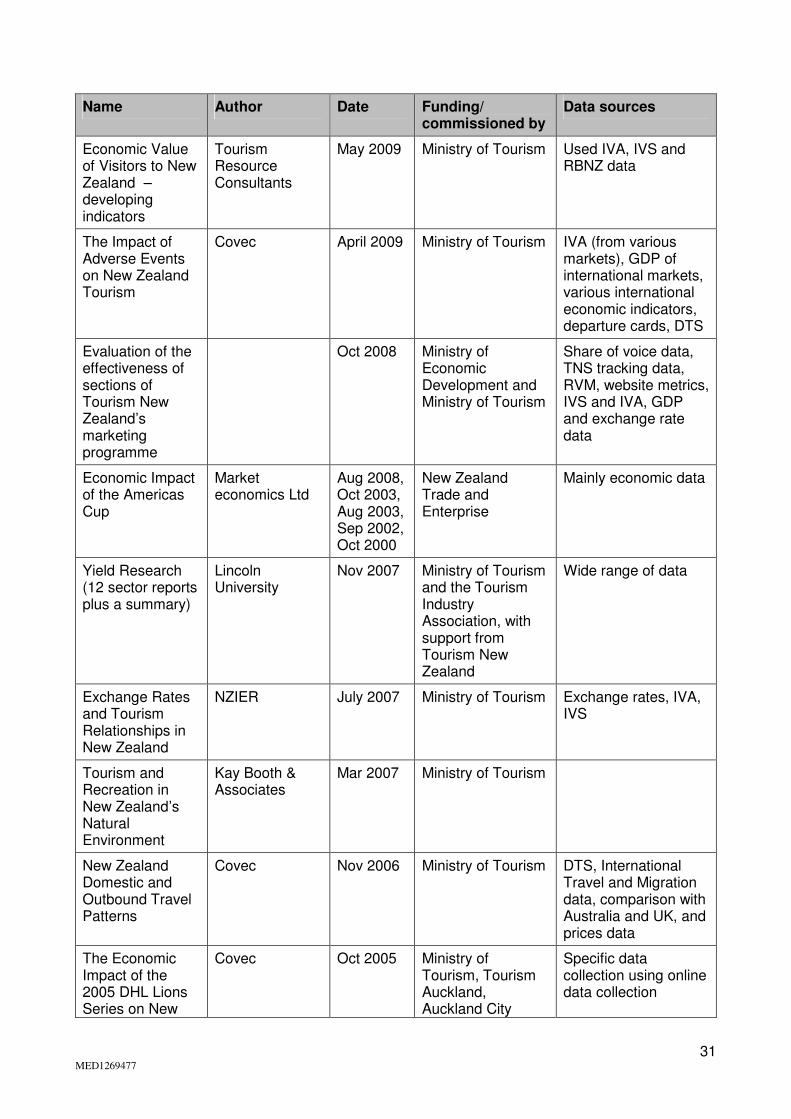
Name Author Date Funding/ commissioned by
Data sources
Economic Value of Visitors to New Zealand – developing indicators
Tourism Resource Consultants
May 2009 Ministry of Tourism Used IVA, IVS and RBNZ data
The Impact of Adverse Events on New Zealand Tourism
Covec April 2009 Ministry of Tourism IVA (from various markets), GDP of international markets, various international economic indicators, departure cards, DTS
Evaluation of the effectiveness of sections of Tourism New Zealand’s marketing programme
Oct 2008 Ministry of Economic Development and Ministry of Tourism
Share of voice data, TNS tracking data, RVM, website metrics, IVS and IVA, GDP and exchange rate data
Economic Impact of the Americas Cup
Market economics Ltd
Aug 2008, Oct 2003, Aug 2003, Sep 2002, Oct 2000
New Zealand Trade and Enterprise
Mainly economic data
Yield Research (12 sector reports plus a summary)
Lincoln University
Nov 2007 Ministry of Tourism and the Tourism Industry Association, with support from Tourism New Zealand
Wide range of data
Exchange Rates and Tourism Relationships in New Zealand
NZIER July 2007 Ministry of Tourism Exchange rates, IVA, IVS
Tourism and Recreation in New Zealand’s Natural Environment
Kay Booth & Associates
Mar 2007 Ministry of Tourism
New Zealand Domestic and Outbound Travel Patterns
Covec Nov 2006 Ministry of Tourism DTS, International Travel and Migration data, comparison with Australia and UK, and prices data
The Economic Impact of the 2005 DHL Lions Series on New
Covec Oct 2005 Ministry of Tourism, Tourism Auckland, Auckland City
Specific data collection using online data collection

32 MED1269477
Name Author Date Funding/ commissioned by
Data sources
Zealand Council and Tourism Dunedin
Māori in Tourism (three reports covering barriers and opportunities, demand and measurement)
Dec 2004, Oct 2004, July 2001
Ministry of Tourism Census, IVS, DTS, Household Labour Force Survey (HLFS), Business Frame, and Cultural Experience Survey 2002
Waters of National Importance for Tourism
Ministry of Tourism
Aug 2004 Ministry of Tourism IVS, DTS (activities data) and numbers
Review of Core Tourism Statistics 2002
Ministry of Tourism
Dec 2002
33 MED1269477
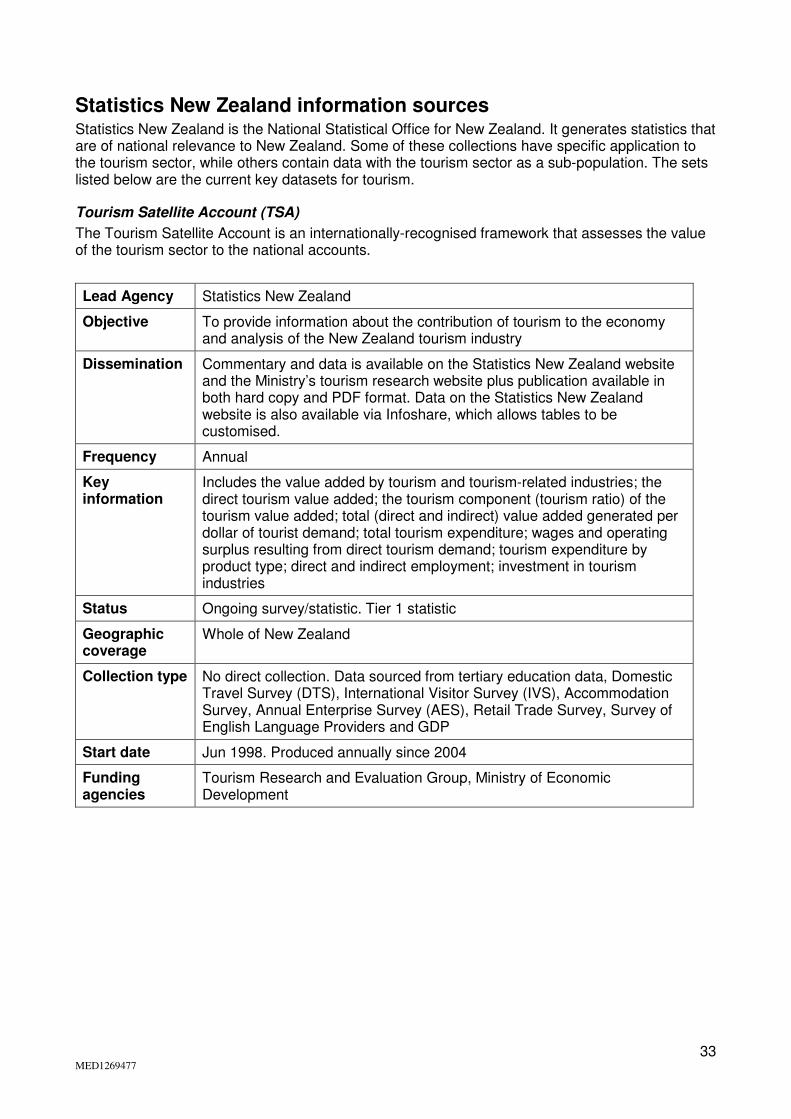
Statistics New Zealand information sources Statistics New Zealand is the National Statistical Office for New Zealand. It generates statistics that are of national relevance to New Zealand. Some of these collections have specific application to the tourism sector, while others contain data with the tourism sector as a sub-population. The sets listed below are the current key datasets for tourism.
Tourism Satellite Account (TSA)
The Tourism Satellite Account is an internationally-recognised framework that assesses the value of the tourism sector to the national accounts.
Lead Agency Statistics New Zealand
Objective To provide information about the contribution of tourism to the economy and analysis of the New Zealand tourism industry
Dissemination Commentary and data is available on the Statistics New Zealand website and the Ministry’s tourism research website plus publication available in both hard copy and PDF format. Data on the Statistics New Zealand website is also available via Infoshare, which allows tables to be customised.
Frequency Annual
Key information
Includes the value added by tourism and tourism-related industries; the direct tourism value added; the tourism component (tourism ratio) of the tourism value added; total (direct and indirect) value added generated per dollar of tourist demand; total tourism expenditure; wages and operating surplus resulting from direct tourism demand; tourism expenditure by product type; direct and indirect employment; investment in tourism industries
Status Ongoing survey/statistic. Tier 1 statistic
Geographic coverage
Whole of New Zealand
Collection type No direct collection. Data sourced from tertiary education data, Domestic Travel Survey (DTS), International Visitor Survey (IVS), Accommodation Survey, Annual Enterprise Survey (AES), Retail Trade Survey, Survey of English Language Providers and GDP
Start date Jun 1998. Produced annually since 2004
Funding agencies
Tourism Research and Evaluation Group, Ministry of Economic Development
34 MED1269477
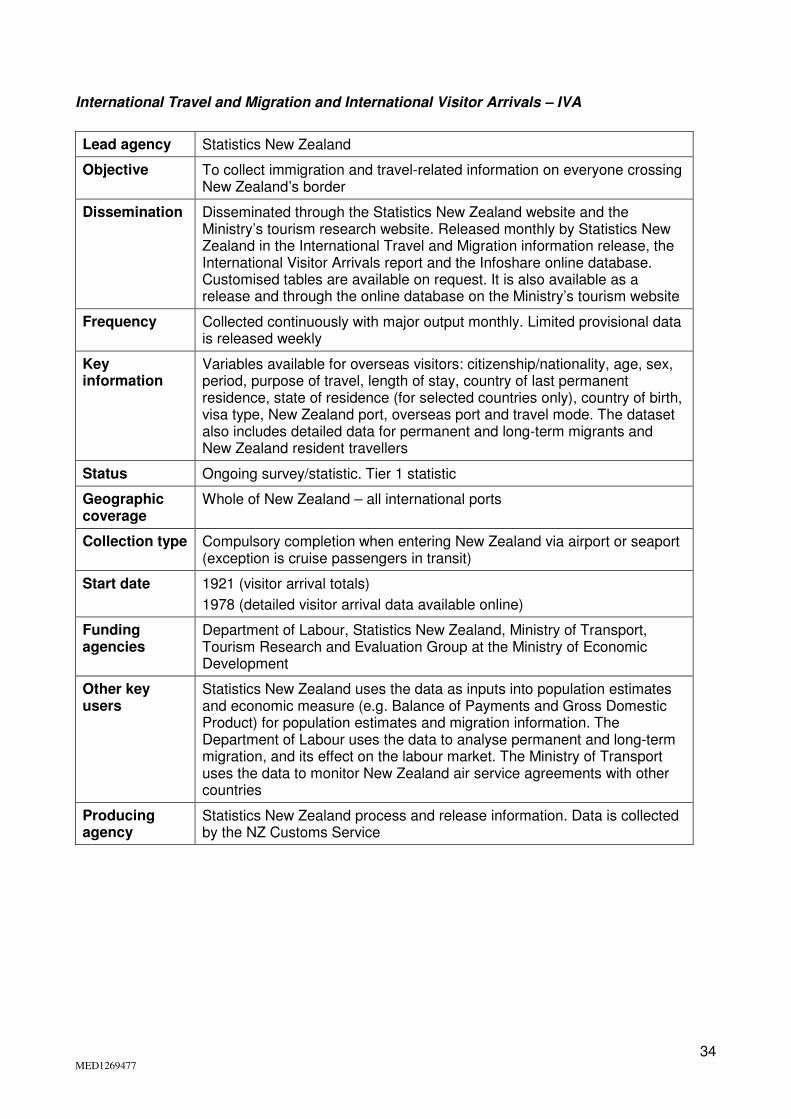
International Travel and Migration and International Visitor Arrivals – IVA
Lead agency Statistics New Zealand
Objective To collect immigration and travel-related information on everyone crossing New Zealand’s border
Dissemination Disseminated through the Statistics New Zealand website and the Ministry’s tourism research website. Released monthly by Statistics New Zealand in the International Travel and Migration information release, the International Visitor Arrivals report and the Infoshare online database. Customised tables are available on request. It is also available as a release and through the online database on the Ministry’s tourism website
Frequency Collected continuously with major output monthly. Limited provisional data is released weekly
Key information
Variables available for overseas visitors: citizenship/nationality, age, sex, period, purpose of travel, length of stay, country of last permanent residence, state of residence (for selected countries only), country of birth, visa type, New Zealand port, overseas port and travel mode. The dataset also includes detailed data for permanent and long-term migrants and New Zealand resident travellers
Status Ongoing survey/statistic. Tier 1 statistic
Geographic coverage
Whole of New Zealand – all international ports
Collection type Compulsory completion when entering New Zealand via airport or seaport (exception is cruise passengers in transit)
Start date 1921 (visitor arrival totals)
1978 (detailed visitor arrival data available online)
Funding agencies
Department of Labour, Statistics New Zealand, Ministry of Transport, Tourism Research and Evaluation Group at the Ministry of Economic Development
Other key users
Statistics New Zealand uses the data as inputs into population estimates and economic measure (e.g. Balance of Payments and Gross Domestic Product) for population estimates and migration information. The Department of Labour uses the data to analyse permanent and long-term migration, and its effect on the labour market. The Ministry of Transport uses the data to monitor New Zealand air service agreements with other countries
Producing agency
Statistics New Zealand process and release information. Data is collected by the NZ Customs Service

35 MED1269477
Commercial Accommodation Monitor (CAM)
Lead agency Tourism Strategy Group, Ministry of Economic Development
Objective To collect statistical data on the supply and demand of commercial short-term accommodation (less than one month) – including hotels, motels, backpackers, hostels, and caravan and camping grounds
Dissemination Statistics New Zealand website and the Ministry’s tourism research website
Frequency Monthly
Key information
Monthly data on guest nights, occupancy rates (excluding parks/camping grounds), capacity, number of establishments, average stay by accommodation type. Data can be disaggregated by regional council, territorial authority or regional tourism organisation and by accommodation type
Status Ongoing survey/statistic. Removed from Tier 1 list in 2011 version
Geographic coverage
Whole of New Zealand
Collection type Compulsory monthly survey for GST-registered commercial accommodation with an annual turnover of $30,000 or greater (response rate between 75 percent and 85 percent)
Start date July 1996 – time series available online
Funding agencies
Tourism Research and Evaluation Group, Ministry of Economic Development
Producing agency
Statistics New Zealand
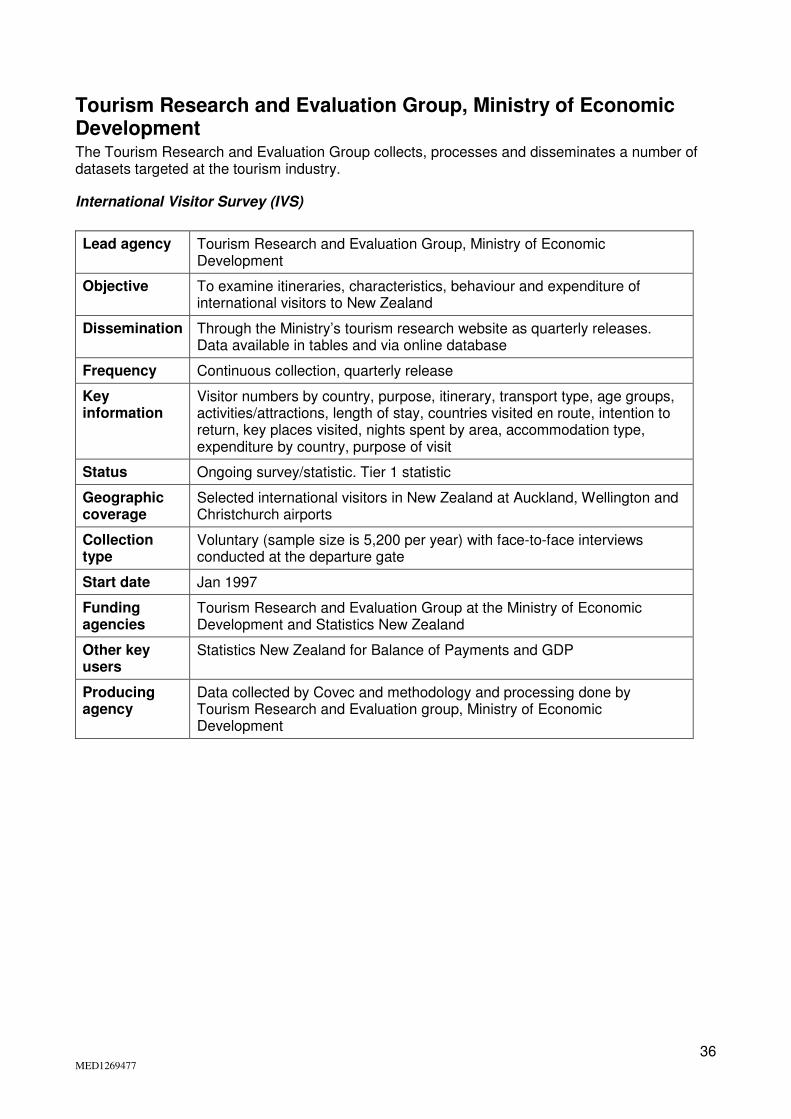
36 MED1269477
Tourism Research and Evaluation Group, Ministry of Economic Development The Tourism Research and Evaluation Group collects, processes and disseminates a number of datasets targeted at the tourism industry.
International Visitor Survey (IVS)
Lead agency Tourism Research and Evaluation Group, Ministry of Economic Development
Objective To examine itineraries, characteristics, behaviour and expenditure of international visitors to New Zealand
Dissemination Through the Ministry’s tourism research website as quarterly releases. Data available in tables and via online database
Frequency Continuous collection, quarterly release
Key information
Visitor numbers by country, purpose, itinerary, transport type, age groups, activities/attractions, length of stay, countries visited en route, intention to return, key places visited, nights spent by area, accommodation type, expenditure by country, purpose of visit
Status Ongoing survey/statistic. Tier 1 statistic
Geographic coverage
Selected international visitors in New Zealand at Auckland, Wellington and Christchurch airports
Collection type
Voluntary (sample size is 5,200 per year) with face-to-face interviews conducted at the departure gate
Start date Jan 1997
Funding agencies
Tourism Research and Evaluation Group at the Ministry of Economic Development and Statistics New Zealand
Other key users
Statistics New Zealand for Balance of Payments and GDP
Producing agency
Data collected by Covec and methodology and processing done by Tourism Research and Evaluation group, Ministry of Economic Development
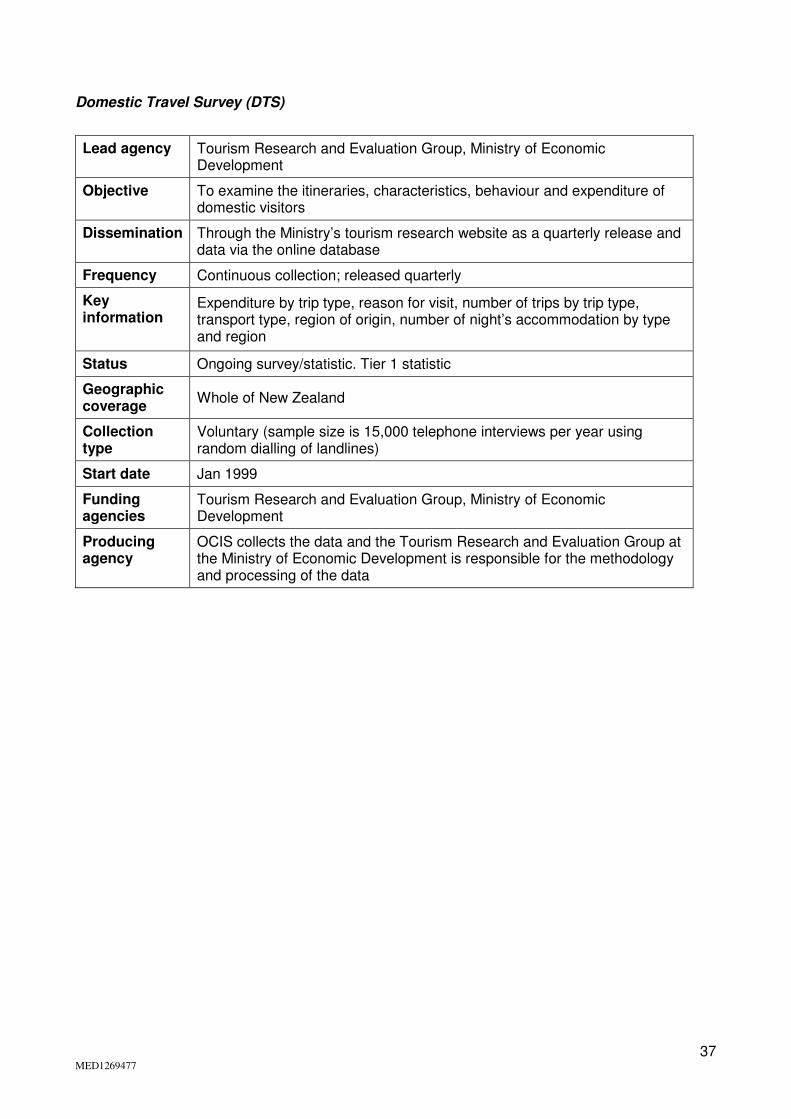
37 MED1269477
Domestic Travel Survey (DTS)
Lead agency Tourism Research and Evaluation Group, Ministry of Economic Development
Objective To examine the itineraries, characteristics, behaviour and expenditure of domestic visitors
Dissemination Through the Ministry’s tourism research website as a quarterly release and data via the online database
Frequency Continuous collection; released quarterly
Key information
Expenditure by trip type, reason for visit, number of trips by trip type, transport type, region of origin, number of night’s accommodation by type and region
Status Ongoing survey/statistic. Tier 1 statistic
Geographic coverage
Whole of New Zealand
Collection type
Voluntary (sample size is 15,000 telephone interviews per year using random dialling of landlines)
Start date Jan 1999
Funding agencies
Tourism Research and Evaluation Group, Ministry of Economic Development
Producing agency
OCIS collects the data and the Tourism Research and Evaluation Group at the Ministry of Economic Development is responsible for the methodology and processing of the data
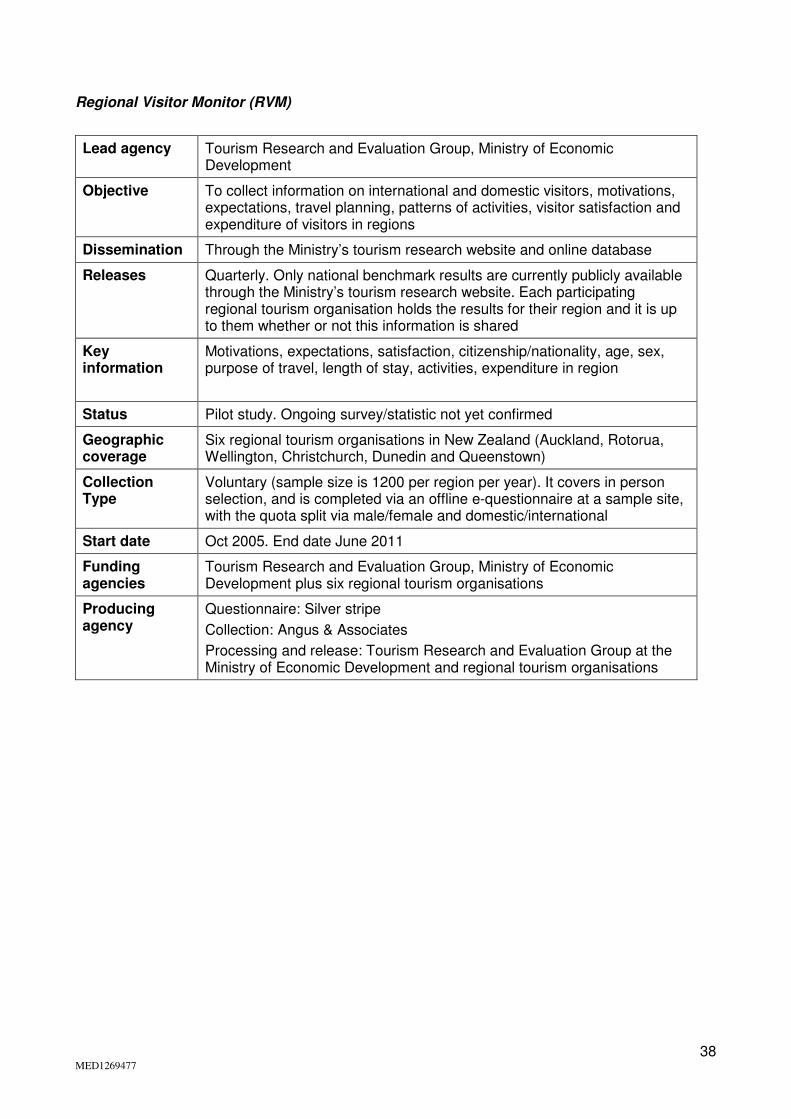
38 MED1269477
Regional Visitor Monitor (RVM)
Lead agency Tourism Research and Evaluation Group, Ministry of Economic Development
Objective To collect information on international and domestic visitors, motivations, expectations, travel planning, patterns of activities, visitor satisfaction and expenditure of visitors in regions
Dissemination Through the Ministry’s tourism research website and online database
Releases Quarterly. Only national benchmark results are currently publicly available through the Ministry’s tourism research website. Each participating regional tourism organisation holds the results for their region and it is up to them whether or not this information is shared
Key information
Motivations, expectations, satisfaction, citizenship/nationality, age, sex, purpose of travel, length of stay, activities, expenditure in region
Status Pilot study. Ongoing survey/statistic not yet confirmed
Geographic coverage
Six regional tourism organisations in New Zealand (Auckland, Rotorua, Wellington, Christchurch, Dunedin and Queenstown)
Collection Type
Voluntary (sample size is 1200 per region per year). It covers in person selection, and is completed via an offline e-questionnaire at a sample site, with the quota split via male/female and domestic/international
Start date Oct 2005. End date June 2011
Funding agencies
Tourism Research and Evaluation Group, Ministry of Economic Development plus six regional tourism organisations
Producing agency
Questionnaire: Silver stripe
Collection: Angus & Associates
Processing and release: Tourism Research and Evaluation Group at the Ministry of Economic Development and regional tourism organisations
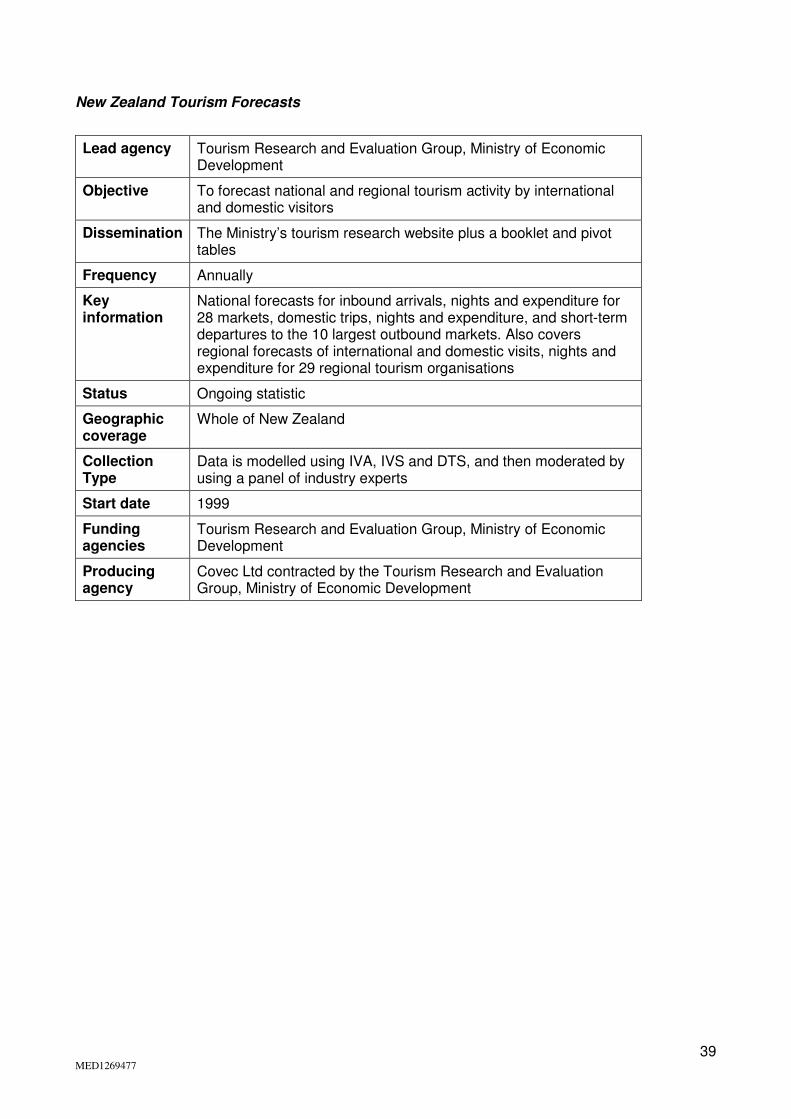
39 MED1269477
New Zealand Tourism Forecasts
Lead agency Tourism Research and Evaluation Group, Ministry of Economic Development
Objective To forecast national and regional tourism activity by international and domestic visitors
Dissemination The Ministry’s tourism research website plus a booklet and pivot tables
Frequency Annually
Key information
National forecasts for inbound arrivals, nights and expenditure for 28 markets, domestic trips, nights and expenditure, and short-term departures to the 10 largest outbound markets. Also covers regional forecasts of international and domestic visits, nights and expenditure for 29 regional tourism organisations
Status Ongoing statistic
Geographic coverage
Whole of New Zealand
Collection Type
Data is modelled using IVA, IVS and DTS, and then moderated by using a panel of industry experts
Start date 1999
Funding agencies
Tourism Research and Evaluation Group, Ministry of Economic Development
Producing agency
Covec Ltd contracted by the Tourism Research and Evaluation Group, Ministry of Economic Development
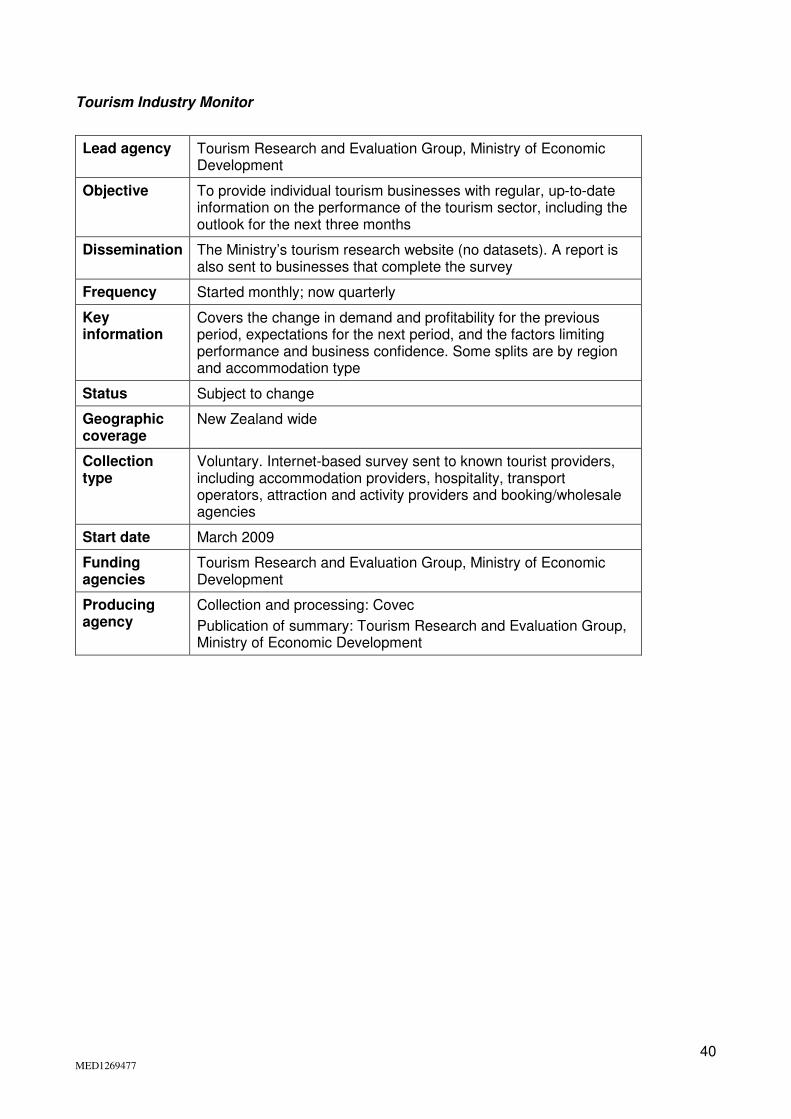
40 MED1269477
Tourism Industry Monitor
Lead agency Tourism Research and Evaluation Group, Ministry of Economic Development
Objective To provide individual tourism businesses with regular, up-to-date information on the performance of the tourism sector, including the outlook for the next three months
Dissemination The Ministry’s tourism research website (no datasets). A report is also sent to businesses that complete the survey
Frequency Started monthly; now quarterly
Key information
Covers the change in demand and profitability for the previous period, expectations for the next period, and the factors limiting performance and business confidence. Some splits are by region and accommodation type
Status Subject to change
Geographic coverage
New Zealand wide
Collection type
Voluntary. Internet-based survey sent to known tourist providers, including accommodation providers, hospitality, transport operators, attraction and activity providers and booking/wholesale agencies
Start date March 2009
Funding agencies
Tourism Research and Evaluation Group, Ministry of Economic Development
Producing agency
Collection and processing: Covec
Publication of summary: Tourism Research and Evaluation Group, Ministry of Economic Development
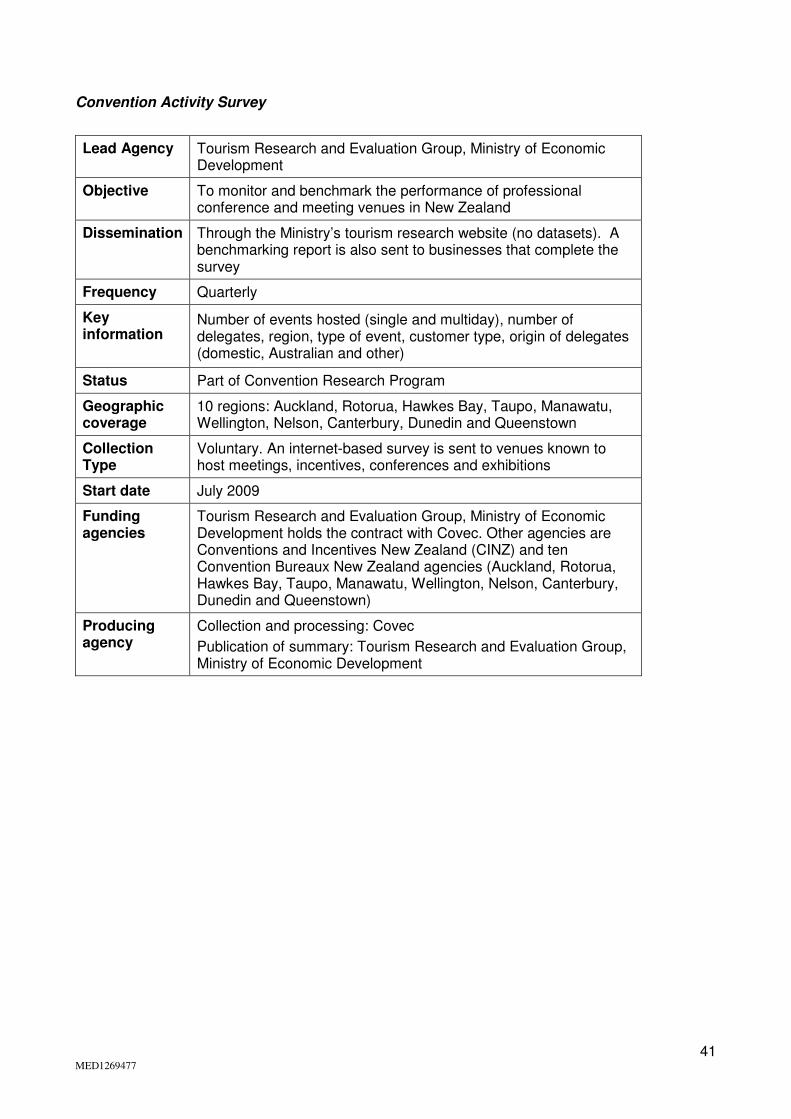
41 MED1269477
Convention Activity Survey
Lead Agency Tourism Research and Evaluation Group, Ministry of Economic Development
Objective To monitor and benchmark the performance of professional conference and meeting venues in New Zealand
Dissemination Through the Ministry’s tourism research website (no datasets). A benchmarking report is also sent to businesses that complete the survey
Frequency Quarterly
Key information
Number of events hosted (single and multiday), number of delegates, region, type of event, customer type, origin of delegates (domestic, Australian and other)
Status Part of Convention Research Program
Geographic coverage
10 regions: Auckland, Rotorua, Hawkes Bay, Taupo, Manawatu, Wellington, Nelson, Canterbury, Dunedin and Queenstown
Collection Type
Voluntary. An internet-based survey is sent to venues known to host meetings, incentives, conferences and exhibitions
Start date July 2009
Funding agencies
Tourism Research and Evaluation Group, Ministry of Economic Development holds the contract with Covec. Other agencies are Conventions and Incentives New Zealand (CINZ) and ten Convention Bureaux New Zealand agencies (Auckland, Rotorua, Hawkes Bay, Taupo, Manawatu, Wellington, Nelson, Canterbury, Dunedin and Queenstown)
Producing agency
Collection and processing: Covec
Publication of summary: Tourism Research and Evaluation Group, Ministry of Economic Development

42 MED1269477
Convention Delegates Survey
Lead agency Tourism Research and Evaluation Group, Ministry of Economic Development
Objective Collect expenditure data from multi-day delegates
Dissemination The Ministry’s tourism research website (no datasets)
Frequency Annual
Key information
Number of nights, customer type, type of event, origin of delegates (domestic, international, spend by activity type)
Status Part of Convention Research Program
Geographic coverage
Delegates from 10 regions: Auckland, Rotorua, Hawkes Bay, Taupo, Manawatu, Wellington, Nelson, Canterbury, Dunedin and Queenstown
Collection Type
Voluntary. An internet-based survey is sent to delegates known to have attended a meeting, incentive, conference or exhibition identified in the CAS
Start date July 2009
Funding agencies
The Tourism Research and Evaluation Group at the Ministry of Economic Development holds the contract with Covec. Other agencies are Conventions and Incentives New Zealand (CINZ) and ten Convention Bureaux New Zealand agencies (Auckland, Rotorua, Hawkes Bay, Taupo, Manawatu, Wellington, Nelson, Canterbury, Dunedin and Queenstown)
Producing agency
Collection and processing: Covec
Publication of summary: Tourism Research and Evaluation Group, Ministry of Economic Development
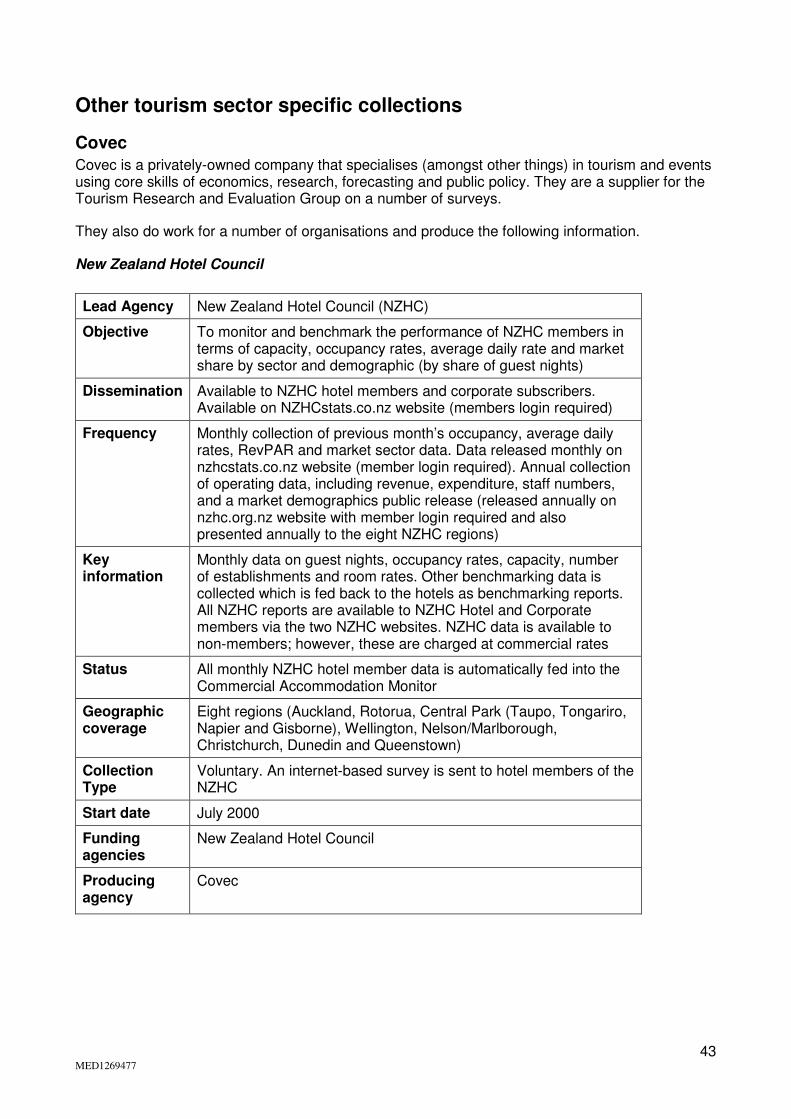
43 MED1269477
Other tourism sector specific collections
Covec
Covec is a privately-owned company that specialises (amongst other things) in tourism and events using core skills of economics, research, forecasting and public policy. They are a supplier for the Tourism Research and Evaluation Group on a number of surveys.
They also do work for a number of organisations and produce the following information.
New Zealand Hotel Council
Lead Agency New Zealand Hotel Council (NZHC)
Objective To monitor and benchmark the performance of NZHC members in terms of capacity, occupancy rates, average daily rate and market share by sector and demographic (by share of guest nights)
Dissemination Available to NZHC hotel members and corporate subscribers. Available on NZHCstats.co.nz website (members login required)
Frequency Monthly collection of previous month’s occupancy, average daily rates, RevPAR and market sector data. Data released monthly on nzhcstats.co.nz website (member login required). Annual collection of operating data, including revenue, expenditure, staff numbers, and a market demographics public release (released annually on nzhc.org.nz website with member login required and also presented annually to the eight NZHC regions)
Key information
Monthly data on guest nights, occupancy rates, capacity, number of establishments and room rates. Other benchmarking data is collected which is fed back to the hotels as benchmarking reports. All NZHC reports are available to NZHC Hotel and Corporate members via the two NZHC websites. NZHC data is available to non-members; however, these are charged at commercial rates
Status All monthly NZHC hotel member data is automatically fed into the Commercial Accommodation Monitor
Geographic coverage
Eight regions (Auckland, Rotorua, Central Park (Taupo, Tongariro, Napier and Gisborne), Wellington, Nelson/Marlborough, Christchurch, Dunedin and Queenstown)
Collection Type
Voluntary. An internet-based survey is sent to hotel members of the NZHC
Start date July 2000
Funding agencies
New Zealand Hotel Council
Producing agency
Covec
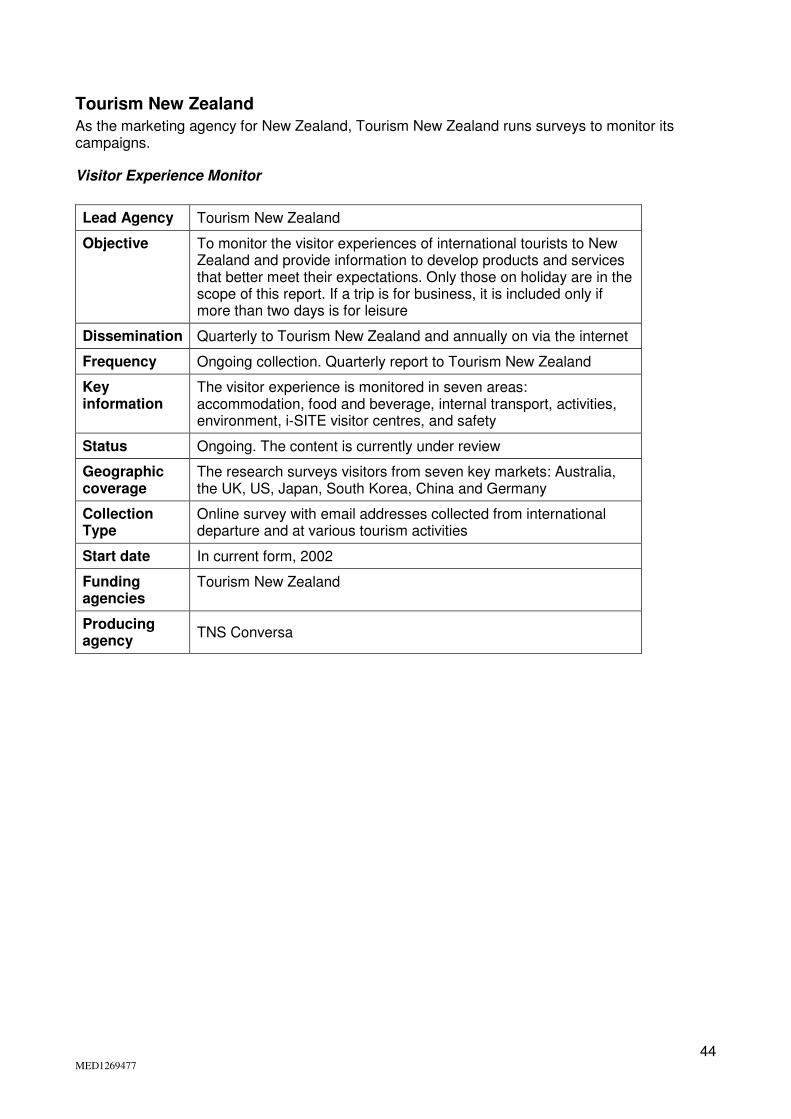
44 MED1269477
Tourism New Zealand
As the marketing agency for New Zealand, Tourism New Zealand runs surveys to monitor its campaigns.
Visitor Experience Monitor
Lead Agency Tourism New Zealand
Objective To monitor the visitor experiences of international tourists to New Zealand and provide information to develop products and services that better meet their expectations. Only those on holiday are in the scope of this report. If a trip is for business, it is included only if more than two days is for leisure
Dissemination Quarterly to Tourism New Zealand and annually on via the internet
Frequency Ongoing collection. Quarterly report to Tourism New Zealand
Key information
The visitor experience is monitored in seven areas: accommodation, food and beverage, internal transport, activities, environment, i-SITE visitor centres, and safety
Status Ongoing. The content is currently under review
Geographic coverage
The research surveys visitors from seven key markets: Australia, the UK, US, Japan, South Korea, China and Germany
Collection Type
Online survey with email addresses collected from international departure and at various tourism activities
Start date In current form, 2002
Funding agencies
Tourism New Zealand
Producing agency
TNS Conversa
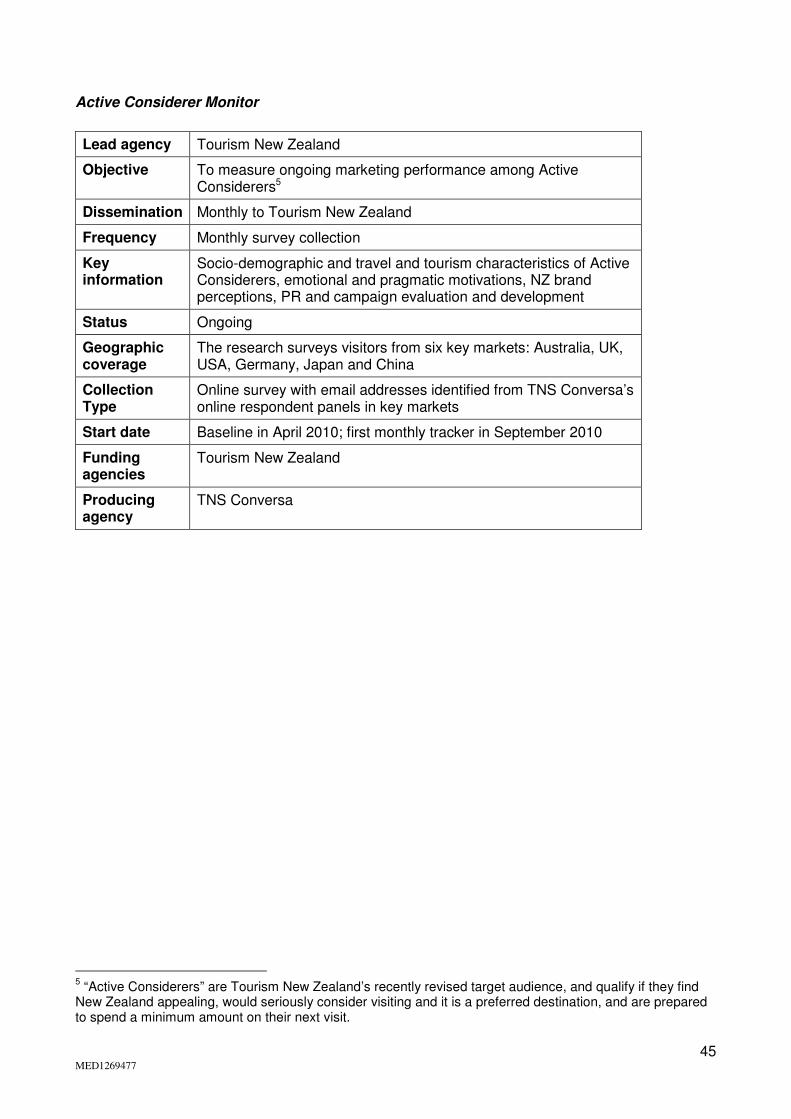
45 MED1269477
Active Considerer Monitor
Lead agency Tourism New Zealand
Objective To measure ongoing marketing performance among Active Considerers5
Dissemination Monthly to Tourism New Zealand
Frequency Monthly survey collection
Key information
Socio-demographic and travel and tourism characteristics of Active Considerers, emotional and pragmatic motivations, NZ brand perceptions, PR and campaign evaluation and development
Status Ongoing
Geographic coverage
The research surveys visitors from six key markets: Australia, UK, USA, Germany, Japan and China
Collection Type
Online survey with email addresses identified from TNS Conversa’s online respondent panels in key markets
Start date Baseline in April 2010; first monthly tracker in September 2010
Funding agencies
Tourism New Zealand
Producing agency
TNS Conversa
5 “Active Considerers” are Tourism New Zealand’s recently revised target audience, and qualify if they find
New Zealand appealing, would seriously consider visiting and it is a preferred destination, and are prepared to spend a minimum amount on their next visit.
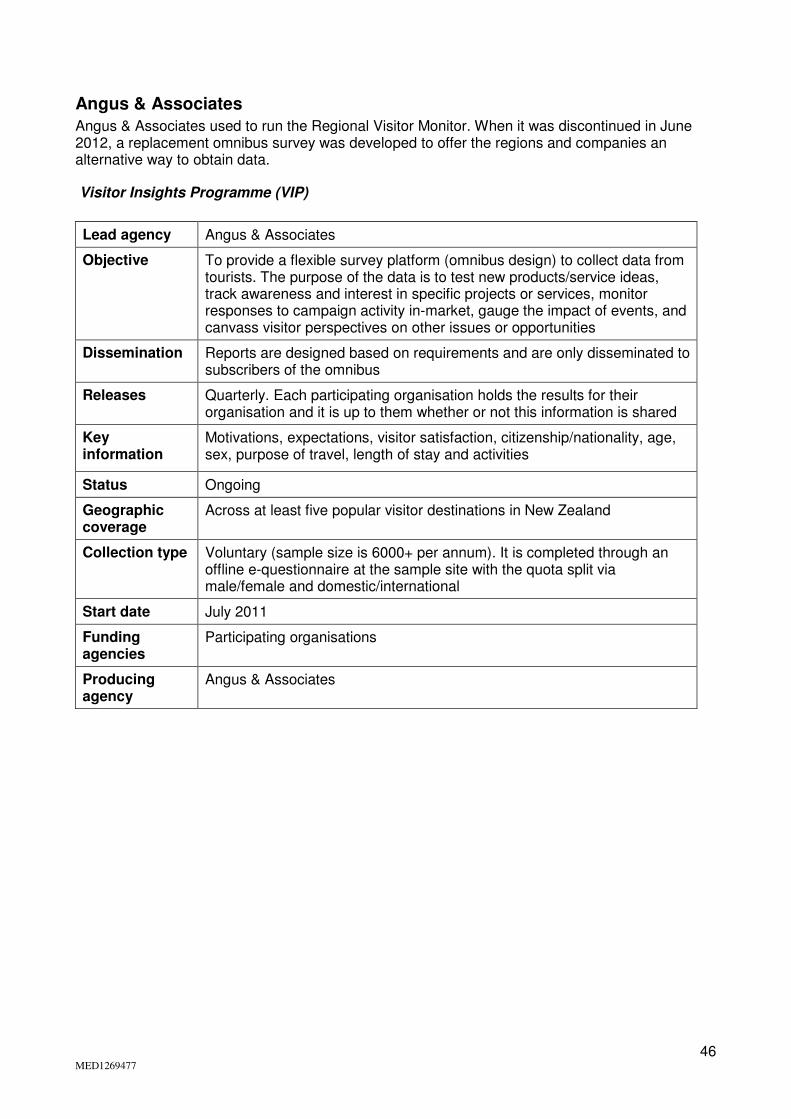
46 MED1269477
Angus & Associates
Angus & Associates used to run the Regional Visitor Monitor. When it was discontinued in June 2012, a replacement omnibus survey was developed to offer the regions and companies an alternative way to obtain data.
Visitor Insights Programme (VIP)
Lead agency Angus & Associates
Objective To provide a flexible survey platform (omnibus design) to collect data from tourists. The purpose of the data is to test new products/service ideas, track awareness and interest in specific projects or services, monitor responses to campaign activity in-market, gauge the impact of events, and canvass visitor perspectives on other issues or opportunities
Dissemination Reports are designed based on requirements and are only disseminated to subscribers of the omnibus
Releases Quarterly. Each participating organisation holds the results for their organisation and it is up to them whether or not this information is shared
Key information
Motivations, expectations, visitor satisfaction, citizenship/nationality, age, sex, purpose of travel, length of stay and activities
Status Ongoing
Geographic coverage
Across at least five popular visitor destinations in New Zealand
Collection type Voluntary (sample size is 6000+ per annum). It is completed through an offline e-questionnaire at the sample site with the quota split via male/female and domestic/international
Start date July 2011
Funding agencies
Participating organisations
Producing agency
Angus & Associates
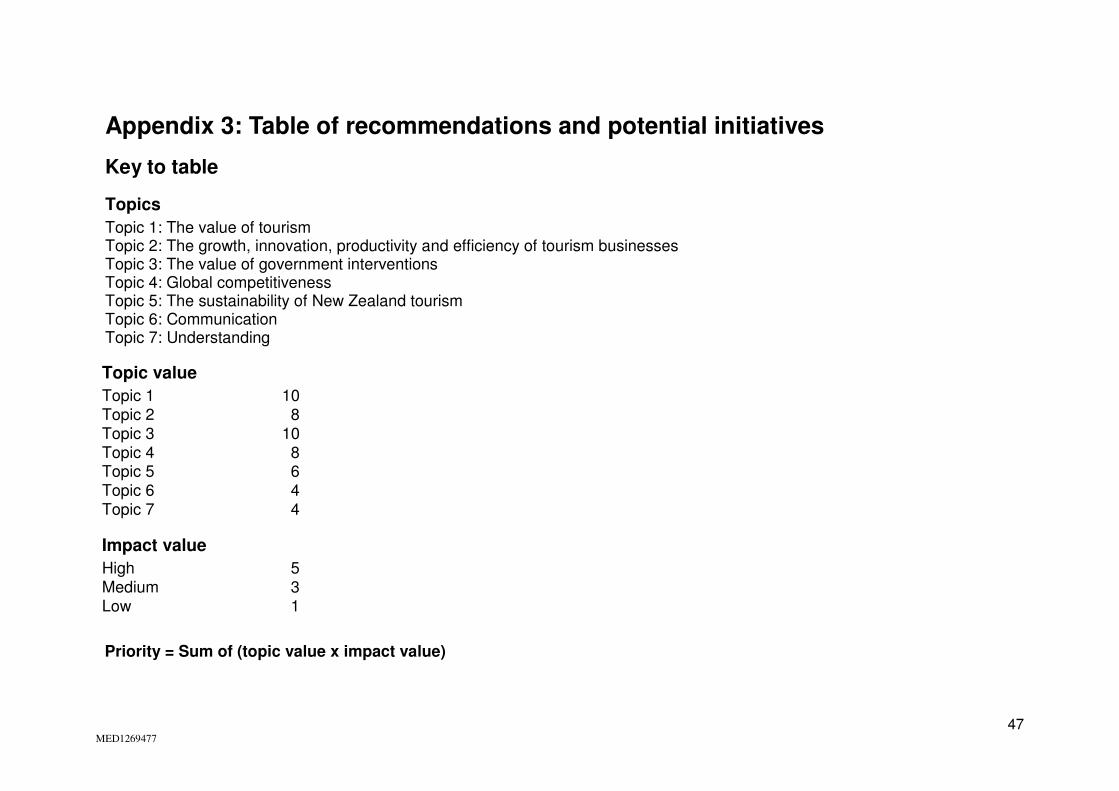
47 MED1269477
Appendix 3: Table of recommendations and potential initiatives
Key to table
Topics
Topic 1: The value of tourism Topic 2: The growth, innovation, productivity and efficiency of tourism businesses Topic 3: The value of government interventions Topic 4: Global competitiveness Topic 5: The sustainability of New Zealand tourism Topic 6: Communication Topic 7: Understanding
Topic value
Topic 1 10 Topic 2 8 Topic 3 10 Topic 4 8 Topic 5 6 Topic 6 4 Topic 7 4
Impact value
High 5 Medium 3 Low 1
Priority = Sum of (topic value x impact value)
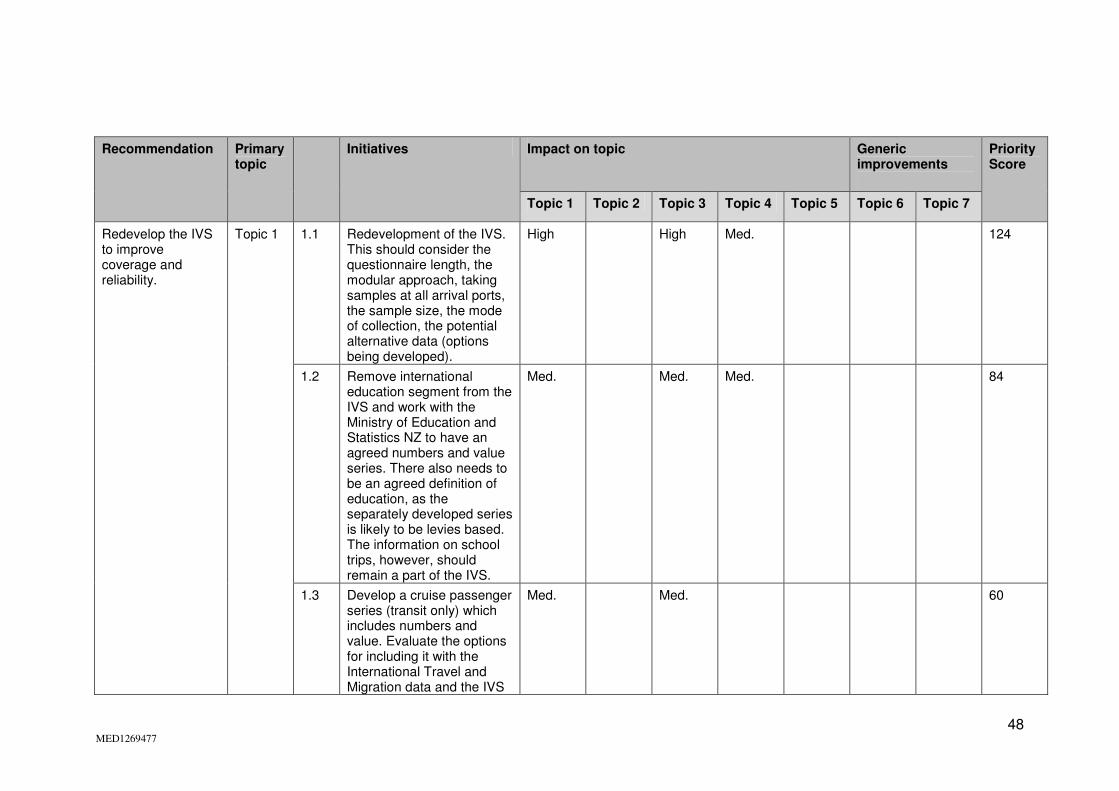
48 MED1269477
Recommendation Primary topic
Initiatives Impact on topic Generic improvements
Priority Score
Topic 1 Topic 2 Topic 3 Topic 4 Topic 5 Topic 6 Topic 7
Redevelop the IVS to improve coverage and reliability.
Topic 1 1.1 Redevelopment of the IVS. This should consider the questionnaire length, the modular approach, taking samples at all arrival ports, the sample size, the mode of collection, the potential alternative data (options being developed).
High High Med. 124
1.2 Remove international education segment from the IVS and work with the Ministry of Education and Statistics NZ to have an agreed numbers and value series. There also needs to be an agreed definition of education, as the separately developed series is likely to be levies based. The information on school trips, however, should remain a part of the IVS.
Med. Med. Med. 84
1.3 Develop a cruise passenger series (transit only) which includes numbers and value. Evaluate the options for including it with the International Travel and Migration data and the IVS
Med. Med. 60
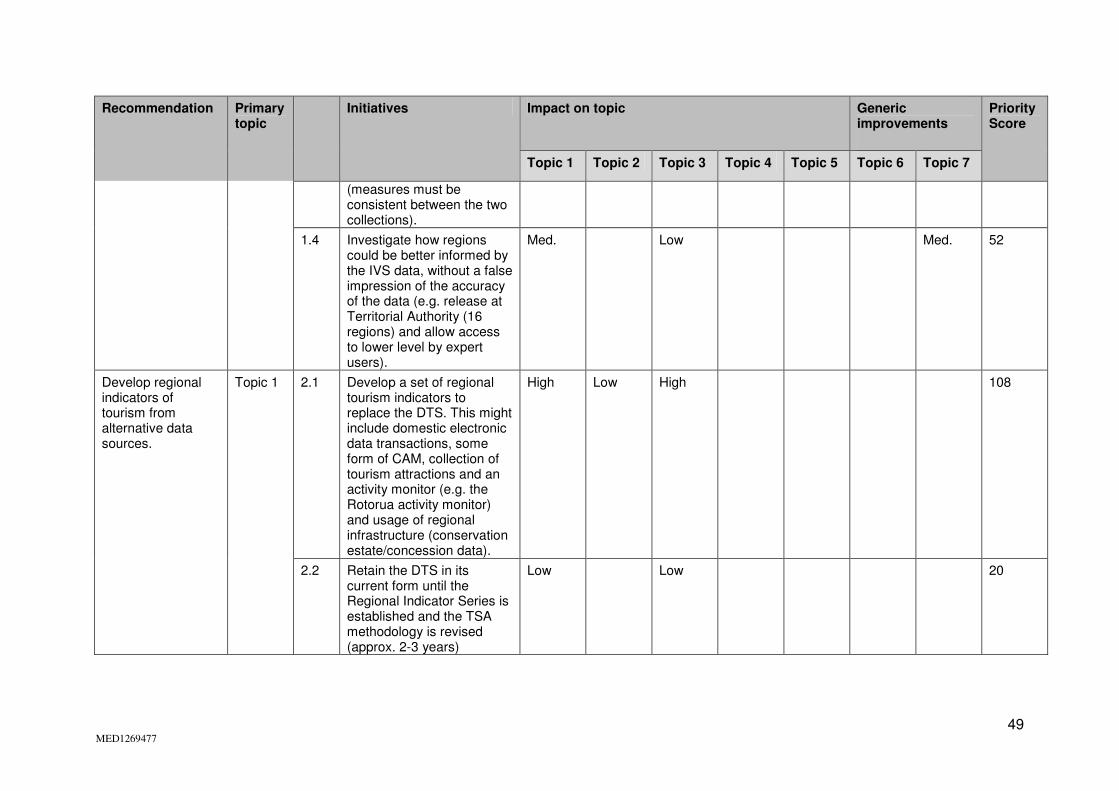
49 MED1269477
Recommendation Primary topic
Initiatives Impact on topic Generic improvements
Priority Score
Topic 1 Topic 2 Topic 3 Topic 4 Topic 5 Topic 6 Topic 7
(measures must be consistent between the two collections).
1.4 Investigate how regions could be better informed by the IVS data, without a false impression of the accuracy of the data (e.g. release at Territorial Authority (16 regions) and allow access to lower level by expert users).
Med. Low Med. 52
Develop regional indicators of tourism from alternative data sources.
Topic 1 2.1 Develop a set of regional tourism indicators to replace the DTS. This might include domestic electronic data transactions, some form of CAM, collection of tourism attractions and an activity monitor (e.g. the Rotorua activity monitor) and usage of regional infrastructure (conservation estate/concession data).
High Low High 108
2.2 Retain the DTS in its current form until the Regional Indicator Series is established and the TSA methodology is revised (approx. 2-3 years)
Low Low 20

50 MED1269477
Recommendation Primary topic
Initiatives Impact on topic Generic improvements
Priority Score
Topic 1 Topic 2 Topic 3 Topic 4 Topic 5 Topic 6 Topic 7
Use the Statistics New Zealand business data to develop an understanding of the value of the various tourism sectors, including the generation of tourism and Māori business flags. The data should be considered from both a revenue and employment perspective.
Topic 1 3 Develop flags for tourism and Māori businesses within the Statistics New Zealand business dataset. By looking at various aspects of firm performance within this dataset, identify business groupings that have high contributions to the tourism sector and analyse size and growth rates and the characteristics that influence this.
High High 90
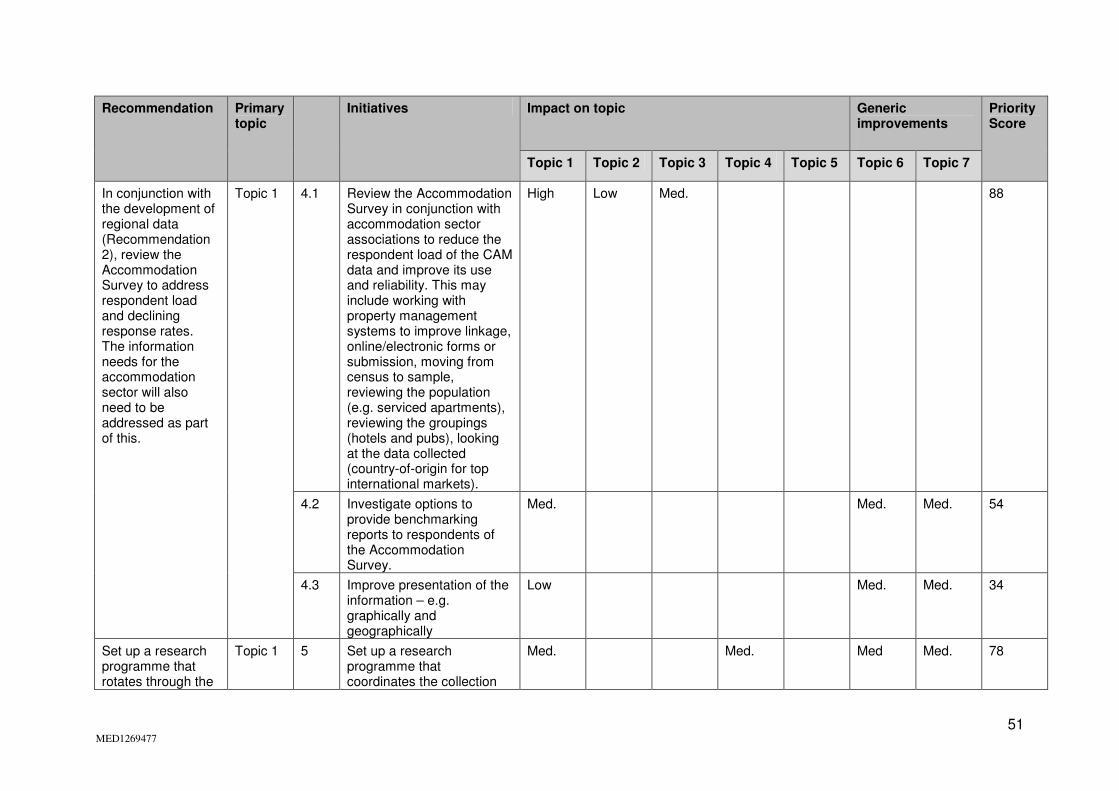
51 MED1269477
Recommendation Primary topic
Initiatives Impact on topic Generic improvements
Priority Score
Topic 1 Topic 2 Topic 3 Topic 4 Topic 5 Topic 6 Topic 7
In conjunction with the development of regional data (Recommendation 2), review the Accommodation Survey to address respondent load and declining response rates. The information needs for the accommodation sector will also need to be addressed as part of this.
Topic 1 4.1 Review the Accommodation Survey in conjunction with accommodation sector associations to reduce the respondent load of the CAM data and improve its use and reliability. This may include working with property management systems to improve linkage, online/electronic forms or submission, moving from census to sample, reviewing the population (e.g. serviced apartments), reviewing the groupings (hotels and pubs), looking at the data collected (country-of-origin for top international markets).
High Low Med. 88
4.2 Investigate options to provide benchmarking reports to respondents of the Accommodation Survey.
Med. Med. Med. 54
4.3 Improve presentation of the information – e.g. graphically and geographically
Low Med. Med. 34
Set up a research programme that rotates through the
Topic 1 5 Set up a research programme that coordinates the collection
Med. Med. Med Med. 78
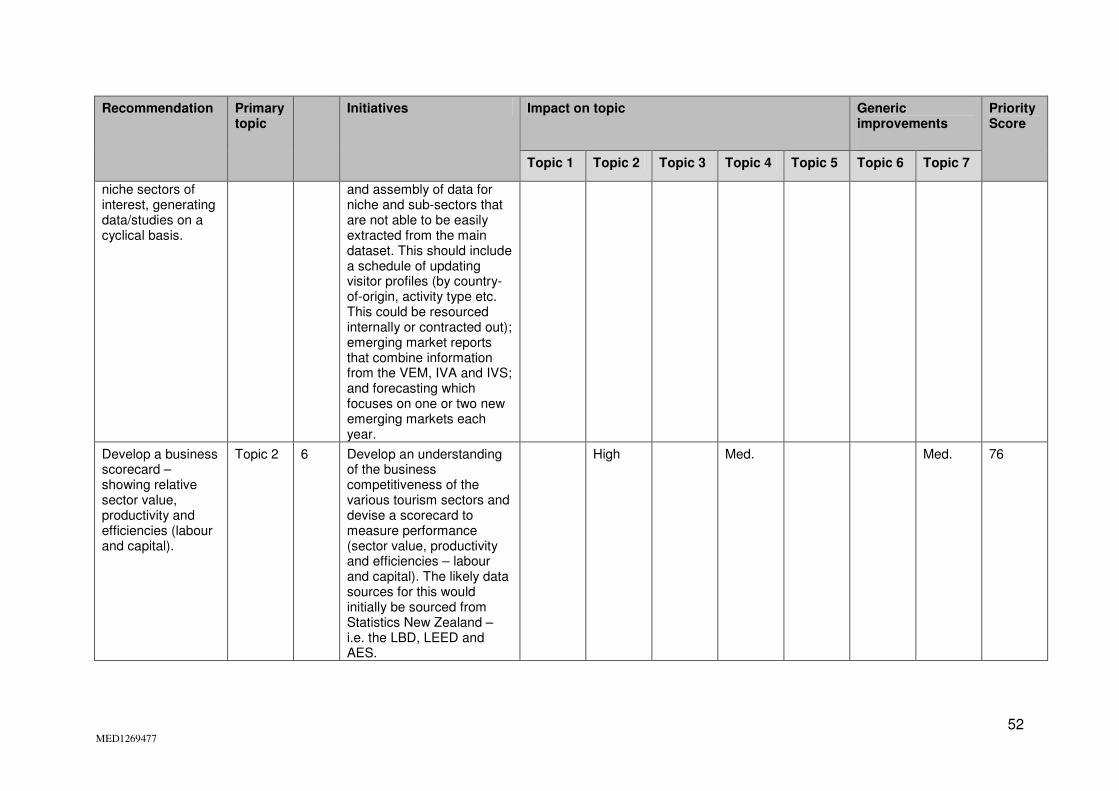
52 MED1269477
Recommendation Primary topic
Initiatives Impact on topic Generic improvements
Priority Score
Topic 1 Topic 2 Topic 3 Topic 4 Topic 5 Topic 6 Topic 7
niche sectors of interest, generating data/studies on a cyclical basis.
and assembly of data for niche and sub-sectors that are not able to be easily extracted from the main dataset. This should include a schedule of updating visitor profiles (by country-of-origin, activity type etc. This could be resourced internally or contracted out); emerging market reports that combine information from the VEM, IVA and IVS; and forecasting which focuses on one or two new emerging markets each year.
Develop a business scorecard – showing relative sector value, productivity and efficiencies (labour and capital).
Topic 2 6 Develop an understanding of the business competitiveness of the various tourism sectors and devise a scorecard to measure performance (sector value, productivity and efficiencies – labour and capital). The likely data sources for this would initially be sourced from Statistics New Zealand – i.e. the LBD, LEED and AES.
High Med. Med. 76

53 MED1269477
Recommendation Primary topic
Initiatives Impact on topic Generic improvements
Priority Score
Topic 1 Topic 2 Topic 3 Topic 4 Topic 5 Topic 6 Topic 7
Develop an agreed methodology for determining return on investment (ROI), addressing the issues of indirect returns as well as estimation of the incremental benefit that results from an investment.
Topic 3 7 Develop a methodology and a better understanding of ROI measurements – especially the indirect and hard-to-measure impacts. This would need to be done alongside other government agencies.
High Low 54
Develop datasets that contain satisfaction and other decision data across appropriate collections. Ensure that the data is as aligned and available as other types of data.
Topic 4 8.1 Improve communication with industry on the data that the VEM contains, including providing links from the Ministry’s tourism research website to TNZ, and making a subset of data available on the website.
High Med. 52
8.2 In conjunction with Tourism New Zealand, investigate providing VEM tables of data to allow more exploration of the data for other purposes. It could also be combined with IVA and IVS type data. This could include a subset of questions, a delayed release for commercial reasons, or a requirement
Med. Med. Med. 66
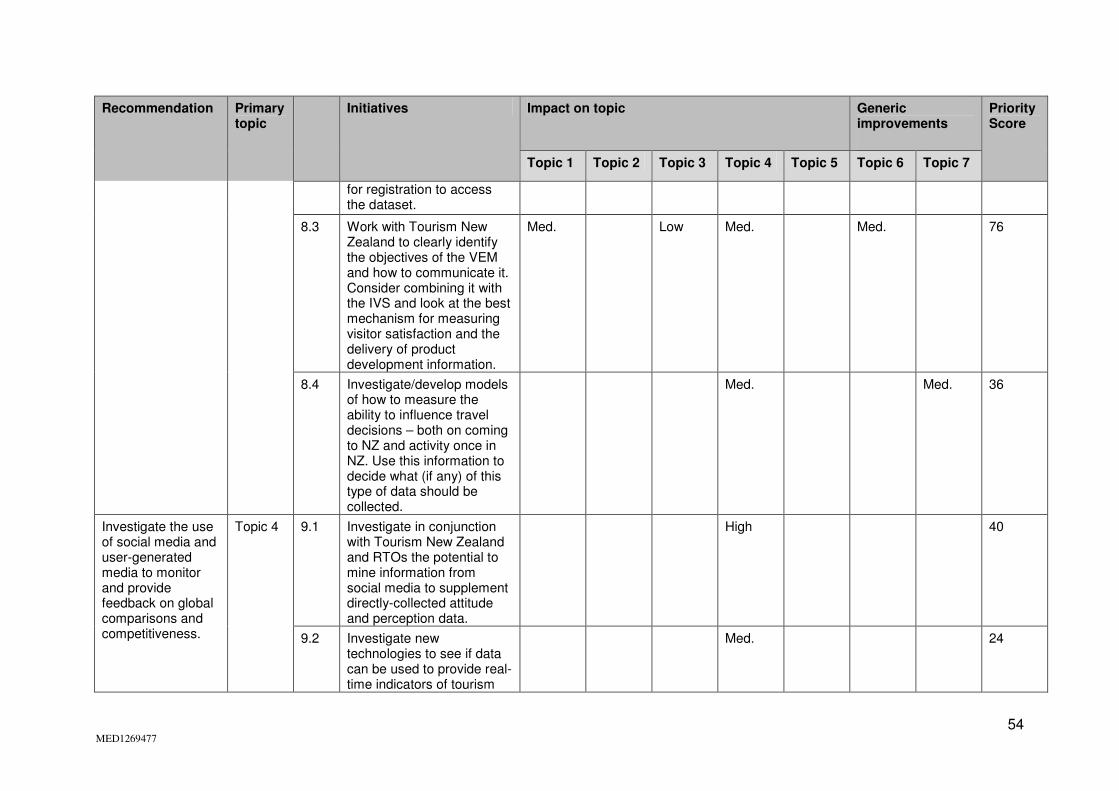
54 MED1269477
Recommendation Primary topic
Initiatives Impact on topic Generic improvements
Priority Score
Topic 1 Topic 2 Topic 3 Topic 4 Topic 5 Topic 6 Topic 7
for registration to access the dataset.
8.3 Work with Tourism New Zealand to clearly identify the objectives of the VEM and how to communicate it. Consider combining it with the IVS and look at the best mechanism for measuring visitor satisfaction and the delivery of product development information.
Med. Low Med. Med. 76
8.4 Investigate/develop models of how to measure the ability to influence travel decisions – both on coming to NZ and activity once in NZ. Use this information to decide what (if any) of this type of data should be collected.
Med. Med. 36
Investigate the use of social media and user-generated media to monitor and provide feedback on global comparisons and competitiveness.
Topic 4 9.1 Investigate in conjunction with Tourism New Zealand and RTOs the potential to mine information from social media to supplement directly-collected attitude and perception data.
High 40
9.2 Investigate new technologies to see if data can be used to provide real-time indicators of tourism
Med. 24
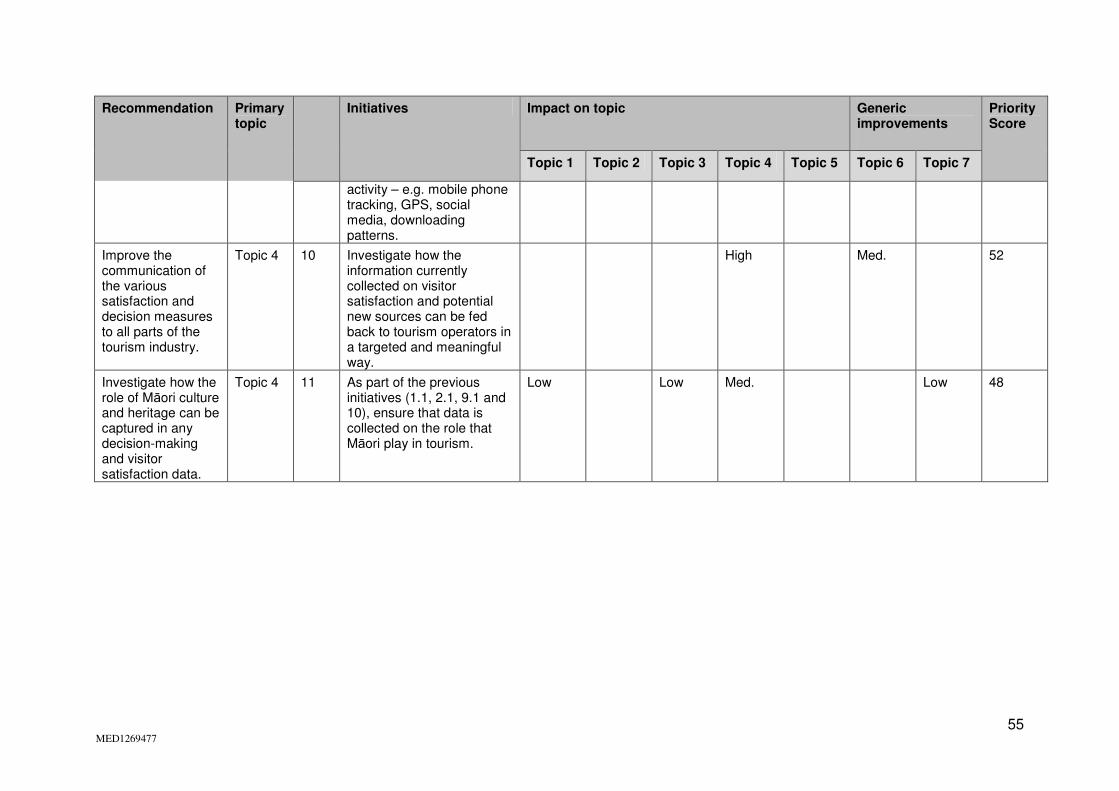
55 MED1269477
Recommendation Primary topic
Initiatives Impact on topic Generic improvements
Priority Score
Topic 1 Topic 2 Topic 3 Topic 4 Topic 5 Topic 6 Topic 7
activity – e.g. mobile phone tracking, GPS, social media, downloading patterns.
Improve the communication of the various satisfaction and decision measures to all parts of the tourism industry.
Topic 4 10 Investigate how the information currently collected on visitor satisfaction and potential new sources can be fed back to tourism operators in a targeted and meaningful way.
High Med. 52
Investigate how the role of Māori culture and heritage can be captured in any decision-making and visitor satisfaction data.
Topic 4 11 As part of the previous initiatives (1.1, 2.1, 9.1 and 10), ensure that data is collected on the role that Māori play in tourism.
Low Low Med. Low 48

56 MED1269477
Recommendation Primary topic
Initiatives Impact on topic Generic improvements
Priority Score
Topic 1 Topic 2 Topic 3 Topic 4 Topic 5 Topic 6 Topic 7
Re-develop forecasts to improve methodology to provide best and worst case options, incorporate more international future-focused information, more information on emerging markets and access to real-time bookings.
Topic 4 12.1 The forecasting methodology needs to be improved to contain updated/modelled actuals for the previous year, a regional breakdown for the previous year, a forecast for the next five years to include best and worst case scenarios, a forecast for next five years of the top 10 markets, a case study of selected emerging markets, and information from forward bookings.
Med. Med. High Low 104
12.2 Alignment of the tourism year – forecasts currently use a calendar year, while TSA uses the year ending in March, and IVS/DTS use the year ending in June.
Low Low 12
12.3 Any publication should be explicit about the modelling done and the assumptions used (exchange rate, price of fuel, economic conditions etc.).
Med. Low 28
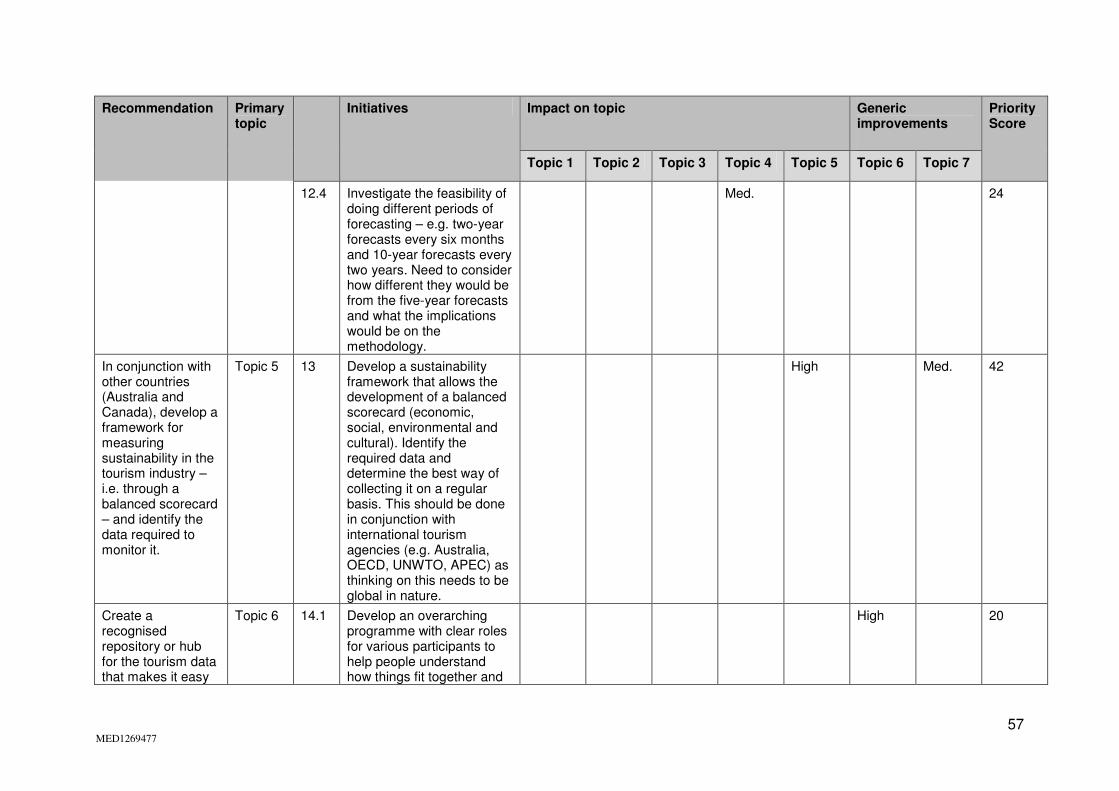
57 MED1269477
Recommendation Primary topic
Initiatives Impact on topic Generic improvements
Priority Score
Topic 1 Topic 2 Topic 3 Topic 4 Topic 5 Topic 6 Topic 7
12.4 Investigate the feasibility of doing different periods of forecasting – e.g. two-year forecasts every six months and 10-year forecasts every two years. Need to consider how different they would be from the five-year forecasts and what the implications would be on the methodology.
Med. 24
In conjunction with other countries (Australia and Canada), develop a framework for measuring sustainability in the tourism industry – i.e. through a balanced scorecard – and identify the data required to monitor it.
Topic 5 13 Develop a sustainability framework that allows the development of a balanced scorecard (economic, social, environmental and cultural). Identify the required data and determine the best way of collecting it on a regular basis. This should be done in conjunction with international tourism agencies (e.g. Australia, OECD, UNWTO, APEC) as thinking on this needs to be global in nature.
High Med. 42
Create a recognised repository or hub for the tourism data that makes it easy
Topic 6 14.1 Develop an overarching programme with clear roles for various participants to help people understand how things fit together and
High 20
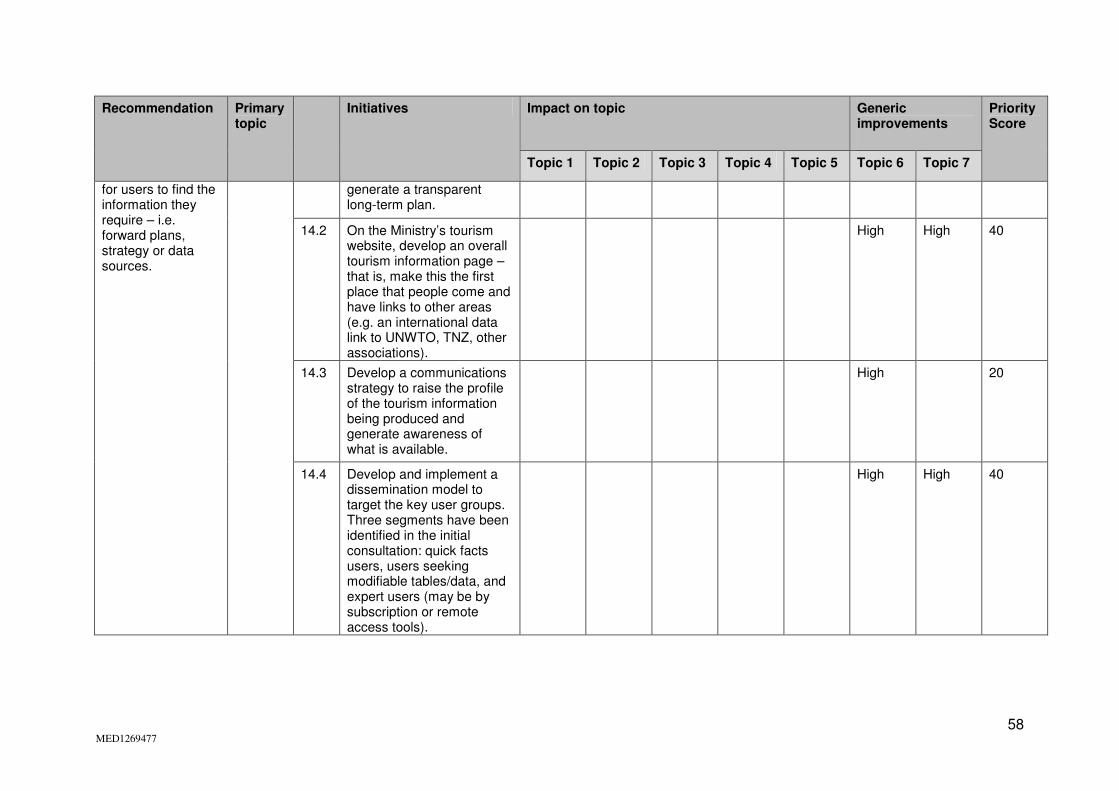
58 MED1269477
Recommendation Primary topic
Initiatives Impact on topic Generic improvements
Priority Score
Topic 1 Topic 2 Topic 3 Topic 4 Topic 5 Topic 6 Topic 7
for users to find the information they require – i.e. forward plans, strategy or data sources.
generate a transparent long-term plan.
14.2 On the Ministry’s tourism website, develop an overall tourism information page – that is, make this the first place that people come and have links to other areas (e.g. an international data link to UNWTO, TNZ, other associations).
High High 40
14.3 Develop a communications strategy to raise the profile of the tourism information being produced and generate awareness of what is available.
High 20
14.4 Develop and implement a dissemination model to target the key user groups. Three segments have been identified in the initial consultation: quick facts users, users seeking modifiable tables/data, and expert users (may be by subscription or remote access tools).
High High 40
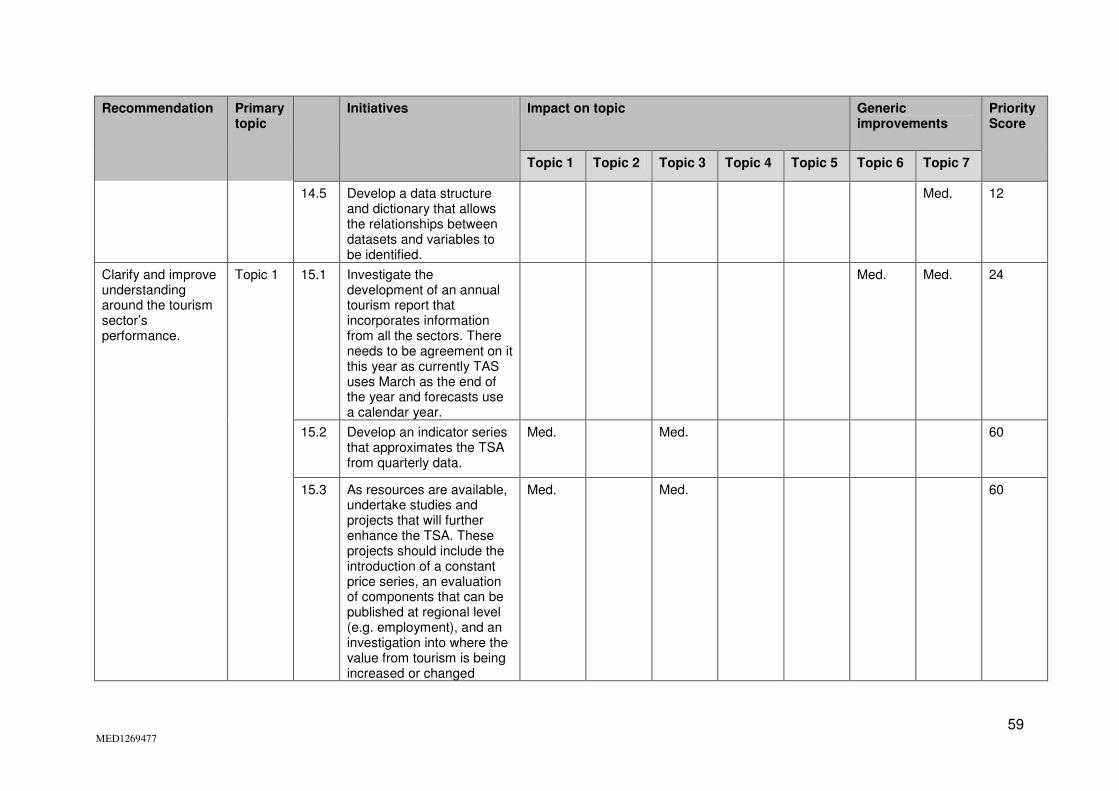
59 MED1269477
Recommendation Primary topic
Initiatives Impact on topic Generic improvements
Priority Score
Topic 1 Topic 2 Topic 3 Topic 4 Topic 5 Topic 6 Topic 7
14.5 Develop a data structure and dictionary that allows the relationships between datasets and variables to be identified.
Med. 12
Clarify and improve understanding around the tourism sector’s performance.
Topic 1 15.1 Investigate the development of an annual tourism report that incorporates information from all the sectors. There needs to be agreement on it this year as currently TAS uses March as the end of the year and forecasts use a calendar year.
Med. Med. 24
15.2 Develop an indicator series that approximates the TSA from quarterly data.
Med. Med. 60
15.3 As resources are available, undertake studies and projects that will further enhance the TSA. These projects should include the introduction of a constant price series, an evaluation of components that can be published at regional level (e.g. employment), and an investigation into where the value from tourism is being increased or changed
Med. Med. 60
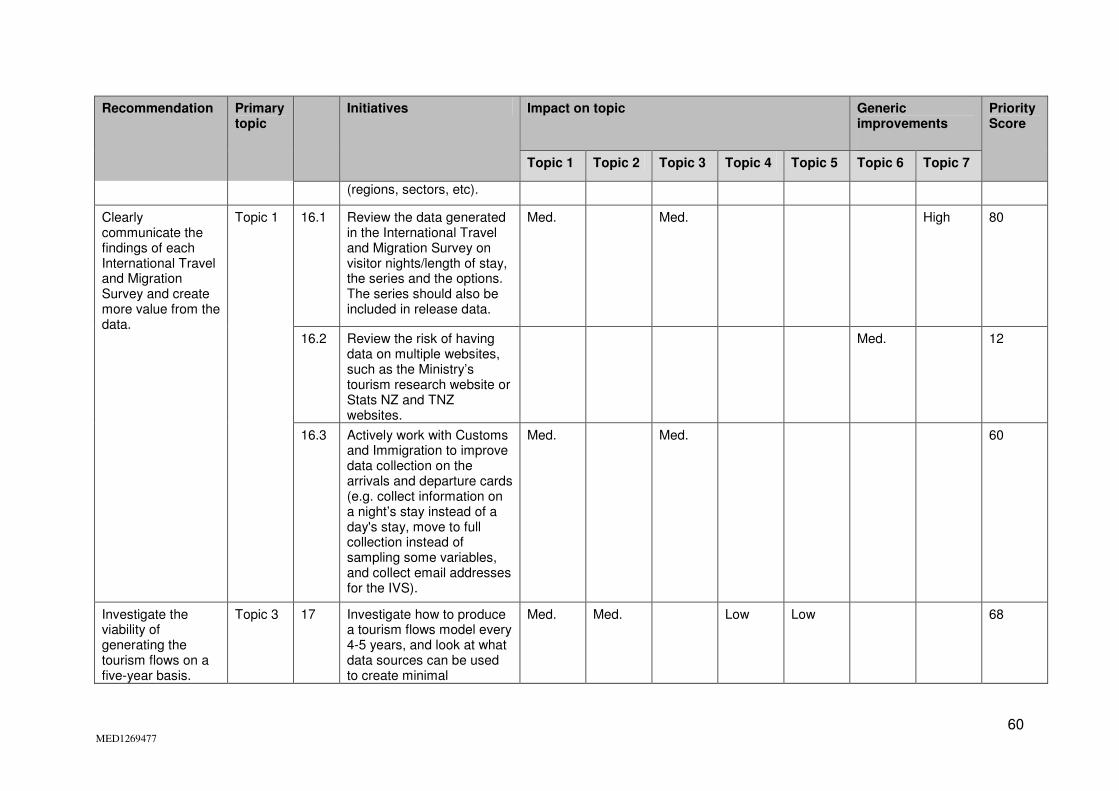
60 MED1269477
Recommendation Primary topic
Initiatives Impact on topic Generic improvements
Priority Score
Topic 1 Topic 2 Topic 3 Topic 4 Topic 5 Topic 6 Topic 7
(regions, sectors, etc).
Clearly communicate the findings of each International Travel and Migration Survey and create more value from the data.
Topic 1 16.1 Review the data generated in the International Travel and Migration Survey on visitor nights/length of stay, the series and the options. The series should also be included in release data.
Med. Med. High 80
16.2 Review the risk of having data on multiple websites, such as the Ministry’s tourism research website or Stats NZ and TNZ websites.
Med. 12
16.3 Actively work with Customs and Immigration to improve data collection on the arrivals and departure cards (e.g. collect information on a night’s stay instead of a day's stay, move to full collection instead of sampling some variables, and collect email addresses for the IVS).
Med. Med. 60
Investigate the viability of generating the tourism flows on a five-year basis.
Topic 3 17 Investigate how to produce a tourism flows model every 4-5 years, and look at what data sources can be used to create minimal
Med. Med. Low Low 68
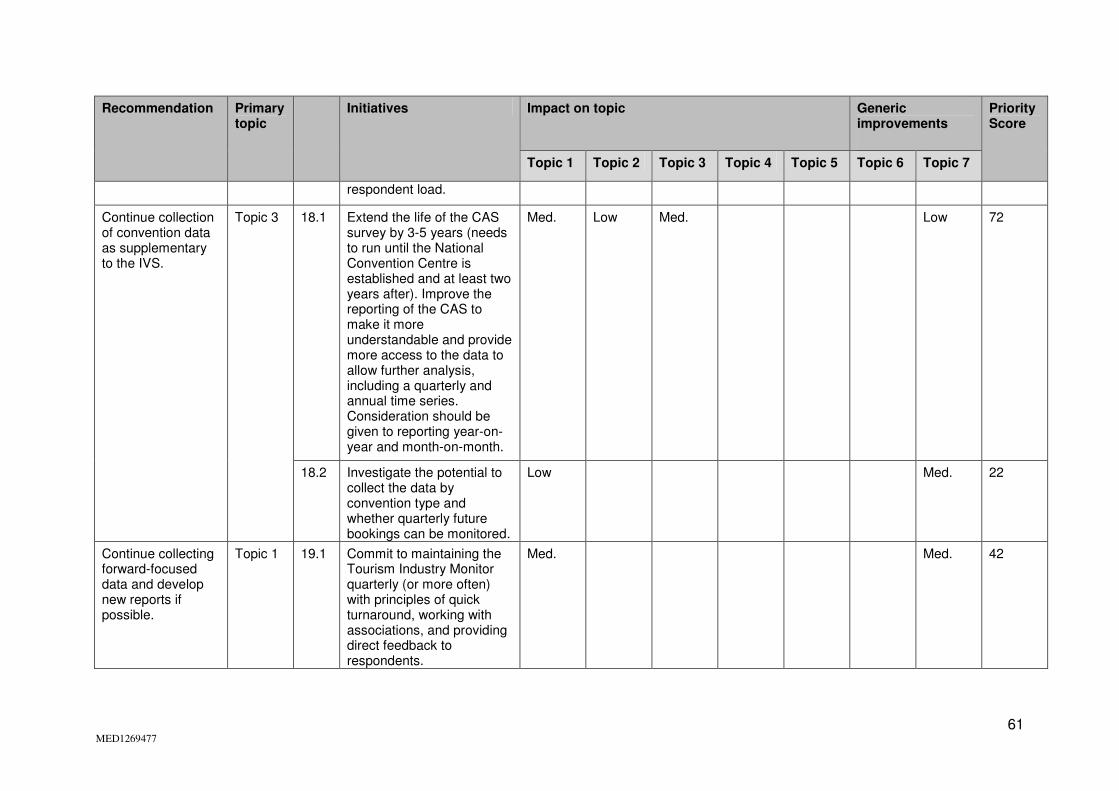
61 MED1269477
Recommendation Primary topic
Initiatives Impact on topic Generic improvements
Priority Score
Topic 1 Topic 2 Topic 3 Topic 4 Topic 5 Topic 6 Topic 7
respondent load.
Continue collection of convention data as supplementary to the IVS.
Topic 3 18.1 Extend the life of the CAS survey by 3-5 years (needs to run until the National Convention Centre is established and at least two years after). Improve the reporting of the CAS to make it more understandable and provide more access to the data to allow further analysis, including a quarterly and annual time series. Consideration should be given to reporting year-on-year and month-on-month.
Med. Low Med. Low 72
18.2 Investigate the potential to collect the data by convention type and whether quarterly future bookings can be monitored.
Low Med. 22
Continue collecting forward-focused data and develop new reports if possible.
Topic 1 19.1 Commit to maintaining the Tourism Industry Monitor quarterly (or more often) with principles of quick turnaround, working with associations, and providing direct feedback to respondents.
Med. Med. 42
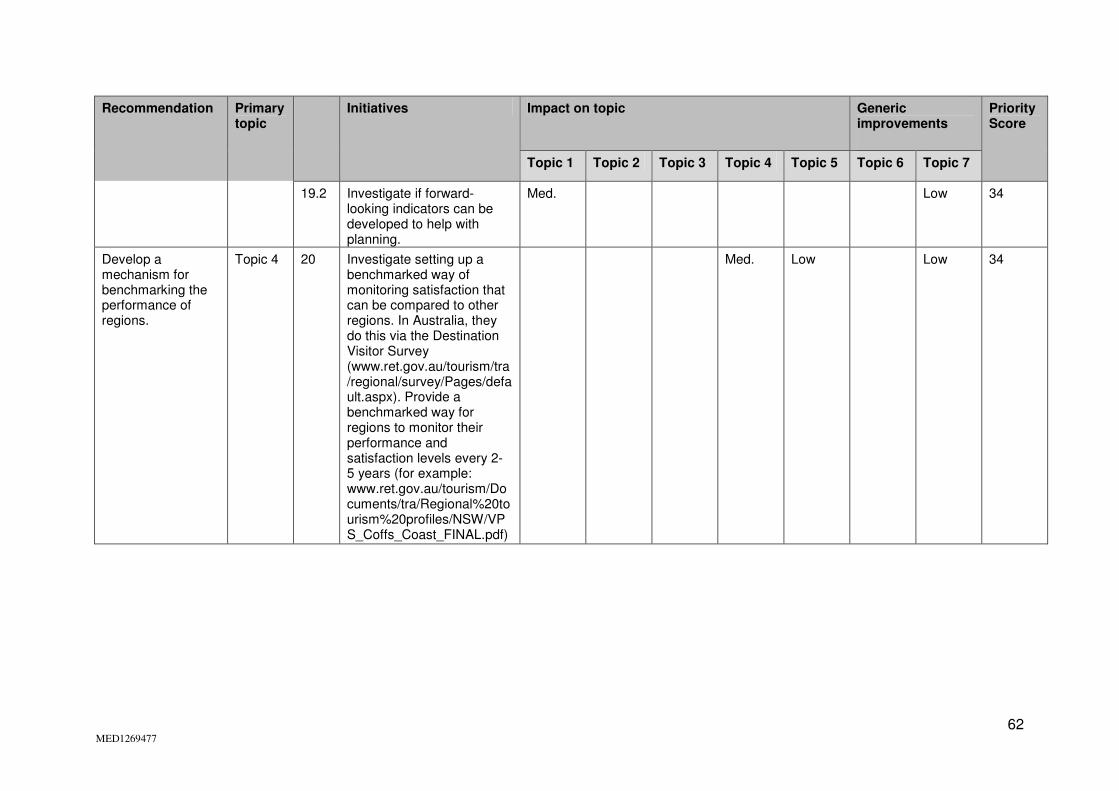
62 MED1269477
Recommendation Primary topic
Initiatives Impact on topic Generic improvements
Priority Score
Topic 1 Topic 2 Topic 3 Topic 4 Topic 5 Topic 6 Topic 7
19.2 Investigate if forward-looking indicators can be developed to help with planning.
Med. Low 34
Develop a mechanism for benchmarking the performance of regions.
Topic 4 20 Investigate setting up a benchmarked way of monitoring satisfaction that can be compared to other regions. In Australia, they do this via the Destination Visitor Survey (www.ret.gov.au/tourism/tra/regional/survey/Pages/default.aspx). Provide a benchmarked way for regions to monitor their performance and satisfaction levels every 2- 5 years (for example: www.ret.gov.au/tourism/Documents/tra/Regional%20tourism%20profiles/NSW/VPS_Coffs_Coast_FINAL.pdf)
Med. Low Low 34
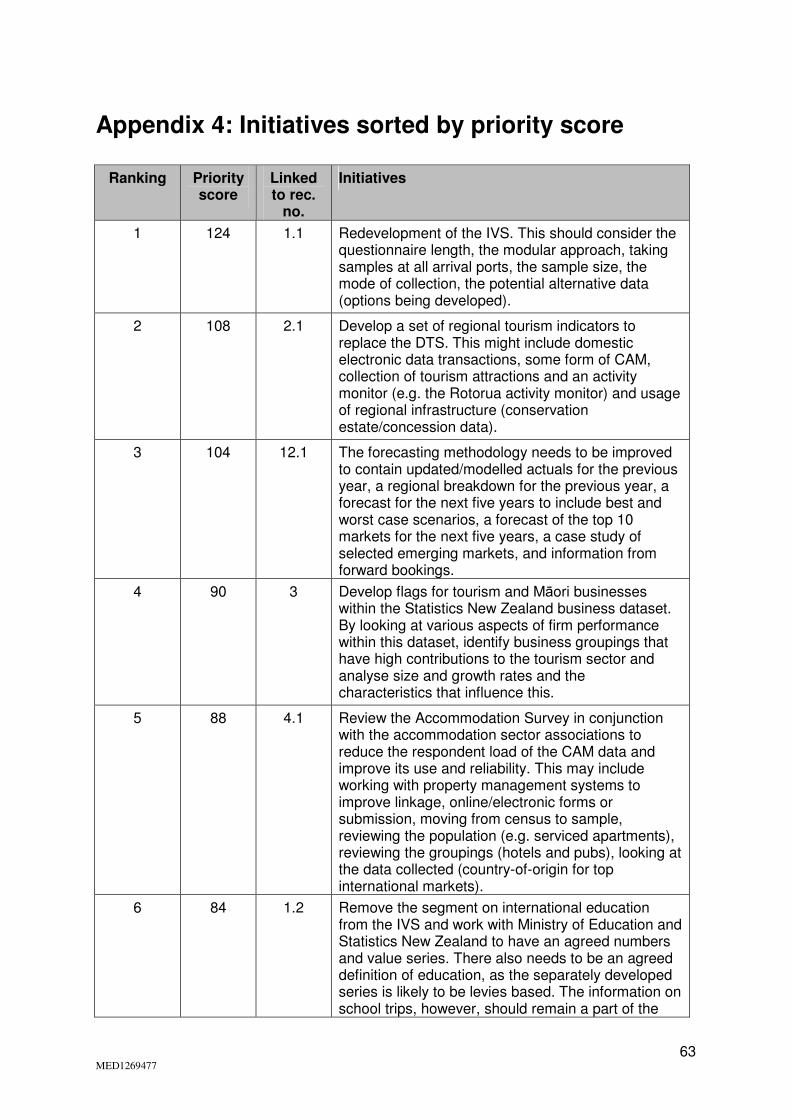
63 MED1269477
Appendix 4: Initiatives sorted by priority score
Ranking Priority score
Linked to rec.
no.
Initiatives
1 124 1.1 Redevelopment of the IVS. This should consider the questionnaire length, the modular approach, taking samples at all arrival ports, the sample size, the mode of collection, the potential alternative data (options being developed).
2 108 2.1 Develop a set of regional tourism indicators to replace the DTS. This might include domestic electronic data transactions, some form of CAM, collection of tourism attractions and an activity monitor (e.g. the Rotorua activity monitor) and usage of regional infrastructure (conservation estate/concession data).
3 104 12.1 The forecasting methodology needs to be improved to contain updated/modelled actuals for the previous year, a regional breakdown for the previous year, a forecast for the next five years to include best and worst case scenarios, a forecast of the top 10 markets for the next five years, a case study of selected emerging markets, and information from forward bookings.
4 90 3 Develop flags for tourism and Māori businesses within the Statistics New Zealand business dataset. By looking at various aspects of firm performance within this dataset, identify business groupings that have high contributions to the tourism sector and analyse size and growth rates and the characteristics that influence this.
5 88 4.1 Review the Accommodation Survey in conjunction with the accommodation sector associations to reduce the respondent load of the CAM data and improve its use and reliability. This may include working with property management systems to improve linkage, online/electronic forms or submission, moving from census to sample, reviewing the population (e.g. serviced apartments), reviewing the groupings (hotels and pubs), looking at the data collected (country-of-origin for top international markets).
6 84 1.2 Remove the segment on international education from the IVS and work with Ministry of Education and Statistics New Zealand to have an agreed numbers and value series. There also needs to be an agreed definition of education, as the separately developed series is likely to be levies based. The information on school trips, however, should remain a part of the
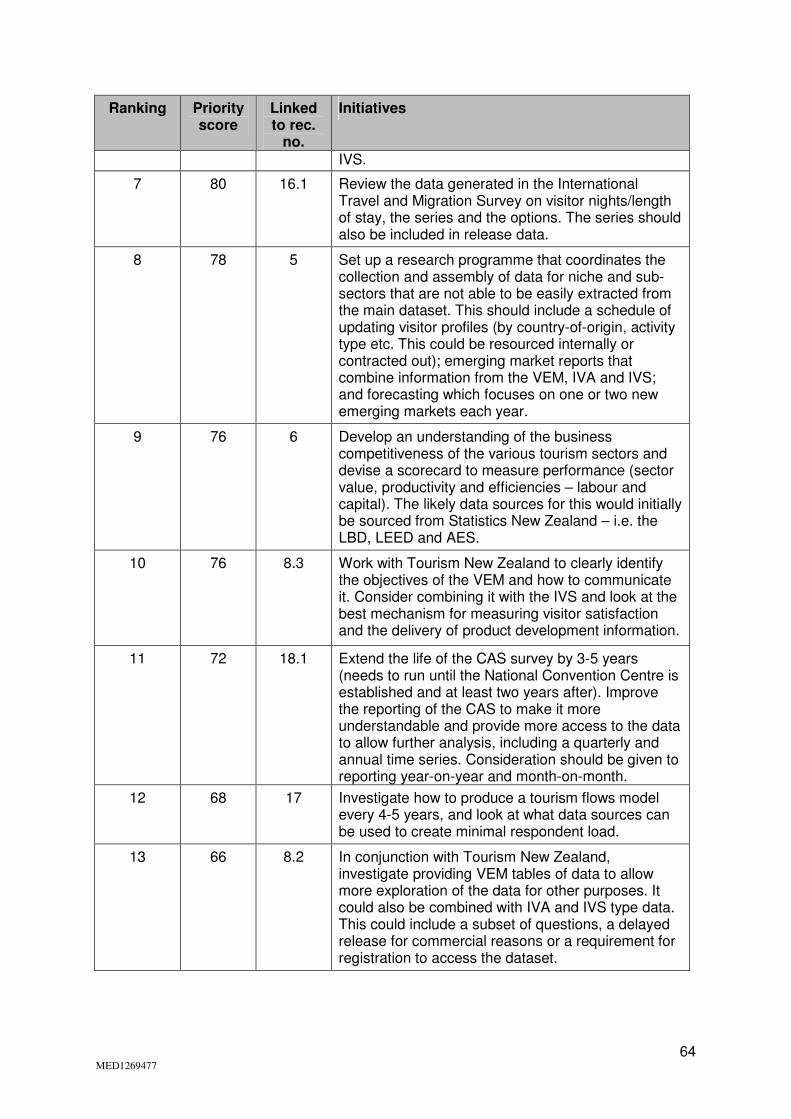
64 MED1269477
Ranking Priority score
Linked to rec.
no.
Initiatives
IVS.
7 80 16.1 Review the data generated in the International Travel and Migration Survey on visitor nights/length of stay, the series and the options. The series should also be included in release data.
8 78 5 Set up a research programme that coordinates the collection and assembly of data for niche and sub-sectors that are not able to be easily extracted from the main dataset. This should include a schedule of updating visitor profiles (by country-of-origin, activity type etc. This could be resourced internally or contracted out); emerging market reports that combine information from the VEM, IVA and IVS; and forecasting which focuses on one or two new emerging markets each year.
9 76 6 Develop an understanding of the business competitiveness of the various tourism sectors and devise a scorecard to measure performance (sector value, productivity and efficiencies – labour and capital). The likely data sources for this would initially be sourced from Statistics New Zealand – i.e. the LBD, LEED and AES.
10 76 8.3 Work with Tourism New Zealand to clearly identify the objectives of the VEM and how to communicate it. Consider combining it with the IVS and look at the best mechanism for measuring visitor satisfaction and the delivery of product development information.
11 72 18.1 Extend the life of the CAS survey by 3-5 years (needs to run until the National Convention Centre is established and at least two years after). Improve the reporting of the CAS to make it more understandable and provide more access to the data to allow further analysis, including a quarterly and annual time series. Consideration should be given to reporting year-on-year and month-on-month.
12 68 17 Investigate how to produce a tourism flows model every 4-5 years, and look at what data sources can be used to create minimal respondent load.
13 66 8.2 In conjunction with Tourism New Zealand, investigate providing VEM tables of data to allow more exploration of the data for other purposes. It could also be combined with IVA and IVS type data. This could include a subset of questions, a delayed release for commercial reasons or a requirement for registration to access the dataset.

65 MED1269477
Ranking Priority score
Linked to rec.
no.
Initiatives
14 60 1.3 Develop a cruise passenger series (transit only) which includes numbers and value. Evaluate the options for including it with the International Travel and Migration data and the IVS (measures must be consistent between the two collections).
15 60 15.2 Develop an indicator series that approximates the TSA from quarterly data.
16 60 15.3 As resources are available, undertake studies and projects that will further enhance the TSA. These projects should include the introduction of a constant price series, an evaluation of components that can be published at regional level (e.g. employment), and an investigation into where the value from tourism is being increased or changed (regions, sectors, etc).
17 60 16.3 Actively work with Customs and Immigration on the project to improve data collection on the arrivals and departure cards (e.g. collect information on a night’s stay instead of a day's stay, move to full collection instead of sampling some variables, and collect email addresses for the IVS).
18 54 4.2 Investigate options to provide benchmarking reports to respondents of the Accommodation Survey.
19 54 7 Develop a methodology and a better understanding of ROI measurements – especially the indirect and hard-to-measure impacts. This would need to be done alongside other government agencies.
20 52 1.4 Investigate how regions could be better informed by the IVS data, without a false impression of the accuracy of the data (e.g. release at Territorial Authority (16 regions) and allow access to lower level by expert users).
21 52 8.1 Improve communication with industry on the data that the VEM contains, including providing links from the Ministry’s tourism research website to TNZ and making a subset of data available.
22 52 10 Investigate how the information currently collected on visitor satisfaction and potential new sources can be fed back to tourism operators in a targeted and meaningful way.
23 48 11 As part of the previous initiatives (1.1, 2.1, 9.1 and 10), ensure that data is collected on the role that Māori plays in tourism.
24 42 13 Develop a sustainability framework that allows the development of a balanced scorecard (economic, social, environmental and cultural). Identify the required data and determine the best way of collecting it on a regular basis. This should be done
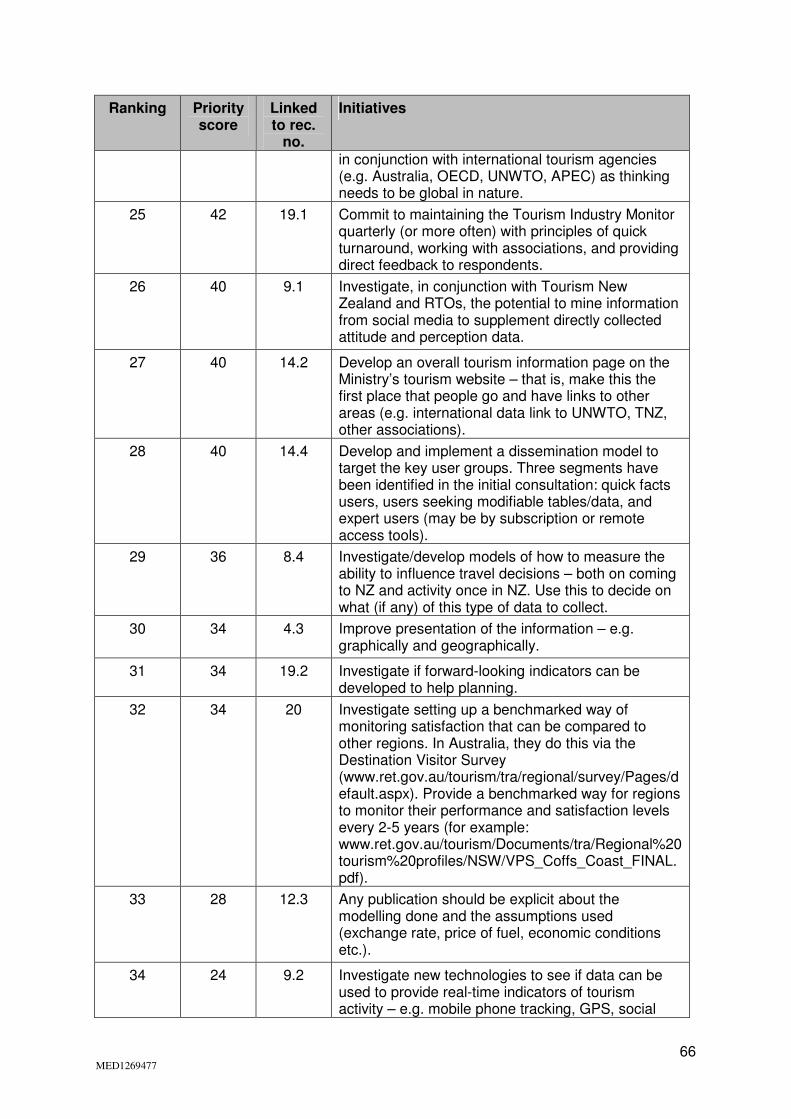
66 MED1269477
Ranking Priority score
Linked to rec.
no.
Initiatives
in conjunction with international tourism agencies (e.g. Australia, OECD, UNWTO, APEC) as thinking needs to be global in nature.
25 42 19.1 Commit to maintaining the Tourism Industry Monitor quarterly (or more often) with principles of quick turnaround, working with associations, and providing direct feedback to respondents.
26 40 9.1 Investigate, in conjunction with Tourism New Zealand and RTOs, the potential to mine information from social media to supplement directly collected attitude and perception data.
27 40 14.2 Develop an overall tourism information page on the Ministry’s tourism website – that is, make this the first place that people go and have links to other areas (e.g. international data link to UNWTO, TNZ, other associations).
28 40 14.4 Develop and implement a dissemination model to target the key user groups. Three segments have been identified in the initial consultation: quick facts users, users seeking modifiable tables/data, and expert users (may be by subscription or remote access tools).
29 36 8.4 Investigate/develop models of how to measure the ability to influence travel decisions – both on coming to NZ and activity once in NZ. Use this to decide on what (if any) of this type of data to collect.
30 34 4.3 Improve presentation of the information – e.g. graphically and geographically.
31 34 19.2 Investigate if forward-looking indicators can be developed to help planning.
32 34 20 Investigate setting up a benchmarked way of monitoring satisfaction that can be compared to other regions. In Australia, they do this via the Destination Visitor Survey (www.ret.gov.au/tourism/tra/regional/survey/Pages/default.aspx). Provide a benchmarked way for regions to monitor their performance and satisfaction levels every 2-5 years (for example: www.ret.gov.au/tourism/Documents/tra/Regional%20tourism%20profiles/NSW/VPS_Coffs_Coast_FINAL.pdf).
33 28 12.3 Any publication should be explicit about the modelling done and the assumptions used (exchange rate, price of fuel, economic conditions etc.).
34 24 9.2 Investigate new technologies to see if data can be used to provide real-time indicators of tourism activity – e.g. mobile phone tracking, GPS, social
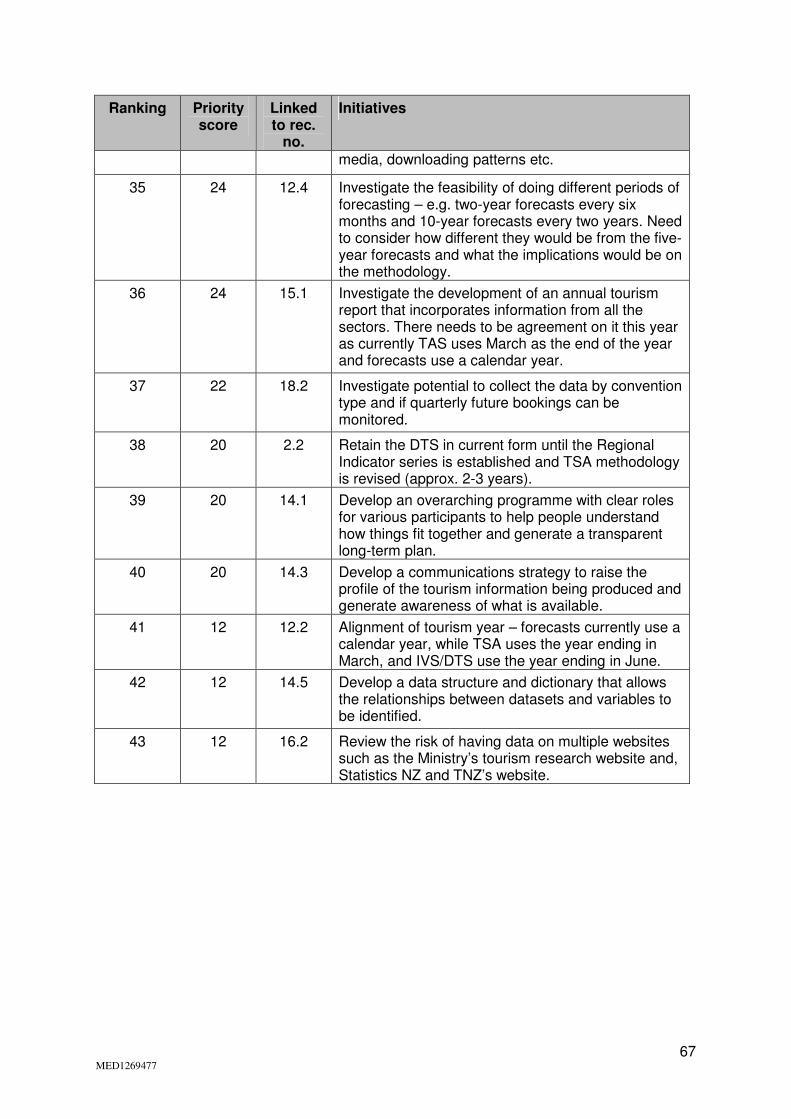
67 MED1269477
Ranking Priority score
Linked to rec.
no.
Initiatives
media, downloading patterns etc.
35 24 12.4 Investigate the feasibility of doing different periods of forecasting – e.g. two-year forecasts every six months and 10-year forecasts every two years. Need to consider how different they would be from the five-year forecasts and what the implications would be on the methodology.
36 24 15.1 Investigate the development of an annual tourism report that incorporates information from all the sectors. There needs to be agreement on it this year as currently TAS uses March as the end of the year and forecasts use a calendar year.
37 22 18.2 Investigate potential to collect the data by convention type and if quarterly future bookings can be monitored.
38 20 2.2 Retain the DTS in current form until the Regional Indicator series is established and TSA methodology is revised (approx. 2-3 years).
39 20 14.1 Develop an overarching programme with clear roles for various participants to help people understand how things fit together and generate a transparent long-term plan.
40 20 14.3 Develop a communications strategy to raise the profile of the tourism information being produced and generate awareness of what is available.
41 12 12.2 Alignment of tourism year – forecasts currently use a calendar year, while TSA uses the year ending in March, and IVS/DTS use the year ending in June.
42 12 14.5 Develop a data structure and dictionary that allows the relationships between datasets and variables to be identified.
43 12 16.2 Review the risk of having data on multiple websites such as the Ministry’s tourism research website and, Statistics NZ and TNZ’s website.