Embed Size (px)
Citation preview

Tourism Destinations
Carbon Footprints
Prepared by Dick Sisman & Associates - March 2007
Contents
Page
Executive Summary 1
1.0 Introduction 2 2.0 Carbon Footprints of Destinations - Review 3 2.1 Ecological Footprints 3 2.2 Carbon Dioxide Footprints - Majorca & Cyprus 3 2.3 Carbon Dioxide Footprint - New Zealand 3 2.4 Greenhouse Gas Emissions - Whistler, Canada 4
2.5 Footprints of Different Holiday Types 4 3.0 Method for Determining Carbon Footprints 5 4.0 Specific Areas of Energy Consumption 8
4.1 Hotel Energy Consumption 9 4.1.1 Water Heating 9 4.1.2 Lighting 10
4.1.3 Heating, Ventilation & Air Conditioning (HVAC) 10
4.1.4 Overall Hotel Energy Saving 11
4.2 Food 12
4.2.1 Food Miles 12 4.2.2 Waste 12 4.2.3 Bottled Water 13
4.2.4 Desalination 13 5.0 Energy Saving Tips 13 6.0 Conclusions 14 Appendix I 15
References 19
Carbon Footprint of Destinations 1
Tourism Destinations
Carbon Footprints
Executive Summary The tourism industry is responding to the widespread concern over the future of the global climate. However, little quantitative work has been done on carbon dioxide emissions associated with tourism destinations. This report presents a framework illustrating how this can be done. It is suggested that the Travel Foundation (TF) encourages development of carbon accounting within the tourism industry. The carbon footprints are likely to vary greatly between destinations, reflecting climate, culture, energy sources, available technology and activities undertaken. Thus each destination should be treated individually. The report evaluates work that has been done and reaches a preliminary conclusion that, air travel apart, the carbon footprint of a holiday may be less, in some cases, than that of staying at home. Air travel is clearly the most significant overall source of greenhouse gas emissions in land-based tourism and support should be given to measures to mitigate this impact. However, the greenhouse gas impact of the cruise industry should also be examined. Two areas: hotel energy consumption and waste disposal are examined in more detail. A number of areas are identified where the Travel Foundation could consider initiating work to reduce CO2 impacts. These include:
- Anaerobic digestion of waste with methane recovery; - Optimisation of the use of bottled water; - Further encouragement of use of local food produce
Some of these are likely to have the potential to produce marketable CO2 credits subject to appropriate verification processes. This report is one of a series of three from The Travel Foundation. It follows the ‘Insider Guide: Climate change and tourism’ and precedes a third report in which suggestions are made to the TF of a range of projects which will help to reduce or offset CO2 emissions in destinations.
Carbon Footprint of Destinations 2
1.0 Introduction This report has been prepared to address the following brief from The Travel Foundation:
“A review of existing ways to determine the carbon footprint of a tourist destination, listing key areas of generation of carbon dioxide emissions and a specific example of how to do this for a typical holiday. This would be accompanied by appropriate conversion factors as to double counting etc. It would also recommend an appropriate methodology for TF to use”
Most tourism-related activities require energy directly in the form of fossil fuels or indirectly in the form of electricity often generated from petroleum, coal or gas. This consumption leads to the emission of greenhouse gases, mainly carbon dioxide. With a few exceptions, it is only very recently that researchers have started to study energy consumption from tourist activities and to estimate the resulting greenhouse gases that contribute to the anthropogenic component of global warming. Carbon dioxide (CO2) in the earth’s atmosphere has a life of 100 years or more; CO2 from any one source has ample time to mix on a global scale and thus become indistinguishable from CO2 from other sources. The impact of CO2 is global; there is no specific local impact of CO2 emissions from a particular location. In the context of this report, the term footprint therefore applies to the quantitative aspects of CO2 arising from specific activities and locations. In 2003 the World Tourism Organisation (WTO) acknowledged the two-way relationship between tourism and climate change. Climatic changes will have impacts on a number of tourist destinations and tourist flows. In turn, tourism is a major contributor to climate change by its use of fossil fuels and emissions of greenhouse gases. The Travel Foundation has already drawn attention to this important area, for example through its recent Insider Guide “Climate Change and Tourism” (1). When accounting for tourism’s environmental impacts, there are a number of key areas that directly generate carbon dioxide emissions. These are accommodation and catering, transport (air road, rail and water), other transport services, equipment hire, and cultural and recreational services (2, 3) This study will:
• review some published approaches to footprinting of destinations and, from these, develop estimates of carbon footprints;
• identify a methodology which can be used by tourism locations or tourism businesses to calculate their specific footprint;
• focus in detail on two areas of tourism energy consumption. Hotels; and Food This report is one of a series of three from The Travel Foundation. It follows the ‘Insider Guide: Climate change and tourism’ and precedes a third report in which suggestions are made to the TF of a range of projects which will help to reduce or offset CO2 emissions in destinations. The brief for this work excludes cruise holidays as they involve sequential visits to a number of destinations; however it is suggested that the greenhouse gas impact of the cruise sector should also be examined.
Carbon Footprint of Destinations 3
2.0 Carbon Footprints of Destinations – Review 2.1 Ecological Footprints One approach to tourism footprinting has been developed by WWF (4). This estimates the ecological footprint of a holiday product in terms of the resources used. The approach integrates the environmental impacts associated with a holiday into a single indicator. It is broader than a carbon footprint and usually converts the impact into area units where one area unit is a hectare of world average bioproductive space. The 2002 report (5) analysed the footprint of typical summer package holidays in two Mediterranean destinations, Majorca and Cyprus, based on data provided by Thomson holidays. This approach is intellectually appealing and while it has been applied (for example 6, 7), it has not been widely adopted by the tourism community and suffers from some difficulties in conversion of the impacts to common units. For example, there is some debate over the relevance of forestry to compensating for CO2 emissions. Also, no account is taken of social and economic impacts. The following is a brief review of some work that has been done in this area; the studies covered are described in more detail in Appendix I. 2.2 Carbon Dioxide Footprints – Majorca & Cyprus The WWF papers can be used as a base to make some estimates of carbon dioxide (CO2) emissions or the ‘carbon footprint’ associated with a holiday destination. Despite the improvements in aviation technology and operational aspects such as higher load factors (percentage of seats occupied), the major component is air travel. The estimates (see also Appendix I) should be taken as illustrative only. Much greater precision would be required to come to definite conclusions. The analysis leads to a rough estimate of the carbon footprint per bed night in Majorca as 27 kg CO2 (5.5 kg when the flight is excluded) and for Cyprus as 66 kg CO2 (18 kg when the flight is excluded). In Cyprus there were 1,486,000 UK visitors in 2002 with an average stay of 11.2 days, compared with the14 days for Thomson clients identified in the WWF paper. Thus the overall CO2 footprint for UK holidaymakers to Cyprus can be estimated very approximately as 1 million tonnes of CO2 including flights, and 300,000 tonnes without flights. In Majorca there were 2,025,000 UK visitors in 2002 (31% of the total). The average stay was 9.3 days giving a total of 18.83 million bed nights. This leads to an overall CO2 footprint for UK visitors of 103,000 tonnes CO2, or 508,000 tonnes CO2 if flights are included. This can be compared with the average domestic per capita energy consumption in the UK of about 5.4 – 6.0 kg CO2 per day. This figure is remarkably close to the CO2 per bed night for a visitor to Cyprus. This suggests that the net carbon footprint of a holiday in some destinations, air transport excluded, could be close to zero or even negative, in terms of CO2.
2.3 Carbon Dioxide Footprint – New Zealand Becken (8) has estimated the energy consumption associated with tourism businesses in New Zealand. Three categories were identified: attractions, entertainments and activities. The average energy use per tourist was much higher
Carbon Footprint of Destinations 4
for activities (95.6 megajoules per tourist) compared with attractions and entertainment (6.2 and 9.4 megajoules per tourist, respectively). This approach has recently been developed further to examine the components of a tourism visit, as indicated in Appendix I. Clearly this information could be used to help calculate the tourism CO2 footprint. In this work, activities associated with direct consumption of fossil fuels stand out more than might be the case for some other destinations. In New Zealand the CO2 intensity of many components of any overall footprint is lower than in many other countries as about 70% of electricity is generated from hydro power and only 30% from fossil fuels. Thus the carbon footprint of tourism is likely to be significantly less, air travel apart, than in other destinations with less use of renewable energy. Becken and Patterson have also used a top down approach to energy accounting based on United Nations procedures.
2.4 Greenhouse Gas Emissions - Whistler, Canada Kelly and Williams (9) have calculated overall greenhouse gas (GGs) emissions for Whistler, a year round mountain resort some 120 km from Vancouver. GG emissions were calculated for two main areas: buildings and the disposal of solid waste. For energy consumption, buildings were divided into categories and the consumption per unit area calculated. Predictions were made as to future energy consumption per unit area, allowing estimations to be made of savings using estimates of the share of each type of fuel. GGs were estimated using established Canadian conversion factors. Based on this work, which included other energy dependent activities such as transport, it was estimated that commercial activities accounted for about 39% of the total of 2.9GJ of energy consumed in the year 2000. The overall CO2 footprint for the activities included was 132,000 tonnes of CO2 equivalent. This is much lower than for the consumption of the same amount of energy in many other locations, because of the high proportion of hydro-derived electricity. The studies in New Zealand and Canada illustrate the importance of taking local energy sources into account when estimating destination CO2 footprints. The Whistler study also indicates the possible contribution of waste disposal to landfill which will be highly dependent on the way the landfill site is managed. 2.5 Footprints of Different Holiday Types A study, partly sponsored by the FTO, (C. Thompson, personal communication) compared two holidays in Bulgaria: one to a Black Sea mainstream resort; and the other to a responsible 'adventure holiday'. Comparison indicated that, per customer, the carbon footprint of the mainstream holiday was less than that of the 'responsible' holiday. For example the energy consumption in heat and light per person in a 450 room hotel was less than in a 14 room hostel. The study also pointed to the need to ensure standards in sewage treatment not just in large hotels but in smaller types of accommodation. While this study was based on only one comparison, it may indicate a wider pattern and it does point to the need to include carbon footprints in consideration of responsible tourism products. A provisional comparison of energy consumption by hotels in the Gambia (D. Sisman personal communication) suggests that, where no energy efficiency measures have been carried out, the average spent on energy per bedroom is about the same for large and small hotels.
Carbon Footprint of Destinations 5
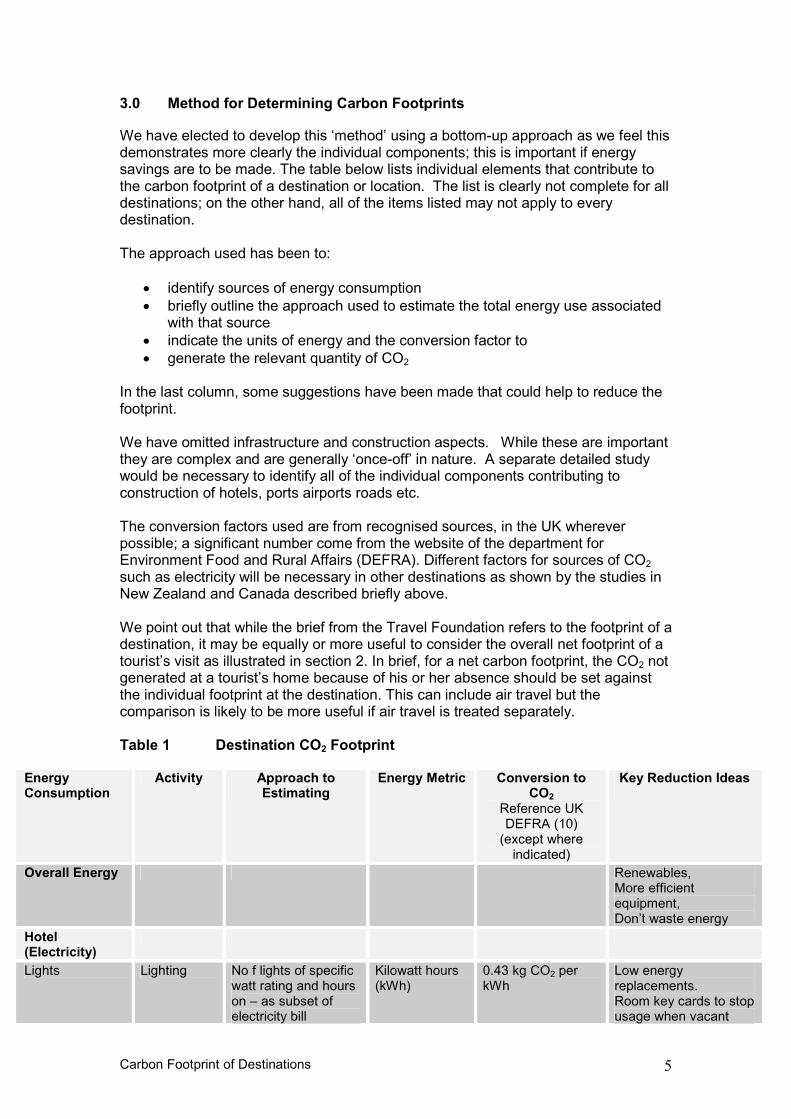
3.0 Method for Determining Carbon Footprints
We have elected to develop this ‘method’ using a bottom-up approach as we feel this demonstrates more clearly the individual components; this is important if energy savings are to be made. The table below lists individual elements that contribute to the carbon footprint of a destination or location. The list is clearly not complete for all destinations; on the other hand, all of the items listed may not apply to every destination. The approach used has been to:
• identify sources of energy consumption • briefly outline the approach used to estimate the total energy use associated
with that source • indicate the units of energy and the conversion factor to • generate the relevant quantity of CO2
In the last column, some suggestions have been made that could help to reduce the footprint. We have omitted infrastructure and construction aspects. While these are important they are complex and are generally ‘once-off’ in nature. A separate detailed study would be necessary to identify all of the individual components contributing to construction of hotels, ports airports roads etc. The conversion factors used are from recognised sources, in the UK wherever possible; a significant number come from the website of the department for Environment Food and Rural Affairs (DEFRA). Different factors for sources of CO2 such as electricity will be necessary in other destinations as shown by the studies in New Zealand and Canada described briefly above.
We point out that while the brief from the Travel Foundation refers to the footprint of a destination, it may be equally or more useful to consider the overall net footprint of a tourist’s visit as illustrated in section 2. In brief, for a net carbon footprint, the CO2 not generated at a tourist’s home because of his or her absence should be set against the individual footprint at the destination. This can include air travel but the comparison is likely to be more useful if air travel is treated separately. Table 1 Destination CO2 Footprint
Energy Consumption
Activity Approach to Estimating
Energy Metric Conversion to CO2
Reference UK DEFRA (10) (except where indicated)
Key Reduction Ideas
Overall Energy Renewables, More efficient equipment, Don’t waste energy
Hotel (Electricity)
Lights Lighting No f lights of specific watt rating and hours on – as subset of electricity bill
Kilowatt hours (kWh)
0.43 kg CO2 per kWh
Low energy replacements. Room key cards to stop usage when vacant
Carbon Footprint of Destinations 6
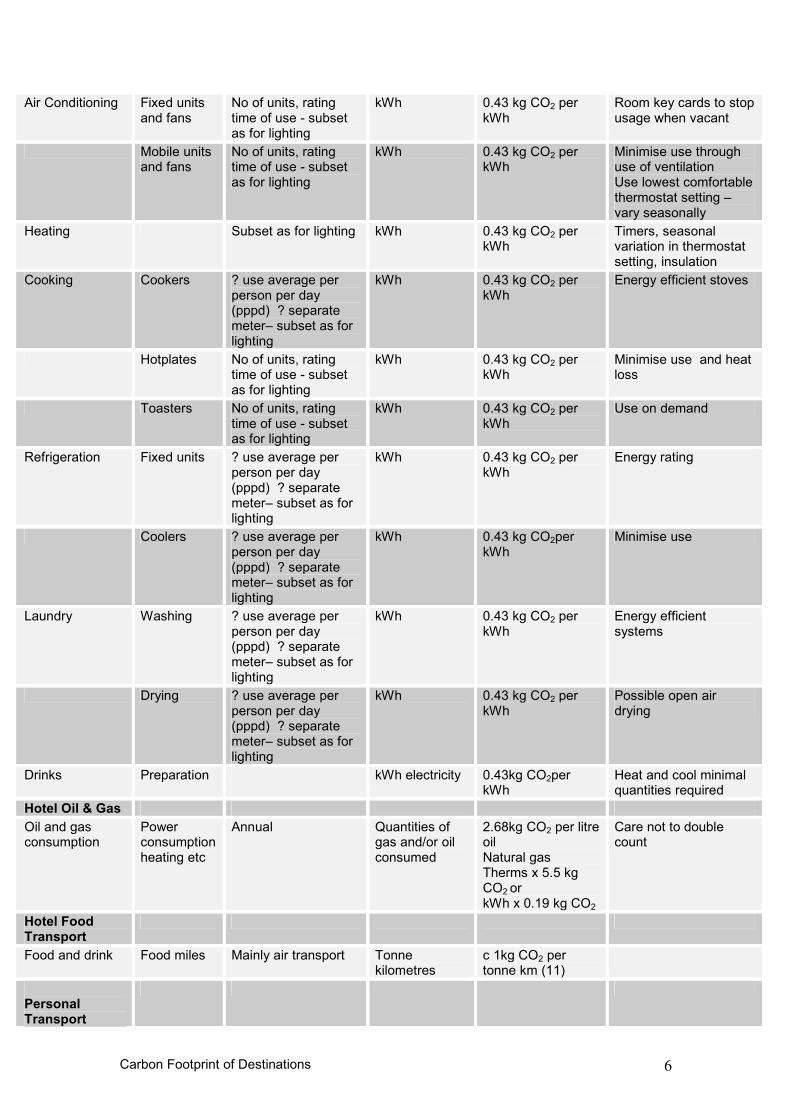
Air Conditioning Fixed units and fans
No of units, rating time of use - subset as for lighting
kWh 0.43 kg CO2 per kWh
Room key cards to stop usage when vacant
Mobile units and fans
No of units, rating time of use - subset as for lighting
kWh 0.43 kg CO2 per kWh
Minimise use through use of ventilation Use lowest comfortable thermostat setting – vary seasonally
Heating Subset as for lighting kWh 0.43 kg CO2 per kWh
Timers, seasonal variation in thermostat setting, insulation
Cooking Cookers ? use average per person per day (pppd) ? separate meter– subset as for lighting
kWh 0.43 kg CO2 per kWh
Energy efficient stoves
Hotplates No of units, rating time of use - subset as for lighting
kWh 0.43 kg CO2 per kWh
Minimise use and heat loss
Toasters No of units, rating time of use - subset as for lighting
kWh 0.43 kg CO2 per kWh
Use on demand
Refrigeration Fixed units ? use average per person per day (pppd) ? separate meter– subset as for lighting
kWh 0.43 kg CO2 per kWh
Energy rating
Coolers ? use average per person per day (pppd) ? separate meter– subset as for lighting
kWh 0.43 kg CO2per kWh
Minimise use
Laundry Washing ? use average per person per day (pppd) ? separate meter– subset as for lighting
kWh 0.43 kg CO2 per kWh
Energy efficient systems
Drying ? use average per person per day (pppd) ? separate meter– subset as for lighting
kWh 0.43 kg CO2 per kWh
Possible open air drying
Drinks Preparation kWh electricity 0.43kg CO2per kWh
Heat and cool minimal quantities required
Hotel Oil & Gas
Oil and gas consumption
Power consumption heating etc
Annual Quantities of gas and/or oil consumed
2.68kg CO2 per litre oil Natural gas Therms x 5.5 kg CO2 or kWh x 0.19 kg CO2
Care not to double count
Hotel Food Transport
Food and drink Food miles Mainly air transport Tonne kilometres
c 1kg CO2 per tonne km (11)
Personal Transport
Carbon Footprint of Destinations 7
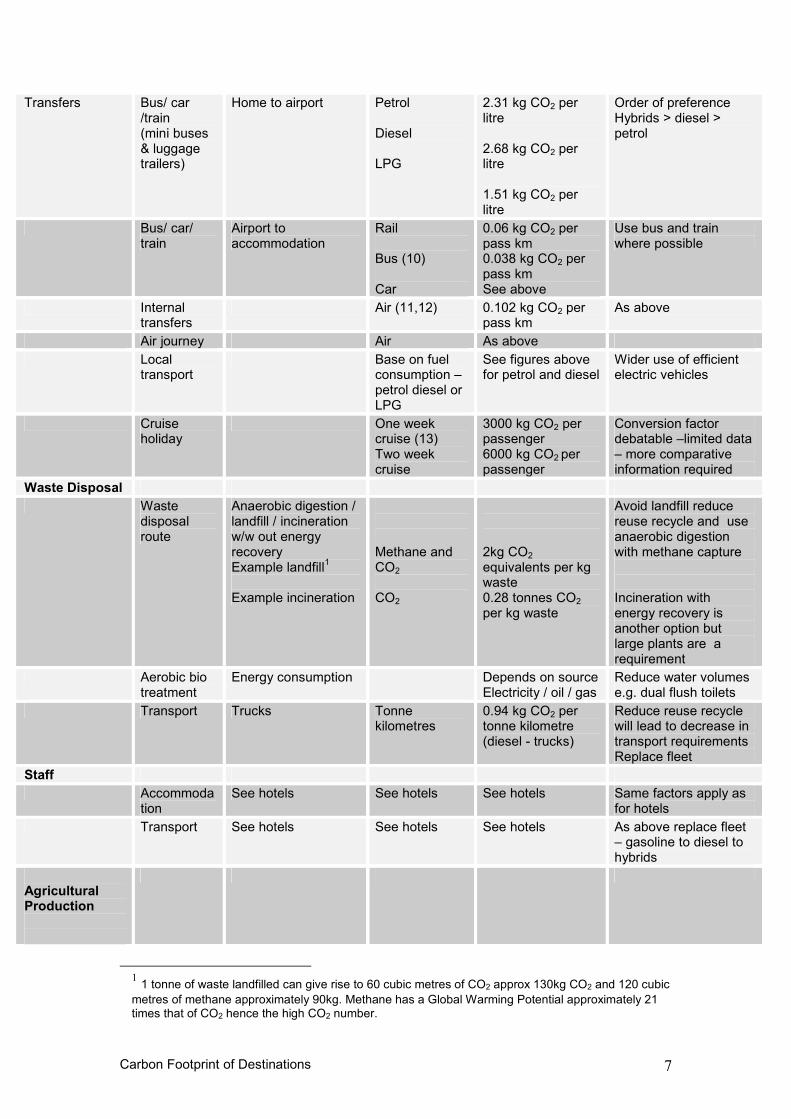
Transfers Bus/ car /train (mini buses & luggage trailers)
Home to airport Petrol Diesel LPG
2.31 kg CO2 per litre 2.68 kg CO2 per litre 1.51 kg CO2 per litre
Order of preference Hybrids > diesel > petrol
Bus/ car/ train
Airport to accommodation
Rail Bus (10) Car
0.06 kg CO2 per pass km 0.038 kg CO2 per pass km See above
Use bus and train where possible
Internal transfers
Air (11,12) 0.102 kg CO2 per pass km
As above
Air journey Air As above
Local transport
Base on fuel consumption – petrol diesel or LPG
See figures above for petrol and diesel
Wider use of efficient electric vehicles
Cruise holiday
One week cruise (13) Two week cruise
3000 kg CO2 per passenger 6000 kg CO2 per passenger
Conversion factor debatable –limited data – more comparative information required
Waste Disposal
Waste disposal route
Anaerobic digestion / landfill / incineration w/w out energy recovery Example landfill
1
Example incineration
Methane and CO2
CO2
2kg CO2 equivalents per kg waste 0.28 tonnes CO2 per kg waste
Avoid landfill reduce reuse recycle and use anaerobic digestion with methane capture Incineration with energy recovery is another option but large plants are a requirement
Aerobic bio treatment
Energy consumption Depends on source Electricity / oil / gas
Reduce water volumes e.g. dual flush toilets
Transport Trucks Tonne kilometres
0.94 kg CO2 per tonne kilometre (diesel - trucks)
Reduce reuse recycle will lead to decrease in transport requirements Replace fleet
Staff
Accommodation
See hotels See hotels See hotels Same factors apply as for hotels
Transport See hotels See hotels See hotels As above replace fleet – gasoline to diesel to hybrids
Agricultural Production
1 1 tonne of waste landfilled can give rise to 60 cubic metres of CO2 approx 130kg CO2 and 120 cubic
metres of methane approximately 90kg. Methane has a Global Warming Potential approximately 21 times that of CO2 hence the high CO2 number.
Carbon Footprint of Destinations 8
Transport See hotels Food miles/kms For air c 1.00 kg CO2 per tonne kilometre (10) Use vehicle miles and fuel consumption for trucks etc
Use local produce
Husbandry Difficult to estimate but could be neutral if no land cleared and crops are cycled
Car/ Vehicle Hire
Small car Fuel consumption km/litre or manufacturers data on CO2
0.17 kg CO2per passenger km (ppkm)
CO2 production in diesel cars is approximately 0.75 that of petrol cars per pass km
Medium car As above As above 0.22 kg CO2 ppkm
Large car As above As above 0.27 kg CO2 ppkm
Events
Conferences etc
Need once-off estimate
Many components as above
Minimise transport use - electric vehicles where possible
Water
Water heating
Energy consumption Depends on source Electricity / oil / gas
Reduce hot water use e.g. low flow shower heads
Bottled water See Food section Use tap water where appropriate
Desalination See 4.3.3
Swimming pools Heating Based on energy consumption
Cover pools
Pumping See 4.23 use low energy circulation systems
The list of potential items is enormous and in approaching such a task for a specific location it is essential to carry out an audit of all energy consuming activities. Some potential additional activity components are illustrated in more detail in the accompanying report. It is also important to use relevant conversion factors. These may well vary, for example the factor used for air travel in Table 1 is significantly different from that used by Becken. Likewise, as already pointed out, the conversion factor for grid electricity to CO2 in New Zealand is likely to be much less than that for the UK (used in Table 1) because of the much greater contribution from hydro power.
4.0 Specific Areas of Energy Consumption In this section two areas are reviewed where there are opportunities to reduce carbon footprints. A detailed study of each of these areas or of the overall impact of food is beyond the scope of this report.
Carbon Footprint of Destinations 9
4.1 Hotel Energy Consumption This section should be read in conjunction with the Travel Foundation Hotel Makeover report (in preparation). Tourist accommodation is perhaps the simplest area of the tourism industry to target for improvements in energy efficiency. On average, hotels spend £700 per bedroom per year on energy. Through careful energy management, hotels can reduce their energy costs between 10% and 40%, saving up to £300 per room. The particular report (14) does not provide sufficient details of energy mix and prices to allow calculation of the CO2 saving. However some idea of the possible scale of the reduction in CO2 emissions can be calculated from a £100 saving in UK consumption of grid electricity. This is equivalent to some 1000 kWh or about 0.43 tonnes of CO2. In hotels the main energy consuming systems are:
- heating - air conditioning and ventilation - hot water production - lighting - electricity (lifts, etc.) - cooking
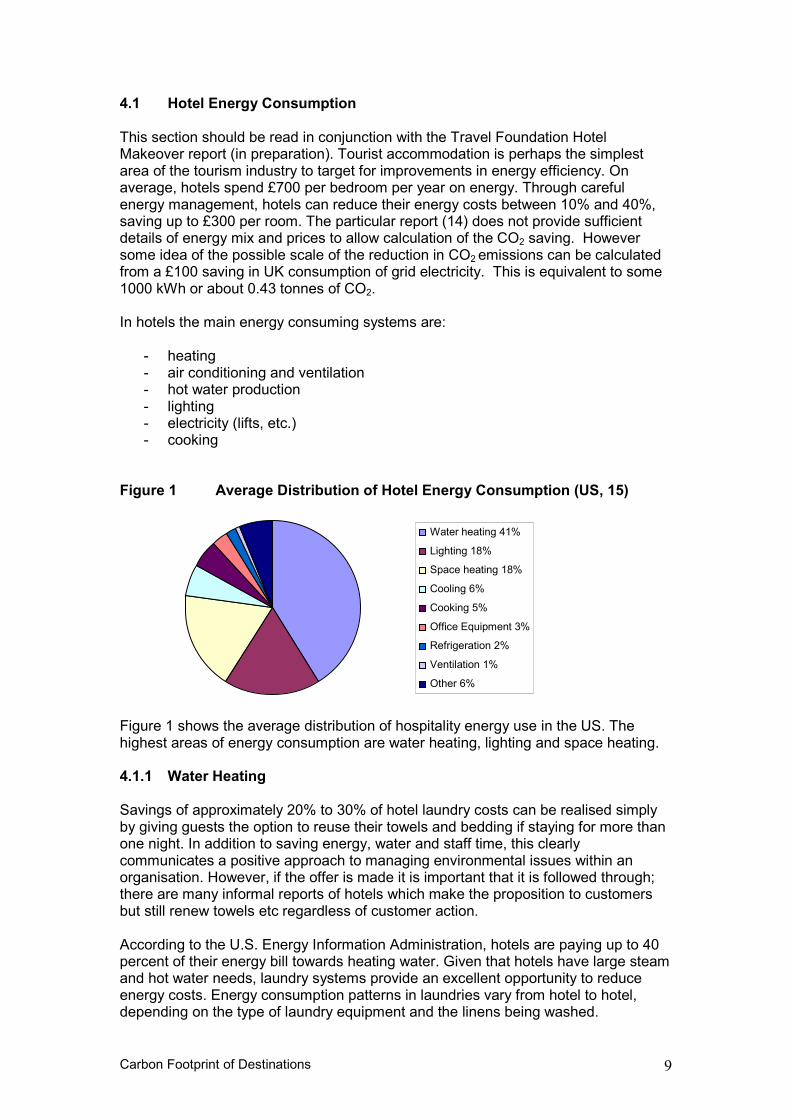
Figure 1 Average Distribution of Hotel Energy Consumption (US, 15)
Figure 1 shows the average distribution of hospitality energy use in the US. The highest areas of energy consumption are water heating, lighting and space heating. 4.1.1 Water Heating Savings of approximately 20% to 30% of hotel laundry costs can be realised simply by giving guests the option to reuse their towels and bedding if staying for more than one night. In addition to saving energy, water and staff time, this clearly communicates a positive approach to managing environmental issues within an organisation. However, if the offer is made it is important that it is followed through; there are many informal reports of hotels which make the proposition to customers but still renew towels etc regardless of customer action. According to the U.S. Energy Information Administration, hotels are paying up to 40 percent of their energy bill towards heating water. Given that hotels have large steam and hot water needs, laundry systems provide an excellent opportunity to reduce energy costs. Energy consumption patterns in laundries vary from hotel to hotel, depending on the type of laundry equipment and the linens being washed.
Water heating 41%
Lighting 18%
Space heating 18%
Cooling 6%
Cooking 5%
Office Equipment 3%
Refrigeration 2%
Ventilation 1%
Other 6%
Carbon Footprint of Destinations 10
4.1.2 Lighting Lighting is the second largest energy-using system in a hotel, and is probably the easiest and most cost-effective area for reducing energy costs. According to the Alliance to Save Energy, fluorescent lamps produce four times as much light per watt than incandescent lamps, and they can last eight to ten times longer. A compact fluorescent light used in place of an incandescent light that is left on continuously for 12 months, all 8,760 hours of the year, will pay for itself in less than one year. The Sheraton Tacoma Hotel developed a project to change to compact fluorescent light fixtures. The staff replaced 2,000 incandescent light fixtures with quadruple-tube compact fluorescent light bulbs in various areas of the hotel such as the guest rooms and the lobby. The cost saving was calculated at up to $15,000 with a payback rate of 18 months. Replacing a single 100 watt bulb that is switched on for 4 hours each day with its 20 watt low energy equivalent will save about 115 kWh per year, equivalent to 50 kg of CO2. While 4 hours a day year round is possibly high, six such substitutions would reduce CO2 emissions by the same amount approximately as a return flight to Majorca. Lighting, ventilation, and other devices or systems can be controlled with a variety of sensors that reduce electricity consumption significantly. A photocell can control day and night operation. Occupancy sensors (motion or ultrasonic) can operate lighting. The infrared sensor uses less energy to operate and is less sensitive to air movement but does not see around corners. An ultrasonic sensor can be used in a restroom and even detect movement around partitions. Other sensors are available that can control operation of a device by door opening, time of day, timer, noise level, and proximity. The Hyatt Regency International Hotel in New Zealand understood that guests often left appliances and heating and cooling systems on, when they were out of their rooms. The hotel developed a project to link energy use with room occupancy. Now, when a guest leaves the room, all energy appliances shut down, with the exception of refrigerators, alarm clocks, and other essential appliances. The project costs were $16,000, while the payback period was only 14 months, with savings of $14,000 annually (16). This will have led to a significant reduction in the CO2 footprint of the hotel. 4.1.3 Heating, Ventilation & Air Conditioning (HVAC) Examples (15) of energy-saving opportunities which can improve HVAC systems efficiency include:
� Insulation: insulate all heating and cooling lines and vessels using appropriate insulation thickness to minimize heat gains or losses.
� Building Envelope: optimize the effective space requiring air conditioning through measures such as false ceilings and segregation of critical areas for air conditioning by air curtains.
� Building Heat Load Minimization: minimize the air conditioning loads by measures such as roof cooling, roof reflectance, efficient lighting, optimal thermostat setting of temperature of air conditioned spaces, sun film applications, etc.
� Solar Heat Gain Control: install awnings, overhangs, or low e-coated windows with low Solar Heat Gain Coefficient (SHGC) for renovation and new construction.
Carbon Footprint of Destinations 11
� Select high-efficiency units when replacing HVAC equipment: reduce energy bills by selecting higher-efficiency air conditioning units. Although some high-efficiency units may be more expensive than average-efficiency units, the higher initial payment can be recovered through increased energy savings in as little as two to five years
� Adjust thermostat and air conditioning settings seasonally a degree or two cooler in winter – a degree or two warmer in summer.
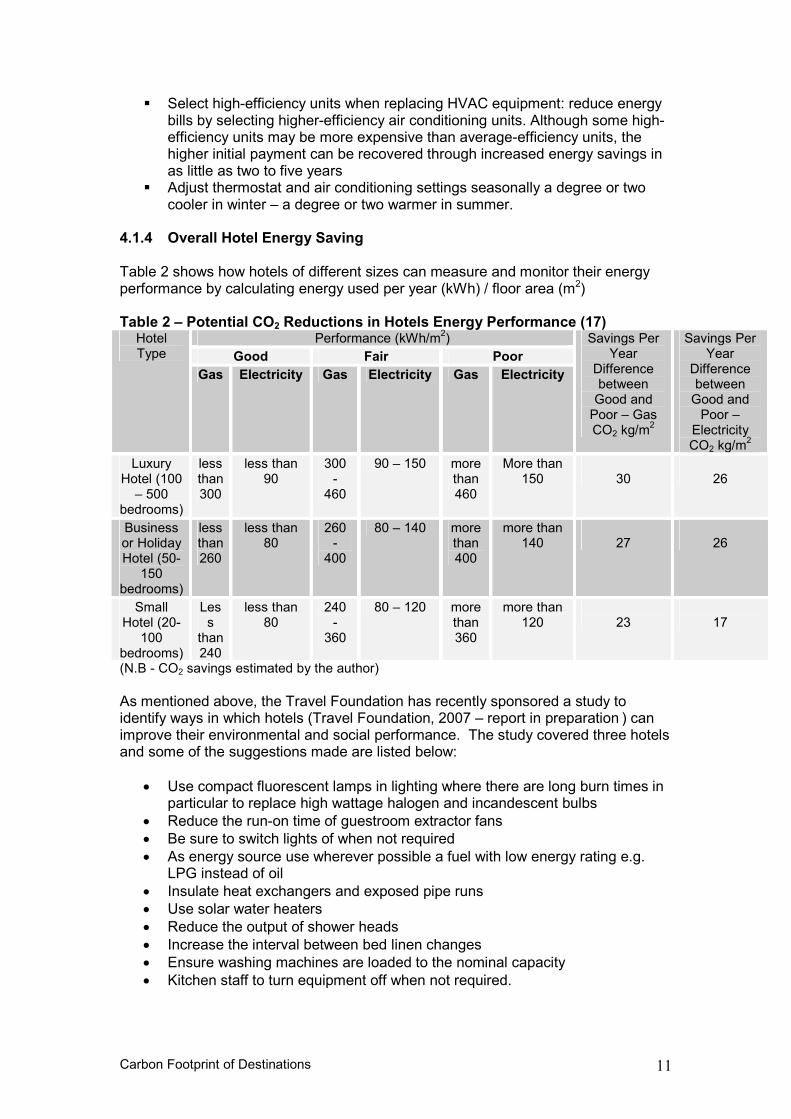
4.1.4 Overall Hotel Energy Saving Table 2 shows how hotels of different sizes can measure and monitor their energy performance by calculating energy used per year (kWh) / floor area (m2) Table 2 – Potential CO2 Reductions in Hotels Energy Performance (17)
Performance (kWh/m2)
Good Fair Poor
Hotel Type
Gas Electricity Gas Electricity Gas Electricity
Savings Per Year
Difference between Good and Poor – Gas CO2 kg/m
2
Savings Per Year
Difference between Good and Poor –
Electricity CO2 kg/m
2
Luxury Hotel (100 – 500
bedrooms)
less than 300
less than 90
300 -
460
90 – 150 more than 460
More than 150
30
26
Business or Holiday Hotel (50-
150 bedrooms)
less than 260
less than 80
260 -
400
80 – 140 more than 400
more than 140
27
26
Small Hotel (20-
100 bedrooms)
Less
than 240
less than 80
240 -
360
80 – 120 more than 360
more than 120
23
17
(N.B - CO2 savings estimated by the author)
As mentioned above, the Travel Foundation has recently sponsored a study to identify ways in which hotels (Travel Foundation, 2007 – report in preparation ) can improve their environmental and social performance. The study covered three hotels and some of the suggestions made are listed below:
• Use compact fluorescent lamps in lighting where there are long burn times in particular to replace high wattage halogen and incandescent bulbs
• Reduce the run-on time of guestroom extractor fans • Be sure to switch lights of when not required • As energy source use wherever possible a fuel with low energy rating e.g.
LPG instead of oil • Insulate heat exchangers and exposed pipe runs • Use solar water heaters • Reduce the output of shower heads • Increase the interval between bed linen changes • Ensure washing machines are loaded to the nominal capacity • Kitchen staff to turn equipment off when not required.
Carbon Footprint of Destinations 12
4.2 Food 4.2.1 Food Miles The Women’s Environmental Network has estimated that a quarter of UK CO2 emissions come from transporting food from growers, via processors and distributors. While this seems high, there is undoubtedly a significant effect in holiday destinations as well as in the UK, where imports account for 95% of fruit and 50% of all vegetables consumed in the UK. For example, it has been shown that an apple from a village shop travelled 38 miles before being eaten, a British supermarket apple travelled 220 miles and a New Zealand apple bought in a UK supermarket travelled 11,300 miles. The Travel Foundation and other organisations have already developed programmes to encourage local farmers to produce for tourism consumption. The potential to develop such programme is primarily economic but also brings significant CO2 benefits. Such initiatives could be carried further by development of local cuisine using local ingredients. 4.2.2 Waste Waste represents a useful resource that can be utilised to reduce energy requirements. While in some situations composting may represent the best environmental option, use of waste to generate energy is one area that has not been fully exploited. The American Hotel and Motel Association (AHMA) has estimated that 25-30% of the total waste stream generated by the hotel industry is food waste (18). Factors that affect the amount of waste generated by a hotel include size of the hotel, number of guest rooms, rate of occupancy, and purchasing practices of the hotel. Larger hotels, in order to accommodate more guests, typically have more restaurants and guest rooms than smaller hotels; and as a result, generate more total waste per hotel (19). One study of wastes from 25 hotels showed that, from 1991-1993, the hotel waste consisted of 46% food waste, 25.3% paper, 11.7% cardboard, 6.7% plastics, 5.6% glass, and 4.5% metals. It has been estimated that around 11% of the food produced in the UK is thrown away. This means that on average we throw away 2.7kgs of food per person, per week. Of this food waste around seven million tonnes (40%) is produced by the large scale food manufacturers within the UK. This waste stream could be made up of animal by products, contaminated packaging, out of date ingredients or simply manufacturing by products. Such waste within the tourism industry could be a valuable source of energy (20). Waste that goes to landfill can produce large amounts of methane, a greenhouse gas with about twenty times the climate impact relative to carbon dioxide (21). While detailed studies of waste practices in destinations would be required, the opportunity to reduce the impact can be illustrated by reference to the UK where 70 percent of landfill gas is captured or flared. By composting waste, an average UK household would reduce methane emissions by an amount equivalent to a small petrol car driving 1000 miles. Anaerobic digestion of wastes provides biogas. Biogas contains about 60 percent methane that can be used to generate electricity or used for heat or for fuel for vehicles. Any animal manure, human sewage or food waste will produce methane during anaerobic digestion. Methane is a greenhouse gas that has 21 times the global warming potential of carbon dioxide. However, it is also a potential fuel and there are many opportunities to recover methane and utilise it with energy recovery.
Carbon Footprint of Destinations 13
One tonne of organic waste can generate over 200 kWh of electricity (equivalent to saving about 80 kg of CO2 equivalent for grid electricity in the UK). Over 125 European anaerobic digestion facilities produce more than 300 Megawatts of electricity (enough to supply 300,000 households), divert millions of tons of food waste from landfills each year, and significantly reduce greenhouse gas emissions. Recently hundreds of farms in Mexico and South America have installed anaerobic digesters to collect and use methane from manure to provide energy for farm use. Many of these digesters have been paid for by a company that aggregates and sells carbon credits to factories and utility companies in countries that signed agreements under the Kyoto protocol to reduce greenhouse emissions (22). Carbon credits are earned by reducing greenhouse gas emissions such as carbon dioxide and methane. These credits have considerable value. There is a real opportunity for the Travel Foundation to investigate the potential for anaerobic digestion technology in the accommodation sector and to identify appropriate technology. 4.2.3 Bottled Water The abstraction, processing, packaging, transportation and sale of bottled water, and disposal of associated waste, involve a significant amount of energy use. A major contribution to the cost of bottled water is likely to be transport, certainly where transport is across international borders. WWF argues that the distribution of bottled water requires substantially more fuel than delivering tap water. This is especially true since over 22 million tonnes of the bottled liquid is transferred each year from country to country. Instead of relying on a mostly pre-existing infrastructure of underground pipes and plumbing, transporting bottled water burns fossil fuels and results in the release of thousands of tonnes of harmful emissions.
Since some bottled water is also shipped or stored cold, electricity is expended for refrigeration. Energy is likewise used in bottled water processing. In filtration, an estimated two gallons of water are wasted for every gallon purified
Most containers for bottled water are made from non-degradable plastics and are not reused or recycled. With both landfill and incineration becoming options of last choice, reusing and recycling systems would benefit the environment, save energy and, increasingly, are likely to be cost-effective options (23). These are some areas where there are opportunities for the Travel Foundation to promote best practice in water use and waste management.
4.2.4 Desalination Desalination is highly energy intensive (24). A report published by the US State of Texas indicates desalination uses 10.6 kWh per thousand gallons produced. A 10 million gallon per day facility will consume 106,000 kWh per day and will produce 33,700 kg carbon dioxide per day or 12,300 tonnes of carbon dioxide per year. 5.0 Energy Saving Tips The lists below give some ideas on how everyone can contribute to reducing the carbon footprint of tourism:
Carbon Footprint of Destinations 14
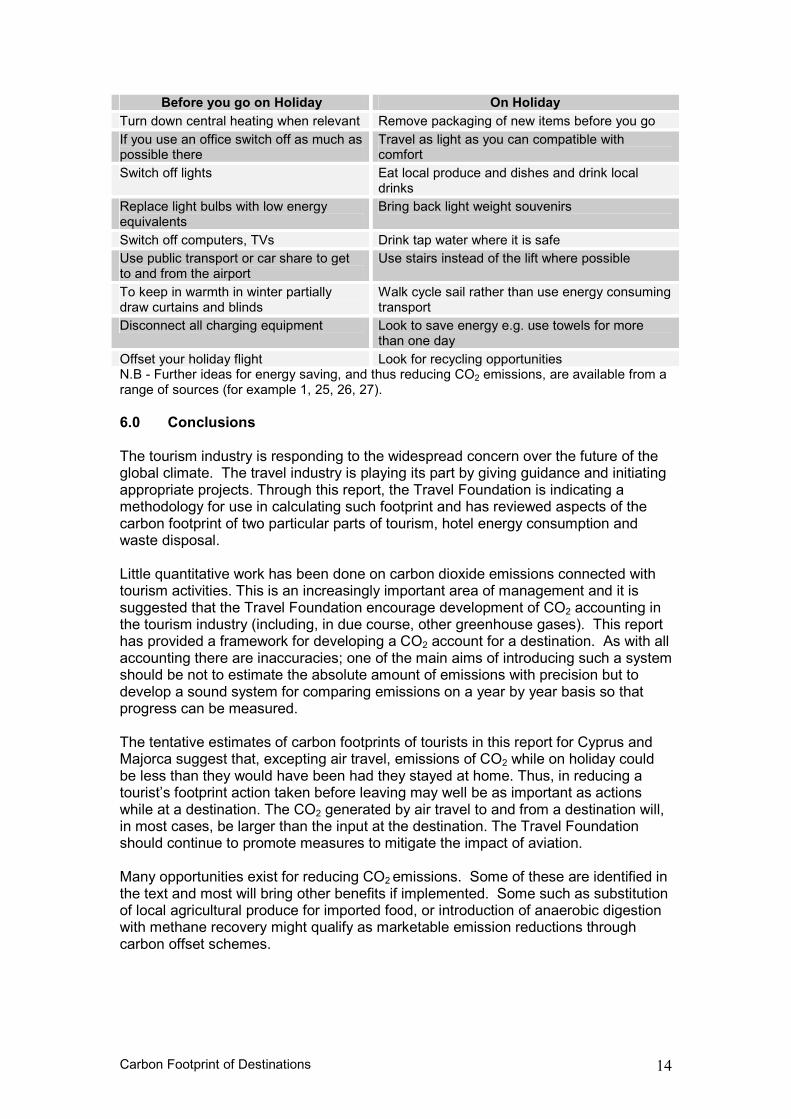
Before you go on Holiday On Holiday
Turn down central heating when relevant Remove packaging of new items before you go
If you use an office switch off as much as possible there
Travel as light as you can compatible with comfort
Switch off lights Eat local produce and dishes and drink local drinks
Replace light bulbs with low energy equivalents
Bring back light weight souvenirs
Switch off computers, TVs Drink tap water where it is safe
Use public transport or car share to get to and from the airport
Use stairs instead of the lift where possible
To keep in warmth in winter partially draw curtains and blinds
Walk cycle sail rather than use energy consuming transport
Disconnect all charging equipment Look to save energy e.g. use towels for more than one day
Offset your holiday flight Look for recycling opportunities N.B - Further ideas for energy saving, and thus reducing CO2 emissions, are available from a range of sources (for example 1, 25, 26, 27).
6.0 Conclusions The tourism industry is responding to the widespread concern over the future of the global climate. The travel industry is playing its part by giving guidance and initiating appropriate projects. Through this report, the Travel Foundation is indicating a methodology for use in calculating such footprint and has reviewed aspects of the carbon footprint of two particular parts of tourism, hotel energy consumption and waste disposal. Little quantitative work has been done on carbon dioxide emissions connected with tourism activities. This is an increasingly important area of management and it is suggested that the Travel Foundation encourage development of CO2 accounting in the tourism industry (including, in due course, other greenhouse gases). This report has provided a framework for developing a CO2 account for a destination. As with all accounting there are inaccuracies; one of the main aims of introducing such a system should be not to estimate the absolute amount of emissions with precision but to develop a sound system for comparing emissions on a year by year basis so that progress can be measured. The tentative estimates of carbon footprints of tourists in this report for Cyprus and Majorca suggest that, excepting air travel, emissions of CO2 while on holiday could be less than they would have been had they stayed at home. Thus, in reducing a tourist’s footprint action taken before leaving may well be as important as actions while at a destination. The CO2 generated by air travel to and from a destination will, in most cases, be larger than the input at the destination. The Travel Foundation should continue to promote measures to mitigate the impact of aviation. Many opportunities exist for reducing CO2 emissions. Some of these are identified in the text and most will bring other benefits if implemented. Some such as substitution of local agricultural produce for imported food, or introduction of anaerobic digestion with methane recovery might qualify as marketable emission reductions through carbon offset schemes.
Carbon Footprint of Destinations 15
Appendix I 1.0 Further Details of Footprint Studies Reviewed in the Report (Please note that the Appendix is an expanded version of some of the text in the main report)
1.1 Ecological Footprints One approach to tourism footprinting has been developed by WWF (4,5). This uses a mechanism for calculating the ecological footprint that a holiday product has on the environment, in terms of the resources used. The approach integrates the environmental impacts associated with a holiday into a single aggregated indicator. It is broader than a carbon footprint and usually converts the impact into area units where one area unit is one hectare of world average bioproductive space. WWF indicates that around 2 such units were available per person on the planet (2002). The average UK footprint per capita (1996) has been estimated at 6.3 area units (4). The 2002 report analysed the footprint of typical summer package holidays in two Mediterranean destinations, Majorca and Cyprus, based on data provided by Thomson holidays. Another example where this approach has been used is in estimating the national ecological footprint of Wales (28). For the calculation, land and sea area is divided into four basic types: bioproductive land; bioproductive sea, energy land (forested land required for the absorption of carbon emissions) and built land (buildings roads, etc). Transport, for example requires built land for roads, parking, airports, rail tracks etc as well as a large amount of forested land to absorb carbon emissions from fuel consumption. Transport obviously also requires energy and materials are required for construction and maintenance. This approach is intellectually appealing and while it has been applied (for example Gossling et al, 2002 (6), Hunter and Shaw, 2005 (7)), it has not been widely adopted by the tourism community and suffers from some difficulties in conversion of the impacts to common units. For example, there is some debate over the relevance of forestry to compensating for CO2 emissions. Also the approach takes no account of social and economic impacts. 1.2 Carbon Dioxide Footprints – Majorca and Cyprus The WWF paper can be used as a base to make some estimates of carbon dioxide (CO2) emissions or the ‘carbon footprint’ associated with a holiday destination. The major component is air travel despite the improvements in technology and operational aspects such as the high load factors (percentage of seats occupied) achieved by some operators. The calculations that follow should be taken as illustrative only, much greater precision would be required to come to definite conclusions. For Majorca the ecological footprint per bed night was calculated as 0.03 hectares of which air travel accounted for 0.02 and for Cyprus 0.07 hectares (air travel 0.03). For Cyprus the energy footprint was 363 units (4.5% of total) and, for Majorca, 134 units (3.4% of the total). In Majorca and Cyprus air travel accounted for 57% and 46% respectively. These components are further broken down in the WWF paper; this breakdown has allowed the present estimation of carbon dioxide emissions in Table 1.
Carbon Footprint of Destinations 16
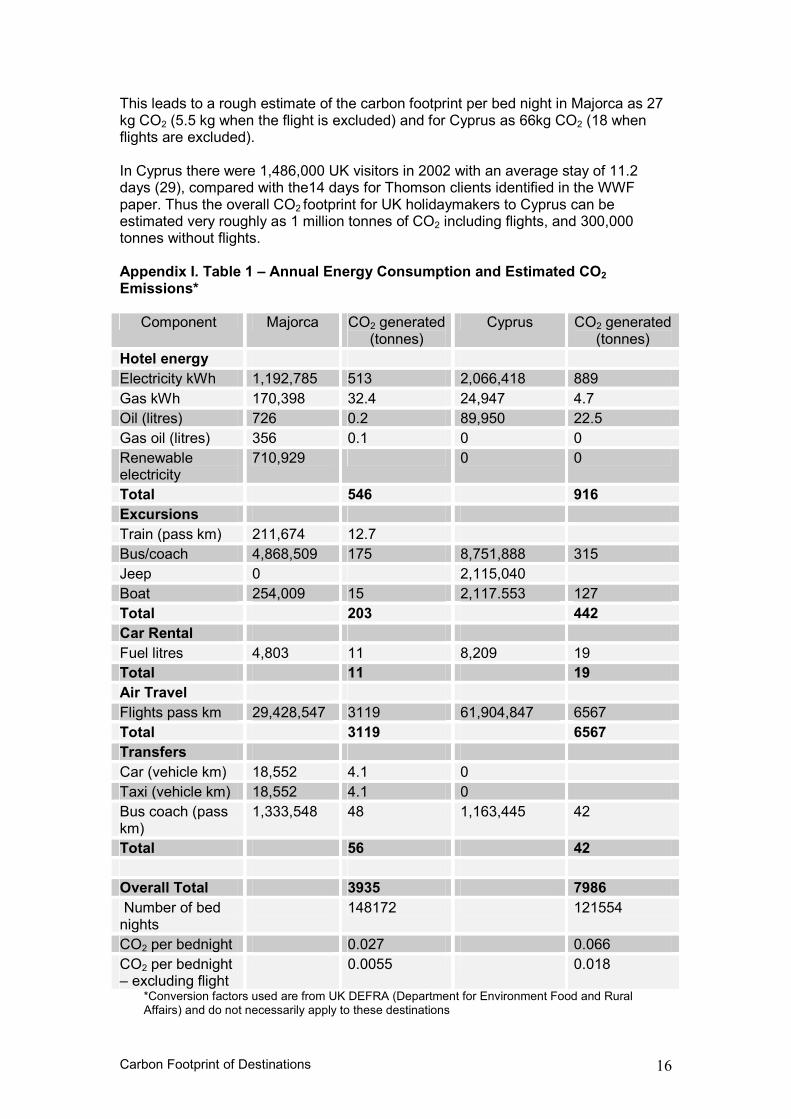
This leads to a rough estimate of the carbon footprint per bed night in Majorca as 27 kg CO2 (5.5 kg when the flight is excluded) and for Cyprus as 66kg CO2 (18 when flights are excluded). In Cyprus there were 1,486,000 UK visitors in 2002 with an average stay of 11.2 days (29), compared with the14 days for Thomson clients identified in the WWF paper. Thus the overall CO2 footprint for UK holidaymakers to Cyprus can be estimated very roughly as 1 million tonnes of CO2 including flights, and 300,000 tonnes without flights. Appendix I. Table 1 – Annual Energy Consumption and Estimated CO2 Emissions*
Component Majorca CO2 generated (tonnes)
Cyprus CO2 generated (tonnes)
Hotel energy
Electricity kWh 1,192,785 513 2,066,418 889
Gas kWh 170,398 32.4 24,947 4.7
Oil (litres) 726 0.2 89,950 22.5
Gas oil (litres) 356 0.1 0 0
Renewable electricity
710,929 0 0
Total 546 916
Excursions
Train (pass km) 211,674 12.7
Bus/coach 4,868,509 175 8,751,888 315
Jeep 0 2,115,040
Boat 254,009 15 2,117.553 127
Total 203 442
Car Rental
Fuel litres 4,803 11 8,209 19
Total 11 19
Air Travel
Flights pass km 29,428,547 3119 61,904,847 6567
Total 3119 6567
Transfers
Car (vehicle km) 18,552 4.1 0
Taxi (vehicle km) 18,552 4.1 0
Bus coach (pass km)
1,333,548 48 1,163,445 42
Total 56 42
Overall Total 3935 7986
Number of bed nights
148172 121554
CO2 per bednight 0.027 0.066
CO2 per bednight – excluding flight
0.0055 0.018
*Conversion factors used are from UK DEFRA (Department for Environment Food and Rural Affairs) and do not necessarily apply to these destinations
Carbon Footprint of Destinations 17
In Majorca there were 2,025,000 UK visitors in 2002 (30), 31% of the total. The average stay was 9.3 days giving a total of 18.83 million bed nights. This leads to an overall CO2 footprint for UK visitors of 103,000 tonnes CO2, or 508,000 tonnes CO2 if aviation is included. The CO2 per bed night can be compared with the average domestic per capita energy consumption in the UK equivalent to about 5.4 – 6.0 kg CO2 per night (for example, 31). This figure is remarkably close to the CO2 per bed night for a visitor to Majorca. This suggests that the net footprint could be close to zero or even negative (in terms of CO2) for some destinations.
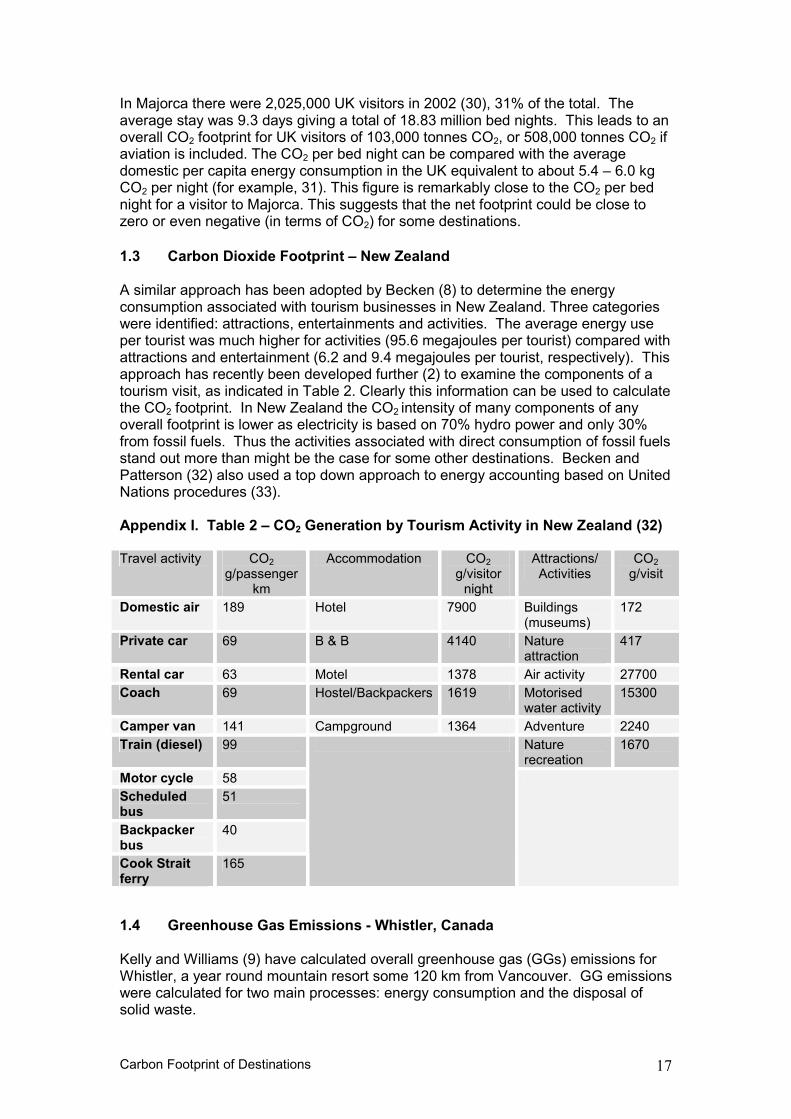
1.3 Carbon Dioxide Footprint – New Zealand A similar approach has been adopted by Becken (8) to determine the energy consumption associated with tourism businesses in New Zealand. Three categories were identified: attractions, entertainments and activities. The average energy use per tourist was much higher for activities (95.6 megajoules per tourist) compared with attractions and entertainment (6.2 and 9.4 megajoules per tourist, respectively). This approach has recently been developed further (2) to examine the components of a tourism visit, as indicated in Table 2. Clearly this information can be used to calculate the CO2 footprint. In New Zealand the CO2 intensity of many components of any overall footprint is lower as electricity is based on 70% hydro power and only 30% from fossil fuels. Thus the activities associated with direct consumption of fossil fuels stand out more than might be the case for some other destinations. Becken and Patterson (32) also used a top down approach to energy accounting based on United Nations procedures (33). Appendix I. Table 2 – CO2 Generation by Tourism Activity in New Zealand (32) Travel activity CO2
g/passenger km
Accommodation CO2 g/visitor night
Attractions/ Activities
CO2 g/visit
Domestic air 189 Hotel 7900 Buildings (museums)
172
Private car 69 B & B 4140 Nature attraction
417
Rental car 63 Motel 1378 Air activity 27700
Coach 69 Hostel/Backpackers 1619 Motorised water activity
15300
Camper van 141 Campground 1364 Adventure 2240
Train (diesel) 99 Nature recreation
1670
Motor cycle 58
Scheduled bus
51
Backpacker bus
40
Cook Strait ferry
165
1.4 Greenhouse Gas Emissions - Whistler, Canada Kelly and Williams (9) have calculated overall greenhouse gas (GGs) emissions for Whistler, a year round mountain resort some 120 km from Vancouver. GG emissions were calculated for two main processes: energy consumption and the disposal of solid waste.
Carbon Footprint of Destinations 18
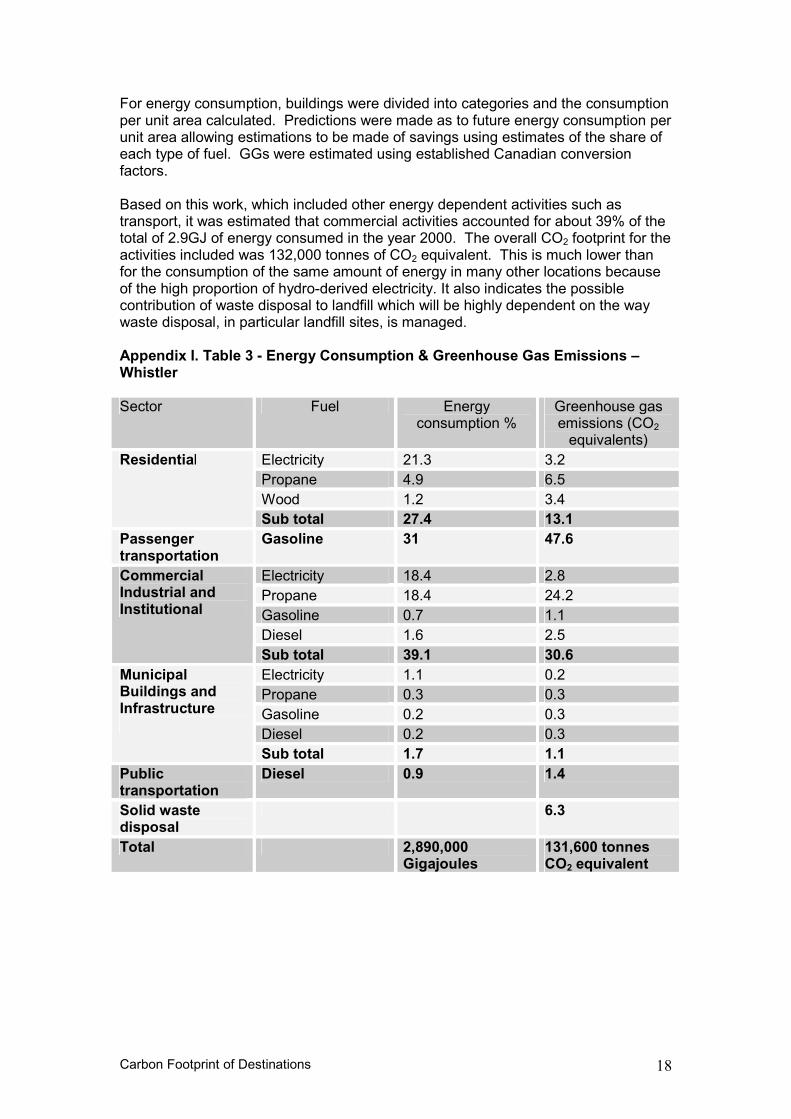
For energy consumption, buildings were divided into categories and the consumption per unit area calculated. Predictions were made as to future energy consumption per unit area allowing estimations to be made of savings using estimates of the share of each type of fuel. GGs were estimated using established Canadian conversion factors. Based on this work, which included other energy dependent activities such as transport, it was estimated that commercial activities accounted for about 39% of the total of 2.9GJ of energy consumed in the year 2000. The overall CO2 footprint for the activities included was 132,000 tonnes of CO2 equivalent. This is much lower than for the consumption of the same amount of energy in many other locations because of the high proportion of hydro-derived electricity. It also indicates the possible contribution of waste disposal to landfill which will be highly dependent on the way waste disposal, in particular landfill sites, is managed. Appendix I. Table 3 - Energy Consumption & Greenhouse Gas Emissions – Whistler Sector Fuel Energy
consumption % Greenhouse gas emissions (CO2 equivalents)
Electricity 21.3 3.2
Propane 4.9 6.5
Wood 1.2 3.4
Residential
Sub total 27.4 13.1
Passenger transportation
Gasoline 31 47.6
Electricity 18.4 2.8
Propane 18.4 24.2
Gasoline 0.7 1.1
Diesel 1.6 2.5
Commercial Industrial and Institutional
Sub total 39.1 30.6
Electricity 1.1 0.2
Propane 0.3 0.3
Gasoline 0.2 0.3
Diesel 0.2 0.3
Municipal Buildings and Infrastructure
Sub total 1.7 1.1
Public transportation
Diesel 0.9 1.4
Solid waste disposal
6.3
Total 2,890,000 Gigajoules
131,600 tonnes CO2 equivalent
References 1. The Travel Foundation, 2006. Insider Guide: Climate Change and Tourism 2. Becken and Murray, 2006. Journal of Sustainable Tourism 14. Measuring
Nnational Carbon Dioxide Emissions from Tourism as a Key Step towards Achieving Sustainable Tourism
3. INESCC www.inescc.pt/urepe/chose/energy.htm 4. WWF, 2000. Living Planet Report. WWF, Goldalming, UK. 5. WWF, 2002. Holiday Footprinting – A Practical Guide for Responsible Tourism.
WWF, Goldalming, UK. 6. Gossling, S. Hansson, C.B. Horstmeier, O and Saggel, S. 2002. Ecological
Economics, 43, 199-211. 7. Hunter, C and Shaw, J 2005. Environmental Conservation. 32, 294-304. 8. Becken, S 2001. Energy Consumption of Tourist Attractions and Activities in
New Zealand. Summary report of a survey. Lincoln University, New Zealand. 9. Kelly, J. and Williams P. W., 2007. Modelling Tourism Destination Energy
Consumption and Greenhouse Gas Emissions. Whistler, British Columbia, Canada. Journal of Sustainable Tourism 15, 67-90.
10. DEFRA www.defra.gov.uk/environment/business/envrp/gas/05.htm 11. Sustainable Aviation, 2006 (assuming 100kg weight per passenger).
www.sustainableaviation.co.uk 12. DEFRA as above plus Hansard 20.7.05. 13. Based on limited information. QE2 published fuel consumption and typical
cruise schedule www.qe2.org.uk/ 14. Egeneration
www.egeneration.co.uk/centre/modules/sustainable_tourism/3_energyefficiency.asp
15. Alliance To Save Energy: Hotel Energy Efficiency www.ase.org/section/topic/ee_hotels
16. Zero Waste Alliance ‘Green Hotels: Opportunities & Resources for Success’ www.zerowaste.org/publications/GREEN_HO.PDF#search=%22Hotel%20food%20waste%20figures%22
17. Action Energy Guide 36. Energy Efficiency in Hotels – A Guide for Owners and Managers. www.egeneration.co.uk/centre/modules/sustainable_tourism/3_energyefficiency.asp
18. Alaska Conservation Solutions. http://www.alaskaconservationsolutions.com/acs/akcalculator.html
19. Nevada Division of Environmental Protection. http://ndep.nv.gov/recycl/what.htm
20. Earthtoys. www.earthtoys.com/emagazine.php?issue_number=06.12.01&article=waste
21. Learning Joy Resources – Methane from Biogas. www.learningjoyresources.com/AD.html
22. Earthpledge – Waste = Fuel. www.earthpledge.org/foodwaste.html 23. The Chartered Institution of Water and Environmental Management.
www.ciwem.org/policy/policies/bottled_water.asp 24. Edie Net www.edie.net/Library/view_article.asp?id=3916&channel=0 25. ABB ‘Top 100 Energy Saving Tips’.
http://www.abb.co.uk/cawp/gbabb903/3e322697ff65ce50c1256c6700532460.aspx#skilift
26. Green Consumer Guide. http://www.greenconsumerguide.com/commercial.php?news=3227

Carbon Footprint of Destinations 1
27. The Carbon Trust. http://www.carbontrust.co.uk/default.ct 28. Stockholm Environment Institute, 2004. Reducing Wales Ecological Footprint.
SEI, York. 29. Visit Cyprus. www.visitcyprus.org 30. Dades Informatives 2002. Illes Balears. 31. National Statistics www.statistics.gov.uk/STATBASE/ssdataset.asp?vInk=7287
Brighton Webs Ltd www.brighton-webs.co.uk/Energy/default.asp 32. Becken, S and Patterson, M. 2006. Journal of Sustainable Tourism. 14, 323-
328. 33. Integrated – Environmental and Economic Accounting: Interim Version 1993.
Handbook of National Accounting Series F No 61. New York, United Nations.