Embed Size (px)
Citation preview
2 0 0 0 - 2 0 1 2TOURISM IN ISRAEL
Statistilite 135
2
Incomingtourism Number of visitors
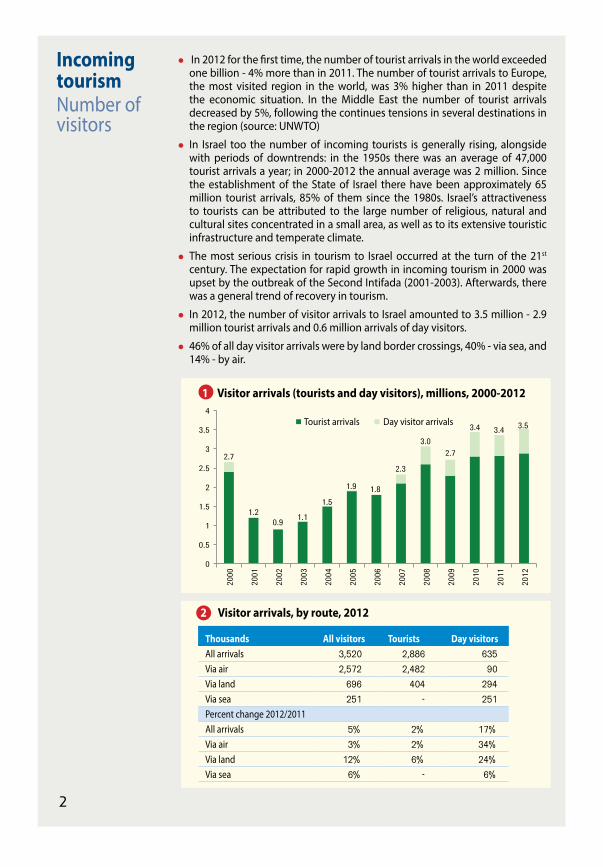
In 2012 for the first time, the number of tourist arrivals in the world exceeded one billion - 4% more than in 2011. The number of tourist arrivals to Europe, the most visited region in the world, was 3% higher than in 2011 despite the economic situation. In the Middle East the number of tourist arrivals decreased by 5%, following the continues tensions in several destinations in the region (source: UNWTO)
In Israel too the number of incoming tourists is generally rising, alongside with periods of downtrends: in the 1950s there was an average of 47,000 tourist arrivals a year; in 2000-2012 the annual average was 2 million. Since the establishment of the State of Israel there have been approximately 65 million tourist arrivals, 85% of them since the 1980s. Israel’s attractiveness to tourists can be attributed to the large number of religious, natural and cultural sites concentrated in a small area, as well as to its extensive touristic infrastructure and temperate climate.
The most serious crisis in tourism to Israel occurred at the turn of the 21st century. The expectation for rapid growth in incoming tourism in 2000 was upset by the outbreak of the Second Intifada (2001-2003). Afterwards, there was a general trend of recovery in tourism.
In 2012, the number of visitor arrivals to Israel amounted to 3.5 million - 2.9 million tourist arrivals and 0.6 million arrivals of day visitors.
46% of all day visitor arrivals were by land border crossings, 40% - via sea, and 14% - by air.
0
0.5
1
1.5
2
2.5
3
3.5
4
2000
2001
2002
2003
2004
2005
2006
2007
2008
2009
2010
2011
2012
Tourist arrivals Day visitor arrivals
2 Visitor arrivals, by route, 2012
Thousands All visitors Tourists Day visitorsAll arrivals 3,520 2,886 635Via air 2,572 2,482 90Via land 696 404 294Via sea 251 - 251Percent change 2012/2011All arrivals 5% 2% 17%Via air 3% 2% 34%Via land 12% 6% 24%Via sea 6% - 6%
1 Visitor arrivals (tourists and day visitors), millions, 2000-2012
2.7
1.20.9 1.1
1.5
1.9 1.8
2.3
3.02.7
3.4 3.4 3.5
3
IncomingtourismThe visitors1
1 Data on religion of tourists were obtained from a survey conducted for the Ministry of Tourism among tourists who departed the country in January-June, 2012.
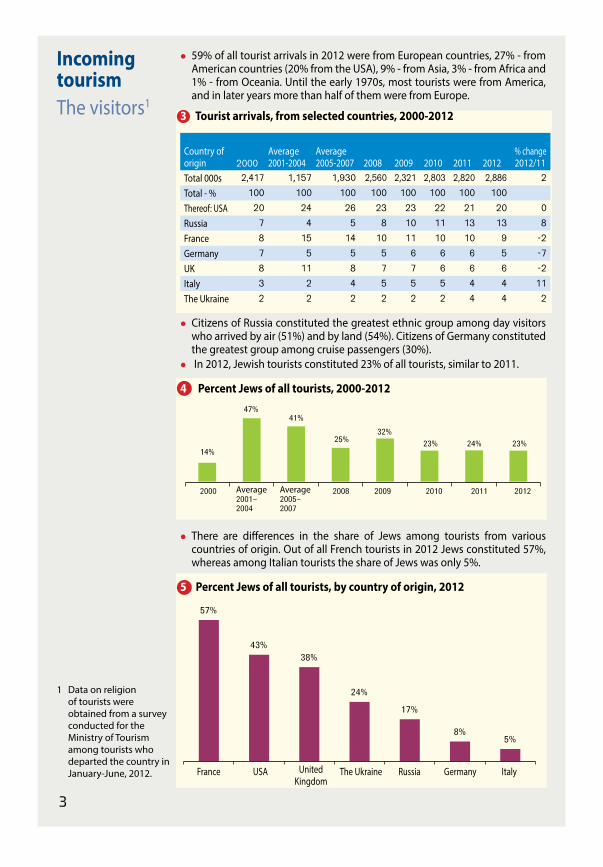
59% of all tourist arrivals in 2012 were from European countries, 27% - from American countries (20% from the USA), 9% - from Asia, 3% - from Africa and 1% - from Oceania. Until the early 1970s, most tourists were from America, and in later years more than half of them were from Europe.
3 Tourist arrivals, from selected countries, 2000-2012
Country of origin 2000
Average 2001-2004
Average 2005-2007 2008 2009 2010 2011 2012
% change 2012/11
Total 000s 2,417 1,157 1,930 2,560 2,321 2,803 2,820 2,886 2Total - % 100 100 100 100 100 100 100 100Thereof: USA 20 24 26 23 23 22 21 20 0Russia 7 4 5 8 10 11 13 13 8France 8 15 14 10 11 10 10 9 -2Germany 7 5 5 5 6 6 6 5 -7UK 8 11 8 7 7 6 6 6 -2Italy 3 2 4 5 5 5 4 4 11The Ukraine 2 2 2 2 2 2 4 4 2
Citizens of Russia constituted the greatest ethnic group among day visitors who arrived by air (51%) and by land (54%). Citizens of Germany constituted the greatest group among cruise passengers (30%).
In 2012, Jewish tourists constituted 23% of all tourists, similar to 2011.
4 Percent Jews of all tourists, 2000-2012
There are differences in the share of Jews among tourists from various countries of origin. Out of all French tourists in 2012 Jews constituted 57%, whereas among Italian tourists the share of Jews was only 5%.
5 Percent Jews of all tourists, by country of origin, 2012
2000 2008 2009 2010 2011 2012
14%
47%41%
25%32%
23% 23%24%
Average2005-2007
Average2001-2004
57%
43% 38%
24%
17%
8% 5%
France USA The Ukraine Russia Germany Italy United
Kingdom
4
IncomingtourismThe visit1
1 Data were obtained from a survey conducted for the Ministry of Tourism among tourists who departed the country in January-June, 2012.
1-4 days25%
5-9 days40%
30+ days8%20-29 days
5%
10-19 days22%
17%20%
17% 15%12%10%
6% 8%2%
38%
28% 29%
37%33%
28%
2010 2011 2012
Pilgrimage OtherBusiness and conferences
Visit of relatives
Touring & leisure
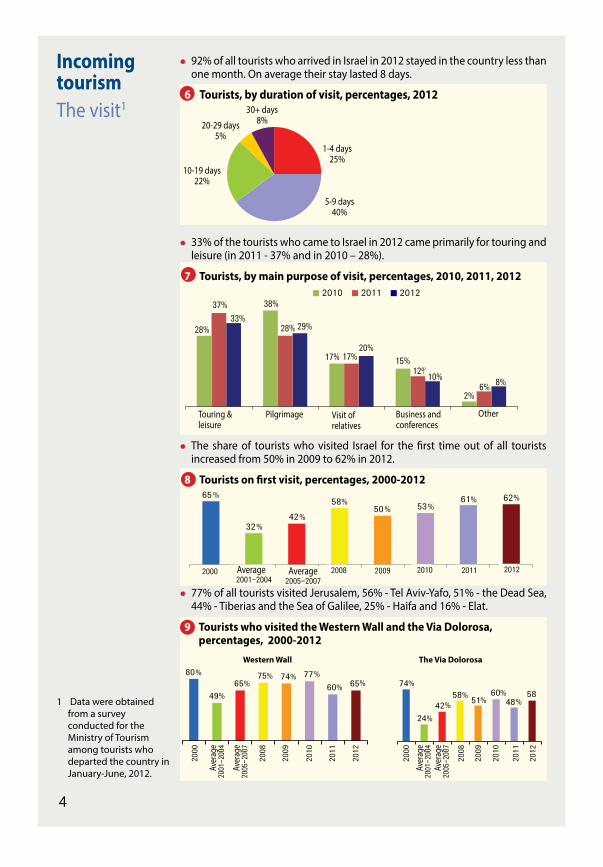
92% of all tourists who arrived in Israel in 2012 stayed in the country less than one month. On average their stay lasted 8 days.
6 Tourists, by duration of visit, percentages, 2012
33% of the tourists who came to Israel in 2012 came primarily for touring and leisure (in 2011 - 37% and in 2010 – 28%).
7 Tourists, by main purpose of visit, percentages, 2010, 2011, 2012
The share of tourists who visited Israel for the first time out of all tourists increased from 50% in 2009 to 62% in 2012.
8 Tourists on first visit, percentages, 2000-2012
77% of all tourists visited Jerusalem, 56% - Tel Aviv-Yafo, 51% - the Dead Sea, 44% - Tiberias and the Sea of Galilee, 25% - Haifa and 16% - Elat.
9 Tourists who visited the Western Wall and the Via Dolorosa, percentages, 2000-2012
65
32 42 58
50 53 61 62
2000 Average2005-2007
Average2001-2004
2008 2009 2010 2011 2012
2000
2000
Aver
age
2005
-200
7
Aver
age
2005
-200
7
Aver
age
2001
-200
4
Aver
age
2001
-200
4
2008
2008
2009
2009
2010
2010
2011
2011
2012
2012
80
49 65 75 74 77 60 65 74
24 42 58 51 60
48 58
Western Wall The Via Dolorosa
5
9.7
3.8 2.6 3.3
4.8
6.8 6.9 8.4
10.2
8.1 9.9 9.9 9.8
2000
2001
2002
2003
2004
2005
2006
2007
2008
2009
2010
2011
2012
Incoming tourismTourist-nights1
1 Person-nights of foreign tourists in tourist hotels (recommended by the Ministry of Tourism).
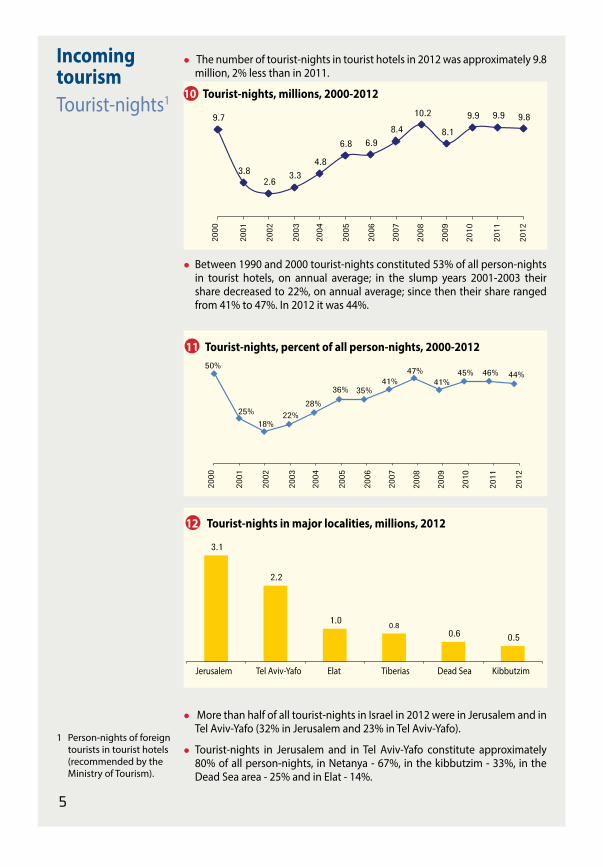
The number of tourist-nights in tourist hotels in 2012 was approximately 9.8 million, 2% less than in 2011.
10 Tourist-nights, millions, 2000-2012
Between 1990 and 2000 tourist-nights constituted 53% of all person-nights in tourist hotels, on annual average; in the slump years 2001-2003 their share decreased to 22%, on annual average; since then their share ranged from 41% to 47%. In 2012 it was 44%.
11 Tourist-nights, percent of all person-nights, 2000-2012
12 Tourist-nights in major localities, millions, 2012
More than half of all tourist-nights in Israel in 2012 were in Jerusalem and in Tel Aviv-Yafo (32% in Jerusalem and 23% in Tel Aviv-Yafo).
Tourist-nights in Jerusalem and in Tel Aviv-Yafo constitute approximately 80% of all person-nights, in Netanya - 67%, in the kibbutzim - 33%, in the Dead Sea area - 25% and in Elat - 14%.
2000
2001
2002
2003
2004
2005
2006
2007
2008
2009
2010
2011
2012
50%
25%18%
22%28%
36% 35%41%
47%41%
45% 46% 44%
0.5 0.6 0.8 1.0
2.2
3.1
Jerusalem Tel Aviv-Yafo Elat Tiberias Dead Sea Kibbutzim
6
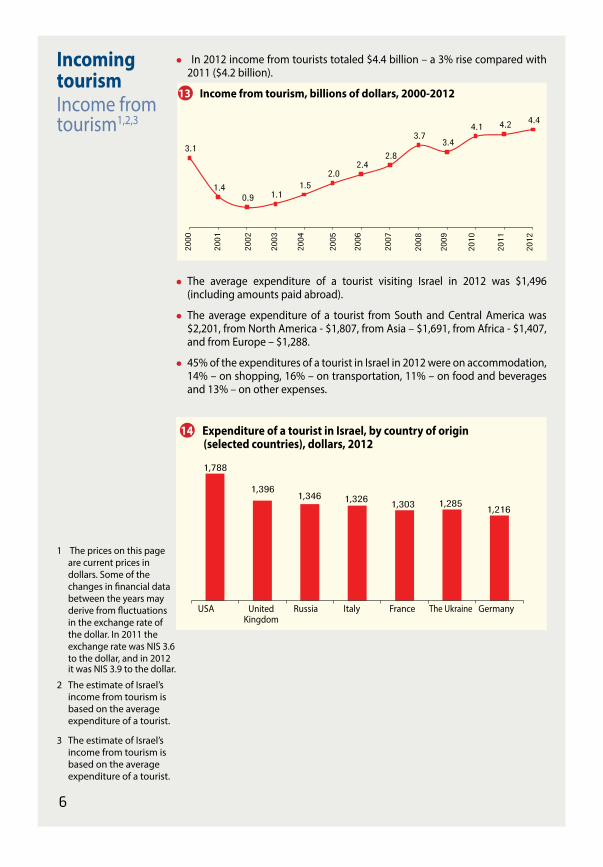
In 2012 income from tourists totaled $4.4 billion – a 3% rise compared with 2011 ($4.2 billion).
13 Income from tourism, billions of dollars, 2000-2012
The average expenditure of a tourist visiting Israel in 2012 was $1,496 (including amounts paid abroad).
The average expenditure of a tourist from South and Central America was $2,201, from North America - $1,807, from Asia – $1,691, from Africa - $1,407, and from Europe – $1,288.
45% of the expenditures of a tourist in Israel in 2012 were on accommodation, 14% – on shopping, 16% – on transportation, 11% – on food and beverages and 13% – on other expenses.
14 Expenditure of a tourist in Israel, by country of origin (selected countries), dollars, 2012
2000
2001
2002
2003
2004
2005
2006
2007
2008
2009
2010
2011
2012
3.1
1.4 0.9 1.1
1.5 2.0
2.4 2.8
3.7 3.4 4.1 4.2 4.4
1,788
1,396 1,346 1,326 1,303 1,285 1,216
USA Russia Italy France The Ukraine Germany UnitedKingdom
Incoming tourismIncome from tourism1,2,3
1 The prices on this page are current prices in dollars. Some of the changes in financial data between the years may derive from fluctuations in the exchange rate of the dollar. In 2011 the exchange rate was NIS 3.6 to the dollar, and in 2012 it was NIS 3.9 to the dollar.
2 The estimate of Israel’s income from tourism is based on the average expenditure of a tourist.
3 The estimate of Israel’s income from tourism is based on the average expenditure of a tourist.
7
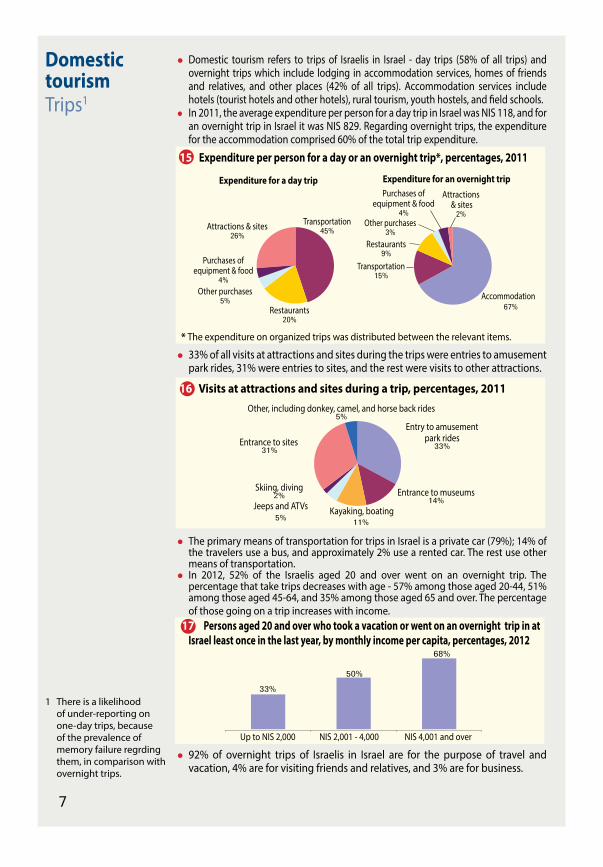
Domestic tourism refers to trips of Israelis in Israel - day trips (58% of all trips) and overnight trips which include lodging in accommodation services, homes of friends and relatives, and other places (42% of all trips). Accommodation services include hotels (tourist hotels and other hotels), rural tourism, youth hostels, and field schools.
In 2011, the average expenditure per person for a day trip in Israel was NIS 118, and for an overnight trip in Israel it was NIS 829. Regarding overnight trips, the expenditure for the accommodation comprised 60% of the total trip expenditure.
15 Expenditure per person for a day or an overnight trip*, percentages, 2011
* The expenditure on organized trips was distributed between the relevant items.
33% of all visits at attractions and sites during the trips were entries to amusement park rides, 31% were entries to sites, and the rest were visits to other attractions.
16 Visits at attractions and sites during a trip, percentages, 2011
The primary means of transportation for trips in Israel is a private car (79%); 14% of the travelers use a bus, and approximately 2% use a rented car. The rest use other means of transportation.
In 2012, 52% of the Israelis aged 20 and over went on an overnight trip. The percentage that take trips decreases with age - 57% among those aged 20-44, 51% among those aged 45-64, and 35% among those aged 65 and over. The percentage of those going on a trip increases with income.
17 Persons aged 20 and over who took a vacation or went on an overnight trip in at Israel least once in the last year, by monthly income per capita, percentages, 2012
92% of overnight trips of Israelis in Israel are for the purpose of travel and vacation, 4% are for visiting friends and relatives, and 3% are for business.
Domestic tourismTrips1
1 There is a likelihood of under-reporting on one-day trips, because of the prevalence of memory failure regrding them, in comparison with overnight trips.
Accommodation67%
Attractions & sites
2%Attractions & sites
26%
Purchases ofequipment & food
4%
Purchases ofequipment & food
4%
Other purchases3%
Other purchases5%
Restaurants9%
Restaurants20%
Transportation15%
Transportation45%
Expenditure for an overnight tripExpenditure for a day trip
Other, including donkey, camel, and horse back rides5%
Entry to amusement park rides
33%
Entrance to museums14%Jeeps and ATVs
5%
Skiing, diving2%
Entrance to sites 31%
68%
50%33%
Up to NIS 2,000 NIS 2,001 - 4,000 NIS 4,001 and over
Kayaking, boating11%
8
Youth hostels and field schools2%
Youth hostels and field schools6%
Rural tourism7%
Rural tourism12%
Other hotels4%
Other hotels
6%
Tourist hotels87%
Tourist hotels76%
Person-Nights (Total 16 million)
Domestictourism Person-nights
1 Revenue from Israelis also includes revenue from services, such as celebrations and conferences
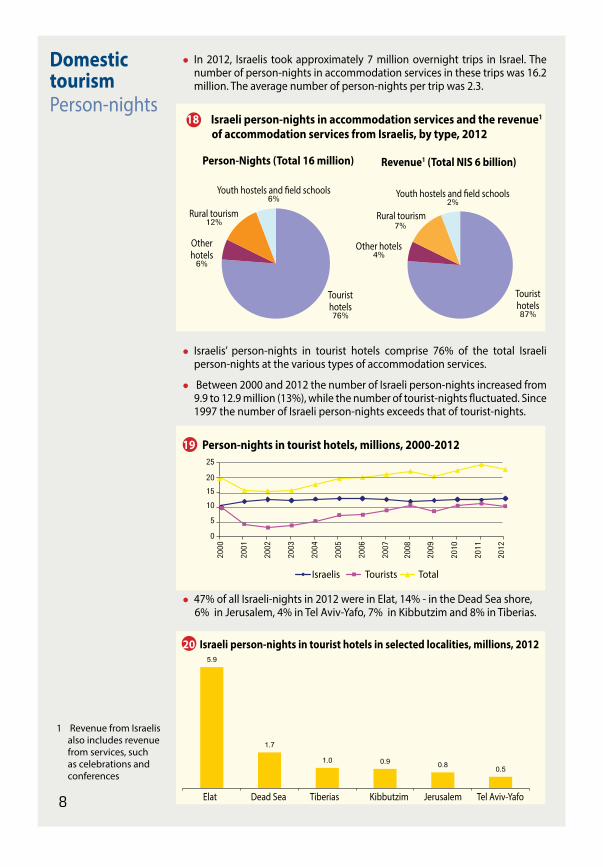
In 2012, Israelis took approximately 7 million overnight trips in Israel. The number of person-nights in accommodation services in these trips was 16.2 million. The average number of person-nights per trip was 2.3.
18 Israeli person-nights in accommodation services and the revenue1 of accommodation services from Israelis, by type, 2012
Israelis’ person-nights in tourist hotels comprise 76% of the total Israeli person-nights at the various types of accommodation services.
Between 2000 and 2012 the number of Israeli person-nights increased from 9.9 to 12.9 million (13%), while the number of tourist-nights fluctuated. Since 1997 the number of Israeli person-nights exceeds that of tourist-nights.
19 Person-nights in tourist hotels, millions, 2000-2012
47% of all Israeli-nights in 2012 were in Elat, 14% - in the Dead Sea shore, 6% in Jerusalem, 4% in Tel Aviv-Yafo, 7% in Kibbutzim and 8% in Tiberias.
20 Israeli person-nights in tourist hotels in selected localities, millions, 2012
0.5 0.8 0.9 1.0
1.7
5.9
Elat Dead Sea Tiberias Kibbutzim Jerusalem Tel Aviv-Yafo
Revenue1 (Total NIS 6 billion)
2000
2001
2002
2003
2004
2005
2006
2007
2008
2009
2010
2011
2012
TotalTouristsIsraelis
0
510
25
2015
9
0.9 1.0 1.1 1.3
1.9 2.3 2.5
2.8 3.0 3.2 3.5 3.6
3.3 3.3 3.6 3.7 3.7
4.1 4.2 4.0 4.3 4.4 4.3
Elat Dead Sea Tiberias Kibbutzim Jerusalem Tel Aviv-Yafo
Departures abroadof Israelis
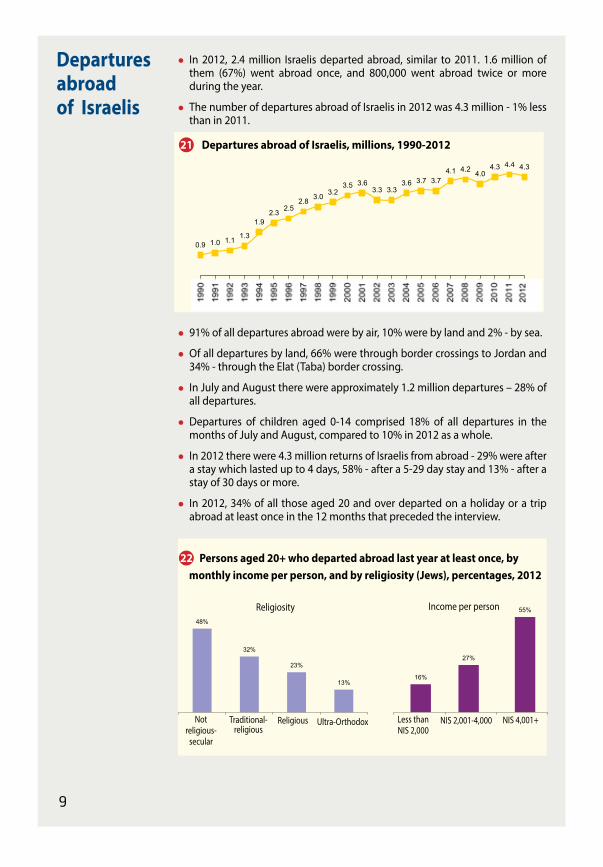
In 2012, 2.4 million Israelis departed abroad, similar to 2011. 1.6 million of them (67%) went abroad once, and 800,000 went abroad twice or more during the year.
The number of departures abroad of Israelis in 2012 was 4.3 million - 1% less than in 2011.
21 Departures abroad of Israelis, millions, 1990-2012
91% of all departures abroad were by air, 10% were by land and 2% - by sea.
Of all departures by land, 66% were through border crossings to Jordan and 34% - through the Elat (Taba) border crossing.
In July and August there were approximately 1.2 million departures – 28% of all departures.
Departures of children aged 0-14 comprised 18% of all departures in the months of July and August, compared to 10% in 2012 as a whole.
In 2012 there were 4.3 million returns of Israelis from abroad - 29% were after a stay which lasted up to 4 days, 58% - after a 5-29 day stay and 13% - after a stay of 30 days or more.
In 2012, 34% of all those aged 20 and over departed on a holiday or a trip abroad at least once in the 12 months that preceded the interview.
22 Persons aged 20+ who departed abroad last year at least once, by monthly income per person, and by religiosity (Jews), percentages, 2012
13%
23%
32%
48%
55%
27%
16%
Income per personReligiosity
Religious Notreligious-
secular
Traditional- religious
Ultra-Orthodox NIS 4,001+NIS 2,001-4,000 Less thanNIS 2,000
10
Departures abroad of Israelis (cont.) Departures abroad bycountry
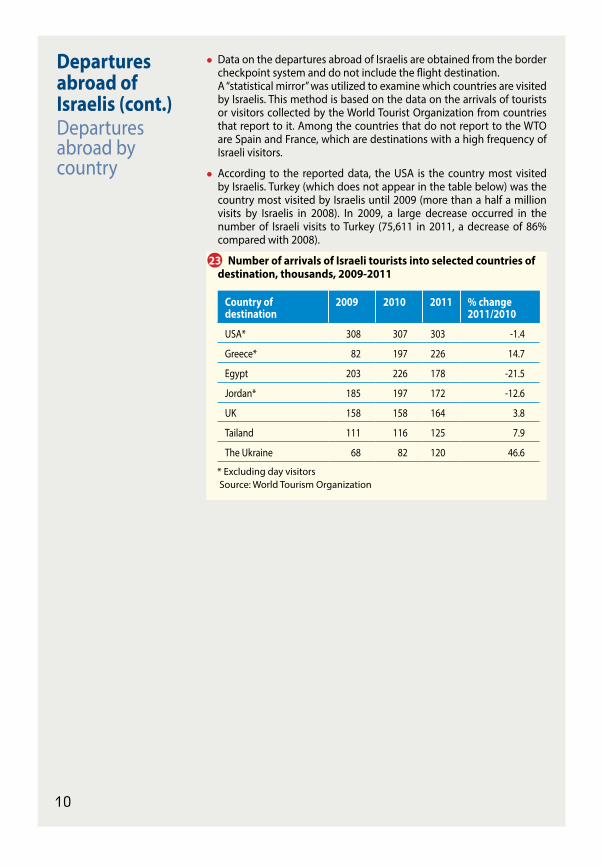
Data on the departures abroad of Israelis are obtained from the border checkpoint system and do not include the flight destination.
A “statistical mirror” was utilized to examine which countries are visited by Israelis. This method is based on the data on the arrivals of tourists or visitors collected by the World Tourist Organization from countries that report to it. Among the countries that do not report to the WTO are Spain and France, which are destinations with a high frequency of Israeli visitors.
According to the reported data, the USA is the country most visited by Israelis. Turkey (which does not appear in the table below) was the country most visited by Israelis until 2009 (more than a half a million visits by Israelis in 2008). In 2009, a large decrease occurred in the number of Israeli visits to Turkey (75,611 in 2011, a decrease of 86% compared with 2008).
23 Number of arrivals of Israeli tourists into selected countries of destination, thousands, 2009-2011
Country of destination
2009 2010 2011 % change 2011/2010
USA* 308 307 303 -1.4
Greece* 82 197 226 14.7
Egypt 203 226 178 -21.5
Jordan* 185 197 172 -12.6
UK 158 158 164 3.8
Tailand 111 116 125 7.9
The Ukraine 68 82 120 46.6
* Excluding day visitors Source: World Tourism Organization
11
60
46 44 45 51
57 58 62 66 60
66 66 66
2000
2001
2002
2003
2004
2005
2006
2007
2008
2009
2010
2011
2012
Accommodation services
Roomoccupancy3
Rooms in tourist hotels1,2
1 Hotels registered at the Ministry of Tourism.
2 Including rooms temporarily closed (7% of all rooms, on average in 2000-2012).
3.9
7.2
5.1
1.6 3.1
1.4 0.9
10.4
9.1
5.9
3.2 4.0
1.9 1.3
11.0
9.4
6.8
4.0 4.2
1.8 1.3
1990 20002012
Elat Jerusalem Tel Aviv-Yafo Dead Sea Tiberias Netanya Haifa
Jerusalem and Tel Aviv-Yafo Elat and the Dead Sea
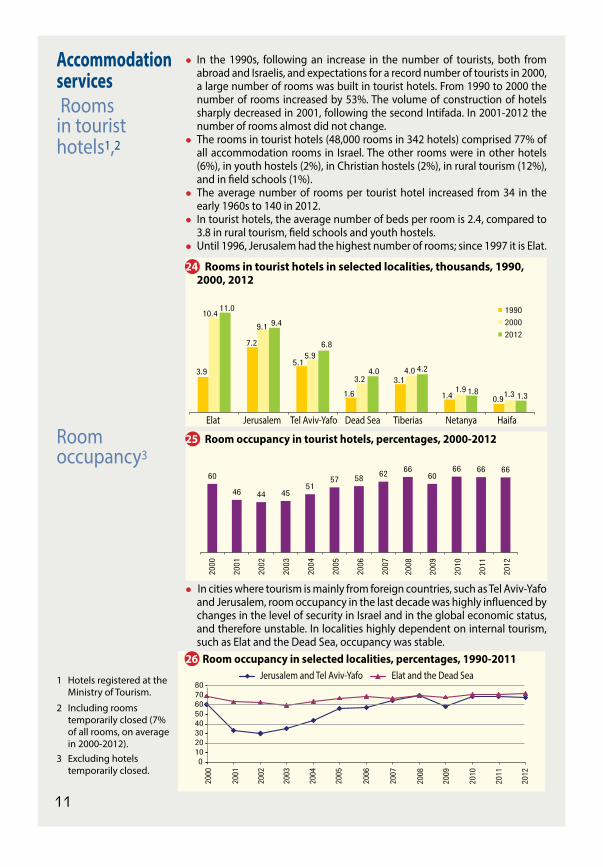
In the 1990s, following an increase in the number of tourists, both from abroad and Israelis, and expectations for a record number of tourists in 2000, a large number of rooms was built in tourist hotels. From 1990 to 2000 the number of rooms increased by 53%. The volume of construction of hotels sharply decreased in 2001, following the second Intifada. In 2001-2012 the number of rooms almost did not change.
The rooms in tourist hotels (48,000 rooms in 342 hotels) comprised 77% of all accommodation rooms in Israel. The other rooms were in other hotels (6%), in youth hostels (2%), in Christian hostels (2%), in rural tourism (12%), and in field schools (1%).
The average number of rooms per tourist hotel increased from 34 in the early 1960s to 140 in 2012.
In tourist hotels, the average number of beds per room is 2.4, compared to 3.8 in rural tourism, field schools and youth hostels.
Until 1996, Jerusalem had the highest number of rooms; since 1997 it is Elat.
24 Rooms in tourist hotels in selected localities, thousands, 1990, 2000, 2012
25 Room occupancy in tourist hotels, percentages, 2000-2012
In cities where tourism is mainly from foreign countries, such as Tel Aviv-Yafo and Jerusalem, room occupancy in the last decade was highly influenced by changes in the level of security in Israel and in the global economic status, and therefore unstable. In localities highly dependent on internal tourism, such as Elat and the Dead Sea, occupancy was stable.
26 Room occupancy in selected localities, percentages, 1990-2011
2000
2001
2002
2003
2004
2005
2006
2007
2008
2009
2010
2011
2012
01020304050607080
3 Excluding hotels temporarily closed.
12
Accommodation services Revenue1and employment
1 In 2012 prices, general CPI adjusted.
2 Revenue from Israelis also includes revenue from services, such as parties, weddings and conferences.
3.5 1.5 1.1 1.3 1.9 2.7 2.8 3.3 3.8 3.4 4.0 3.9 4.0
4.2
4.2 4.0 3.9 4.3
4.6 4.9 5.0
4.8 4.9 5.1 5.1 5.2
0123456789
10
2000 2001 2002 2003 2004 2005 2006 2007 2008 2009 2010 2011 2012
From Israelis From tourists
NIS
bill
ion
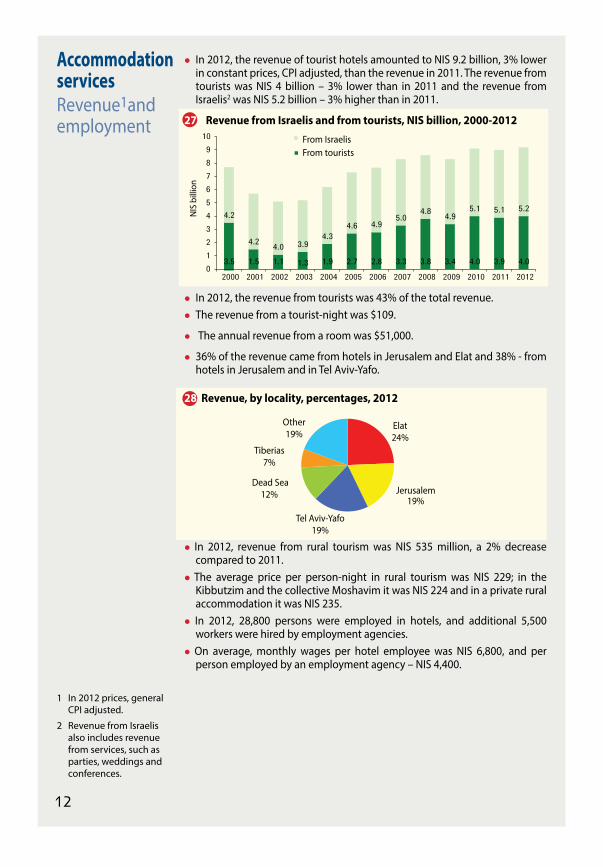
In 2012, the revenue of tourist hotels amounted to NIS 9.2 billion, 3% lower in constant prices, CPI adjusted, than the revenue in 2011. The revenue from tourists was NIS 4 billion – 3% lower than in 2011 and the revenue from Israelis2 was NIS 5.2 billion – 3% higher than in 2011.
27 Revenue from Israelis and from tourists, NIS billion, 2000-2012
In 2012, the revenue from tourists was 43% of the total revenue. The revenue from a tourist-night was $109.
The annual revenue from a room was $51,000.
36% of the revenue came from hotels in Jerusalem and Elat and 38% - from hotels in Jerusalem and in Tel Aviv-Yafo.
28 Revenue, by locality, percentages, 2012
In 2012, revenue from rural tourism was NIS 535 million, a 2% decrease compared to 2011.
The average price per person-night in rural tourism was NIS 229; in the Kibbutzim and the collective Moshavim it was NIS 224 and in a private rural accommodation it was NIS 235.
In 2012, 28,800 persons were employed in hotels, and additional 5,500 workers were hired by employment agencies.
On average, monthly wages per hotel employee was NIS 6,800, and per person employed by an employment agency – NIS 4,400.
Elat24%
Jerusalem19%
Tel Aviv-Yafo19%
Dead Sea12%
Tiberias7%
Other19%
13
Management and taxes 13%
Profit21%
Maintenance 20%
Food13%
Labour cost33%
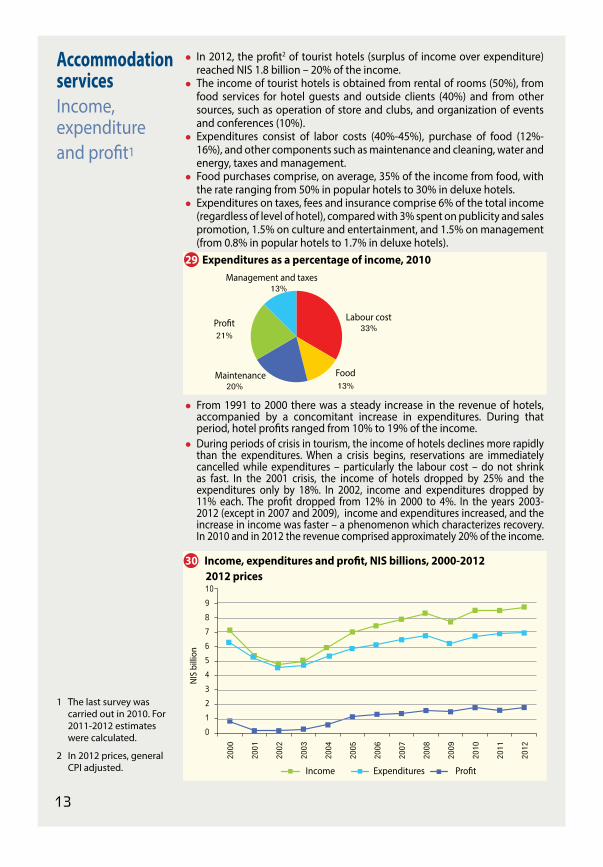
In 2012, the profit2 of tourist hotels (surplus of income over expenditure) reached NIS 1.8 billion – 20% of the income.
The income of tourist hotels is obtained from rental of rooms (50%), from food services for hotel guests and outside clients (40%) and from other sources, such as operation of store and clubs, and organization of events and conferences (10%).
Expenditures consist of labor costs (40%-45%), purchase of food (12%-16%), and other components such as maintenance and cleaning, water and energy, taxes and management.
Food purchases comprise, on average, 35% of the income from food, with the rate ranging from 50% in popular hotels to 30% in deluxe hotels.
Expenditures on taxes, fees and insurance comprise 6% of the total income (regardless of level of hotel), compared with 3% spent on publicity and sales promotion, 1.5% on culture and entertainment, and 1.5% on management (from 0.8% in popular hotels to 1.7% in deluxe hotels).
29 Expenditures as a percentage of income, 2010
From 1991 to 2000 there was a steady increase in the revenue of hotels, accompanied by a concomitant increase in expenditures. During that period, hotel profits ranged from 10% to 19% of the income.
During periods of crisis in tourism, the income of hotels declines more rapidly than the expenditures. When a crisis begins, reservations are immediately cancelled while expenditures – particularly the labour cost – do not shrink as fast. In the 2001 crisis, the income of hotels dropped by 25% and the expenditures only by 18%. In 2002, income and expenditures dropped by 11% each. The profit dropped from 12% in 2000 to 4%. In the years 2003-2012 (except in 2007 and 2009), income and expenditures increased, and the increase in income was faster – a phenomenon which characterizes recovery. In 2010 and in 2012 the revenue comprised approximately 20% of the income.
30 Income, expenditures and profit, NIS billions, 2000-2012 2012 prices
Accommodation services Income, expenditure and profit1
1 The last survey was carried out in 2010. For 2011-2012 estimates were calculated.
2000
2001
2002
2003
2004
2005
2006
2007
2008
2009
2010
2011
2012
109876543210
Income Expenditures Profit
NIS
bill
ion
2 In 2012 prices, general CPI adjusted.
14
Tourist Attractions
Tourist attractions are the main draw for tourists and therefore the main reason for the existence of the tourist industry. In fact, without attractions there is almost no need for tourist services upon which the industry is based, for example, accommodation services and transportation. The dimensions of tourism, whether with regards to arrivals or to internal tourism, are influenced to a large extent by the existence of tourist attractions at the destination. Besides for their general contribution to the development of tourism, tourist attractions contribute directly to Israel’s economy by providing places of work and foreign currency income.
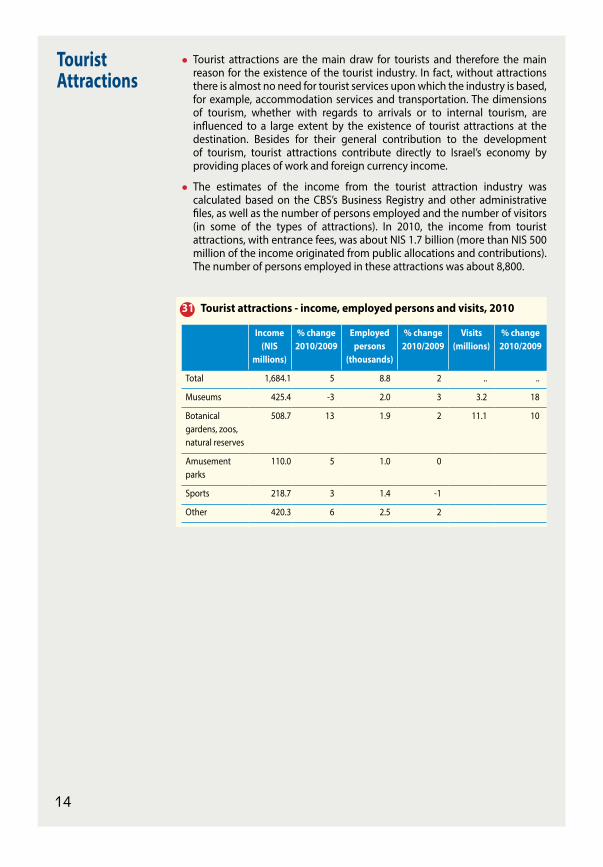
The estimates of the income from the tourist attraction industry was calculated based on the CBS’s Business Registry and other administrative files, as well as the number of persons employed and the number of visitors (in some of the types of attractions). In 2010, the income from tourist attractions, with entrance fees, was about NIS 1.7 billion (more than NIS 500 million of the income originated from public allocations and contributions). The number of persons employed in these attractions was about 8,800.
31 Tourist attractions - income, employed persons and visits, 2010
Income (NIS
millions)
% change 2010/2009
Employed persons
(thousands)
% change 2010/2009
Visits (millions)
% change 2010/2009
Total 1,684.1 5 8.8 2 .. ..
Museums 425.4 -3 2.0 3 3.2 18
Botanical gardens, zoos, natural reserves
508.7 13 1.9 2 11.1 10
Amusement parks
110.0 5 1.0 0
Sports 218.7 3 1.4 -1
Other 420.3 6 2.5 2
15
The economic contribution of tourism 1,2
1.6 2
5.35.8
3.3
1.4
5.4 6.5
Percentage of the GDP Percentage of employed persons
Transportation,Communication
Transportation,Communication
Construction Construction Tourism TourismAgriculture Agriculture
The tourism industry is based mainly on accommodation services (28% of tourism output), and on air transport services (29%). Additional divisions that contribute to tourism output are travel agencies (9% of the tourism output), restaurants (7%), leisure and vacation services (3%), and more.
In 2012, the tourism consumption in Israel (of tourists from abroad, of Israelis for traveling abroad and of Israelis in Israel) was estimated at NIS 39.6 billion.
The expenditure of tourists from abroad in Israel (including flight cost on Israeli airline companies) was estimated at NIS 19.7 billion - 50% of the total tourism consumption and close to 17% of the total export of services of Israel. Compared to 2011, this is an 11% increase.
The expenditure of Israelis for trips in Israel and abroad was estimated at NIS 20 billion - 50% of the total tourism expenditure.
32 Economic estimates of tourism, 2006-2012, current prices
2006 2007 2008 2009 2010 2011 2012 % change 2012/2011
Tourism (NIS billion) Total 28.7 31.0 32.9 33.0 36.4 36.9 39.6 7
Of incoming tourism 13.1 14.3 16.1 15.8 17.9 17.8 19.7 11
Of Israelis 15.6 16.7 16.8 17.2 18.5 19.1 19.9 4
Value AddedOf tourism 13.3 14.4 15.4 15.4 17.1 17.3 18.6 8
Of tourism as percentage of GDP
2.1 2.1 2.1 2.0 2.1 2.0 2.0 0
Employed persons (thousands)
90 91 95 95 99 103 110 7
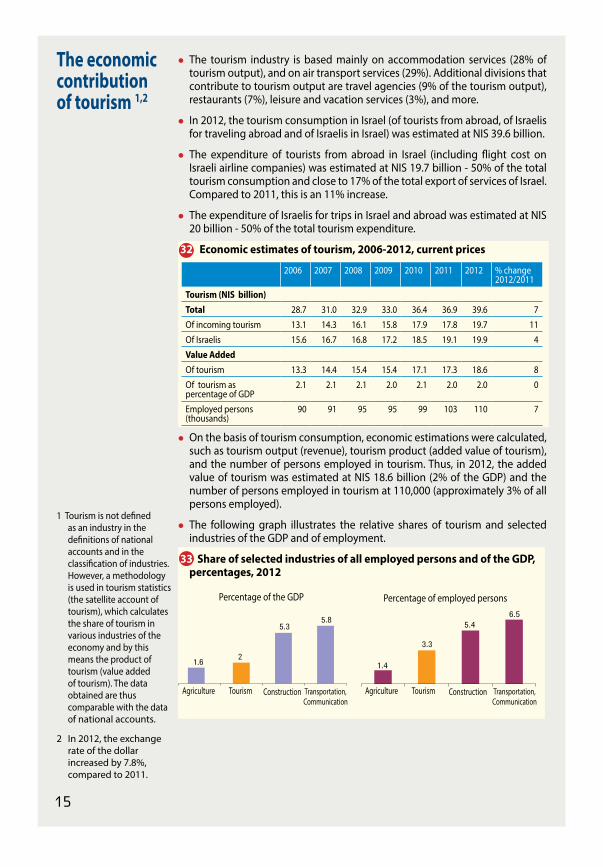
On the basis of tourism consumption, economic estimations were calculated, such as tourism output (revenue), tourism product (added value of tourism), and the number of persons employed in tourism. Thus, in 2012, the added value of tourism was estimated at NIS 18.6 billion (2% of the GDP) and the number of persons employed in tourism at 110,000 (approximately 3% of all persons employed).
The following graph illustrates the relative shares of tourism and selected industries of the GDP and of employment.
33 Share of selected industries of all employed persons and of the GDP, percentages, 2012
1 Tourism is not defined as an industry in the definitions of national accounts and in the classification of industries. However, a methodology is used in tourism statistics (the satellite account of tourism), which calculates the share of tourism in various industries of the economy and by this means the product of tourism (value added of tourism). The data obtained are thus comparable with the data of national accounts.
2 In 2012, the exchange rate of the dollar increased by 7.8%, compared to 2011.

16 תיירות ושירותי הארחה 2011-1990כתיבה: עמרי רומנו ולנה אוסטרובסקי | עורכת סדרת סטטיסטיקל: נורית יפה | יולי 2012
Tourism in Israel 2000-2012
The Central Bureau of Statistics
Web site: www.cbs.gov.il
E-mail: [email protected]
Phones at information center:
Jerusalem 972-2-6592666
Tel Aviv-Yafo 973-3-5681933
Written by: Tilda Hayat, Omri Romano and Lena Ostrovsky | Editor of Stati-Lite series: Nurit Yaffe | November 2013