Embed Size (px)
Citation preview
Toward Complete Miniaturisation of Flow Injection Analysis Systems:Microfluidic Enhancement of Chemiluminescent DetectionAna M. Gracioso Martins,† Nick R. Glass,‡,§ Sally Harrison,† Amgad R. Rezk,‡ Nichola A. Porter,†
Peter D. Carpenter,† Johan Du Plessis,† James R. Friend,‡ and Leslie Y. Yeo*,‡
†Centre for Environmental Science and Remediation, School of Applied Sciences, RMIT University, Melbourne, Victoria 3000,Australia‡Micro/Nanophysics Research Laboratory, RMIT University, Melbourne, Victoria 3000, Australia§Monash University, Clayton, Victoria 3800, Australia
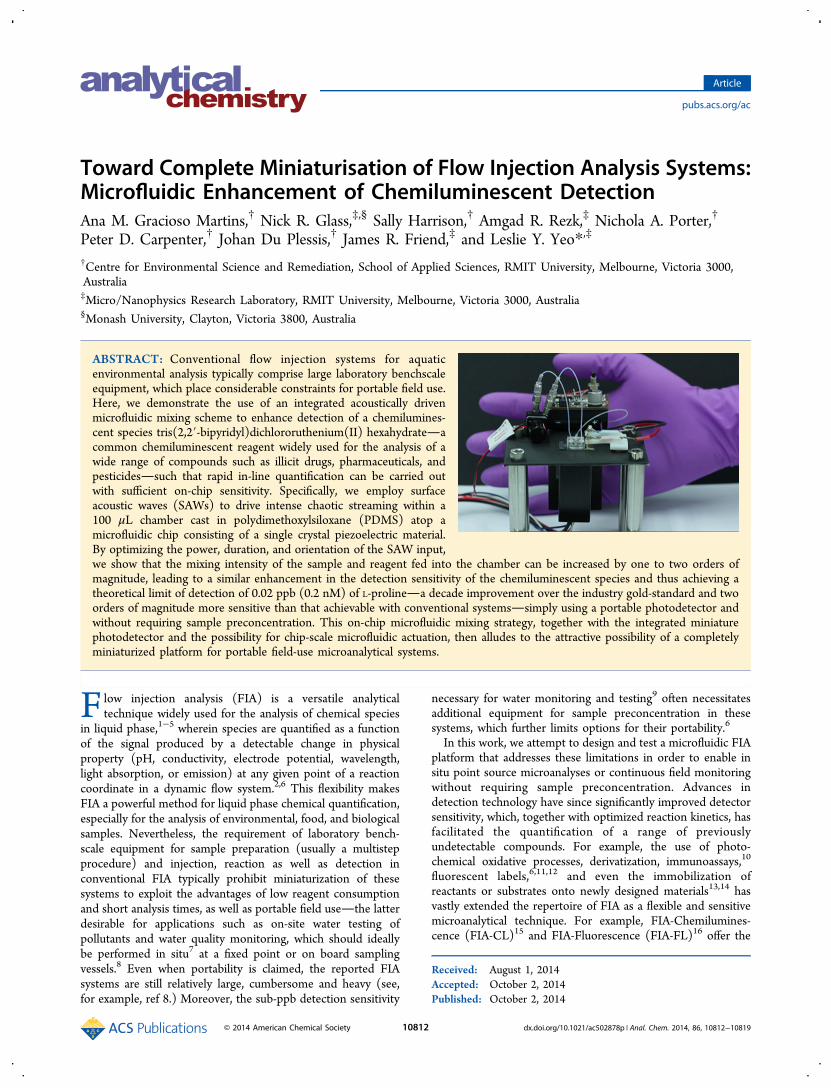
ABSTRACT: Conventional flow injection systems for aquaticenvironmental analysis typically comprise large laboratory benchscaleequipment, which place considerable constraints for portable field use.Here, we demonstrate the use of an integrated acoustically drivenmicrofluidic mixing scheme to enhance detection of a chemilumines-cent species tris(2,2′-bipyridyl)dichlororuthenium(II) hexahydrateacommon chemiluminescent reagent widely used for the analysis of awide range of compounds such as illicit drugs, pharmaceuticals, andpesticidessuch that rapid in-line quantification can be carried outwith sufficient on-chip sensitivity. Specifically, we employ surfaceacoustic waves (SAWs) to drive intense chaotic streaming within a100 μL chamber cast in polydimethoxylsiloxane (PDMS) atop amicrofluidic chip consisting of a single crystal piezoelectric material.By optimizing the power, duration, and orientation of the SAW input,we show that the mixing intensity of the sample and reagent fed into the chamber can be increased by one to two orders ofmagnitude, leading to a similar enhancement in the detection sensitivity of the chemiluminescent species and thus achieving atheoretical limit of detection of 0.02 ppb (0.2 nM) of L-prolinea decade improvement over the industry gold-standard and twoorders of magnitude more sensitive than that achievable with conventional systemssimply using a portable photodetector andwithout requiring sample preconcentration. This on-chip microfluidic mixing strategy, together with the integrated miniaturephotodetector and the possibility for chip-scale microfluidic actuation, then alludes to the attractive possibility of a completelyminiaturized platform for portable field-use microanalytical systems.
Flow injection analysis (FIA) is a versatile analyticaltechnique widely used for the analysis of chemical species
in liquid phase,1−5 wherein species are quantified as a functionof the signal produced by a detectable change in physicalproperty (pH, conductivity, electrode potential, wavelength,light absorption, or emission) at any given point of a reactioncoordinate in a dynamic flow system.2,6 This flexibility makesFIA a powerful method for liquid phase chemical quantification,especially for the analysis of environmental, food, and biologicalsamples. Nevertheless, the requirement of laboratory bench-scale equipment for sample preparation (usually a multistepprocedure) and injection, reaction as well as detection inconventional FIA typically prohibit miniaturization of thesesystems to exploit the advantages of low reagent consumptionand short analysis times, as well as portable field usethe latterdesirable for applications such as on-site water testing ofpollutants and water quality monitoring, which should ideallybe performed in situ7 at a fixed point or on board samplingvessels.8 Even when portability is claimed, the reported FIAsystems are still relatively large, cumbersome and heavy (see,for example, ref 8.) Moreover, the sub-ppb detection sensitivity
necessary for water monitoring and testing9 often necessitatesadditional equipment for sample preconcentration in thesesystems, which further limits options for their portability.6
In this work, we attempt to design and test a microfluidic FIAplatform that addresses these limitations in order to enable insitu point source microanalyses or continuous field monitoringwithout requiring sample preconcentration. Advances indetection technology have since significantly improved detectorsensitivity, which, together with optimized reaction kinetics, hasfacilitated the quantification of a range of previouslyundetectable compounds. For example, the use of photo-chemical oxidative processes, derivatization, immunoassays,10
fluorescent labels,6,11,12 and even the immobilization ofreactants or substrates onto newly designed materials13,14 hasvastly extended the repertoire of FIA as a flexible and sensitivemicroanalytical technique. For example, FIA-Chemilumines-cence (FIA-CL)15 and FIA-Fluorescence (FIA-FL)16 offer the
Received: August 1, 2014Accepted: October 2, 2014Published: October 2, 2014
Article
pubs.acs.org/ac
© 2014 American Chemical Society 10812 dx.doi.org/10.1021/ac502878p | Anal. Chem. 2014, 86, 10812−10819

possibility for limits of quantification that are comparable tothose of other sensitive conventional analytical techniques suchas CE, LC-MS, and GC-MS.17−19 Further, chemiluminescentreagents display a high degree of selectivity17 in their reactionwith chemiluminogenic compounds, emitting distinct lightwavelengths that can be captured with highly sensitive detectorssuch as photomultiplier tubes (PMTs), charge coupled devices(CCDs), or complementary metal-oxide semiconductor(CMOS) cameras,20 whose advances have enabled miniatur-ization into portable hand-held systems.Nevertheless, the ability to completely miniaturize the FIA
detection platform cannot be achieved merely by incorporatingthese portable sensors, especially given the compromise indetection sensitivity with scale down in size. As such, thekinetics of the reaction must be taken into account in thedesign of these systems in addition to favorable stereochemicalconditions. Given the fast chemiluminescent reaction timescales, the process is typically diffusion-limited21 due to theabsence of turbulent mixing vortices in the typical low Reynoldsnumber laminar flow conditions of a FIA system, and thusmicromixing is an important consideration not only to increasereaction yield (in this case, the intensity of the chemilumines-cent signal) and hence allow lower limits of detection with agiven sensor, but also to attain sufficiently short residence timesthat, in turn, facilitate scale down in the dimensions of thereaction chamber. In view of their relative simplicity, passivesample-reagent mixing strategies, such as the incorporation ofserpentine channels and flow obstructions, for example, havetherefore been adopted in many FIA-CL platforms to increasethe rate of reaction despite their lower mixing efficiencies,22−24
longer residence times, larger associated pressure drops andfabrication complexities compared to their active counterparts.This has primarily been due to the lack of a low cost andefficient active micromixing scheme that can be easilyintegrated to date, especially if portability is desired.
Here, we demonstrate that the use of acoustics to drive activemicromixing of any chemiluminogenic compound is able toenhance the mixing efficiency to a sufficient extent that limits ofdetection superior to that using both conventional benchscaleFIA instrumentation as well as chemiluminescent micro-analyses25−27 can be achieved with a portable PMT integratedinto a microfluidic chamber. More specifically, we exploit theuse of surface acoustic waves (SAWs)nanometre amplitudehigh frequency (MHz order) electromechanical waves thatpropagate on the surface of a piezoelectric substratewhichhas recently been shown not just as a powerful tool formicroscale fluid manipulation28−30 but also one that canefficiently be driven using a battery-powered portable hand-heldcircuit.31 While batch chaotic micromixing via SAW-generatedacoustic streaming32,33 has been demonstrated in a sessiledrop,34−39 microchamber,40,41 microchannel,42 microdisc,43 andin paper,44 the work reported here presents the first instance ofa continuous f low micromixing strategy in addition to completeon-chip integration with a portable photodetection scheme;unlike batch systems, the residence time of the sample andreagent in the mixing chamber, which is a function of the liquidflow rate into the chamber, is an additional systemconsideration since it imposes a constraint on the mixingtime and hence the mixing efficiency. Together with the abilityto incorporate integrated chip-scale SAW continuous flowmicropumps,45 this on-chip microfluidic mixing strategy andintegrated miniature photodetector therefore constitutes acompletely miniaturized platform for portable field-useminiaturized FIA systems (Figure 1) that is able to improvecurrent industry standard limits of detection even without theneed for sample preconcentration.
■ MATERIALS AND METHODS
Materials. Tris(2,2′-bipyridyl)dichlororuthenium(II) hexa-hydrate ([Ru(bipy)3]
2+) is a chemiluminescent reagent that hasbeen widely described in the literature and utilized for the
Figure 1. Image of the proposed portable FIA system which includes a micropump, the SAW chip powered by a miniature driver circuit that includesa signal generator and amplifier, the PDMS reaction chamber bonded to the chip and a portable photodetector, showing the possibility for completeintegration and portability for field use. The total weight of the entire system is approximately 130 g.
Analytical Chemistry Article
dx.doi.org/10.1021/ac502878p | Anal. Chem. 2014, 86, 10812−1081910813
analysis of various classes of compounds such as amines, aminoacids, organic acids, illicit drugs, pharmaceuticals, andpesticides.46 Due to its wide applicability,52 [Ru(bipy)3]
2+ isthus the reagent of choice in this study, whose chemilumines-cent reaction can be summarized by the following:
⎯ →⎯⎯⎯⎯⎯⎯⎯⎯⎯+ +Ru(bipy) Ru(bipy)32 (oxidation)
33
+ ⎯ →⎯⎯⎯⎯⎯⎯⎯⎯⎯ *+ +Ru(bipy) Analyte [Ru(bipy) ] , and33 (reduction)
32
ν
* → +
+
+ + + − +
h
[Ru(bipy) ] Ru(bipy) [Ru (bipy) (bipy) ]32
32 3
22
In general, the [Ru(bipy)3]2+ species is oxidized by a catalyst
into its chemiluminogenic form tris(2,2′-bipyridyl)-dichlororuthenium(III) hexahydrate ([Ru(bipy)3]
3+). Thereaction of [Ru(bipy)3]
3+ with an electron-rich analyte thengives rise to the excited-state [Ru(bipy)3
2+]*, which sub-sequently relaxes back to its ground-state [Ru(bipy)3]
2+ byemitting light in the form of photon energy hν, while alsoforming the byproduct [Ru3+(bipy)−(bipy)2]
2+.52 The amountof light emitted by the chemiluminescent reaction is,fundamentally, a function of the analyte concentration underoptimized reaction conditions as it is the direct result of thereduction of [Ru(bipy)3]
3+ to [Ru(bipy)3]2+ and
[Ru3+(bipy)−(bipy)2]2+ by the analyte.46
Prolinea uniquely structured α-amino-acid featuring asecondary amine group which readily reacts with [Ru-(bipy)3]
3+is employed as our analyte of choice given that itis widely used in similar chemiluminescent detectionstudies47−51 and since numerous microanalytical chemilumi-nescence methods have been developed to target it for thedetermination of nitrogen content in amino-acid-rich mattersuch as foods, animal tissues, and other forms of organicmatter;25−27,46,53 other chemiluminescent reagents with similarapplications are luminol, diaryloxalates and potassium perman-ganate.54
Specifically, L-proline (analytical grade; Sigma-Aldrich Pty.Ltd., Castle Hill, NSW, Australia) standards were prepared in50.0 mM (w/w) sodium tetraborate buffer (analytical grade,Ajax Finechem; Thermo Fisher Scientific Pty. Ltd., North Ryde,NSW, Australia), adjusted to pH 9.0 using hydrochloric acid(analytical grade, Ajax Finechem; Thermo Fisher Scientific Pty.Ltd., North Ryde, NSW, Australia). 1.0 mM [Ru(bipy)3]
2+
(analytical grade, Sigma-Aldrich Pty. Ltd., Castle Hill, NSW,Australia) was prepared in 20.0 mM sulfuric acid and oxidizedto [Ru(bipy)3]
3+ using 1.0 g of lead dioxide powder per 100 mLaliquot (analytical grade, Merck Pty. Ltd., Kilsyth, VIC,Australia) and filtered in-line using a 0.45 μm Teflon microfilter(Labquip Ltd., Dublin, Ireland).Device Fabrication. The SAW device was designed with a
simple unweighted interdigital electrode described elsewhere,29
with 20 electrode finger pairs to operate between 19.6 and 21.5MHz on single crystal lithium niobate in a 127.68° Y-rotated,X-propagating cut (Roditi International Corp., London, U.K.),fabricated using lift-off photolithography. Briefly, double-sidedpolished lithium niobate wafers were piranha-cleaned (3:1H2SO4/H2O2) for 20 min. The wafers were then rinsed withwater and isopropanol and subsequently dried with nitrogen.AZ4562 photoresist (MicroChemicals GmbH, Ulm, Germany)was spin coated onto the wafers to a thickness of approximately6 μm and then baked for 2 min at 90 °C. The wafers were
subsequently allowed to cool for at least 10 min beforeexposure.The resist was exposed to a constant UV dose of 150 mJ/cm2
and then developed in a mixture of 4:1 H2O/AK400(photoresist developer; MicroChemicals GmbH, Ulm, Ger-many) to completion. After rinsing, the wafers wereimmediately dried and loaded into an evaporation chamber.After reaching a base pressure of less than 10−6 Torr, sequentiallayers of chromium and gold were deposited with thicknesses of5 and 175 nm, respectively. After metallization, the wafers weresonicated in acetone to lift off the photoresist, typicallyrequiring approximately 20 min for full lift-off from thesubstrate. Subsequently, the wafers were rinsed with acetoneand further sonicated in successive baths of acetone andisopropanol for 5 min. The wafers were then dried withnitrogen, coated with a protective layer of photoresist and dicedinto 3 × 1 cm2 chips. After dicing, the chips were cleaned withacetone and isopropanol and dried with nitrogen. Theelectrode fingers and the central working area of each chipwere then coated with a 1 μm layer of silicon dioxide usingplasma enhanced chemical vapor deposition (Plasmalab System100, Oxford Instruments, Abingdon, U.K.).The reaction chambers were cast in polydimethylsiloxane
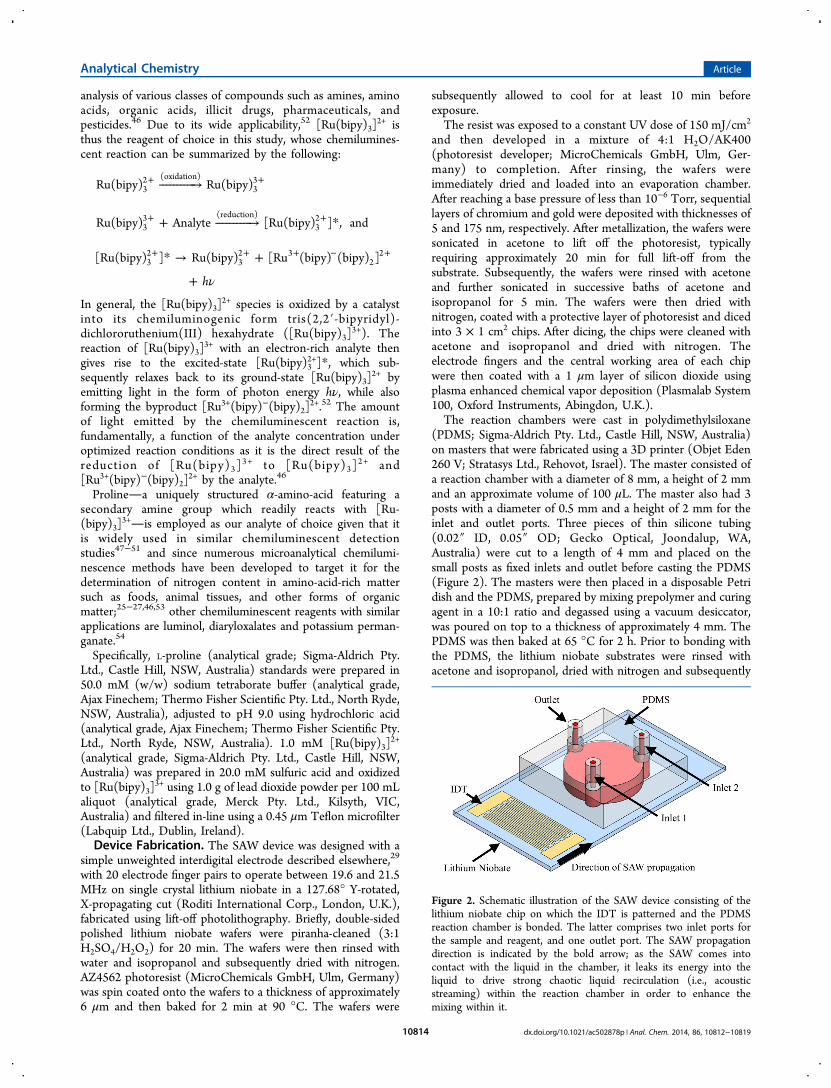
(PDMS; Sigma-Aldrich Pty. Ltd., Castle Hill, NSW, Australia)on masters that were fabricated using a 3D printer (Objet Eden260 V; Stratasys Ltd., Rehovot, Israel). The master consisted ofa reaction chamber with a diameter of 8 mm, a height of 2 mmand an approximate volume of 100 μL. The master also had 3posts with a diameter of 0.5 mm and a height of 2 mm for theinlet and outlet ports. Three pieces of thin silicone tubing(0.02″ ID, 0.05″ OD; Gecko Optical, Joondalup, WA,Australia) were cut to a length of 4 mm and placed on thesmall posts as fixed inlets and outlet before casting the PDMS(Figure 2). The masters were then placed in a disposable Petridish and the PDMS, prepared by mixing prepolymer and curingagent in a 10:1 ratio and degassed using a vacuum desiccator,was poured on top to a thickness of approximately 4 mm. ThePDMS was then baked at 65 °C for 2 h. Prior to bonding withthe PDMS, the lithium niobate substrates were rinsed withacetone and isopropanol, dried with nitrogen and subsequently
Figure 2. Schematic illustration of the SAW device consisting of thelithium niobate chip on which the IDT is patterned and the PDMSreaction chamber is bonded. The latter comprises two inlet ports forthe sample and reagent, and one outlet port. The SAW propagationdirection is indicated by the bold arrow; as the SAW comes intocontact with the liquid in the chamber, it leaks its energy into theliquid to drive strong chaotic liquid recirculation (i.e., acousticstreaming) within the reaction chamber in order to enhance themixing within it.
Analytical Chemistry Article
dx.doi.org/10.1021/ac502878p | Anal. Chem. 2014, 86, 10812−1081910814
exposed to air plasma at a pressure of 400 mTorr for 90 s in aplasma cleaner (Harrick Plasma, Ithaca, NY). Immediately afterplasma treatment, the PDMS chambers were pressed intocontact with the lithium niobate substrate and then heated inan oven at 60 °C for 1 h to ensure permanent and evenbonding. Unless otherwise stated, the inlet and outlet ports areoriented with respect to the IDT as shown in Figure 2.Device Setup and Characterization. A schematic of the
fully assembled device can be seen in Figure 2. These deviceswere mounted on a custom-made jig that allowed the device tobe connected to a signal generator (N9310, AgilentTechnologies Pty. Ltd., Mulgrave, VIC, Australia) and amplifier(ZHL-5W-1, Mini-Circuits, Brooklyn, NY, U.S.A.). Theoperating frequency of the SAW device was fixed at a valuebetween 19.6 and 21.5 MHz, verified for each device using animpedance analyzer (4194A; Agilent Technologies Pty. Ltd.,Mulgrave, VIC, Australia). The vibration surface displacementof the device was determined using a high frequency laserDoppler vibrometer (UHF-120-SV; Polytec GmBH, Wald-bronn, Germany). All images were taken through the opticallytransparent, double sided polished lithium niobate substrate.Samples and reagents were injected into the reaction
chamber using syringe pumps (SP100i, World PrecisionInstruments Inc., Sarasota, FL, U.S.A.) in the qualitativeexperiments and peristaltic pumps (Ismatec IP-N 4 Channel,IDEX Health & Science GmbH, Wertheim, Germany) in thequantitative experiments. We also verified and demonstratedthe possibility for using portable micropumps (M200-P4; RSCompoments Pty. Ltd., Wetherill Park, NSW, Australia) for thepurposes of complete integration and miniaturizability of thesystem, as shown in Figure 1. Syringes were capped with 32gauge needles (Livingstone International Pty. Ltd., Rosebery,NSW, Australia) threaded onto approximately 50 cm of flexiblePVC tubing (0.04″ ID, 0.08″ OD; Ormantine Ltd., Palm Bay,FL, U.S.A.) and microbore PTFE tubing (0.012″ ID, 0.030″OD; Cole-Parmer Instrument Co., Vernon Hills, IL, U.S.A.),which was subsequently mounted manually onto the inputports of the reaction chamber. The same tubing was alsomounted on the outlet end and the waste was dispensed into anamber reagent bottle wrapped in aluminum foil to insulate thedetector from any stray chemiluminescent signal arising fromfurther reaction in the waste line. The device was filled withisopropanol and rinsed with water in order to remove airbubbles before operation.Micromixing Quantification. In order to investigate the
effect as well as to optimize the mixing of the chemiluminescentreaction in the continuous flow system, mixtures of 1 mMfluorescein (analytical grade, Sigma-Aldrich Pty. Ltd., CastleHill, NSW, Australia) and deionized water were initially used.Video images that captured the mixing were then acquired at 50fps with a high-speed camera (FASTCAM SA-5; Photron Ltd.,Tokyo, Japan) ported to an inverted microscope (Eclipse Ti-S,Nikon Instruments Inc., Tokyo, Japan) with a FITC filter set(Chroma Technology Corp., Bellows Falls, VT, U.S.A.). A 2Xobjective was used to facilitate full view of the reactionchamber. Images were then cropped to exclude the exterior ofthe chamber for the purposes of determining the extent ofmixing of the reaction in the chamber in each still frame of thevideo, which is quantified by a mixing index that is defined asfollows:35
= SA
mixing index(1)
wherein S is the image standard deviation, and A the averageimage intensity. The mixing index was normalized for all SAWexperiments such that a mixing index value of unity representsthe mixing in the absence of the SAW and a value of zerorepresents the fully mixed case. Given that the instantaneousnormalized mixing indices for each frame stabilized afterapproximately 20 s, a representative steady-state mixing indexfor a given parameter set can then be calculated by averagingthe instantaneous normalized mixing index over a periodranging from 28 to 30 s.
Chemiluminescent Detection. Initial qualitative chem-iluminescent experiments were performed in a darkroom boxand recorded with a high resolution camera (EOS 550D SL;Canon Inc., Tokyo, Japan) with a macro lens (EF-S, 60 mmfocal length, F2/8; Canon Inc., Tokyo, Japan). The camera wasoriented to view the interior of the PDMS reaction chamberfrom beneath through the transparent lithium niobate substrate.Briefly, 2 mg/L L-proline in pH 9.0 sodium tetraborate bufferwas mixed with 0.1 mM [Ru(bipy)3]
3+ in 20.0 mM sulfuric acid,whose reaction was given at least 5 min to equilibrate prior torecording for any given flow rate. Once steady-state wasreached, a series of images were taken in the darkroom box withan exposure time of 3.2 s keeping the camera setting the same.In order to compare the results of various experiments across aparameter set that allowed a range of flow rates and SAWpower inputs to be investigated, the average mixing intensitiesof the reaction chamber were calculated and normalized againstthe steady-state mixing intensity in the absence of the SAWinput.Quantitative chemiluminescent detection experiments were
carried out by continuously mixing each L-proline standardprepared in 50.0 mM sodium tetraborate buffer at pH 9.0 withthe oxidized [Ru(bipy)3]
3+ reagent in the interior of thereaction chamber at an optimal combined flow rate of 0.3 mL/min. LabVIEW (National Instruments Corp., Austin, TX,U.S.A.) was used to simultaneously power one set of IDTs byremotely triggering the signal generator to produce directedSAWs at a continuous surface displacement of approximately1.2 nm. The light signal produced by the chemiluminescentreaction was detected using a PMT (H10721-20; HamamatsuPhotonics K.K., Hamamatsu City, Japan). The photodetectorcell was aligned with the reaction chamber (both 8.0 mm indiameter) and the light captured through the lithium niobatewafer at a distance <1 mm; both the reaction chamber and thePMT were isolated in a dark instrument case (ABS InstrumentCase with Purge Valve MPV4, Jaycar, Rydalmere, NSW,Australia). The PMT was connected to a data acquisitionassistant (NI-USB 6008; National Instruments Corp., Austin,TX, USA) and the data was logged using LabVIEW, whichplotted the PMT response (V) against the analysis time (s) aswell as the integrated area under each peak (Vs). Thechemiluminescent response for each standard was recorded inthe form of a baseline acquired over 60 s with the SAW deviceswitched off, followed by a 10 s detection peak obtained withthe SAW device switched on. Each standard was analyzed inquintuplicate and a calibration curve was produced for a set ofL-proline standards ranging from 0−0.5 ppb.
■ RESULTS AND DISCUSSIONTo enhance the micromixing and hence optimize thechemiluminescent detection, several different parameters wereadjusted to investigate their effects on the mixing in thereaction chamber. We first observe in Figure 3 that the mixing
Analytical Chemistry Article
dx.doi.org/10.1021/ac502878p | Anal. Chem. 2014, 86, 10812−1081910815

considerably improves when driven actively with the SAW andthat the mixing intensity progressively increases with increasingSAW surface displacement (synonymous with the level of theSAW input power), as seen from the decreasing mixing index.This is due to the leakage of the SAW energy into the liquid inthe chamber when the SAW comes into contact with the liquid,giving rise to strong liquid recirculation (i.e., acousticstreaming)28,29 and hence chaotic convection55 within thereaction chamber such that the laminarity of the flow isdisrupted,56 which leads to a reduction in the diffusion lengthand time scales, thus resulting in an enhancement in the mixing.Nevertheless, we note that there is a limit to which the SAWsurface displacement can be increased, since high input powersbeyond 5 W corresponding to a surface displacement amplitude>3.1 nm causes either boiling within the chamber and/or devicefracture. To circumvent this limitation, it is possible to cycle theinput signal to the SAW on and off rapidly over a pulse periodof 500 ms and a pulse width of 250 ms with duty cycles of 25%,50% and 75%. Using a 50% duty cycle allowed for surfacedisplacements of up to 3.1 nm to be used without adverselyaffecting the device and further enhancing the mixing, as shownin Figure 4. In addition to improving the mixing efficiency,which can be attributed to intermittency effects which causefurther disruption to the flow laminarity,56 using pulsed in placeof the continuous operation has the advantage of reducingpower consumption, thus facilitating further possible miniatur-ization providing the power can be sufficiently reduced suchthat smaller batteries can be employed; this will be explored ina future study.Nevertheless, unlike the case of batch SAW mixing in sessile
drops or closed chambers that have been previouslystudied,34−41 there is an additional parameter that has asignificant effect on the mixing of the sample and reagent in thesystem in continuous f low devices, namely the liquid flow rateand thus the liquid residence time within the chamber. Thiseffect is shown in Figure 5, wherein it can be generally observedthat for a given SAW surface displacement, increases in the
sample and reagent volumetric flow rate to the device causes anincrease in the mixing index and hence a deterioration in themixing intensity. This is because of the decrease in residencetime in the reaction chamber, i.e., the duration over which thesample and reagent are exposed to the SAW before they leavethe chamber. As such, an increase in the SAW input power isrequired to maintain the same mixing intensity if the flow rate isincreased. Consistent with the results in Figure 4, the mixing
Figure 3. Effect of the SAW surface displacement (which is a functionof the SAW input power) on the steady-state normalized mixing indexfor a combined inlet flow rate of 0.5 mL/min. It can be seen that themixing is enhanced, reflected by the decrease in the mixing indextoward the fully mixed state represented by a null value of the index,with higher surface displacement, i.e., higher power. Also shown aboveare still images of the reaction chamber captured when at steady-state,showing the mixing (or lack thereof) in the chamber. Each conditionwas tested once with an average of 100 readings.
Figure 4. Normalized average pixel intensity for images of the reactionchamber (shown on top) at steady-state as a function of the SAWamplitude and modulation (pulsed operation with 50% duty cycle(DC)) for a combined inlet flow rate of 0.5 mL/min. Error barsindicate 95% confidence intervals. Each condition was tested once,with the normalized average pixel intensity corresponding to theaverage pixel intensity for the last seven images in a series of tenimages given the long exposure time of 3.2 s for each image.
Figure 5. Steady-state normalized mixing index as a function of thevolumetric flow rate through the reaction chamber and hence theliquid residence time in the chamber for different SAW surfacedisplacement amplitudes, both in continuous and pulsed (50% dutycycle (DC)) modes. Corresponding images of the chemiluminescentmixing in the reaction chamber are shown above. Error bars represent95% confidence intervals and the trendlines were added for ease ofvisualization.
Analytical Chemistry Article
dx.doi.org/10.1021/ac502878p | Anal. Chem. 2014, 86, 10812−1081910816
can be further enhanced for a given flow rate and SAW inputpower by utilizing the pulsed SAW drive (here, the pulse dutycycle is kept constant at 50%) in place of continuous SAWexcitation.Longer residence times, equating to longer exposure to the
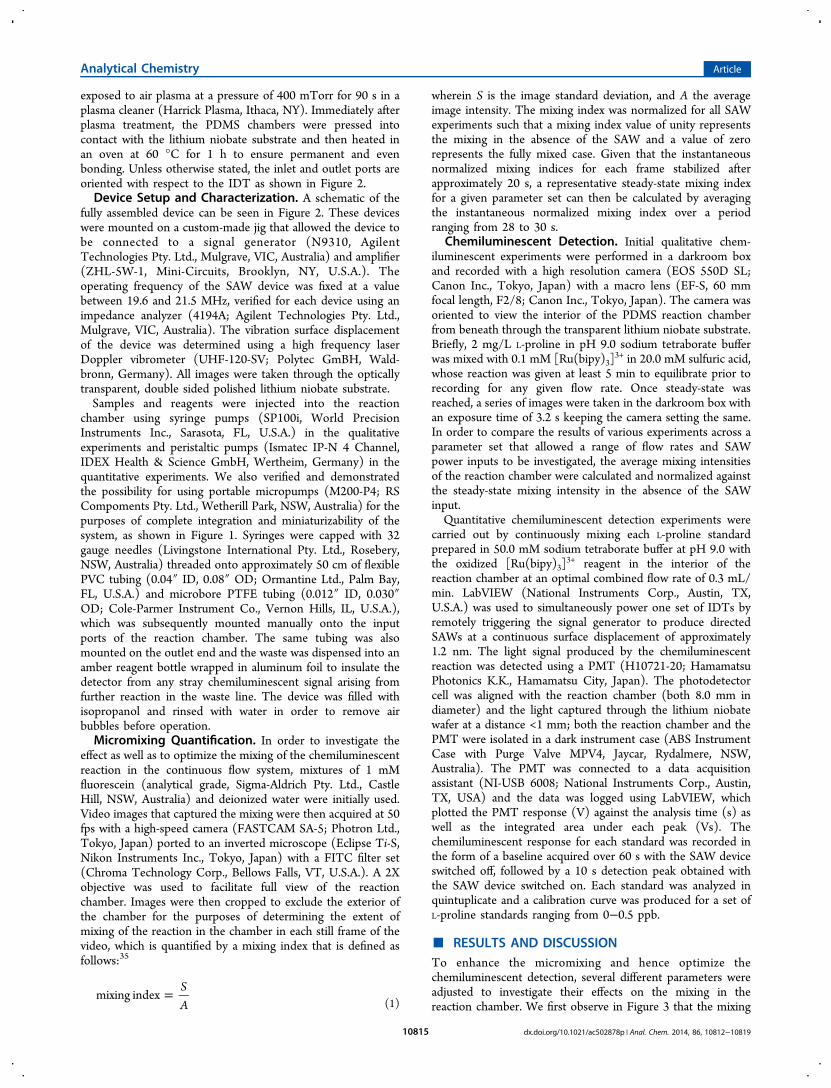
SAW, for a fixed volumetric flow rate can also be achieved byvarying the orientation of the reaction chamber (i.e., theposition of the inlet and outlet ports) with respect to the IDTand hence the SAW propagation direction, as shown in Figure6. It can clearly be seen that more efficient mixing can be
obtained when the flow direction is perpendicular to that of theSAW propagation such that the SAW is most efficient inbreaking the laminarity of the flow stream from the inlet to theoutlet by inducing chaotic convection;55 similar enhancementsin mixing have been reported, for example, when electric fieldswere applied perpendicular to the laminar flow direction andhence the interface between the streams to be mixed.57
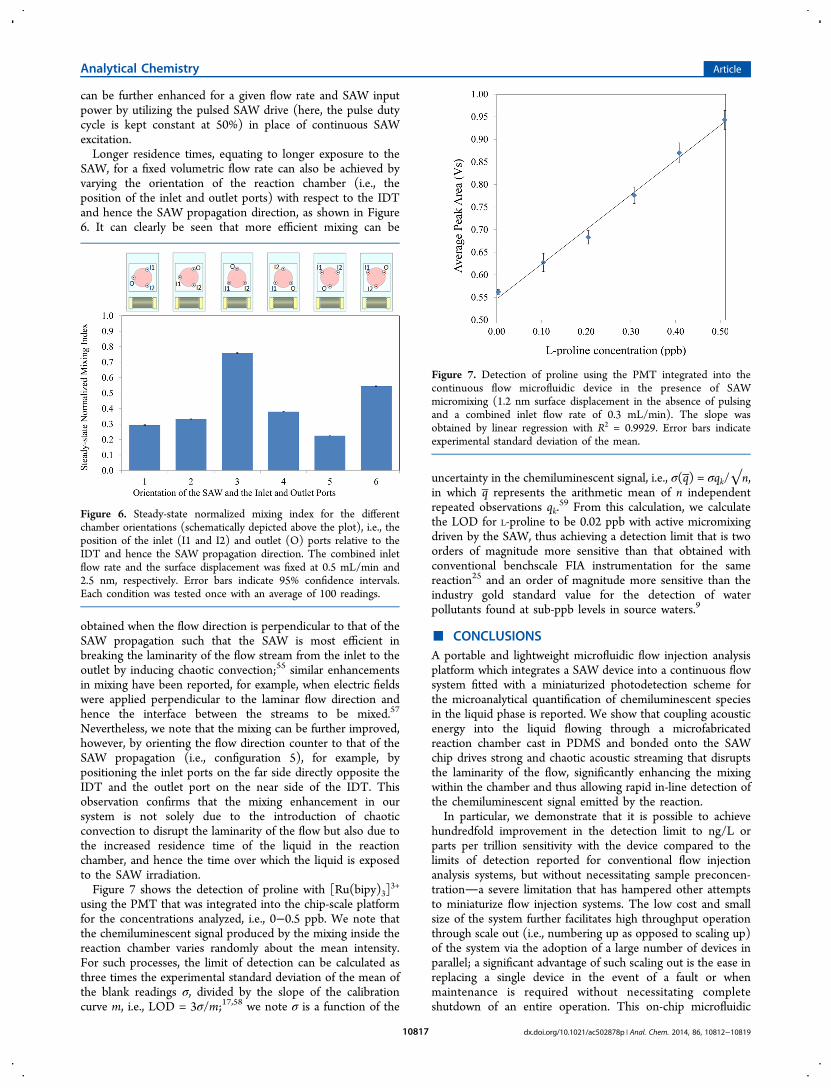
Nevertheless, we note that the mixing can be further improved,however, by orienting the flow direction counter to that of theSAW propagation (i.e., configuration 5), for example, bypositioning the inlet ports on the far side directly opposite theIDT and the outlet port on the near side of the IDT. Thisobservation confirms that the mixing enhancement in oursystem is not solely due to the introduction of chaoticconvection to disrupt the laminarity of the flow but also due tothe increased residence time of the liquid in the reactionchamber, and hence the time over which the liquid is exposedto the SAW irradiation.Figure 7 shows the detection of proline with [Ru(bipy)3]
3+
using the PMT that was integrated into the chip-scale platformfor the concentrations analyzed, i.e., 0−0.5 ppb. We note thatthe chemiluminescent signal produced by the mixing inside thereaction chamber varies randomly about the mean intensity.For such processes, the limit of detection can be calculated asthree times the experimental standard deviation of the mean ofthe blank readings σ, divided by the slope of the calibrationcurve m, i.e., LOD = 3σ/m;17,58 we note σ is a function of the
uncertainty in the chemiluminescent signal, i.e., σ(q) = σqk/√n,in which q represents the arithmetic mean of n independentrepeated observations qk.
59 From this calculation, we calculatethe LOD for L-proline to be 0.02 ppb with active micromixingdriven by the SAW, thus achieving a detection limit that is twoorders of magnitude more sensitive than that obtained withconventional benchscale FIA instrumentation for the samereaction25 and an order of magnitude more sensitive than theindustry gold standard value for the detection of waterpollutants found at sub-ppb levels in source waters.9
■ CONCLUSIONSA portable and lightweight microfluidic flow injection analysisplatform which integrates a SAW device into a continuous flowsystem fitted with a miniaturized photodetection scheme forthe microanalytical quantification of chemiluminescent speciesin the liquid phase is reported. We show that coupling acousticenergy into the liquid flowing through a microfabricatedreaction chamber cast in PDMS and bonded onto the SAWchip drives strong and chaotic acoustic streaming that disruptsthe laminarity of the flow, significantly enhancing the mixingwithin the chamber and thus allowing rapid in-line detection ofthe chemiluminescent signal emitted by the reaction.In particular, we demonstrate that it is possible to achieve
hundredfold improvement in the detection limit to ng/L orparts per trillion sensitivity with the device compared to thelimits of detection reported for conventional flow injectionanalysis systems, but without necessitating sample preconcen-trationa severe limitation that has hampered other attemptsto miniaturize flow injection systems. The low cost and smallsize of the system further facilitates high throughput operationthrough scale out (i.e., numbering up as opposed to scaling up)of the system via the adoption of a large number of devices inparallel; a significant advantage of such scaling out is the ease inreplacing a single device in the event of a fault or whenmaintenance is required without necessitating completeshutdown of an entire operation. This on-chip microfluidic
Figure 6. Steady-state normalized mixing index for the differentchamber orientations (schematically depicted above the plot), i.e., theposition of the inlet (I1 and I2) and outlet (O) ports relative to theIDT and hence the SAW propagation direction. The combined inletflow rate and the surface displacement was fixed at 0.5 mL/min and2.5 nm, respectively. Error bars indicate 95% confidence intervals.Each condition was tested once with an average of 100 readings.
Figure 7. Detection of proline using the PMT integrated into thecontinuous flow microfluidic device in the presence of SAWmicromixing (1.2 nm surface displacement in the absence of pulsingand a combined inlet flow rate of 0.3 mL/min). The slope wasobtained by linear regression with R2 = 0.9929. Error bars indicateexperimental standard deviation of the mean.
Analytical Chemistry Article
dx.doi.org/10.1021/ac502878p | Anal. Chem. 2014, 86, 10812−1081910817
mixing strategy, together with the integrated miniaturephotodetector and chip-scale microfluidic actuation using thesame SAW setup, then suggests that a completely miniaturizedlow cost and lightweight platform that is sufficiently sensitive asa portable field-use microanalytical system is within reach.
■ AUTHOR INFORMATION
Corresponding Author*E-mail: [email protected].
NotesThe authors declare no competing financial interest.
■ ACKNOWLEDGMENTS
This work was in part supported by ARC Discovery grantsDP1092955 and DP120100013. A.M.G.M. is a recipient offunding from Water Research Australia (WATERRA). L.Y.Y.also acknowledges funding through an Australian ResearchCouncil Future Fellowship (FT130100672), whereas J.R.F. isgrateful to RMIT University for a Vice-Chancellor’s SeniorResearch Fellowship.
■ REFERENCES(1) Nacapricha, D.; Sastranurak, P.; Mantim, T.; Amornthammarong,N.; Uraisin, K.; Boonpanaid, C.; Chuyprasartwattana, C.; Wilairat, P.Talanta 2013, 110, 89−95.(2) van Staden, J. F.; van Staden, R. I. S. Talanta 2012, 102, 34−43.(3) Miro, M.; Cerda, V.; Estela, J. M. TrAC, Trends Anal. Chem. 2002,21, 199−210.(4) Ranger, C. B. Anal. Chem. 1981, 53, 20A−32A.(5) Betteridge, D. Anal. Chem. 1978, 50, 832A−846A.(6) Worsfold, P. J.; Clough, R.; Lohan, M. C.; Monbet, P.; Ellis, P. S.;Quetel, C. R.; Floor, G. H.; McKelvie, I. D. Anal. Chim. Acta 2013,803, 15−40.(7) Danet, A.; Cheregi, M.; Calatayud, J. M.; Mateo, J. V. G.; Enein,H. Y.A. Crit. Rev. Anal. Chem. 2001, 31, 191−222.(8) Lyddy-Meaney, A. J.; Ellis, P. S.; Worsfold, P. J.; Butler, E. C.;McKelvie, I. D. Talanta 2002, 58, 1043−1053.(9) National Water Quality Management Strategy−Australian DrinkingWater Guidelines Paper 6, National Health & Medical ResearchCouncil and National Resource Management Ministerial Council,Commonwealth of Australia, Canberra, 2011.(10) Wilson, R.; Barker, M. H.; Schiffrin, D. J.; Abuknesha, R. Biosens.Bioelectron. 1997, 12, 277−286.(11) Galeano Díaz, T.; Acedo Valenzuela, M.; Salinas, F. Anal. Chim.Acta 1999, 384, 185−191.(12) Vílchez, J.; Valencia, M.; Navalon, A.; Molinero-Morales, B.;Capitan-Vallvey, L. Anal. Chim. Acta 2001, 439, 299−305.(13) Li, Y.; Yang, F.; Yang, X. Analyst 2009, 134, 2100−2105.(14) Jain, S.; Borowska, E.; Davidsson, R.; Tudorache, M.; Ponten,E.; Emneus, J. Biosens. Bioelectron. 2004, 19, 795−803.(15) Perez-Ruiz, T.; Martinez-Lozano, C.; Sanz, A.; Val, O. Anal.Chim. Acta 1993, 284, 173−179.(16) Subova, I.; Khenlami Assandas, A.; Catala Icardo, M.; MartínezCalatayud, J. Anal. Sci. 2006, 22, 21−24.(17) Gomez-Benito, C.; Meseguer-Lloret, S.; Torres-Cartas, S. Int. J.Environ. Anal. Chem. 2013, 93, 152−165.(18) Gamiz-Gracia, L.; García-Campana, A. M.; Soto-Chinchilla, J. J.;Huertas-Perez, J. F.; Gonzalez-Casado, A. TrAC, Trends Anal. Chem.2005, 24, 927−942.(19) Gamiz-Gracia, L.; García-Campana, A. M.; Huertas-Perez, J. F.;Lara, F. J. Anal. Chim. Acta 2009, 640, 7−28.(20) Mirasoli, M.; Guardigli, M.; Michelini, E.; Roda, A. J. Pharm.Biomed. Anal. 2014, 87, 36−52.(21) Mansur, E. A.; Ye, M.; Wang, Y.; Dai, Y. Chin. J. Chem. Eng.2008, 16, 503−516.
(22) Terry, J. M.; Adcock, J. L.; Olson, D. C.; Wolcott, D. K.;Schwanger, C.; Hill, L. A.; Barnett, N. W.; Francis, P. S. Anal. Chem.2008, 80, 9817−9821.(23) Terry, J. M.; Zammit, E. M.; Slezak, T.; Barnett, N. W.; Olson,D. C.; Wolcott, D. K.; Edwards, D. L.; Francis, P. S. Analyst 2011, 136,913−919.(24) Terry, J. M.; Mohr, S.; Fielden, P. R.; Goddard, N. J.; Barnett, N.W.; Olson, D. C.; Wolcott, D. K.; Francis, P. S. Anal. Bioanal. Chem.2012, 403, 2353−2360.(25) Costin, J. W.; Barnett, N. W.; Lewis, S. W. Talanta 2004, 64,894−898.(26) He, L.; Cox, K. A.; Danielson, N. D. Anal. Lett. 1990, 23, 195−210.(27) Jackson, W. A.; Bobbitt, D. R. Anal. Chim. Acta 1994, 285, 309−320.(28) Yeo, L. Y.; Friend, J. R. Biomicrofluidics 2009, 3, 012002.(29) Friend, J.; Yeo, L. Y. Rev. Mod. Phys. 2011, 83, 647.(30) Ding, X.; Li, P.; Lin, S.-C. S.; Stratton, Z. S.; Nama, N.; Guo, F.;Slotcavage, D.; Mao, X.; Shi, J.; Costanzo, F.; Huang, T. J. Lab Chip2013, 13, 3626−3649.(31) Yeo, L. Y.; Friend, J. R. Annu. Rev. Fluid Mech. 2014, 46, 379−406.(32) Frommelt, T.; Kostur, M.; Wenzel-Schafer, M.; Talkner, P.;Hanggi, P.; Wixforth, A. Phys. Rev. Lett. 2008, 100, 034502.(33) Shilton, R. J.; Yeo, L. Y.; Friend, J. R. Sens. Actuators, B 2011,160, 1565−1572.(34) Sritharan, K.; Strobl, C.; Schneider, M.; Wixforth, A.;Guttenberg, Z. v. Appl. Phys. Lett. 2006, 88, 054102.(35) Li, H.; Friend, J. R.; Yeo, L. Y. Biomed. Microdevices 2007, 9,647−656.(36) Renaudin, A.; Chabot, V.; Grondin, E.; Aimez, V.; Charette, P.G. Lab Chip 2010, 10, 111−115.(37) Alghane, M.; Chen, B.; Fu, Y.; Li, Y.; Luo, J.; Walton, A. J.Micromech. Microeng. 2011, 21, 015005.(38) Ducloux, O.; Galopin, E.; Zoueshtiagh, F.; Merlen, A.; Thomy,V. Biomicrofluidics 2010, 4, 011102.(39) Li, Y.; Fu, Y.; Brodie, S.; Alghane, M.; Walton, A. Biomicrofluidics2012, 6, 012812.(40) Tseng, W.-K.; Lin, J.-L.; Sung, W.-C.; Chen, S.-H.; Lee, G.-B. J.Micromech. Microeng. 2006, 16, 539−548.(41) Shilton, R.; Tan, M. K.; Yeo, L. Y.; Friend, J. R. J. Appl. Phys.2008, 104, 014910.(42) Tan, M.; Yeo, L.; Friend, J. EPL (Europhys. Lett.) 2009, 87,47003.(43) Glass, N.; Shilton, R.; Chan, P.; Friend, J.; Yeo, Y. Small 2012, 8,1881−1888.(44) Rezk, A. R.; Qi, A.; Friend, J. R.; Li, W. H.; Yeo, L. Y. Lab Chip2012, 12, 773−779.(45) Dentry, M. B.; Friend, J. R.; Yeo, L. Y. Lab Chip 2014, 14, 750−758.(46) Gerardi, R.; Barnett, N.; Lewis, S. Anal. Chim. Acta 1999, 378,1−41.(47) Brune, S. N.; Bobbitt, D. R. Anal. Chem. 1992, 64, 166−170.(48) Bobbitt, D. R.; Jackson, W. A.; Hendrickson, H. P. Talanta1998, 46, 565−572.(49) Costin, J. W.; Francis, P. S.; Lewis, S. W. Anal. Chim. Acta 2003,480, 67−77.(50) Gorman, B. A.; Francis, P. S.; Barnett, N. W. Analyst 2006, 131,616−639.(51) Hosono, H.; Satoh, W.; Fukuda, J.; Suzuki, H. Sens. Actuators, B2007, 122, 542−548.(52) Damrauer, N. H.; Cerullo, G.; Yeh, A.; Boussie, T. R.; Shank, C.V.; McCusker, J. K. Science 1997, 275, 54−57.(53) Lee, W.; Nieman, T. Anal. Chem. 1995, 67, 1789−1796.(54) Adcock, J. L.; Francis, P. S.; Barnett, N. W. Anal. Chim. Acta2007, 601, 36−67.(55) Shilton, R.; Yeo, L.; Friend, J. Sens. Actuators, B 2011, 160,1565−1572.(56) Ottino, J. Annu. Rev. Fluid Mech. 1990, 22, 207−254.
Analytical Chemistry Article
dx.doi.org/10.1021/ac502878p | Anal. Chem. 2014, 86, 10812−1081910818

(57) Lin, H.; Storey, B. D.; Oddy, M. H.; Chen, C.-H.; Santiago, J. G.Phys. Fluids 2004, 16, 1922−1935.(58) Fonollosa, J.; Vergara, A.; Huerta, R.; Marco, S. Anal. Chim. Acta2014, 810, 1−9.(59) JCGM 100:2008 Evaluation of Measurement DataGuide for theExpression of Uncertainty in Measurement, (Joint Committee for Guidesin Metrology: Bureau International des Poids et Mesures BIPM,International Electrotechnical Commission IEC, International Feder-ation of Clinical Chemistry & Laboratory Medicine IFCC, Interna-tional Laboratory Accreditation Cooperation ILAC, InternationalStandards Organization ISO, International Union of Pure & AppliedChemistry IUPAC, International Union of Pure & Applied PhysicsIUPAP, Organisation Internationale de Metrologie Legale OIML)2008.
Analytical Chemistry Article
dx.doi.org/10.1021/ac502878p | Anal. Chem. 2014, 86, 10812−1081910819