Embed Size (px)
Citation preview
Toward Consolidated Tactical Network Architecture:A Modeling and Simulation Study
Andy S. Peng∗‡, Brian R. Eickhoff∗, Tian He†, David J. Lilja‡
∗Tactical Systems, Maritime Systems and Sensors (MS2), Lockheed Martin, Eagan, MN†Department of Computer Science and Engineering, University of Minnesota, Minneapolis, MN‡Department of Electrical and Computer Engineering, University of Minnesota, Minneapolis, MN
{andy.s.peng, brian.eickhoff}@lmco.com, [email protected], [email protected]
Abstract—A consolidated tactical network architecture pro-vides an integrated shipboard local area network infrastructurefor disparate afloat platforms operating with multiple securitylevel enclaves. In this modeling and simulation study, a simulatednetwork test bed is developed to investigate the performancetrade-offs in a consolidated tactical network architecture. Abaseline network traffic profile is defined in this study. Failoverand traffic growth test scenarios are presented to study theperformance of tactical applications under these network con-ditions. The results show that network traffic is redirectedproperly during failover conditions. The results also show thatperformance of the applications are scaled according to thenetwork traffic growth.
Index Terms—CANES, Network Simulation, OPNET, Perfor-mance Evaluation, Tactical Network, Simulation Models, ServiceOriented Architecture.
I. INTRODUCTION
The U.S. Navy has developed a plan to revolutionize thefuture of its fleets’ communication and networking capabilitiesby consolidating all shipboard network-centric communicationsystems to a common architecture known as ConsolidatedAfloat Networks and Enterprise Services (CANES) [1] [2] [3][4]. CANES implements a Common Computing Environment(CCE), which includes an integrated Local Area Network(LAN) infrastructure for disparate afloat platforms operatingwith multiple security level enclaves [4]. The operationalview of the afloat networks in Fig. 1 illustrates that CANESinterfaces with Automated Digital Network System (ADNS)1
to provide end-to-end (ETE) network services across theGlobal Information Grid (GIG). Inspired by the concept ofService Oriented Architecture (SOA), CANES consists ofloosely coupled hardware devices capable of hosting a widevariety of tactical applications. The design of the hardwarearchitecture utilizes open architecture Commercial-Off-The-Shelf (COTS) products which are modular and scalable. Thecore services are comprised of reusable software applicationsthat can be efficiently adapted to support rapidly changingdemands in a wide range of tactical operations.
In the traditional system-centric design paradigm, each typeof tactical communication system was designed to support asingle warfighting function [4]. This design paradigm created
1ADNS interfaces with shipboard radio equipments to provide wide areanetwork (WAN) connectivity for the afloat platforms [5].
Fig. 1. Operational View of Afloat Networks
many stove-piped systems, each developed in isolation andwithout considering the requirements for interoperability withexisting and future technologies. A stove-piped system typ-ically requires an unique set of hardware devices, softwareapplications, and a distinct network infrastructure. Dependingon its application, the system is often inefficiently utilizingthe available processing resources. The development of thesoftware applications is based upon the specific hardware ar-chitecture of the host. In addition, as the demands for networkcapability increase, the total number of required stove-pipedsystems can potentially grow into an unmanageable state forboth operations and maintenance staff. It also increases thecomplexity of system integration, training, and supportability[4]. From a security perspective, these individual networksare difficult to certify and defend against potential networkattacks [2]. A consolidated tactical network architecture hasthe advantage of reduced total system component count, andfurthermore has the ability to mitigate the risks incurred withintegrating many stove-piped systems. The future shipboardnetwork-centric communication systems developed aroundthe common computing architecture will require less power,smaller rack space, lighter weight, and lower overall cost insystem development and maintenance.
The objective of this study is to develop a simulated networktest bed using OPNET Modeler for the performance evaluation
978-1-4244-2677-5/08/$25.00 c©2008 IEEE
Authorized licensed use limited to: University of Minnesota. Downloaded on July 13, 2009 at 17:40 from IEEE Xplore. Restrictions apply.
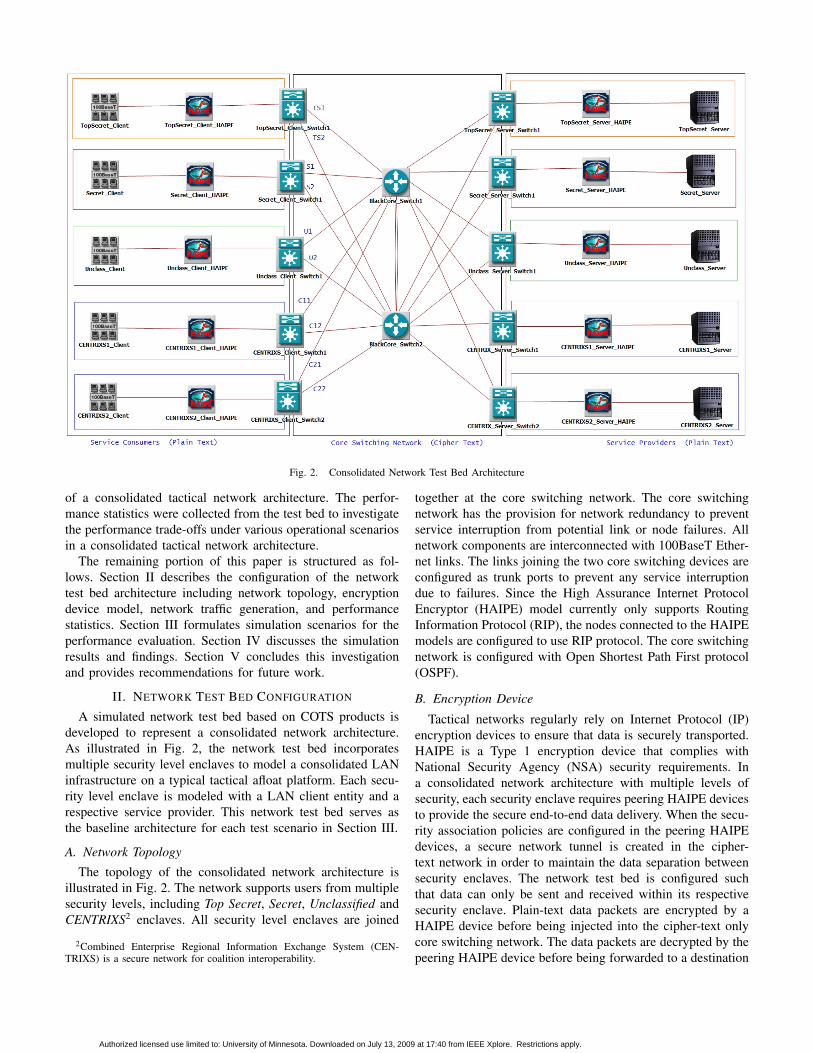
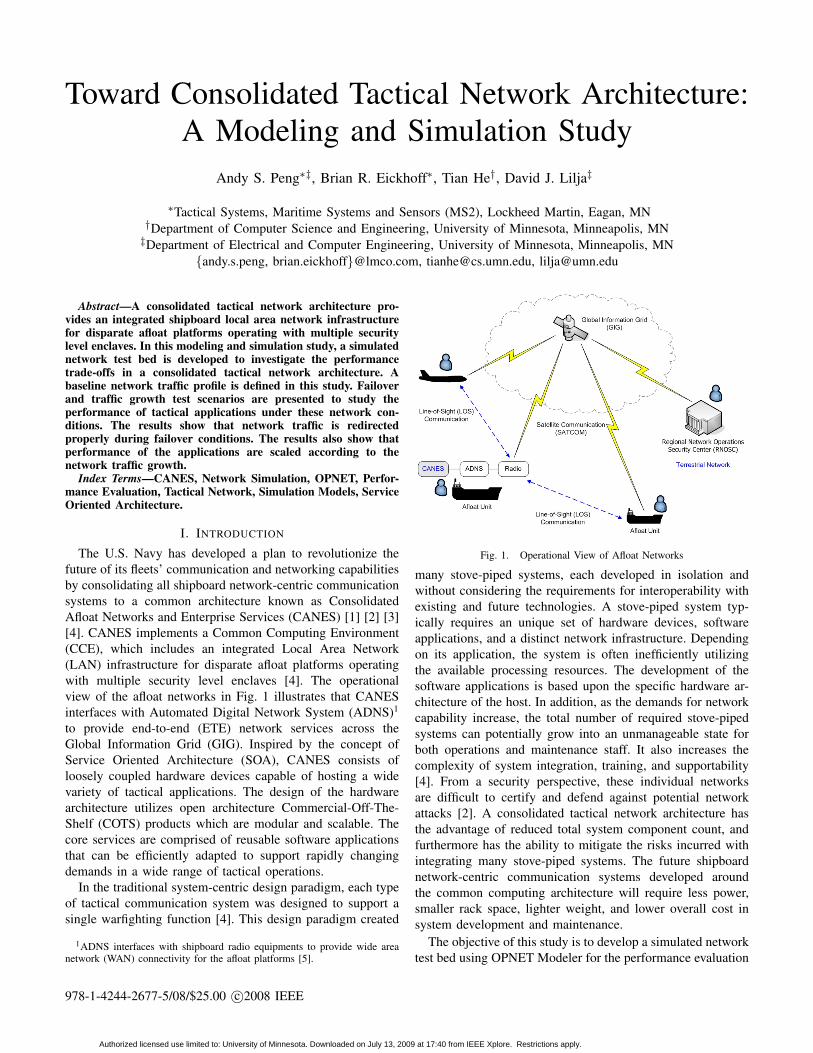
Fig. 2. Consolidated Network Test Bed Architecture
of a consolidated tactical network architecture. The perfor-mance statistics were collected from the test bed to investigatethe performance trade-offs under various operational scenariosin a consolidated tactical network architecture.
The remaining portion of this paper is structured as fol-lows. Section II describes the configuration of the networktest bed architecture including network topology, encryptiondevice model, network traffic generation, and performancestatistics. Section III formulates simulation scenarios for theperformance evaluation. Section IV discusses the simulationresults and findings. Section V concludes this investigationand provides recommendations for future work.
II. NETWORK TEST BED CONFIGURATION
A simulated network test bed based on COTS products isdeveloped to represent a consolidated network architecture.As illustrated in Fig. 2, the network test bed incorporatesmultiple security level enclaves to model a consolidated LANinfrastructure on a typical tactical afloat platform. Each secu-rity level enclave is modeled with a LAN client entity and arespective service provider. This network test bed serves asthe baseline architecture for each test scenario in Section III.
A. Network Topology
The topology of the consolidated network architecture isillustrated in Fig. 2. The network supports users from multiplesecurity levels, including Top Secret, Secret, Unclassified andCENTRIXS2 enclaves. All security level enclaves are joined
2Combined Enterprise Regional Information Exchange System (CEN-TRIXS) is a secure network for coalition interoperability.
together at the core switching network. The core switchingnetwork has the provision for network redundancy to preventservice interruption from potential link or node failures. Allnetwork components are interconnected with 100BaseT Ether-net links. The links joining the two core switching devices areconfigured as trunk ports to prevent any service interruptiondue to failures. Since the High Assurance Internet ProtocolEncryptor (HAIPE) model currently only supports RoutingInformation Protocol (RIP), the nodes connected to the HAIPEmodels are configured to use RIP protocol. The core switchingnetwork is configured with Open Shortest Path First protocol(OSPF).
B. Encryption Device
Tactical networks regularly rely on Internet Protocol (IP)encryption devices to ensure that data is securely transported.HAIPE is a Type 1 encryption device that complies withNational Security Agency (NSA) security requirements. Ina consolidated network architecture with multiple levels ofsecurity, each security enclave requires peering HAIPE devicesto provide the secure end-to-end data delivery. When the secu-rity association policies are configured in the peering HAIPEdevices, a secure network tunnel is created in the cipher-text network in order to maintain the data separation betweensecurity enclaves. The network test bed is configured suchthat data can only be sent and received within its respectivesecurity enclave. Plain-text data packets are encrypted by aHAIPE device before being injected into the cipher-text onlycore switching network. The data packets are decrypted by thepeering HAIPE device before being forwarded to a destination
Authorized licensed use limited to: University of Minnesota. Downloaded on July 13, 2009 at 17:40 from IEEE Xplore. Restrictions apply.
TABLE ICONFIGURATION OF MIXED APPLICATIONS [5] [6] [7] [8]
Service Classes Applications Attributes Setting PHB / DSCP
Control & Management Remote LoginInter-Command (sec) normal(60,5)
CS5 / 40Terminal Traffic (bytes/command) normal(20,16)Host Traffic (bytes/command) normal(10,11.111)
Inelastic Real-Time
Voice
Encoder Scheme G.723.1 5.3K
EF / 47Voice Frame per Packet 1Compression Delay (sec) 0.02Decompression Delay (sec) 0.02Conversation Environment Land Phone - Quiet Room
Video Frame Inter-arrival Time Information 15 frames/secAF43 / 38Frame Size Information (bytes) Incoming Stream Frame Size = constant(1066)
Outgoing Stream Frame Size = constant(1066)
Preferred Elastic
HTTPHTTP Specification HTTP 1.1
AF23 / 22Packet Inter-arrival Time (sec) constant(10)
Page PropertiesObject size (bytes) = constant(1000)Objects/Page = constant(1)Medium Image = constant(7)
FTPCommand Mix (Get/Total) 50%
AF13 / 14Inter-Request Time (sec) exponential(80)File Size constant(200000)
Elastic E-mail
Send Interarrival Time exponential(24)
BE / 0Send Group Size exponential(24)Received Inter-arrival Time constant(1)Received Group Size exponential(24)E-Mail Size (bytes) constant(6000)
(a) Throughput (bits/sec) (b) Average Throughput (bits/sec) (c) Throughput (pkts/sec) (d) Average Throughput (pkts/sec)
Fig. 3. Characteristics of Mixed Application
with the same security classification level as the source. Sinceall data passes through peering encryption devices, the HAIPEmodel affects the overall throughput and packet latency in thenetwork architecture.
C. Service Classes (Network Traffic Generation)
Network traffic models are typically derived from the outputof a dynamic stochastic processes (i.e., random) which requirechallenging modeling techniques. OPNET Modeler provides aconvenient solution to represent standard applications such asDatabase Query, E-mail, FTP, HTTP, Remote Login, Telnet,Video, Voice and other custom applications in its applicationconfiguration model [6]. Various network traffic behaviors canbe modeled by adjusting application parameters such as objectsize, request inter-arrival time, packet distributions, start/endtimes, duration, repeatability, and others. Before investigatingthe performance statistics of various simulation scenarios, itis important to construct a common network traffic profilerepresenting the behavior of the actual network applicationsand to understand its basic characteristics. This study assumesthe configuration of mixed applications as shown in Table I,which includes four major service classes commonly usedin tactical applications. The control and management class
typically consumes very low network bandwidth with near-constant login or polling of the system status. It is importantto ensure the control and management packets are deliveredon time and with low packet loss. The inelastic real-time,preferred elastic, and elastic traffic have low, medium, and hightolerance, respectively, in term of packet loss, delay, and jitterparameters. Fig. 3 illustrates the network traffic throughputof the mixed applications used in this study. The asymmetricnetwork traffic throughput in both directions shows that thereis more network traffic from a server to a client due to FTPdownloading.
D. Performance Statistics
OPNET Modeler provides built-in performance statisticscollection that supports both global and local statistics [6].Global statistics illustrate the overall performance characteris-tics of a network scenario. Local statistics provide performancedata for particular objects such as nodes, links, and modules.Common performance parameters such as throughput, delay,delay variation (i.e., jitter), and packet loss are includedin the performance statistics collection. These performanceparameters are briefly discussed herein.
The channel capacity of a network connection can be
Authorized licensed use limited to: University of Minnesota. Downloaded on July 13, 2009 at 17:40 from IEEE Xplore. Restrictions apply.
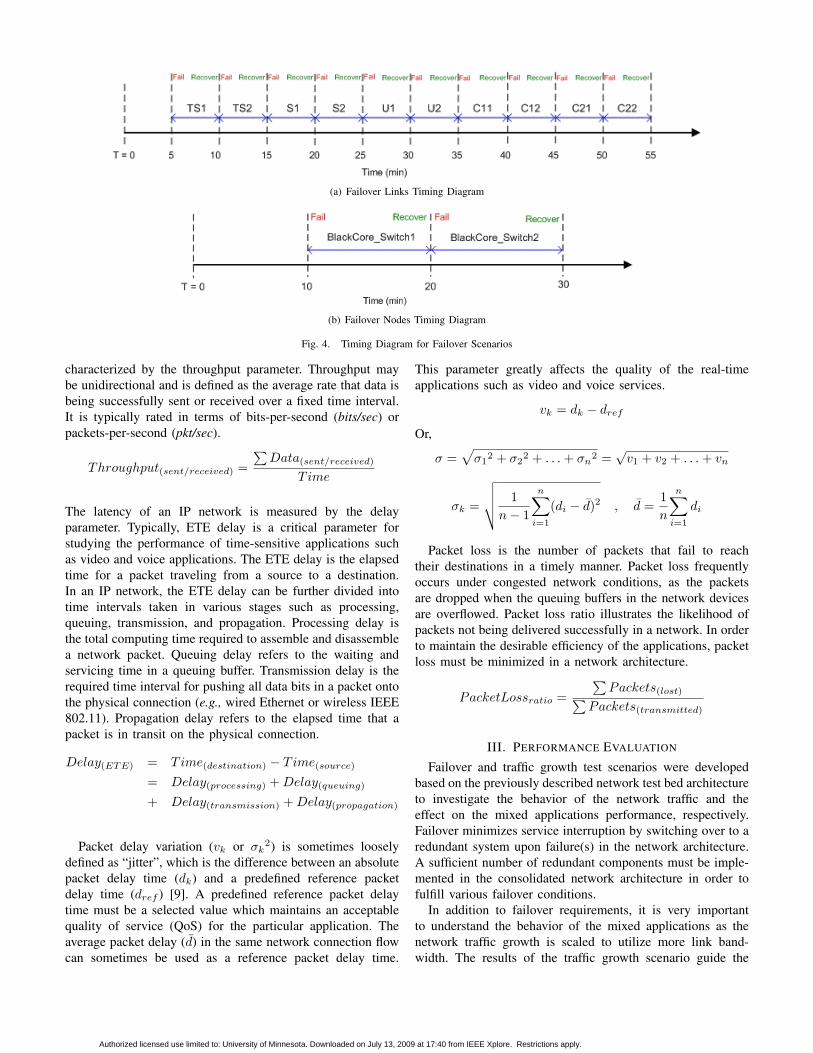
(a) Failover Links Timing Diagram
(b) Failover Nodes Timing Diagram
Fig. 4. Timing Diagram for Failover Scenarios
characterized by the throughput parameter. Throughput maybe unidirectional and is defined as the average rate that data isbeing successfully sent or received over a fixed time interval.It is typically rated in terms of bits-per-second (bits/sec) orpackets-per-second (pkt/sec).
Throughput(sent/received) =∑Data(sent/received)
Time
The latency of an IP network is measured by the delayparameter. Typically, ETE delay is a critical parameter forstudying the performance of time-sensitive applications suchas video and voice applications. The ETE delay is the elapsedtime for a packet traveling from a source to a destination.In an IP network, the ETE delay can be further divided intotime intervals taken in various stages such as processing,queuing, transmission, and propagation. Processing delay isthe total computing time required to assemble and disassemblea network packet. Queuing delay refers to the waiting andservicing time in a queuing buffer. Transmission delay is therequired time interval for pushing all data bits in a packet ontothe physical connection (e.g., wired Ethernet or wireless IEEE802.11). Propagation delay refers to the elapsed time that apacket is in transit on the physical connection.
Delay(ETE) = Time(destination) − Time(source)
= Delay(processing) +Delay(queuing)
+ Delay(transmission) +Delay(propagation)
Packet delay variation (vk or σk2) is sometimes loosely
defined as “jitter”, which is the difference between an absolutepacket delay time (dk) and a predefined reference packetdelay time (dref ) [9]. A predefined reference packet delaytime must be a selected value which maintains an acceptablequality of service (QoS) for the particular application. Theaverage packet delay (d̄) in the same network connection flowcan sometimes be used as a reference packet delay time.
This parameter greatly affects the quality of the real-timeapplications such as video and voice services.
vk = dk − dref
Or,
σ =√σ1
2 + σ22 + . . .+ σn
2 =√v1 + v2 + . . .+ vn
σk =
√√√√ 1n− 1
n∑i=1
(di − d̄)2 , d̄ =1n
n∑i=1
di
Packet loss is the number of packets that fail to reachtheir destinations in a timely manner. Packet loss frequentlyoccurs under congested network conditions, as the packetsare dropped when the queuing buffers in the network devicesare overflowed. Packet loss ratio illustrates the likelihood ofpackets not being delivered successfully in a network. In orderto maintain the desirable efficiency of the applications, packetloss must be minimized in a network architecture.
PacketLossratio =∑Packets(lost)∑
Packets(transmitted)
III. PERFORMANCE EVALUATION
Failover and traffic growth test scenarios were developedbased on the previously described network test bed architectureto investigate the behavior of the network traffic and theeffect on the mixed applications performance, respectively.Failover minimizes service interruption by switching over to aredundant system upon failure(s) in the network architecture.A sufficient number of redundant components must be imple-mented in the consolidated network architecture in order tofulfill various failover conditions.
In addition to failover requirements, it is very importantto understand the behavior of the mixed applications as thenetwork traffic growth is scaled to utilize more link band-width. The results of the traffic growth scenario guide the
Authorized licensed use limited to: University of Minnesota. Downloaded on July 13, 2009 at 17:40 from IEEE Xplore. Restrictions apply.
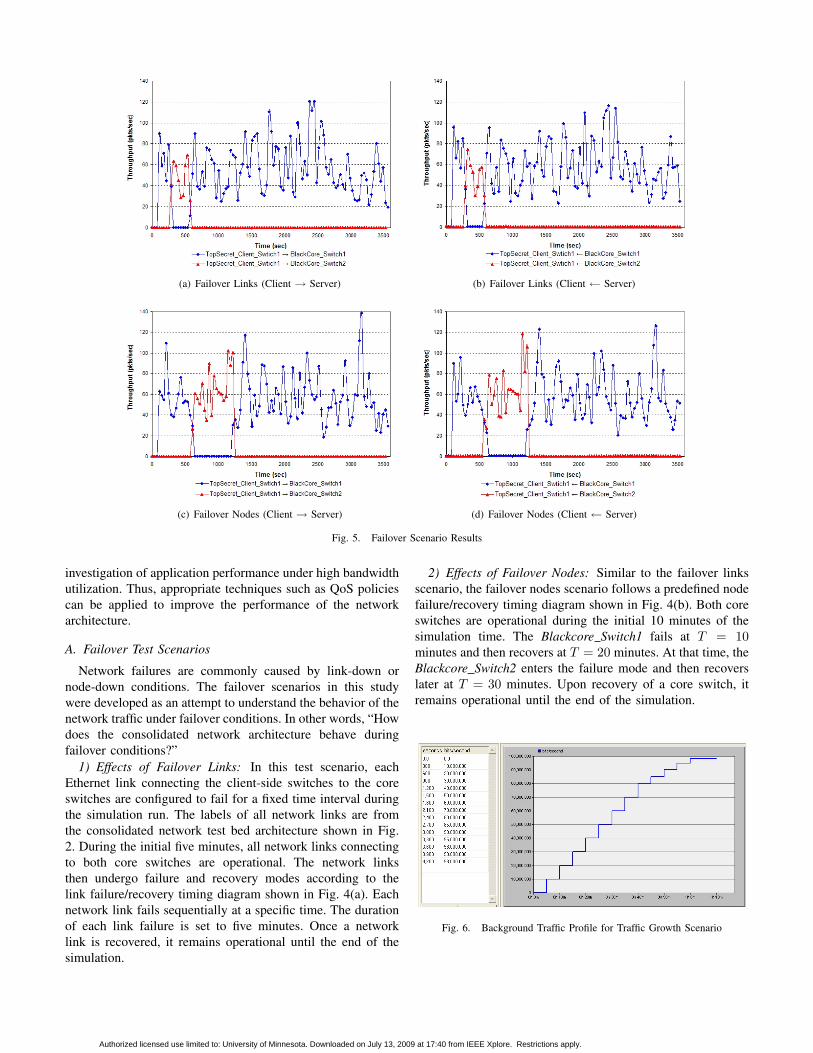
(a) Failover Links (Client → Server) (b) Failover Links (Client ← Server)
(c) Failover Nodes (Client → Server) (d) Failover Nodes (Client ← Server)
Fig. 5. Failover Scenario Results
investigation of application performance under high bandwidthutilization. Thus, appropriate techniques such as QoS policiescan be applied to improve the performance of the networkarchitecture.
A. Failover Test Scenarios
Network failures are commonly caused by link-down ornode-down conditions. The failover scenarios in this studywere developed as an attempt to understand the behavior of thenetwork traffic under failover conditions. In other words, “Howdoes the consolidated network architecture behave duringfailover conditions?”
1) Effects of Failover Links: In this test scenario, eachEthernet link connecting the client-side switches to the coreswitches are configured to fail for a fixed time interval duringthe simulation run. The labels of all network links are fromthe consolidated network test bed architecture shown in Fig.2. During the initial five minutes, all network links connectingto both core switches are operational. The network linksthen undergo failure and recovery modes according to thelink failure/recovery timing diagram shown in Fig. 4(a). Eachnetwork link fails sequentially at a specific time. The durationof each link failure is set to five minutes. Once a networklink is recovered, it remains operational until the end of thesimulation.
2) Effects of Failover Nodes: Similar to the failover linksscenario, the failover nodes scenario follows a predefined nodefailure/recovery timing diagram shown in Fig. 4(b). Both coreswitches are operational during the initial 10 minutes of thesimulation time. The Blackcore Switch1 fails at T = 10minutes and then recovers at T = 20 minutes. At that time, theBlackcore Switch2 enters the failure mode and then recoverslater at T = 30 minutes. Upon recovery of a core switch, itremains operational until the end of the simulation.
Fig. 6. Background Traffic Profile for Traffic Growth Scenario
Authorized licensed use limited to: University of Minnesota. Downloaded on July 13, 2009 at 17:40 from IEEE Xplore. Restrictions apply.
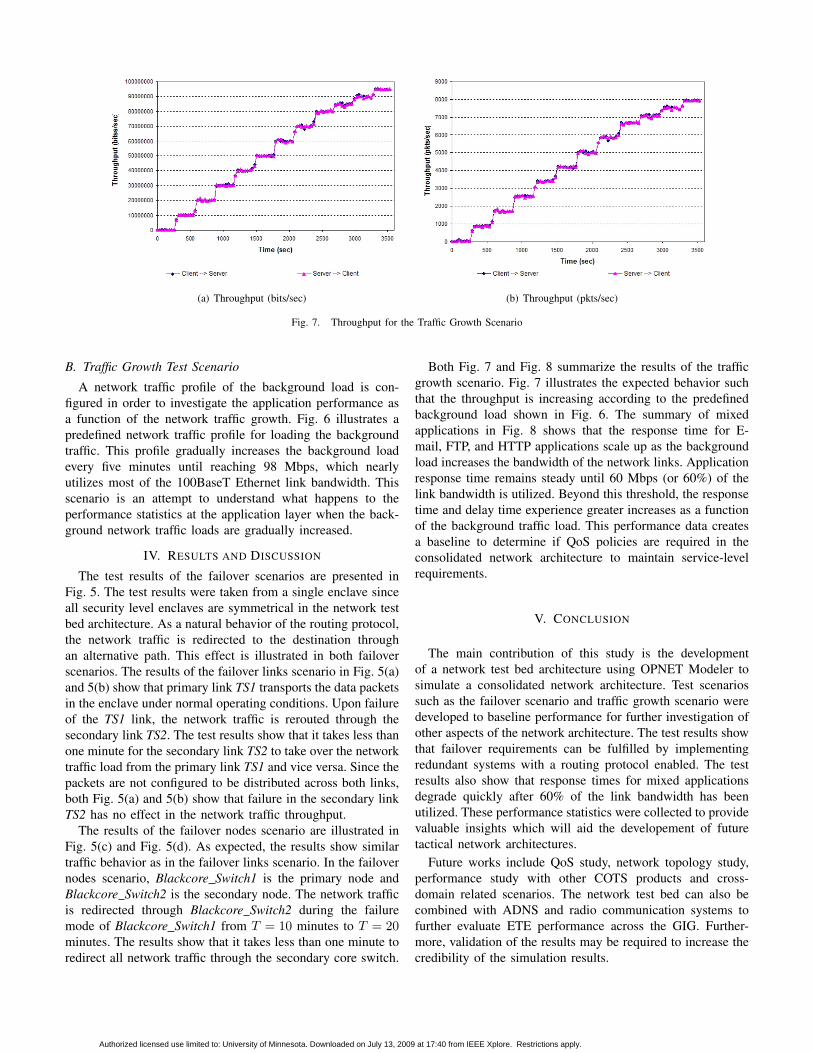
(a) Throughput (bits/sec) (b) Throughput (pkts/sec)
Fig. 7. Throughput for the Traffic Growth Scenario
B. Traffic Growth Test Scenario
A network traffic profile of the background load is con-figured in order to investigate the application performance asa function of the network traffic growth. Fig. 6 illustrates apredefined network traffic profile for loading the backgroundtraffic. This profile gradually increases the background loadevery five minutes until reaching 98 Mbps, which nearlyutilizes most of the 100BaseT Ethernet link bandwidth. Thisscenario is an attempt to understand what happens to theperformance statistics at the application layer when the back-ground network traffic loads are gradually increased.
IV. RESULTS AND DISCUSSION
The test results of the failover scenarios are presented inFig. 5. The test results were taken from a single enclave sinceall security level enclaves are symmetrical in the network testbed architecture. As a natural behavior of the routing protocol,the network traffic is redirected to the destination throughan alternative path. This effect is illustrated in both failoverscenarios. The results of the failover links scenario in Fig. 5(a)and 5(b) show that primary link TS1 transports the data packetsin the enclave under normal operating conditions. Upon failureof the TS1 link, the network traffic is rerouted through thesecondary link TS2. The test results show that it takes less thanone minute for the secondary link TS2 to take over the networktraffic load from the primary link TS1 and vice versa. Since thepackets are not configured to be distributed across both links,both Fig. 5(a) and 5(b) show that failure in the secondary linkTS2 has no effect in the network traffic throughput.
The results of the failover nodes scenario are illustrated inFig. 5(c) and Fig. 5(d). As expected, the results show similartraffic behavior as in the failover links scenario. In the failovernodes scenario, Blackcore Switch1 is the primary node andBlackcore Switch2 is the secondary node. The network trafficis redirected through Blackcore Switch2 during the failuremode of Blackcore Switch1 from T = 10 minutes to T = 20minutes. The results show that it takes less than one minute toredirect all network traffic through the secondary core switch.
Both Fig. 7 and Fig. 8 summarize the results of the trafficgrowth scenario. Fig. 7 illustrates the expected behavior suchthat the throughput is increasing according to the predefinedbackground load shown in Fig. 6. The summary of mixedapplications in Fig. 8 shows that the response time for E-mail, FTP, and HTTP applications scale up as the backgroundload increases the bandwidth of the network links. Applicationresponse time remains steady until 60 Mbps (or 60%) of thelink bandwidth is utilized. Beyond this threshold, the responsetime and delay time experience greater increases as a functionof the background traffic load. This performance data createsa baseline to determine if QoS policies are required in theconsolidated network architecture to maintain service-levelrequirements.
V. CONCLUSION
The main contribution of this study is the developmentof a network test bed architecture using OPNET Modeler tosimulate a consolidated network architecture. Test scenariossuch as the failover scenario and traffic growth scenario weredeveloped to baseline performance for further investigation ofother aspects of the network architecture. The test results showthat failover requirements can be fulfilled by implementingredundant systems with a routing protocol enabled. The testresults also show that response times for mixed applicationsdegrade quickly after 60% of the link bandwidth has beenutilized. These performance statistics were collected to providevaluable insights which will aid the developement of futuretactical network architectures.
Future works include QoS study, network topology study,performance study with other COTS products and cross-domain related scenarios. The network test bed can also becombined with ADNS and radio communication systems tofurther evaluate ETE performance across the GIG. Further-more, validation of the results may be required to increase thecredibility of the simulation results.
Authorized licensed use limited to: University of Minnesota. Downloaded on July 13, 2009 at 17:40 from IEEE Xplore. Restrictions apply.
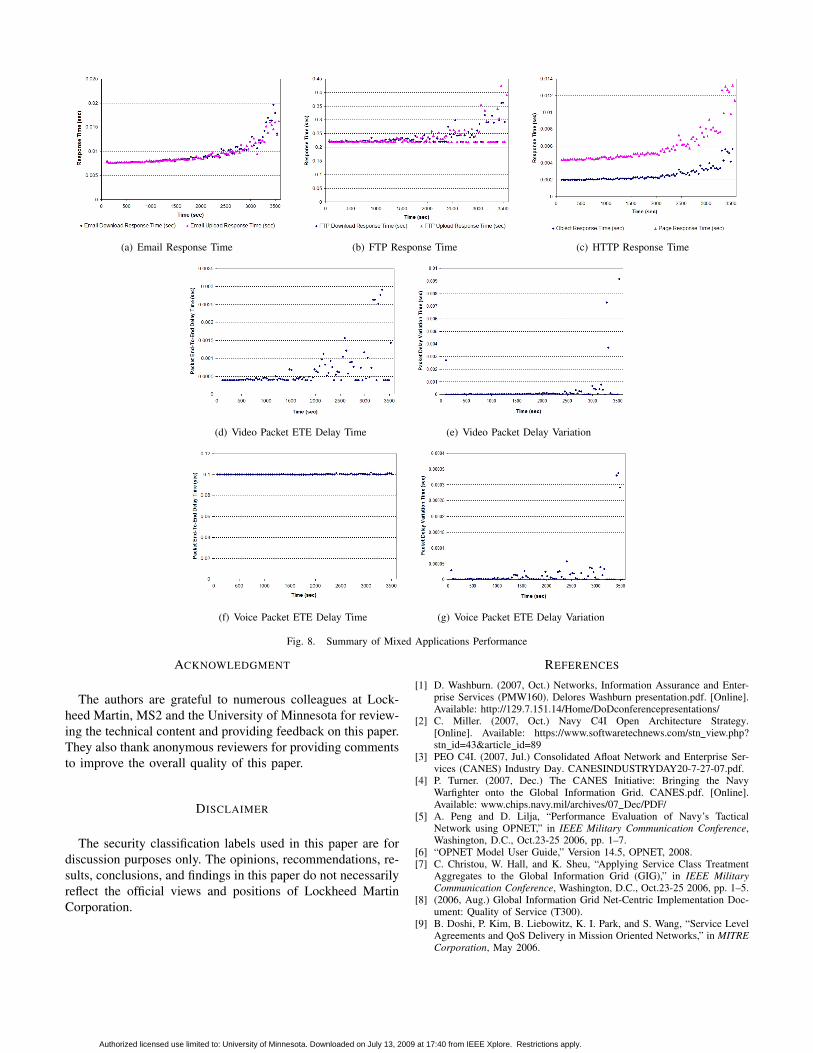
(a) Email Response Time (b) FTP Response Time (c) HTTP Response Time
(d) Video Packet ETE Delay Time (e) Video Packet Delay Variation
(f) Voice Packet ETE Delay Time (g) Voice Packet ETE Delay Variation
Fig. 8. Summary of Mixed Applications Performance
ACKNOWLEDGMENT
The authors are grateful to numerous colleagues at Lock-heed Martin, MS2 and the University of Minnesota for review-ing the technical content and providing feedback on this paper.They also thank anonymous reviewers for providing commentsto improve the overall quality of this paper.
DISCLAIMER
The security classification labels used in this paper are fordiscussion purposes only. The opinions, recommendations, re-sults, conclusions, and findings in this paper do not necessarilyreflect the official views and positions of Lockheed MartinCorporation.
REFERENCES
[1] D. Washburn. (2007, Oct.) Networks, Information Assurance and Enter-prise Services (PMW160). Delores Washburn presentation.pdf. [Online].Available: http://129.7.151.14/Home/DoDconferencepresentations/
[2] C. Miller. (2007, Oct.) Navy C4I Open Architecture Strategy.[Online]. Available: https://www.softwaretechnews.com/stn view.php?stn id=43&article id=89
[3] PEO C4I. (2007, Jul.) Consolidated Afloat Network and Enterprise Ser-vices (CANES) Industry Day. CANESINDUSTRYDAY20-7-27-07.pdf.
[4] P. Turner. (2007, Dec.) The CANES Initiative: Bringing the NavyWarfighter onto the Global Information Grid. CANES.pdf. [Online].Available: www.chips.navy.mil/archives/07 Dec/PDF/
[5] A. Peng and D. Lilja, “Performance Evaluation of Navy’s TacticalNetwork using OPNET,” in IEEE Military Communication Conference,Washington, D.C., Oct.23-25 2006, pp. 1–7.
[6] “OPNET Model User Guide,” Version 14.5, OPNET, 2008.[7] C. Christou, W. Hall, and K. Sheu, “Applying Service Class Treatment
Aggregates to the Global Information Grid (GIG),” in IEEE MilitaryCommunication Conference, Washington, D.C., Oct.23-25 2006, pp. 1–5.
[8] (2006, Aug.) Global Information Grid Net-Centric Implementation Doc-ument: Quality of Service (T300).
[9] B. Doshi, P. Kim, B. Liebowitz, K. I. Park, and S. Wang, “Service LevelAgreements and QoS Delivery in Mission Oriented Networks,” in MITRECorporation, May 2006.
Authorized licensed use limited to: University of Minnesota. Downloaded on July 13, 2009 at 17:40 from IEEE Xplore. Restrictions apply.


![Tactical Combat Casualty Care [TCCC] Some reminders and ...€¦ · Tactical Combat Casualty Care Tactical Evacuation Care The term “Tactical Evacuation” includes both Casualty](https://img.pdfslide.net/doc/110x75/604ef4767ef6a83727287be2/tactical-combat-casualty-care-tccc-some-reminders-and-tactical-combat-casualty.jpg)