Embed Size (px)
Citation preview
Towards Improving Operator Alarm Flood Responses: Alternative Alarm Presentation Techniques
Peter T. Bullemer
Human Centered Solutions Independence, MN USA
Dal Vernon C. Reising
Human Centered Solutions Canton, MI USA
Mischa Tolsma Sasol Synfuels, Ltd.
Secunda, South Africa
Jason C. Laberge Honeywell Advanced Labs Golden Valley, MN USA
ABSTRACT
Alarm flooding is the phenomenon of presenting more alarms in a given period of time than a human operator can effectively respond. Past Abnormal Situation Management® (ASM®) Consortium research on the use of alarm system rationalization and configuration methodologies have demonstrated significant reduction in the probability and extent of alarm flooding. However, despite these effective alarm system design and configuration efforts, the occurrence of alarm flooding has not been eliminated. As a consequence, the ASM Consortium1 conducted a research project to develop and evaluate alternative design concepts for presenting alarm information to enable operators to more effectively handle abnormal situations that produce alarm floods. This paper will present the alternative alarm presentation concepts and discuss the study findings on their impact on operator performance. The use of a logical processing technique to modulate the presentation rate of alarms in the alarm display improved operator performance. In addition, the results showed that console operator performance improved with the use of all alarm presentation techniques in combination with the use of a formal alarm response strategy. Specifically, the study demonstrates that operator performance under alarm flood conditions can be improved if the operator interface enables the operator to strategically view subsets of the alarms associated with specific equipment areas rather than a list containing all of the alarms.
INTRODUCTION
Alarm systems in the process industries are important information sources for operators responsible for preventing and responding to abnormal situations and ultimately, mitigating the occurrence of process safety incidents (Bullemer and Metzger, 2008). Alarm flooding is the phenomenon of presenting more alarms in a given period of time than a human operator can effectively respond to (Errington, Reising & Burns, 2009). Alarm flooding has been identified as the root cause to significant plant incidents such as Texaco Pembroke (Health & Safety Executive, 1997) and Three Mile Island Nuclear plant (Rubinstein & Mason, 1979). Previous ASM Consortium human performance modeling research has shown the limit for a typical operator to be approximately 10 alarms in a ten minute period (Reising,
1 This research study was sponsored by the Abnormal Situation Management® (ASM®) Consortium. ASM and Abnormal Situation Management are registered trademarks of Honeywell International, Inc.
Addressing Alarm Floods: Operator Interface Considerations
Distributed with permission of author(s) by ISA 2011 Presented at ISA Automation Week; http://www.isa.org
Downs, & Bayn, 2004), consistent with the EEMUA (1999) standard of not more than 10 alarms in the first ten minutes following an upset. The ASM Consortium members have conducted numerous studies exploring alternative methods to reduce the probability of alarm flooding through improved alarm rationalization, alarm system configuration and alarm system maintenance practices. These studies have demonstrated that better alarm configuration and effective use of suppression techniques can make a considerable impact on reducing the likelihood of alarm floods in the operator. However, even the best efforts do not eliminate the occurrence of alarm flooding (Bransby, 2001; Reising & Montgomery, 2005). A key finding of a 2006 ASM Consortium research project (Andow, Cade, Clark, & Foslien, 2006) was that even though the configuration techniques can significantly reduce the size of the alarm flooding associated with process upsets, these techniques on their own are not sufficient to reduce the alarm loads to a level at which human operators can mentally process and physically respond. A key need that remains is to provide effective alarm summary displays to help operators cope with these inevitable alarm floods (Tuszynski, Larsson, Nihlwing, Öhman & Calzada, 2002).
TRADITIONAL ALARM LIST DISPLAY
In plants where modern distributed control systems (DCSs) are installed, the traditional practice is to show alarms using a chronologically sorted list-based alarm summary display (Bransby, 2001). Alarms are presented via scrolling lists on console monitors and are no longer displayed with spatially-dedicated annunciator tiles as was done on older direct-wired panel boards. The usability challenges of the traditional list-based alarm summary display during an alarm flood include the fact that alarms move through the list and off the page faster than can be read by a typical operator (Bransby, 2001; Brown, O’Hara, & Higgins, 2000). The viewable list for a given page also fills up quickly so operators must scroll or change pages to see all the alarms that are occurring, which takes their attention away from their operating displays and takes valuable time (Mattiasson, 1999). A consequence of the scrolling list is that alarms will move down the list as the operator is actually trying to read it, so in order to read the alarm details, the operator has to move his/her gaze down at the same rate as the changing alarm position. Higher priority alarms will also be scrolled off a given page as it fills up while the operator’s attention is directed elsewhere (Zwaga & Hoonhout, 1994). Similarly, alarms that came in earlier in the flood (and for which the operator may be “chasing” on other operating graphics) will have moved to successive pages in the alarm summary display and therefore would be missed by the operator were these same alarms to “clear” on their own accord. It is apparent that the rapidly changing, chronological list-based alarm summary display that is traditionally installed in most process plants does not support the operator’s ability to effectively analyze which process functions are lost, being threatened, or remain unthreatened (Tuszynski et al., 2002). In other words, the alarm list display tends to be too detailed with the presentation of sequential information; it lacks the functional organization necessary to understand the nature and progress of a disturbance (Zwaga & Hoonhout, 1994). Consequently, alternative effective visual display techniques are necessary to enable control room operators to cope with plant upsets that result in these inevitable alarm flood situations.
Addressing Alarm Floods: Operator Interface Considerations
Distributed with permission of author(s) by ISA 2011 Presented at ISA Automation Week; http://www.isa.org
ALTERNATIVE ALARM VISUALIZATION TECHNIQUES
Past research has explored alternatives to using a single alarm list to monitor and track plant disturbances. A pilot experiment by Tuszynski et al (2002) demonstrated a performance advantage for operators that had a split-list display where primary and secondary alarm types were split between two separate windows. In an analogous fashion without lists, Gordon and Andersson (2004) created soft panel annunciators where there was a fixed position computer screen for the highest level alarms (called a “direct and shared” screen); where the alarms are grouped by process and system function in an attempt to avoid using alarm lists altogether. Additional detailed alarm information was available on secondary computer screens where the same panel concept was used to view less critical alarms. Another visualization technique explored in the nuclear power industry is the creation of a hybrid of a functional console overview display and the annunciator panel (see Brown, O’Hara, & Higgins, 2000 for a review). In a functional console overview display the emphasis is on highlighting key functional relationships across the span-of-control responsibility of the console operator (Bullemer & Reising, 2008). In addition, alarm annunciators can be integrated into the overview to show alarms status of the critical operating functions (Bristol, 2001). Bristol (2001) developed the “battle ribbon” visualization technique that combined the annunciator concept with an indication of alarm status of key functions over time such that at a glance operators could see how alarm status was changing over time. The integration of the annunciator panel concept with the organizational structure of an overview status display puts the critical functions in context with key process parameters and supports the at-a-glance pattern recognition for situation awareness of changes in status. Researchers at the HAMMLAB in Norway concluded that an effective solution required multiple interface techniques (such as alarm panels, message lists, alarm indicators in process monitoring displays) to enable operators to effectively handle the variety of alarm system behaviors that occur under varying operating scenarios (Kvalem, Haugset & Øwre, 2005).
LOGICAL PROCESSING
Another possible solution to the alarm flood problem that results in alarms being presented at a rate faster than human operators can mentally process is to use logical processing to adjust or throttle the rate of alarm presentation. The concept of throttling alarms involves the algorithmic modulation of the alarm presentation rate to be compatible with the effective rate that an operator can read and take appropriate actions (also referred to as automatic alarm load shedding, EEMUA, 1999, pp. 80-81). In this study, the alarm flood situation has been defined as a condition in which the alarm rate for a single operator is higher than 10 alarms per ten minutes for three or more consecutive 10-minute periods, then the throttling algorithm needs to be active whenever an alarm flood condition is detected. The definition is based on human performance studies that indicate a “maximum rate (or performance ceiling)” is approximately 49 seconds per alarm, that is, people need approximately one minute per alarm on the average to execute the expected response (Reising, Downs and Bayn, 2004). The remainder of this paper presents the findings from an ASM Consortium research project that evaluated the impact of three alternative visualization techniques and one alarm throttling technique on console operators’ ability to understand plant disturbances that generate alarm floods.
Addressing Alarm Floods: Operator Interface Considerations
Distributed with permission of author(s) by ISA 2011 Presented at ISA Automation Week; http://www.isa.org
METHODOLOGY
This methodology describes the experimental platform and the experimental design.
EXPERIMENTAL PLATFORM
The study examines the influence of three alternative visualization techniques and one alarm throttling technique on operators’ ability to respond to emulated alarm flood scenarios in a controlled experimental setting. This section characterizes the platform used in conducting the study in terms of the alarm presentation concepts, the operator workstation setup, and the nature of the alarm flood scenarios.
ALARM PRESENTATION TECHNIQUES
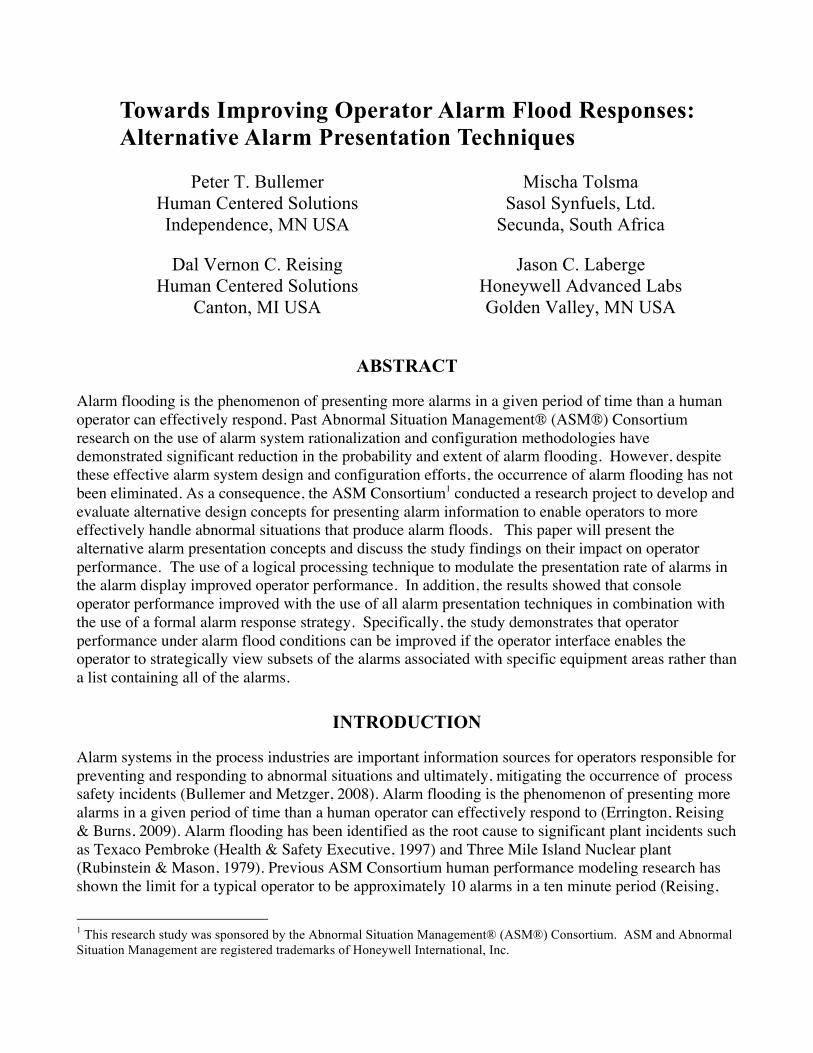
The study investigates three alternative visualization techniques and one alarm throttling technique in terms of their impact on operator’s ability to response to alarm flood conditions. Presentation Technique #1—Industry-typical Alarm Summary Display is indicative of many of today’s DCS vendor designs for presenting process alarms (shown in Figure 1).
Figure 1 Illustration of the Industry-typical Alarm Summary Display mockup used in the study.
Addressing Alarm Floods: Operator Interface Considerations
Distributed with permission of author(s) by ISA 2011 Presented at ISA Automation Week; http://www.isa.org
The Industry-typical Alarm Summary Display has three major interface elements:
• Detailed List—the detailed description of process alarms appear in this view with attributes such as time/date, priority, alarm type and tagname. Operators can acknowledge individual alarms or all alarms on the page. The list can be sorted on attributes such as time, priority, and equipment area by clicking on column headings.
• Asset Browser—a list of major process areas or units appears in a tree structure in the form of a browser tool. The highest priority alarm status of any alarm being annunciated is shown associated with each equipment area represented in the view. Selection of any item on the list, changes the content of the Detailed List to the alarms for the selected equipment area.
• Filter Bar—Just above the Detailed List there are command buttons to change the content of the Detailed List to remove lower priority, acknowledged or return to normal alarms.
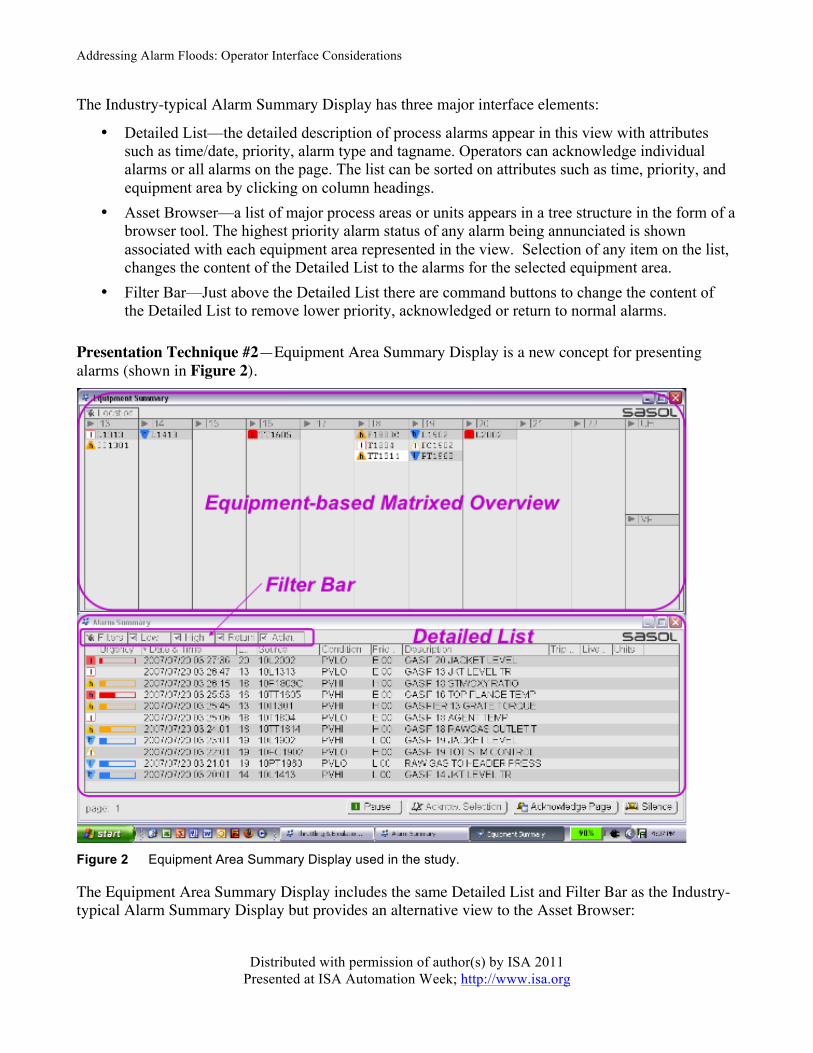
Presentation Technique #2—Equipment Area Summary Display is a new concept for presenting alarms (shown in Figure 2).
Figure 2 Equipment Area Summary Display used in the study.
The Equipment Area Summary Display includes the same Detailed List and Filter Bar as the Industry-typical Alarm Summary Display but provides an alternative view to the Asset Browser:
Addressing Alarm Floods: Operator Interface Considerations
Distributed with permission of author(s) by ISA 2011 Presented at ISA Automation Week; http://www.isa.org
• Equipment-based Matrix Overview—each major equipment area of the console operator area of responsibility is represented at the top of the display in single or double row of alarm panels. The equipment areas shown are the same as used in the Asset Browser in the Industry-typical Alarm Summary display. The definition of specific scope of each major equipment area will be a plant-specific organization. It is expected that the typical scope would be the scope associated with a major equipment area like distillation column, reactor, or furnace. The panels are arranged in a left-to-right, top-to-bottom organization that intuitively reflects the plant process flow or geographical arrangement. Within each panel, alarm indicators are shown in vertical arrangement with the most recent alarms appearing on the top. Each alarm indicator represents key attributes such as alarm priority, acknowledged status, alarm type, parameter type and short tag descriptor. A mouse-over with the cursor results in the display of a full alarm description. As with the Asset Browser, selection of a specific equipment area panel focuses the content of the Detailed List on alarms for just that area.
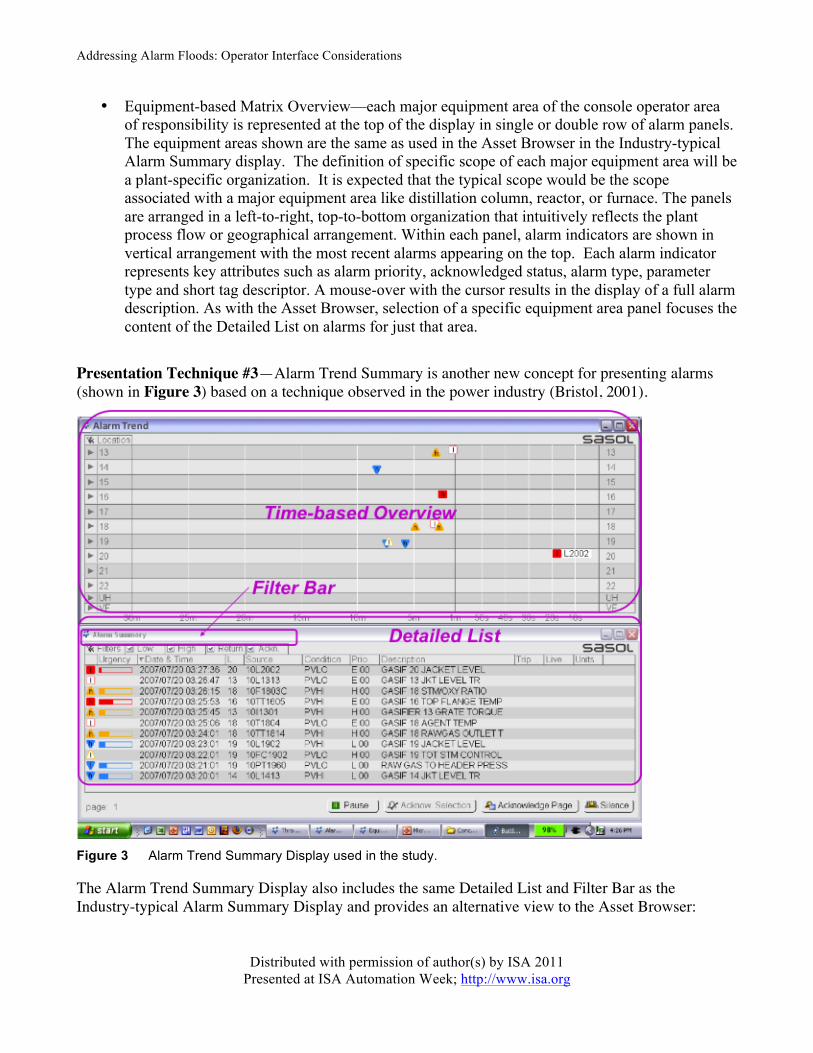
Presentation Technique #3—Alarm Trend Summary is another new concept for presenting alarms (shown in Figure 3) based on a technique observed in the power industry (Bristol, 2001).
Figure 3 Alarm Trend Summary Display used in the study.
The Alarm Trend Summary Display also includes the same Detailed List and Filter Bar as the Industry-typical Alarm Summary Display and provides an alternative view to the Asset Browser:
Addressing Alarm Floods: Operator Interface Considerations
Distributed with permission of author(s) by ISA 2011 Presented at ISA Automation Week; http://www.isa.org
• Time-based Overview—each major equipment area of the console operator area of responsibility is represented at the top of the display in rows of alarm panels (i.e., consistent with the two other summary displays). The panels are arranged in a top-to-bottom organization that intuitively reflects the plant process flow or geographical arrangement. Within each panel, alarm indicators are shown in horizontal arrangement with the most recent alarms appearing on the right (in fashion similar to a trend display with most recent information on the right). Each alarm indicator represents key attributes such as alarm priority, acknowledged status, alarm type, parameter type and short tag descriptor. As in the Asset Browser, selection of a specific equipment area panel focuses the content of the Detailed List on alarms for just that area.
Presentation Technique #4—Alarm load throttling and de-chattering is a logical processing technique that modulates the rate of alarms appearing in the alarm summary displays and at the same time also reduces the total number of annunciations of a repeating alarm condition. The alarm load throttling algorithm adjusts the rate of visual/auditory alarm annunciation to a target rate of 1 alarm per minute. When alarms are being triggered at a rate faster than 1 per minute, the algorithm throttles (i.e., temporarily holds the alarm) based on the relative importance of all active alarms; where importance is defined by priority (i.e., high, medium, or low), minimum response time threshold, (e.g., 5 minutes left to respond) and consequence associated with equipment areas (i.e., equipment areas are rank ordered)2. When alarms are of equal priority, those associated with equipment areas of higher consequence rank are shown first. When an alarm reaches the minimum alarm response threshold, it is shown regardless of priority. The alarm load throttling and de-chattering algorithm uses an off-delay de-bounce threshold for all alarms independent of their alarm configuration setting, but dependent on the alarm priority. For the study, this threshold was set at 30 seconds for high, 60 seconds for medium and 120 seconds for low priority alarms.
OPERATOR WORKSTATION
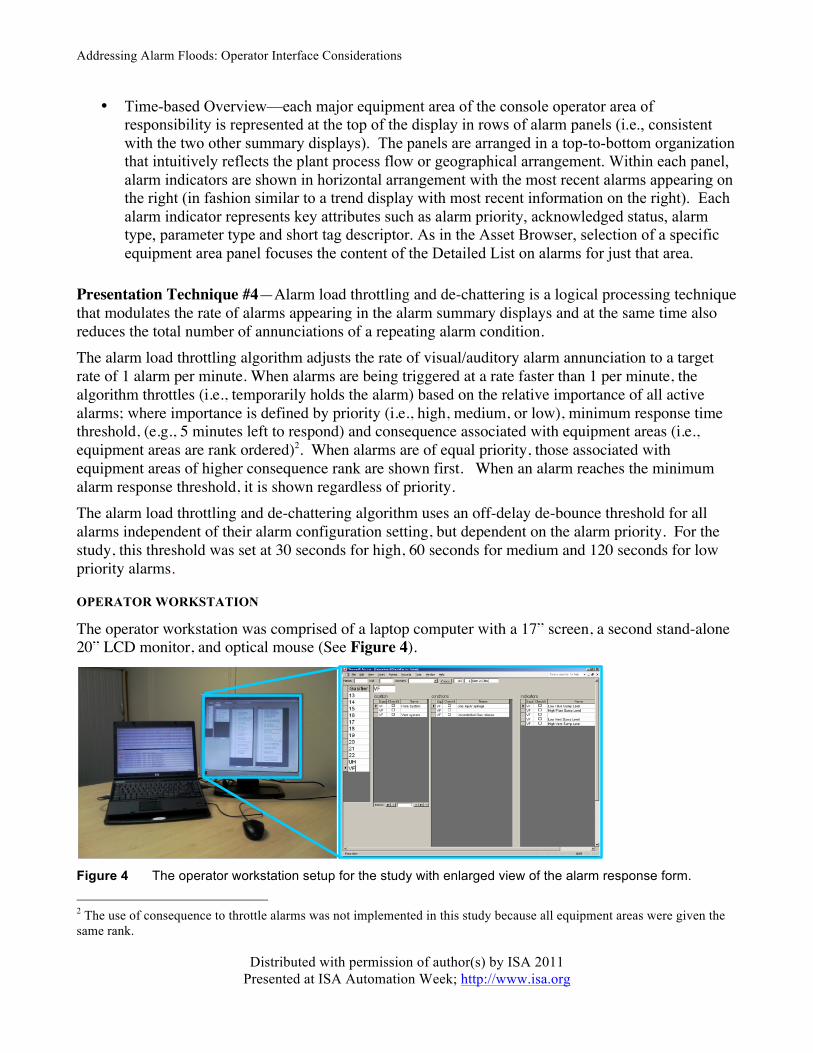
The operator workstation was comprised of a laptop computer with a 17” screen, a second stand-alone 20” LCD monitor, and optical mouse (See Figure 4).
Figure 4 The operator workstation setup for the study with enlarged view of the alarm response form.
2 The use of consequence to throttle alarms was not implemented in this study because all equipment areas were given the same rank.
Addressing Alarm Floods: Operator Interface Considerations
Distributed with permission of author(s) by ISA 2011 Presented at ISA Automation Week; http://www.isa.org
The study participants saw the alarm summary displays on the laptop screen and the alarm response form on the stand-alone monitor. The laptop computer was used to run the alarm flood emulator software and captured the operator alarm response data. Using the alarm response form, the study participants could respond to an individual alarm or a group of alarms in the alarm scenario by indicating where in the plant the problem was (i.e., specific unit and specific piece of equipment), what the key alarm indications were (i.e., indicators) and what underlying abnormal conditions were indicated (i.e., conditions). Since operators were not able to respond to alarms as they normally would in their console workstation in the control room, this form enabled the participants to perform an alarm interpretation task while simultaneously monitoring the alarm summary display. So as the alarms were appearing on the alarm summary displays, the participants were continuously going to this alarm response form to indicate their alarm interpretations.
ALARM FLOOD SCENARIOS
A total of twelve ten minute alarm flood scenarios were developed for this study using historical alarm data for the process plant area represented in the study. The average alarm rate across the 12 scenarios was 146 alarms per 10 minute with a range of 85 to 316 alarms. The number of unique alarms averaged 25 per 10 minute scenario with a range of 14 to 28 and the average number of equipment areas in alarm per scenario was 9.8 out of a possible 12 equipment areas (the range of 8 to 11 areas).
EXPERIMENTAL DESIGN
The experimental design for the study is described in terms of the operator participants, the activities of each of the study sessions and the treatment conditions for evaluating the operator interface concepts.
STUDY PARTICIPANTS
The participants were sixteen active console operators from two gasification process plants in the Sasol Secunda Synfuels operations that voluntarily participated while working their normal shift. Prior to beginning the experimental session, each operator was asked to fill out a Pre-Session Questionnaire containing survey questions on demographic characteristics. The demographic measures included experience with operations, console responsibilities, personnel computers, and software applications. Each operator was assigned to one of two between subjects groups, Equipment Area (EA) or Alarm Trend (AT) corresponding to one of the new alarm visualization techniques. As operators were made available to the study, the study team assigned them to specific experimental conditions based on their competency level to counterbalance competencies in the between subject treatment conditions. Table 1 presents some of the demographic statistics for each of the two groups of study participants.
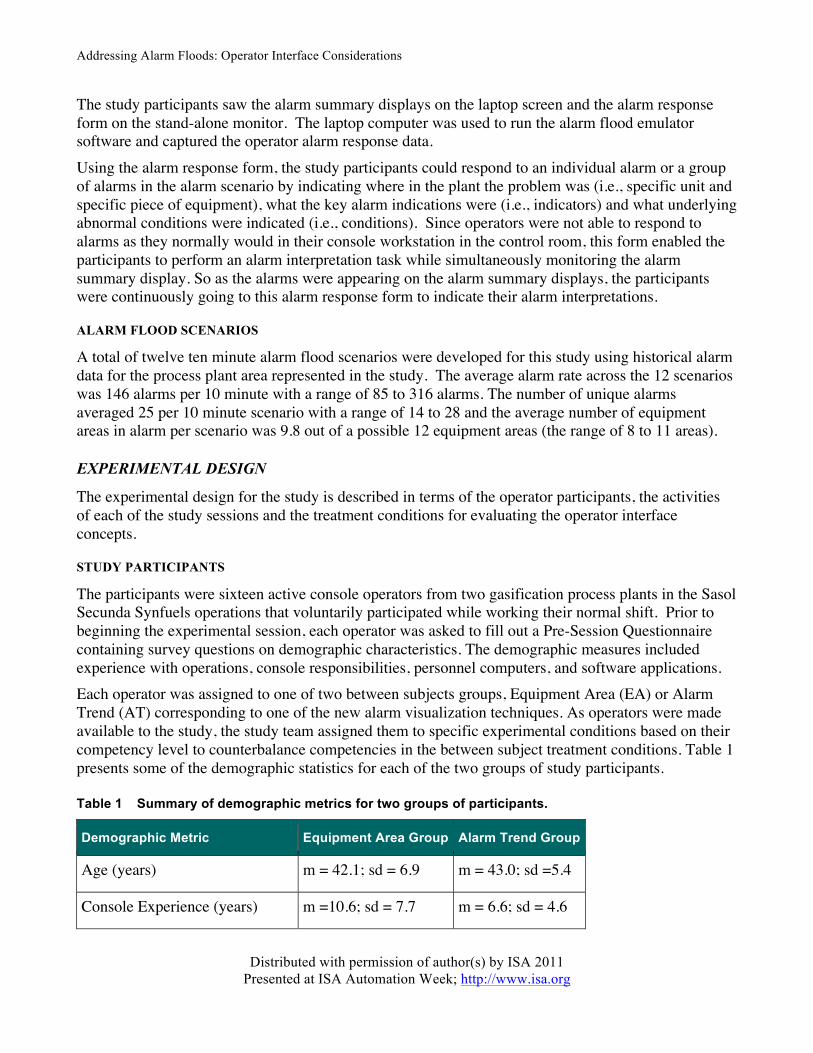
Table 1 Summary of demographic metrics for two groups of participants.
Demographic Metric Equipment Area Group Alarm Trend Group
Age (years) m = 42.1; sd = 6.9 m = 43.0; sd =5.4
Console Experience (years) m =10.6; sd = 7.7 m = 6.6; sd = 4.6
Addressing Alarm Floods: Operator Interface Considerations
Distributed with permission of author(s) by ISA 2011 Presented at ISA Automation Week; http://www.isa.org
Field Experience (years) m = 8.9; sd = 6.1 m = 10.6; sd = 5.0
Current DCS Experience (years) m = 8.8; sd = 6.8 m = 6.7; sd = 4.5
Daily Hours on Computer m = 3.3; sd = 1.9 m = 3.0; sd = 1.8
The statistical comparison between the two groups of participants on the demographic metrics did not reveal any significant differences.
EVALUATION SESSIONS
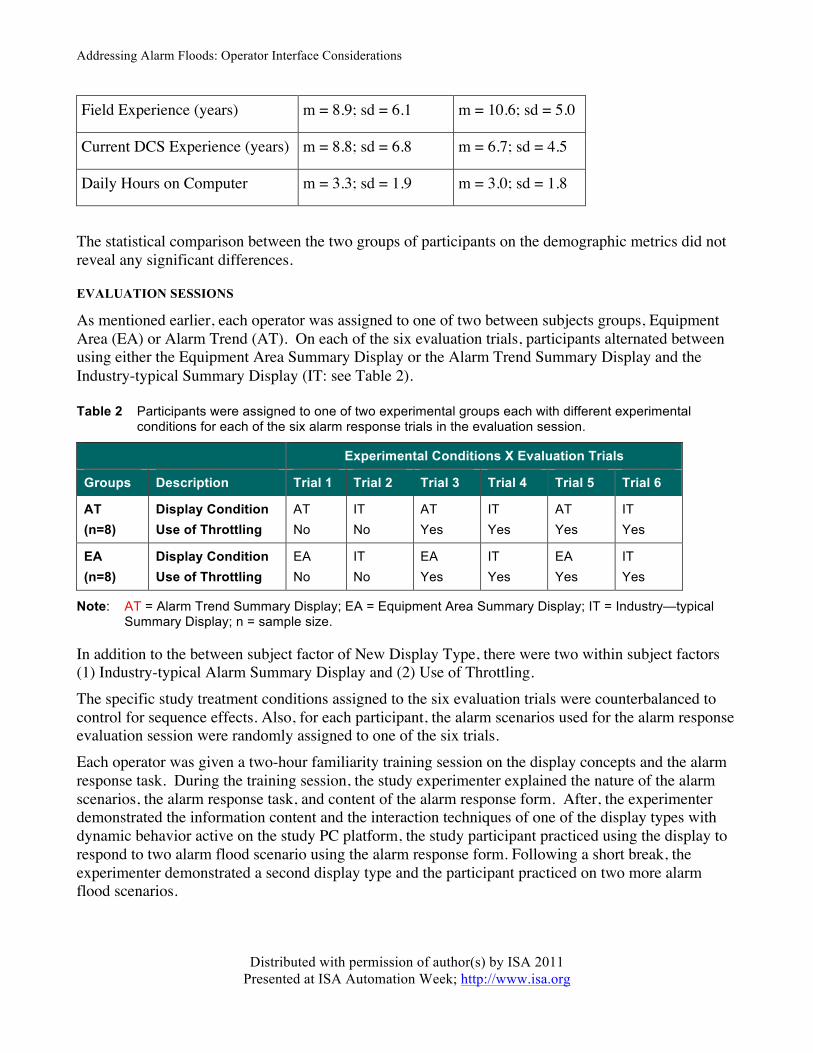
As mentioned earlier, each operator was assigned to one of two between subjects groups, Equipment Area (EA) or Alarm Trend (AT). On each of the six evaluation trials, participants alternated between using either the Equipment Area Summary Display or the Alarm Trend Summary Display and the Industry-typical Summary Display (IT: see Table 2).
Table 2 Participants were assigned to one of two experimental groups each with different experimental conditions for each of the six alarm response trials in the evaluation session.
Experimental Conditions X Evaluation Trials
Groups Description Trial 1 Trial 2 Trial 3 Trial 4 Trial 5 Trial 6
AT (n=8)
Display Condition Use of Throttling
AT No
IT No
AT Yes
IT Yes
AT Yes
IT Yes
EA (n=8)
Display Condition Use of Throttling
EA No
IT No
EA Yes
IT Yes
EA Yes
IT Yes
Note: AT = Alarm Trend Summary Display; EA = Equipment Area Summary Display; IT = Industry—typical Summary Display; n = sample size.
In addition to the between subject factor of New Display Type, there were two within subject factors (1) Industry-typical Alarm Summary Display and (2) Use of Throttling. The specific study treatment conditions assigned to the six evaluation trials were counterbalanced to control for sequence effects. Also, for each participant, the alarm scenarios used for the alarm response evaluation session were randomly assigned to one of the six trials. Each operator was given a two-hour familiarity training session on the display concepts and the alarm response task. During the training session, the study experimenter explained the nature of the alarm scenarios, the alarm response task, and content of the alarm response form. After, the experimenter demonstrated the information content and the interaction techniques of one of the display types with dynamic behavior active on the study PC platform, the study participant practiced using the display to respond to two alarm flood scenario using the alarm response form. Following a short break, the experimenter demonstrated a second display type and the participant practiced on two more alarm flood scenarios.
Addressing Alarm Floods: Operator Interface Considerations
Distributed with permission of author(s) by ISA 2011 Presented at ISA Automation Week; http://www.isa.org
All participants received a fifteen-minute break following the completion of the last alarm response practice session. During the alarm response evaluation session, the participants performed the alarm response task with six different alarm flood scenarios. Following each alarm response evaluation trial, participants completed a usability survey and a subjective workload survey.
CONDITION-INDICATOR KNOWLEDGE ASSESSMENT
Following the completion of the alarm response evaluation session, each operator was asked to show the specific alarm condition or conditions that would indicate specific abnormal conditions in the process units. Participants used a knowledge assessment form that listed the same alarm indicators that were on the alarm response form. The participants were asked to provide all possible single or combinations of indicators of each abnormal condition. This mapping of alarm indicators to abnormal conditions represents the mental models for each of the participants. This mental model data is used in the analysis of alarm response data in the performance session to determine the accuracy and completeness of each participant’s performance in the various treatment conditions. Hence, the accuracy of each participant’s interpretation of the alarm flood data is not based on a normative correct answer but based on each individual’s mental model of the relation between patterns of alarm notifications and underlying abnormal process conditions.
FINDINGS
The operator experience and alarm response performance measures (i.e., as reported in the next two sections) for the four study treatment conditions were analyzed using independent Analysis of Variance (ANOVA). Significant alpha values were set at p < .10, but marginally significant results (p < .15) and trends (p < .20) were also noted given the exploratory nature of the study and the small sample sizes (Wickens, 1998). Follow-up tests for statistically and marginally significant findings and trends were done using a Bonferroni correction.
The study data was screened to identify any participants who stood out statistically from the rest based on any of the data collected (i.e., box-plots were used to identify outliers). Based on the examination of the outlier information, all participants were included in the analysis
ALARM RESPONSE PERFORMANCE MEASURES
In this section, the results of the alarm response performance are reported in terms of orienting to alarms, evaluating to alarms and alarm response strategies.
ORIENTING TO ALARMS
Orienting to alarms involves detecting the occurrence of an alarm and identifying the source of the alarm in terms of a location of an abnormal condition in the process. In this study, orienting to alarms was captured explicitly with the location check boxes in the alarm response form as well as implicitly with the selection of a specific abnormal condition checkbox. Each operator’s orienting responses were scored by assessing whether the location or the condition check box response was consistent with the participant’s post-session knowledge assessment response. The overall orienting score was calculated as a weighted composite score of hits (+3), misses (-3), and false positives (-1). Prior to computing the sum, the hits, misses and false positives were multiplied by a weight assigned to the
Addressing Alarm Floods: Operator Interface Considerations
Distributed with permission of author(s) by ISA 2011 Presented at ISA Automation Week; http://www.isa.org
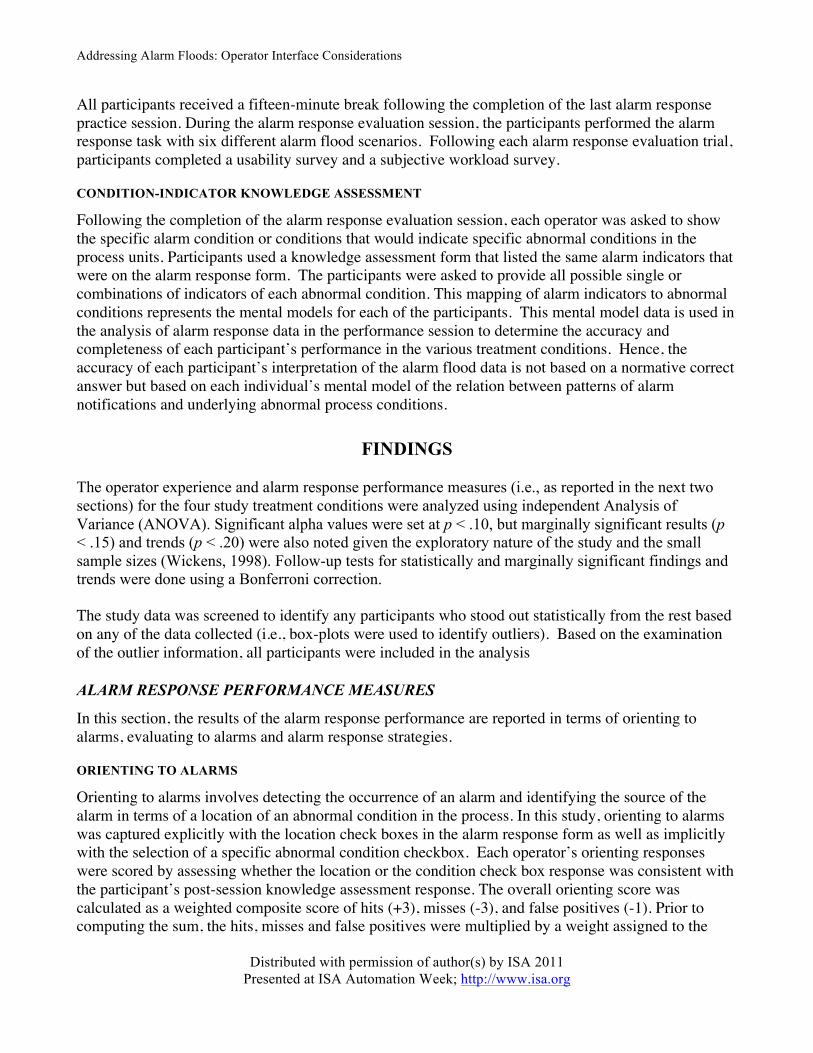
priority of the leading alarm indicator for the problem scenario such that “high” = 3, “medium” = 2, and low priority = “1”. The rationale for the weighting priority level was based on the fact that consequences of not responding are greater the higher the alarm priority. Table 3 shows the findings on the Orienting response score comparisons. Orienting alarm response scores were higher under Throttling (TH) compared to the Baseline (Base) condition. The main effects of Display were not significant, although less Misses and False Positives were associated with the Equipment Area Display relative to the Alarm Trend Display.
Table 3 Summary of Orienting dependent variable main effects for each comparison of interest.
Measurement Baseline (Base)
vs. Throttling (TH)
Equip Area (EA) vs.
Alarm Trend (AT)
Alarm Trend (AT) vs.
Industry Typical (IT)
Equip Area (EA) vs.
Industry Typical (IT)
Overall Orienting Score Base < TH EA = AT AT = IT EA = IT # of Correct Base < TH EA = AT AT = IT EA = IT # of Misses Base > TH EA < AT AT = IT EA = IT
# of False Positives Base = TH EA < AT AT = IT EA = IT
Note: Red and bold = statistically significant (p < .10); Blue and underlined = marginally significant (p < .15); Green and italicized = trend (p < .20); Black = no significant difference; Grey box = direction is consistent with our expectations.
EVALUATING ALARMS
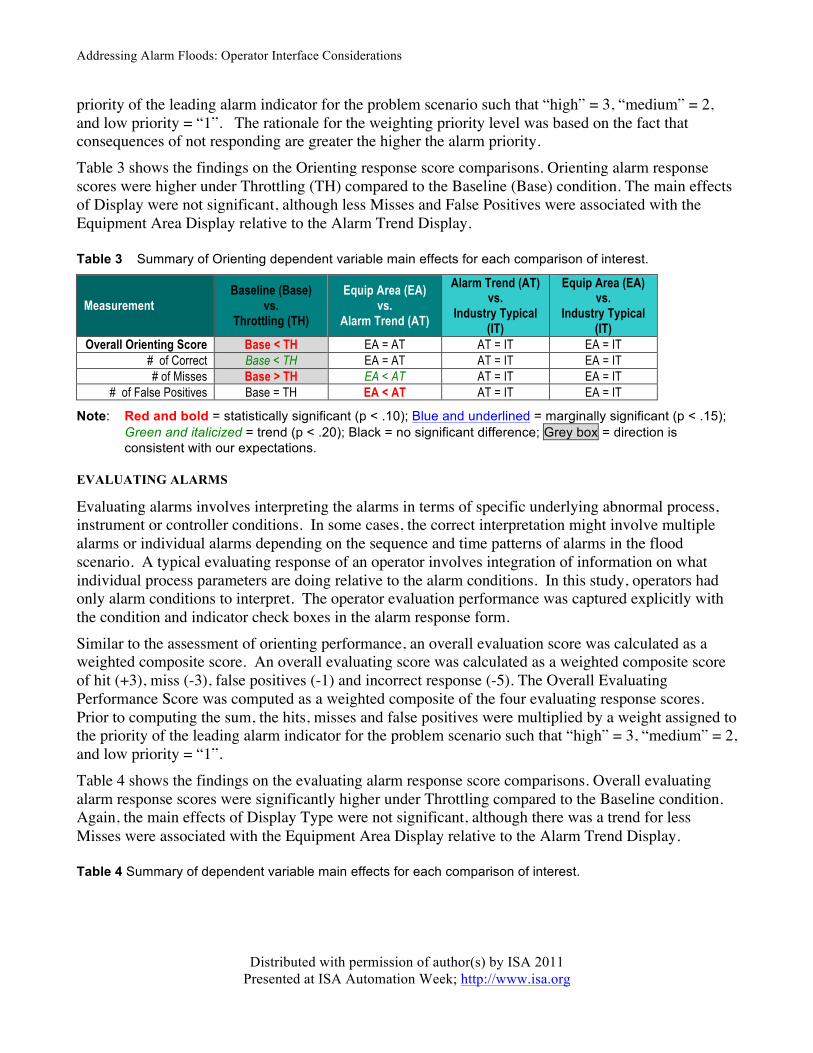
Evaluating alarms involves interpreting the alarms in terms of specific underlying abnormal process, instrument or controller conditions. In some cases, the correct interpretation might involve multiple alarms or individual alarms depending on the sequence and time patterns of alarms in the flood scenario. A typical evaluating response of an operator involves integration of information on what individual process parameters are doing relative to the alarm conditions. In this study, operators had only alarm conditions to interpret. The operator evaluation performance was captured explicitly with the condition and indicator check boxes in the alarm response form. Similar to the assessment of orienting performance, an overall evaluation score was calculated as a weighted composite score. An overall evaluating score was calculated as a weighted composite score of hit (+3), miss (-3), false positives (-1) and incorrect response (-5). The Overall Evaluating Performance Score was computed as a weighted composite of the four evaluating response scores. Prior to computing the sum, the hits, misses and false positives were multiplied by a weight assigned to the priority of the leading alarm indicator for the problem scenario such that “high” = 3, “medium” = 2, and low priority = “1”. Table 4 shows the findings on the evaluating alarm response score comparisons. Overall evaluating alarm response scores were significantly higher under Throttling compared to the Baseline condition. Again, the main effects of Display Type were not significant, although there was a trend for less Misses were associated with the Equipment Area Display relative to the Alarm Trend Display.
Table 4 Summary of dependent variable main effects for each comparison of interest.
Addressing Alarm Floods: Operator Interface Considerations
Distributed with permission of author(s) by ISA 2011 Presented at ISA Automation Week; http://www.isa.org
Measurement Baseline (Base)
vs. Throttling (TH)
Equip Area (EA) vs.
Alarm Trend (AT)
Alarm Trend (AT) vs.
Industry Typical (IT)
Equip Area (EA) vs.
Industry Typical (IT)
Overall Evaluating Score Base < TH EA = AT AT = IT EA = IT # of Correct Base < TH EA = AT AT = IT EA = IT
# of Incorrect Base > TH EA = AT AT = IT EA = IT # of Misses Base > TH EA < AT AT = IT EA = IT
# of False Positives Base = TH EA = AT AT = IT EA = IT
Note: Red and bold = statistically significant (p < .10); Blue and underlined = marginally significant (p < .15); Green and italicized = trend (p < .20); Black = no significant difference; Grey box = direction is consistent with our expectations.
ALARM RESPONSE STRATEGIES
Alarm Response strategies were calculated from the recorded number of actions taken by an operator in a given alarm scenario. Based on the project team’s assessment of the effectiveness of the interface, along with observations of the operators interacting with the different alarm summary displays, the project team determined a “best” strategy of:
• Using the summary view to determine what equipment area required attention, selecting just that area for viewing in the alarm list, and then evaluating the pattern of alarms in that area.
• Then completing the alarm response task in the Access database form, returning to the alarm list, and acknowledging all alarms showing (as opposed to acknowledging individual alarms).
Less effective strategies were characterized by:
• Not focusing the alarm list by equipment area and by acknowledging all alarms showing in the alarm list while all units were shown, or
• Not focusing the alarm list by equipment area and only acknowledging single alarms
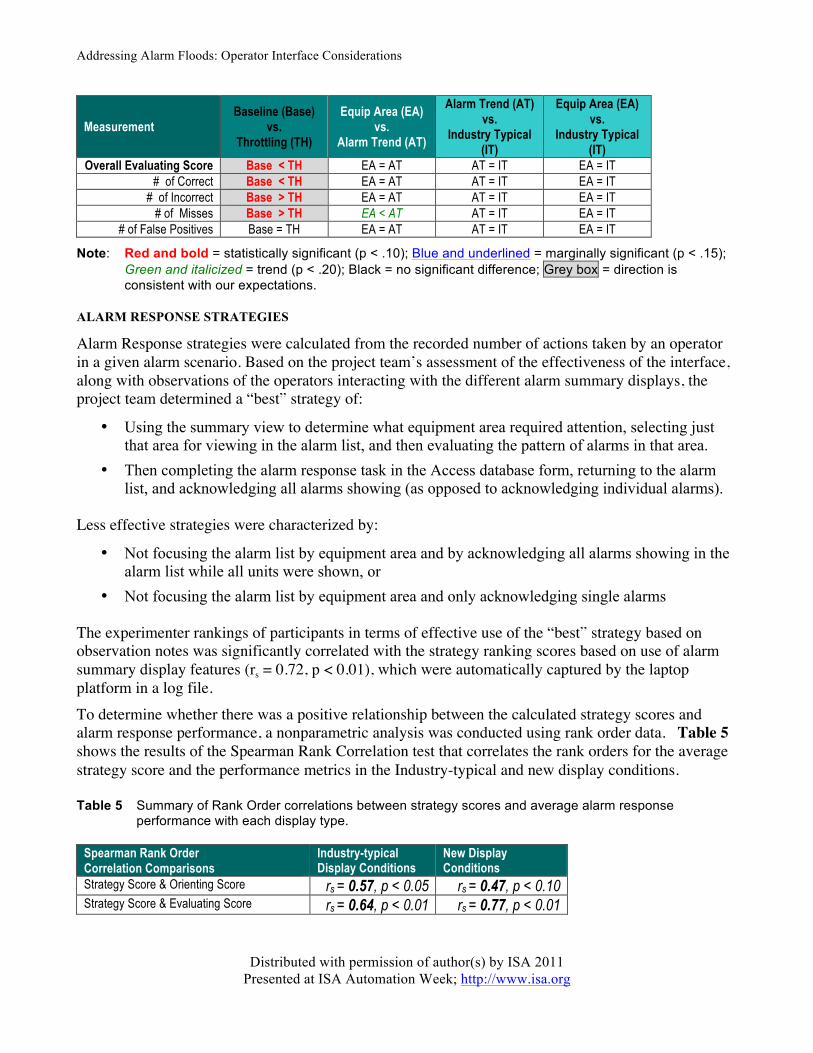
The experimenter rankings of participants in terms of effective use of the “best” strategy based on observation notes was significantly correlated with the strategy ranking scores based on use of alarm summary display features (rs = 0.72, p < 0.01), which were automatically captured by the laptop platform in a log file. To determine whether there was a positive relationship between the calculated strategy scores and alarm response performance, a nonparametric analysis was conducted using rank order data. Table 5 shows the results of the Spearman Rank Correlation test that correlates the rank orders for the average strategy score and the performance metrics in the Industry-typical and new display conditions.
Table 5 Summary of Rank Order correlations between strategy scores and average alarm response performance with each display type.
Spearman Rank Order Correlation Comparisons
Industry-typical Display Conditions
New Display Conditions
Strategy Score & Orienting Score rs = 0.57, p < 0.05 rs = 0.47, p < 0.10 Strategy Score & Evaluating Score rs = 0.64, p < 0.01 rs = 0.77, p < 0.01
Addressing Alarm Floods: Operator Interface Considerations
Distributed with permission of author(s) by ISA 2011 Presented at ISA Automation Week; http://www.isa.org
Specifically, a significantly higher ranking on calculated strategy score was associated with a higher ranking on both orienting and evaluating response scores for all display types. Consistent with the analysis of alarm response and display types, there does not appear to be a display type effect. In addition, operators with a higher (i.e., better) ranking on calculated strategy score tended to also have a higher ranking in years of experience in console operations (rs = 0.47, p < 0.10). This finding indicates that the more experienced operators tended to make more effective use of the “best” alarm response strategy than the less experienced operators.
SUBJECTIVE WORKLOAD MEASURE
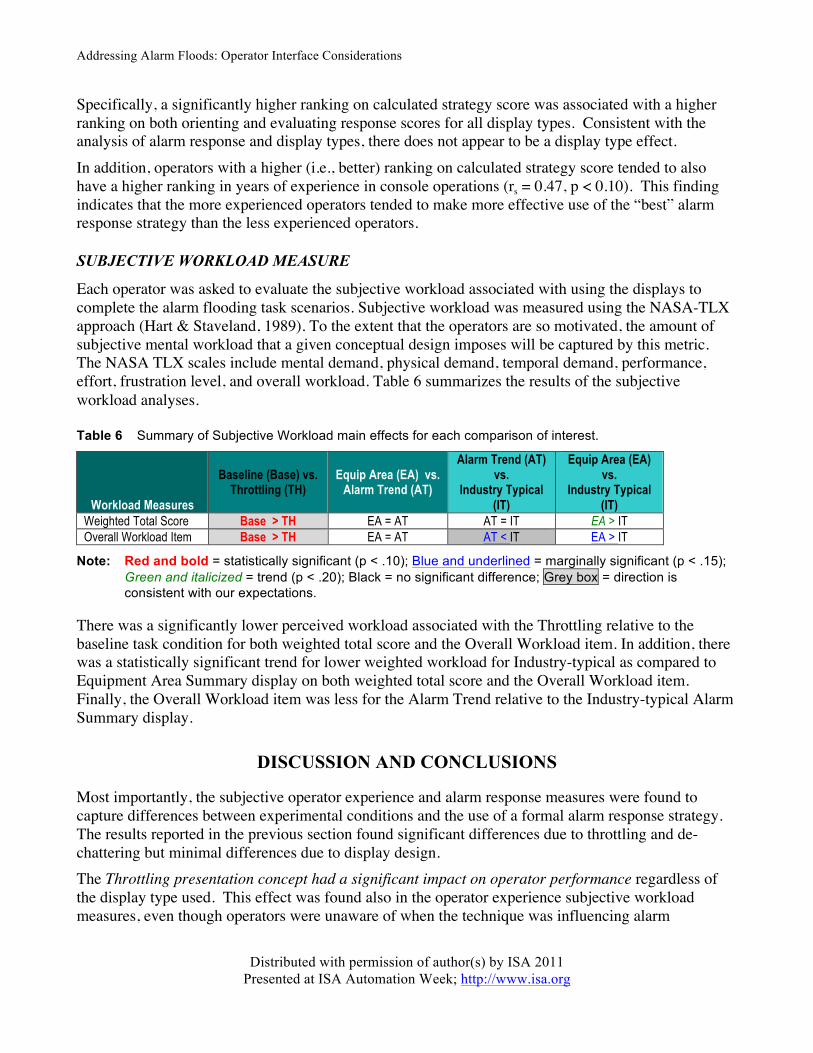
Each operator was asked to evaluate the subjective workload associated with using the displays to complete the alarm flooding task scenarios. Subjective workload was measured using the NASA-TLX approach (Hart & Staveland, 1989). To the extent that the operators are so motivated, the amount of subjective mental workload that a given conceptual design imposes will be captured by this metric. The NASA TLX scales include mental demand, physical demand, temporal demand, performance, effort, frustration level, and overall workload. Table 6 summarizes the results of the subjective workload analyses.
Table 6 Summary of Subjective Workload main effects for each comparison of interest.
Workload Measures
Baseline (Base) vs. Throttling (TH)
Equip Area (EA) vs. Alarm Trend (AT)
Alarm Trend (AT) vs.
Industry Typical (IT)
Equip Area (EA) vs.
Industry Typical (IT)
Weighted Total Score Base > TH EA = AT AT = IT EA > IT Overall Workload Item Base > TH EA = AT AT < IT EA > IT
Note: Red and bold = statistically significant (p < .10); Blue and underlined = marginally significant (p < .15); Green and italicized = trend (p < .20); Black = no significant difference; Grey box = direction is consistent with our expectations.
There was a significantly lower perceived workload associated with the Throttling relative to the baseline task condition for both weighted total score and the Overall Workload item. In addition, there was a statistically significant trend for lower weighted workload for Industry-typical as compared to Equipment Area Summary display on both weighted total score and the Overall Workload item. Finally, the Overall Workload item was less for the Alarm Trend relative to the Industry-typical Alarm Summary display.
DISCUSSION AND CONCLUSIONS
Most importantly, the subjective operator experience and alarm response measures were found to capture differences between experimental conditions and the use of a formal alarm response strategy. The results reported in the previous section found significant differences due to throttling and de-chattering but minimal differences due to display design. The Throttling presentation concept had a significant impact on operator performance regardless of the display type used. This effect was found also in the operator experience subjective workload measures, even though operators were unaware of when the technique was influencing alarm
Addressing Alarm Floods: Operator Interface Considerations
Distributed with permission of author(s) by ISA 2011 Presented at ISA Automation Week; http://www.isa.org
presentation rates. Consequently, this logical processing technique shows the potential for improving the ability of operators to respond to alarm flood conditions independent of alarm display techniques. The effectiveness of a particular display design can be influenced by the alarm response strategy used when interacting with that display. The project team did observe both effective and ineffective strategies for all three alarm summary display designs. Most importantly, all three display designs provided features that enabled operators to strategically focus the contents of the detailed list view on a specific equipment area of interest to reduce the number of alarms in view. The “best” strategy was effective because it allowed the operators to see patterns in the alarms associated with an equipment area that were not readily perceptible when distributed within the list of all alarms. The effective response to alarm flood conditions may depend on effective operator training. Another observation from the study was that, despite the project team purposefully training each operator on the “best”, effective strategy of using the summary view to focus what equipment area was in the alarm list, many operators reverted back to the strategy they brought to the study, based on how they interact with the existing DCS alarm summary display (similar to the Industry-typical display used in the study). The consequence of this very common behavior was that each of the three display conditions was effectively reduced to a single alarm list, with no summary information being used. The training session did not include feedback on performance. Hence, some operators perceived that they actually performed better when they did not use the “best” alarm response strategy. In fact, there was sometimes a mistaken perception that they were performing better because they were aware of fewer alarms, i.e., they were not aware of what they were not responding to. Training that includes feedback on performance has a better chance of establishing the value of using the effective alarm response strategy. The lack of a consistent performance advantage of the new display concepts, Alarm Trend Summary and Equipment Area Summary, relative to the existing Industry-typical Alarm Summary was an unexpected finding. Although, operators reported post experiment a preference for the new Alarm Trend display, the alarm response measures did not show any performance advantage. The lack of discovery of a benefit to the new display concepts might be explained by the fact that operators had very little time with any of the new displays in terms of familiarity with their features, relative to their day-to-day use of their DCS alarm summary display that was similar to the Industry-typical display. During the familiarity practice sessions, all of the operators were coached on using the features as well as using an alarm response strategy to focus on equipment areas and look for patterns in the alarms. However, most of these operators tended to focus on the Detailed List during the alarm response performance sessions in handling the alarms. Consequently, the operators were predominately using the common design element across all three displays in this session. Hence, the finding of no difference between displays makes sense and, in future, more emphasis needs to be placed on the training of effective alarm summary display usage strategies. A second design factor that was also influenced potentially by familiarity with the new display concepts was the use of tag descriptors with the alarm indicators in the Overview panels in the new display types. The tag descriptions in the Overviews were not effective because operators did not have new tagnames memorized. The site had recently revised the tagname descriptors as part of an alarm rationalization program. Consequently, the design using tagnames, e.g., TT1814 or PT1960, forced operators to look in Detailed List to know what the alarm was indicating. It may have been more effective to use short descriptors instead such as “RawGasTemp” or “HeadPress.”
Addressing Alarm Floods: Operator Interface Considerations
Distributed with permission of author(s) by ISA 2011 Presented at ISA Automation Week; http://www.isa.org
In conclusion, the study revealed some promising findings on alarm presentation techniques that can enable operators to better manage plant upset situations that result in alarm floods. Past research has revealed significant usability issues with the traditional presentation in list format. First and foremost, the use of a logical alarm throttling and de-chattering processing technique to modulate the presentation rate of alarms in the alarm display improved operator performance with the traditional a list-based display. Second, the results showed that console operator performance improved with the use of all alarm presentation techniques in combination with the use of an effective alarm response strategy. Specifically, the study demonstrates that operator performance under alarm flood conditions can be improved if the operator interface enables the operator to strategically view subsets of the alarms associated with specific equipment areas rather than a list containing all of the alarms. Future research examining the impact of potential enhancements to the new display concepts may provide additional insight on how to resolve this significant challenge in the process industries.
REFERENCES
Andow, P., Cade, J., Clark, R., and Foslien, W. (2007). Alarm flood analysis report. ASM Consortium Internal Technical Report, Version 1.14.
Bransby, M. (2001). Design of alarm systems. In J. Noyes and M Bransby (Eds.), People in control: Human factors in control room design (pp. 207-222). London: IEE.
Bristol, E.H. (2001). Improved process control alarm operation. ISA Transactions, 40, pp. 191-205. Brown, W., O’Hara, J. and Higgins, J. (2000). Advanced Alarm Systems: Guidance Development and
Technical Basis (NUREG/C$-6684). Washington, D.C.:U.S. Nuclear Regulatory Commission. Bullemer, P. and Metzger, D. (2008). CCPS Process Safety Metrics Review: Considerations from an
ASM perspective. ASM Consortium White Paper. Minneapolis, MN: ASM Consortium. Bullemer, P.T., and Reising, D.C. (2008). Improve operator situation awareness with effective design
of overview displays. Proceedings of the 2008 NPRA Annual Meeting, San Diego, CA. Engineering Equipment and Materials Users Association. (1999). Alarm systems: A guide to design,
management and procurement. EEMUA Publication No. 191. Errington, J., Reising, D. and Burns, C. (2009). Effective Alarm Management Practices. Minneapolis,
MN: Abnormal Situation Management Consortium Books. Gordon, P. & Anderson, T. (2004). Alarm Presentation System (APS) at Ringhals nuclear power plant
unit 2. American Nuclear Society 4th International Topical Meeting on Nuclear Plant Instrumentation, Control and Human Machine Interface Technology, 311-321.
Hart, S.G. and Staveland, L.E. (1989). Development of a multi-dimensional workload rating scale: Results of empirical and theoretical research. In P. A. Hancock and N. Meshkati (Eds.), Human mental workload. Amsterdam: North Holland.
Health & Safety Executive (1997). The explosion and fires at the Texaco Refinery, Milford Haven, 24 July 1994. HSE Books.
Kvalem, J., Haugset, K., & Øwre, F. (2005). The simulator-based Halden Man-Machine Laboratory (HAMMLAB) and its applications in human factor studies. White paper. OECD Halden Reactor
Addressing Alarm Floods: Operator Interface Considerations
Distributed with permission of author(s) by ISA 2011 Presented at ISA Automation Week; http://www.isa.org
Project, Institute for Energy Technology, Norway. Dowloaded March 2007 from www.ife.no/laboratories/hammlab/files/hammlabpaper/Attachment/at_download.
Mattiasson, C. (1999). The alarm system from the operator's perspective. In Proceedings of International Conference on People in Control (Human Interfaces in Control Rooms, Cockpits and Command Centres). 21-23 June 1999; Bath, UK
Reising, D.V., Downs, J. L., and Bayn, D. (2004). Human performance models for response to alarm notifications in the process industries: an industrial case study. Proceedings of the Human Factors and Ergonomics Society 48th Annual Meeting, pp. 1189-1193. Santa Monica, CA: HFES.
Reising, D.V., and Montgomery, T. (2005). Achieving effective alarm system performance: Results of ASM Consortium benchmarking against EEMUA Publication No. 191 Guidelines. Paper in the Proceedings of the AIChE 20th Annual CCPS International Conference, Atlanta, GA, April 11-13.
Rubinstein, E. and Mason, J.F., (1979). The accident that shouldn’t have happened: An analysis of Three Mile Island. IEE Spectrum, 16, 32-42.
Tuszynski, J., Larsson, J. E., Nihlwing, C., Öhman, B., & Calzada, A. (2002). A Pilot project on alarm reduction and presentation based on Multilevel Flow Models. In Proceedings of the Enlarged Halden Programme Group Meeting, HPR-358, Storefjell, Gol, Norway.
Wickens, C.D. (1998). Common sense statistics. Ergonomics in Design, pp. 18-22. Zwaga, H. J. G., & Hoonhout, H. C. M., (1994). Supervisory control behaviour and the implementation
of alarms in process control. In N. A. Stanton (Ed.), Human factors in alarm design (pp. 119-134). London: Taylor & Francis.