Embed Size (px)
Citation preview
Y i e l d
G r o w t h
Q u a l i t y
…Steady Wins®
To r t o i s e E n e rg y C a p i t a l C o r p .
SM
Tortoise Power and Energy Infrastructure Fund, Inc.
SM
2012 2nd Quarter Report
May 31, 2012
Tortoise Power and Energy Infrastructure Fund, Inc. 2012 2nd Quarter Reportb 1
Total Assets(dollars in millions)
Common Distributions(in dollars)
Closing Stock Price(in dollars)
0
222
0.000000
25.869999
0.000
0.375
24.4
1
24.1
8
25.8
7
24.0
2215
222
214
204
0.3
75
0.3
75
0.3
75
0.3
75
Q2Q1
2011
Q4Q3
2012
Q2Q1
2011
Q4Q3
2012
Q2Q1
2011
Q4Q3
2012
C o m p a n y a t a G l a n C e
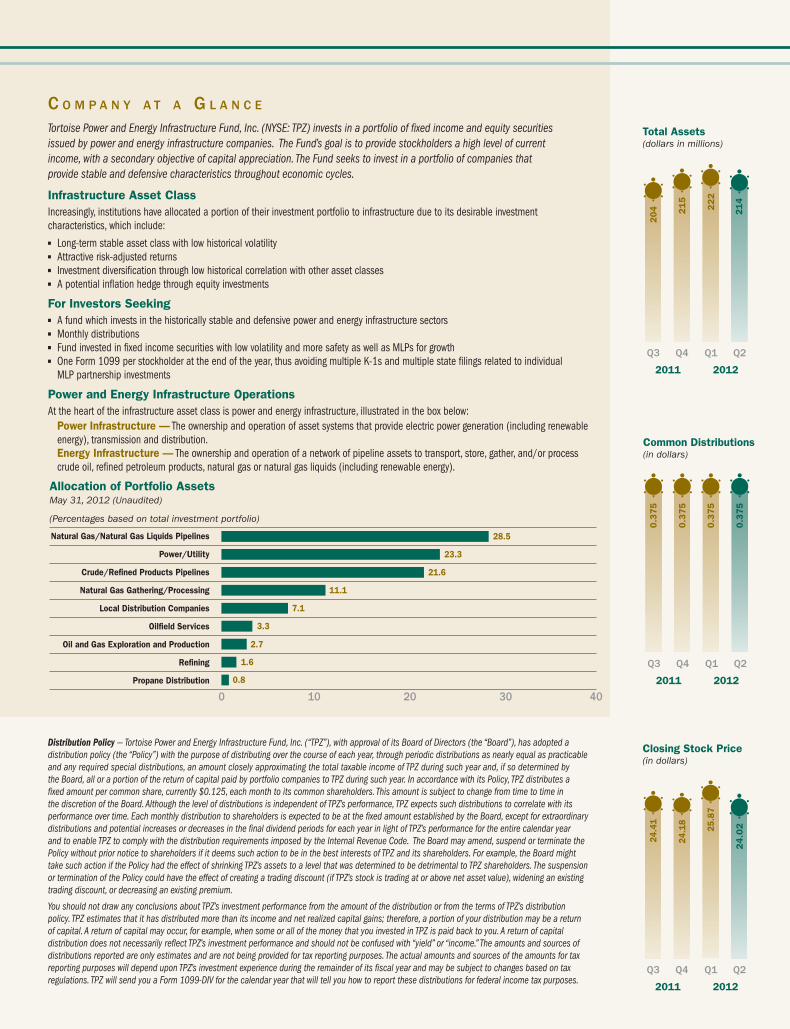
Tortoise Power and Energy Infrastructure Fund, Inc. (NYSE: TPZ) invests in a portfolio of fixed income and equity securities issued by power and energy infrastructure companies. The Fund’s goal is to provide stockholders a high level of current income, with a secondary objective of capital appreciation. The Fund seeks to invest in a portfolio of companies that provide stable and defensive characteristics throughout economic cycles.
Total Assets(dollars in millions)
Common Distributions(in dollars)
Closing Stock Price(in dollars)
0
222
0.000000
25.869999
0.000
0.375
24.4
1
24.1
8
25.8
7
24.0
2215
222
214
204
0.3
75
0.3
75
0.3
75
0.3
75
Q2Q1
2011
Q4Q3
2012
Q2Q1
2011
Q4Q3
2012
Q2Q1
2011
Q4Q3
2012
Total Assets(dollars in millions)
Common Distributions(in dollars)
Closing Stock Price(in dollars)
0
222
0.000000
25.869999
0.000
0.375
24.4
1
24.1
8
25.8
7
24.0
2215
222
214
204
0.3
75
0.3
75
0.3
75
0.3
75
Q2Q1
2011
Q4Q3
2012
Q2Q1
2011
Q4Q3
2012
Q2Q1
2011
Q4Q3
2012
Infrastructure Asset ClassIncreasingly, institutions have allocated a portion of their investment portfolio to infrastructure due to its desirable investment characteristics, which include:n Long-term stable asset class with low historical volatilityn Attractive risk-adjusted returnsn Investment diversification through low historical correlation with other asset classesn A potential inflation hedge through equity investments
For Investors Seekingn A fund which invests in the historically stable and defensive power and energy infrastructure sectorsn Monthly distributionsn Fund invested in fixed income securities with low volatility and more safety as well as MLPs for growthn One Form 1099 per stockholder at the end of the year, thus avoiding multiple K-1s and multiple state filings related to individual
MLP partnership investments
Power and Energy Infrastructure OperationsAt the heart of the infrastructure asset class is power and energy infrastructure, illustrated in the box below:
Power Infrastructure — The ownership and operation of asset systems that provide electric power generation (including renewable energy), transmission and distribution.Energy Infrastructure — The ownership and operation of a network of pipeline assets to transport, store, gather, and/or process crude oil, refined petroleum products, natural gas or natural gas liquids (including renewable energy).
Distribution Policy — Tortoise Power and Energy Infrastructure Fund, Inc. (‘‘TPZ”), with approval of its Board of Directors (the “Board”), has adopted a distribution policy (the “Policy”) with the purpose of distributing over the course of each year, through periodic distributions as nearly equal as practicable and any required special distributions, an amount closely approximating the total taxable income of TPZ during such year and, if so determined by the Board, all or a portion of the return of capital paid by portfolio companies to TPZ during such year. In accordance with its Policy, TPZ distributes a fixed amount per common share, currently $0.125, each month to its common shareholders. This amount is subject to change from time to time in the discretion of the Board. Although the level of distributions is independent of TPZ’s performance, TPZ expects such distributions to correlate with its performance over time. Each monthly distribution to shareholders is expected to be at the fixed amount established by the Board, except for extraordinary distributions and potential increases or decreases in the final dividend periods for each year in light of TPZ’s performance for the entire calendar year and to enable TPZ to comply with the distribution requirements imposed by the Internal Revenue Code. The Board may amend, suspend or terminate the Policy without prior notice to shareholders if it deems such action to be in the best interests of TPZ and its shareholders. For example, the Board might take such action if the Policy had the effect of shrinking TPZ’s assets to a level that was determined to be detrimental to TPZ shareholders. The suspension or termination of the Policy could have the effect of creating a trading discount (if TPZ’s stock is trading at or above net asset value), widening an existing trading discount, or decreasing an existing premium.
You should not draw any conclusions about TPZ’s investment performance from the amount of the distribution or from the terms of TPZ’s distribution policy. TPZ estimates that it has distributed more than its income and net realized capital gains; therefore, a portion of your distribution may be a return of capital. A return of capital may occur, for example, when some or all of the money that you invested in TPZ is paid back to you. A return of capital distribution does not necessarily reflect TPZ’s investment performance and should not be confused with “yield” or “income.” The amounts and sources of distributions reported are only estimates and are not being provided for tax reporting purposes. The actual amounts and sources of the amounts for tax reporting purposes will depend upon TPZ’s investment experience during the remainder of its fiscal year and may be subject to changes based on tax regulations. TPZ will send you a Form 1099-DIV for the calendar year that will tell you how to report these distributions for federal income tax purposes.
0 10 20 30 40
Allocation of Portfolio AssetsMay 31, 2012 (Unaudited)
(Percentages based on total investment portfolio)
Natural Gas/Natural Gas Liquids Pipelines
Power/Utility
Crude/Refined Products Pipelines
Natural Gas Gathering/Processing
Local Distribution Companies
Oilfield Services
Oil and Gas Exploration and Production
Refining
Propane Distribution
28.5
23.3
21.6
11.1
7.1
3.3
2.7
1.6
0.8

Tortoise Power and Energy Infrastructure Fund, Inc. 2012 2nd Quarter Reportb 1
Global uncertainty dominated the last month of our second fiscal quarter ended May 31, 2012, with European turmoil taking center stage. This uncertainty did not discriminate between high quality and low quality equities. Despite the general equity market volatility, fixed income markets did not move in tandem as Treasury yields remained low and other credit securities strengthened modestly.
Power & Energy Infrastructure Sector Review and OutlookThe TPZ Benchmark Index*, posted a total return of negative 1.7 percent and positive 4.4 percent for the three months and six months ended May 31, 2012, respectively. Fixed income performance was positive, offset by declines in MLP equities.
Power and energy companies remain steady, fundamental performers and we expect them to benefit from our expectation of increased natural demand usage over the long-term. It is noteworthy that in April, for the first time ever, U.S. power plants produced the same amount of electricity from both natural gas and coal, with each accounting for approximately 32 percent of net electricity generation. This achievement resulted from the relatively low cost of natural gas, as power companies are finding it economic to switch from coal-fired generation to natural gas. We expect utilities to continue to benefit from low fuel costs for the foreseeable future.
The North American energy landscape continues to grow, with over $4.3 trillion of expected investment in production between now and 2035, with approximately $120 billion anticipated in 2012 alone. This will not only lead to greater domestic energy self-sufficiency, but we expect significant pipeline infrastructure will be needed to support the construction associated with this increased hydrocarbon production.
Fund Performance ReviewOur total assets decreased from $222.0 million on Feb. 29, 2012, to $213.9 million as of the second fiscal quarter end, resulting primarily from market declines in the value of our investments. Our market-based total return was negative 5.7 percent and positive 2.3 percent (including the reinvestment of distributions) for the three months and six months ended May 31, 2012, respectively.
During the fiscal quarter, we paid monthly distributions of $0.125 per share ($1.50 annualized). These distributions represented an annualized yield of 6.2 percent based on our fiscal quarter closing price of $24.02. For tax purposes, we currently expect 80 to 100 percent of TPZ’s 2012 distributions will be characterized as ordinary income and capital gain, with the remainder being return of capital. A final determination of the characterization will be made in January 2013. Please refer to the inside front cover of this report for important information about TPZ’s distribution policy.
We ended the second fiscal quarter with leverage at 16.4 percent of total assets, which had a weighted average maturity of 2.1 years, a weighted average cost of 3.3 percent, and over 74 percent at fixed rates.
Additional information about our financial performance is available in the Key Financial Data and Management’s Discussion of this report.
ConclusionWe will continue to monitor the impact of the macroeconomic environment, but believe power and energy assets, critical to our energy needs, are attractive to investors in both expansionary and more uncertain environments.
Sincerely,
The Managing DirectorsTortoise Capital Advisors, L.L.C.The adviser to Tortoise Power and Energy Infrastructure Fund, Inc.
H. Kevin Birzer Zachary A. Hamel Kenneth P. Malvey
Terry Matlack David J. Schulte
*TPZ Benchmark Index includes the BofA Merrill Lynch US Energy Index (CIEN), the BofA Merrill Lynch US Electric Utility Index (CUEL) and the Tortoise MLP Total Return Index® (TMLPT).
June 15, 2012
D e a r F e l l o w S t o C k h o l D e r S,
(Unaudited)
Tortoise Power and Energy Infrastructure Fund, Inc.2
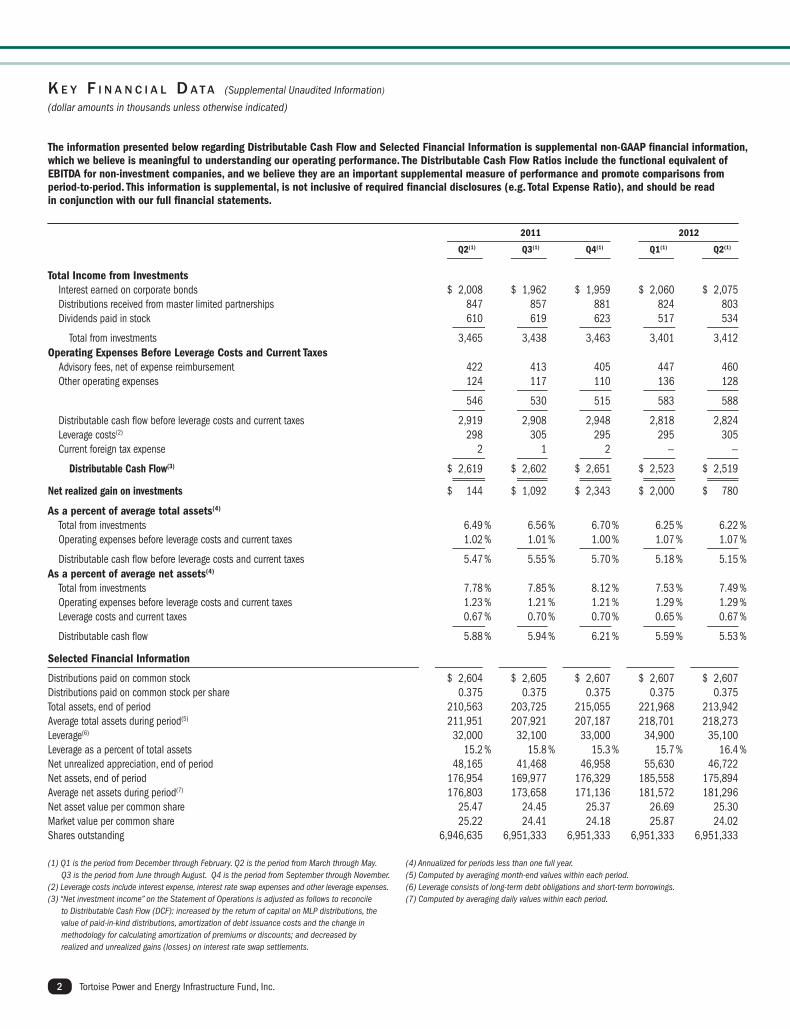
(1) Q1 is the period from December through February. Q2 is the period from March through May. Q3 is the period from June through August. Q4 is the period from September through November.
(2) Leverage costs include interest expense, interest rate swap expenses and other leverage expenses.(3) “Net investment income” on the Statement of Operations is adjusted as follows to reconcile
to Distributable Cash Flow (DCF): increased by the return of capital on MLP distributions, the value of paid-in-kind distributions, amortization of debt issuance costs and the change in methodology for calculating amortization of premiums or discounts; and decreased by realized and unrealized gains (losses) on interest rate swap settlements.
(4) Annualized for periods less than one full year. (5) Computed by averaging month-end values within each period.(6) Leverage consists of long-term debt obligations and short-term borrowings.(7) Computed by averaging daily values within each period.
k e y F i n a n C i a l D a t a (Supplemental Unaudited Information)
(dollar amounts in thousands unless otherwise indicated)
The information presented below regarding Distributable Cash Flow and Selected Financial Information is supplemental non-GAAP financial information, which we believe is meaningful to understanding our operating performance. The Distributable Cash Flow Ratios include the functional equivalent of EBITDA for non-investment companies, and we believe they are an important supplemental measure of performance and promote comparisons from period-to-period. This information is supplemental, is not inclusive of required financial disclosures (e.g. Total Expense Ratio), and should be read in conjunction with our full financial statements.
Total Income from Investments Interest earned on corporate bonds $ 2,008 $ 1,962 $ 1,959 $ 2,060 $ 2,075 Distributions received from master limited partnerships 847 857 881 824 803 Dividends paid in stock 610 619 623 517 534
Total from investments 3,465 3,438 3,463 3,401 3,412Operating Expenses Before Leverage Costs and Current Taxes Advisory fees, net of expense reimbursement 422 413 405 447 460 Other operating expenses 124 117 110 136 128
546 530 515 583 588
Distributable cash flow before leverage costs and current taxes 2,919 2,908 2,948 2,818 2,824 Leverage costs(2) 298 305 295 295 305 Current foreign tax expense 2 1 2 — —
Distributable Cash Flow(3) $ 2,619 $ 2,602 $ 2,651 $ 2,523 $ 2,519
Net realized gain on investments $ 144 $ 1,092 $ 2,343 $ 2,000 $ 780
As a percent of average total assets(4)
Total from investments 6.49 % 6.56 % 6.70 % 6.25 % 6.22 % Operating expenses before leverage costs and current taxes 1.02 % 1.01 % 1.00 % 1.07 % 1.07 %
Distributable cash flow before leverage costs and current taxes 5.47 % 5.55 % 5.70 % 5.18 % 5.15 %As a percent of average net assets(4)
Total from investments 7.78 % 7.85 % 8.12 % 7.53 % 7.49 % Operating expenses before leverage costs and current taxes 1.23 % 1.21 % 1.21 % 1.29 % 1.29 % Leverage costs and current taxes 0.67 % 0.70 % 0.70 % 0.65 % 0.67 %
Distributable cash flow 5.88 % 5.94 % 6.21 % 5.59 % 5.53 %
Selected Financial Information
Distributions paid on common stock $ 2,604 $ 2,605 $ 2,607 $ 2,607 $ 2,607Distributions paid on common stock per share 0.375 0.375 0.375 0.375 0.375Total assets, end of period 210,563 203,725 215,055 221,968 213,942Average total assets during period(5) 211,951 207,921 207,187 218,701 218,273Leverage(6) 32,000 32,100 33,000 34,900 35,100Leverage as a percent of total assets 15.2 % 15.8 % 15.3 % 15.7 % 16.4 %Net unrealized appreciation, end of period 48,165 41,468 46,958 55,630 46,722Net assets, end of period 176,954 169,977 176,329 185,558 175,894Average net assets during period(7) 176,803 173,658 171,136 181,572 181,296Net asset value per common share 25.47 24.45 25.37 26.69 25.30Market value per common share 25.22 24.41 24.18 25.87 24.02Shares outstanding 6,946,635 6,951,333 6,951,333 6,951,333 6,951,333
2011 2012
Q2(1) Q3(1) Q4(1) Q1(1) Q2(1)
2012 2nd Quarter Report 3
stockholders in the last quarter of the fiscal year in order to avoid being subject to U.S. federal income taxes. Our Board of Directors reviews the distribution rate quarterly, and may adjust the monthly distributions throughout the year. Our distribution policy is described on the inside front cover of this report.
Determining DCFDCF is income from investments less expenses. Income from investments includes the accrued interest from corporate bonds, cash distributions and paid-in-kind distributions from MLPs and related companies and dividends earned from short-term investments. The total expenses include current or anticipated operating expenses and leverage costs.
The Key Financial Data table discloses the calculation of DCF and should be read in conjunction with this discussion. The difference between income from investments in the DCF calculation and total investment income as reported in the Statement of Operations, is reconciled as follows: (1) GAAP recognizes distribution income from MLPs and common stock on their ex-dates, whereas the DCF calculation reflects distribution income on their pay dates; (2) GAAP recognizes that a significant portion of the cash distributions received from MLPs are characterized as a return of capital and therefore excluded from investment income, whereas the DCF calculation includes the return of capital; (3) income from investments in the DCF calculation includes the value of dividends paid-in-kind (additional stock or units), whereas such amounts are not included as income for GAAP purposes; and (4) amortization of premium or discount for all securities is calculated using the yield to worst methodology for GAAP purposes while yield to call is used in calculating amortization for long-dated hybrid securities in the DCF calculation. The treatment of expenses in the DCF calculation also differs from what is reported in the Statement of Operations. In addition to the total operating expenses, including expense reimbursement, as disclosed in the Statement of Operations, the DCF calculation reflects interest expense and realized and unrealized gains (losses) on interest rate swap settlements as leverage costs. A reconciliation of Net Investment Income to DCF is included below.
Income from InvestmentsWe seek to achieve our investment objectives by investing in income-producing fixed income and equity securities of companies that we believe offer attractive distribution rates. We evaluate each holding based upon its contribution to our investment income and its risk relative to other potential investments.
Total income from investments for the 2nd quarter 2012 was approximately $3.4 million, a slight increase as compared to 1st quarter 2012 and decrease as compared to 2nd quarter 2011. These changes reflect increases in per share distribution rates on our MLP investments, the impact of trading activity wherein certain investments with higher current yields and lower expected future growth were sold and replaced with investments that had lower current yields and higher expected future growth, as well as fixed income investments that have been refinanced in a lower interest rate environment.
ExpensesWe incur two types of expenses: (1) operating expenses, consisting primarily of the advisory fee, and (2) leverage costs. On a percentage basis, operating expenses before leverage costs were an annualized 1.07 percent of average total assets for 2nd quarter 2012 as compared to 1.07 percent for the 1st quarter 2012 and 1.02 percent for 2nd quarter 2011. Advisory fees for 2nd quarter 2012 increased 2.9 percent from 1st quarter 2012 as a result of slightly lower average managed assets offset by a reduction in the advisory fee waiver. While the contractual advisory fee is 0.95 percent of average monthly managed assets, the Adviser waived an amount equal to 0.15 percent of average monthly managed assets for calendar year 2011 and has agreed to waive
m a n a G e m e n t ’ S D i S C u S S i o n (Unaudited)
The information contained in this section should be read in conjunction with our Financial Statements and the Notes thereto. In addition, this report contains certain forward-looking statements. These statements include the plans and objectives of management for future operations and financial objectives and can be identified by the use of forward-looking terminology such as “may,” “will,” “expect,” “intend,” “anticipate,” “estimate,” or “continue” or the negative thereof or other variations thereon or comparable terminology. These forward-looking statements are subject to the inherent uncertainties in predicting future results and conditions. Certain factors that could cause actual results and conditions to differ materially from those projected in these forward-looking statements are set forth in the “Risk Factors” section of our public filings with the SEC.
OverviewTortoise Power and Energy Infrastructure Fund, Inc.’s (“TPZ”) primary investment objective is to provide a high level of current income, with a secondary objective of capital appreciation. We seek to provide our stockholders a vehicle to invest in a portfolio consisting primarily of securities issued by power and energy infrastructure companies. Power infrastructure operations use asset systems to provide electric power generation (including renewable energy), transmission and distribution. Energy infrastructure operations use a network of pipeline assets to transport, store, gather and/or process crude oil, refined petroleum products (including biodiesel and ethanol), natural gas or natural gas liquids. We believe the power and energy infrastructure sectors provide stable and defensive characteristics throughout economic cycles. A majority of the investments are in fixed income securities with the remainder invested in equities which provide growth potential.
TPZ is a registered non-diversified, closed-end management investment company under the Investment Company Act of 1940, as amended (the “1940 Act”), and expects to qualify each year as a regulated investment company (“RIC”) under the U.S. Internal Revenue Code of 1986, as amended (the “Code”). Tortoise Capital Advisors, L.L.C. (the “Adviser”) serves as investment adviser.
Company UpdateThe combined market values of our debt and MLP investments decreased during the 2nd quarter, contributing to an overall decrease of $8.0 million in total assets. The total income received from our investments increased slightly during the quarter while asset based expenses increased slightly. Leverage was relatively unchanged during the quarter, and our total leverage as a percent of total assets increased. We maintained our monthly distribution of $0.125 per share. Additional information on the results of our operations is discussed in more detail below.
Critical Accounting PoliciesThe financial statements are based on the selection and application of critical accounting policies, which require management to make significant estimates and assumptions. Critical accounting policies are those that are both important to the presentation of our financial condition and results of operations and require management’s most difficult, complex, or subjective judgments. Our critical accounting policies are those applicable to the valuation of investments and certain revenue recognition matters as discussed in Note 2 in the Notes to Financial Statements.
Determining Distributions to StockholdersWe pay monthly distributions based primarily upon our current and estimated future distributable cash flow (“DCF”). In addition, and to the extent that the sum of our net investment company taxable income and net realized gains from investments exceed our monthly distributions, we intend to make an additional distribution to common
Tortoise Power and Energy Infrastructure Fund, Inc.4
change in net realized and unrealized gains on investments (excluding return of capital on distributions) and an increase in receivables of approximately $1.1 million.
Total leverage outstanding at May 31, 2012 of $35.1 million is comprised of $20 million floating rate senior notes and $15.1 million outstanding on our bank credit facility. Through the utilization of our interest rate swaps, we have essentially fixed the rate on approximately 74 percent of our leverage with the remaining 26 percent floating based upon short-term LIBOR. Total leverage represented 16.4 percent of total assets with a weighted average maturity of 1.5 years. Our leverage as a percent of total assets remains below our long-term target level of 20 percent of total assets. This allows the opportunity to add leverage when compelling investment opportunities arise. Temporary increases to up to 25 percent of our total assets may be permitted, provided that such leverage is consistent with the limits set forth in the 1940 Act, and that such leverage is expected to be reduced over time in an orderly fashion to reach our long-term target. Our leverage ratio is impacted by increases or decreases in investment values, issuance of equity and/or the sale of securities where proceeds are used to reduce leverage.
We have used leverage to acquire investments consistent with our investment philosophy. The terms of our leverage are governed by regulatory and contractual asset coverage requirements that arise from the use of leverage. Additional information on our leverage and asset coverage requirements is discussed in Note 9 in the Notes to Financial Statements. Our coverage ratio is updated each week on our Web site at www.tortoiseadvisors.com.
Subsequent to quarter-end, we entered into an amendment to our bank credit facility that extends the facility through June 17, 2013. Terms of the amendment provide for an unsecured revolving credit facility of $19,000,000. During the extension, outstanding balances generally will accrue interest at a variable annual rate equal to one-month LIBOR plus 1.25 percent and unused portions of the credit facility will accrue a non-usage fee equal to an annual rate of 0.20 percent.
Taxation of our DistributionsWe expect that distributions paid on common shares will generally consist of: (i) investment company taxable income (which includes, among other items, taxable interest and the excess of any short-term capital gains over net long-term capital losses); (ii) long-term capital gain (net gain from the sale of a capital asset held longer than 12 months over net short-term capital losses) and (iii) return of capital.
We have received exemptive relief from the SEC to distribute capital gains throughout the year and we may also distribute additional capital gains in the last fiscal quarter if necessary to meet minimum distribution requirements and to avoid being subject to excise taxes. If, however, we elect to retain any capital gains, we will be subject to U.S. capital gains taxes. The payment of those taxes will flow-through to stockholders as a tax credit to apply against their U.S. income tax payable on the deemed distribution of the retained capital gain.
For tax purposes, distributions paid to common stockholders for the calendar year ended December 31, 2011 were approximately 57 percent ordinary income (none of which is qualified dividend income), 34 percent long-term capital gain and 9 percent return of capital. A holder of our common stock would reduce their cost basis for income tax purposes by approximately 9 percent of the total distributions they received in 2011. This information is reported to stockholders on Form 1099-DIV and is available on our Web site at www.tortoiseadvisors.com. We currently estimate that 80 to 100 percent of 2012 distributions will be characterized as ordinary income and capital gain, with the remaining percentage, if any, characterized as return of capital. A final determination of the characterization will be made in January 2013.
0.10 percent of average monthly managed assets for calendar year 2012. Other operating expenses decreased from 1st quarter 2012 primarily due to decreased professional fees.
Leverage costs consist of two major components: (1) the direct interest expense, which will vary from period to period, as our senior notes and revolving credit facility have variable rates of interest, and (2) the realized and unrealized gain or loss on our interest rate swap settlements. Detailed information on our senior notes and revolving credit facility is included in the Liquidity and Capital Resources section below.
As indicated in Note 10 of our Notes to Financial Statements, at May 31, 2012, we had $26 million notional amount of interest rate swap contracts with Wells Fargo Bank in an attempt to reduce a portion of the interest rate risk arising from our leveraged capital structure. TPZ has agreed to pay Wells Fargo Bank a fixed rate while receiving a floating rate based upon the 1-month or 3-month U.S. Dollar London Interbank Offered Rate (“LIBOR”). The spread between the fixed swap rate and LIBOR is reflected in our Statement of Operations as a realized or unrealized gain when LIBOR exceeds the fixed rate (Wells Fargo Bank pays TPZ the net difference) or a realized or unrealized loss when the fixed rate exceeds LIBOR (TPZ pays Wells Fargo Bank the net difference). The interest rate swap contracts have a weighted average fixed rate of 2.18 percent and weighted average remaining maturity of approximately 2.3 years. This swap arrangement effectively fixes the cost of approximately 74 percent of our outstanding leverage over the remaining swap period.
Total leverage costs for DCF purposes were approximately $305,000 for the 2nd quarter 2012, a slight increase as compared to 1st quarter 2012. This includes interest expense on our senior notes and bank credit facility. The weighted average annual rate of our leverage was 3.27 percent at May 31, 2012.
Distributable Cash Flow and Capital Gains For 2nd quarter 2012, our DCF was approximately $2.5 million, a 3.8 percent decrease as compared to 2nd quarter 2011 and relatively unchanged as compared to 1st quarter 2012. This decrease is the net result of the change in distributions and expenses as outlined above. In addition, we had net realized gains of approximately $0.8 million from the sale of portfolio investments in the 2nd quarter 2012. On February 6, 2012, we declared monthly distributions for the 2012 2nd fiscal quarter of $0.125 per share. This is unchanged as compared to 1st quarter 2012.
Net Investment Income on the Statement of Operations is adjusted as follows to reconcile to DCF for 2012 YTD and 2nd quarter 2012 (in thousands): 2012 YTD 2nd Qtr 2012
Net Investment Income $ 2,449 $ 1,180 Adjustments to reconcile to DCF: Dividends paid in stock 1,050 533 Distributions characterized as return of capital 1,624 847 Amortization of debt issuance costs 19 10 Interest rate swap expenses (221 ) (112 ) Change in amortization methodology 121 61
DCF $ 5,042 $ 2,519
Liquidity and Capital ResourcesWe had total assets of $213.9 million at quarter-end. Our total assets reflect the value of our investments, which are itemized in the Schedule of Investments. It also reflects cash, interest and receivables and any expenses that may have been prepaid. During the 2nd quarter 2012, total assets decreased by $8.0 million. This change was primarily the result of a $9.0 million decrease in the value of our investments as reflected by the
m a n a G e m e n t ’ S D i S C u S S i o n (Unaudited)
(Continued)
See accompanying Notes to Financial Statements.
2012 2nd Quarter Report 5
S C h e D u l e o F i n v e S t m e n t S
May 31, 2012
(Unaudited)
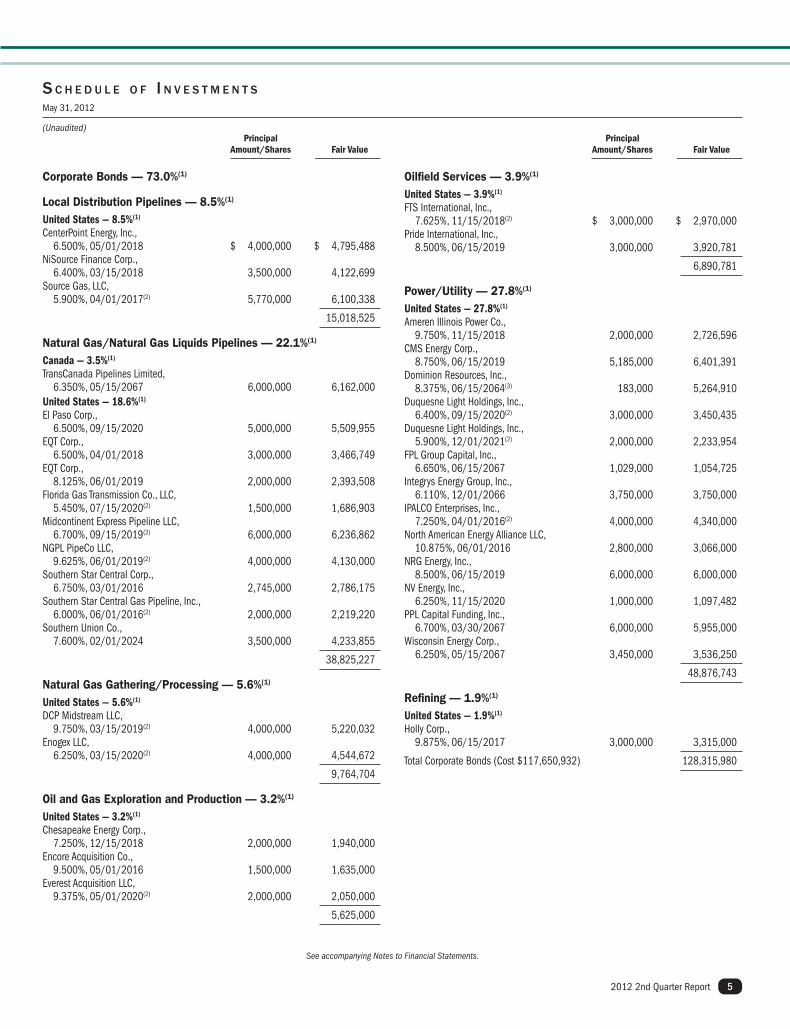
Corporate Bonds — 73.0%(1)
Local Distribution Pipelines — 8.5%(1)
United States — 8.5%(1)
CenterPoint Energy, Inc., 6.500%, 05/01/2018 $ 4,000,000 $ 4,795,488NiSource Finance Corp., 6.400%, 03/15/2018 3,500,000 4,122,699Source Gas, LLC, 5.900%, 04/01/2017(2) 5,770,000 6,100,338
15,018,525
Natural Gas/Natural Gas Liquids Pipelines — 22.1%(1)
Canada — 3.5%(1)
TransCanada Pipelines Limited, 6.350%, 05/15/2067 6,000,000 6,162,000United States — 18.6%(1)
El Paso Corp., 6.500%, 09/15/2020 5,000,000 5,509,955EQT Corp., 6.500%, 04/01/2018 3,000,000 3,466,749EQT Corp., 8.125%, 06/01/2019 2,000,000 2,393,508Florida Gas Transmission Co., LLC, 5.450%, 07/15/2020(2) 1,500,000 1,686,903Midcontinent Express Pipeline LLC, 6.700%, 09/15/2019(2) 6,000,000 6,236,862NGPL PipeCo LLC, 9.625%, 06/01/2019(2) 4,000,000 4,130,000Southern Star Central Corp., 6.750%, 03/01/2016 2,745,000 2,786,175Southern Star Central Gas Pipeline, Inc., 6.000%, 06/01/2016(2) 2,000,000 2,219,220Southern Union Co., 7.600%, 02/01/2024 3,500,000 4,233,855
38,825,227
Natural Gas Gathering/Processing — 5.6%(1)
United States — 5.6%(1)
DCP Midstream LLC, 9.750%, 03/15/2019(2) 4,000,000 5,220,032Enogex LLC, 6.250%, 03/15/2020(2) 4,000,000 4,544,672
9,764,704
Oil and Gas Exploration and Production — 3.2%(1)
United States — 3.2%(1)
Chesapeake Energy Corp., 7.250%, 12/15/2018 2,000,000 1,940,000Encore Acquisition Co., 9.500%, 05/01/2016 1,500,000 1,635,000Everest Acquisition LLC, 9.375%, 05/01/2020(2) 2,000,000 2,050,000
5,625,000
Principal Amount/Shares Fair Value
Principal Amount/Shares Fair Value
Oilfield Services — 3.9%(1)
United States — 3.9%(1)
FTS International, Inc., 7.625%, 11/15/2018(2) $ 3,000,000 $ 2,970,000Pride International, Inc., 8.500%, 06/15/2019 3,000,000 3,920,781
6,890,781
Power/Utility — 27.8%(1)
United States — 27.8%(1)
Ameren Illinois Power Co., 9.750%, 11/15/2018 2,000,000 2,726,596CMS Energy Corp., 8.750%, 06/15/2019 5,185,000 6,401,391Dominion Resources, Inc., 8.375%, 06/15/2064(3) 183,000 5,264,910Duquesne Light Holdings, Inc., 6.400%, 09/15/2020(2) 3,000,000 3,450,435Duquesne Light Holdings, Inc., 5.900%, 12/01/2021(2) 2,000,000 2,233,954FPL Group Capital, Inc., 6.650%, 06/15/2067 1,029,000 1,054,725Integrys Energy Group, Inc., 6.110%, 12/01/2066 3,750,000 3,750,000IPALCO Enterprises, Inc., 7.250%, 04/01/2016(2) 4,000,000 4,340,000North American Energy Alliance LLC, 10.875%, 06/01/2016 2,800,000 3,066,000NRG Energy, Inc., 8.500%, 06/15/2019 6,000,000 6,000,000NV Energy, Inc., 6.250%, 11/15/2020 1,000,000 1,097,482PPL Capital Funding, Inc., 6.700%, 03/30/2067 6,000,000 5,955,000Wisconsin Energy Corp., 6.250%, 05/15/2067 3,450,000 3,536,250
48,876,743
Refining — 1.9%(1)
United States — 1.9%(1)
Holly Corp., 9.875%, 06/15/2017 3,000,000 3,315,000
Total Corporate Bonds (Cost $117,650,932) 128,315,980
See accompanying Notes to Financial Statements.
Tortoise Power and Energy Infrastructure Fund, Inc.6
S C h e D u l e o F i n v e S t m e n t S (Continued)
May 31, 2012
(Unaudited)
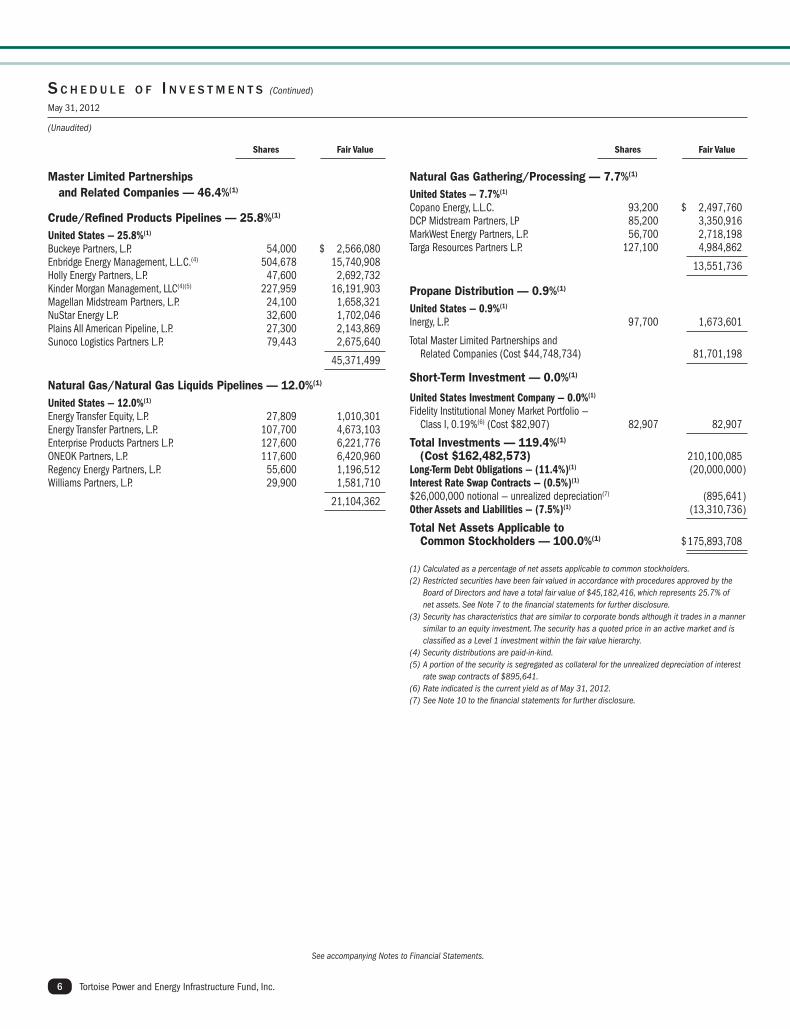
Master Limited Partnerships and Related Companies — 46.4%(1)
Crude/Refined Products Pipelines — 25.8%(1)
United States — 25.8%(1)
Buckeye Partners, L.P. 54,000 $ 2,566,080Enbridge Energy Management, L.L.C.(4) 504,678 15,740,908Holly Energy Partners, L.P. 47,600 2,692,732Kinder Morgan Management, LLC(4)(5) 227,959 16,191,903Magellan Midstream Partners, L.P. 24,100 1,658,321NuStar Energy L.P. 32,600 1,702,046Plains All American Pipeline, L.P. 27,300 2,143,869Sunoco Logistics Partners L.P. 79,443 2,675,640
45,371,499
Natural Gas/Natural Gas Liquids Pipelines — 12.0%(1)
United States — 12.0%(1)
Energy Transfer Equity, L.P. 27,809 1,010,301Energy Transfer Partners, L.P. 107,700 4,673,103Enterprise Products Partners L.P. 127,600 6,221,776ONEOK Partners, L.P. 117,600 6,420,960Regency Energy Partners, L.P. 55,600 1,196,512Williams Partners, L.P. 29,900 1,581,710
21,104,362
Shares Fair Value
Shares Fair Value
Natural Gas Gathering/Processing — 7.7%(1)
United States — 7.7%(1)
Copano Energy, L.L.C. 93,200 $ 2,497,760DCP Midstream Partners, LP 85,200 3,350,916MarkWest Energy Partners, L.P. 56,700 2,718,198Targa Resources Partners L.P. 127,100 4,984,862
13,551,736
Propane Distribution — 0.9%(1)
United States — 0.9%(1)
Inergy, L.P. 97,700 1,673,601
Total Master Limited Partnerships and Related Companies (Cost $44,748,734) 81,701,198
Short-Term Investment — 0.0%(1)
United States Investment Company — 0.0%(1)
Fidelity Institutional Money Market Portfolio — Class I, 0.19%(6) (Cost $82,907) 82,907 82,907
Total Investments — 119.4%(1) (Cost $162,482,573) 210,100,085Long-Term Debt Obligations — (11.4%)(1) (20,000,000 )Interest Rate Swap Contracts — (0.5%)(1)
$26,000,000 notional — unrealized depreciation(7) (895,641 )Other Assets and Liabilities — (7.5%)(1) (13,310,736 )
Total Net Assets Applicable to Common Stockholders — 100.0%(1) $ 175,893,708
(1) Calculated as a percentage of net assets applicable to common stockholders.(2) Restricted securities have been fair valued in accordance with procedures approved by the
Board of Directors and have a total fair value of $45,182,416, which represents 25.7% of net assets. See Note 7 to the financial statements for further disclosure.
(3) Security has characteristics that are similar to corporate bonds although it trades in a manner similar to an equity investment. The security has a quoted price in an active market and is classified as a Level 1 investment within the fair value hierarchy.
(4) Security distributions are paid-in-kind.(5) A portion of the security is segregated as collateral for the unrealized depreciation of interest
rate swap contracts of $895,641.(6) Rate indicated is the current yield as of May 31, 2012.(7) See Note 10 to the financial statements for further disclosure.
See accompanying Notes to Financial Statements.
2012 2nd Quarter Report 7
S t a t e m e n t o F a S S e t S & l i a b i l i t i e S
May 31, 2012
(Unaudited)
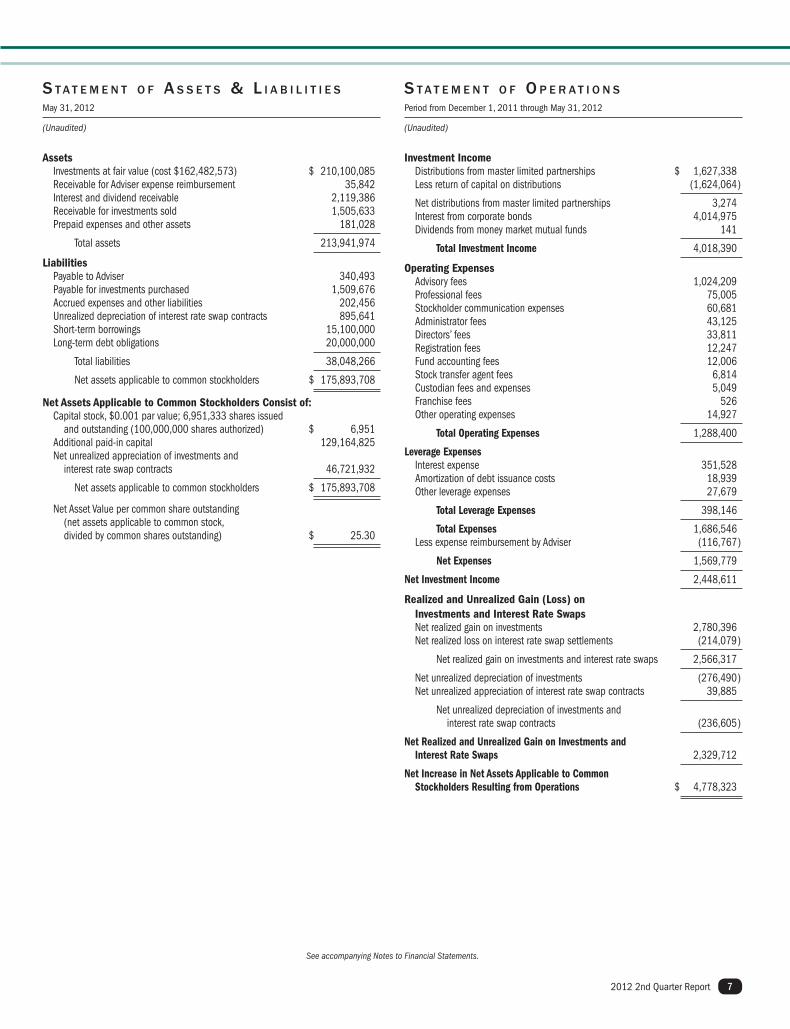
Assets Investments at fair value (cost $162,482,573) $ 210,100,085 Receivable for Adviser expense reimbursement 35,842 Interest and dividend receivable 2,119,386 Receivable for investments sold 1,505,633 Prepaid expenses and other assets 181,028
Total assets 213,941,974
Liabilities Payable to Adviser 340,493 Payable for investments purchased 1,509,676 Accrued expenses and other liabilities 202,456 Unrealized depreciation of interest rate swap contracts 895,641 Short-term borrowings 15,100,000 Long-term debt obligations 20,000,000
Total liabilities 38,048,266
Net assets applicable to common stockholders $ 175,893,708
Net Assets Applicable to Common Stockholders Consist of: Capital stock, $0.001 par value; 6,951,333 shares issued and outstanding (100,000,000 shares authorized) $ 6,951 Additional paid-in capital 129,164,825 Net unrealized appreciation of investments and interest rate swap contracts 46,721,932
Net assets applicable to common stockholders $ 175,893,708
Net Asset Value per common share outstanding (net assets applicable to common stock, divided by common shares outstanding) $ 25.30
S t a t e m e n t o F o p e r a t i o n S
Period from December 1, 2011 through May 31, 2012
(Unaudited)
Investment Income Distributions from master limited partnerships $ 1,627,338 Less return of capital on distributions (1,624,064 )
Net distributions from master limited partnerships 3,274 Interest from corporate bonds 4,014,975 Dividends from money market mutual funds 141
Total Investment Income 4,018,390
Operating Expenses Advisory fees 1,024,209 Professional fees 75,005 Stockholder communication expenses 60,681 Administrator fees 43,125 Directors’ fees 33,811 Registration fees 12,247 Fund accounting fees 12,006 Stock transfer agent fees 6,814 Custodian fees and expenses 5,049 Franchise fees 526 Other operating expenses 14,927
Total Operating Expenses 1,288,400
Leverage Expenses Interest expense 351,528 Amortization of debt issuance costs 18,939 Other leverage expenses 27,679
Total Leverage Expenses 398,146
Total Expenses 1,686,546 Less expense reimbursement by Adviser (116,767 )
Net Expenses 1,569,779
Net Investment Income 2,448,611
Realized and Unrealized Gain (Loss) on Investments and Interest Rate Swaps Net realized gain on investments 2,780,396 Net realized loss on interest rate swap settlements (214,079 )
Net realized gain on investments and interest rate swaps 2,566,317
Net unrealized depreciation of investments (276,490 ) Net unrealized appreciation of interest rate swap contracts 39,885
Net unrealized depreciation of investments and interest rate swap contracts (236,605 )
Net Realized and Unrealized Gain on Investments and Interest Rate Swaps 2,329,712
Net Increase in Net Assets Applicable to Common Stockholders Resulting from Operations $ 4,778,323
See accompanying Notes to Financial Statements.
Tortoise Power and Energy Infrastructure Fund, Inc.8
S t a t e m e n t o F C h a n G e S i n n e t a S S e t S
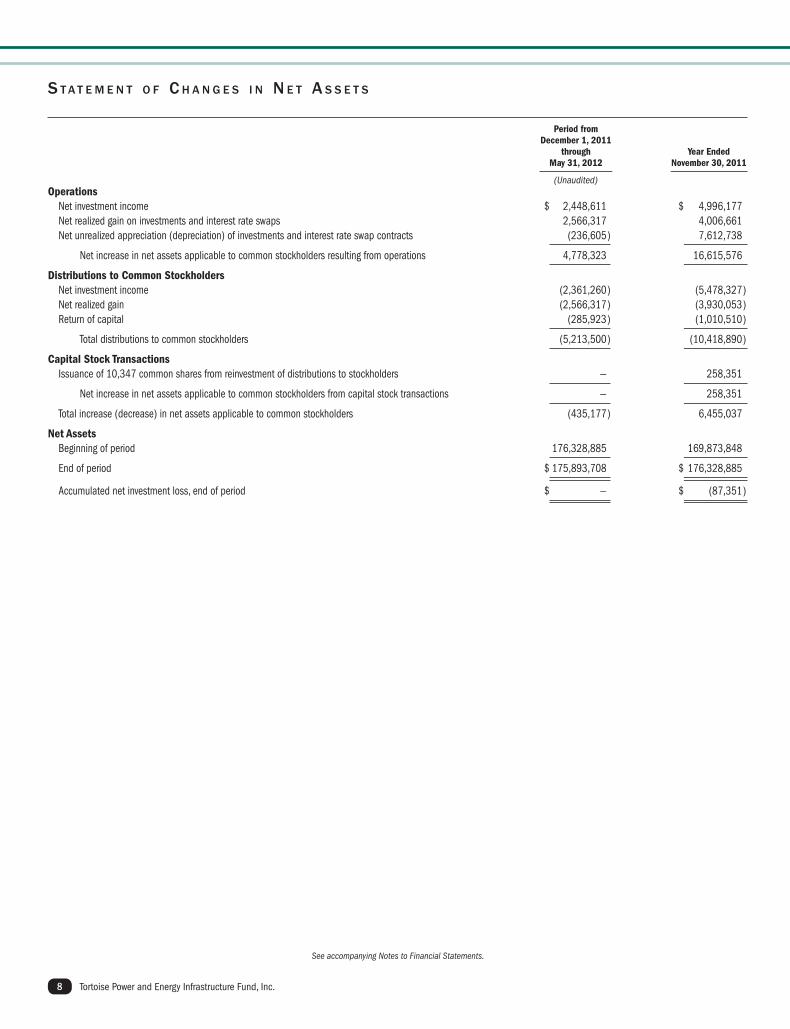
Operations Net investment income $ 2,448,611 $ 4,996,177 Net realized gain on investments and interest rate swaps 2,566,317 4,006,661 Net unrealized appreciation (depreciation) of investments and interest rate swap contracts (236,605 ) 7,612,738
Net increase in net assets applicable to common stockholders resulting from operations 4,778,323 16,615,576
Distributions to Common Stockholders Net investment income (2,361,260 ) (5,478,327 ) Net realized gain (2,566,317 ) (3,930,053 ) Return of capital (285,923 ) (1,010,510 )
Total distributions to common stockholders (5,213,500 ) (10,418,890 )
Capital Stock Transactions Issuance of 10,347 common shares from reinvestment of distributions to stockholders — 258,351
Net increase in net assets applicable to common stockholders from capital stock transactions — 258,351
Total increase (decrease) in net assets applicable to common stockholders (435,177 ) 6,455,037
Net Assets Beginning of period 176,328,885 169,873,848
End of period $ 175,893,708 $ 176,328,885
Accumulated net investment loss, end of period $ — $ (87,351 )
Period from December 1, 2011
through Year Ended May 31, 2012 November 30, 2011
(Unaudited)
See accompanying Notes to Financial Statements.
2012 2nd Quarter Report 9
S t a t e m e n t o F C a S h F l o w S
Period from December 1, 2011 through May 31, 2012
(Unaudited)
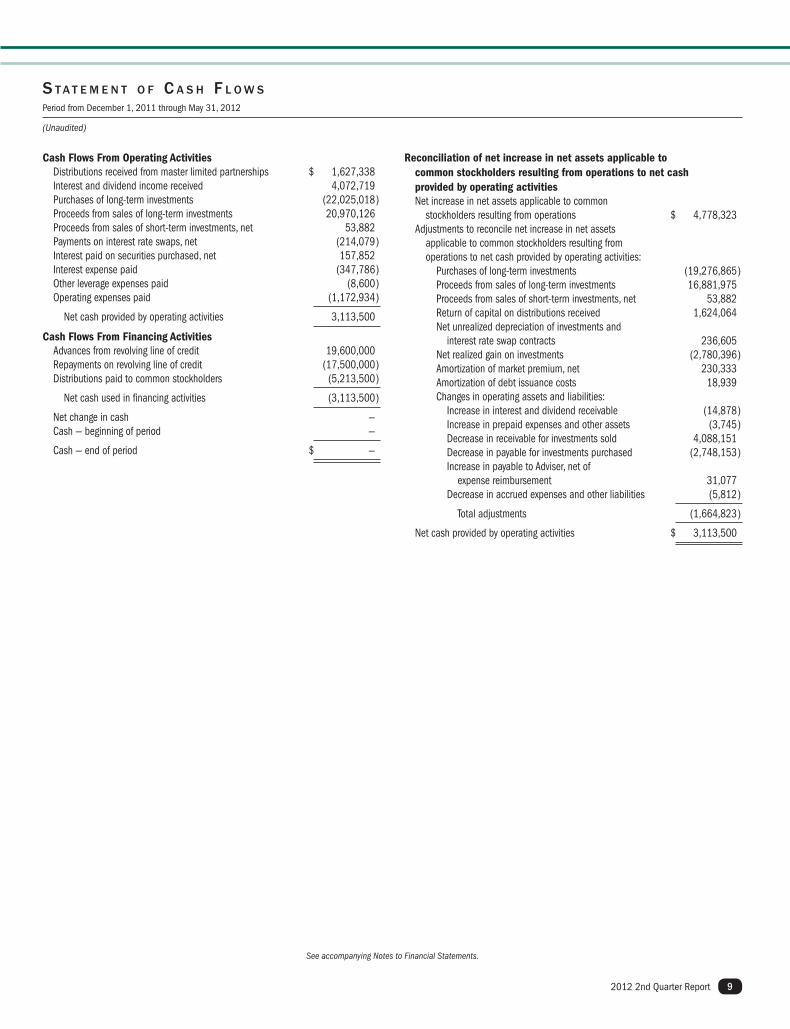
Cash Flows From Operating Activities Distributions received from master limited partnerships $ 1,627,338 Interest and dividend income received 4,072,719 Purchases of long-term investments (22,025,018 ) Proceeds from sales of long-term investments 20,970,126 Proceeds from sales of short-term investments, net 53,882 Payments on interest rate swaps, net (214,079 ) Interest paid on securities purchased, net 157,852 Interest expense paid (347,786 ) Other leverage expenses paid (8,600 ) Operating expenses paid (1,172,934 )
Net cash provided by operating activities 3,113,500
Cash Flows From Financing Activities Advances from revolving line of credit 19,600,000 Repayments on revolving line of credit (17,500,000 ) Distributions paid to common stockholders (5,213,500 )
Net cash used in financing activities (3,113,500 )
Net change in cash — Cash — beginning of period —
Cash — end of period $ —
Reconciliation of net increase in net assets applicable to common stockholders resulting from operations to net cash provided by operating activities Net increase in net assets applicable to common stockholders resulting from operations $ 4,778,323 Adjustments to reconcile net increase in net assets applicable to common stockholders resulting from operations to net cash provided by operating activities: Purchases of long-term investments (19,276,865 ) Proceeds from sales of long-term investments 16,881,975 Proceeds from sales of short-term investments, net 53,882 Return of capital on distributions received 1,624,064 Net unrealized depreciation of investments and interest rate swap contracts 236,605 Net realized gain on investments (2,780,396 ) Amortization of market premium, net 230,333 Amortization of debt issuance costs 18,939 Changes in operating assets and liabilities: Increase in interest and dividend receivable (14,878 ) Increase in prepaid expenses and other assets (3,745 ) Decrease in receivable for investments sold 4,088,151 Decrease in payable for investments purchased (2,748,153 ) Increase in payable to Adviser, net of expense reimbursement 31,077 Decrease in accrued expenses and other liabilities (5,812 )
Total adjustments (1,664,823 )
Net cash provided by operating activities $ 3,113,500
See accompanying Notes to Financial Statements.
Tortoise Power and Energy Infrastructure Fund, Inc.10
F i n a n C i a l h i G h l i G h t S
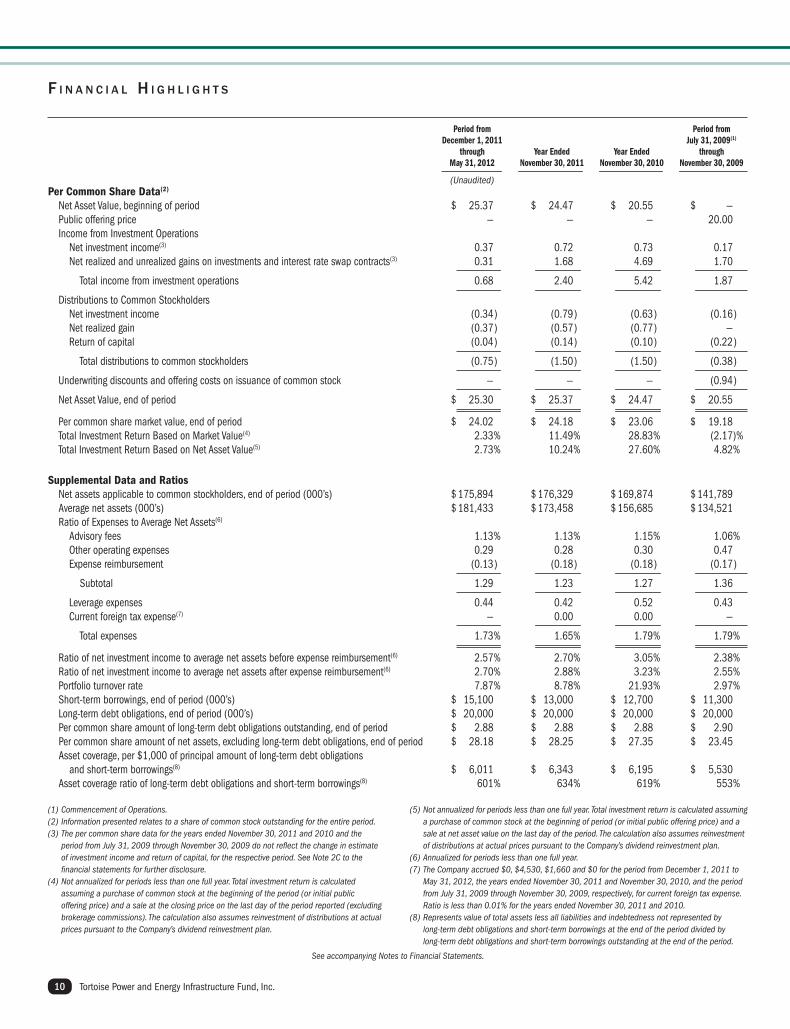
Period from Period from December 1, 2011 July 31, 2009(1) through Year Ended Year Ended through May 31, 2012 November 30, 2011 November 30, 2010 November 30, 2009
(Unaudited)
(1) Commencement of Operations.(2) Information presented relates to a share of common stock outstanding for the entire period.(3) The per common share data for the years ended November 30, 2011 and 2010 and the
period from July 31, 2009 through November 30, 2009 do not reflect the change in estimate of investment income and return of capital, for the respective period. See Note 2C to the financial statements for further disclosure.
(4) Not annualized for periods less than one full year. Total investment return is calculated assuming a purchase of common stock at the beginning of the period (or initial public offering price) and a sale at the closing price on the last day of the period reported (excluding brokerage commissions). The calculation also assumes reinvestment of distributions at actual prices pursuant to the Company’s dividend reinvestment plan.
(5) Not annualized for periods less than one full year. Total investment return is calculated assuming a purchase of common stock at the beginning of period (or initial public offering price) and a sale at net asset value on the last day of the period. The calculation also assumes reinvestment of distributions at actual prices pursuant to the Company’s dividend reinvestment plan.
(6) Annualized for periods less than one full year.(7) The Company accrued $0, $4,530, $1,660 and $0 for the period from December 1, 2011 to
May 31, 2012, the years ended November 30, 2011 and November 30, 2010, and the period from July 31, 2009 through November 30, 2009, respectively, for current foreign tax expense. Ratio is less than 0.01% for the years ended November 30, 2011 and 2010.
(8) Represents value of total assets less all liabilities and indebtedness not represented by long-term debt obligations and short-term borrowings at the end of the period divided by long-term debt obligations and short-term borrowings outstanding at the end of the period.
Per Common Share Data(2)
Net Asset Value, beginning of period $ 25.37 $ 24.47 $ 20.55 $ — Public offering price — — — 20.00 Income from Investment Operations Net investment income(3) 0.37 0.72 0.73 0.17 Net realized and unrealized gains on investments and interest rate swap contracts(3) 0.31 1.68 4.69 1.70
Total income from investment operations 0.68 2.40 5.42 1.87
Distributions to Common Stockholders Net investment income (0.34 ) (0.79 ) (0.63 ) (0.16 ) Net realized gain (0.37 ) (0.57 ) (0.77 ) — Return of capital (0.04 ) (0.14 ) (0.10 ) (0.22 )
Total distributions to common stockholders (0.75 ) (1.50 ) (1.50 ) (0.38 )
Underwriting discounts and offering costs on issuance of common stock — — — (0.94 )
Net Asset Value, end of period $ 25.30 $ 25.37 $ 24.47 $ 20.55
Per common share market value, end of period $ 24.02 $ 24.18 $ 23.06 $ 19.18 Total Investment Return Based on Market Value(4) 2.33 % 11.49 % 28.83 % (2.17 )% Total Investment Return Based on Net Asset Value(5) 2.73 % 10.24 % 27.60 % 4.82 %
Supplemental Data and Ratios Net assets applicable to common stockholders, end of period (000’s) $ 175,894 $ 176,329 $ 169,874 $ 141,789 Average net assets (000’s) $ 181,433 $ 173,458 $ 156,685 $ 134,521 Ratio of Expenses to Average Net Assets(6)
Advisory fees 1.13 % 1.13 % 1.15 % 1.06 % Other operating expenses 0.29 0.28 0.30 0.47 Expense reimbursement (0.13 ) (0.18 ) (0.18 ) (0.17 )
Subtotal 1.29 1.23 1.27 1.36
Leverage expenses 0.44 0.42 0.52 0.43 Current foreign tax expense(7) — 0.00 0.00 —
Total expenses 1.73 % 1.65 % 1.79 % 1.79 %
Ratio of net investment income to average net assets before expense reimbursement(6) 2.57 % 2.70 % 3.05 % 2.38 % Ratio of net investment income to average net assets after expense reimbursement(6) 2.70 % 2.88 % 3.23 % 2.55 % Portfolio turnover rate 7.87 % 8.78 % 21.93 % 2.97 % Short-term borrowings, end of period (000’s) $ 15,100 $ 13,000 $ 12,700 $ 11,300 Long-term debt obligations, end of period (000’s) $ 20,000 $ 20,000 $ 20,000 $ 20,000 Per common share amount of long-term debt obligations outstanding, end of period $ 2.88 $ 2.88 $ 2.88 $ 2.90 Per common share amount of net assets, excluding long-term debt obligations, end of period $ 28.18 $ 28.25 $ 27.35 $ 23.45 Asset coverage, per $1,000 of principal amount of long-term debt obligations and short-term borrowings(8) $ 6,011 $ 6,343 $ 6,195 $ 5,530 Asset coverage ratio of long-term debt obligations and short-term borrowings(8) 601 % 634 % 619 % 553 %
2012 2nd Quarter Report 11
discount at which the Company purchased the securities. To the extent that such securities are convertible or otherwise become freely tradable within a time frame that may be reasonably determined, an amortization schedule may be used to determine the discount.
The Company generally values debt securities at prices based on market quotations for such securities, except those securities purchased with 60 days or less to maturity are valued on the basis of amortized cost, which approximates market value.
The Company generally values its interest rate swap contracts using industry-accepted models which discount the estimated future cash flows based on the stated terms of the interest rate swap agreement by using interest rates currently available in the market, or based on dealer quotations, if available.
C. Security Transactions and Investment Income
Security transactions are accounted for on the date the securities are purchased or sold (trade date). Realized gains and losses are reported on an identified cost basis. Interest income is recognized on the accrual basis, including amortization of premiums and accretion of discounts. Dividend and distribution income is recorded on the ex-dividend date. Distributions received from the Company’s investments in master limited partnerships (“MLPs”) generally are comprised of ordinary income and return of capital from the MLPs. The Company allocates distributions between investment income and return of capital based on estimates made at the time such distributions are received. Such estimates are based on information provided by each MLP and other industry sources. These estimates may subsequently be revised based on actual allocations received from MLPs after their tax reporting periods are concluded, as the actual character of these distributions is not known until after the fiscal year end of the Company.
For the period from December 1, 2010 through November 30, 2011, the Company estimated the allocation of investment income and return of capital for the distributions received from MLPs within the Statement of Operations. For this period, the Company had estimated approximately 7 percent of total distributions as investment income and approximately 93 percent as return of capital.
Subsequent to November 30, 2011, the Company reallocated the amount of investment income and return of capital it recognized for the period from December 1, 2010 through November 30, 2011 based on the 2011 tax reporting information received from the individual MLPs. This reclassification amounted to a decrease in net investment income of approximately $91,000 or $0.013 per share, an increase in unrealized appreciation of investments of approximately $78,400 or $0.011 per share, and an increase in realized gains of approximately $12,600 or $0.002 per share for the period from December 1, 2011 through May 31, 2012.
Subsequent to the period ended February 29, 2012, the Company reallocated the amount of investment income and return of capital it recognized in the current fiscal year based on its revised 2012 estimates, after considering the final allocations from 2011. This reclassification amounted to a decrease in unrealized appreciation of investments of approximately $15,500 or $0.002 per share and an increase in realized gains of approximately $15,500 or $0.002 per share.
1. Organization
Tortoise Power and Energy Infrastructure Fund, Inc. (the “Company”) was organized as a Maryland corporation on July 5, 2007, and is a non-diversified, closed-end management investment company under the Investment Company Act of 1940, as amended (the “1940 Act”). The Company’s primary investment objective is to provide a high level of current income, with a secondary objective of capital appreciation. The Company seeks to provide its stockholders with a vehicle to invest in a portfolio consisting primarily of securities issued by power and energy infrastructure companies. The Company commenced operations on July 31, 2009. The Company’s stock is listed on the New York Stock Exchange under the symbol “TPZ.”
2. Significant Accounting Policies
A. Use of Estimates
The preparation of financial statements in conformity with U.S. generally accepted accounting principles requires management to make estimates and assumptions that affect the reported amount of assets and liabilities, recognition of distribution income and disclosure of contingent assets and liabilities at the date of the financial statements. Actual results could differ from those estimates.
B. Investment Valuation
The Company primarily owns securities that are listed on a securities exchange or over-the-counter market. The Company values those securities at their last sale price on that exchange or over-the-counter market on the valuation date. If the security is listed on more than one exchange, the Company uses the price from the exchange that it considers to be the principal exchange on which the security is traded. Securities listed on the NASDAQ will be valued at the NASDAQ Official Closing Price, which may not necessarily represent the last sale price. If there has been no sale on such exchange or over-the-counter market on such day, the security will be valued at the mean between the last bid price and last ask price on such day.
The Company may invest up to 15 percent of its total assets in restricted securities. Restricted securities are subject to statutory or contractual restrictions on their public resale, which may make it more difficult to obtain a valuation and may limit the Company’s ability to dispose of them. Investments in private placement securities and other securities for which market quotations are not readily available will be valued in good faith by using fair value procedures approved by the Board of Directors. Such fair value procedures consider factors such as discounts to publicly traded issues, time until conversion date, securities with similar yields, quality, type of issue, coupon, duration and rating. If events occur that affect the value of the Company’s portfolio securities before the net asset value has been calculated (a “significant event”), the portfolio securities so affected will generally be priced using fair value procedures.
An equity security of a publicly traded company acquired in a direct placement transaction may be subject to restrictions on resale that can affect the security’s liquidity and fair value. Such securities that are convertible or otherwise will become freely tradable will be valued based on the market value of the freely tradable security less an applicable discount. Generally, the discount will initially be equal to the
n o t e S t o F i n a n C i a l S t a t e m e n t S (Unaudited)
May 31, 2012
Tortoise Power and Energy Infrastructure Fund, Inc.12
n o t e S t o F i n a n C i a l S t a t e m e n t S (Unaudited)
(Continued)
instruments are recorded at fair value with changes in fair value during the reporting period, and amounts accrued under the agreements, included as unrealized gains or losses in the Statement of Operations. Cash settlements under the terms of the interest rate swap agreements and termination of such agreements are recorded as realized gains or losses in the Statement of Operations.
H. Indemnifications
Under the Company’s organizational documents, its officers and directors are indemnified against certain liabilities arising out of the performance of their duties to the Company. In addition, in the normal course of business, the Company may enter into contracts that provide general indemnification to other parties. The Company’s maximum exposure under these arrangements is unknown, as this would involve future claims that may be made against the Company that have not yet occurred, and may not occur. However, the Company has not had prior claims or losses pursuant to these contracts and expects the risk of loss to be remote.
I. Recent Accounting Pronouncement
In May 2011, the FASB issued ASU No. 2011-04 “Amendments to Achieve Common Fair Value Measurement and Disclosure Requirements” in GAAP and the International Financial Reporting Standards (“IFRSs”). ASU No. 2011-04 amends FASB ASC Topic 820, Fair Value Measurements and Disclosures, to establish common requirements for measuring fair value and for disclosing information about fair value measurements in accordance with GAAP and IFRSs. ASU No. 2011-04 is effective for fiscal years beginning after December 15, 2011 and for interim periods within those fiscal years. Management is evaluating the impact of these amendments, but currently does not believe they will have a material impact on the Company’s financial statements.
3. Concentration of Risk
Under normal circumstances, the Company intends to invest at least 80 percent of total assets (including assets obtained through potential leverage) in securities of companies that derive more than 50 percent of their revenue from power or energy operations and no more than 25 percent of the total assets in equity securities of MLPs as of the date of purchase. The Company will invest a minimum of 60 percent of total assets in fixed income securities, which may include up to 25 percent of its assets in non-investment grade rated fixed income securities. In determining application of these policies, the term “total assets” includes assets obtained through leverage. Companies that primarily invest in a particular sector may experience greater volatility than companies investing in a broad range of industry sectors. The Company may, for defensive purposes, temporarily invest all or a significant portion of its assets in investment grade securities, short-term debt securities and cash or cash equivalents. To the extent the Company uses this strategy, it may not achieve its investment objective.
4. Agreements
The Company has entered into an Investment Advisory Agreement with Tortoise Capital Advisors, L.L.C. (the “Adviser”). Under the terms of the agreement, the Company pays the Adviser a fee equal to an annual rate of 0.95 percent of the Company’s average monthly total assets (including any assets attributable to leverage) minus accrued liabilities (other than debt entered into for purposes of leverage and the aggregate
D. Distributions to Stockholders
Distributions to common stockholders are recorded on the ex-dividend date. The Company intends to make monthly cash distributions of its investment company income to common stockholders. In addition, on an annual basis, the Company may distribute additional capital gains in the last fiscal quarter if necessary to meet minimum distribution requirements and thus avoid being subject to excise taxes. The amount of any distributions will be determined by the Board of Directors. The character of distributions made during the year may differ from their ultimate characterization for federal income tax purposes. Distributions paid to stockholders in excess of investment company taxable income and net realized gains will be treated as return of capital to stockholders. For the year ended November 30, 2011, the Company’s distributions were comprised of 53 percent ordinary income, 37 percent long-term capital gain and 10 percent return of capital. The tax character of distributions paid to common stockholders for the current year will be determined subsequent to November 30, 2012.
E. Federal Income Taxation
The Company qualifies as a regulated investment company (“RIC”) under the U.S. Internal Revenue Code of 1986, as amended (the “Code”). As a result, the Company generally will not be subject to U.S. federal income tax on income and gains that it distributes each taxable year to stockholders if it meets certain minimum distribution requirements. The Company is required to distribute substantially all of its income, in addition to other asset diversification requirements. The Company is subject to a 4 percent non-deductible U.S. federal excise tax on certain undistributed income unless the Company makes sufficient distributions to satisfy the excise tax avoidance requirement. The Company invests in MLPs, which generally are treated as partnerships for federal income tax purposes. As a limited partner in the MLPs, the Company reports its allocable share of the MLP’s taxable income in computing its own taxable income.
The Company has adopted financial reporting rules regarding recognition and measurement of tax positions taken or expected to be taken on a tax return. The Company has reviewed all open tax years and major jurisdictions and concluded that there is no impact on the Company’s net assets and no tax liability resulting from unrecognized tax benefits relating to uncertain income tax positions taken or expected to be taken on a tax return. All tax years since inception remain open to examination by federal and state tax authorities.
F. Offering and Debt Issuance Costs
Offering costs related to the issuance of common stock are charged to additional paid-in capital when the stock is issued. Debt issuance costs related to long-term debt obligations are capitalized and amortized over the period the debt is outstanding.
G. Derivative Financial Instruments
The Company uses derivative financial instruments (principally interest rate swap contracts) to manage interest rate risk. The Company has established policies and procedures for risk assessment and the approval, reporting and monitoring of derivative financial instrument activities. The Company does not hold or issue derivative financial instruments for speculative purposes. All derivative financial
2012 2nd Quarter Report 13
n o t e S t o F i n a n C i a l S t a t e m e n t S (Unaudited)
(Continued)
6. Fair Value of Financial Instruments
Various inputs are used in determining the value of the Company’s investments. These inputs are summarized in the three broad levels listed below:
Level 1 — quoted prices in active markets for identical investments
Level 2 – other significant observable inputs (including quoted prices for similar investments, market corroborated inputs, etc.)
Level 3 – significant unobservable inputs (including the Company’s own assumptions in determining the fair value of investments)
The inputs or methodology used for valuing securities are not necessarily an indication of the risk associated with investing in those securities.
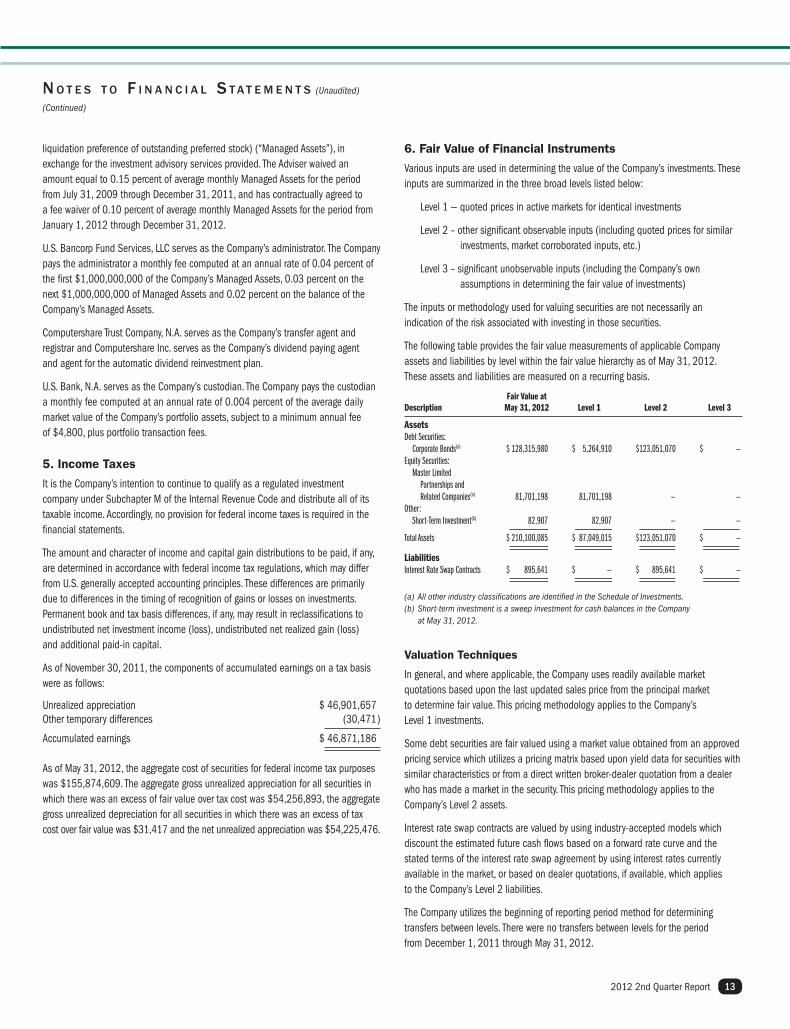
The following table provides the fair value measurements of applicable Company assets and liabilities by level within the fair value hierarchy as of May 31, 2012. These assets and liabilities are measured on a recurring basis.
Fair Value at Description May 31, 2012 Level 1 Level 2 Level 3
AssetsDebt Securities: Corporate Bonds(a) $ 128,315,980 $ 5,264,910 $ 123,051,070 $ — Equity Securities: Master Limited Partnerships and Related Companies(a) 81,701,198 81,701,198 — —Other: Short-Term Investment(b) 82,907 82,907 — —
Total Assets $ 210,100,085 $ 87,049,015 $ 123,051,070 $ —
LiabilitiesInterest Rate Swap Contracts $ 895,641 $ — $ 895,641 $ —
(a) All other industry classifications are identified in the Schedule of Investments.(b) Short-term investment is a sweep investment for cash balances in the Company
at May 31, 2012.
Valuation Techniques
In general, and where applicable, the Company uses readily available market quotations based upon the last updated sales price from the principal market to determine fair value. This pricing methodology applies to the Company’s Level 1 investments.
Some debt securities are fair valued using a market value obtained from an approved pricing service which utilizes a pricing matrix based upon yield data for securities with similar characteristics or from a direct written broker-dealer quotation from a dealer who has made a market in the security. This pricing methodology applies to the Company’s Level 2 assets.
Interest rate swap contracts are valued by using industry-accepted models which discount the estimated future cash flows based on a forward rate curve and the stated terms of the interest rate swap agreement by using interest rates currently available in the market, or based on dealer quotations, if available, which applies to the Company’s Level 2 liabilities.
The Company utilizes the beginning of reporting period method for determining transfers between levels. There were no transfers between levels for the period from December 1, 2011 through May 31, 2012.
liquidation preference of outstanding preferred stock) (“Managed Assets”), in exchange for the investment advisory services provided. The Adviser waived an amount equal to 0.15 percent of average monthly Managed Assets for the period from July 31, 2009 through December 31, 2011, and has contractually agreed to a fee waiver of 0.10 percent of average monthly Managed Assets for the period from January 1, 2012 through December 31, 2012.
U.S. Bancorp Fund Services, LLC serves as the Company’s administrator. The Company pays the administrator a monthly fee computed at an annual rate of 0.04 percent of the first $1,000,000,000 of the Company’s Managed Assets, 0.03 percent on the next $1,000,000,000 of Managed Assets and 0.02 percent on the balance of the Company’s Managed Assets.
Computershare Trust Company, N.A. serves as the Company’s transfer agent and registrar and Computershare Inc. serves as the Company’s dividend paying agent and agent for the automatic dividend reinvestment plan.
U.S. Bank, N.A. serves as the Company’s custodian. The Company pays the custodian a monthly fee computed at an annual rate of 0.004 percent of the average daily market value of the Company’s portfolio assets, subject to a minimum annual fee of $4,800, plus portfolio transaction fees.
5. Income Taxes
It is the Company’s intention to continue to qualify as a regulated investment company under Subchapter M of the Internal Revenue Code and distribute all of its taxable income. Accordingly, no provision for federal income taxes is required in the financial statements.
The amount and character of income and capital gain distributions to be paid, if any, are determined in accordance with federal income tax regulations, which may differ from U.S. generally accepted accounting principles. These differences are primarily due to differences in the timing of recognition of gains or losses on investments. Permanent book and tax basis differences, if any, may result in reclassifications to undistributed net investment income (loss), undistributed net realized gain (loss) and additional paid-in capital.
As of November 30, 2011, the components of accumulated earnings on a tax basis were as follows:
Unrealized appreciation $ 46,901,657Other temporary differences (30,471 )
Accumulated earnings $ 46,871,186
As of May 31, 2012, the aggregate cost of securities for federal income tax purposes was $155,874,609. The aggregate gross unrealized appreciation for all securities in which there was an excess of fair value over tax cost was $54,256,893, the aggregate gross unrealized depreciation for all securities in which there was an excess of tax cost over fair value was $31,417 and the net unrealized appreciation was $54,225,476.
Tortoise Power and Energy Infrastructure Fund, Inc.14
n o t e S t o F i n a n C i a l S t a t e m e n t S (Unaudited)
(Continued)
8. Investment Transactions
For the period from December 1, 2011 through May 31, 2012, the Company purchased (at cost) and sold securities (proceeds received) in the amount of $19,276,865 and $16,881,975 (excluding short-term debt securities), respectively.
9. Long-Term Debt Obligations
The Company has $20,000,000 aggregate principal amount of Series A private senior notes (the “Notes”) outstanding. Holders of the Notes are entitled to receive quarterly cash interest payments at an annual rate that resets each quarter based on the 3-month LIBOR plus 1.87 percent. The Notes are not listed on any exchange or automated quotation system.
The Notes are unsecured obligations of the Company and, upon liquidation, dissolution or winding up of the Company, will rank: (1) senior to all of the Company’s outstanding preferred shares (if any); (2) senior to all of the Company’s outstanding common shares; (3) on parity with any unsecured creditors of the Company and any unsecured senior securities representing indebtedness of the Company and (4) junior to any secured creditors of the Company.
The Notes are redeemable in certain circumstances at the option of the Company. The Notes are also subject to a mandatory redemption if the Company fails to meet asset coverage ratios required under the 1940 Act or the rating agency guidelines if such failure is not waived or cured. At May 31, 2012, the Company was in compliance with asset coverage covenants and basic maintenance covenants for its senior notes.
At May 31, 2012, the fair value of the Series A Notes approximates the carrying amount because the interest rate fluctuates with changes in interest rates available in the current market. The following table shows the maturity date, notional/carrying amount, current rate as of May 31, 2012, and the weighted-average rate for the period from December 1, 2011 through May 31, 2012.
Maturity Notional/Carrying Current Weighted-Average Series Date Amount Rate Rate
Series A November 6, 2014 $ 20,000,000 2.34% 2.35%
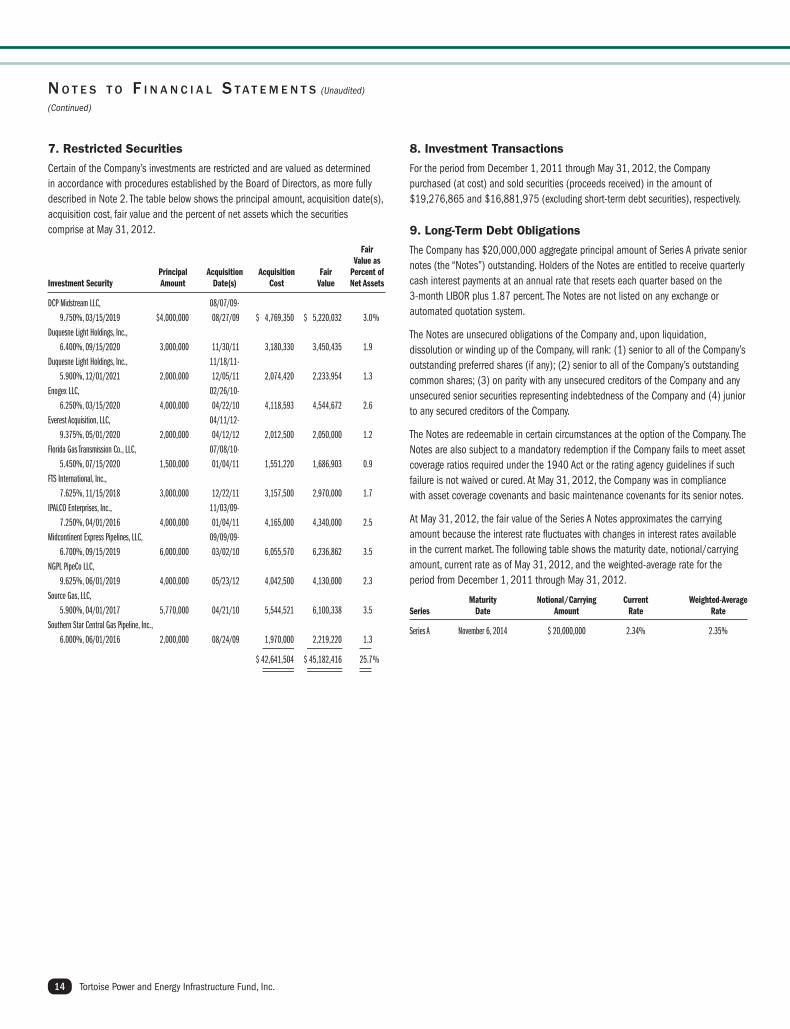
7. Restricted Securities
Certain of the Company’s investments are restricted and are valued as determined in accordance with procedures established by the Board of Directors, as more fully described in Note 2. The table below shows the principal amount, acquisition date(s), acquisition cost, fair value and the percent of net assets which the securities comprise at May 31, 2012.
Fair Value as Principal Acquisition Acquisition Fair Percent of Investment Security Amount Date(s) Cost Value Net Assets
DCP Midstream LLC, 08/07/09-
9.750%, 03/15/2019 $4,000,000 08/27/09 $ 4,769,350 $ 5,220,032 3.0 %
Duquesne Light Holdings, Inc.,
6.400%, 09/15/2020 3,000,000 11/30/11 3,180,330 3,450,435 1.9
Duquesne Light Holdings, Inc., 11/18/11-
5.900%, 12/01/2021 2,000,000 12/05/11 2,074,420 2,233,954 1.3
Enogex LLC, 02/26/10-
6.250%, 03/15/2020 4,000,000 04/22/10 4,118,593 4,544,672 2.6
Everest Acquisition, LLC, 04/11/12-
9.375%, 05/01/2020 2,000,000 04/12/12 2,012,500 2,050,000 1.2
Florida Gas Transmission Co., LLC, 07/08/10-
5.450%, 07/15/2020 1,500,000 01/04/11 1,551,220 1,686,903 0.9
FTS International, Inc.,
7.625%, 11/15/2018 3,000,000 12/22/11 3,157,500 2,970,000 1.7
IPALCO Enterprises, Inc., 11/03/09-
7.250%, 04/01/2016 4,000,000 01/04/11 4,165,000 4,340,000 2.5
Midcontinent Express Pipelines, LLC, 09/09/09-
6.700%, 09/15/2019 6,000,000 03/02/10 6,055,570 6,236,862 3.5
NGPL PipeCo LLC,
9.625%, 06/01/2019 4,000,000 05/23/12 4,042,500 4,130,000 2.3
Source Gas, LLC,
5.900%, 04/01/2017 5,770,000 04/21/10 5,544,521 6,100,338 3.5
Southern Star Central Gas Pipeline, Inc.,
6.000%, 06/01/2016 2,000,000 08/24/09 1,970,000 2,219,220 1.3
$ 42,641,504 $ 45,182,416 25.7 %
2012 2nd Quarter Report 15
n o t e S t o F i n a n C i a l S t a t e m e n t S (Unaudited)
(Continued)
11. Credit Facility
On September 14, 2011, the Company entered into an amendment to its credit facility that extends the credit facility through September 14, 2012. U.S. Bank, N.A. serves as a lender and the leading syndicate agent on behalf of other lenders participating in the credit facility. The terms of the amendment provided for an unsecured revolving credit facility of $18,000,000. During the extension, outstanding balances accrued interest at a variable annual rate equal to one-month LIBOR plus 1.25 percent and unused portions of the credit facility accrued a non-usage fee equal to an annual rate of 0.20 percent.
The average principal balance and interest rate for the period during which the credit facility was utilized during the period ended May 31, 2012 was approximately $14,100,000 and 1.51 percent, respectively. At May 31, 2012, the principal balance outstanding was $15,100,000 at an interest rate of 1.49 percent.
Under the terms of the credit facility, the Company must maintain asset coverage required under the 1940 Act. If the Company fails to maintain the required coverage, it may be required to repay a portion of an outstanding balance until the coverage requirement has been met. At May 31, 2012, the Company was in compliance with the terms of the credit facility.
12. Common Stock
The Company has 100,000,000 shares of capital stock authorized and 6,951,333 shares outstanding at May 31, 2012 and November 30, 2011.
13. Subsequent Events
On June 18, 2012, the Company entered into an amendment to its credit facility that extends the credit facility through June 17, 2013. The terms of the amendment provide for an unsecured revolving credit facility of $19,000,000. During the extension, outstanding balances generally will accrue interest at a variable annual rate equal to one-month LIBOR plus 1.25 percent and unused portions of the credit facility will accrue a non-usage fee equal to an annual rate of 0.20 percent.
On June 29, 2012, the Company paid a distribution in the amount of $0.125 per common share, for a total of $868,917. Of this total, the dividend reinvestment amounted to $59,158.
The Company has performed an evaluation of subsequent events through the date the financial statements were issued and has determined that no additional items require recognition or disclosure.
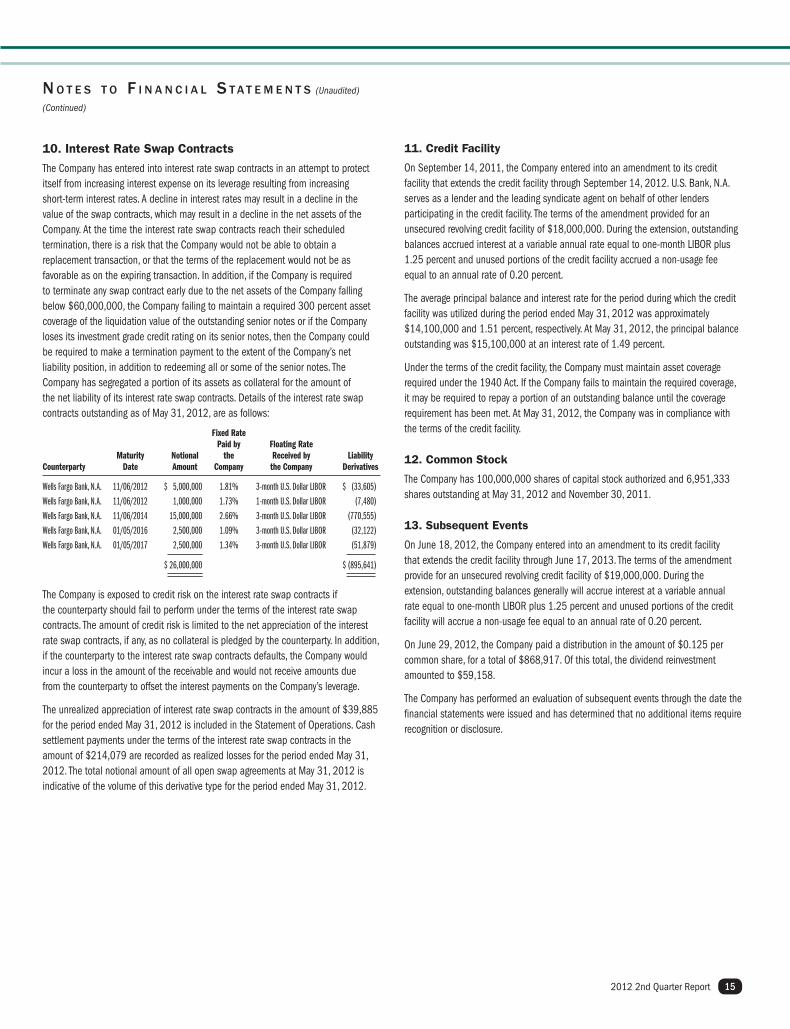
10. Interest Rate Swap Contracts
The Company has entered into interest rate swap contracts in an attempt to protect itself from increasing interest expense on its leverage resulting from increasing short-term interest rates. A decline in interest rates may result in a decline in the value of the swap contracts, which may result in a decline in the net assets of the Company. At the time the interest rate swap contracts reach their scheduled termination, there is a risk that the Company would not be able to obtain a replacement transaction, or that the terms of the replacement would not be as favorable as on the expiring transaction. In addition, if the Company is required to terminate any swap contract early due to the net assets of the Company falling below $60,000,000, the Company failing to maintain a required 300 percent asset coverage of the liquidation value of the outstanding senior notes or if the Company loses its investment grade credit rating on its senior notes, then the Company could be required to make a termination payment to the extent of the Company’s net liability position, in addition to redeeming all or some of the senior notes. The Company has segregated a portion of its assets as collateral for the amount of the net liability of its interest rate swap contracts. Details of the interest rate swap contracts outstanding as of May 31, 2012, are as follows:
Fixed Rate Paid by Floating Rate Maturity Notional the Received by Liability Counterparty Date Amount Company the Company Derivatives
Wells Fargo Bank, N.A. 11/06/2012 $ 5,000,000 1.81% 3-month U.S. Dollar LIBOR $ (33,605)
Wells Fargo Bank, N.A. 11/06/2012 1,000,000 1.73% 1-month U.S. Dollar LIBOR (7,480)
Wells Fargo Bank, N.A. 11/06/2014 15,000,000 2.66% 3-month U.S. Dollar LIBOR (770,555)
Wells Fargo Bank, N.A. 01/05/2016 2,500,000 1.09% 3-month U.S. Dollar LIBOR (32,122)
Wells Fargo Bank, N.A. 01/05/2017 2,500,000 1.34% 3-month U.S. Dollar LIBOR (51,879)
$ 26,000,000 $ (895,641)
The Company is exposed to credit risk on the interest rate swap contracts if the counterparty should fail to perform under the terms of the interest rate swap contracts. The amount of credit risk is limited to the net appreciation of the interest rate swap contracts, if any, as no collateral is pledged by the counterparty. In addition, if the counterparty to the interest rate swap contracts defaults, the Company would incur a loss in the amount of the receivable and would not receive amounts due from the counterparty to offset the interest payments on the Company’s leverage.
The unrealized appreciation of interest rate swap contracts in the amount of $39,885 for the period ended May 31, 2012 is included in the Statement of Operations. Cash settlement payments under the terms of the interest rate swap contracts in the amount of $214,079 are recorded as realized losses for the period ended May 31, 2012. The total notional amount of all open swap agreements at May 31, 2012 is indicative of the volume of this derivative type for the period ended May 31, 2012.
Tortoise Power and Energy Infrastructure Fund, Inc.16
materially from those contemplated by the forward-looking statements. Several factors that could materially affect the Company’s actual results are the performance of the portfolio of investments held by it, the conditions in the U.S. and international financial, petroleum and other markets, the price at which shares of the Company will trade in the public markets and other factors discussed in filings with the SEC.
Proxy Voting PoliciesA description of the policies and procedures that the Company uses to determine how to vote proxies relating to portfolio securities owned by the Company and information regarding how the Company voted proxies relating to the portfolio of securities during the 12-month period ended June 30, 2011 are available to stockholders (i) without charge, upon request by calling the Company at (913) 981-1020 or toll-free at (866) 362-9331 and on the Company’s Web site at www.tortoiseadvisors.com; and (ii) on the SEC’s Web site at www.sec.gov.
Form N-QThe Company files its complete schedule of portfolio holdings for the first and third quarters of each fiscal year with the SEC on Form N-Q. The Company’s Form N-Q is available without charge upon request by calling the Company at (866) 362-9331 or by visiting the SEC’s Web site at www.sec.gov. In addition, you may review and copy the Company’s Form N-Q at the SEC’s Public Reference Room in Washington D.C. You may obtain information on the operation of the Public Reference Room by calling (800) SEC-0330.
The Company’s Form N-Qs are also available on the Company’s Web site at www.tortoiseadvisors.com.
Statement of Additional InformationThe Statement of Additional Information (“SAI”) includes additional information about the Company’s directors and is available upon request without charge by calling the Company at (866) 362-9331 or by visiting the SEC’s Web site at www.sec.gov.
CertificationsThe Company’s Chief Executive Officer has submitted to the New York Stock Exchange the annual certification as required by Section 303A.12(a) of the NYSE Listed Company Manual.
The Company has filed with the SEC, as an exhibit to its most recently filed Form N-CSR, the certification of its Chief Executive Officer and Chief Financial Officer required by Section 302 of the Sarbanes-Oxley Act.
Privacy PolicyIn order to conduct its business, the Company collects and maintains certain nonpublic personal information about its stockholders of record with respect to their transactions in shares of the Company’s securities. This information includes the stockholder’s address, tax identification or Social Security number, share balances, and distribution elections. We do not collect or maintain personal information about stockholders whose share balances of our securities are held in “street name” by a financial institution such as a bank or broker.
We do not disclose any nonpublic personal information about you, the Company’s other stockholders or the Company’s former stockholders to third parties unless necessary to process a transaction, service an account, or as otherwise permitted by law.
To protect your personal information internally, we restrict access to nonpublic personal information about the Company’s stockholders to those employees who need to know that information to provide services to our stockholders. We also maintain certain other safeguards to protect your nonpublic personal information.
Stockholder Proxy Voting ResultsThe annual meeting of stockholders was held on May 24, 2012. The matters considered at the meeting, together with the actual vote tabulations relating to such matters are as follows:
1. To elect one director of the Company, to hold office for a term of three years and until his successor is duly elected and qualified.
No. of Shares Charles E. Heath Affirmative 6,041,095 Withheld 59,266
TOTAL 6,100,361
Each of H. Kevin Birzer and John Graham continued as a director with a term expiring on the date of the 2013 annual meeting of stockholders. Conrad S. Ciccotello continued as a director and his term expires on the date of the 2014 annual meeting of stockholders.
2. To approve a proposal to authorize flexibility to the Company to sell its common shares for less than net asset value, subject to certain conditions.
Vote of Common Stockholders No. of of Record (4 Stockholders of Recordholders Record as of Record Date) Voting
Affirmative 4 Against 0 Abstain 0 Broker Non-votes 0
TOTAL 4
Vote of Stockholders No. of Shares
Affirmative 1,762,519 Against 173,228 Abstain 34,752 Broker Non-votes 4,129,862
TOTAL 6,100,361
3. To ratify the selection of Ernst & Young LLP as the independent registered public accounting firm of the Company for its fiscal year ending November 30, 2012.
No. of Shares
Affirmative 6,042,190 Against 30,781 Abstain 27,390
TOTAL 6,100,361
Based upon votes required for approval, each of these matters passed.
Director and Officer CompensationThe Company does not compensate any of its directors who are “interested persons,” as defined in Section 2(a)(19) of the 1940 Act, nor any of its officers. For the period ended May 31, 2012, the aggregate compensation paid by the Company to the independent directors was $34,500. The Company did not pay any special compensation to any of its directors or officers.
Forward-Looking StatementsThis report contains “forward-looking statements” within the meaning of the Securities Act of 1933 and the Securities Exchange Act of 1934. By their nature, all forward-looking statements involve risks and uncertainties, and actual results could differ
a D D i t i o n a l i n F o r m a t i o n (Unaudited)
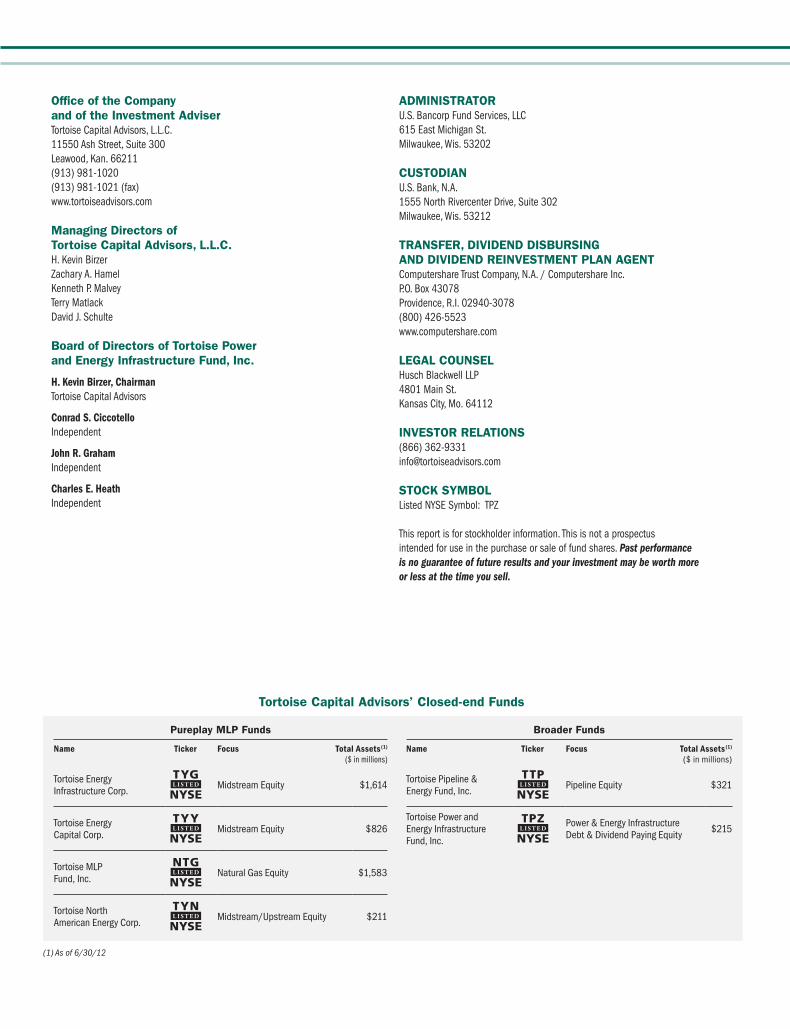
Office of the Company and of the Investment AdviserTortoise Capital Advisors, L.L.C. 11550 Ash Street, Suite 300 Leawood, Kan. 66211 (913) 981-1020 (913) 981-1021 (fax)www.tortoiseadvisors.com
Managing Directors of Tortoise Capital Advisors, L.L.C.H. Kevin BirzerZachary A. HamelKenneth P. MalveyTerry MatlackDavid J. Schulte
Board of Directors of Tortoise Power and Energy Infrastructure Fund, Inc.
H. Kevin Birzer, ChairmanTortoise Capital Advisors
Conrad S. CiccotelloIndependent
John R. GrahamIndependent
Charles E. HeathIndependent
ADMINISTRATORU.S. Bancorp Fund Services, LLC615 East Michigan St.Milwaukee, Wis. 53202
CUSTODIANU.S. Bank, N.A.1555 North Rivercenter Drive, Suite 302Milwaukee, Wis. 53212
TRANSFER, DIVIDEND DISBURSING AND DIVIDEND REINVESTMENT PLAN AGENTComputershare Trust Company, N.A. / Computershare Inc.P.O. Box 43078Providence, R.I. 02940-3078(800) 426-5523www.computershare.com
LEGAL COUNSELHusch Blackwell LLP4801 Main St.Kansas City, Mo. 64112
INVESTOR RELATIONS(866) [email protected]
STOCk SyMBOLListed NYSE Symbol: TPZ This report is for stockholder information. This is not a prospectus intended for use in the purchase or sale of fund shares. Past performance is no guarantee of future results and your investment may be worth more or less at the time you sell.
Tortoise Capital Advisors’ Closed-end Funds
Broader Funds
Name Ticker Focus Total Assets(1) ($ in millions)
Tortoise Pipeline & Energy Fund, Inc.
TTP
NYSEL I S T E D Pipeline Equity $321
Tortoise Power and Energy Infrastructure Fund, Inc.
TPZ
NYSEL I S T E D
Power & Energy Infrastructure Debt & Dividend Paying Equity $215
Pureplay MLP Funds
Name Ticker Focus Total Assets(1) ($ in millions)
Tortoise Energy Infrastructure Corp.
TYG
NYSEL I S T E D Midstream Equity $1,614
Tortoise Energy Capital Corp.
TYY
NYSEL I S T E D Midstream Equity $826
Tortoise MLP Fund, Inc.
NTG
NYSEL I S T E D Natural Gas Equity $1,583
Tortoise North American Energy Corp.
TYN
NYSEL I S T E D Midstream/Upstream Equity $211
(1) As of 6/30/12

…Steady Wins®
Tortoise Capital Advisors, L.L.C.Investment Adviser to
Tortoise Power and Energy Infrastructure Fund, Inc.
11550 Ash Street, Suite 300 • Leawood, Kan. 66211 • (913) 981-1020 • (913) 981-1021 (fax) • www.tortoiseadvisors.com
To r t o i s e E n e rg y C a p i t a l C o r p .
SM
Tortoise Power and Energy Infrastructure Fund, Inc.
SM