Embed Size (px)
Citation preview
Manufacturing Process Reliability, Track 2
The Pursuit of Continuous
Improvement in Asset Management:
Merck, West Point’s Journey1
Mike Rose & Chris Gould, Merck & Co., Inc.
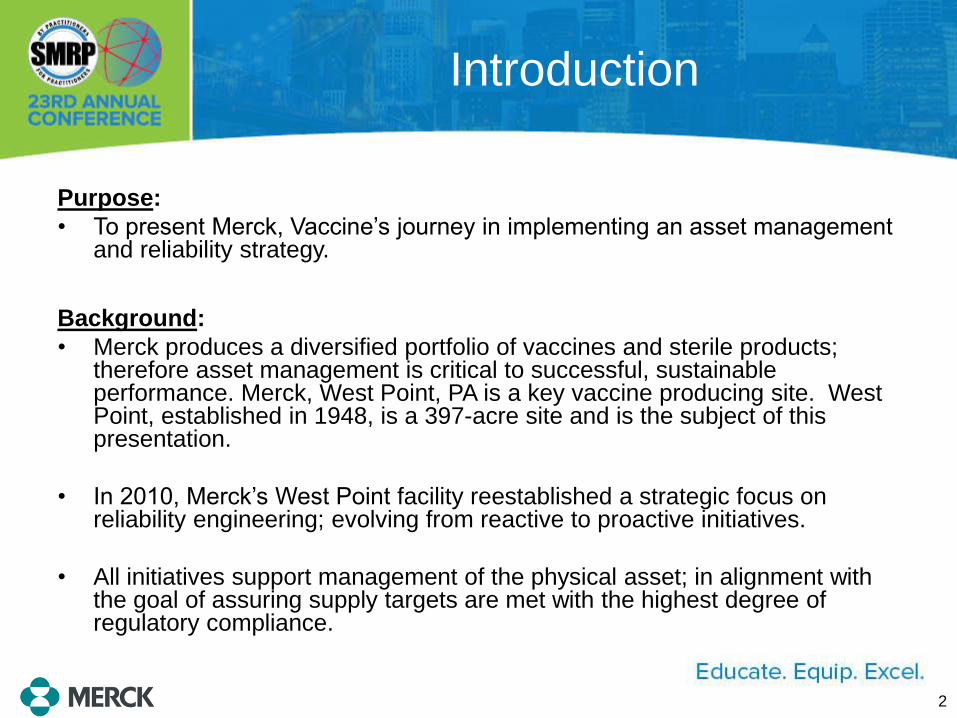
Introduction
Purpose:
• To present Merck, Vaccine’s journey in implementing an asset management and reliability strategy.
Background:
• Merck produces a diversified portfolio of vaccines and sterile products; therefore asset management is critical to successful, sustainable performance. Merck, West Point, PA is a key vaccine producing site. West Point, established in 1948, is a 397-acre site and is the subject of this presentation.
• In 2010, Merck’s West Point facility reestablished a strategic focus on reliability engineering; evolving from reactive to proactive initiatives.
• All initiatives support management of the physical asset; in alignment with the goal of assuring supply targets are met with the highest degree of regulatory compliance.
2
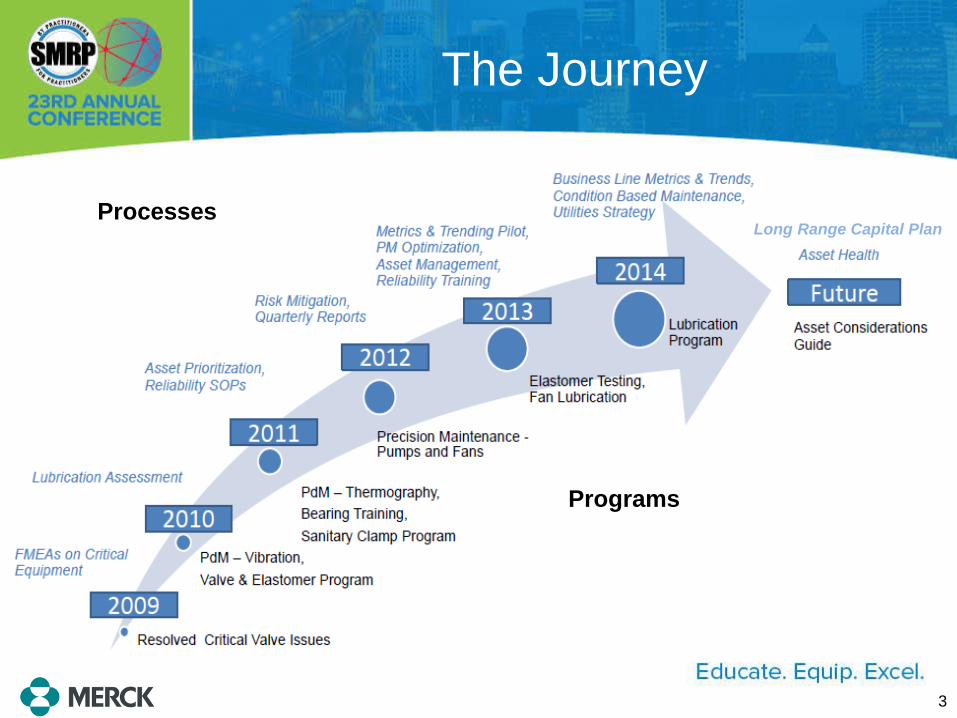
The Journey
Processes
Programs
3
Long Range Capital Plan
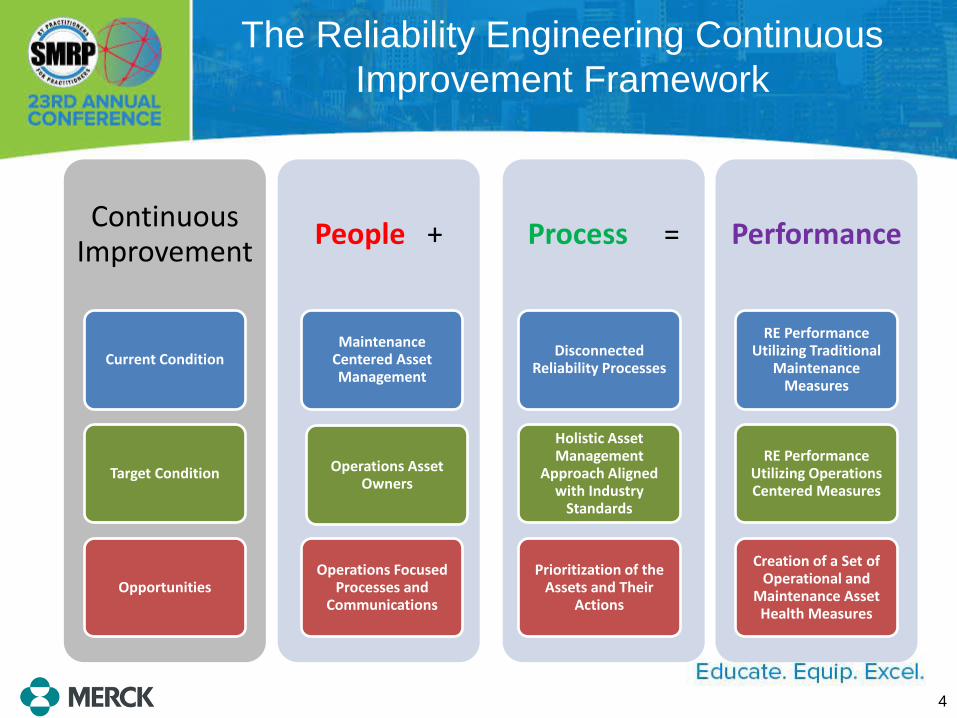
The Reliability Engineering Continuous
Improvement Framework
Continuous Improvement
Current Condition
Target Condition
Opportunities
People +
Maintenance Centered Asset Management
Operations Asset Owners
Operations Focused Processes and
Communications
Process =
Disconnected Reliability Processes
Holistic Asset Management
Approach Aligned with Industry
Standards
Prioritization of the Assets and Their
Actions
Performance
RE Performance Utilizing Traditional
Maintenance Measures
RE Performance Utilizing Operations Centered Measures
Creation of a Set of Operational and
Maintenance Asset Health Measures
4
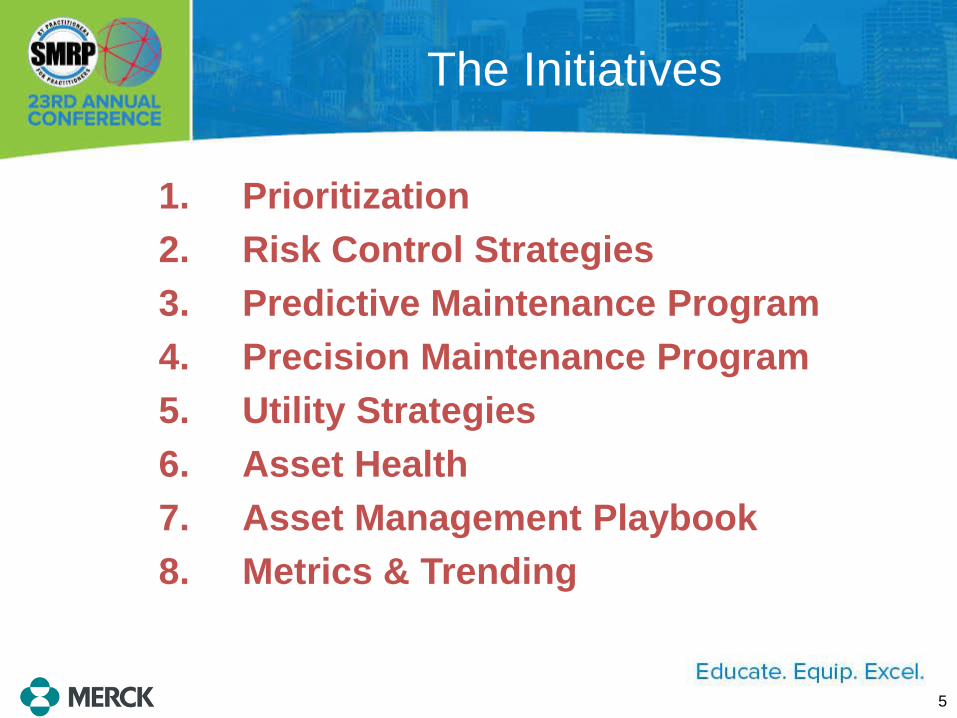
The Initiatives
1. Prioritization
2. Risk Control Strategies
3. Predictive Maintenance Program
4. Precision Maintenance Program
5. Utility Strategies
6. Asset Health
7. Asset Management Playbook
8. Metrics & Trending
5
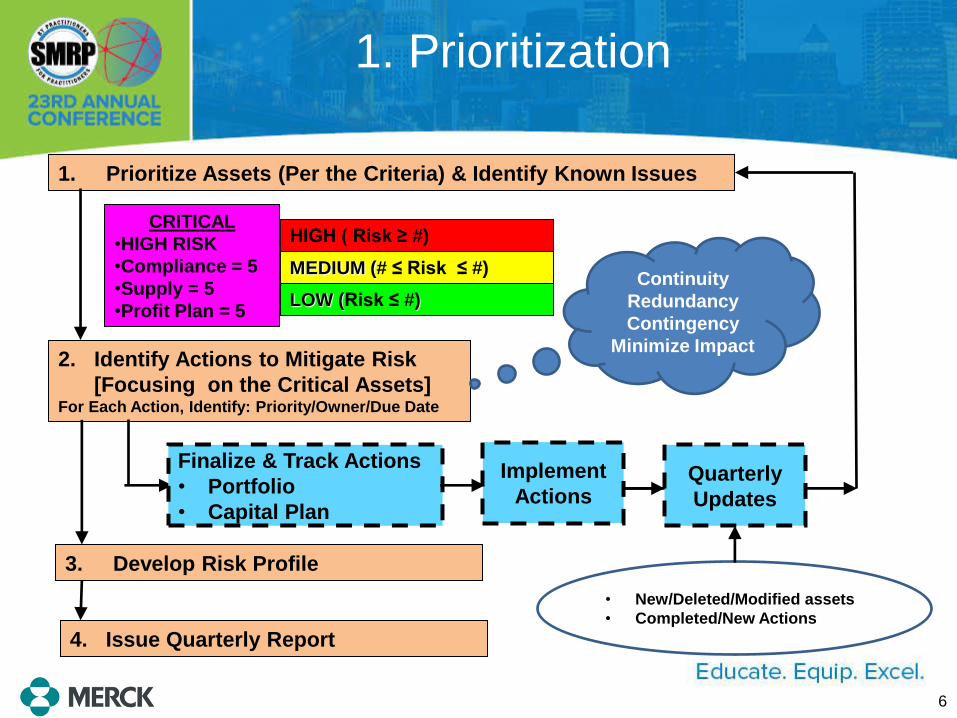
1. Prioritize Assets (Per the Criteria) & Identify Known Issues
2. Identify Actions to Mitigate Risk
[Focusing on the Critical Assets] For Each Action, Identify: Priority/Owner/Due Date
3. Develop Risk Profile
LOW (Risk ≤ #)
HIGH ( Risk ≥ #)
MEDIUM (# ≤ Risk ≤ #)
CRITICAL
•HIGH RISK
•Compliance = 5
•Supply = 5
•Profit Plan = 5
Finalize & Track Actions
• Portfolio
• Capital Plan
Implement
Actions
1. Prioritization
Continuity
Redundancy
Contingency
Minimize Impact
Quarterly
Updates
4. Issue Quarterly Report
• New/Deleted/Modified assets
• Completed/New Actions
6
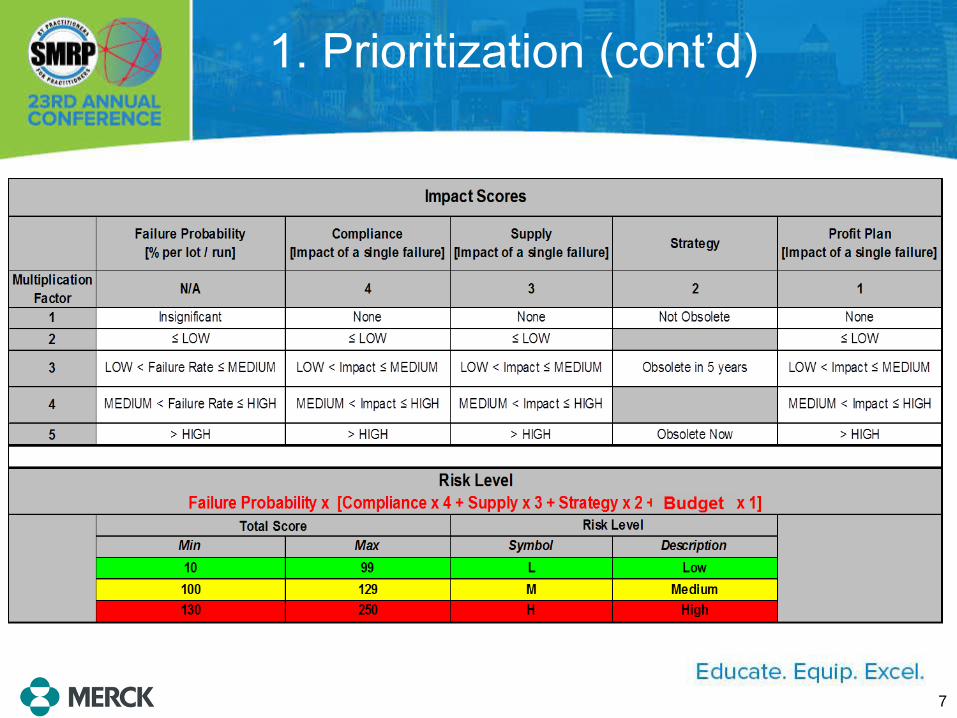
1. Prioritization (cont’d)
7
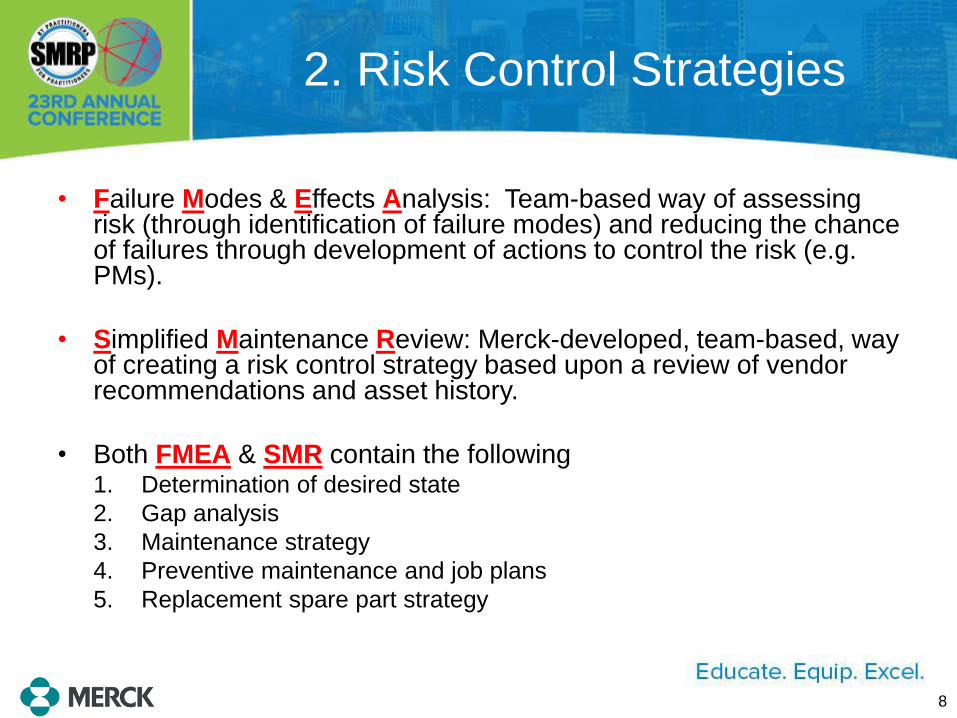
2. Risk Control Strategies
• Failure Modes & Effects Analysis: Team-based way of assessing risk (through identification of failure modes) and reducing the chance of failures through development of actions to control the risk (e.g. PMs).
• Simplified Maintenance Review: Merck-developed, team-based, way of creating a risk control strategy based upon a review of vendor recommendations and asset history.
• Both FMEA & SMR contain the following 1. Determination of desired state
2. Gap analysis
3. Maintenance strategy
4. Preventive maintenance and job plans
5. Replacement spare part strategy
8
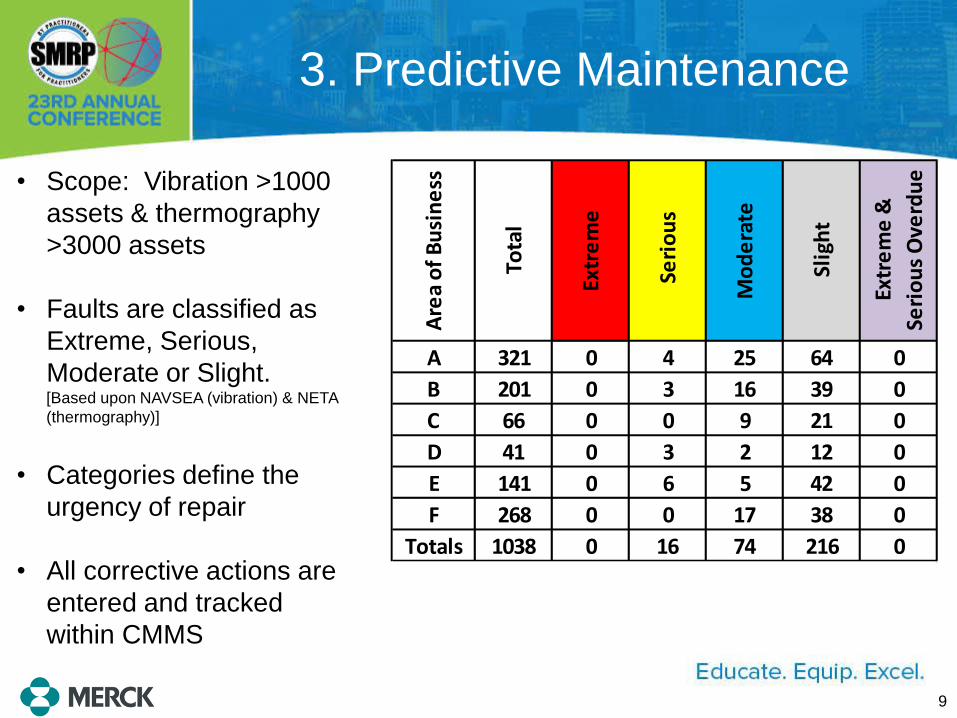
3. Predictive Maintenance
• Scope: Vibration >1000
assets & thermography
>3000 assets
• Faults are classified as
Extreme, Serious,
Moderate or Slight. [Based upon NAVSEA (vibration) & NETA
(thermography)]
• Categories define the
urgency of repair
• All corrective actions are
entered and tracked
within CMMS
Are
a o
f B
usi
ne
ss
Tota
l
Extr
em
e
Se
rio
us
Mo
de
rate
Slig
ht
Extr
em
e &
Seri
ou
s O
verd
ue
A 321 0 4 25 64 0
B 201 0 3 16 39 0
C 66 0 0 9 21 0
D 41 0 3 2 12 0
E 141 0 6 5 42 0
F 268 0 0 17 38 0
Totals 1038 0 16 74 216 0
9
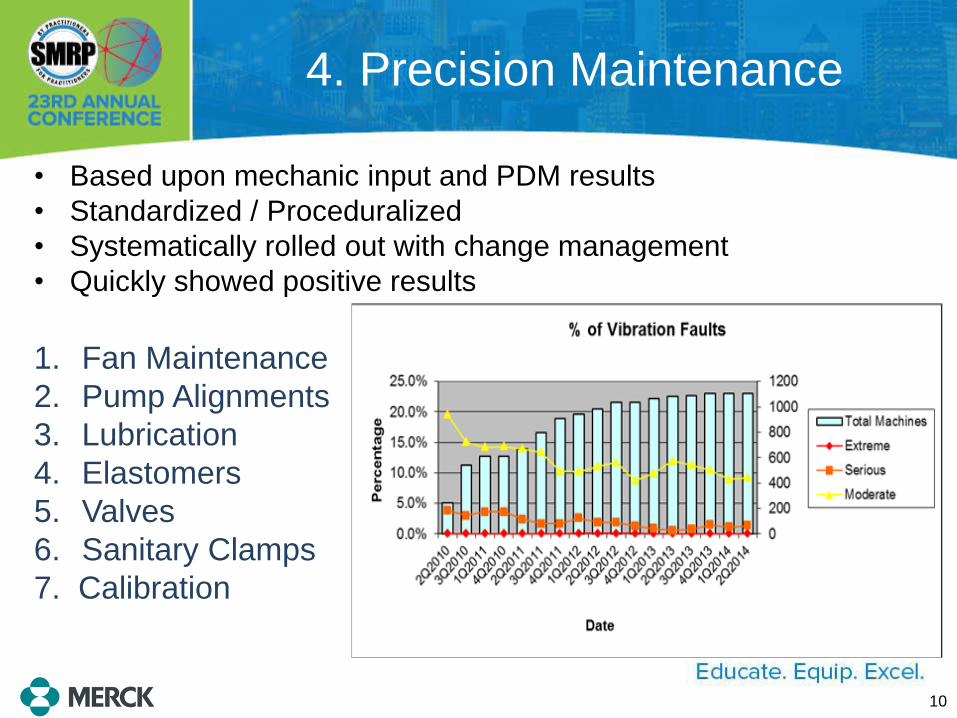
4. Precision Maintenance
• Based upon mechanic input and PDM results
• Standardized / Proceduralized
• Systematically rolled out with change management
• Quickly showed positive results
1. Fan Maintenance
2. Pump Alignments
3. Lubrication
4. Elastomers
5. Valves
6. Sanitary Clamps
7. Calibration
10
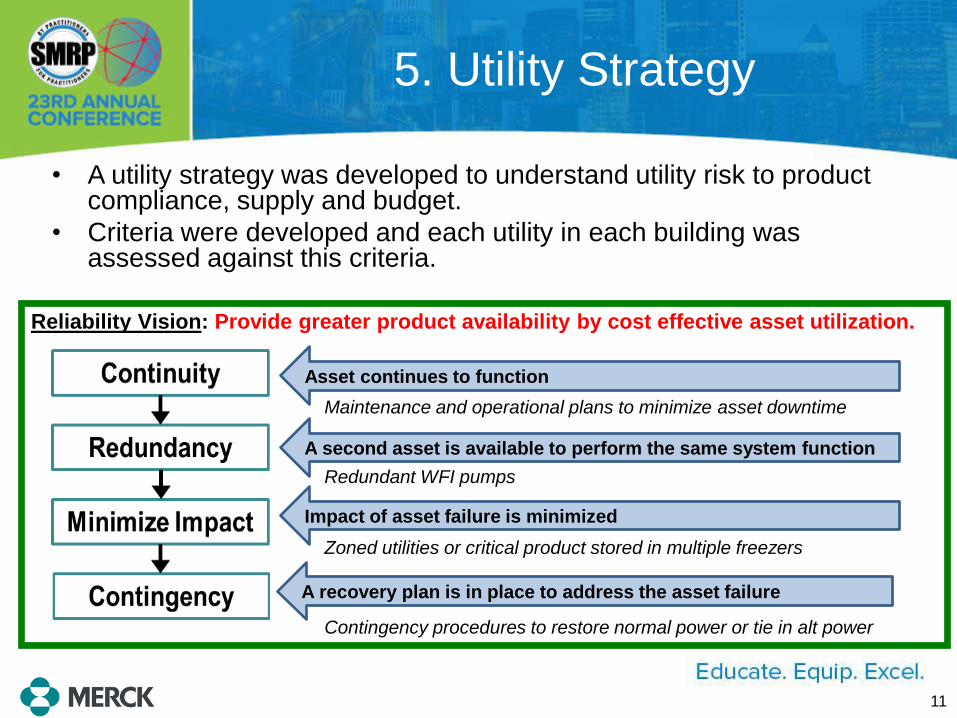
5. Utility Strategy
• A utility strategy was developed to understand utility risk to product compliance, supply and budget.
• Criteria were developed and each utility in each building was assessed against this criteria.
Reliability Vision: Provide greater product availability by cost effective asset utilization.
Maintenance and operational plans to minimize asset downtime
Redundant WFI pumps
Zoned utilities or critical product stored in multiple freezers
Contingency procedures to restore normal power or tie in alt power
Asset continues to function
A second asset is available to perform the same system function
Impact of asset failure is minimized
A recovery plan is in place to address the asset failure
11
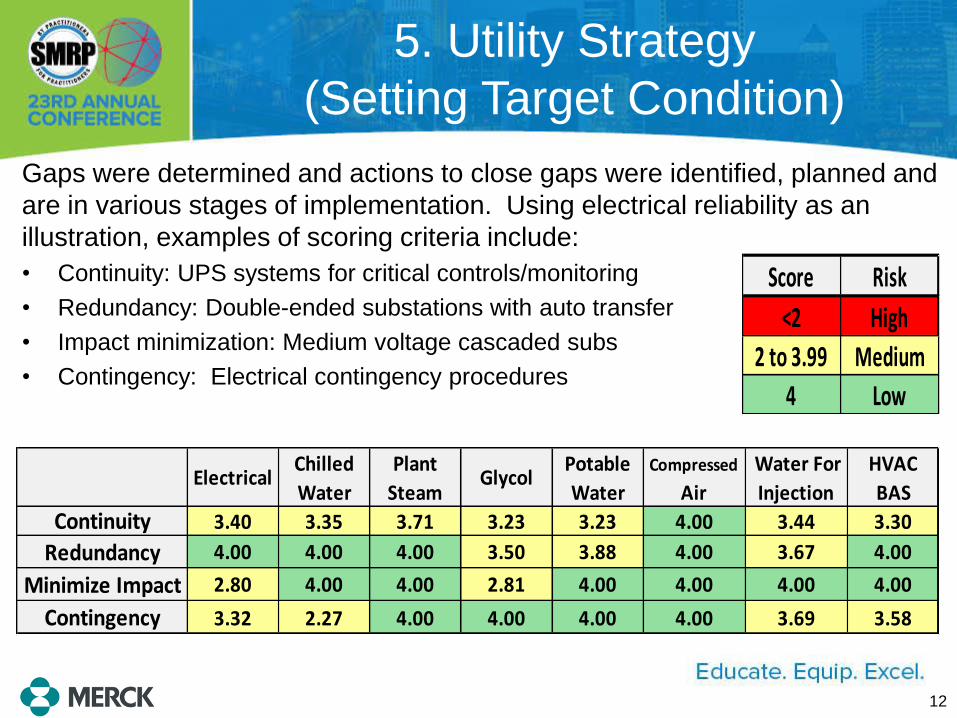
Gaps were determined and actions to close gaps were identified, planned and
are in various stages of implementation. Using electrical reliability as an
illustration, examples of scoring criteria include:
• Continuity: UPS systems for critical controls/monitoring
• Redundancy: Double-ended substations with auto transfer
• Impact minimization: Medium voltage cascaded subs
• Contingency: Electrical contingency procedures
5. Utility Strategy
(Setting Target Condition)
Score Risk
<2 High
2 to 3.99 Medium
4 Low
12
ElectricalChilled
Water
Plant
SteamGlycol
Potable
Water
Compressed
Air
Water For
Injection
HVAC
BAS
Continuity 3.40 3.35 3.71 3.23 3.23 4.00 3.44 3.30
Redundancy 4.00 4.00 4.00 3.50 3.88 4.00 3.67 4.00
Minimize Impact 2.80 4.00 4.00 2.81 4.00 4.00 4.00 4.00
Contingency 3.32 2.27 4.00 4.00 4.00 4.00 3.69 3.58
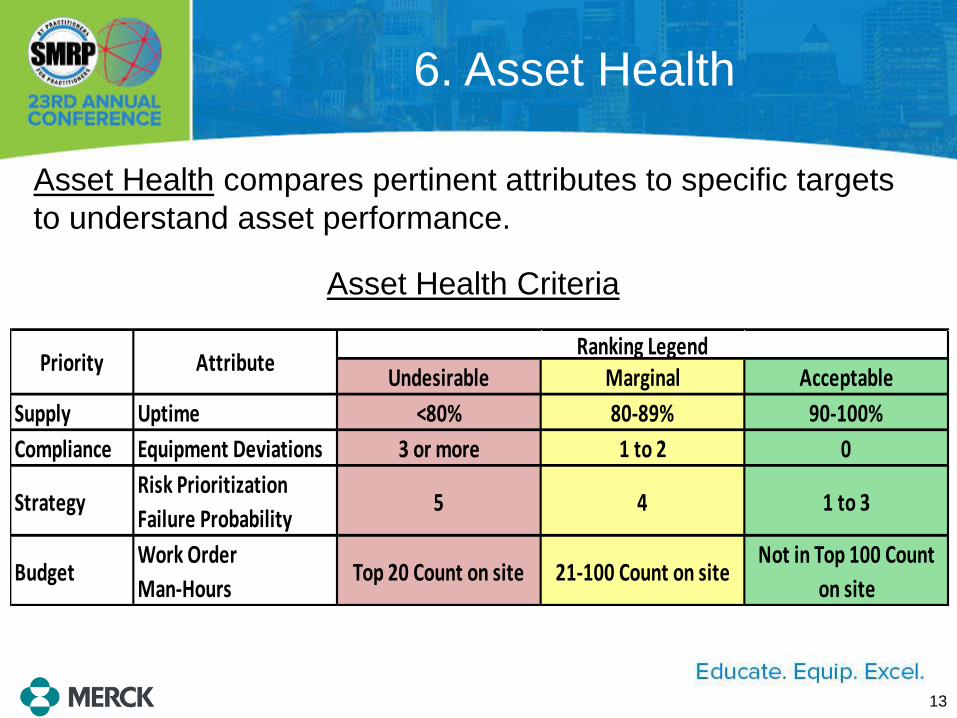
6. Asset Health
Asset Health compares pertinent attributes to specific targets
to understand asset performance.
Asset Health Criteria
Undesirable Marginal Acceptable
Supply Uptime <80% 80-89% 90-100%
Compliance Equipment Deviations 3 or more 1 to 2 0
StrategyRisk Prioritization
Failure Probability5 4 1 to 3
BudgetWork Order
Man-HoursTop 20 Count on site 21-100 Count on site
Not in Top 100 Count
on site
Ranking LegendAttributePriority
13
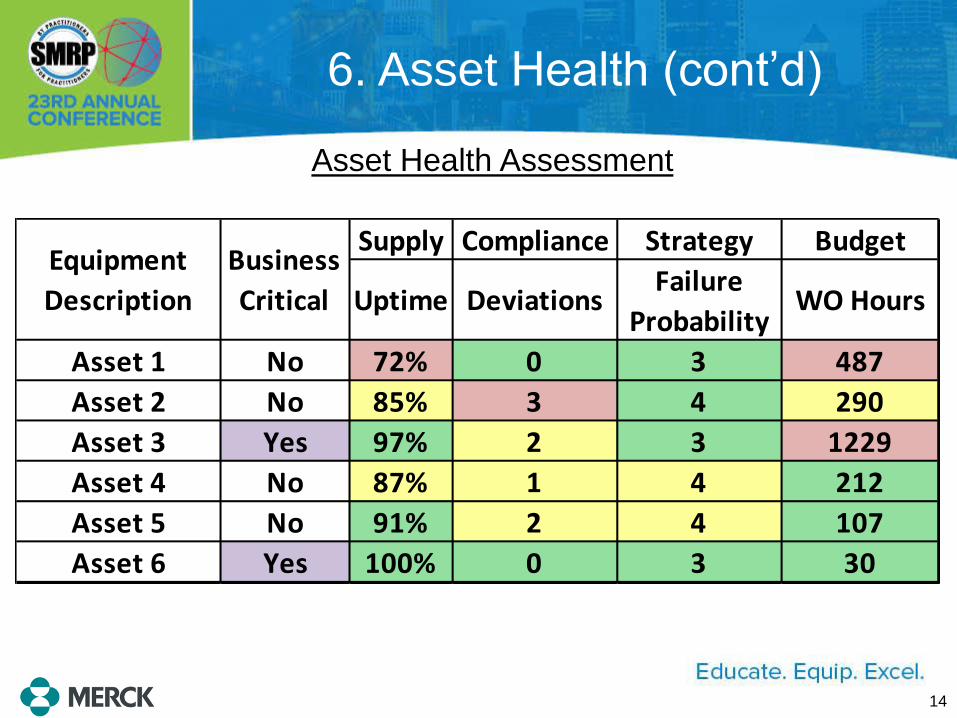
6. Asset Health (cont’d)
Asset Health Assessment
14
Supply Compliance Strategy Budget
Uptime DeviationsFailure
ProbabilityWO Hours
Asset 1 No 72% 0 3 487
Asset 2 No 85% 3 4 290
Asset 3 Yes 97% 2 3 1229
Asset 4 No 87% 1 4 212
Asset 5 No 91% 2 4 107
Asset 6 Yes 100% 0 3 30
Equipment
Description
Business
Critical
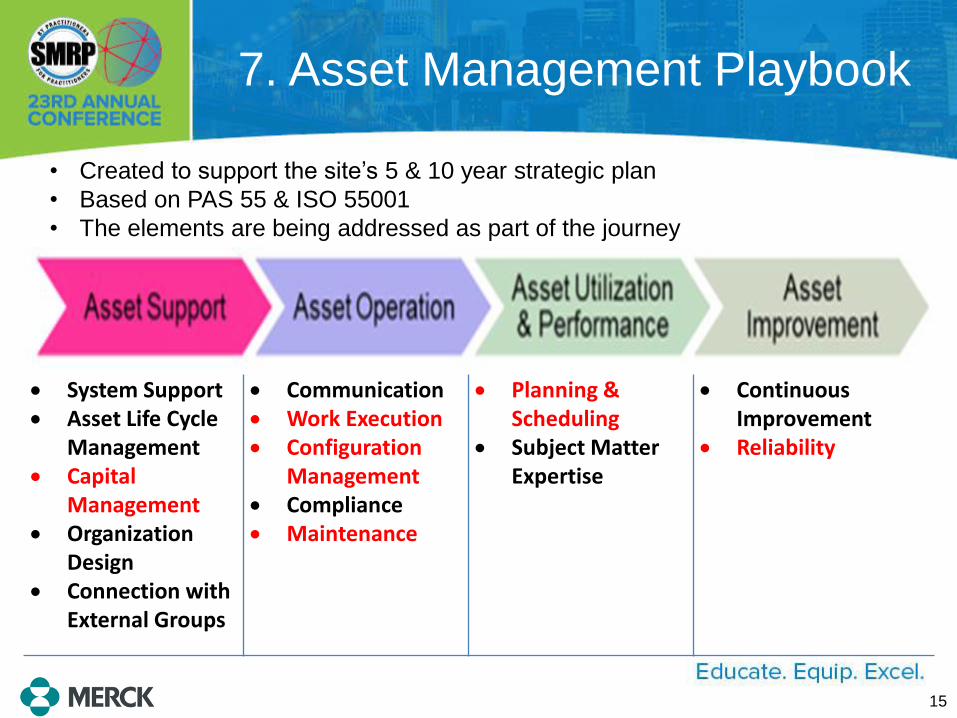
7. Asset Management Playbook
System Support Asset Life Cycle
Management Capital
Management Organization
Design Connection with
External Groups
Communication Work Execution Configuration
Management Compliance Maintenance
Planning & Scheduling
Subject Matter Expertise
Continuous Improvement
Reliability
• Created to support the site’s 5 & 10 year strategic plan
• Based on PAS 55 & ISO 55001
• The elements are being addressed as part of the journey
15
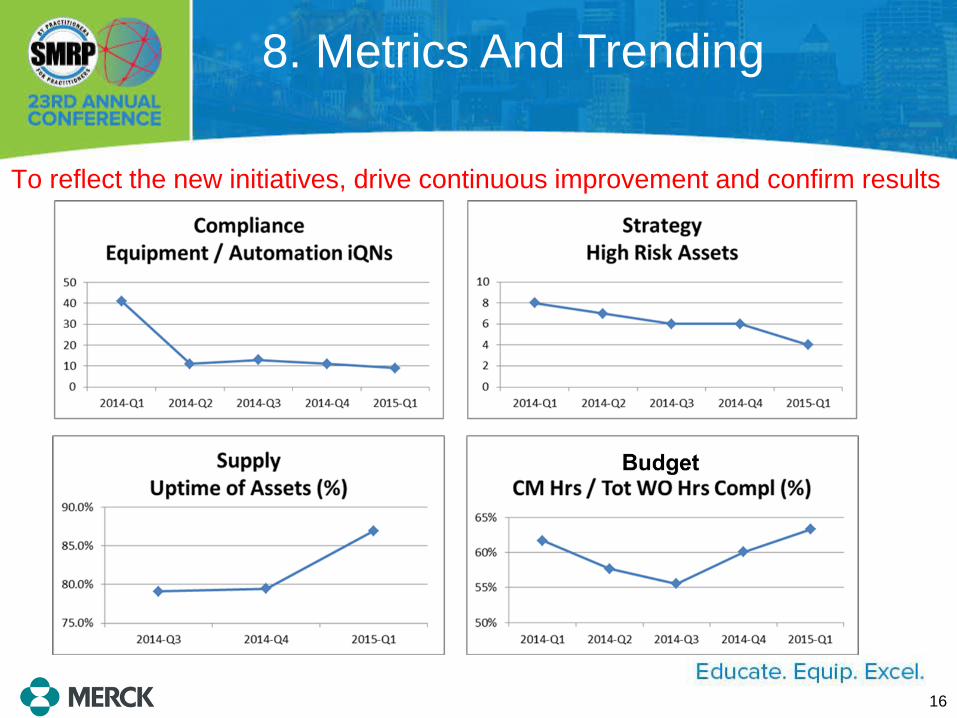
8. Metrics And Trending
To reflect the new initiatives, drive continuous improvement and confirm results
16
Budget
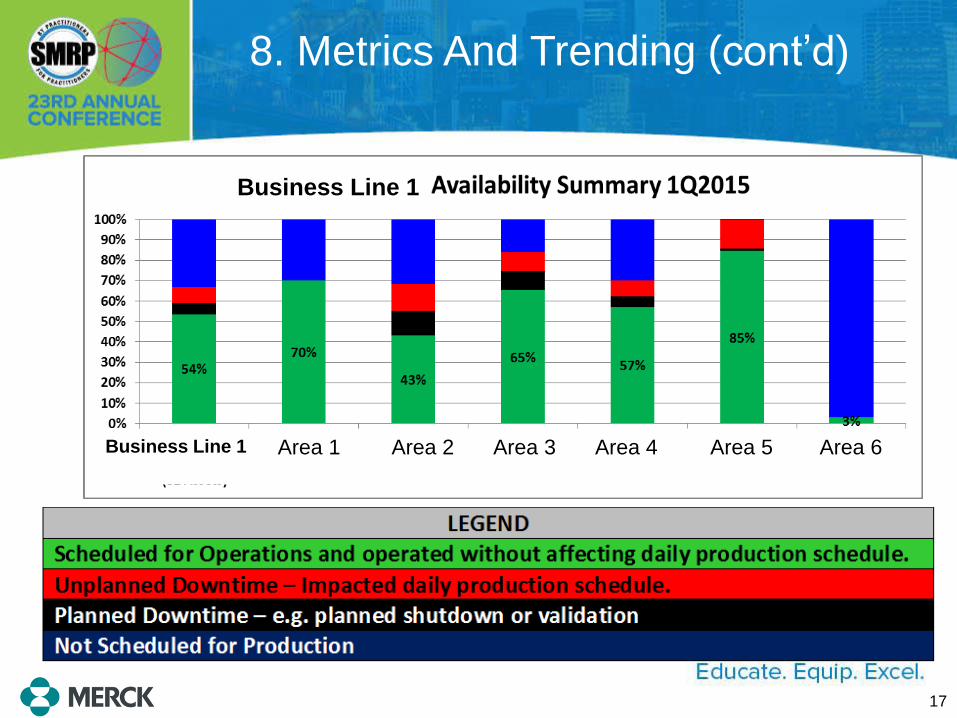
Area 1 Area 2 Area 3 Area 4 Area 5 Area 6
Business Line 1
Business Line 1
8. Metrics And Trending (cont’d)
17
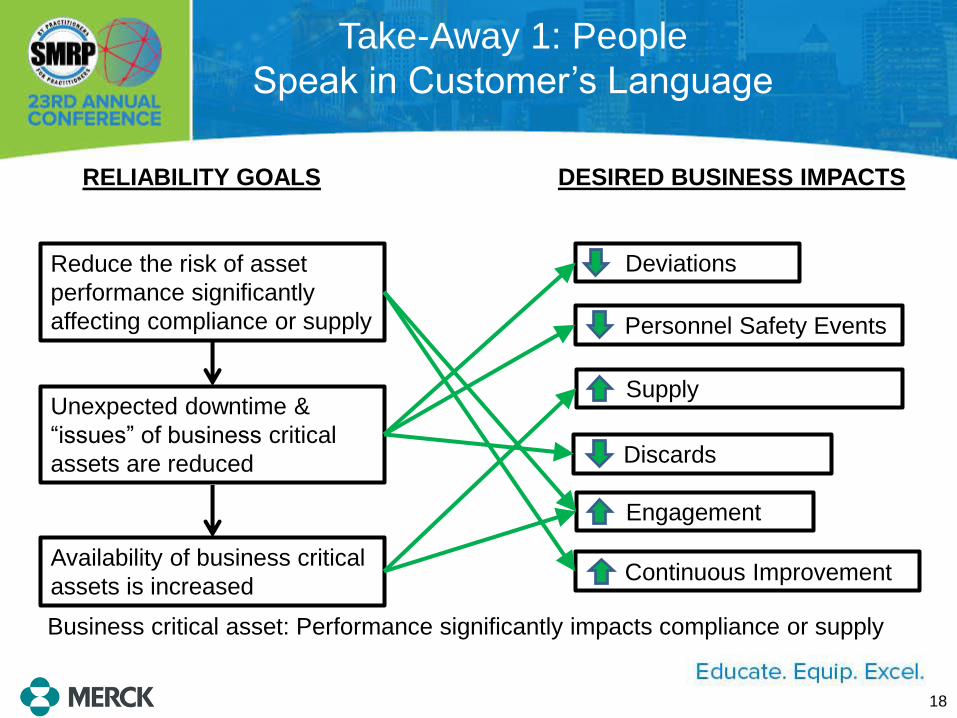
Reduce the risk of asset
performance significantly
affecting compliance or supply
Unexpected downtime &
“issues” of business critical
assets are reduced
Availability of business critical
assets is increased
Business critical asset: Performance significantly impacts compliance or supply
Deviations
Personnel Safety Events
Supply
Discards
Engagement
Continuous Improvement
RELIABILITY GOALS DESIRED BUSINESS IMPACTS
Take-Away 1: People
Speak in Customer’s Language
18
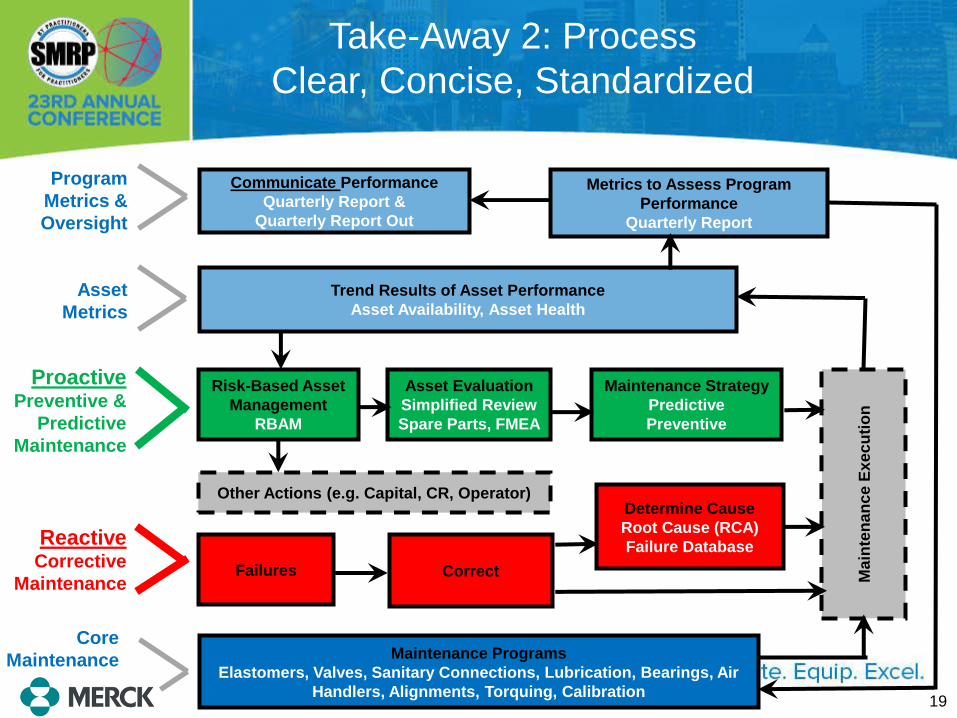
Risk-Based Asset
Management
RBAM
Reactive Corrective
Maintenance
Proactive
Preventive &
Predictive
Maintenance
Asset
Metrics
Program
Metrics &
Oversight
Ma
inte
na
nce
Ex
ec
uti
on
Asset Evaluation
Simplified Review
Spare Parts, FMEA
Determine Cause
Root Cause (RCA)
Failure Database
Failures Correct
Trend Results of Asset Performance
Asset Availability, Asset Health
Metrics to Assess Program
Performance
Quarterly Report
Maintenance Strategy
Predictive
Preventive
Communicate Performance
Quarterly Report &
Quarterly Report Out
Core
Maintenance Maintenance Programs
Elastomers, Valves, Sanitary Connections, Lubrication, Bearings, Air
Handlers, Alignments, Torquing, Calibration
Other Actions (e.g. Capital, CR, Operator)
Take-Away 2: Process
Clear, Concise, Standardized
19
Three high impact operational areas were evaluated for their performance over time with respect to deviations, transfers to inventory, proactive maintenance and total maintenance man-hours. All had similar results:
1. Reduced equipment/automation related deviations
2. Increased transfers
3. Improved ratio of preventative versus corrective maintenance
4. As expected, maintenance manpower was lagging. In two of three cases maintenance manpower decreased, but in one case the manpower had increased slightly.
Take-Away 3: Performance
Quantitative & Qualitative
20
Questions?
Reference 1: The Pursuit of Continuous Improvement in Asset Management: Merck, West
Point’s Journey, by Mike Rose & Chris Gould, Merck & Co. Inc., to be published in Uptime
Magazine
Chris Gould, Executive Director, Engineering [[email protected]]
Mike Rose, Associate Director, Engineering [[email protected]]
21