Embed Size (px)
Citation preview
Commissioned by the Missouri Department of Transportation
Tracker
Measure 5c
Prepared By:
Helping You Better
Understand Your StakeholdersSM
December 2012

Photos on the cover courtesy of MoDOT. All rights reserved by the Missouri Department of Transportation.
Final Report
Project Number: TR 13 1234
Assessing MoDOT’s Efforts to Provide the Right Transportation Solution
Tracker Measure 5c
Prepared for the Missouri Department of Transportation
December 2012
by
Helping You Better Understand Your StakeholdersSM
The opinions, findings, and conclusions expressed in this publication are those of the
principal investigator. They are not necessarily those of the Missouri Department of Transportation, the U.S. Department of Transportation or the Federal Highway
Administration. This report does not constitute a standard or regulation.
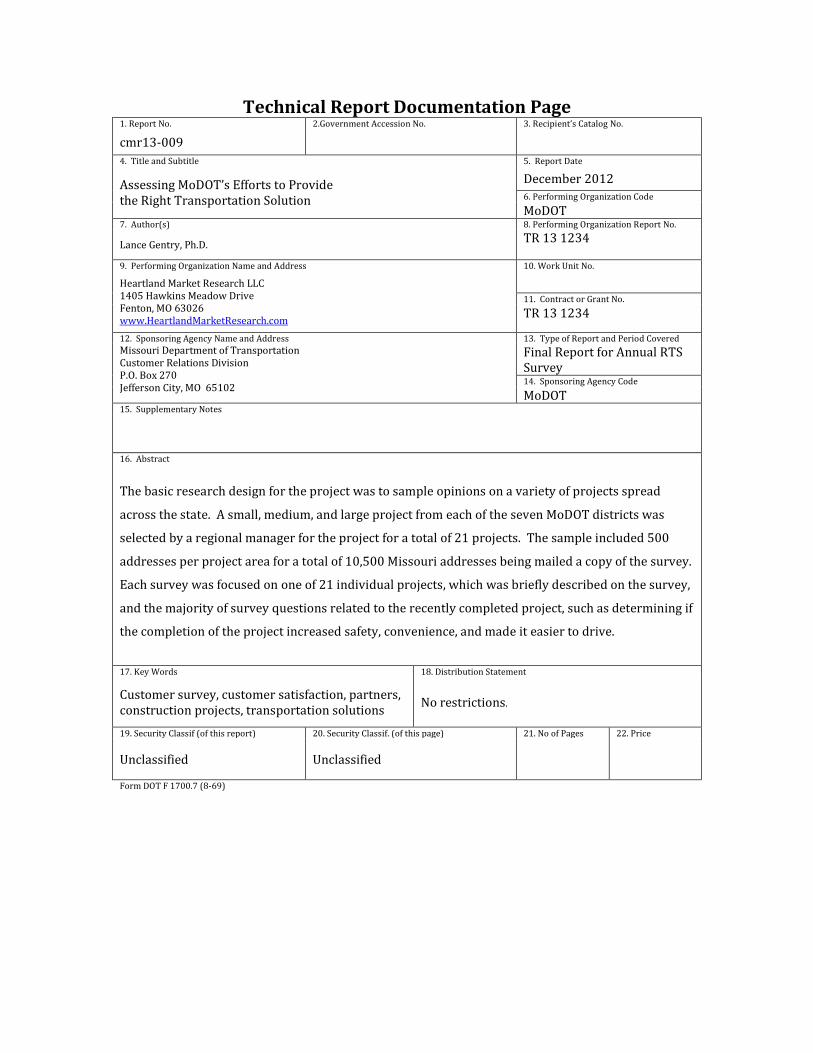
Technical Report Documentation Page 1. Report No. 2.Government Accession No. 3. Recipient’s Catalog No.
cmr13-009
4. Title and Subtitle 5. Report Date
Assessing MoDOT’s Efforts to Provide the Right Transportation Solution
December 2012 6. Performing Organization Code MoDOT
7. Author(s) 8. Performing Organization Report No.
Lance Gentry, Ph.D. TR 13 1234
9. Performing Organization Name and Address 10. Work Unit No.
Heartland Market Research LLC 1405 Hawkins Meadow Drive Fenton, MO 63026 www.HeartlandMarketResearch.com
11. Contract or Grant No. TR 13 1234
12. Sponsoring Agency Name and Address 13. Type of Report and Period Covered Missouri Department of Transportation Customer Relations Division P.O. Box 270 Jefferson City, MO 65102
Final Report for Annual RTS Survey 14. Sponsoring Agency Code
MoDOT 15. Supplementary Notes
16. Abstract
The basic research design for the project was to sample opinions on a variety of projects spread
across the state. A small, medium, and large project from each of the seven MoDOT districts was
selected by a regional manager for the project for a total of 21 projects. The sample included 500
addresses per project area for a total of 10,500 Missouri addresses being mailed a copy of the survey.
Each survey was focused on one of 21 individual projects, which was briefly described on the survey,
and the majority of survey questions related to the recently completed project, such as determining if
the completion of the project increased safety, convenience, and made it easier to drive.
17. Key Words 18. Distribution Statement
Customer survey, customer satisfaction, partners, construction projects, transportation solutions
No restrictions.
19. Security Classif (of this report) 20. Security Classif. (of this page) 21. No of Pages 22. Price
Unclassified Unclassified
Form DOT F 1700.7 (8-69)
The Right Transportation Solution
P a g e | i
Commissioned By: The Missouri Department of Transportation December 2012
TABLE OF CONTENTS
Table of Tables ................................................................................................................................ ii
Table of Figures .............................................................................................................................. iii
Executive Summary ........................................................................................................................ 1
Background and Methodology ........................................................................................................ 4
Project Descriptions and Locations ................................................................................................. 6
Respondents..................................................................................................................................... 9
Project Assessment ........................................................................................................................ 11
Safer .......................................................................................................................................... 13
Improving Traffic Flow in the Area .......................................................................................... 15
More Convenient ................................................................................................................... 15
Less Congested ...................................................................................................................... 17
Driving Environment ................................................................................................................ 19
Easier to Travel...................................................................................................................... 20
Better Marked ........................................................................................................................ 22
Accommodation for Bicyclists and Pedestrians ............................................................................ 24
Projects with Accommodations for Bicyclists and Pedestrians ................................................ 24
Projects with No Bicyclist/Pedestrian Component ................................................................... 28
Familiarity with Roadway ............................................................................................................. 34
The Right Transportation Solution ................................................................................................ 38
Respondent Property Loss ............................................................................................................. 41
The Right Priority .......................................................................................................................... 44
Gender ........................................................................................................................................... 47
Ethnicity ........................................................................................................................................ 50
New Questions .............................................................................................................................. 52
Project Awareness ..................................................................................................................... 52
Overall Satisfaction ................................................................................................................... 55
Summary ....................................................................................................................................... 58
Appendix A. Survey Instrument ................................................................................................... 59
Appendix B: Right Transportation Solution by Project ............................................................... 63
The Right Transportation Solution
P a g e | ii
Commissioned By: The Missouri Department of Transportation December 2012
TABLE OF TABLES
Table 1: Summary of Key Indicators by Project and District ........................................................ 2
Table 2: Project Descriptions ......................................................................................................... 6
Table 3: Gross Response Rate by Project and District ................................................................... 9
Table 4: Safety Feedback by Project and District ........................................................................ 14
Table 5: Convenience Feedback by Project and District .............................................................. 16
Table 6: Congestion Feedback by Project and District ................................................................ 18
Table 7: Easier to Drive Feedback by Project and District .......................................................... 21
Table 8: Better Marked Feedback by Project and District ........................................................... 23
Table 9: Bike/Pedestrian Accommodation – Meets Your Needs by District and Project ............ 24
Table 10: Bike/Pedestrian Accommodation – Is Safe by District and Project ............................. 26
Table 11: Bike/Pedestrian Accommodation – Is Easy to Use by District and Project ................. 27
Table 12: No Bicyclist/Pedestrian Component – Right Decision by District and Project ........... 28
Table 13: No Bicyclist/Pedestrian Component – Pedestrian Usage by District and Project ........ 30
Table 14: No Bicyclist/Pedestrian Component – Bicyclist Usage by District and Project .......... 32
Table 15: Familiarity with Roadway by District and Project ....................................................... 35
Table 16: Frequency of Roadway Use by District and Project .................................................... 37
Table 17: Right Transportation Solution by Project and District ................................................. 39
Table 18: Right Transportation Solution by Project Size ............................................................. 40
Table 19: Frequency of Respondents Who Lost Property to Project by District and Project ...... 42
Table 20: Cross Reference of Right Transportation Solution and Property Loss ........................ 43
Table 21: Cross Reference of Priority by Right Transportation Solution .................................... 46
Table 22: Respondent Gender by Project and District ................................................................. 48
Table 23: Cross Reference of Gender and Right Transportation Solution ................................... 49
Table 24: Ethnicity by Right Transportation Solution ................................................................. 51
Table 25: Project Awareness by Project and District ................................................................... 53
Table 26: Cross Reference of Project Awareness and Right Transportation Solution ................. 54
Table 27: Satisfaction by Project and District .............................................................................. 56
Table 28: Cross Reference of Satisfaction and Right Transportation Solution ............................ 57
Table 29: Project Margin of Error for RTS Measure ................................................................... 64
The Right Transportation Solution
P a g e | iii
Commissioned By: The Missouri Department of Transportation December 2012
TABLE OF FIGURES
Figure 1: Safer – Historical Comparison ...................................................................................... 13
Figure 2: Convenience – Historical Comparison ......................................................................... 15
Figure 3: Congestion – Historical Comparison ............................................................................ 17
Figure 4: Easier to Travel – Historical Comparison ..................................................................... 20
Figure 5: Better Marked – Historical Comparison ....................................................................... 22
Figure 6: Bike/Pedestrian Accommodation – Meets Your Needs ................................................ 25
Figure 7: Bike/Pedestrian Accommodation – Is Safe ................................................................... 26
Figure 8: Bike/Pedestrian Accommodation – Is Easy to Use ....................................................... 27
Figure 9: No Bicyclist/Pedestrian Component – Right Decision ................................................. 29
Figure 10: No Bicyclist/Pedestrian Component – Pedestrian Usage............................................ 31
Figure 11: No Bicyclist/Pedestrian Component – Bicyclist Usage .............................................. 33
Figure 12: Road Familiarity – Historical Comparison ................................................................. 34
Figure 13: Frequency of Use – Historical Comparison ................................................................ 36
Figure 14: Right Transportation Solution – Historical Comparison ............................................ 38
Figure 15: Property Loss – Historical Comparison ...................................................................... 41
Figure 16: Priority – Historical Comparison ................................................................................ 44
Figure 17: Priority Feedback by Project and District ................................................................... 45
Figure 18: Respondent Gender – Historical Comparison ............................................................. 47
Figure 19: Respondent Ethnicity .................................................................................................. 50
Figure 20: Project Awareness ....................................................................................................... 52
Figure 21: Satisfaction .................................................................................................................. 55
Figure 22: Northwest District ....................................................................................................... 65
Figure 23: Northeast District ........................................................................................................ 65
Figure 24: Kansas City District .................................................................................................... 66
Figure 25: Central District ............................................................................................................ 66
Figure 26: St. Louis District ......................................................................................................... 67
Figure 27: Southwest District ....................................................................................................... 67
Figure 28: Southeast District ........................................................................................................ 68
The Right Transportation Solution
P a g e | 1
Commissioned By: The Missouri Department of Transportation December 2012
EXECUTIVE SUMMARY
The Missouri Department of Transportation (MoDOT) has developed the Tracker
system to assess performance with tangible results to help MoDOT “provide a
world-class transportation system that delights our customers.” The Tracker system
includes the concept of “Fast projects that are of great value,” and an important
aspect of this measure is whether Missourians view MoDOT projects as the right
transportation solution. To assess customer satisfaction with MoDOT projects, a
mail survey was conducted in late 2012 by Heartland Market Research LLC. 1,537
respondents returned a valid survey questionnaire so the general margin of error for
the analysis is plus or minus 2.55 percent. These results are similar to that of the
three previous years.
The basic research design for the project was to sample opinions on a variety of
projects spread across the state as was done in the previous fiscal year. A small,
medium, and large project from each of the seven MoDOT districts was selected by
a regional manager for the project for a total of 21 projects. Then Heartland drew a
sample of residents from one or more ZIP code areas as appropriate for each project
which was reviewed by the appropriate MoDOT district. The sample included 500
addresses per project area for a total of 10,500 Missouri addresses being mailed a
copy of the survey. Despite this effort to keep the number of addresses even across
the districts and projects, the response rate varied by project area.
Each survey was focused on one of 21 individual projects, which was briefly
described on the survey, and the majority of survey questions related to the recently
completed project, such as determining if the completion of the project increased
safety, convenience, and made it easier to drive. In addition, questions were asked
about the overall value of the particular project and the respondents were given the
opportunity to provide comments regarding the project.
The Right Transportation Solution
P a g e | 2
Commissioned By: The Missouri Department of Transportation December 2012
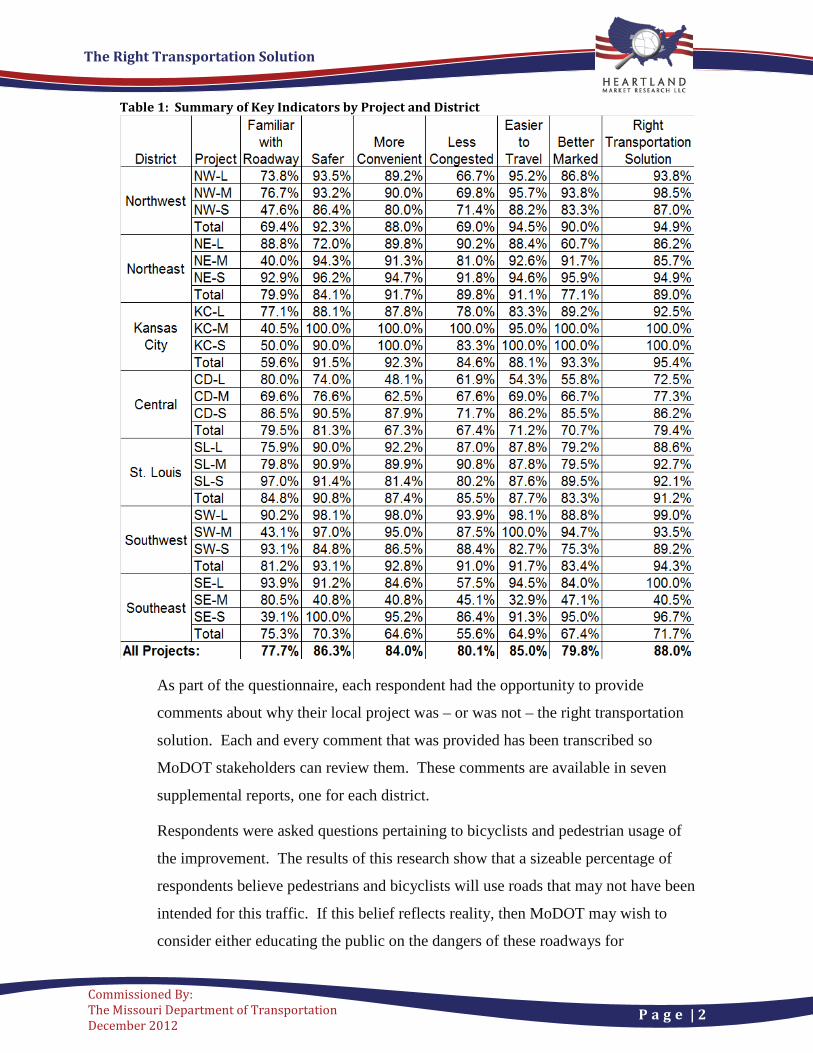
Table 1: Summary of Key Indicators by Project and District
As part of the questionnaire, each respondent had the opportunity to provide
comments about why their local project was – or was not – the right transportation
solution. Each and every comment that was provided has been transcribed so
MoDOT stakeholders can review them. These comments are available in seven
supplemental reports, one for each district.
Respondents were asked questions pertaining to bicyclists and pedestrian usage of
the improvement. The results of this research show that a sizeable percentage of
respondents believe pedestrians and bicyclists will use roads that may not have been
intended for this traffic. If this belief reflects reality, then MoDOT may wish to
consider either educating the public on the dangers of these roadways for
The Right Transportation Solution
P a g e | 3
Commissioned By: The Missouri Department of Transportation December 2012
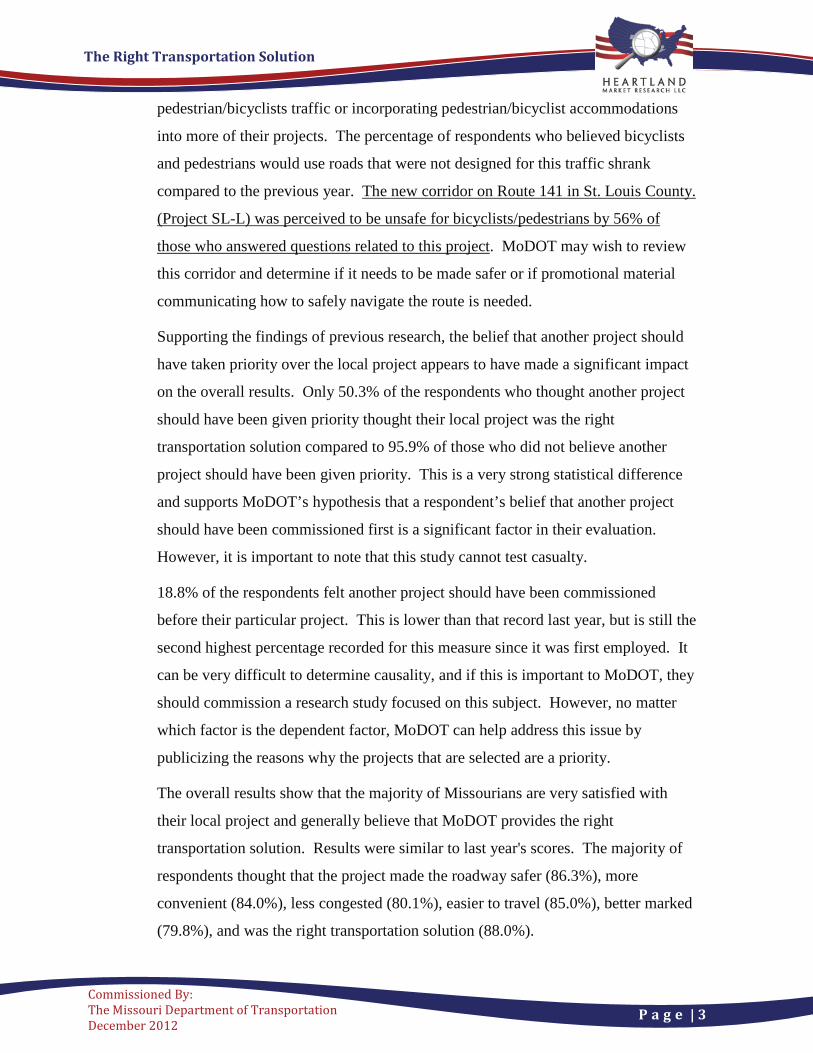
pedestrian/bicyclists traffic or incorporating pedestrian/bicyclist accommodations
into more of their projects. The percentage of respondents who believed bicyclists
and pedestrians would use roads that were not designed for this traffic shrank
compared to the previous year. The new corridor on Route 141 in St. Louis County.
(Project SL-L) was perceived to be unsafe for bicyclists/pedestrians by 56% of
those who answered questions related to this project. MoDOT may wish to review
this corridor and determine if it needs to be made safer or if promotional material
communicating how to safely navigate the route is needed.
Supporting the findings of previous research, the belief that another project should
have taken priority over the local project appears to have made a significant impact
on the overall results. Only 50.3% of the respondents who thought another project
should have been given priority thought their local project was the right
transportation solution compared to 95.9% of those who did not believe another
project should have been given priority. This is a very strong statistical difference
and supports MoDOT’s hypothesis that a respondent’s belief that another project
should have been commissioned first is a significant factor in their evaluation.
However, it is important to note that this study cannot test casualty.
18.8% of the respondents felt another project should have been commissioned
before their particular project. This is lower than that record last year, but is still the
second highest percentage recorded for this measure since it was first employed. It
can be very difficult to determine causality, and if this is important to MoDOT, they
should commission a research study focused on this subject. However, no matter
which factor is the dependent factor, MoDOT can help address this issue by
publicizing the reasons why the projects that are selected are a priority.
The overall results show that the majority of Missourians are very satisfied with
their local project and generally believe that MoDOT provides the right
transportation solution. Results were similar to last year's scores. The majority of
respondents thought that the project made the roadway safer (86.3%), more
convenient (84.0%), less congested (80.1%), easier to travel (85.0%), better marked
(79.8%), and was the right transportation solution (88.0%).
The Right Transportation Solution
P a g e | 4
Commissioned By: The Missouri Department of Transportation December 2012
BACKGROUND AND METHODOLOGY
MoDOT’s mission is to “provide a world-class transportation system that delights
our customers.” The public’s perception of MoDOT’s performance is crucial to the
long-term success of the agency, and an important aspect of the Tracker measure is
whether Missouri citizens view MoDOT projects as the right transportation
solution. The Tracker system assesses tangible results related to MoDOT’s
mission, and one of the tangible results is the concept of “Fast projects that are of
great value.” An element of this measure is an assessment of customer satisfaction
with these projects.
In the fall of 2006, MoDOT commissioned the Institute of Public Policy at the
University of Missouri Columbia to design and implement a new survey to measure
and capture this measure. This was done and a report was provided to MoDOT in
January 2007. The introduction to this section is from that report. In the fall of
2007, MoDOT commissioned Heartland Market Research LLC to implement the
same survey with a new set of projects. The intention was to model the FY08’s
survey and methodology on the previous experience, and also make incremental
improvements where feasible.
In FY09, the survey was significantly revised based on the experience from the
previous year. The key questions were kept, but many of the auxiliary questions
(such as Approximately how many miles do you drive per year?) were dropped as
they had not proved to be key factors in respondent satisfaction. This survey space
was reclaimed for three new survey questions, including a request of respondents to
comment directly. The new questionnaire worked well, so the same questions were
used in FY10. In FY11, some additional questions were added to the questionnaire.
Respondent comments are available in seven supplemental reports, one for each
district. FY12 was the first year that the RTS measure was conducted using the
seven new districts resulting from MoDOT’s reorganization. To keep the statewide
margin of error similar to that of previous years, 500 surveys were mailed to each of
the 21 projects for a total of 10,500 surveys. This is a per project increase of 100,
The Right Transportation Solution
P a g e | 5
Commissioned By: The Missouri Department of Transportation December 2012
but the total number of surveys mailed slightly decreased (in previous years, 400
surveys were mailed to each of the 30 projects over the 10 traditional districts for a
total of 12,000 surveys). This increase in the number of surveys mailed per project
should slightly decrease the margins of error for each project and district. A similar
methodology was employed for FY13.
The sample of 500 people per project was initially selected by Heartland Market
Research based upon geographical assumptions about which people would be likely
to be most familiar with the project. The zip code recommendations were then
reviewed by each of the seven MoDOT districts for input. In several cases the zip
code selections were then revised based upon input from the districts.
In FY13, two additional questions were added to the survey. A question was added
to investigate when people first learned about the project. Another question was
added to measure citizens’ overall satisfaction with the project. Previous studies
used the right transportation solution question (Question 8 on this year’s survey) as
a proxy for satisfaction. The additional of a satisfaction question (Question 9 on
this year’s survey) provided the means for testing this assumption.
The Right Transportation Solution
P a g e | 6
Commissioned By: The Missouri Department of Transportation December 2012
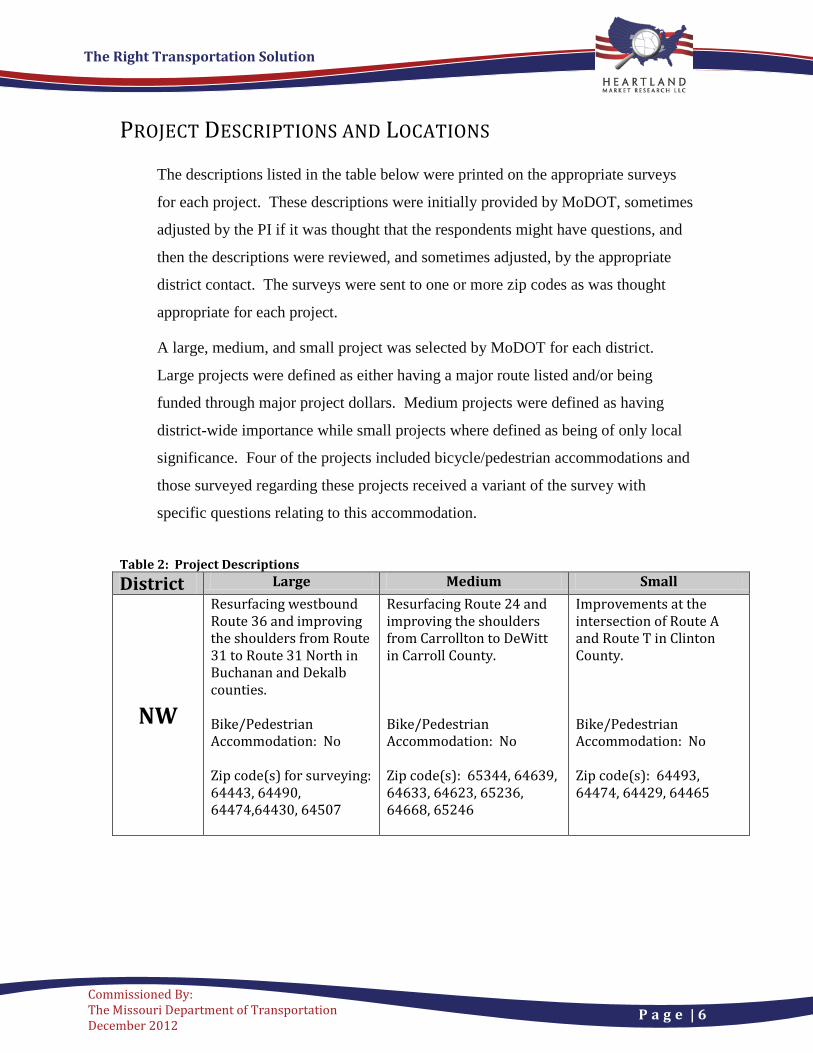
PROJECT DESCRIPTIONS AND LOCATIONS
The descriptions listed in the table below were printed on the appropriate surveys
for each project. These descriptions were initially provided by MoDOT, sometimes
adjusted by the PI if it was thought that the respondents might have questions, and
then the descriptions were reviewed, and sometimes adjusted, by the appropriate
district contact. The surveys were sent to one or more zip codes as was thought
appropriate for each project.
A large, medium, and small project was selected by MoDOT for each district.
Large projects were defined as either having a major route listed and/or being
funded through major project dollars. Medium projects were defined as having
district-wide importance while small projects where defined as being of only local
significance. Four of the projects included bicycle/pedestrian accommodations and
those surveyed regarding these projects received a variant of the survey with
specific questions relating to this accommodation.
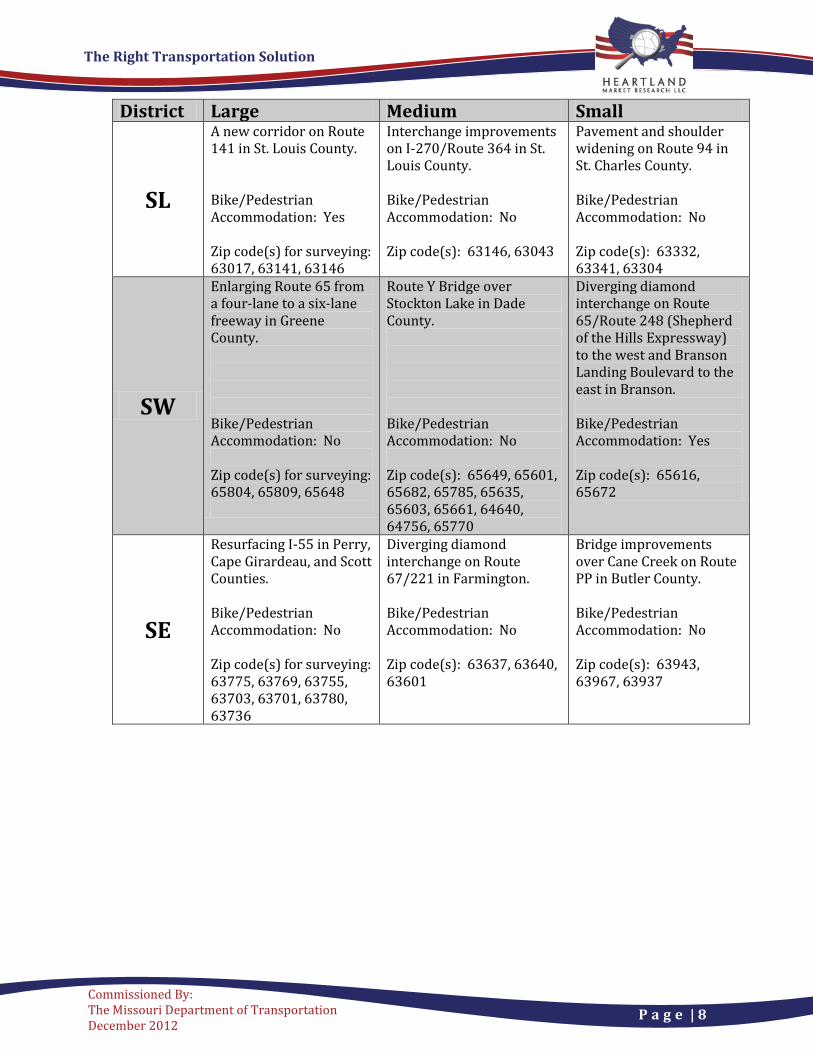
Table 2: Project Descriptions District Large Medium Small
NW
Resurfacing westbound Route 36 and improving the shoulders from Route 31 to Route 31 North in Buchanan and Dekalb counties. Bike/Pedestrian Accommodation: No Zip code(s) for surveying: 64443, 64490, 64474,64430, 64507
Resurfacing Route 24 and improving the shoulders from Carrollton to DeWitt in Carroll County. Bike/Pedestrian Accommodation: No Zip code(s): 65344, 64639, 64633, 64623, 65236, 64668, 65246
Improvements at the intersection of Route A and Route T in Clinton County. Bike/Pedestrian Accommodation: No Zip code(s): 64493, 64474, 64429, 64465
The Right Transportation Solution
P a g e | 7
Commissioned By: The Missouri Department of Transportation December 2012
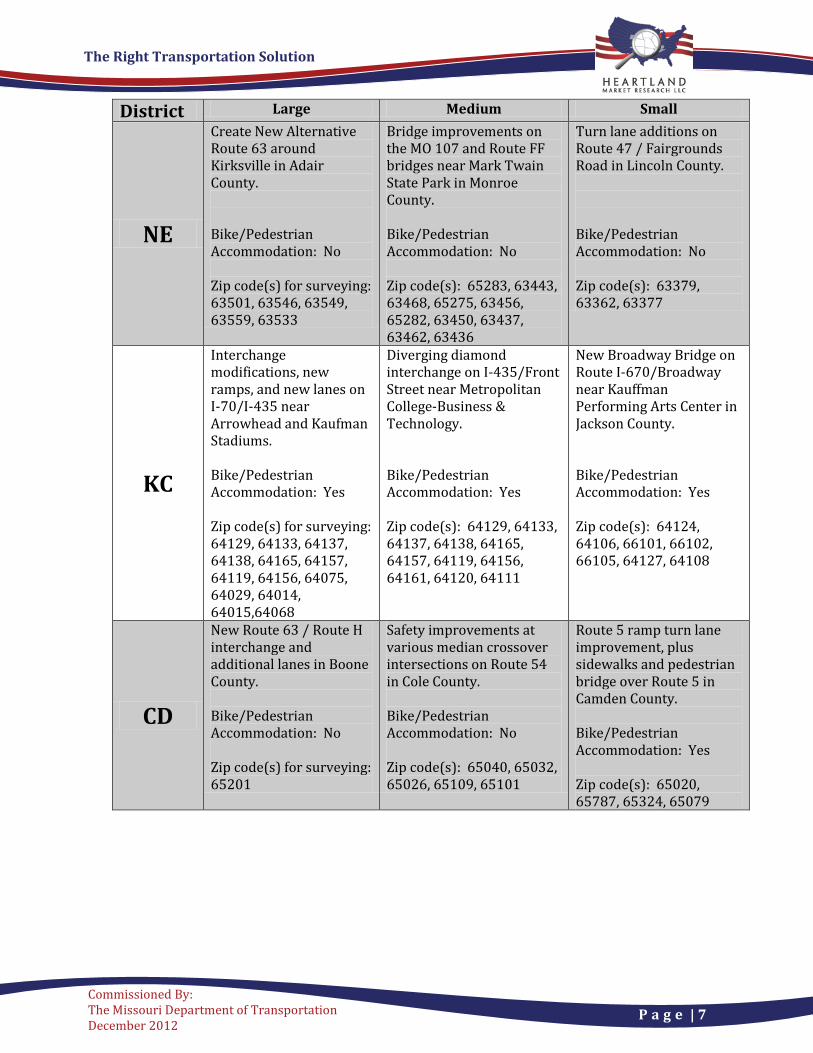
District Large Medium Small
NE
Create New Alternative Route 63 around Kirksville in Adair County. Bike/Pedestrian Accommodation: No Zip code(s) for surveying: 63501, 63546, 63549, 63559, 63533
Bridge improvements on the MO 107 and Route FF bridges near Mark Twain State Park in Monroe County. Bike/Pedestrian Accommodation: No Zip code(s): 65283, 63443, 63468, 65275, 63456, 65282, 63450, 63437, 63462, 63436
Turn lane additions on Route 47 / Fairgrounds Road in Lincoln County. Bike/Pedestrian Accommodation: No Zip code(s): 63379, 63362, 63377
KC
Interchange modifications, new ramps, and new lanes on I-70/I-435 near Arrowhead and Kaufman Stadiums. Bike/Pedestrian Accommodation: Yes Zip code(s) for surveying: 64129, 64133, 64137, 64138, 64165, 64157, 64119, 64156, 64075, 64029, 64014, 64015,64068
Diverging diamond interchange on I-435/Front Street near Metropolitan College-Business & Technology. Bike/Pedestrian Accommodation: Yes Zip code(s): 64129, 64133, 64137, 64138, 64165, 64157, 64119, 64156, 64161, 64120, 64111
New Broadway Bridge on Route I-670/Broadway near Kauffman Performing Arts Center in Jackson County. Bike/Pedestrian Accommodation: Yes Zip code(s): 64124, 64106, 66101, 66102, 66105, 64127, 64108
CD
New Route 63 / Route H interchange and additional lanes in Boone County. Bike/Pedestrian Accommodation: No Zip code(s) for surveying: 65201
Safety improvements at various median crossover intersections on Route 54 in Cole County. Bike/Pedestrian Accommodation: No Zip code(s): 65040, 65032, 65026, 65109, 65101
Route 5 ramp turn lane improvement, plus sidewalks and pedestrian bridge over Route 5 in Camden County. Bike/Pedestrian Accommodation: Yes Zip code(s): 65020, 65787, 65324, 65079
The Right Transportation Solution
P a g e | 8
Commissioned By: The Missouri Department of Transportation December 2012
District Large Medium Small
SL
A new corridor on Route 141 in St. Louis County. Bike/Pedestrian Accommodation: Yes Zip code(s) for surveying: 63017, 63141, 63146
Interchange improvements on I-270/Route 364 in St. Louis County. Bike/Pedestrian Accommodation: No Zip code(s): 63146, 63043
Pavement and shoulder widening on Route 94 in St. Charles County. Bike/Pedestrian Accommodation: No Zip code(s): 63332, 63341, 63304
SW
Enlarging Route 65 from a four-lane to a six-lane freeway in Greene County. Bike/Pedestrian Accommodation: No Zip code(s) for surveying: 65804, 65809, 65648
Route Y Bridge over Stockton Lake in Dade County. Bike/Pedestrian Accommodation: No Zip code(s): 65649, 65601, 65682, 65785, 65635, 65603, 65661, 64640, 64756, 65770
Diverging diamond interchange on Route 65/Route 248 (Shepherd of the Hills Expressway) to the west and Branson Landing Boulevard to the east in Branson. Bike/Pedestrian Accommodation: Yes Zip code(s): 65616, 65672
SE
Resurfacing I-55 in Perry, Cape Girardeau, and Scott Counties. Bike/Pedestrian Accommodation: No Zip code(s) for surveying: 63775, 63769, 63755, 63703, 63701, 63780, 63736
Diverging diamond interchange on Route 67/221 in Farmington. Bike/Pedestrian Accommodation: No Zip code(s): 63637, 63640, 63601
Bridge improvements over Cane Creek on Route PP in Butler County. Bike/Pedestrian Accommodation: No Zip code(s): 63943, 63967, 63937
The Right Transportation Solution
P a g e | 9
Commissioned By: The Missouri Department of Transportation December 2012
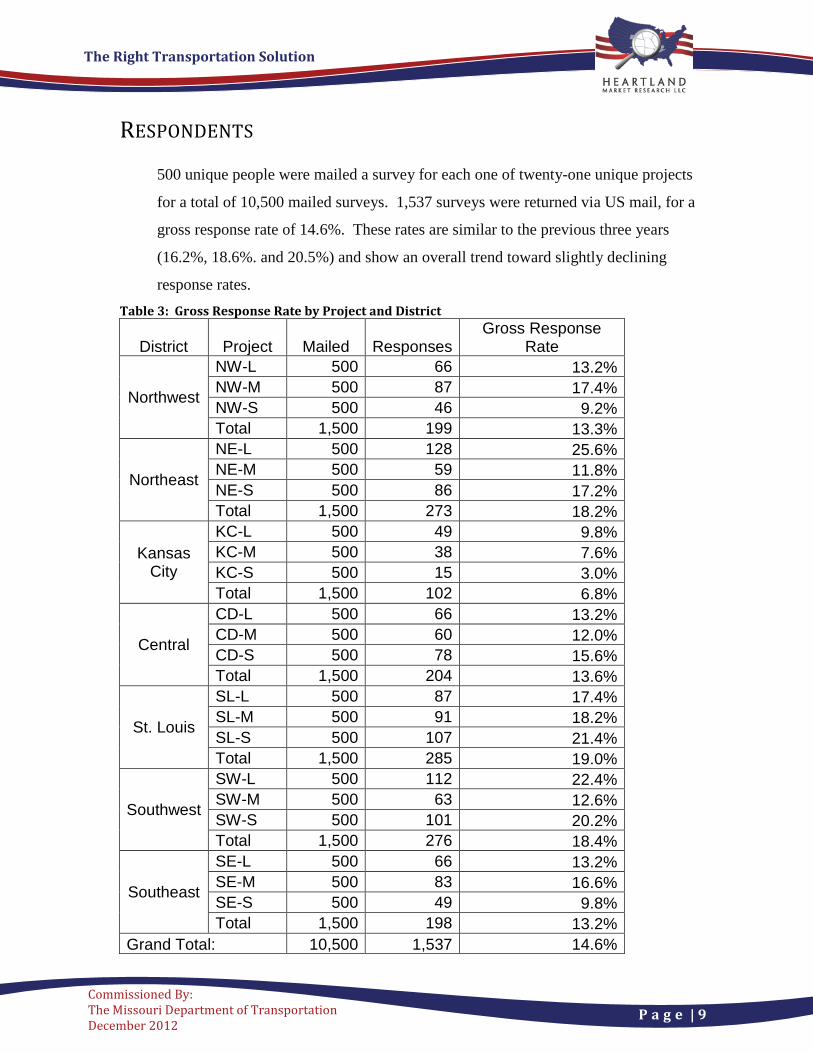
RESPONDENTS
500 unique people were mailed a survey for each one of twenty-one unique projects
for a total of 10,500 mailed surveys. 1,537 surveys were returned via US mail, for a
gross response rate of 14.6%. These rates are similar to the previous three years
(16.2%, 18.6%. and 20.5%) and show an overall trend toward slightly declining
response rates. Table 3: Gross Response Rate by Project and District
District Project Mailed Responses Gross Response
Rate
Northwest
NW-L 500 66 13.2% NW-M 500 87 17.4% NW-S 500 46 9.2% Total 1,500 199 13.3%
Northeast
NE-L 500 128 25.6% NE-M 500 59 11.8% NE-S 500 86 17.2% Total 1,500 273 18.2%
Kansas City
KC-L 500 49 9.8% KC-M 500 38 7.6% KC-S 500 15 3.0% Total 1,500 102 6.8%
Central
CD-L 500 66 13.2% CD-M 500 60 12.0% CD-S 500 78 15.6% Total 1,500 204 13.6%
St. Louis
SL-L 500 87 17.4% SL-M 500 91 18.2% SL-S 500 107 21.4% Total 1,500 285 19.0%
Southwest
SW-L 500 112 22.4% SW-M 500 63 12.6% SW-S 500 101 20.2% Total 1,500 276 18.4%
Southeast
SE-L 500 66 13.2% SE-M 500 83 16.6% SE-S 500 49 9.8% Total 1,500 198 13.2%
Grand Total: 10,500 1,537 14.6%
The Right Transportation Solution
P a g e | 10
Commissioned By: The Missouri Department of Transportation December 2012
Seven projects had gross response rates outside of the norm (the standard deviation
was +/- 5.1%). Projects NW-S, KC-M, and KC-S had gross response rates at least
one standard deviation below the norm of 14.6%. Projects NE-L, SL-S, SW-L, and
SW-S had gross response rates at least one standard deviation above the norm. All
in all, the district response rates were very consistent with the lowest number of
responses coming from the Kansas City District’s three projects (representing 6.6%
of all mailed responses) and the highest number coming from the St. Louis District
(representing 18.5% of all mailed responses), close to the ideal of 14.3% coming
from each district.
The Right Transportation Solution
P a g e | 11
Commissioned By: The Missouri Department of Transportation December 2012
PROJECT ASSESSMENT
The survey was designed to obtain detailed information about various aspects of a
project so that MoDOT could evaluate whether or not Missourians were pleased
with all aspects of a project such as safety, convenience, congestion reduction,
drivability, and markings. Obviously MoDOT desires to score highly on all of
these aspects, but variance among these dimensions can provide constructive input
on areas of potential improvement. In addition, two questions were asked to
measure Missourians’ assessment of the overall appropriateness of the local project.
Providing the concrete example of a particular project for citizen assessment offers
a number of benefits. First, we know which project the citizen is considering as
they make an assessment. If a particular project was not named, different citizens
could be considering different local projects. Second, the specific example makes it
less likely that a single frustration in the distant past with another project will
influence the citizen’s assessment of current performance. Third, it makes it less
likely that the survey respondent will confuse a MoDOT project with a city or
county project in the area.
One of the most important factors, if not the single most important factor, in making
the survey meaningful, is in ensuring that the respondents may provide
knowledgeable input. Since most Missourians are likely to be familiar with only a
small portion of the roads maintained by MoDOT, it is vital to ask respondents
about a local project that is probably familiar to the respondent. The majority of the
respondents were both familiar with the roadway and regular users of the affected
roadway (details under the discussion of questions three and four).

The Right Transportation Solution
P a g e | 12
Commissioned By: The Missouri Department of Transportation December 2012
Using a specific project example provides additional research benefits. We know
which project was being evaluated by each respondent, thus MoDOT can better
understand and apply the feedback obtained by the survey. In addition, the use of a
specific project both reduces the chance of the respondents confusing MoDOT’s
efforts with that of a city or county project while also differentiating the
respondents’ general attitude toward MoDOT from their evaluation of a particular
project. In other words, based upon the survey design and the respondents’
familiarity and frequency of use of the affected roadways, we can have confidence
in the information provided in this research by the citizens of Missouri.
In order to facilitate better comparisons of changes from year to year, the statistics
used in the project assessment usually do not include the “not sure” percentages.
This eliminates a major source of random variability and allows a more accurate
observation of change over time. In addition, this methodology is consistent with
how MoDOT calculates similar Tracker measures. The fiscal year 2007 data
discussed in this report was recalculated in the fiscal year 2008 report with this
methodology to enable readers to see changes from year to another. Thus, no
recalculations were required this fiscal year, all historical data was taken directly
from last year’s report.
The Right Transportation Solution
P a g e | 13
Commissioned By: The Missouri Department of Transportation December 2012
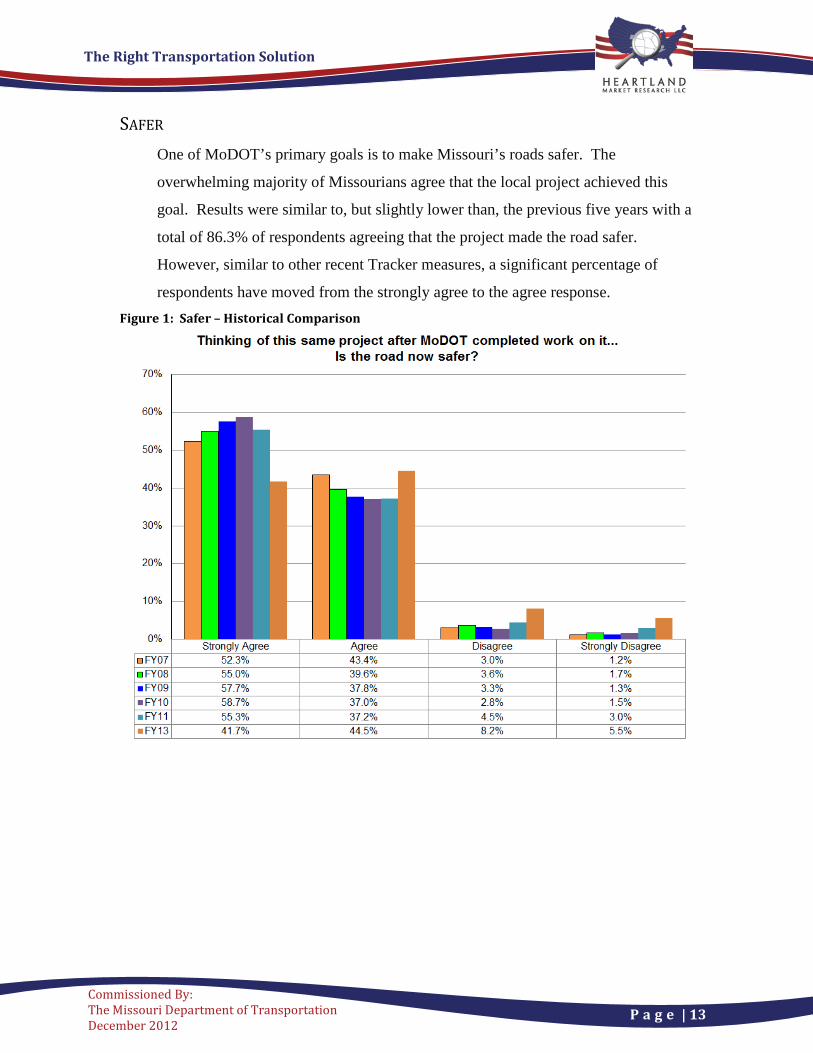
SAFER One of MoDOT’s primary goals is to make Missouri’s roads safer. The
overwhelming majority of Missourians agree that the local project achieved this
goal. Results were similar to, but slightly lower than, the previous five years with a
total of 86.3% of respondents agreeing that the project made the road safer.
However, similar to other recent Tracker measures, a significant percentage of
respondents have moved from the strongly agree to the agree response. Figure 1: Safer – Historical Comparison

The Right Transportation Solution
P a g e | 14
Commissioned By: The Missouri Department of Transportation December 2012
Table 4: Safety Feedback by Project and District
District Project Strongly Agree Agree Disagree
Strongly Disagree Total
Northwest
NW-L 18 39.1% 25 54.3% 2 4.3% 1 2.2% 46 NW-M 26 35.1% 43 58.1% 5 6.8% 0 0.0% 74 NW-S 7 31.8% 12 54.5% 3 13.6% 0 0.0% 22 Total 51 35.9% 80 56.3% 10 7.0% 1 0.7% 142
Northeast
NE-L 25 23.4% 52 48.6% 24 22.4% 6 5.6% 107 NE-M 13 37.1% 20 57.1% 2 5.7% 0 0.0% 35 NE-S 44 56.4% 31 39.7% 2 2.6% 1 1.3% 78 Total 82 37.3% 103 46.8% 28 12.7% 7 3.2% 220
Kansas City
KC-L 16 38.1% 21 50.0% 4 9.5% 1 2.4% 42 KC-M 9 47.4% 10 52.6% 0 0.0% 0 0.0% 19 KC-S 3 30.0% 6 60.0% 1 10.0% 0 0.0% 10 Total 28 39.4% 37 52.1% 5 7.0% 1 1.4% 71
Central
CD-L 20 40.0% 17 34.0% 6 12.0% 7 14.0% 50 CD-M 13 27.7% 23 48.9% 5 10.6% 6 12.8% 47 CD-S 28 44.4% 29 46.0% 2 3.2% 4 6.3% 63 Total 61 38.1% 69 43.1% 13 8.1% 17 10.6% 160
St. Louis
SL-L 37 52.9% 26 37.1% 4 5.7% 3 4.3% 70 SL-M 40 51.9% 30 39.0% 7 9.1% 0 0.0% 77 SL-S 56 60.2% 29 31.2% 7 7.5% 1 1.1% 93 Total 133 55.4% 85 35.4% 18 7.5% 4 1.7% 240
Southwest
SW-L 59 56.2% 44 41.9% 1 1.0% 1 1.0% 105 SW-M 11 33.3% 21 63.6% 0 0.0% 1 3.0% 33 SW-S 36 45.6% 31 39.2% 7 8.9% 5 6.3% 79 Total 106 48.8% 96 44.2% 8 3.7% 7 3.2% 217
Southeast
SE-L 15 26.3% 37 64.9% 3 5.3% 2 3.5% 57 SE-M 13 18.3% 16 22.5% 14 19.7% 28 39.4% 71 SE-S 15 50.0% 15 50.0% 0 0.0% 0 0.0% 30 Total 43 27.2% 68 43.0% 17 10.8% 30 19.0% 158
Grand Total: 504 41.7% 538 44.5% 99 8.2% 67 5.5% 1,208
The Right Transportation Solution
P a g e | 15
Commissioned By: The Missouri Department of Transportation December 2012
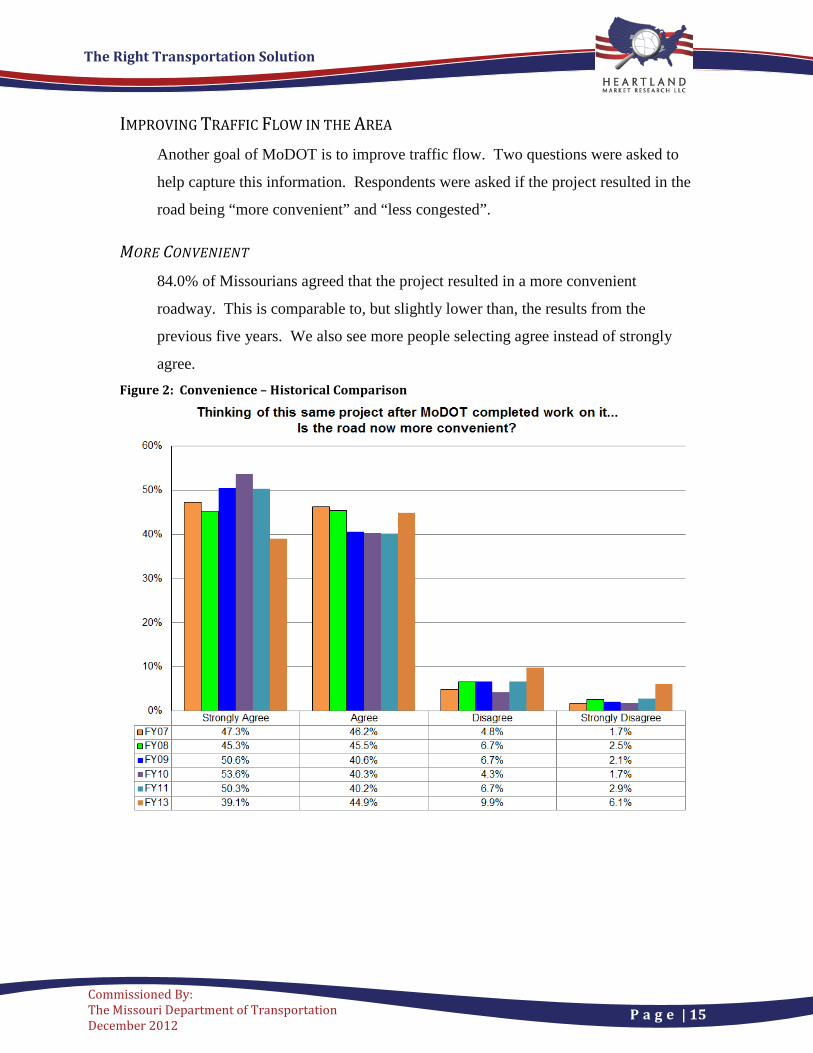
IMPROVING TRAFFIC FLOW IN THE AREA Another goal of MoDOT is to improve traffic flow. Two questions were asked to
help capture this information. Respondents were asked if the project resulted in the
road being “more convenient” and “less congested”.
MORE CONVENIENT
84.0% of Missourians agreed that the project resulted in a more convenient
roadway. This is comparable to, but slightly lower than, the results from the
previous five years. We also see more people selecting agree instead of strongly
agree. Figure 2: Convenience – Historical Comparison

The Right Transportation Solution
P a g e | 16
Commissioned By: The Missouri Department of Transportation December 2012
Table 5: Convenience Feedback by Project and District
District Project Strongly agree Agree Disagree
Strongly disagree Total
Northwest
NW-L 15 40.5% 18 48.6% 3 8.1% 1 2.7% 37 NW-M 10 16.7% 44 73.3% 6 10.0% 0 0.0% 60 NW-S 6 30.0% 10 50.0% 3 15.0% 1 5.0% 20 Total 31 26.5% 72 61.5% 12 10.3% 2 1.7% 117
Northeast
NE-L 44 40.7% 53 49.1% 8 7.4% 3 2.8% 108 NE-M 6 26.1% 15 65.2% 2 8.7% 0 0.0% 23 NE-S 39 52.0% 32 42.7% 2 2.7% 2 2.7% 75 Total 89 43.2% 100 48.5% 12 5.8% 5 2.4% 206
Kansas City
KC-L 14 34.1% 22 53.7% 5 12.2% 0 0.0% 41 KC-M 7 36.8% 12 63.2% 0 0.0% 0 0.0% 19 KC-S 0 0.0% 5 100.0% 0 0.0% 0 0.0% 5 Total 21 32.3% 39 60.0% 5 7.7% 0 0.0% 65
Central
CD-L 10 19.2% 15 28.8% 12 23.1% 15 28.8% 52 CD-M 7 17.5% 18 45.0% 10 25.0% 5 12.5% 40 CD-S 18 31.0% 33 56.9% 3 5.2% 4 6.9% 58 Total 35 23.3% 66 44.0% 25 16.7% 24 16.0% 150
St. Louis
SL-L 47 61.0% 24 31.2% 4 5.2% 2 2.6% 77 SL-M 40 50.6% 31 39.2% 7 8.9% 1 1.3% 79 SL-S 59 60.8% 20 20.6% 12 12.4% 6 6.2% 97 Total 146 57.7% 75 29.6% 23 9.1% 9 3.6% 253
Southwest
SW-L 56 56.0% 42 42.0% 1 1.0% 1 1.0% 100 SW-M 3 15.0% 16 80.0% 1 5.0% 0 0.0% 20 SW-S 39 43.8% 38 42.7% 9 10.1% 3 3.4% 89 Total 98 46.9% 96 45.9% 11 5.3% 4 1.9% 209
Southeast
SE-L 12 23.1% 32 61.5% 7 13.5% 1 1.9% 52 SE-M 7 9.9% 22 31.0% 17 23.9% 25 35.2% 71 SE-S 8 38.1% 12 57.1% 1 4.8% 0 0.0% 21 Total 27 18.8% 66 45.8% 25 17.4% 26 18.1% 144
Grand Total: 447 39.1% 514 44.9% 113 9.9% 70 6.1% 1,144
The Right Transportation Solution
P a g e | 17
Commissioned By: The Missouri Department of Transportation December 2012
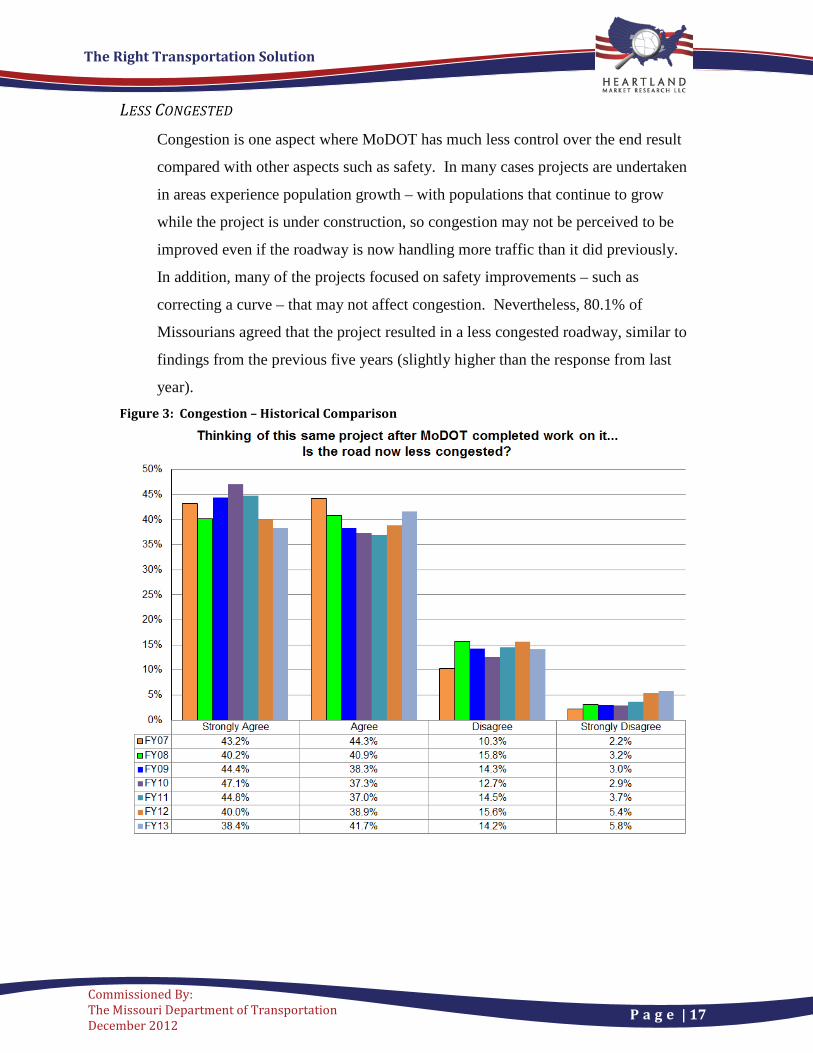
LESS CONGESTED
Congestion is one aspect where MoDOT has much less control over the end result
compared with other aspects such as safety. In many cases projects are undertaken
in areas experience population growth – with populations that continue to grow
while the project is under construction, so congestion may not be perceived to be
improved even if the roadway is now handling more traffic than it did previously.
In addition, many of the projects focused on safety improvements – such as
correcting a curve – that may not affect congestion. Nevertheless, 80.1% of
Missourians agreed that the project resulted in a less congested roadway, similar to
findings from the previous five years (slightly higher than the response from last
year). Figure 3: Congestion – Historical Comparison
The Right Transportation Solution
P a g e | 18
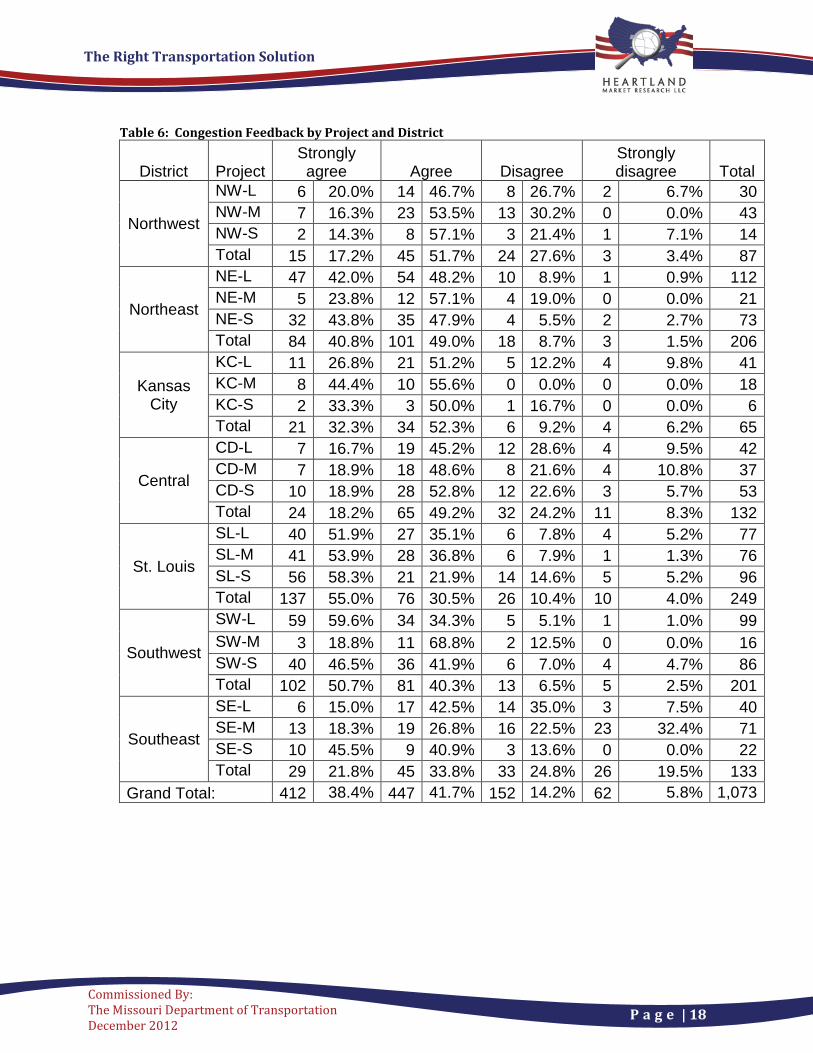
Commissioned By: The Missouri Department of Transportation December 2012
Table 6: Congestion Feedback by Project and District
District Project Strongly agree Agree Disagree
Strongly disagree Total
Northwest
NW-L 6 20.0% 14 46.7% 8 26.7% 2 6.7% 30 NW-M 7 16.3% 23 53.5% 13 30.2% 0 0.0% 43 NW-S 2 14.3% 8 57.1% 3 21.4% 1 7.1% 14 Total 15 17.2% 45 51.7% 24 27.6% 3 3.4% 87
Northeast
NE-L 47 42.0% 54 48.2% 10 8.9% 1 0.9% 112 NE-M 5 23.8% 12 57.1% 4 19.0% 0 0.0% 21 NE-S 32 43.8% 35 47.9% 4 5.5% 2 2.7% 73 Total 84 40.8% 101 49.0% 18 8.7% 3 1.5% 206
Kansas City
KC-L 11 26.8% 21 51.2% 5 12.2% 4 9.8% 41 KC-M 8 44.4% 10 55.6% 0 0.0% 0 0.0% 18 KC-S 2 33.3% 3 50.0% 1 16.7% 0 0.0% 6 Total 21 32.3% 34 52.3% 6 9.2% 4 6.2% 65
Central
CD-L 7 16.7% 19 45.2% 12 28.6% 4 9.5% 42 CD-M 7 18.9% 18 48.6% 8 21.6% 4 10.8% 37 CD-S 10 18.9% 28 52.8% 12 22.6% 3 5.7% 53 Total 24 18.2% 65 49.2% 32 24.2% 11 8.3% 132
St. Louis
SL-L 40 51.9% 27 35.1% 6 7.8% 4 5.2% 77 SL-M 41 53.9% 28 36.8% 6 7.9% 1 1.3% 76 SL-S 56 58.3% 21 21.9% 14 14.6% 5 5.2% 96 Total 137 55.0% 76 30.5% 26 10.4% 10 4.0% 249
Southwest
SW-L 59 59.6% 34 34.3% 5 5.1% 1 1.0% 99 SW-M 3 18.8% 11 68.8% 2 12.5% 0 0.0% 16 SW-S 40 46.5% 36 41.9% 6 7.0% 4 4.7% 86 Total 102 50.7% 81 40.3% 13 6.5% 5 2.5% 201
Southeast
SE-L 6 15.0% 17 42.5% 14 35.0% 3 7.5% 40 SE-M 13 18.3% 19 26.8% 16 22.5% 23 32.4% 71 SE-S 10 45.5% 9 40.9% 3 13.6% 0 0.0% 22 Total 29 21.8% 45 33.8% 33 24.8% 26 19.5% 133
Grand Total: 412 38.4% 447 41.7% 152 14.2% 62 5.8% 1,073
The Right Transportation Solution
P a g e | 19
Commissioned By: The Missouri Department of Transportation December 2012
DRIVING ENVIRONMENT Another goal of the MoDOT improvement projects was to improve the driving
environment of the roadways by making them easier to navigate and easier to
understand. Two questions were asked to help capture this information.
Respondents were asked if the project resulted in the road being “easier to travel”
and “better marked”. At the request of MoDOT, the phrasing of these questions
was slightly adjusted in FY08 and again in FY11 to help respondents better
understand the survey. While this had the potential for making it more difficult to
make comparisons from year to year, fine-tuning the Tracker measure was given a
higher priority to ensure that this and future surveys capture the most accurate
information possible. In practice, even with the improved wording, the results
thereafter were quite comparable to that of previous years.

The Right Transportation Solution
P a g e | 20
Commissioned By: The Missouri Department of Transportation December 2012
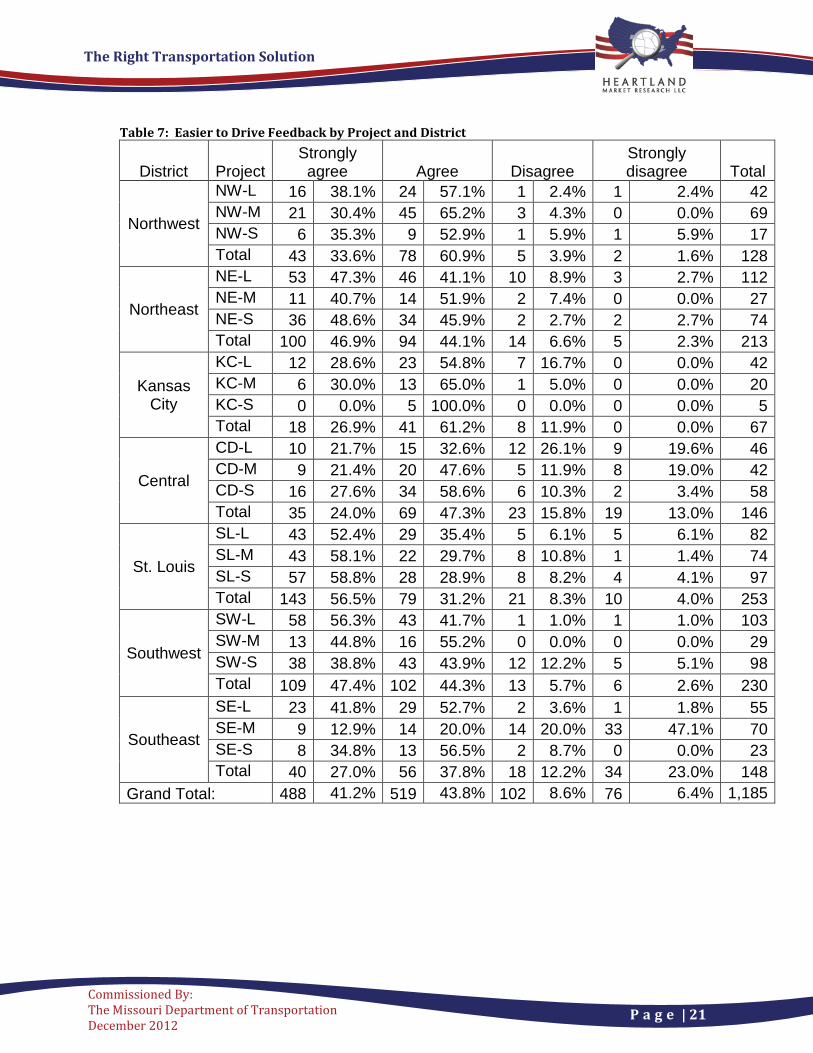
EASIER TO TRAVEL
85.0% of Missourians agreed that the project resulted in a roadway that was easier
to travel. This is comparable to, but slightly lower than, the respondents in the
previous five years. Over the last four years, the amount of people who marked
agree instead of strongly agree has grown. Figure 4: Easier to Travel – Historical Comparison
The Right Transportation Solution
P a g e | 21
Commissioned By: The Missouri Department of Transportation December 2012
Table 7: Easier to Drive Feedback by Project and District
District Project Strongly agree Agree Disagree
Strongly disagree Total
Northwest
NW-L 16 38.1% 24 57.1% 1 2.4% 1 2.4% 42 NW-M 21 30.4% 45 65.2% 3 4.3% 0 0.0% 69 NW-S 6 35.3% 9 52.9% 1 5.9% 1 5.9% 17 Total 43 33.6% 78 60.9% 5 3.9% 2 1.6% 128
Northeast
NE-L 53 47.3% 46 41.1% 10 8.9% 3 2.7% 112 NE-M 11 40.7% 14 51.9% 2 7.4% 0 0.0% 27 NE-S 36 48.6% 34 45.9% 2 2.7% 2 2.7% 74 Total 100 46.9% 94 44.1% 14 6.6% 5 2.3% 213
Kansas City
KC-L 12 28.6% 23 54.8% 7 16.7% 0 0.0% 42 KC-M 6 30.0% 13 65.0% 1 5.0% 0 0.0% 20 KC-S 0 0.0% 5 100.0% 0 0.0% 0 0.0% 5 Total 18 26.9% 41 61.2% 8 11.9% 0 0.0% 67
Central
CD-L 10 21.7% 15 32.6% 12 26.1% 9 19.6% 46 CD-M 9 21.4% 20 47.6% 5 11.9% 8 19.0% 42 CD-S 16 27.6% 34 58.6% 6 10.3% 2 3.4% 58 Total 35 24.0% 69 47.3% 23 15.8% 19 13.0% 146
St. Louis
SL-L 43 52.4% 29 35.4% 5 6.1% 5 6.1% 82 SL-M 43 58.1% 22 29.7% 8 10.8% 1 1.4% 74 SL-S 57 58.8% 28 28.9% 8 8.2% 4 4.1% 97 Total 143 56.5% 79 31.2% 21 8.3% 10 4.0% 253
Southwest
SW-L 58 56.3% 43 41.7% 1 1.0% 1 1.0% 103 SW-M 13 44.8% 16 55.2% 0 0.0% 0 0.0% 29 SW-S 38 38.8% 43 43.9% 12 12.2% 5 5.1% 98 Total 109 47.4% 102 44.3% 13 5.7% 6 2.6% 230
Southeast
SE-L 23 41.8% 29 52.7% 2 3.6% 1 1.8% 55 SE-M 9 12.9% 14 20.0% 14 20.0% 33 47.1% 70 SE-S 8 34.8% 13 56.5% 2 8.7% 0 0.0% 23 Total 40 27.0% 56 37.8% 18 12.2% 34 23.0% 148
Grand Total: 488 41.2% 519 43.8% 102 8.6% 76 6.4% 1,185
The Right Transportation Solution
P a g e | 22
Commissioned By: The Missouri Department of Transportation December 2012
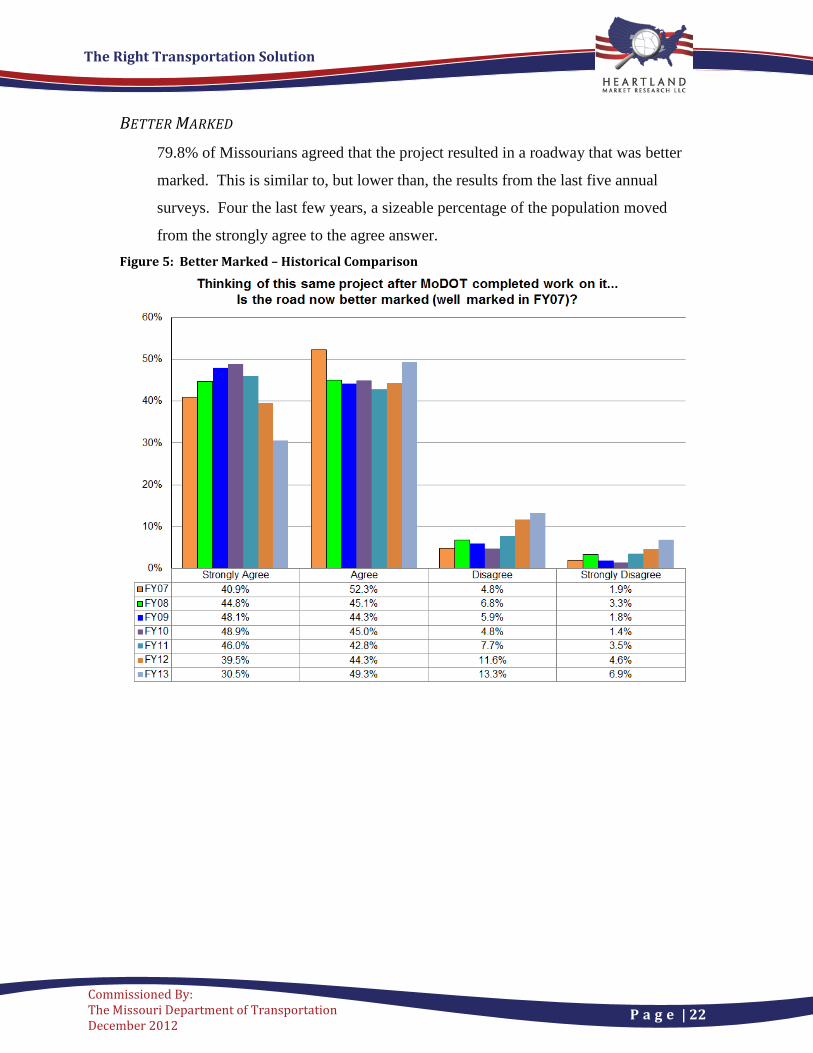
BETTER MARKED
79.8% of Missourians agreed that the project resulted in a roadway that was better
marked. This is similar to, but lower than, the results from the last five annual
surveys. Four the last few years, a sizeable percentage of the population moved
from the strongly agree to the agree answer. Figure 5: Better Marked – Historical Comparison

The Right Transportation Solution
P a g e | 23
Commissioned By: The Missouri Department of Transportation December 2012
Table 8: Better Marked Feedback by Project and District
District Project Strongly agree Agree Disagree
Strongly disagree Total
Northwest
NW-L 17 44.7% 16 42.1% 4 10.5% 1 2.6% 38 NW-M 23 35.9% 37 57.8% 4 6.3% 0 0.0% 64 NW-S 5 27.8% 10 55.6% 2 11.1% 1 5.6% 18 Total 45 37.5% 63 52.5% 10 8.3% 2 1.7% 120
Northeast
NE-L 21 19.6% 44 41.1% 32 29.9% 10 9.3% 107 NE-M 7 29.2% 15 62.5% 2 8.3% 0 0.0% 24 NE-S 33 44.6% 38 51.4% 0 0.0% 3 4.1% 74 Total 61 29.8% 97 47.3% 34 16.6% 13 6.3% 205
Kansas City
KC-L 7 18.9% 26 70.3% 3 8.1% 1 2.7% 37 KC-M 5 27.8% 13 72.2% 0 0.0% 0 0.0% 18 KC-S 1 20.0% 4 80.0% 0 0.0% 0 0.0% 5 Total 13 21.7% 43 71.7% 3 5.0% 1 1.7% 60
Central
CD-L 8 18.6% 16 37.2% 11 25.6% 8 18.6% 43 CD-M 9 21.4% 19 45.2% 9 21.4% 5 11.9% 42 CD-S 10 18.2% 37 67.3% 5 9.1% 3 5.5% 55 Total 27 19.3% 72 51.4% 25 17.9% 16 11.4% 140
St. Louis
SL-L 29 37.7% 32 41.6% 9 11.7% 7 9.1% 77 SL-M 22 30.1% 36 49.3% 13 17.8% 2 2.7% 73 SL-S 46 48.4% 39 41.1% 10 10.5% 0 0.0% 95 Total 97 39.6% 107 43.7% 32 13.1% 9 3.7% 245
Southwest
SW-L 26 29.2% 53 59.6% 8 9.0% 2 2.2% 89 SW-M 7 36.8% 11 57.9% 1 5.3% 0 0.0% 19 SW-S 27 31.8% 37 43.5% 11 12.9% 10 11.8% 85 Total 60 31.1% 101 52.3% 20 10.4% 12 6.2% 193
Southeast
SE-L 16 32.0% 26 52.0% 7 14.0% 1 2.0% 50 SE-M 9 13.2% 23 33.8% 14 20.6% 22 32.4% 68 SE-S 8 40.0% 11 55.0% 1 5.0% 0 0.0% 20 Total 33 23.9% 60 43.5% 22 15.9% 23 16.7% 138
Grand Total: 336 30.5% 543 49.3% 146 13.3% 76 6.9% 1,101
The Right Transportation Solution
P a g e | 24
Commissioned By: The Missouri Department of Transportation December 2012
ACCOMMODATION FOR BICYCLISTS AND PEDESTRIANS
Six of the twenty-one projects selected by MoDOT were different in that special
accommodation for bicyclists and pedestrians were designed into the project. The
other projects were standard and did not have a bicyclist/pedestrian component.
Question two (with three parts) differed for these projects. The respondents who
were asked about the four projects that specifically accommodated bicyclists and
pedestrians were asked about the accommodation. The respondents from the other
seventeen projects were asked questions about the expected pedestrian and
bicyclists usage of the road.
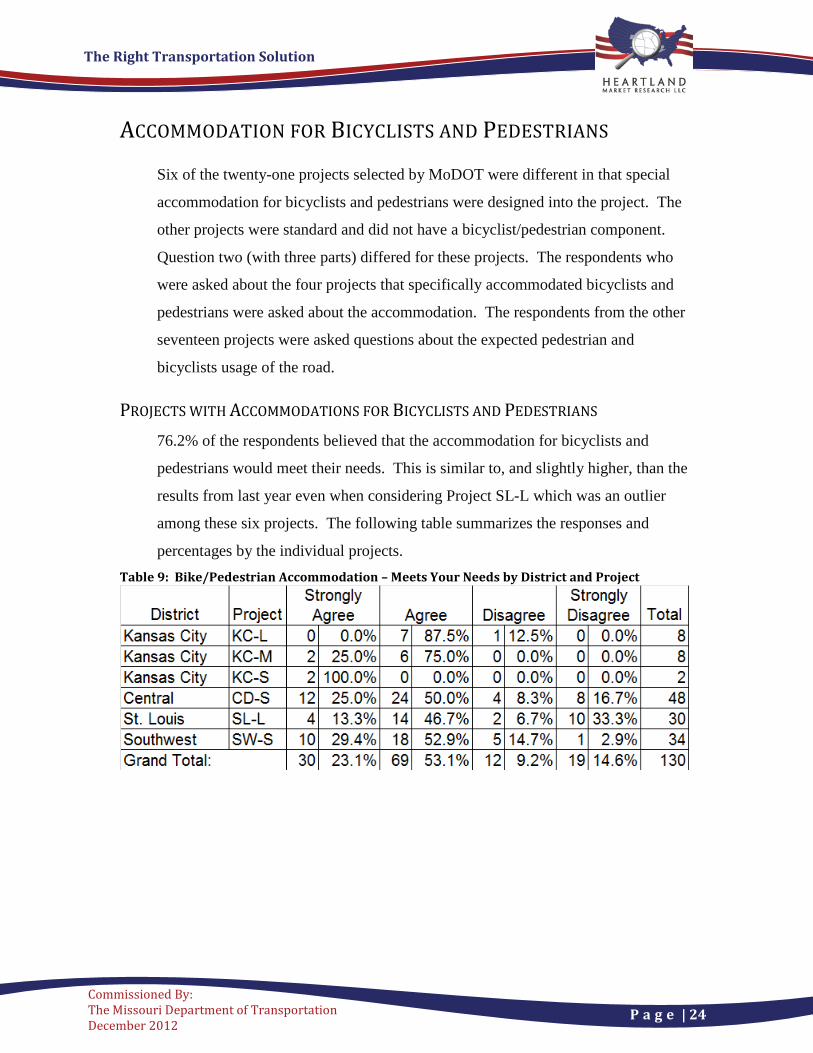
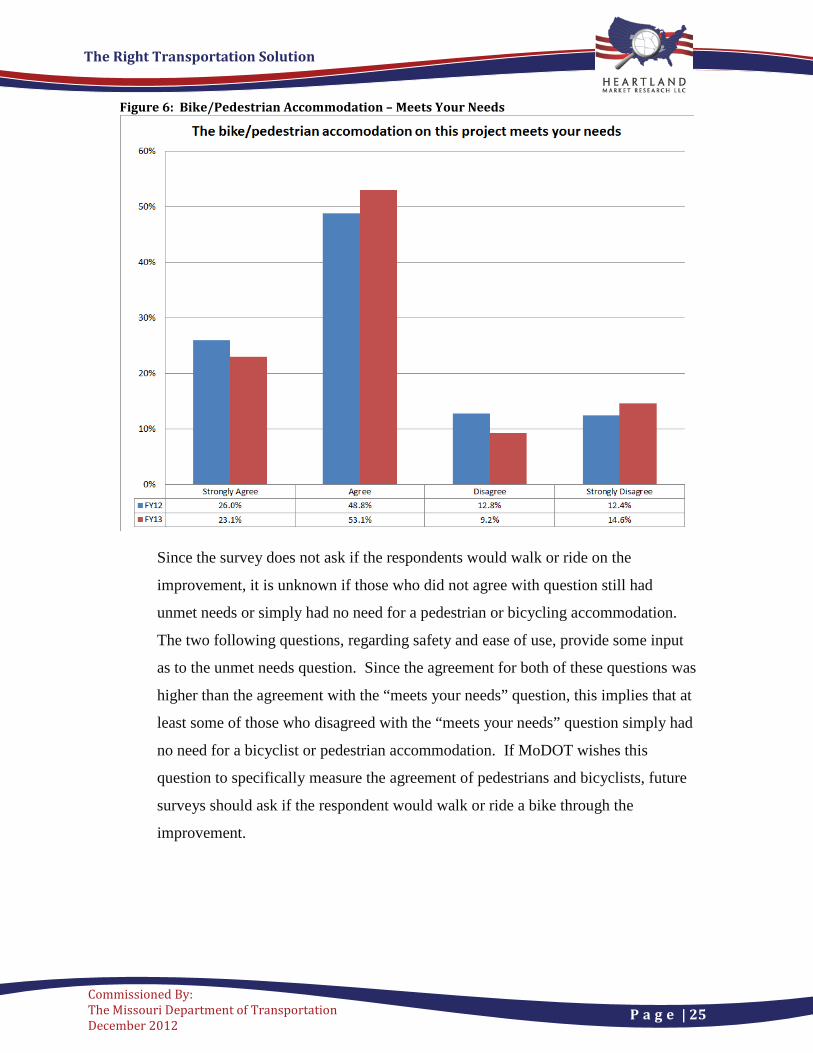
PROJECTS WITH ACCOMMODATIONS FOR BICYCLISTS AND PEDESTRIANS 76.2% of the respondents believed that the accommodation for bicyclists and
pedestrians would meet their needs. This is similar to, and slightly higher, than the
results from last year even when considering Project SL-L which was an outlier
among these six projects. The following table summarizes the responses and
percentages by the individual projects. Table 9: Bike/Pedestrian Accommodation – Meets Your Needs by District and Project
The Right Transportation Solution
P a g e | 25
Commissioned By: The Missouri Department of Transportation December 2012
Figure 6: Bike/Pedestrian Accommodation – Meets Your Needs
Since the survey does not ask if the respondents would walk or ride on the
improvement, it is unknown if those who did not agree with question still had
unmet needs or simply had no need for a pedestrian or bicycling accommodation.
The two following questions, regarding safety and ease of use, provide some input
as to the unmet needs question. Since the agreement for both of these questions was
higher than the agreement with the “meets your needs” question, this implies that at
least some of those who disagreed with the “meets your needs” question simply had
no need for a bicyclist or pedestrian accommodation. If MoDOT wishes this
question to specifically measure the agreement of pedestrians and bicyclists, future
surveys should ask if the respondent would walk or ride a bike through the
improvement.

The Right Transportation Solution
P a g e | 26
Commissioned By: The Missouri Department of Transportation December 2012
77.0% of the respondents thought the bicyclists and pedestrian accommodation was
safe. This is significantly less than the 85.3% measured last year. This is a
statistically significant change and the drop in this measure is due to one project.
56% of the respondents for SL-L thought the bike/pedestrian accommodation
for this project was unsafe. The following table summarizes the responses and
percentages by the individual projects. Table 10: Bike/Pedestrian Accommodation – Is Safe by District and Project
Figure 7: Bike/Pedestrian Accommodation – Is Safe
The Right Transportation Solution
P a g e | 27
Commissioned By: The Missouri Department of Transportation December 2012
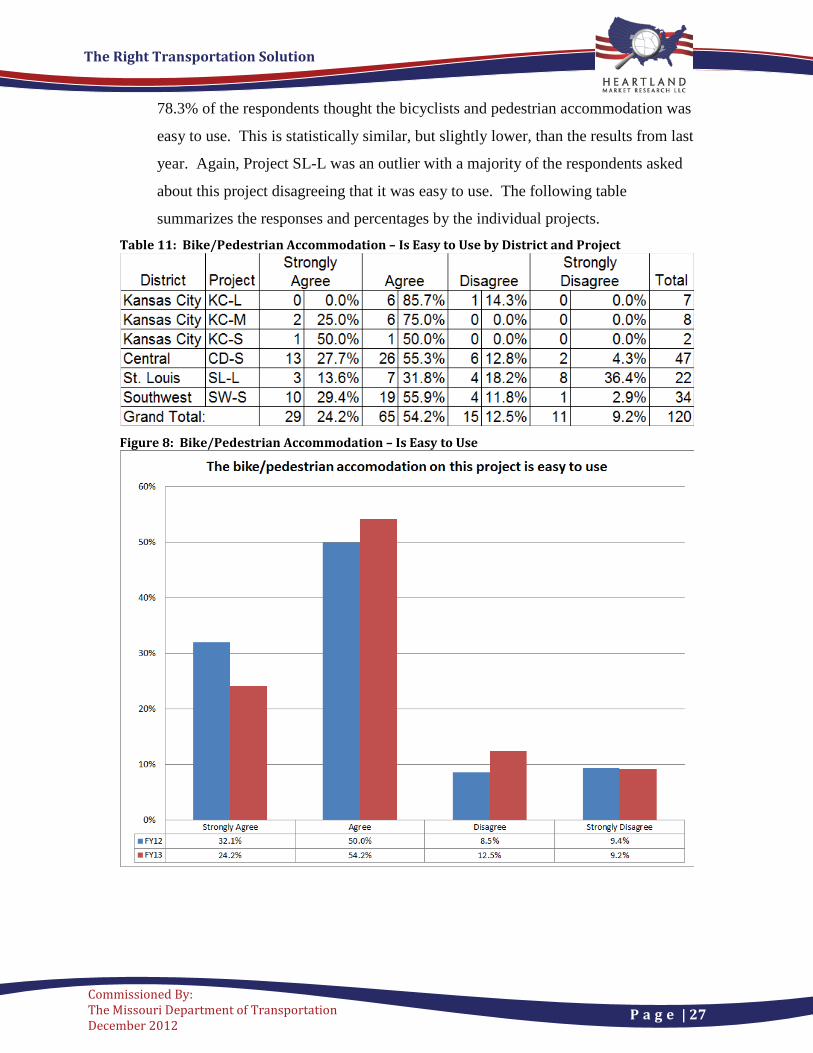
78.3% of the respondents thought the bicyclists and pedestrian accommodation was
easy to use. This is statistically similar, but slightly lower, than the results from last
year. Again, Project SL-L was an outlier with a majority of the respondents asked
about this project disagreeing that it was easy to use. The following table
summarizes the responses and percentages by the individual projects. Table 11: Bike/Pedestrian Accommodation – Is Easy to Use by District and Project
Figure 8: Bike/Pedestrian Accommodation – Is Easy to Use
The Right Transportation Solution
P a g e | 28
Commissioned By: The Missouri Department of Transportation December 2012
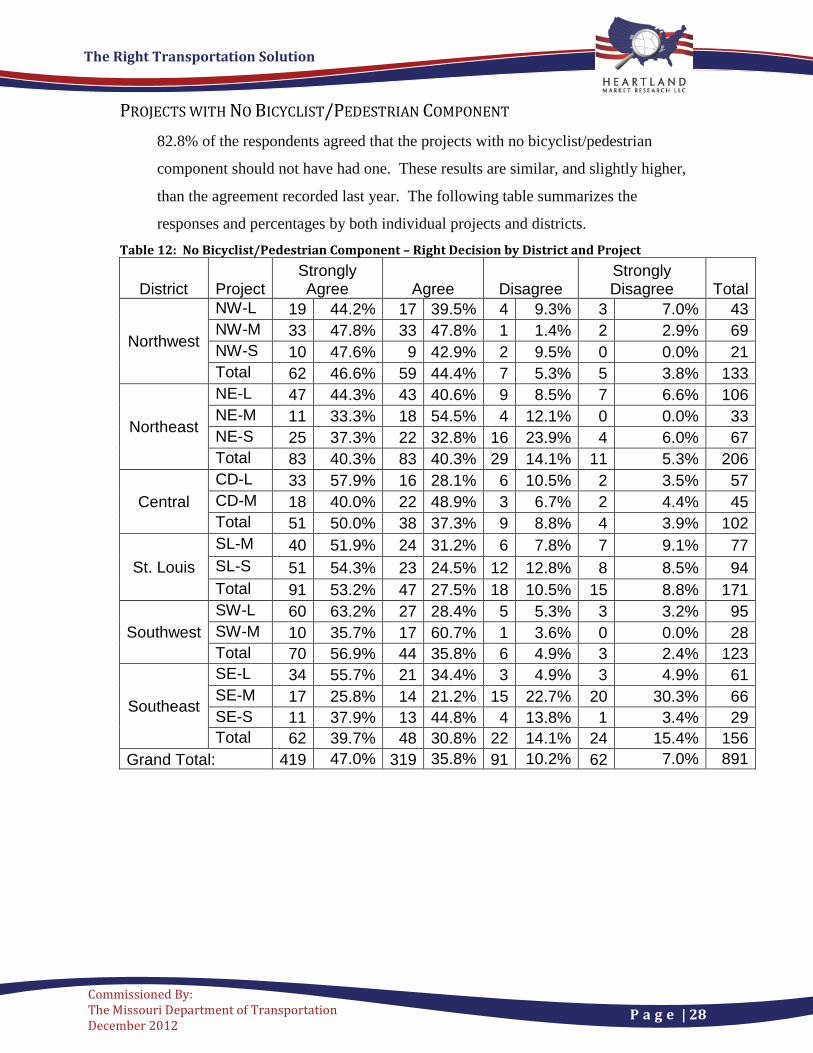
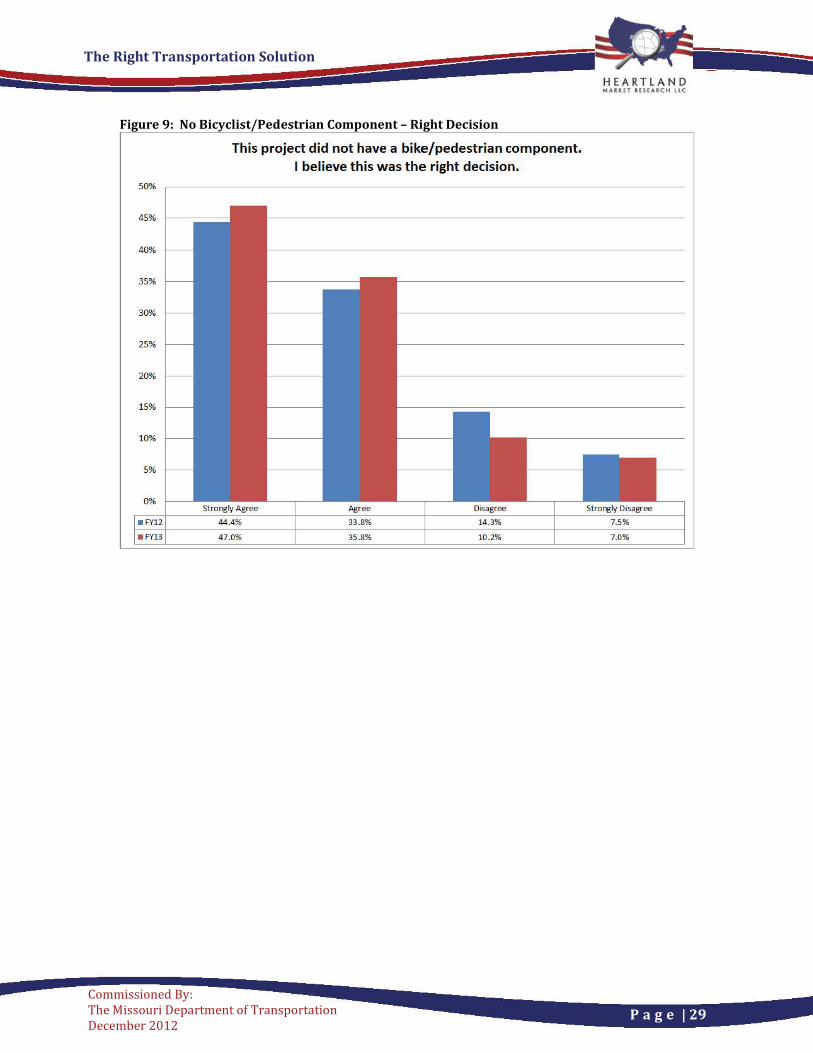
PROJECTS WITH NO BICYCLIST/PEDESTRIAN COMPONENT 82.8% of the respondents agreed that the projects with no bicyclist/pedestrian
component should not have had one. These results are similar, and slightly higher,
than the agreement recorded last year. The following table summarizes the
responses and percentages by both individual projects and districts. Table 12: No Bicyclist/Pedestrian Component – Right Decision by District and Project
District Project Strongly Agree Agree Disagree
Strongly Disagree Total
Northwest
NW-L 19 44.2% 17 39.5% 4 9.3% 3 7.0% 43 NW-M 33 47.8% 33 47.8% 1 1.4% 2 2.9% 69 NW-S 10 47.6% 9 42.9% 2 9.5% 0 0.0% 21 Total 62 46.6% 59 44.4% 7 5.3% 5 3.8% 133
Northeast
NE-L 47 44.3% 43 40.6% 9 8.5% 7 6.6% 106 NE-M 11 33.3% 18 54.5% 4 12.1% 0 0.0% 33 NE-S 25 37.3% 22 32.8% 16 23.9% 4 6.0% 67 Total 83 40.3% 83 40.3% 29 14.1% 11 5.3% 206
Central CD-L 33 57.9% 16 28.1% 6 10.5% 2 3.5% 57 CD-M 18 40.0% 22 48.9% 3 6.7% 2 4.4% 45 Total 51 50.0% 38 37.3% 9 8.8% 4 3.9% 102
St. Louis SL-M 40 51.9% 24 31.2% 6 7.8% 7 9.1% 77 SL-S 51 54.3% 23 24.5% 12 12.8% 8 8.5% 94 Total 91 53.2% 47 27.5% 18 10.5% 15 8.8% 171
Southwest SW-L 60 63.2% 27 28.4% 5 5.3% 3 3.2% 95 SW-M 10 35.7% 17 60.7% 1 3.6% 0 0.0% 28 Total 70 56.9% 44 35.8% 6 4.9% 3 2.4% 123
Southeast
SE-L 34 55.7% 21 34.4% 3 4.9% 3 4.9% 61 SE-M 17 25.8% 14 21.2% 15 22.7% 20 30.3% 66 SE-S 11 37.9% 13 44.8% 4 13.8% 1 3.4% 29 Total 62 39.7% 48 30.8% 22 14.1% 24 15.4% 156
Grand Total: 419 47.0% 319 35.8% 91 10.2% 62 7.0% 891
The Right Transportation Solution
P a g e | 29
Commissioned By: The Missouri Department of Transportation December 2012
Figure 9: No Bicyclist/Pedestrian Component – Right Decision
This project did not have a bike/pedestrian component. I believe this was the right decision.
SO%
The Right Transportation Solution
P a g e | 30
Commissioned By: The Missouri Department of Transportation December 2012
Respondents for projects that did not have a bicyclist/pedestrian component were
then asked if they thought pedestrians and bicyclists would use the improvement.
Disagreement with the next two questions indicated that the respondents thought
pedestrians and bicyclists would not use the improvement.
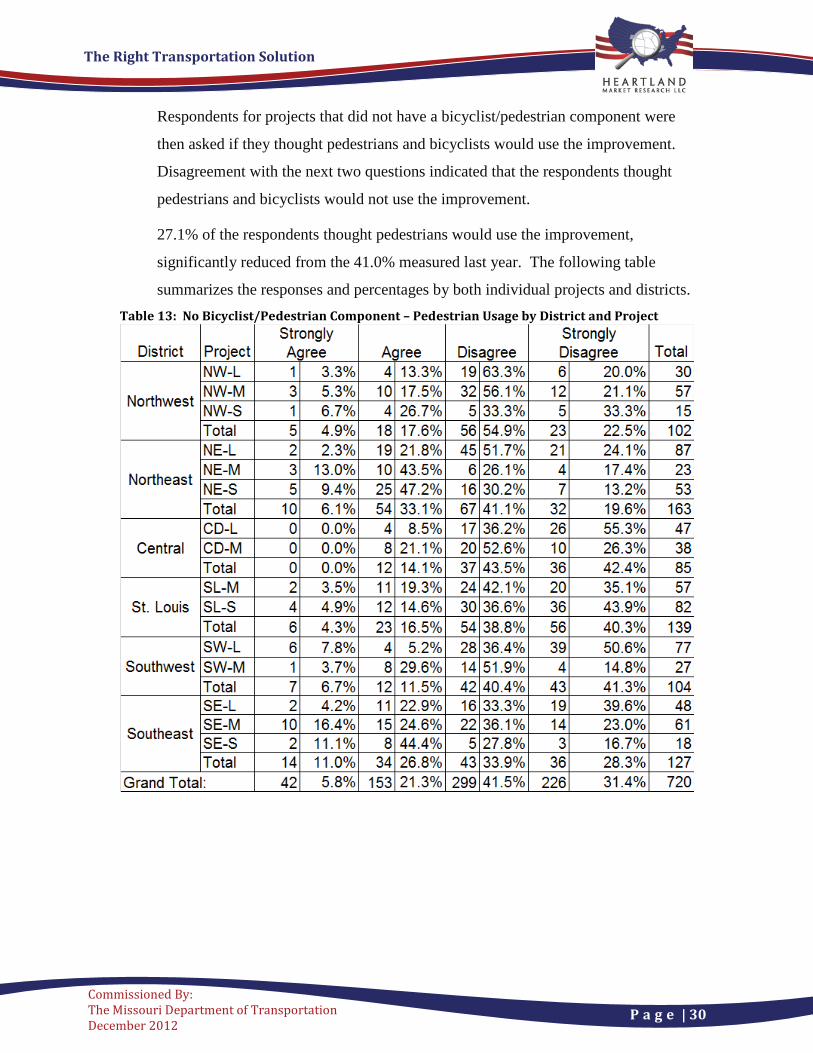
27.1% of the respondents thought pedestrians would use the improvement,
significantly reduced from the 41.0% measured last year. The following table
summarizes the responses and percentages by both individual projects and districts. Table 13: No Bicyclist/Pedestrian Component – Pedestrian Usage by District and Project

The Right Transportation Solution
P a g e | 31
Commissioned By: The Missouri Department of Transportation December 2012
Figure 10: No Bicyclist/Pedestrian Component – Pedestrian Usage
This project did not have a bike/pedestrian component. I believe pedestrians will use this road.
45%
The Right Transportation Solution
P a g e | 32
Commissioned By: The Missouri Department of Transportation December 2012
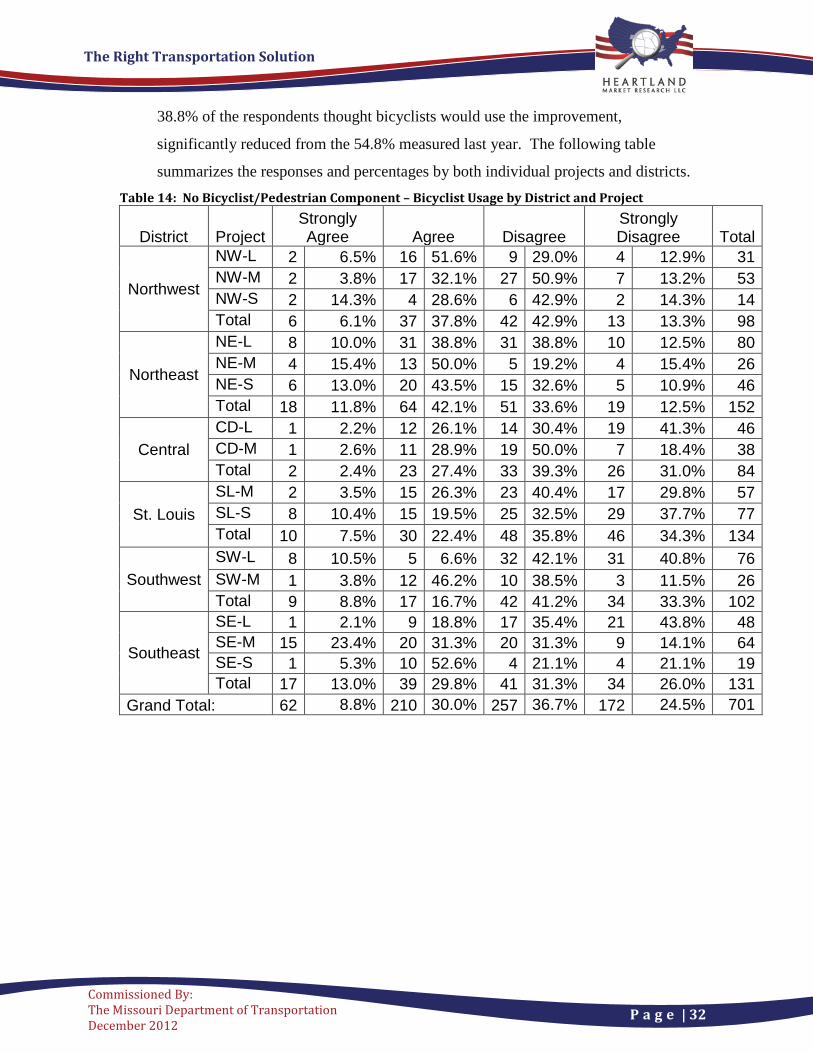
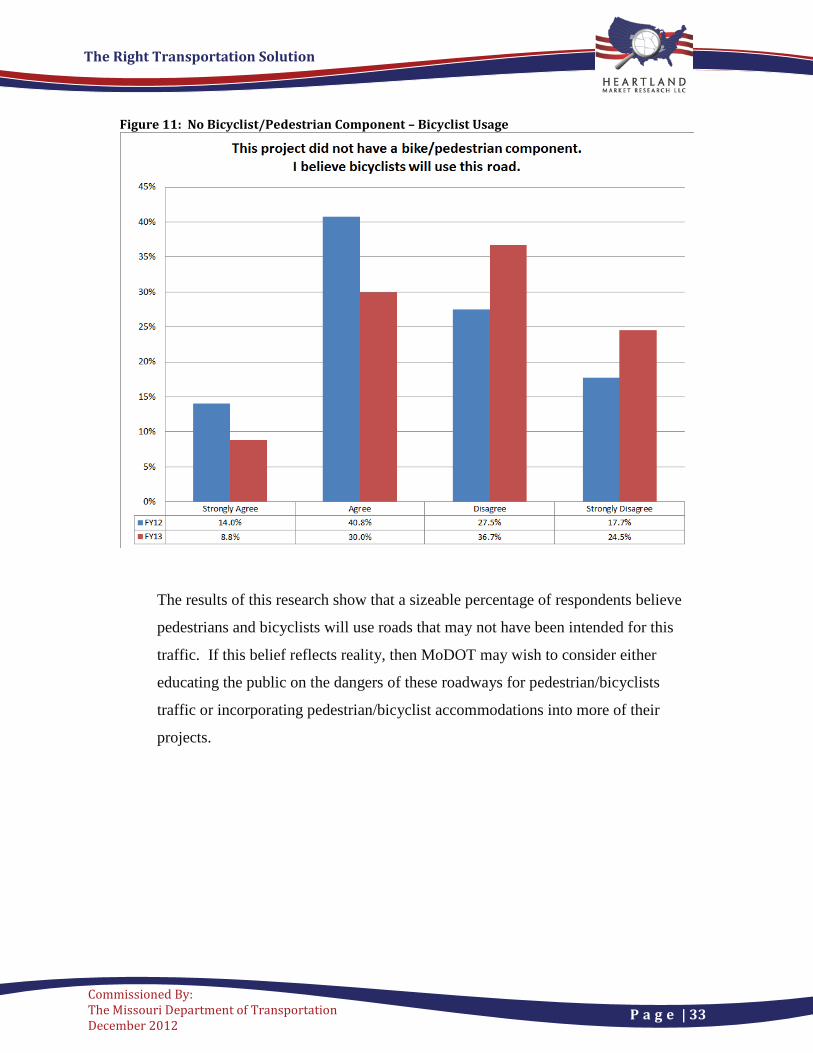
38.8% of the respondents thought bicyclists would use the improvement,
significantly reduced from the 54.8% measured last year. The following table
summarizes the responses and percentages by both individual projects and districts. Table 14: No Bicyclist/Pedestrian Component – Bicyclist Usage by District and Project
District Project Strongly Agree Agree Disagree
Strongly Disagree Total
Northwest
NW-L 2 6.5% 16 51.6% 9 29.0% 4 12.9% 31 NW-M 2 3.8% 17 32.1% 27 50.9% 7 13.2% 53 NW-S 2 14.3% 4 28.6% 6 42.9% 2 14.3% 14 Total 6 6.1% 37 37.8% 42 42.9% 13 13.3% 98
Northeast
NE-L 8 10.0% 31 38.8% 31 38.8% 10 12.5% 80 NE-M 4 15.4% 13 50.0% 5 19.2% 4 15.4% 26 NE-S 6 13.0% 20 43.5% 15 32.6% 5 10.9% 46 Total 18 11.8% 64 42.1% 51 33.6% 19 12.5% 152
Central CD-L 1 2.2% 12 26.1% 14 30.4% 19 41.3% 46 CD-M 1 2.6% 11 28.9% 19 50.0% 7 18.4% 38 Total 2 2.4% 23 27.4% 33 39.3% 26 31.0% 84
St. Louis SL-M 2 3.5% 15 26.3% 23 40.4% 17 29.8% 57 SL-S 8 10.4% 15 19.5% 25 32.5% 29 37.7% 77 Total 10 7.5% 30 22.4% 48 35.8% 46 34.3% 134
Southwest SW-L 8 10.5% 5 6.6% 32 42.1% 31 40.8% 76 SW-M 1 3.8% 12 46.2% 10 38.5% 3 11.5% 26 Total 9 8.8% 17 16.7% 42 41.2% 34 33.3% 102
Southeast
SE-L 1 2.1% 9 18.8% 17 35.4% 21 43.8% 48 SE-M 15 23.4% 20 31.3% 20 31.3% 9 14.1% 64 SE-S 1 5.3% 10 52.6% 4 21.1% 4 21.1% 19 Total 17 13.0% 39 29.8% 41 31.3% 34 26.0% 131
Grand Total: 62 8.8% 210 30.0% 257 36.7% 172 24.5% 701
The Right Transportation Solution
P a g e | 33
Commissioned By: The Missouri Department of Transportation December 2012
Figure 11: No Bicyclist/Pedestrian Component – Bicyclist Usage
The results of this research show that a sizeable percentage of respondents believe
pedestrians and bicyclists will use roads that may not have been intended for this
traffic. If this belief reflects reality, then MoDOT may wish to consider either
educating the public on the dangers of these roadways for pedestrian/bicyclists
traffic or incorporating pedestrian/bicyclist accommodations into more of their
projects.
The Right Transportation Solution
P a g e | 34
Commissioned By: The Missouri Department of Transportation December 2012
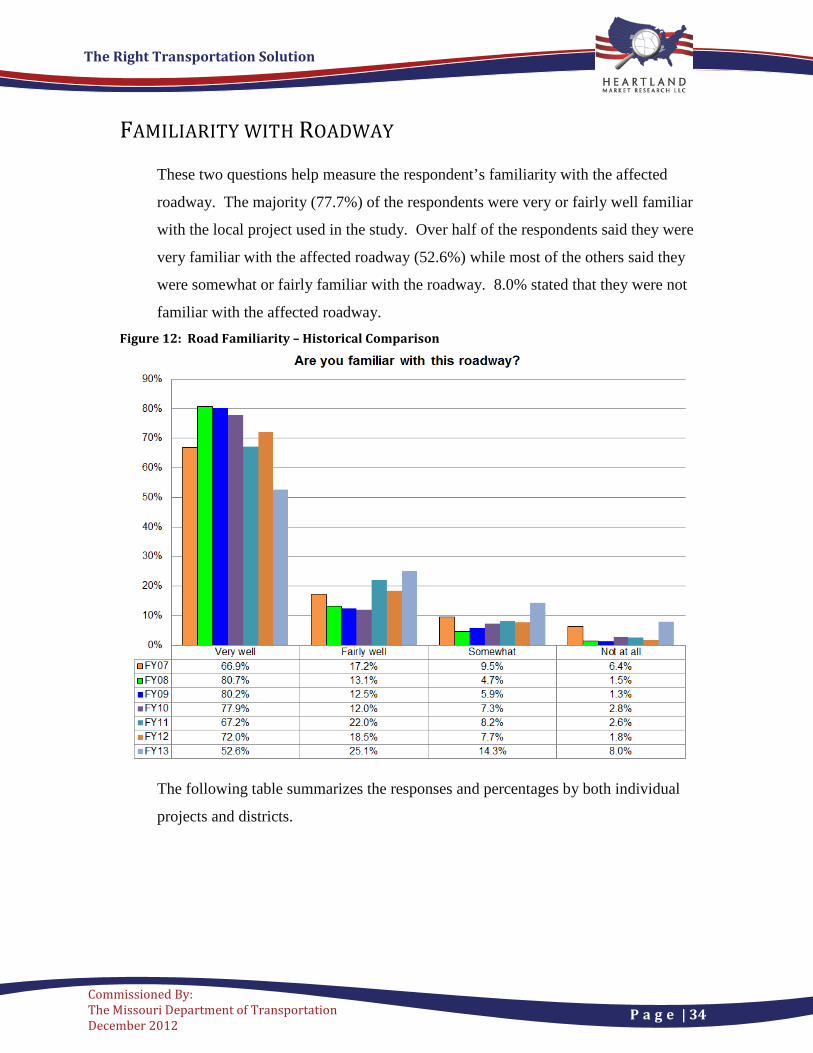
FAMILIARITY WITH ROADWAY
These two questions help measure the respondent’s familiarity with the affected
roadway. The majority (77.7%) of the respondents were very or fairly well familiar
with the local project used in the study. Over half of the respondents said they were
very familiar with the affected roadway (52.6%) while most of the others said they
were somewhat or fairly familiar with the roadway. 8.0% stated that they were not
familiar with the affected roadway. Figure 12: Road Familiarity – Historical Comparison
The following table summarizes the responses and percentages by both individual
projects and districts.
The Right Transportation Solution
P a g e | 35
Commissioned By: The Missouri Department of Transportation December 2012
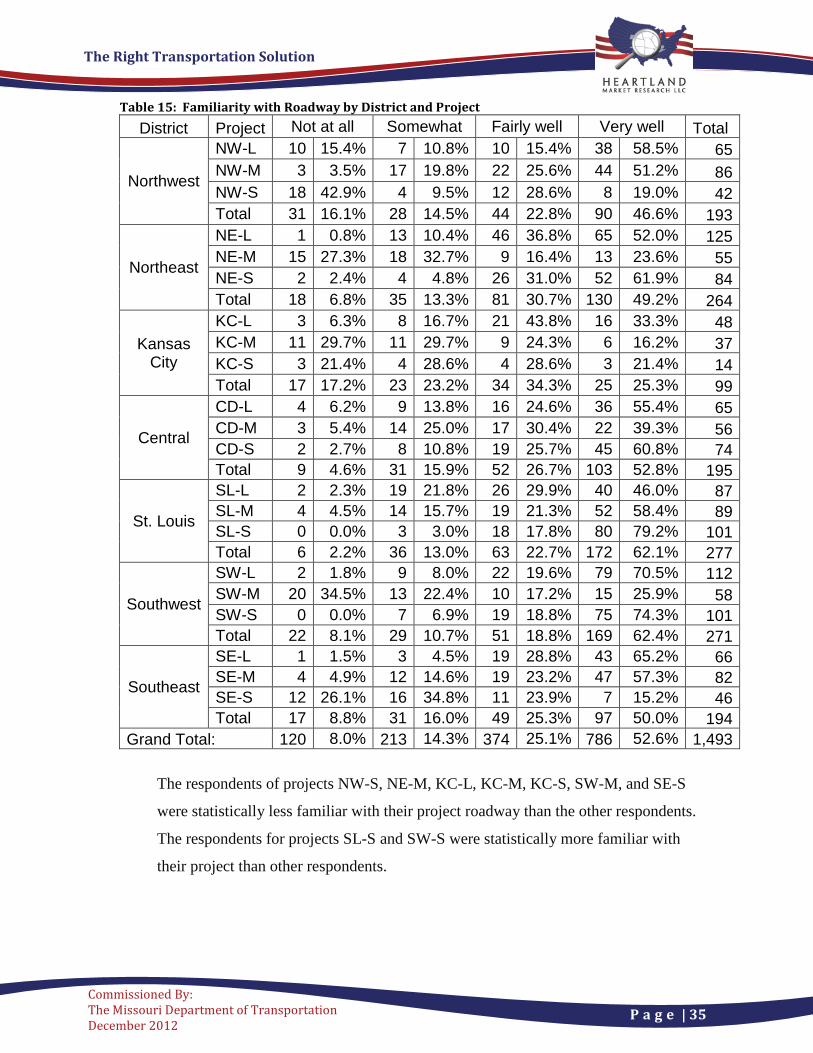
Table 15: Familiarity with Roadway by District and Project District Project Not at all Somewhat Fairly well Very well Total
Northwest
NW-L 10 15.4% 7 10.8% 10 15.4% 38 58.5% 65 NW-M 3 3.5% 17 19.8% 22 25.6% 44 51.2% 86 NW-S 18 42.9% 4 9.5% 12 28.6% 8 19.0% 42 Total 31 16.1% 28 14.5% 44 22.8% 90 46.6% 193
Northeast
NE-L 1 0.8% 13 10.4% 46 36.8% 65 52.0% 125 NE-M 15 27.3% 18 32.7% 9 16.4% 13 23.6% 55 NE-S 2 2.4% 4 4.8% 26 31.0% 52 61.9% 84 Total 18 6.8% 35 13.3% 81 30.7% 130 49.2% 264
Kansas City
KC-L 3 6.3% 8 16.7% 21 43.8% 16 33.3% 48 KC-M 11 29.7% 11 29.7% 9 24.3% 6 16.2% 37 KC-S 3 21.4% 4 28.6% 4 28.6% 3 21.4% 14 Total 17 17.2% 23 23.2% 34 34.3% 25 25.3% 99
Central
CD-L 4 6.2% 9 13.8% 16 24.6% 36 55.4% 65 CD-M 3 5.4% 14 25.0% 17 30.4% 22 39.3% 56 CD-S 2 2.7% 8 10.8% 19 25.7% 45 60.8% 74 Total 9 4.6% 31 15.9% 52 26.7% 103 52.8% 195
St. Louis
SL-L 2 2.3% 19 21.8% 26 29.9% 40 46.0% 87 SL-M 4 4.5% 14 15.7% 19 21.3% 52 58.4% 89 SL-S 0 0.0% 3 3.0% 18 17.8% 80 79.2% 101 Total 6 2.2% 36 13.0% 63 22.7% 172 62.1% 277
Southwest
SW-L 2 1.8% 9 8.0% 22 19.6% 79 70.5% 112 SW-M 20 34.5% 13 22.4% 10 17.2% 15 25.9% 58 SW-S 0 0.0% 7 6.9% 19 18.8% 75 74.3% 101 Total 22 8.1% 29 10.7% 51 18.8% 169 62.4% 271
Southeast
SE-L 1 1.5% 3 4.5% 19 28.8% 43 65.2% 66 SE-M 4 4.9% 12 14.6% 19 23.2% 47 57.3% 82 SE-S 12 26.1% 16 34.8% 11 23.9% 7 15.2% 46 Total 17 8.8% 31 16.0% 49 25.3% 97 50.0% 194
Grand Total: 120 8.0% 213 14.3% 374 25.1% 786 52.6% 1,493
The respondents of projects NW-S, NE-M, KC-L, KC-M, KC-S, SW-M, and SE-S
were statistically less familiar with their project roadway than the other respondents.
The respondents for projects SL-S and SW-S were statistically more familiar with
their project than other respondents.
The Right Transportation Solution
P a g e | 36
Commissioned By: The Missouri Department of Transportation December 2012
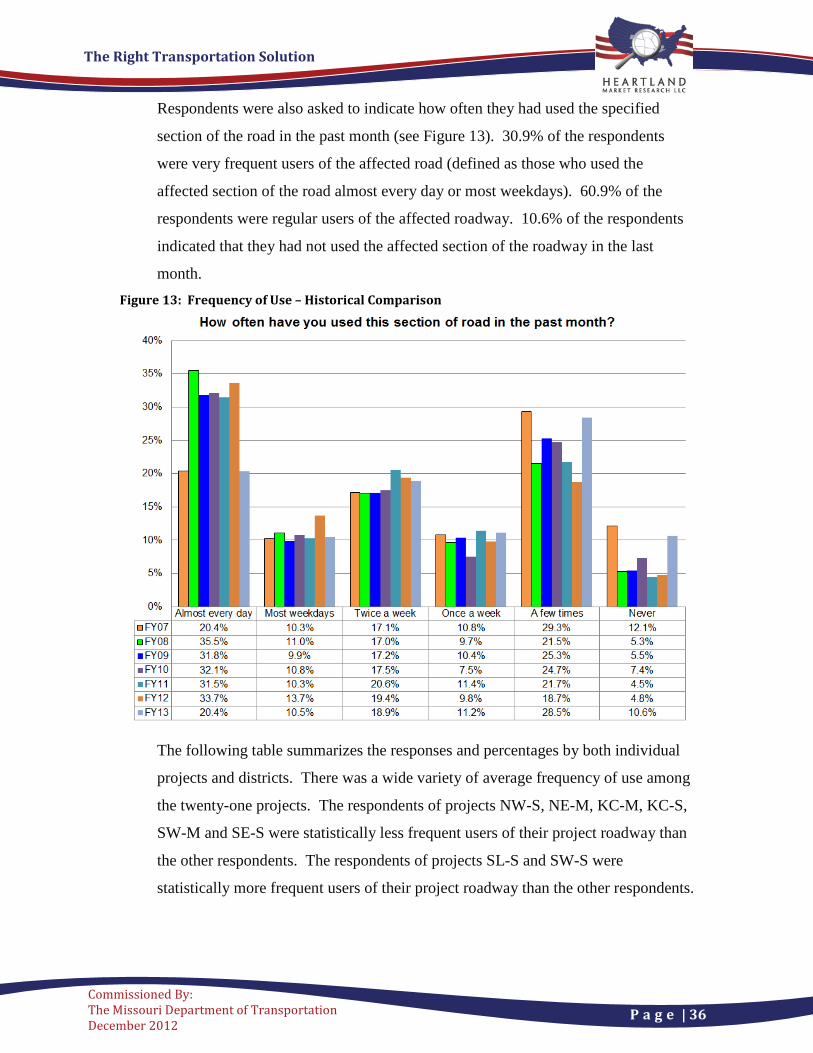
Respondents were also asked to indicate how often they had used the specified
section of the road in the past month (see Figure 13). 30.9% of the respondents
were very frequent users of the affected road (defined as those who used the
affected section of the road almost every day or most weekdays). 60.9% of the
respondents were regular users of the affected roadway. 10.6% of the respondents
indicated that they had not used the affected section of the roadway in the last
month. Figure 13: Frequency of Use – Historical Comparison
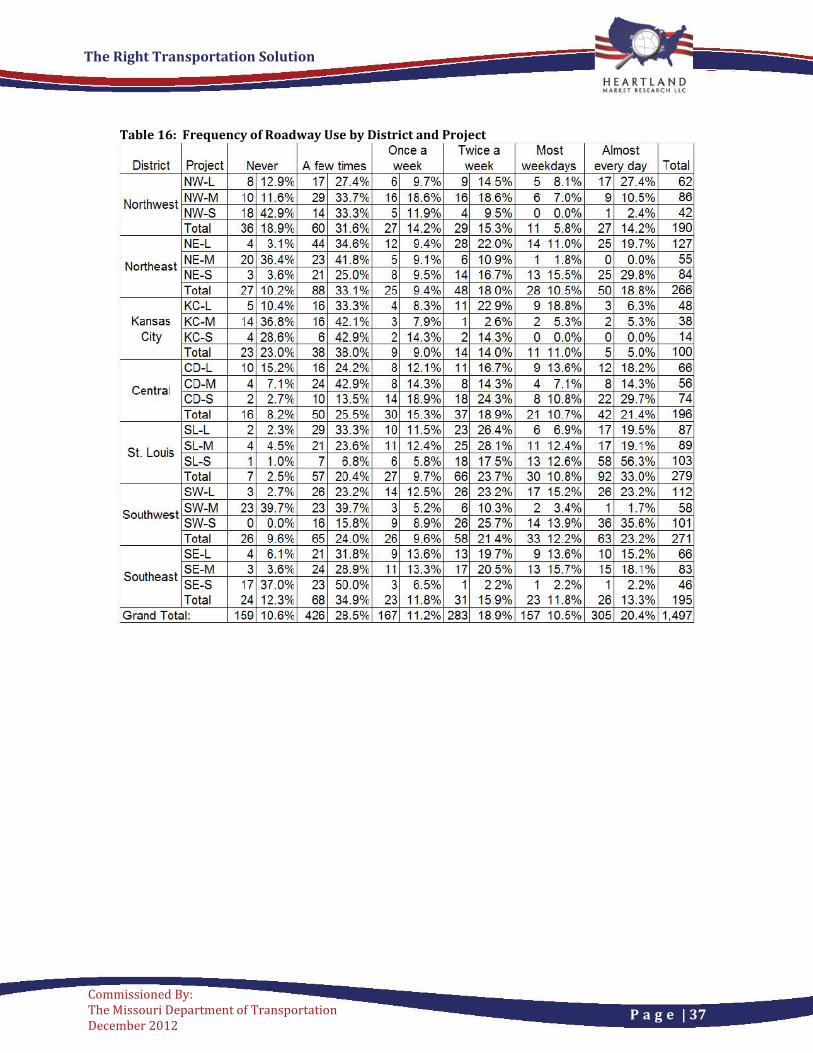
The following table summarizes the responses and percentages by both individual
projects and districts. There was a wide variety of average frequency of use among
the twenty-one projects. The respondents of projects NW-S, NE-M, KC-M, KC-S,
SW-M and SE-S were statistically less frequent users of their project roadway than
the other respondents. The respondents of projects SL-S and SW-S were
statistically more frequent users of their project roadway than the other respondents.
The Right Transportation Solution
P a g e | 37
Commissioned By: The Missouri Department of Transportation December 2012
Table 16: Frequency of Roadway Use by District and Project
Once a Twice a Most Almost District Project Never A few times week week weekdays every day Total
NW-L 8 12.9% 17 27.4% 6 9.7% 9 14.5% 5 8.1% 17 27.4% 62
Northwest NW-M 10 11 .6% 29 33.7% 16 18.6% 16 18.6% 6 7.0% 9 10.5% 86
NW-S 18 42.9% 14 33.3% 5 11.9% 4 9.5% 0 0.0% 1 2.4% 42 Total 36 18.9% 60 31.6% 27 14.2% 29 15.3% 11 5.8% 27 14.2% 190 NE-L 4 3.1% 44 34.6% 12 9.4% 28 22.0% 14 11 .0% 25 19.7% 127
Northeast NE-M 20 36.4% 23 41.8% 5 9.1% 6 10.9% 1 1.8% 0 0.0% 55 NE-S 3 3.6% 21 25.0% 8 9.5% 14 16.7% 13 15.5% 25 29.8% 84 Total 27 10.2% 88 33.1% 25 9.4% 48 180% 28 10.5% 50 18.8% 266 KC-L 5 10.4% 16 33.3% 4 8.3% 11 22.9% 9 18.8% 3 6.3% 48
Kansas KC-M 14 36.8% 16 42.1% 3 7.9% 1 2.6% 2 5.3% 2 5.3% 38 City KC-S 4 28.6% 6 42.9% 2 14.3% 2 14.3% 0 0.0% 0 0.0% 14
Total 23 23.0% 38 38.0% 9 9.0% 14 14.0% 11 11 .0% 5 5.0% 100 CO-L 10 15.2% 16 24.2% 8 12.1% 11 16.7% 9 13.6% 12 18.2% 66
Central CO-M 4 7.1% 24 42.9% 8 14.3% 8 14.3% 4 7.1% 8 14.3% 56 CD-S 2 2.7% 10 13.5% 14 18.9% 18 24.3% 8 10.8% 22 29.7% 74 Total 16 8.2% 50 25.5% 30 15.3% 37 189% 21 10.7% 42 21.4% 196 SL-L 2 2.3% 29 33.3% 10 11.5% 23 26.4% 6 6.9% 17 19.5% 87
St. Louis SL-M 4 4.5% 21 23.6% 11 12.4% 25 28.1% 11 12.4% 17 19.1% 89 SL-S 1 1.0% 7 6.8% 6 5.8% 18 17.5% 13 12.6% 58 56.3% 103 Total 7 2.5% 57 20.4% 27 9.7% 66 23.7% 30 10.8% 92 33.0% 279 SW-L 3 2.7% 26 23.2% 14 12.5% 26 23.2% 17 15.2% 26 23.2% 112
Southwest SW-M 23 39.7% 23 39.7% 3 5.2% 6 10.3% 2 3.4% 1 1.7% 58 SW-S 0 0.0% 16 15.8% 9 8.9% 26 25.7% 14 13.9% 36 35.6% 101 Total 26 9.6% 65 24.0% 26 9.6% 58 21 4% 33 12.2% 63 23.2% 271 SE-L 4 6.1% 21 31.8% 9 13.6% 13 19.7% 9 13.6% 10 15.2% 66
Southeast SE-M 3 3.6% 24 28.9% 11 13.3% 17 20.5% 13 15.7% 15 18.1% 83 SE-S 17 37.0% 23 50.0% 3 6.5% 1 2.2% 1 2.2% 1 2.2% 46 Total 24 12.3% 68 34.9% 23 11.8% 31 15.9% 23 11 .8% 26 13.3% 195
Grand Total: 159 10.6% 426 28.5% 167 11.2% 283 18.9% 157 10.5% 305 20.4% 1,497
The Right Transportation Solution
P a g e | 38
Commissioned By: The Missouri Department of Transportation December 2012
THE RIGHT TRANSPORTATION SOLUTION
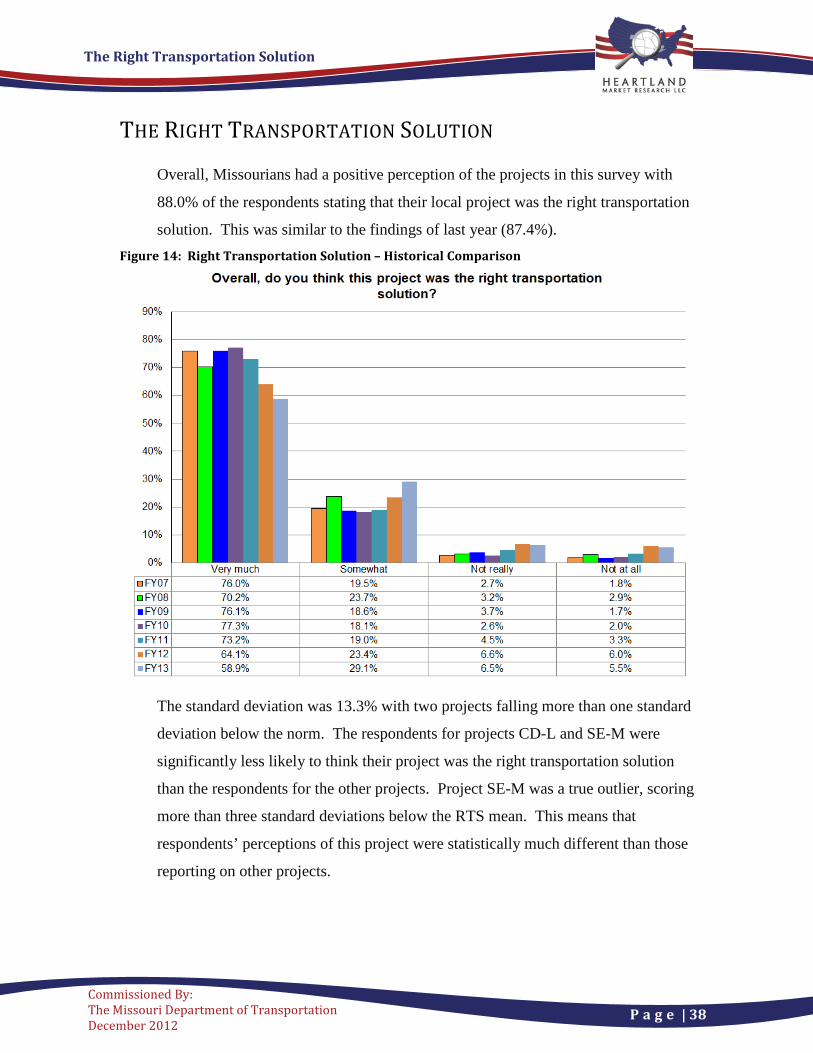
Overall, Missourians had a positive perception of the projects in this survey with
88.0% of the respondents stating that their local project was the right transportation
solution. This was similar to the findings of last year (87.4%). Figure 14: Right Transportation Solution – Historical Comparison
The standard deviation was 13.3% with two projects falling more than one standard
deviation below the norm. The respondents for projects CD-L and SE-M were
significantly less likely to think their project was the right transportation solution
than the respondents for the other projects. Project SE-M was a true outlier, scoring
more than three standard deviations below the RTS mean. This means that
respondents’ perceptions of this project were statistically much different than those
reporting on other projects.
The Right Transportation Solution
P a g e | 39
Commissioned By: The Missouri Department of Transportation December 2012
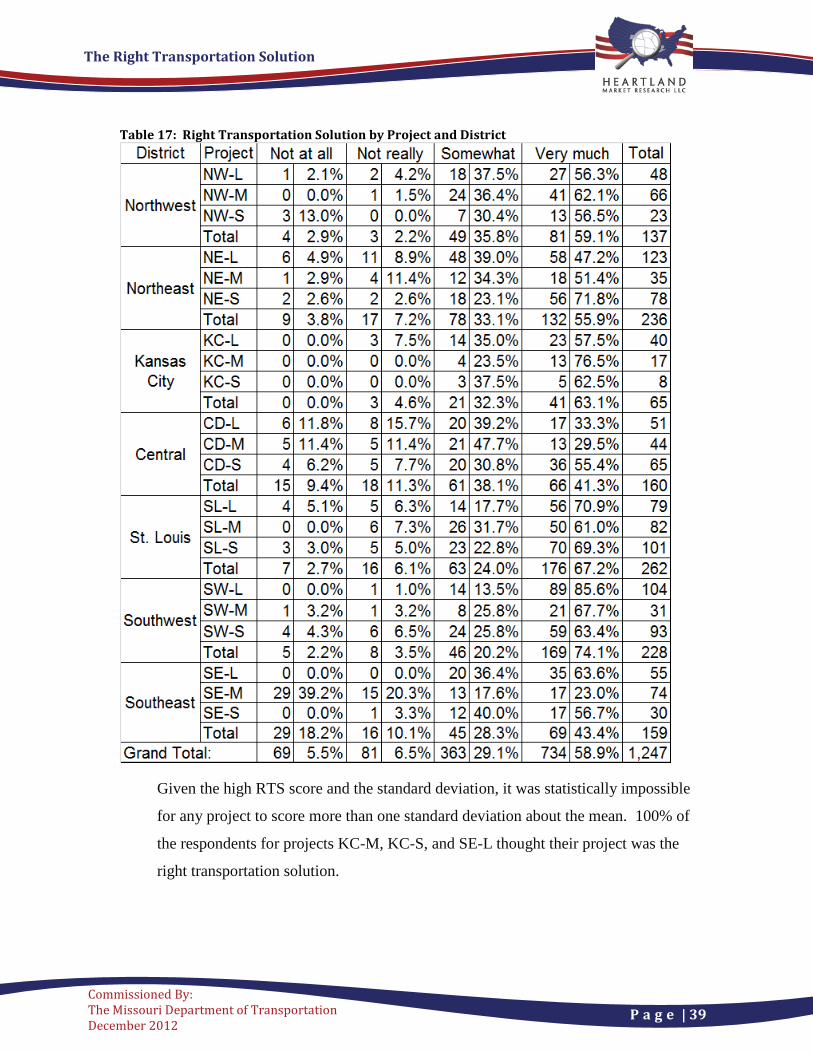
Table 17: Right Transportation Solution by Project and District
Given the high RTS score and the standard deviation, it was statistically impossible
for any project to score more than one standard deviation about the mean. 100% of
the respondents for projects KC-M, KC-S, and SE-L thought their project was the
right transportation solution.
The Right Transportation Solution
P a g e | 40
Commissioned By: The Missouri Department of Transportation December 2012
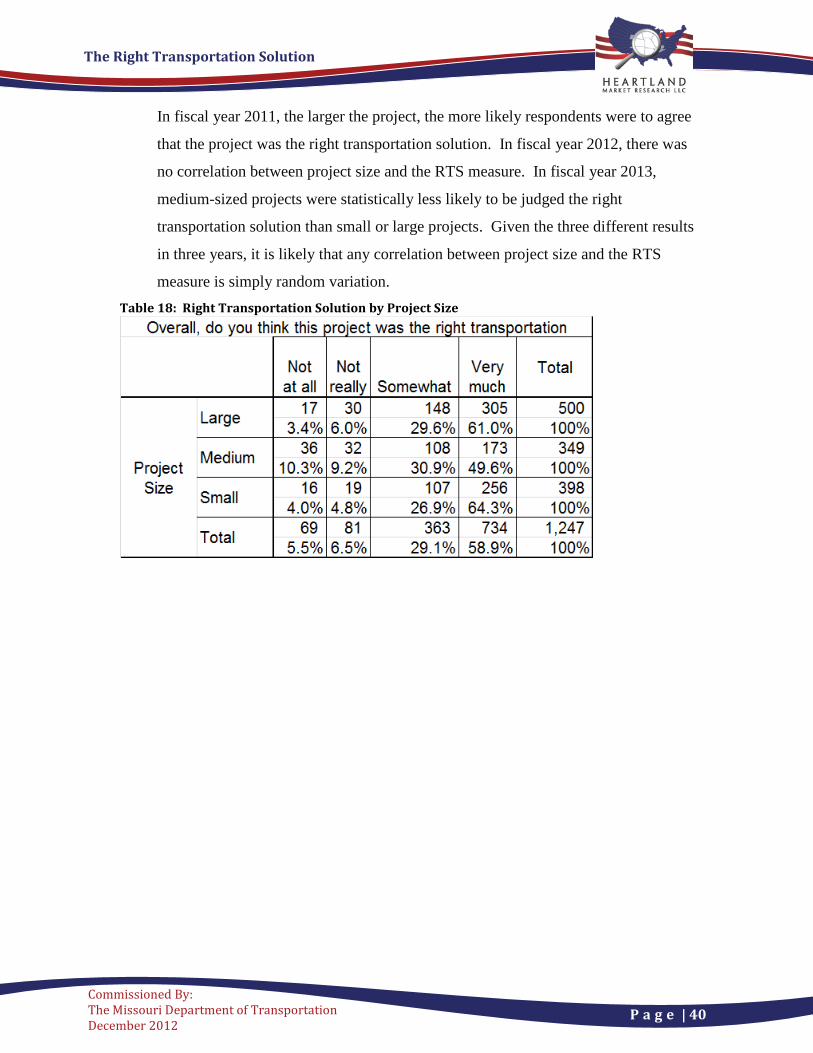
In fiscal year 2011, the larger the project, the more likely respondents were to agree
that the project was the right transportation solution. In fiscal year 2012, there was
no correlation between project size and the RTS measure. In fiscal year 2013,
medium-sized projects were statistically less likely to be judged the right
transportation solution than small or large projects. Given the three different results
in three years, it is likely that any correlation between project size and the RTS
measure is simply random variation. Table 18: Right Transportation Solution by Project Size
The Right Transportation Solution
P a g e | 41
Commissioned By: The Missouri Department of Transportation December 2012
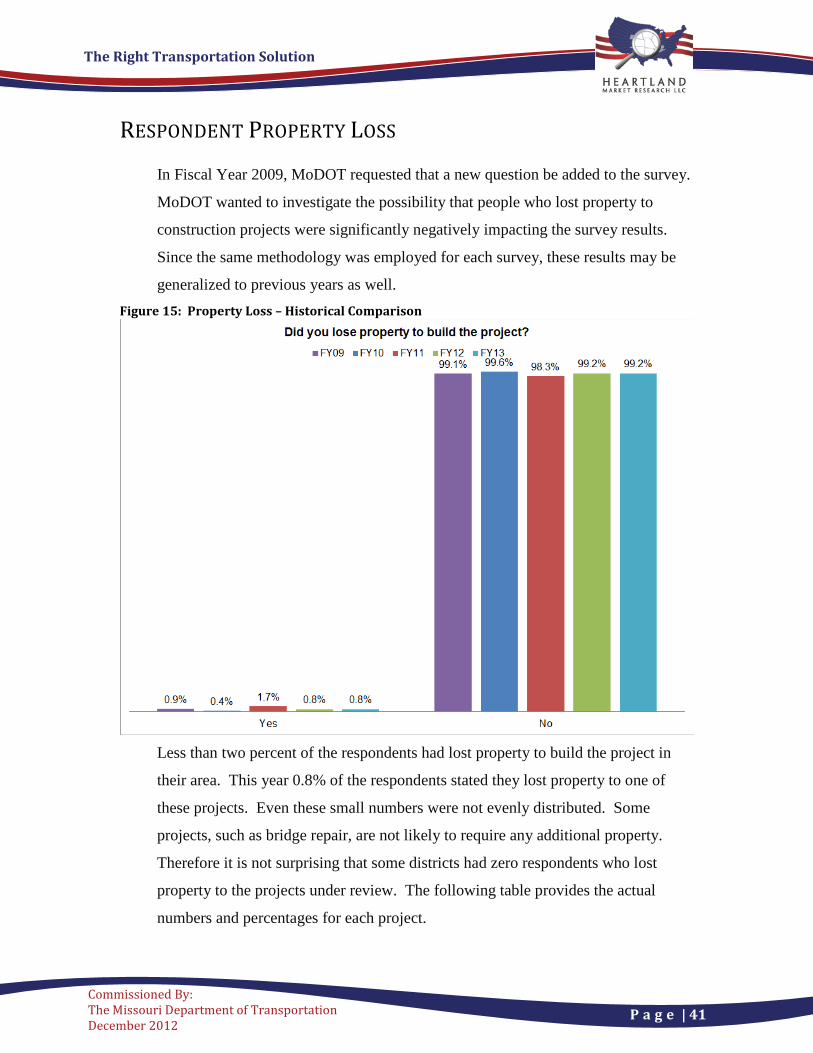
RESPONDENT PROPERTY LOSS
In Fiscal Year 2009, MoDOT requested that a new question be added to the survey.
MoDOT wanted to investigate the possibility that people who lost property to
construction projects were significantly negatively impacting the survey results.
Since the same methodology was employed for each survey, these results may be
generalized to previous years as well. Figure 15: Property Loss – Historical Comparison
Less than two percent of the respondents had lost property to build the project in
their area. This year 0.8% of the respondents stated they lost property to one of
these projects. Even these small numbers were not evenly distributed. Some
projects, such as bridge repair, are not likely to require any additional property.
Therefore it is not surprising that some districts had zero respondents who lost
property to the projects under review. The following table provides the actual
numbers and percentages for each project.
The Right Transportation Solution
P a g e | 42
Commissioned By: The Missouri Department of Transportation December 2012
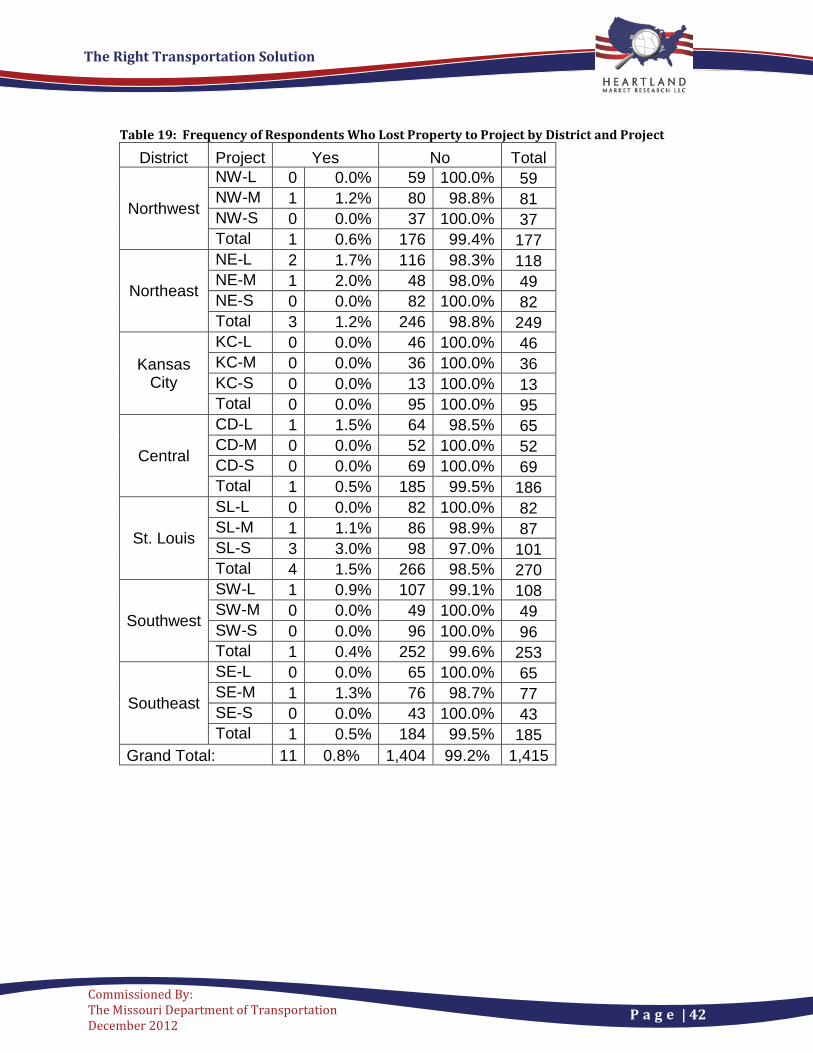
Table 19: Frequency of Respondents Who Lost Property to Project by District and Project
District Project Yes No Total
Northwest
NW-L 0 0.0% 59 100.0% 59 NW-M 1 1.2% 80 98.8% 81 NW-S 0 0.0% 37 100.0% 37 Total 1 0.6% 176 99.4% 177
Northeast
NE-L 2 1.7% 116 98.3% 118 NE-M 1 2.0% 48 98.0% 49 NE-S 0 0.0% 82 100.0% 82 Total 3 1.2% 246 98.8% 249
Kansas City
KC-L 0 0.0% 46 100.0% 46 KC-M 0 0.0% 36 100.0% 36 KC-S 0 0.0% 13 100.0% 13 Total 0 0.0% 95 100.0% 95
Central
CD-L 1 1.5% 64 98.5% 65 CD-M 0 0.0% 52 100.0% 52 CD-S 0 0.0% 69 100.0% 69 Total 1 0.5% 185 99.5% 186
St. Louis
SL-L 0 0.0% 82 100.0% 82 SL-M 1 1.1% 86 98.9% 87 SL-S 3 3.0% 98 97.0% 101 Total 4 1.5% 266 98.5% 270
Southwest
SW-L 1 0.9% 107 99.1% 108 SW-M 0 0.0% 49 100.0% 49 SW-S 0 0.0% 96 100.0% 96 Total 1 0.4% 252 99.6% 253
Southeast
SE-L 0 0.0% 65 100.0% 65 SE-M 1 1.3% 76 98.7% 77 SE-S 0 0.0% 43 100.0% 43 Total 1 0.5% 184 99.5% 185
Grand Total: 11 0.8% 1,404 99.2% 1,415
The Right Transportation Solution
P a g e | 43
Commissioned By: The Missouri Department of Transportation December 2012
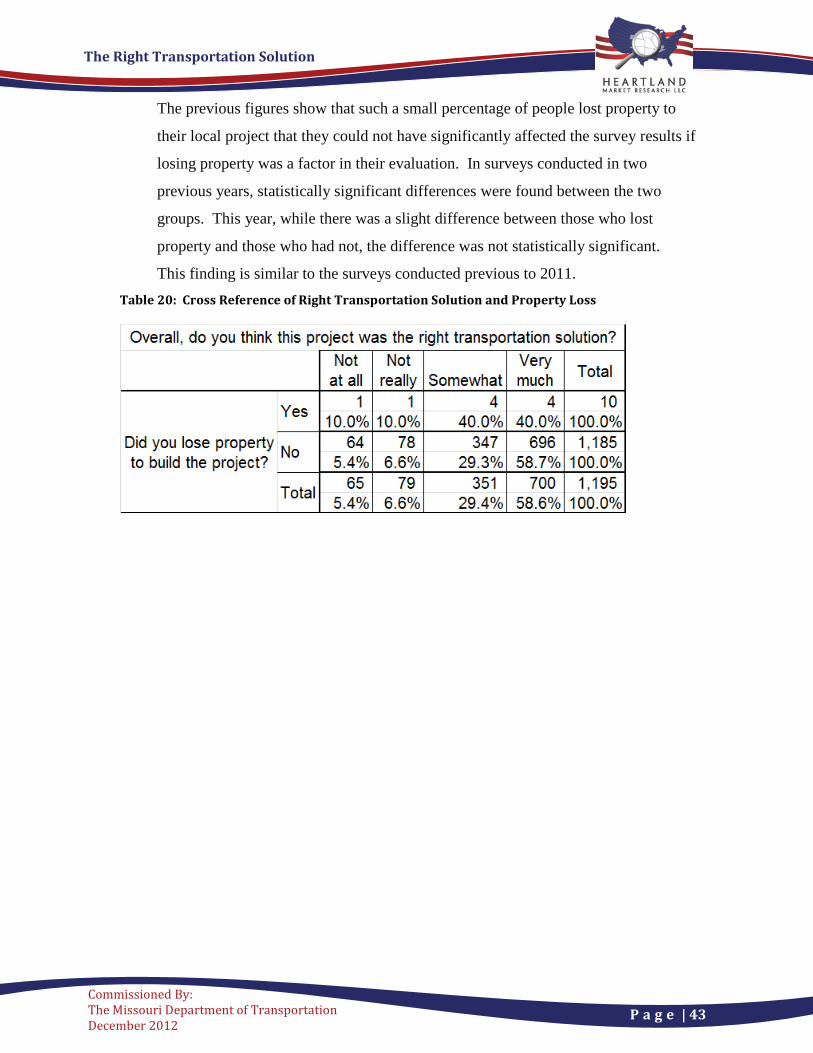
The previous figures show that such a small percentage of people lost property to
their local project that they could not have significantly affected the survey results if
losing property was a factor in their evaluation. In surveys conducted in two
previous years, statistically significant differences were found between the two
groups. This year, while there was a slight difference between those who lost
property and those who had not, the difference was not statistically significant.
This finding is similar to the surveys conducted previous to 2011. Table 20: Cross Reference of Right Transportation Solution and Property Loss

The Right Transportation Solution
P a g e | 44
Commissioned By: The Missouri Department of Transportation December 2012
THE RIGHT PRIORITY
At MoDOT’s request, a new question was added to the survey in Fiscal Year 2009
to help investigate a potential reason why some respondents did not believe their
project to be the right transportation solution. This year, 18.8% of the respondents
felt another project should have been commissioned before their particular project.
This is lower than that record last year, but is still the second highest percentage
recorded for this measure since it was first employed. This relatively high measure
may explain why many of the other measures scored lower this year compared to
previous years. Figure 16: Priority – Historical Comparison
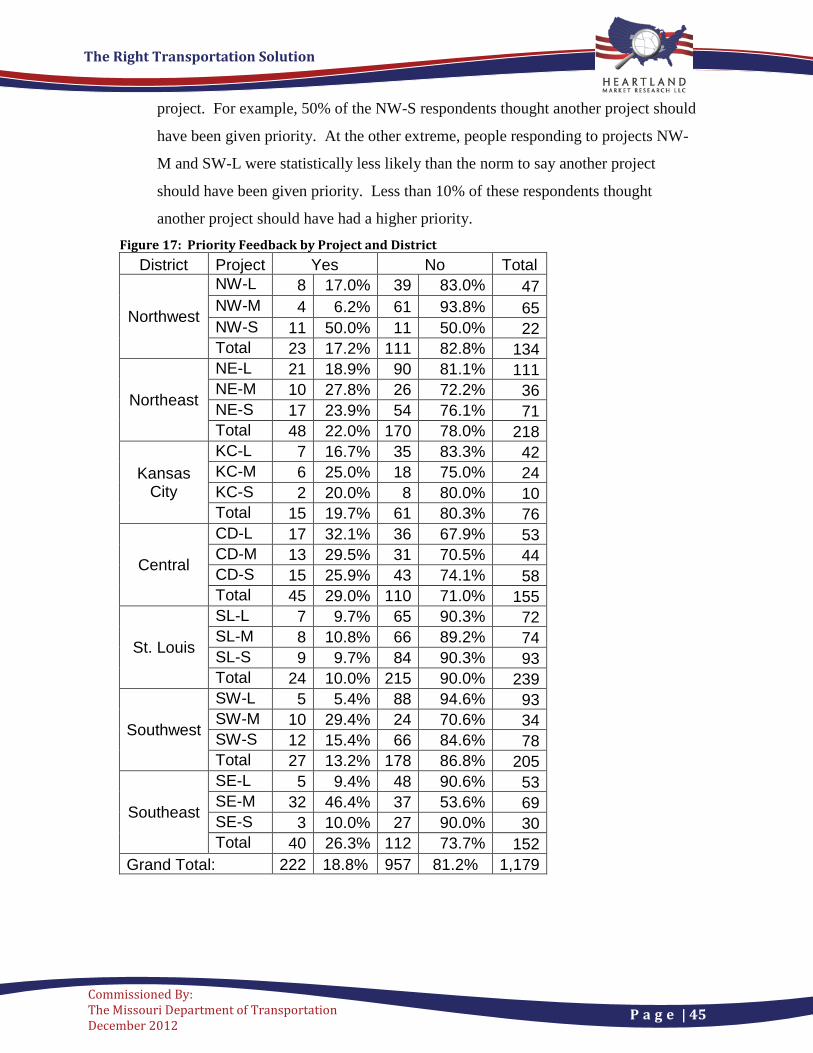
These responses were not evenly distributed across the state. The respondents from
five projects were statistically more likely to fall at least one standard deviation
(11.0%) from the normal range. People from NW-S, CD-L, and SE-M were much
more likely to think another project should have been given priority over their local
The Right Transportation Solution
P a g e | 45
Commissioned By: The Missouri Department of Transportation December 2012
project. For example, 50% of the NW-S respondents thought another project should
have been given priority. At the other extreme, people responding to projects NW-
M and SW-L were statistically less likely than the norm to say another project
should have been given priority. Less than 10% of these respondents thought
another project should have had a higher priority. Figure 17: Priority Feedback by Project and District
District Project Yes No Total
Northwest
NW-L 8 17.0% 39 83.0% 47 NW-M 4 6.2% 61 93.8% 65 NW-S 11 50.0% 11 50.0% 22 Total 23 17.2% 111 82.8% 134
Northeast
NE-L 21 18.9% 90 81.1% 111 NE-M 10 27.8% 26 72.2% 36 NE-S 17 23.9% 54 76.1% 71 Total 48 22.0% 170 78.0% 218
Kansas City
KC-L 7 16.7% 35 83.3% 42 KC-M 6 25.0% 18 75.0% 24 KC-S 2 20.0% 8 80.0% 10 Total 15 19.7% 61 80.3% 76
Central
CD-L 17 32.1% 36 67.9% 53 CD-M 13 29.5% 31 70.5% 44 CD-S 15 25.9% 43 74.1% 58 Total 45 29.0% 110 71.0% 155
St. Louis
SL-L 7 9.7% 65 90.3% 72 SL-M 8 10.8% 66 89.2% 74 SL-S 9 9.7% 84 90.3% 93 Total 24 10.0% 215 90.0% 239
Southwest
SW-L 5 5.4% 88 94.6% 93 SW-M 10 29.4% 24 70.6% 34 SW-S 12 15.4% 66 84.6% 78 Total 27 13.2% 178 86.8% 205
Southeast
SE-L 5 9.4% 48 90.6% 53 SE-M 32 46.4% 37 53.6% 69 SE-S 3 10.0% 27 90.0% 30 Total 40 26.3% 112 73.7% 152
Grand Total: 222 18.8% 957 81.2% 1,179
The Right Transportation Solution
P a g e | 46
Commissioned By: The Missouri Department of Transportation December 2012
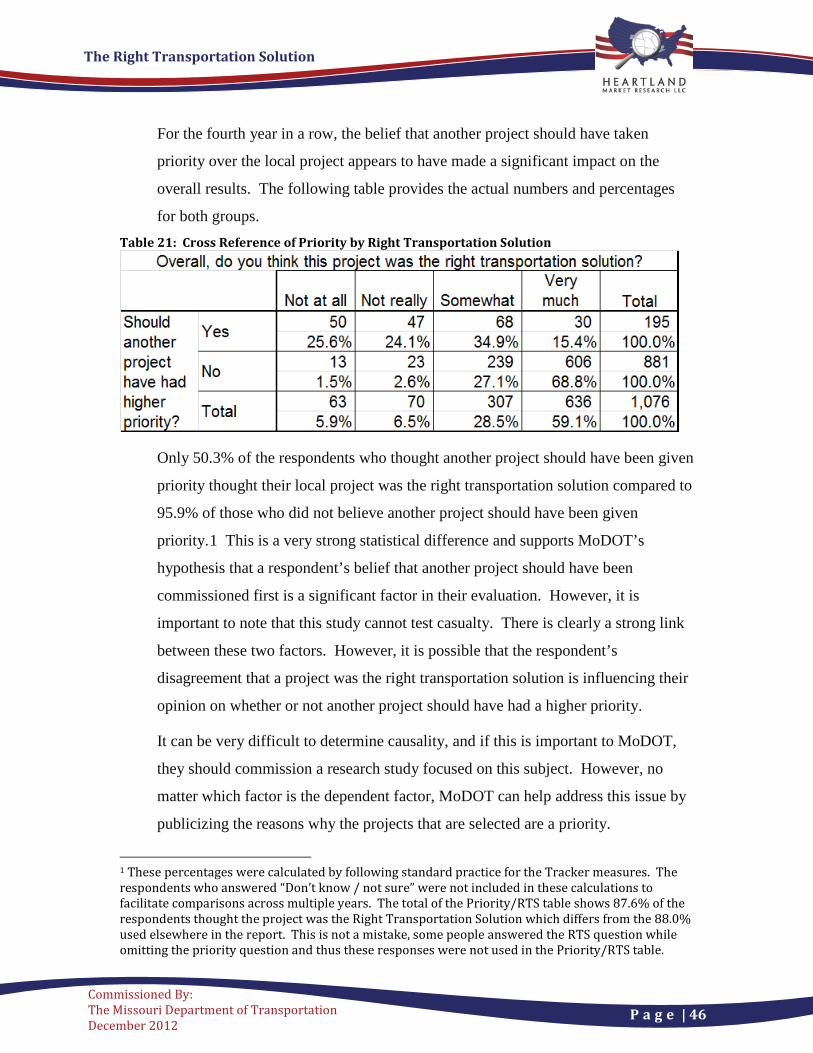
For the fourth year in a row, the belief that another project should have taken
priority over the local project appears to have made a significant impact on the
overall results. The following table provides the actual numbers and percentages
for both groups. Table 21: Cross Reference of Priority by Right Transportation Solution
Only 50.3% of the respondents who thought another project should have been given
priority thought their local project was the right transportation solution compared to
95.9% of those who did not believe another project should have been given
priority.1 This is a very strong statistical difference and supports MoDOT’s
hypothesis that a respondent’s belief that another project should have been
commissioned first is a significant factor in their evaluation. However, it is
important to note that this study cannot test casualty. There is clearly a strong link
between these two factors. However, it is possible that the respondent’s
disagreement that a project was the right transportation solution is influencing their
opinion on whether or not another project should have had a higher priority.
It can be very difficult to determine causality, and if this is important to MoDOT,
they should commission a research study focused on this subject. However, no
matter which factor is the dependent factor, MoDOT can help address this issue by
publicizing the reasons why the projects that are selected are a priority.
1 These percentages were calculated by following standard practice for the Tracker measures. The respondents who answered “Don’t know / not sure” were not included in these calculations to facilitate comparisons across multiple years. The total of the Priority/RTS table shows 87.6% of the respondents thought the project was the Right Transportation Solution which differs from the 88.0% used elsewhere in the report. This is not a mistake, some people answered the RTS question while omitting the priority question and thus these responses were not used in the Priority/RTS table.
The Right Transportation Solution
P a g e | 47
Commissioned By: The Missouri Department of Transportation December 2012
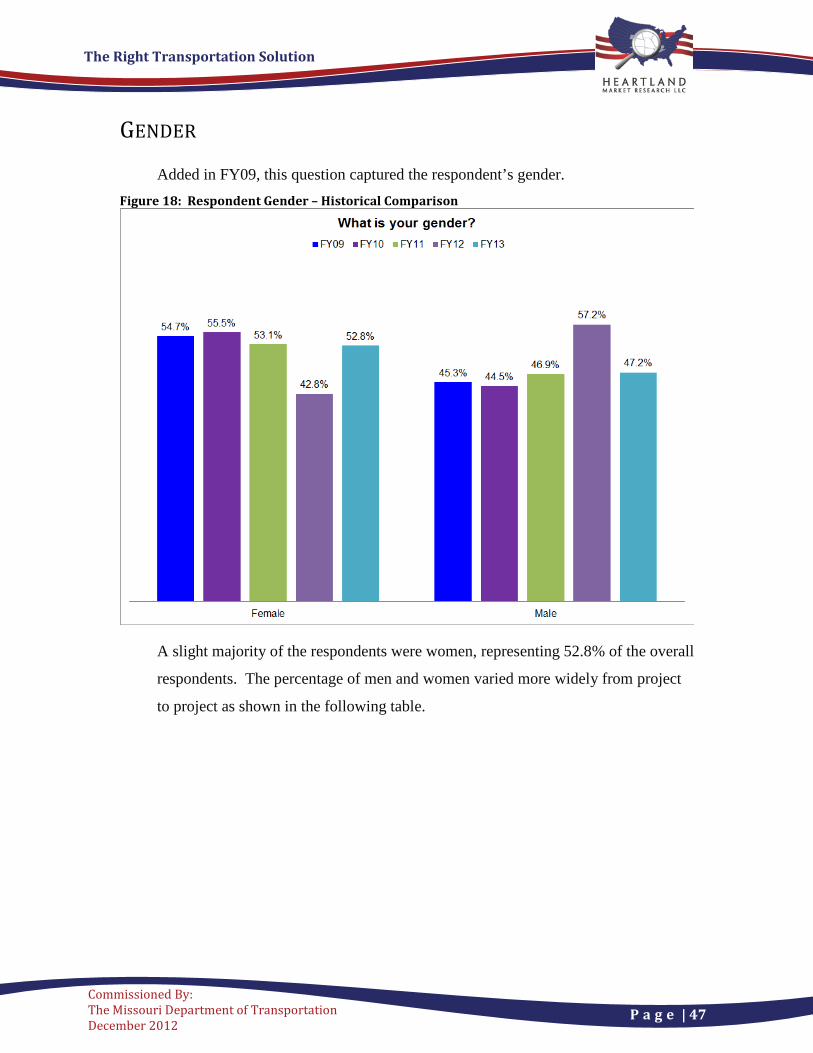
GENDER
Added in FY09, this question captured the respondent’s gender. Figure 18: Respondent Gender – Historical Comparison
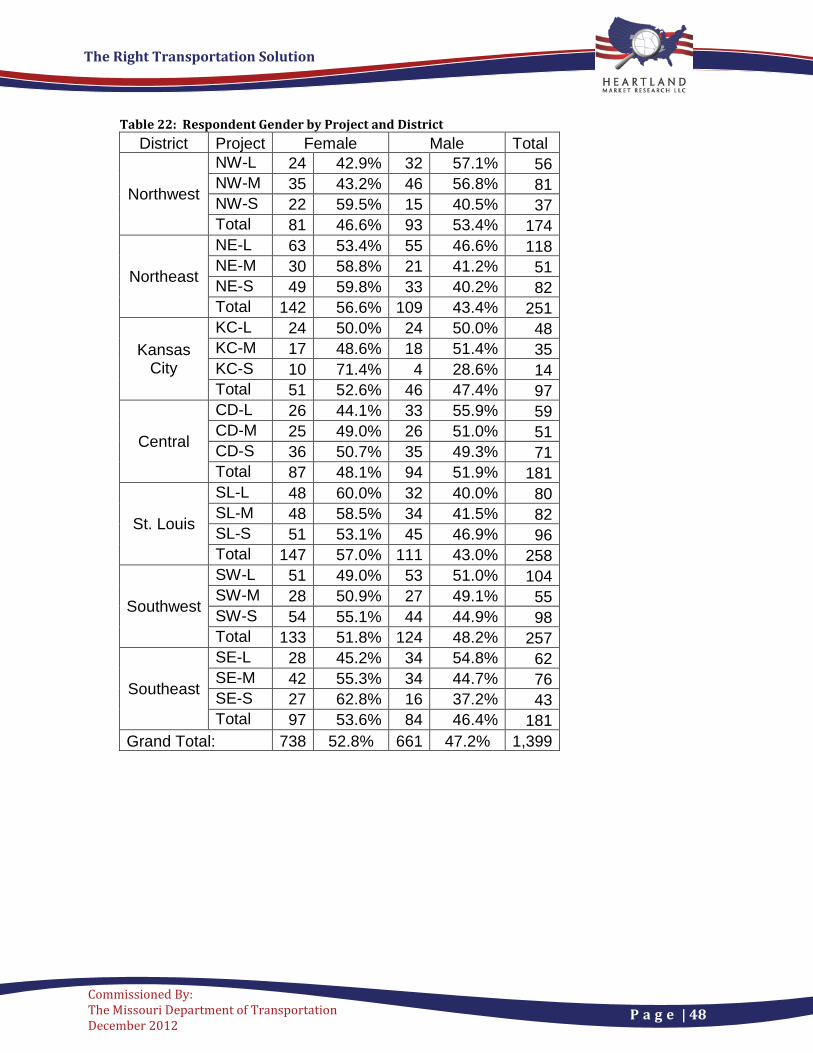
A slight majority of the respondents were women, representing 52.8% of the overall
respondents. The percentage of men and women varied more widely from project
to project as shown in the following table.
The Right Transportation Solution
P a g e | 48
Commissioned By: The Missouri Department of Transportation December 2012
Table 22: Respondent Gender by Project and District
District Project Female Male Total
Northwest
NW-L 24 42.9% 32 57.1% 56 NW-M 35 43.2% 46 56.8% 81 NW-S 22 59.5% 15 40.5% 37 Total 81 46.6% 93 53.4% 174
Northeast
NE-L 63 53.4% 55 46.6% 118 NE-M 30 58.8% 21 41.2% 51 NE-S 49 59.8% 33 40.2% 82 Total 142 56.6% 109 43.4% 251
Kansas City
KC-L 24 50.0% 24 50.0% 48 KC-M 17 48.6% 18 51.4% 35 KC-S 10 71.4% 4 28.6% 14 Total 51 52.6% 46 47.4% 97
Central
CD-L 26 44.1% 33 55.9% 59 CD-M 25 49.0% 26 51.0% 51 CD-S 36 50.7% 35 49.3% 71 Total 87 48.1% 94 51.9% 181
St. Louis
SL-L 48 60.0% 32 40.0% 80 SL-M 48 58.5% 34 41.5% 82 SL-S 51 53.1% 45 46.9% 96 Total 147 57.0% 111 43.0% 258
Southwest
SW-L 51 49.0% 53 51.0% 104 SW-M 28 50.9% 27 49.1% 55 SW-S 54 55.1% 44 44.9% 98 Total 133 51.8% 124 48.2% 257
Southeast
SE-L 28 45.2% 34 54.8% 62 SE-M 42 55.3% 34 44.7% 76 SE-S 27 62.8% 16 37.2% 43 Total 97 53.6% 84 46.4% 181
Grand Total: 738 52.8% 661 47.2% 1,399
The Right Transportation Solution
P a g e | 49
Commissioned By: The Missouri Department of Transportation December 2012
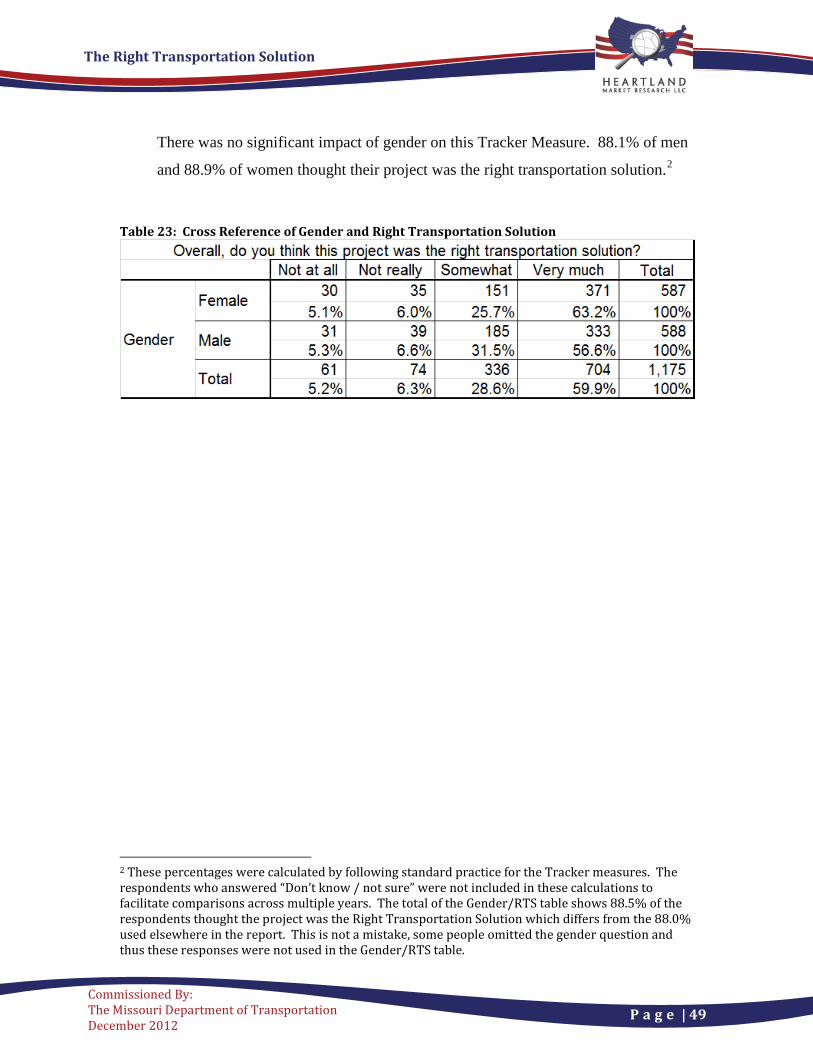
There was no significant impact of gender on this Tracker Measure. 88.1% of men
and 88.9% of women thought their project was the right transportation solution.2
Table 23: Cross Reference of Gender and Right Transportation Solution
2 These percentages were calculated by following standard practice for the Tracker measures. The respondents who answered “Don’t know / not sure” were not included in these calculations to facilitate comparisons across multiple years. The total of the Gender/RTS table shows 88.5% of the respondents thought the project was the Right Transportation Solution which differs from the 88.0% used elsewhere in the report. This is not a mistake, some people omitted the gender question and thus these responses were not used in the Gender/RTS table.
The Right Transportation Solution
P a g e | 50
Commissioned By: The Missouri Department of Transportation December 2012
ETHNICITY
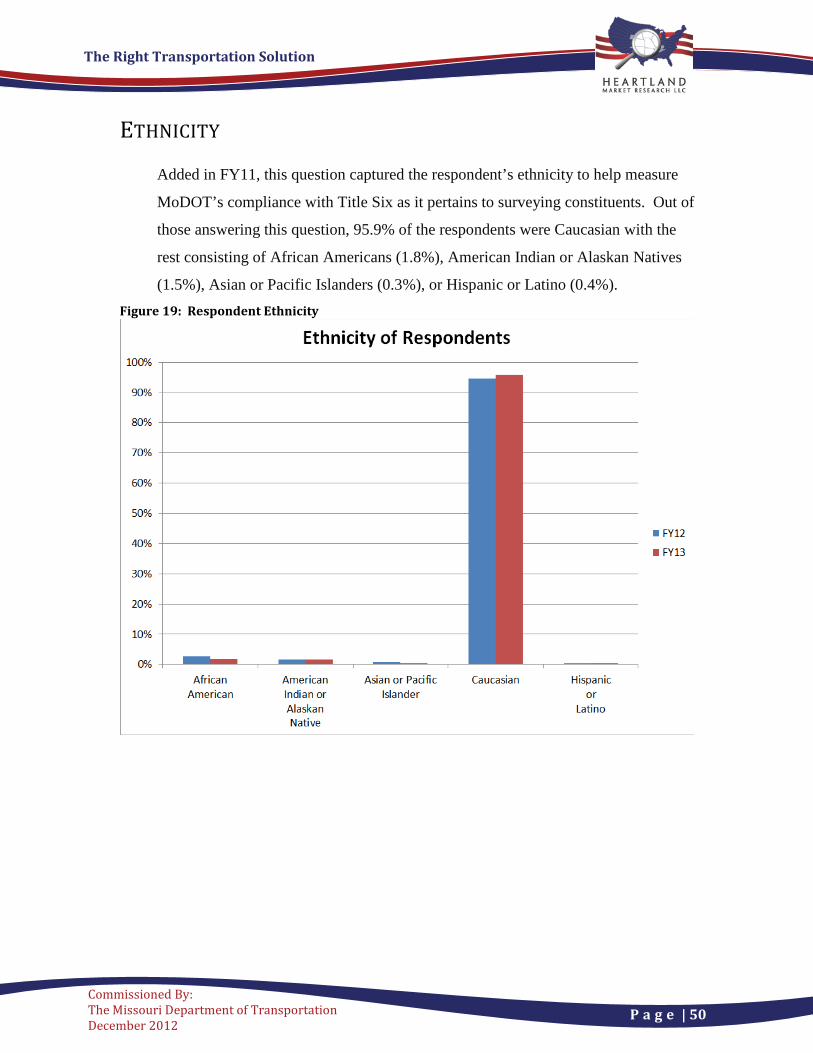
Added in FY11, this question captured the respondent’s ethnicity to help measure
MoDOT’s compliance with Title Six as it pertains to surveying constituents. Out of
those answering this question, 95.9% of the respondents were Caucasian with the
rest consisting of African Americans (1.8%), American Indian or Alaskan Natives
(1.5%), Asian or Pacific Islanders (0.3%), or Hispanic or Latino (0.4%). Figure 19: Respondent Ethnicity
The Right Transportation Solution
P a g e | 51
Commissioned By: The Missouri Department of Transportation December 2012
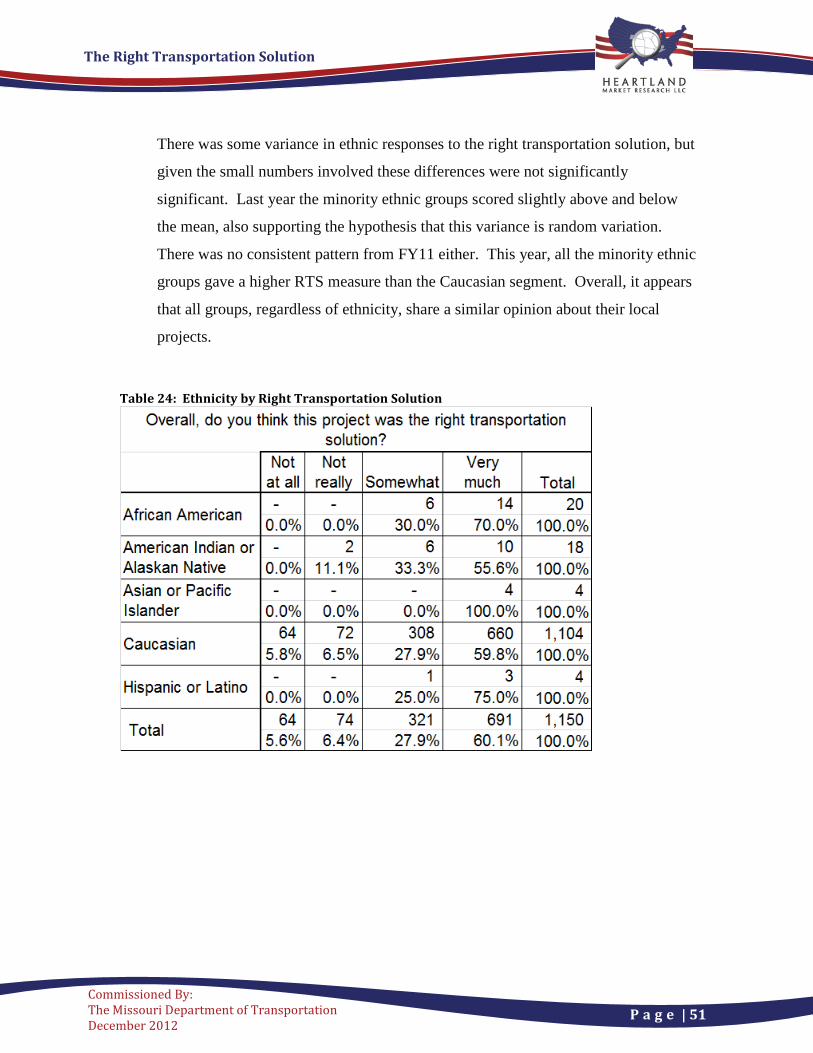
There was some variance in ethnic responses to the right transportation solution, but
given the small numbers involved these differences were not significantly
significant. Last year the minority ethnic groups scored slightly above and below
the mean, also supporting the hypothesis that this variance is random variation.
There was no consistent pattern from FY11 either. This year, all the minority ethnic
groups gave a higher RTS measure than the Caucasian segment. Overall, it appears
that all groups, regardless of ethnicity, share a similar opinion about their local
projects.
Table 24: Ethnicity by Right Transportation Solution
The Right Transportation Solution
P a g e | 52
Commissioned By: The Missouri Department of Transportation December 2012
NEW QUESTIONS
Two new questions were added to the survey this year. A question was added to
investigate when people first learned about the project. Another question was
added to measure citizens’ overall satisfaction with the project.
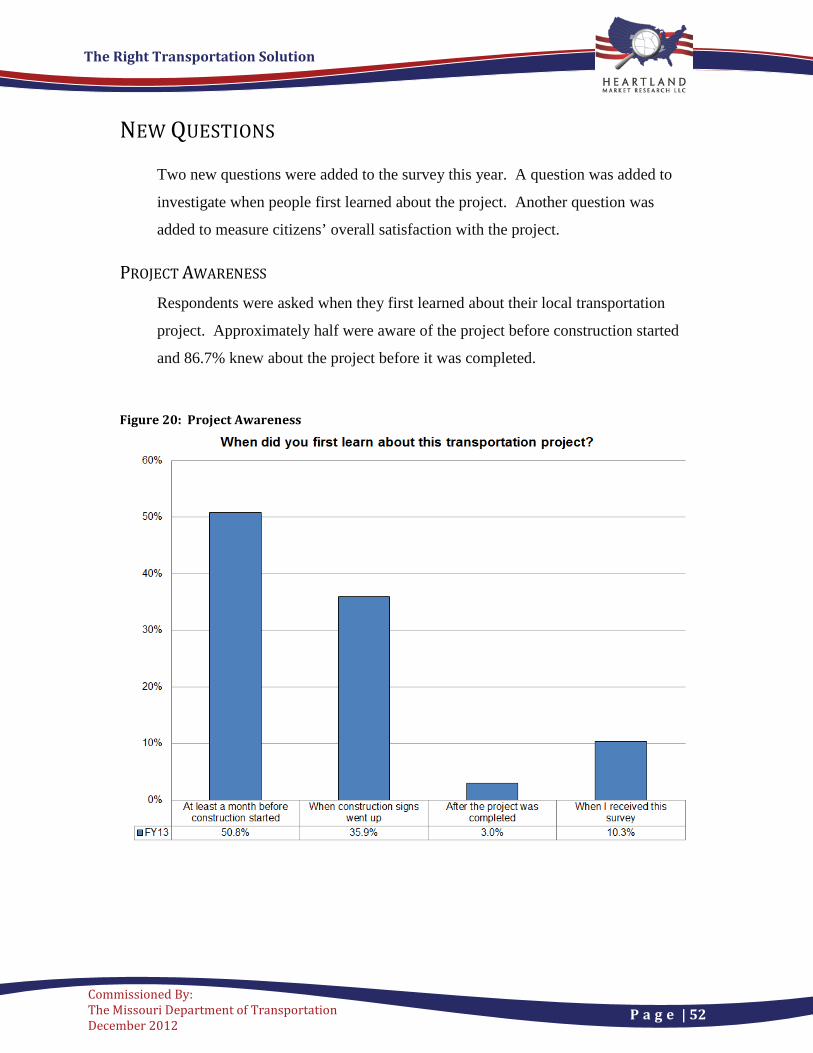
PROJECT AWARENESS Respondents were asked when they first learned about their local transportation
project. Approximately half were aware of the project before construction started
and 86.7% knew about the project before it was completed.
Figure 20: Project Awareness
The Right Transportation Solution
P a g e | 53
Commissioned By: The Missouri Department of Transportation December 2012
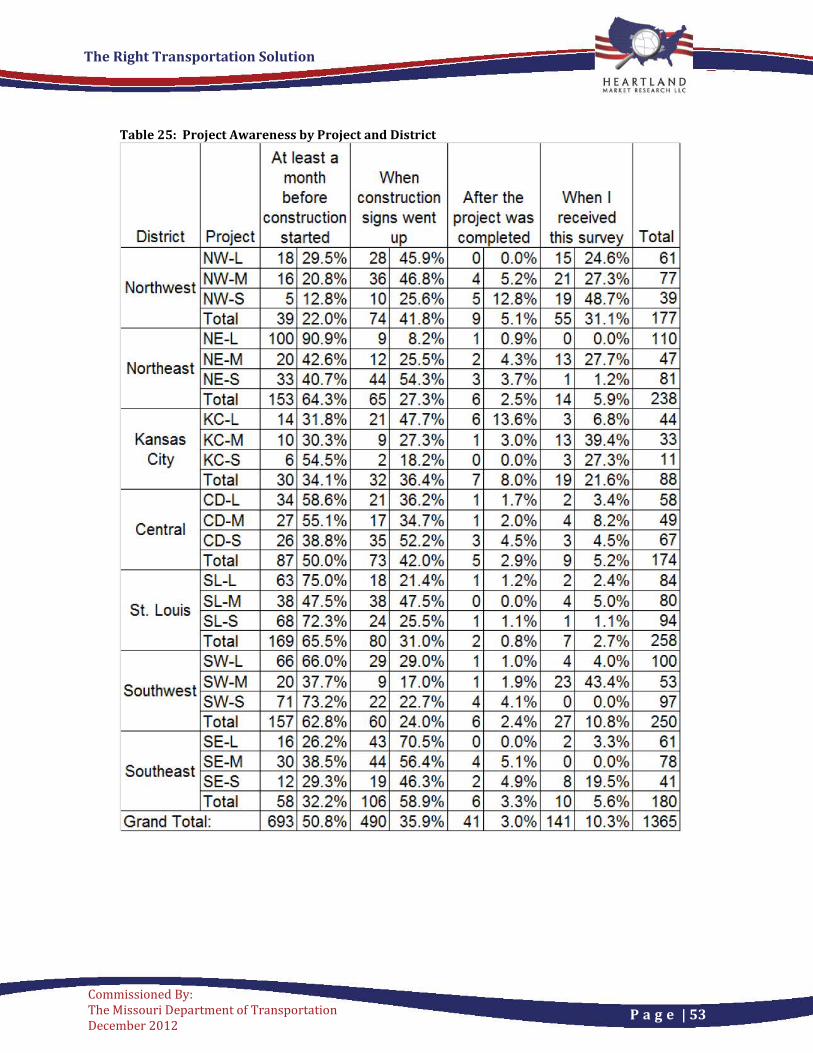
Table 25: Project Awareness by Project and District
At least a month When before construction After the When I
construction signs went project was received District Project started up completed this survey Total
NW-L 18 29.5% 28 45.9% 0 0.0% 15 24.6% 61
Northwest NW-M 16 20.8% 36 46.8% 4 5.2% 21 27.3% 77 NW-S 5 12.8% 10 25.6% 5 12.8% 19 48.7% 39
I Total 39 22.0% 74 41 .8% 9 5.1% 55 31 .1% 177 I NE-L 100 90.9% 9 8.2% 1 0.9% 0 0.0% 110
Northeast NE-M 20 42.6% 12 25.5% 2 4.3% 13 27.7% 47 NE-S 33 40.7% 44 54.3% 3 3.7% 1 1.2% 81
I Total 153 64.3% 65 27.3% 6 2.5% 14 5.9% 238 I KC-L 14 31.8% 21 47.7% 6 13.6% 3 6.8% 44
Kansas KC-M 10 30.3% 9 27.3% 1 3.0% 13 39.4% 33
I City KC-S 6 54.5% 2 18.2% 0 0.0% 3 27.3% 11
Total 30 34.1 % 32 36.4% 7 8.0% 19 21 .6% 88 I CD-L 34 58.6% 21 36.2% 1 1.7% 2 3.4% 58
Central CD-M 27 55.1% 17 34.7% 1 2.0% 4 8.2% 49 CD-S 26 38.8% 35 52.2% 3 4.5% 3 4.5% 67
I Total 87 50.0% 73 42.0% 5 2.9% 9 5.2% 174 I SL-L 63 75.0% 18 21 .4% 1 1.2% 2 2.4% 84
St. Louis SL-M 38 47.5% 38 47.5% 0 0.0% 4 5.0% 80 SL-S 68 72.3% 24 25.5% 1 1.1% 1 1.1% 94
I Total 169 65.5% 80 31 .0% 2 0.8% 7 2.7% 258 I SW-L 66 66.0% 29 29.0% 1 1.0% 4 4.0% 100
Southwest SW-M 20 37.7% 9 17.0% 1 1.9% 23 43.4% 53 SW-S 71 73.2% 22 22.7% 4 4.1% 0 0.0% 97
I Total 157 62.8% 60 24.0% 6 2.4% 27 10.8% 250 I SE-L 16 26.2% 43 70.5% 0 0.0% 2 3.3% 61
Southeast SE-M 30 38.5% 44 56.4% 4 5.1% 0 0.0% 78 SE-S 12 29.3% 19 46.3% 2 4.9% 8 19.5% 41 Total 58 32.2% 106 58.9% 6 3.3% 10 5.6% 180
Grand Total: 693 50.8% 490 35.9% 41 3.0% 141 10.3% 1365
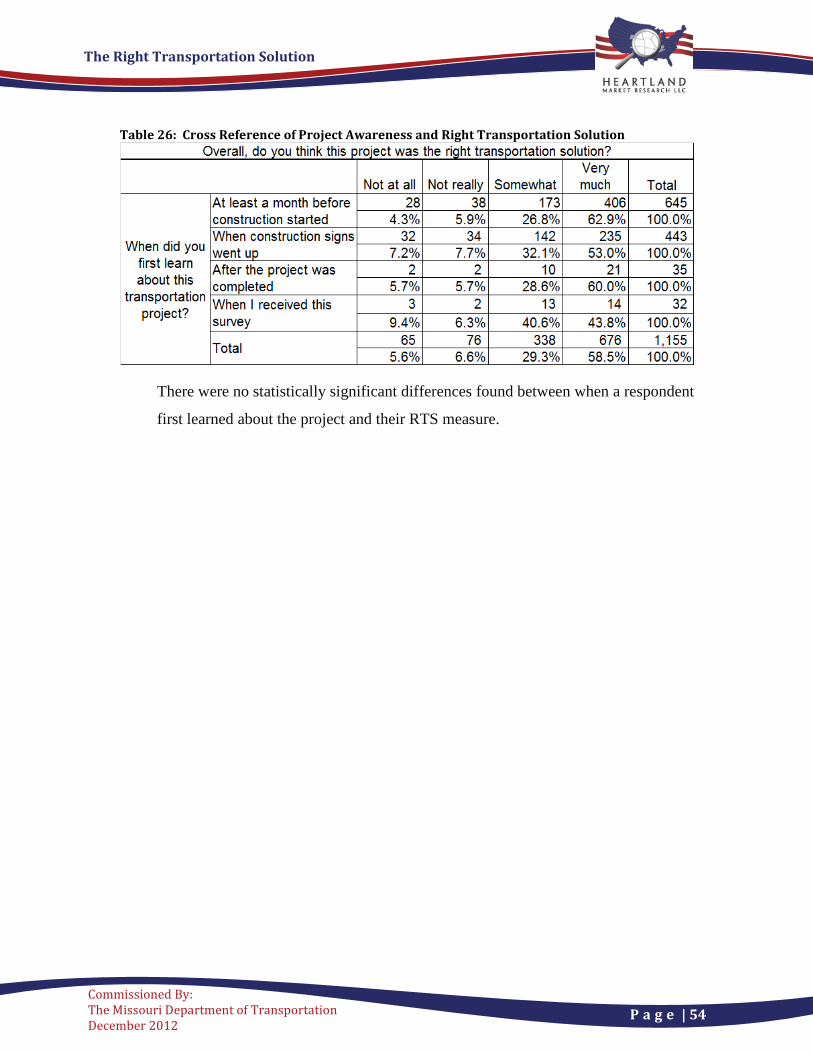
The Right Transportation Solution
P a g e | 54
Commissioned By: The Missouri Department of Transportation December 2012
Table 26: Cross Reference of Project Awareness and Right Transportation Solution
There were no statistically significant differences found between when a respondent
first learned about the project and their RTS measure.
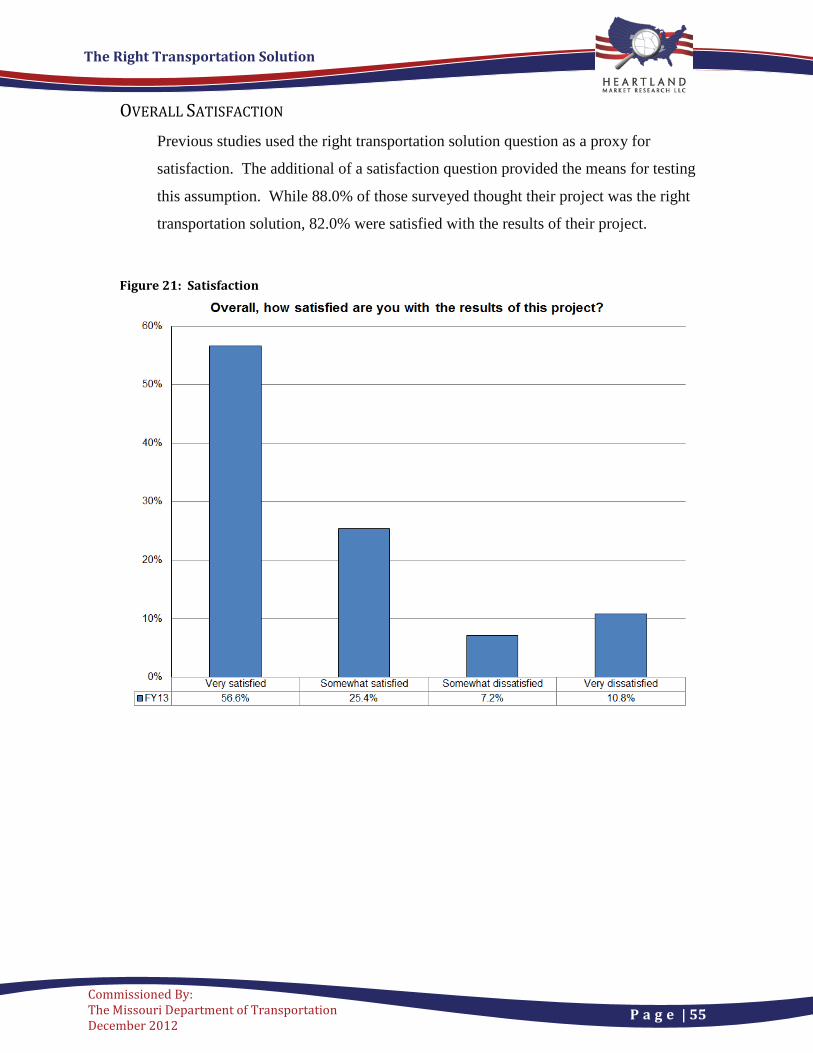
The Right Transportation Solution
P a g e | 55
Commissioned By: The Missouri Department of Transportation December 2012
OVERALL SATISFACTION Previous studies used the right transportation solution question as a proxy for
satisfaction. The additional of a satisfaction question provided the means for testing
this assumption. While 88.0% of those surveyed thought their project was the right
transportation solution, 82.0% were satisfied with the results of their project.
Figure 21: Satisfaction
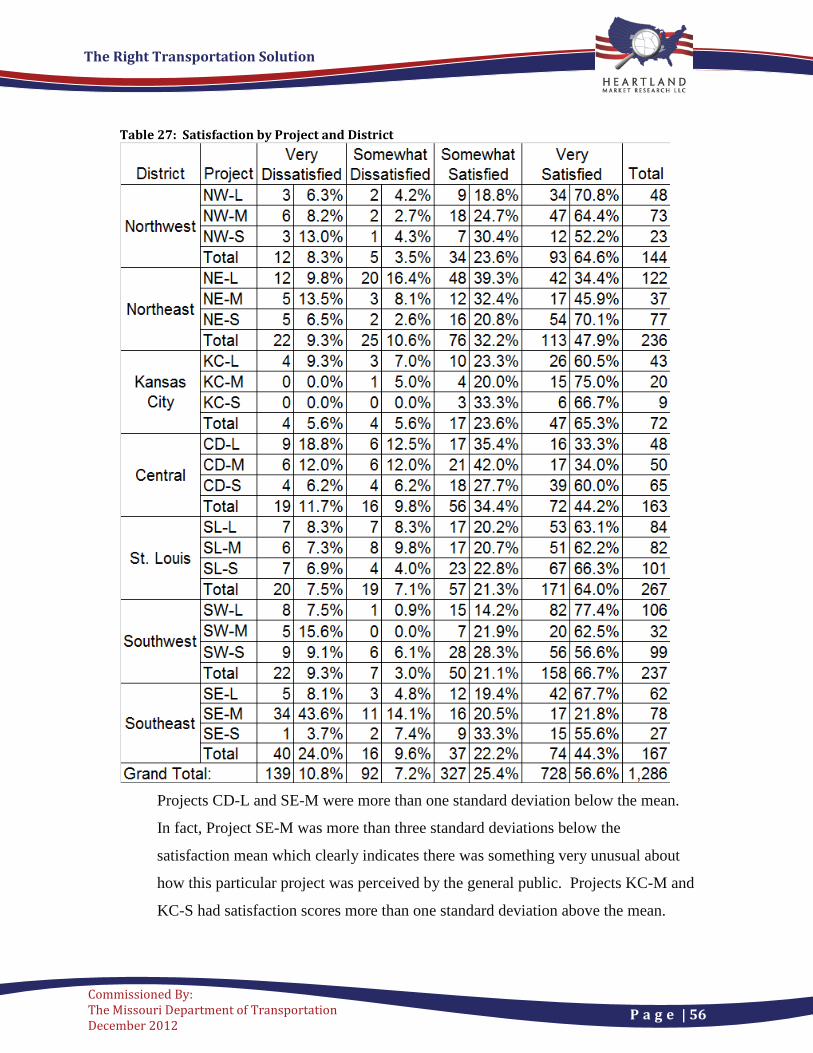
The Right Transportation Solution
P a g e | 56
Commissioned By: The Missouri Department of Transportation December 2012
Table 27: Satisfaction by Project and District
Projects CD-L and SE-M were more than one standard deviation below the mean.
In fact, Project SE-M was more than three standard deviations below the
satisfaction mean which clearly indicates there was something very unusual about
how this particular project was perceived by the general public. Projects KC-M and
KC-S had satisfaction scores more than one standard deviation above the mean.
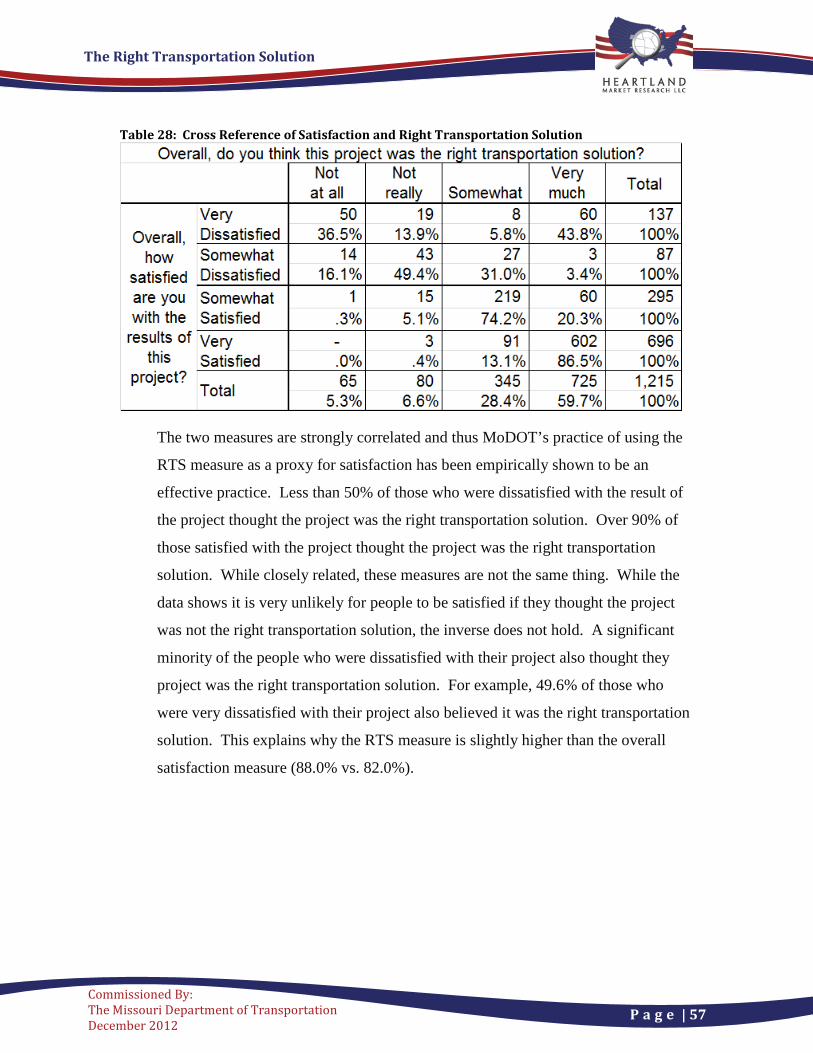
The Right Transportation Solution
P a g e | 57
Commissioned By: The Missouri Department of Transportation December 2012
Table 28: Cross Reference of Satisfaction and Right Transportation Solution
The two measures are strongly correlated and thus MoDOT’s practice of using the
RTS measure as a proxy for satisfaction has been empirically shown to be an
effective practice. Less than 50% of those who were dissatisfied with the result of
the project thought the project was the right transportation solution. Over 90% of
those satisfied with the project thought the project was the right transportation
solution. While closely related, these measures are not the same thing. While the
data shows it is very unlikely for people to be satisfied if they thought the project
was not the right transportation solution, the inverse does not hold. A significant
minority of the people who were dissatisfied with their project also thought they
project was the right transportation solution. For example, 49.6% of those who
were very dissatisfied with their project also believed it was the right transportation
solution. This explains why the RTS measure is slightly higher than the overall
satisfaction measure (88.0% vs. 82.0%).
The Right Transportation Solution
P a g e | 58
Commissioned By: The Missouri Department of Transportation December 2012
SUMMARY
The overall results show that the majority of Missourians are very satisfied with
their local project and generally believe that MoDOT provides the right
transportation solution. Results were similar to last year's scores. The majority of
respondents thought that the project made the roadway safer (86.3%), more
convenient (84.0%), less congested (80.1%), easier to travel (85.0%), better marked
(79.8%), and was the right transportation solution (88.0%).
The Right Transportation Solution
P a g e | 59
Commissioned By: The Missouri Department of Transportation December 2012
APPENDIX A. SURVEY INSTRUMENT
The next three pages show the front and back side of the survey instrument. Two
questionnaires were developed, one for projects with accommodations for bicyclists
and pedestrians and one for projects without such accommodations. Two examples
are provided on the following pages, one of each type of questionnaire.
On the front page of each survey, a unique project description was printed for each
of the twenty-one projects. All of the actual descriptions are available under Project
Descriptions and Locations starting on page 6. The back page of each survey was
identical for each questionnaire and provided respondents with an opportunity to
express their opinions and to capture Title Six demographic information in
accordance with federal guidelines.
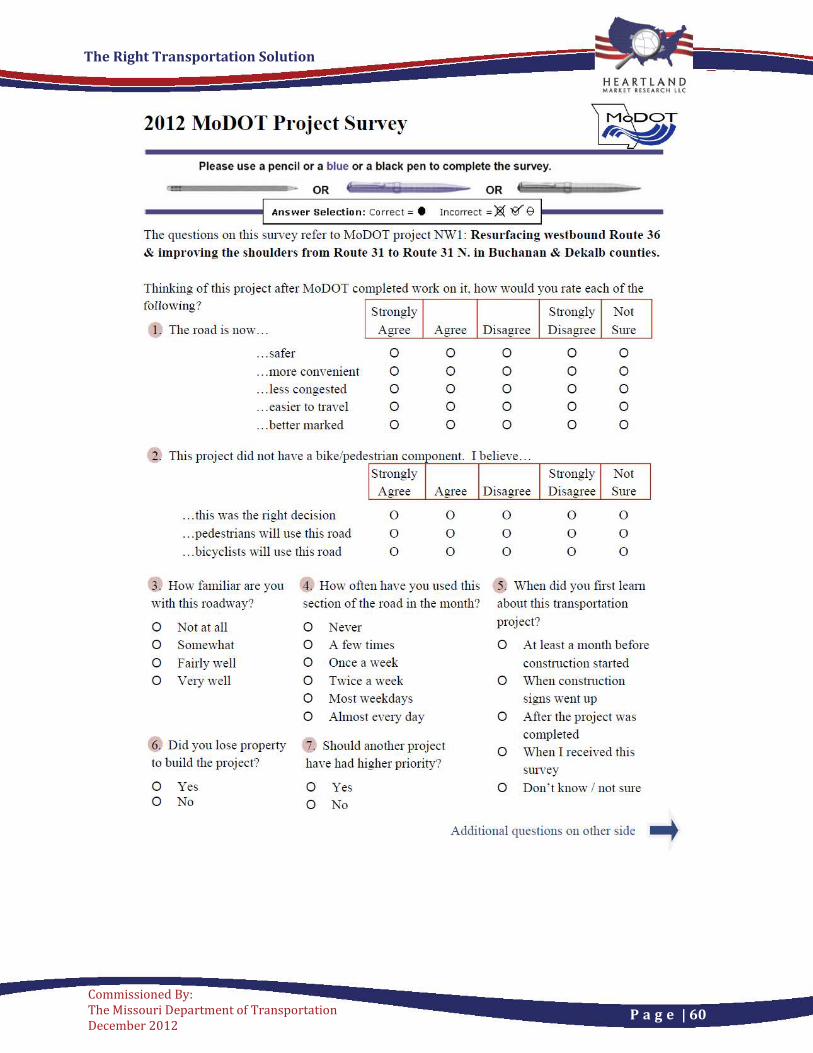
The Right Transportation Solution
P a g e | 60
Commissioned By: The Missouri Department of Transportation December 2012
2012 MoDOT Project Survey
Please use a pencil or a blue or a black pen to complete the survey.
OR OR
Answer Selection: Correct = • Incorrec t = )8[ if 8 ~--------
The questions on this survey refer to MoDOT project NWl: Resurfacing westbound Route 36 & improving the shoulders from Route 31 to Route 31 N. in Buchanan & Dekalb counties.
Thinking of this project after MoDOT completed work on it, how would you rate each of the foil owing? Strongly
1. The road is now ... Agree
... safer
... more convenient
... less congested
... easier to travel
... better marked
... this was the right decision
... pedestrians will use this road
... bicyclists will use this road
0 Never
0
0 0 0
0
0
0
0
0 A few times 0 Once a week
0 Twice a week 0 Most weekdays
0 Almost evety day
Agree
0
0 0 0
0
0
0
0
6. Did you lose property 7. Should another project
to build the project? have had higher priority?
0 Yes 0 No
0 Yes 0 No
Strongly Not
Disagree Disagree Sure
0
0 0 0
0
0
0
0
0
0
0
0
0
0 0 0 0
0
0
0
0
0
0 0 0
0
0
0
0
At least a month before
construction started 'vVhen constmction signs went up
After the project was completed When I received this survey
Don' t know I not sure
Additional questions on other side ....
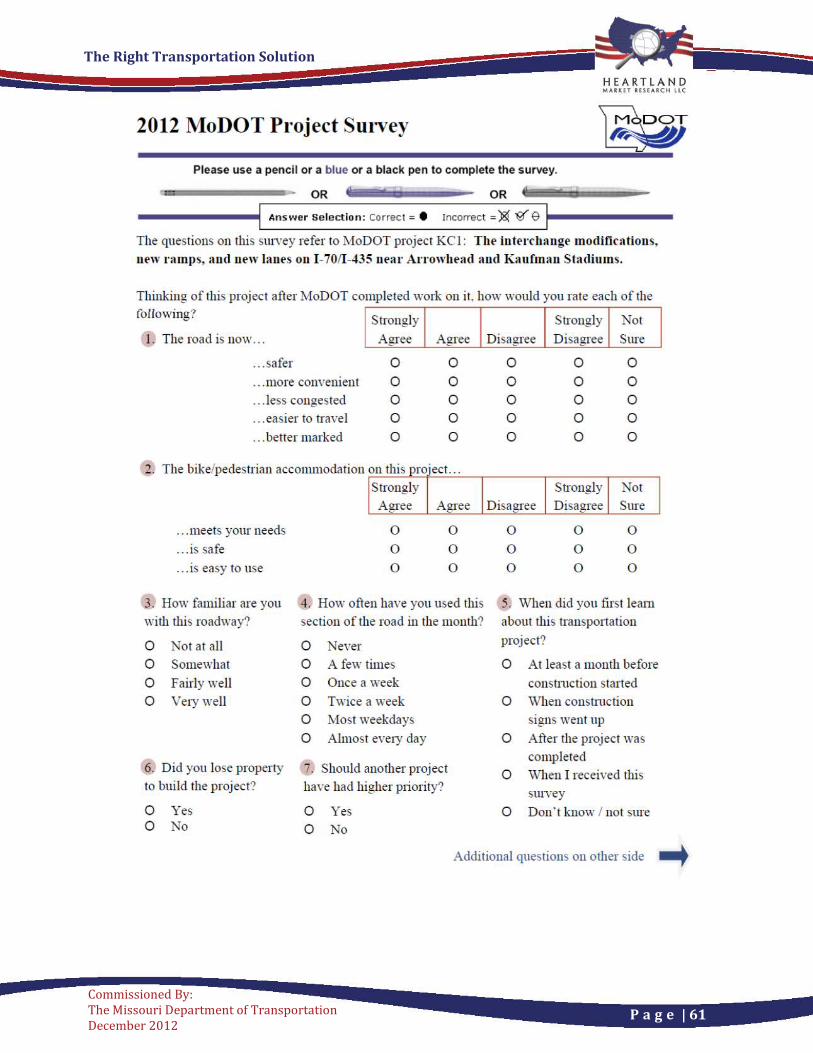
The Right Transportation Solution
P a g e | 61
Commissioned By: The Missouri Department of Transportation December 2012
2012 MoDOT Project Survey
Please use a pencil or a blue or a black pen to complete the survey.
OR OR
Answer Selection : Correct= . Incorrect =)8(' 'if 9 ~-------
The questions on this smYey refer to MoDOT project KCl: Tht' intt'r changt' modifications,
nt'w ramps, and nt'W laut's on 1-7011-435 ut'ai· AITowht'ad aud Kaufman Stadiums.
Thinking of this project after MoDOT completed work on it. how would you rate each of the following? Strongly
1. The road is now ... Agree Agree
... safer
... more convenient
... less congested
... easier to travel
... better marked
0 0 0 0 0
0 0 0 0 0
2.
. .. meets your needs
. .. is safe
.. . is easy to use
3. How familiar are you
with this roadway?
0 Not at all
0 Somewhat
0 Fairly well
0 Ve1y well
6. Did you lose property
to build the project?
0 Yes 0 No
4.
0
0
0
0
0
0
How often ha\'e you used tllis
section of the road in the month?
0 Never
0 A few times
0 Once a week
0 Twice a week
0 Most weekdays
0 Almost eve1y day
7. Should another project
have had higher priority?
0 Yes 0 No
Strongly Not
Disagree Disagree Sure
0 0 0 0 0
0
0
0
0 0 0 0 0
0
0
0
0 0 0 0 0
0
0 0
5. When did you flrst leam
about this transportation
project?
0 At least a month before
construction started
0 When constmction
signs went up
0 After the project was
completed
0 When I received this
smvey
0 Don' t know I not sure
Additional questions on other side --+
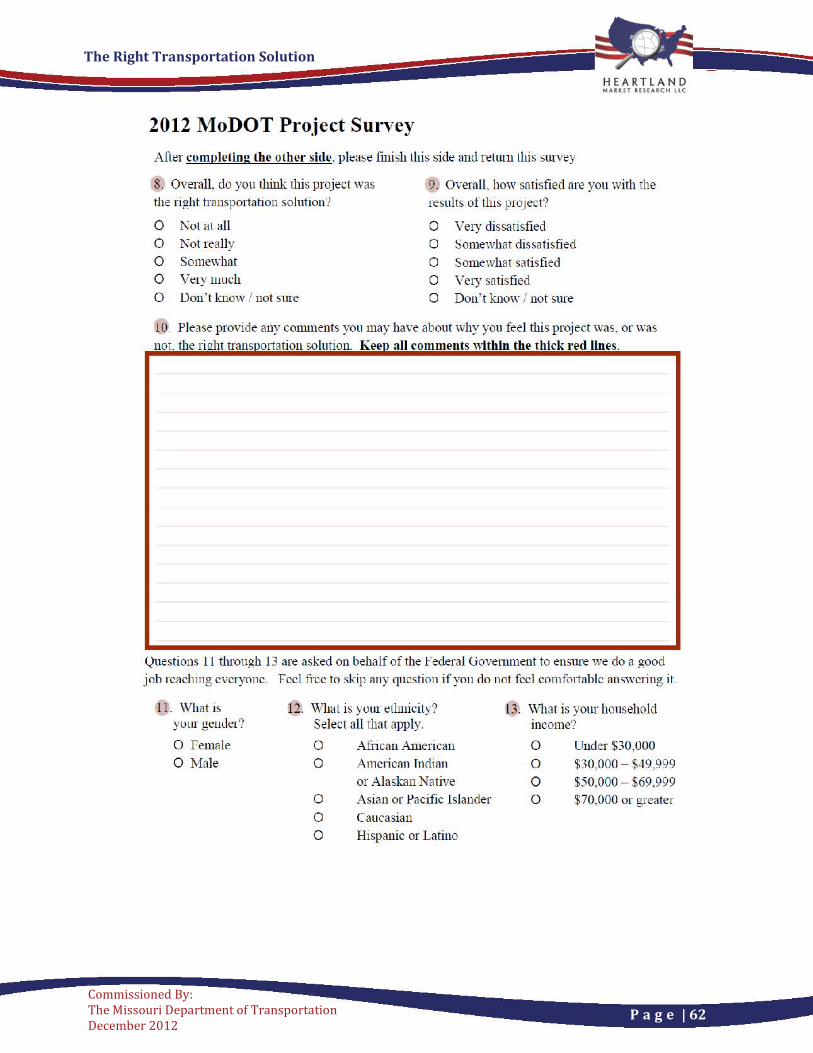
The Right Transportation Solution
P a g e | 62
Commissioned By: The Missouri Department of Transportation December 2012
2012 ~1oDOT Project Survey
Afl~r cumpMing the other shlll, pl~ase finish th is side and rdum this sm vey
8. Overall, do you think this project was the nght h·ansportation solution?
9. Overall, how satisfied are you with the results of this project?
0 Not <lL all 0 Not really
0 Some\ovhat 0 Very rnud t
0 Don 't know / not sure
0 Vety dissarisfied 0 Somewhat dissatisfied
0 Somewhat satisfied
0 Vety satisfied 0 Don't know I not sure
uO. Please pmvide any comments you may have abmtt why ymt feel this project was, or was
not. the right transportation solution. Keep all comments within the thick l'ed llnes.
Questions 11 through 13 are asked on behalf of the Federal Govemment to ensure we do a good
job reflehing evety one. Feel fi·ce to skip any question if yon rlo not feel eomfmt ahlc answering it.
11 . What is your gender?
0 f emale
0 Mnle
Wha l is yutn d lmicily? Select all that apply.
0 African American
0 A meti can Tnrlian
or Alaskan Native 0 Asian or Pacific i slander
0 Caucasian
0 Hispanic or Latino
13. What is your household income?
0 Under $30,000
0 $30,000 - $49,999
0 $50,000 - $69,999
0 $70,000 or greater

The Right Transportation Solution
P a g e | 63
Commissioned By: The Missouri Department of Transportation December 2012
APPENDIX B: RIGHT TRANSPORTATION SOLUTION BY PROJECT
The results from the right transportation solution question have been graphically
provided for each project. Statistically, it is very safe to compare overall results
from fiscal year 2012 to previous fiscal years. The margin of error for all years has
been less than 2.5%. Since the margin of error can go either way (e.g., low in one
year and high in another), the margins of error are cumulative. Therefore, we can
be 95% confident that differences between years are truly real changes if the overall
difference is at least 5%. Since the margin of error increases as the sample size
decreases, readers should use caution when using the information provided to
compare projects as the margins of error are much higher given the limited number
of responses per project. However, despite these statistical concerns, these graphs
do provide some useful information. For example, many projects were
overwhelmingly the right transportation solution in the eyes of the respondents.
The question that can be raised by these graphs is why do a few projects have much
different levels of support than other projects?
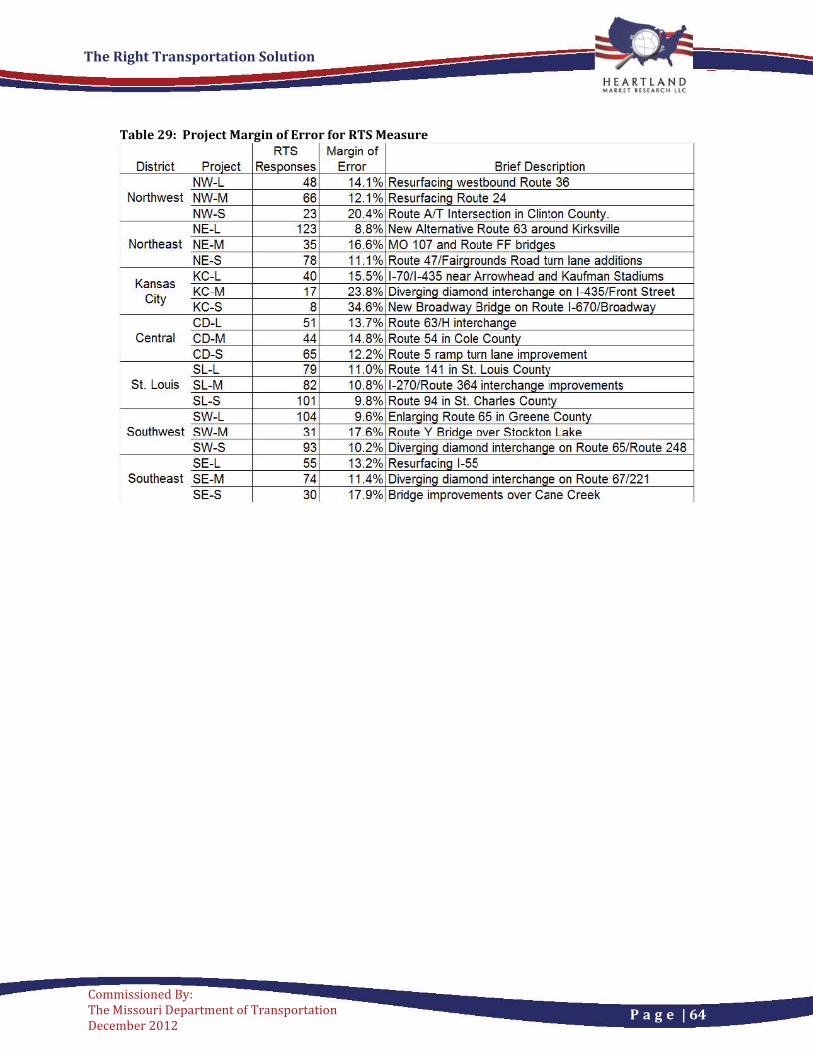
The Right Transportation Solution
P a g e | 64
Commissioned By: The Missouri Department of Transportation December 2012
Table 29: Project Margin of Error for RTS Measure
RTS Margin of District Project Responses Error Brief Description
NW-L 48 14.1% Resurfacing westbound Route 36 Northwest NW-M 66 12.1% Resurfacing Route 24
NW-S 23 20.4% Route AfT Intersection in Clinton County. NE-L 123 8.8% New Alternative Route 63 around Kirksville
Northeast NE-M 35 16.6% MO 1 07 and Route FF bridges NE-S 78 11.1% Route 47/Fairgrounds Road turn lane additions
Kansas KC-L 40 15.5% 1-70/1-435 near Arrowhead and Kaufman Stadiums KC-M 17 23.8% Diverging diamond interchange on 1-435/Front Street
City KC-S 8 34.6% New Broadway Bridge on Route 1-670/Broadway CD-L 51 13.7% Route 63/H interchange
Central CD-M 44 14.8% Route 54 in Cole County CD-S 65 12.2% Route 5 ramp turn lane improvement SL-L 79 11.0% Route 141 in St. Louis County
St. Louis SL-M 82 10.8% 1-270/Route 364 interchange improvements SL-S 101 9.8% Route 94 in St. Charles County SW-L 104 9.6% Enlarging Route 65 in Greene County
Southwest SW-M 31 17.6% Route Y Bridge over Stockton Lake SW-S 93 10.2% Diverging diamond interchange on Route 65/Route 248 SE-L 55 13.2% Resurfacing 1-55
Southeast SE-M 74 11.4% Diverging diamond interchange on Route 67/221 SE-S 30 17.9% Bridge improvements over Cane Creek
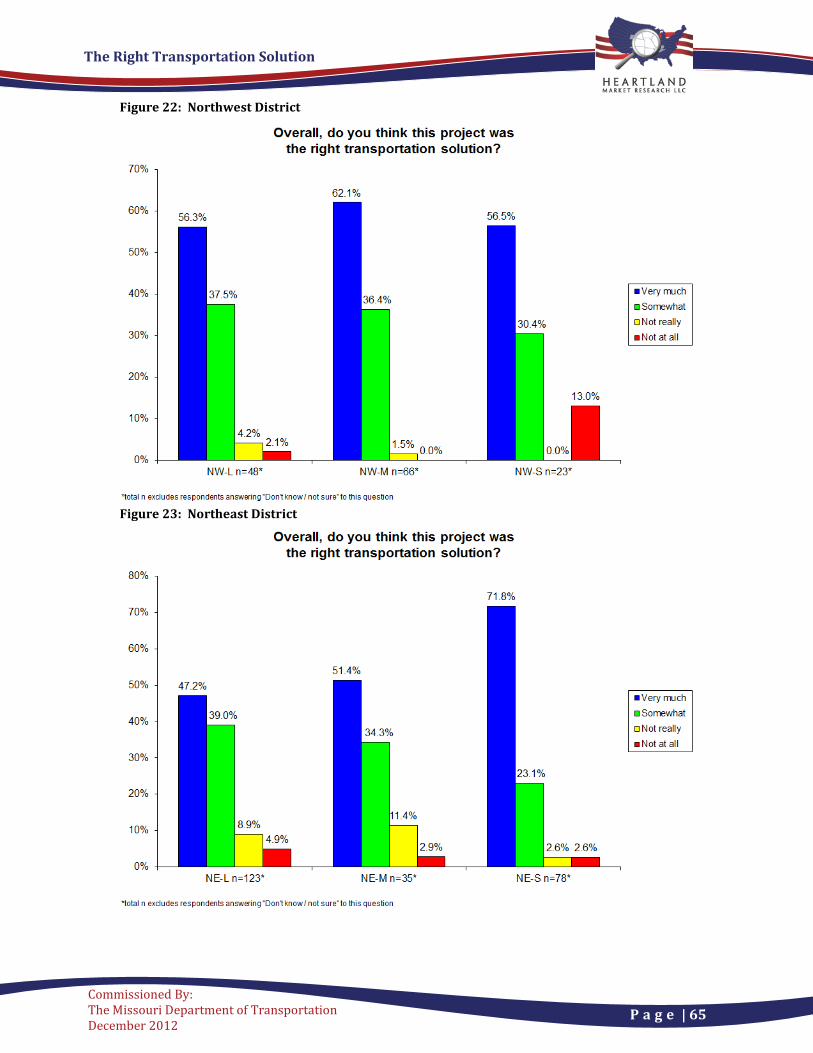
The Right Transportation Solution
P a g e | 65
Commissioned By: The Missouri Department of Transportation December 2012
Figure 22: Northwest District
Figure 23: Northeast District
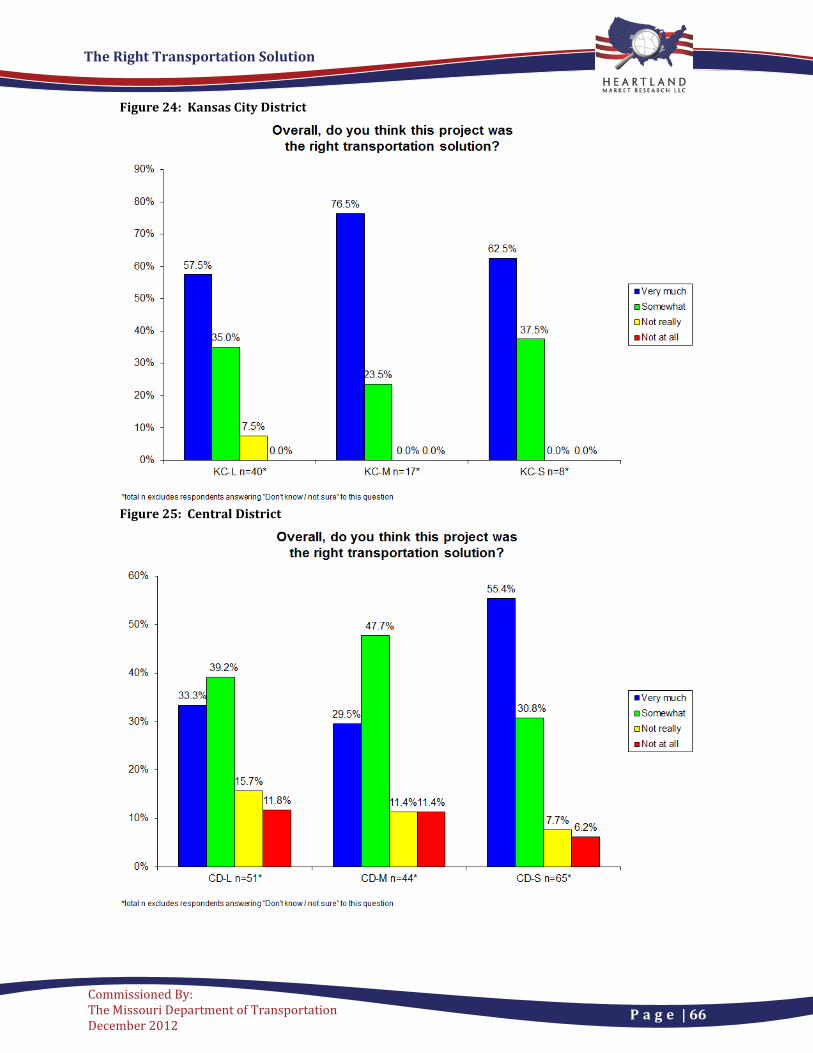
The Right Transportation Solution
P a g e | 66
Commissioned By: The Missouri Department of Transportation December 2012
Figure 24: Kansas City District
Figure 25: Central District
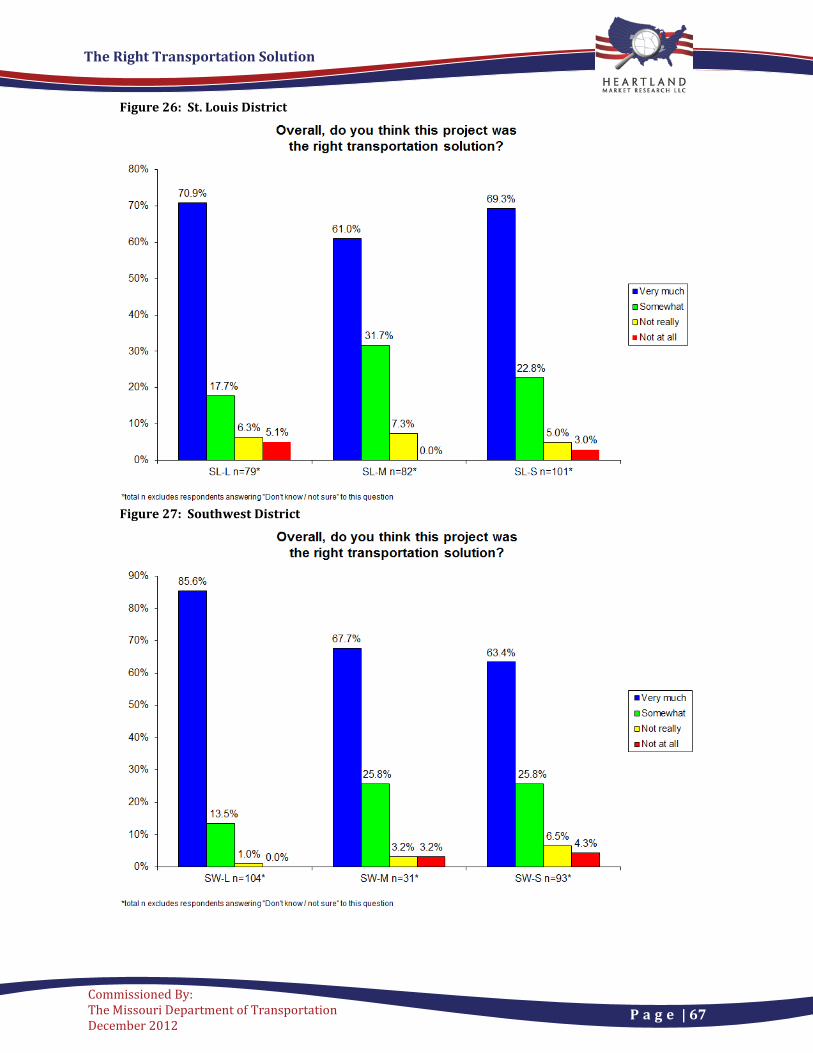
The Right Transportation Solution
P a g e | 67
Commissioned By: The Missouri Department of Transportation December 2012
Figure 26: St. Louis District
Figure 27: Southwest District
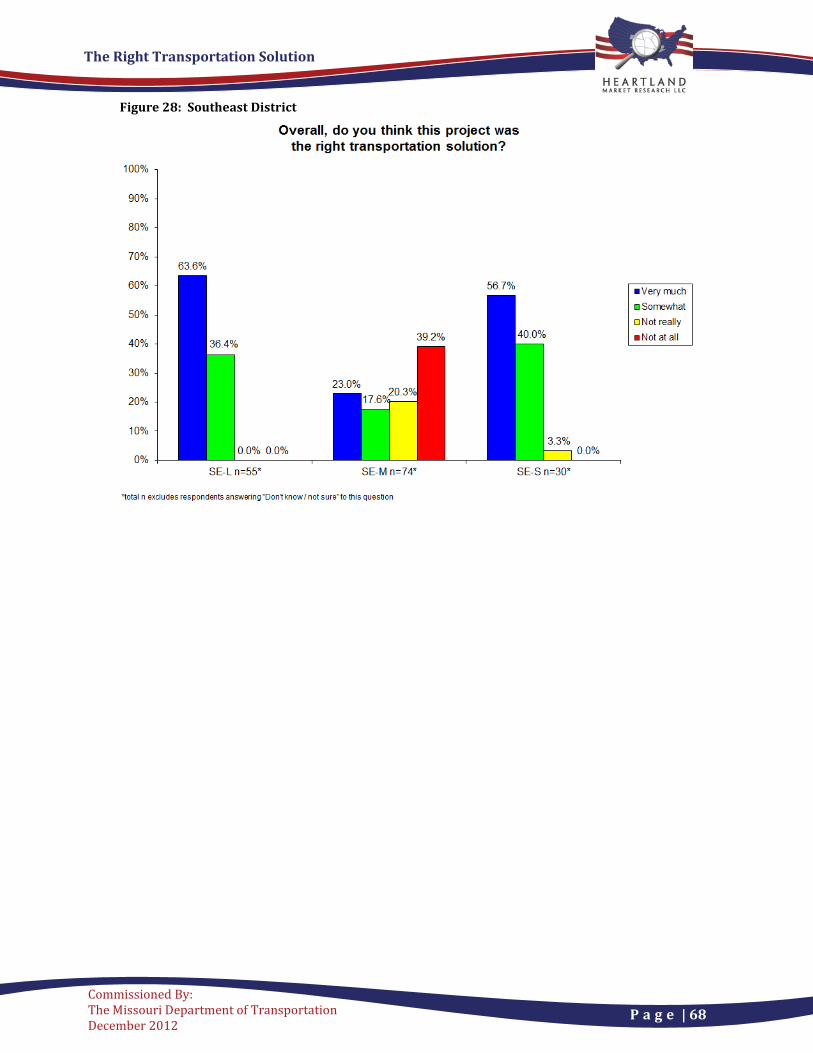
The Right Transportation Solution
P a g e | 68
Commissioned By: The Missouri Department of Transportation December 2012
Figure 28: Southeast District