Embed Size (px)
Citation preview

TRACKING PROGRESS IN MATERNAL, NEWBORN & CHILD SURVIVAL THE 2008 REPORT
i
TRACKING PROGRESS IN MATERNAL, NEWBORN & CHILD SURVIVALThe 2008 Report
TRACKING PROGRESS IN MATERNAL, NEWBORN & CHILD SURVIVAL THE 2008 REPORT
ii
Tracking Progress in Maternal, Newborn & Child Survival The 2008 Report, V2.
ISBN: 978-92-806-4284-1
© The United Nations Children’s Fund (UNICEF), 2008
Cover photo © UNICEF/HQ07-1153/Shehzad Noorani
This is a working document. It has been prepared to facilitate the exchange of knowledge and to stimulate discussion. Participating agencies and institutions accept no responsibility for errors. The designations in this publication do not imply an opinion on legal status of any country or territory, or of its authorities, or the delimitation of frontiers.
The views expressed in this document are solely the responsibility of the contributors. The document may be freely reviewed, abstracted, or translated in part or whole, but not for sale nor use in conjunction with commercial purposes.
All reasonable precautions have been taken by UNICEF and the Countdown Partners to verify the information contained in this publication. However, the published material is being distributed without warranty of any kind, either expressed or implied. The responsibility for the interpretation and use of the material lies with the reader. In no event shall UNICEF be liable for damages arising from its use.
For more information contact
UNICEF3 United Nations PlazaNew York, NY 10017USA
www.countdown2015mnch.org
TRACKING PROGRESS IN MATERNAL, NEWBORN & CHILD SURVIVAL THE 2008 REPORT
iii
TRACKING PROGRESS IN MATERNAL, NEWBORN & CHILD SURVIVALThe 2008 Report
TRACKING PROGRESS IN MATERNAL, NEWBORN & CHILD SURVIVAL THE 2008 REPORT
iv
AbbreviationsAARPARVCHERGDHSGAVIGFATMHibILOIMCIISCOITNsLSHTMJMP WHO/UNICEFMDGsMERGMICSNMROECDPMNCHSWApsU5MRUNFPA UNGASSUNICEFWFFCWHO
Average annual rate of reductionAnti-retroviral treatmentChild Health Epidemiology Reference GroupDemographic and Health SurveysGlobal Alliance for Vaccines InitiativeGlobal Fund for AIDS, TB and MalariaHaemophilus influenzae type BInternational Labour OrganizationIntegrated management of childhood illnessInternational Standard Classification of OccupationsInsecticide-treated netsLondon School of Hygiene and Tropical MedicineJoint Monitoring Programme on Water Supply and SanitationMillennium Development GoalsRoll Back Malaria Monitoring and Evaluation Reference GroupMultiple Indicator Cluster SurveysNeonatal Mortality RateOrganisation for Economic Co-operation and DevelopmentPartnership for Maternal, Newborn and Child HealthSector-Wide ApproachesUnder-five mortality rateUnited Nations Population FundUnited Nations General Assembly Special SessionUnited Nations Children’s FundWorld Fit for ChildrenWorld Health Organization
ii
© U
NIC
EF/H
Q05
-215
9/G
iaco
mo
Piro
zzi
TRACKING PROGRESS IN MATERNAL, NEWBORN & CHILD SURVIVAL THE 2008 REPORT
v
ContributorsLead AuthorsJennifer Bryce (Johns Hopkins University, USA) and Jennifer Harris Requejo (PMNCH, Switzerland)
Special RecognitionTessa Wardlaw, Archana Dwivedi, Holly Newby of UNICEF, for technical support and substantial contribution to all phases of report preparation and production
2008 Countdown Working GroupJasmina Acimovic, UNICEF, USAPriscilla Akwara, UNICEF, USAHenrik Axelson, PMNCH, SwitzerlandStan Bernstein, UNFPA, USAZulfiqar Bhutta, Aga Khan University, PakistanRobert Black, Johns Hopkins University, USATies Boerma, WHO, SwitzerlandJosephine Borghi, LSHTM, UKJennifer Bryce, Johns Hopkins University, USAFlavia Bustreo, PMNCH, SwitzerlandDennis Caillaux, Global Movement for Children, SwitzerlandNaomi Cassirer, ILO, SwitzerlandEleanora Cavagnero, WHO, SwitzerlandDavid Clark, UNICEF, USAGiorgio Cometto, Save the Children, UKBernadette Daelmans, WHO, SwitzerlandNita Dalmiya, UNICEF, USAMaria Dal Poz, WHO, SwitzerlandArchana Dwivedi, UNICEF, USALeslie Elder, Saving Newborn Lives / Save the Children, USADavid Evans, WHO, SwitzerlandVincent Fauveau, UNFPA, SwitzerlandHelga Fogstad, NORAD, NorwayAnastasia J. Gage Tulane University, USAYoussouph Gaye, Ministry of Health, SenegalWendy Graham, University of Aberdeen, UKGiulia Greco, LSHTM, UKNeeru Gupta, WHO, SwitzerlandRichard Horton, The Lancet, UKJulia Hussein, University of Aberdeen, UKMonir Islam, WHO, SwitzerlandKareen Jabre, Inter-Parliamentary Union, SwitzerlandKate Kerber, Saving Newborn Lives / Save the Children, USABetty Kirkwood, LSHTM, UKJoy Lawn, Saving Newborn Lives / Save the Children, USASamantha Lobis, Columbia University, USAViviana Mangiaterra, WHO, SwitzerlandElizabeth Mason, WHO, SwitzerlandJeffrey Mecaskey, Save the Children, UKAnne Mills, LSHTM, UKHolly Newby, UNICEF, USAMaryanne Neill, UNICEF, USAArletty Pinel, UNFPA, USATim Powell-Jackson, LSHTM, UKSonya Rabeneck, PMNCH, SwitzerlandJennifer Harris Requejo, PMNCH, SwitzerlandCarine Ronsmans, LSHTM, UKPeter Salama, UNICEF, USADavid Sanders, University of Western Cape, South AfricaHarshad Sanghvi, JHPIEGO, USALale Say, WHO, SwitzerlandWerner Schultink, UNICEF, USAAnuraj Shankar, WHO, SwitzerlandMeera Shekar, World Bank, USARobert Scherpbier, WHO, SwitzerlandFrancisco Songane, PMNCH, SwitzerlandMarcus Stahlhofer, WHO, SwitzerlandAnn Starrs, Family Care International, USASissel Hodne Steen, NORAD, NorwayNancy Terreri, UNICEF, USAAnne Tinker, Save the Children, USAJim Tulloch, AusAid, AustraliaStewart Tyson, DFID, UKPatrick Unterlerchner, PMNCH, SwitzerlandCostanza Vallenas, WHO, SwitzerlandCesar Victora, Universidade Federal de Pelotas, BrazilTessa Wardlaw, UNICEF, USA
Acknowledgements
The Countdown Group would like to thank the following:
UNICEF/Strategic Information Section for use of global databases, preparation of country profiles, and review of report text. Particular recognition goes to Xiaodong Cai, Khin Wityee Oo, and Me Me Khine for their input and review of country profiles. Irene Deineko for administrative support and convening of review meetings.
WHO regional offices and headquarters staff who contributed to data collection: Christopher Drasbek, Susan Farhoud, Olivier Fontaine, Phanuel Habimana, Ardi Kaptinisingh, Aigul Kuttumaratova, Ramez Mahaini, Sudhansh Malhotra, Shameen Qazi and Mariana Trias.
The Countdown communications team for their inputs in shaping the key messages, media strategy and Countdown Executive Summary: Genine Babakian, Flavia Bustreo, Marie Agnes Heine, Olivia Lawe-Davies, Kate Kerber, Ruth Landy, Jessica Malter, Tunga Namjilsuren, George Ngwa, Jennifer Requejo, Jacqueline Toupin, Michelle Zelsman.
Christa Fischer-Walker and Jeremy Schiefen of Johns Hopkins University, USA for preparing maps.
The DevInfo initiative for the development of the database and the production of the Country Profiles.
UN Country Team in South Africa, particularly the UNICEF Sub-Office in Cape Town for administrative and logistics support.
The PMNCH Secretariat for convening meetings for Countdown Core Groups and PMNCH colleague Tigest Yilma Desta for providing administrative support.
Working Groups
Coverage Indicators: Fred Arnold, Linda Bartlett, Stan Bernstein, Zilfiqar Bhutta, Robert Black, Ties Boerma, Jennifer Bryce, Flavia Bustreo, Simon Cousens, Trevor Croft, Bernadette Daelmans, Leslie Elder, Anastasia Gage, Wendy Graham, Kate Kerber, Stein-Erik Kruse, Joy Lawn, Elizabeth Mason, Jeffrey Mecaskey, Carine Ronsmans, Peter Salama, Harshad Sanghvi, Lale Say, Werner Schultink, Anuraj Shankar, Nancy Terreri, Anne Tinker, Vincent Fauveau, Cesar Victora, Tessa Wardlaw
Equity: Henrik Axelson, Stan Bernstein, Ties Boerma, Wendy Graham, Kate Kerber, Betty Kirkwood, Jeffrey Mecaskey, Carine Ronsmans, Cesar Victora
Financial Flows: Henrik Axelson, Zulfiqar Bhutta, Josephine Borghi, Flavia Bustreo, Guilia Greco, Anne Mills, Tim Powell-Jackson
Policy Review: Bernadette Daelmans, Vincent Fauveau, Andy Haines, Monir Islam, Stein-Erik Kruse, Viviana Mangiaterra, Jeffrey Mecaskey, Ann Starrs, Nancy Terreri, Stewart Tyson, Patrick Unterlerchner
iii
TRACKING PROGRESS IN MATERNAL, NEWBORN & CHILD SURVIVAL THE 2008 REPORT
2
Summary
The last few years have seen enormous and welcome developments in global public health and nutrition. There is growing recognition – increasingly backed by resources – that achieving the Millennium Development Goals (box 1) will demand radical changes to the scale and scope of effective strategies. The Countdown to 2015 responds to these calls for change.
The Millennium Development Goals
Goal 1: Eradicate extreme poverty and hunger.Goal 2: Achieve universal primary education.Goal 3: Promote gender equality and empower
women.Goal 4: Reduce child mortality.Goal 5: Improve maternal health.Goal 6: Combat HIV/AIDS, malaria and other
diseases.Goal 7: Ensure environmental sustainability.Goal 8: Develop a global partnership for
development.
Box 1: The Millennium Development Goals
Countdown Principles
Focus on coverageFocus on effective interventionsMaintain a country orientationBuild on existing goals and monitoring efforts
Box 2: Countdown principles
A collaboration among individuals and institutions established in 2005, the Countdown aims to stimulate country action by tracking coverage for interventions needed to attain Millennium Development Goals 4 and 5 – and, in addition, parts of Millennium Development Goals 1, 6 and 7. Through this unified effort national and international policy makers, programme implementers, development and media partners and researchers are working together to:
Summarise, synthesise and disseminate the best and • most recent information on country-level progress towards high, sustained and equitable coverage with health interventions to save women and children.Take stock of progress in maternal, • newborn and child survival.Call on governments, development partners • and the broader community to be accountable if rates of progress are not satisfactory.Identify knowledge gaps that are hindering progress.• Propose new actions to achieve the health-related • Millennium Development Goals, in particular Millennium Development Goals 4 and 5.
The Countdown pursues these objectives through conferences, publications and follow-up regional and country activities, focusing attention on progress towards national-level coverage of proven interventions in countries with the highest levels of maternal and child mortality. The activities of the Countdown are guided by four principles (box 2).
Countdown priority countries
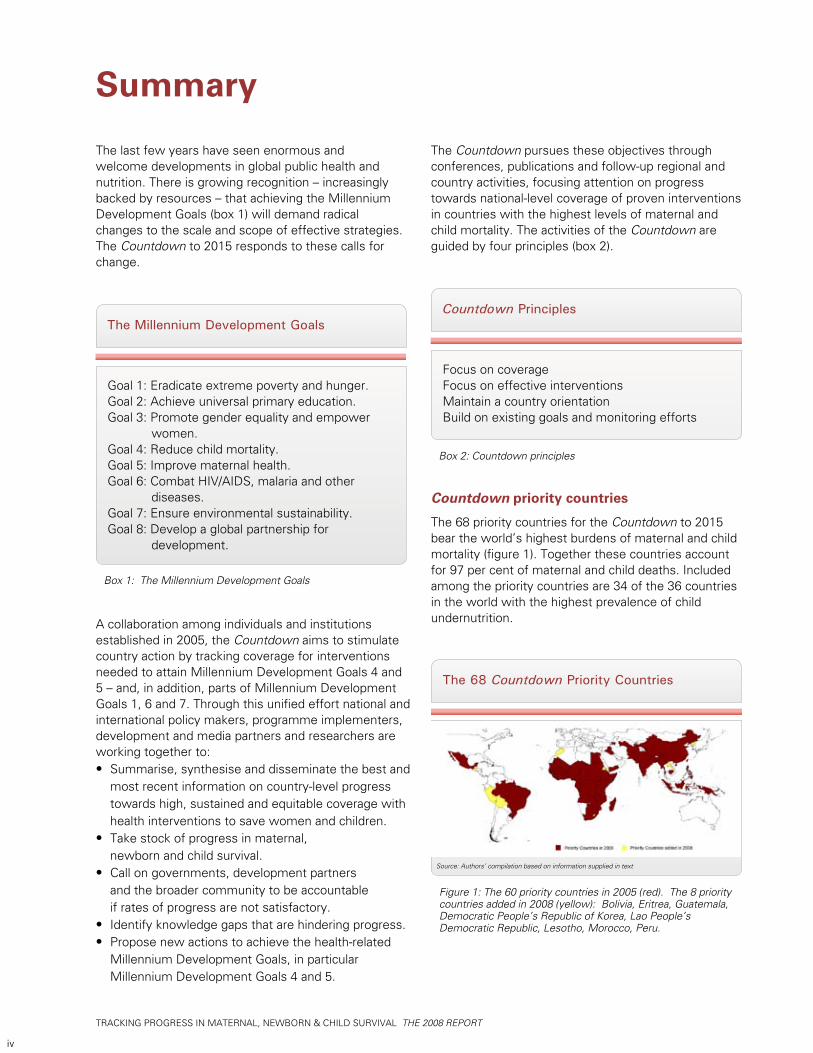
The 68 priority countries for the Countdown to 2015 bear the world’s highest burdens of maternal and child mortality (figure 1). Together these countries account for 97 per cent of maternal and child deaths. Included among the priority countries are 34 of the 36 countries in the world with the highest prevalence of child undernutrition.
The 68 Countdown Priority Countries
Figure 1: The 60 priority countries in 2005 (red). The 8 priority countries added in 2008 (yellow): Bolivia, Eritrea, Guatemala, Democratic People’s Republic of Korea, Lao People’s Democratic Republic, Lesotho, Morocco, Peru.
Source: Authors’ compilation based on information supplied in text
iv
TRACKING PROGRESS IN MATERNAL, NEWBORN & CHILD SURVIVAL THE 2008 REPORT
3
Interventions and indicators
All interventions tracked through the Countdown are empirically proven to reduce mortality among mothers, newborns or children. Coverage with broader approaches, such as antenatal and postnatal care, delivery and reproductive health services also need to be tracked, as they provide the basic platform for delivery of multiple effective interventions to reduce maternal and newborn mortality.
The Countdown tracks only interventions and approaches that are feasible for universal implementation in poor countries. In addition, to be tracked, an intervention or approach must be associated with a valid coverage indicator that is reliable and comparable across countries and time. The Countdown recognizes the limitations of some coverage indicators now used and is doing technical work to improve them. Finally, the 68 Countdown country profiles present other information helpful for interpreting coverage levels, including:
Country-specific estimates of maternal and • child mortality and child nutritional status,The status of policies related to maternal, • newborn and child health,Indicators of health system strength,• Measures of equity in coverage,• Estimates of financial flows to maternal, • newborn and child health and nutrition.
DEMOGRAPHICS MATERNAL AND NEWBORN HEALTH
INTERVENTION COVERAGE FOR MOTHERS, NEWBORNS AND CHILDRENNUTRITION
Exclusive breastfeedingPercent infants < 6 months exclusively breastfed
Vitamin A supplementationPercent children 6-59 months receiving vitamin A doses
Diarrhoeal disease treatmentPercent children < 5 years with diarrhoea receiving oral rehydrationtherapy or increased fluids, with continued feeding
Pneumonia treatment Percent children < 5 years with suspected pneumonia taken to appropriate health provider Percent children < 5 years with suspected pneumonia receiving antibiotics
Total population (000)
Total under-five population (000)
Births (000)
Birth registration (%)
Under-five mortality rate (per 1000 live births)
Infant mortality rate (per 1000 live births)
Neonatal mortality rate (per 1000 live births)
Total under-five deaths (000)
Maternal mortality ratio (per 100,000 live births)
Lifetime risk of maternal death (1 in N)
Total maternal deaths
Stunting prevalence (moderate and severe, %)
Wasting prevalence (moderate and severe, %)
Complementary feeding rate (6-9 months, %)
Low birthweight incidence (%)
CHILD HEALTH
Countdown to 20152008 Report
Benin
1999 2000 2001 2002 2003 2004 2005
23 42
1996DHS
2001DHS
At least one dose Two doses
Source: WHO, 2006Source: Lawn JE, Cousens SNfor CHERG (Nov 2006)
Source: UNICEF
Underweight prevalencePercent children < 5 years underweight for age*
449
*Based on 2006 WHO reference population
20
2001DHS
22
2006DHS
2001DHS
38
70
2006DHS
56
100 96 8595
98
95 89 92
94 94
Immunization Percent of children immunised against measles Percent of children immunised with 3 doses DPT Percent of children immunised with 3 doses Hib
1990 1995 2000 20052006
9393
89
0
20
40
60
80
100
1996DHS
2001DHS
32 35
8,7601,488
35870
148883853
84020
2,900
(2006)
(2006)
(2006)
(2006)
(2006)
(2006)
(2000)
(2006)
(2005)
(2005)
(2005)
Causes of under-five deathsGlobally more than one third of child deaths are attributable toundernutrition
(2006)
(2006)
5016
(2006)
(2001)
Per
cent
20
0
40
60
80
100
Per
cent
20
0
40
60
80
100
Per
cent
20
0
40
60
80
100
Per
cent
20
0
40
60
80
100
Per
cent
20
0
40
60
80
100
Per
cent
1996DHS
10
Per
cent
20
0
40
60
80
100
Source: WHO/UNICEF
Unmet need for family planning (%)
Antenatal visits for woman (4 or more visits, %)
Intermittent preventive treatment for malaria (%)
C-section rate (total, urban, rural; %)(Minimum target is 5% and maximum target is 15%)
Early initiation of breastfeeding (within 1 hr of birth, %)
Postnatal visit for baby (within 2 days for home births, %)
27
62
3
3, 6, 2
49
---
(2001)
(2001)
(2006)
(2001)
(2001)
Coverage along the continuum of care
Source: DHS, MICS, Other NS
*See Annex for indicator definition
Pre-pregnancy
Pregnancy
Birth
Neonatal period
Infancy
0 20 40 60 80 100
17
88
78
70
89
WATER AND SANITATION EQUITY
SYSTEMSPOLICIES
WaterPercent population using improved drinking water sources
SanitationPercent population using improved sanitation facilities
Financial Flows and Human Resources
Coverage gap by wealth quintile
Benin
1990 2004
TotalRural Urban TotalRural Urban
Source: WHO/UNICEF JMP, 2006
Per
cent
20
0
40
60
80
100
Skilled attendant at deliveryPercent live births attended by skilled health personnel
Neonatal tetanus protectionPercent of newborns protected against tetanus
1996DHS
2001DHS
2006DHS
Per
cent
20
0
40
60
80
100
Source: WHO/UNICEF
Per
cent
20
40
60
80
100
1986 1991 20011996 2006
57
73
57
7867
63
1990 2004Source: WHO/UNICEF JMP, 2006
Per
cent
20
0
40
60
80
100
2
32
11
59
33
12
Poorest 2nd 3rd 4th Wealthiest
Per
cent
20
0
40
60
80
100
International Code of Marketing of Breastmilk Substitutes
New ORS formula and zinc for management of diarrhoea
Community treatment of pneumonia with antibiotics
IMCI adapted to cover newborns 0-1 week of age
Costed implementation plan(s) for maternal, newborn and child health available
Midwives be authorised to administer a core set of life saving interventions
Maternity protection in accordance with ILO Convention 183
Specific notification of maternal deaths
Yes
Yes
Partial
Yes
Yes
Partial
No
Yes
Per capita total expenditure on health (US$)
General government expenditure on health as % of total government expenditure (%)
Out-of-pocket expenditure as % of total expenditure on health (%)
Density of health workers (per 1000 population)
Official Development Assistance to child healthper child (US$)
Official Development Assistance to maternal and neonatal health per live birth (US$)
National availability of Emergency Obstetric Care services (% of recommended minimum)
40
10
49
0.9
7
4
66
(2007)
(2007)
(2007)
(2004)
(2005)
(2005)
(2002)
Coverage gap (%)
1996DHS
2001DHS
48
1.9
29
41
1.7
22
Ratiopoorest/wealthiestDifferencepoorest-wealthiest (%)
Diarrhoea 2%Tetanus 4%Other 5%Congenital 8%
Asphyxia 19%
Infection 34%
Preterm 28%
Pneumonia21%
Diarrhoea17%
Measles5%
HIV/AIDS2%
Injuries2%
Other0% Malaria
27%
Neonatal25%
Causes of neonataldeaths
Measles
Exclusivebreastfeeding
Skilled attendantat birth
Antenatal visit(1 or more)
Contraceptiveprevalence rate
*Postnatal care
1990 1995 2000 2005 2010 2015
40
0
80
120
160
200
62
148
185
Source: UNICEF, 2006
MDG Target
Under-five mortality rateDeaths per 1000 live births
Antenatal carePercent women aged 15-49 years attended at least once by a skilled health provider during pregnancy
Per
cent
20
0
40
60
80
100
66
Malaria preventionPercent children < 5 years sleeping under ITNs
2001DHS
2006MICS
207
Per
cent
20
0
40
60
80
100
Malaria treatmentPercent febrile children < 5 years using antimalarials
2006DHS
2001DHS
5460
Per
cent
20
0
40
60
80
100
1996DHS
2001DHS
2006DHS
2005Other NS
27
2006Other NS
53
80 8188
6066
78 94
0 000
Prevention of mother to childtransmission of HIVPercent HIV+ pregnant women receiving ARVs for PMTCT
Causes of maternal deathsRegional estimates for Africa, 1997-2002
Source: Khan, Khalid S., et al, Lancet 2006:367:1066-74
Other causes30%
Anaemia4%
Haemorrhage34%
Abortion4%
Obstructed labor4%
Hypertensive disorders
9%
Sepsis/Infections,including AIDS
16%
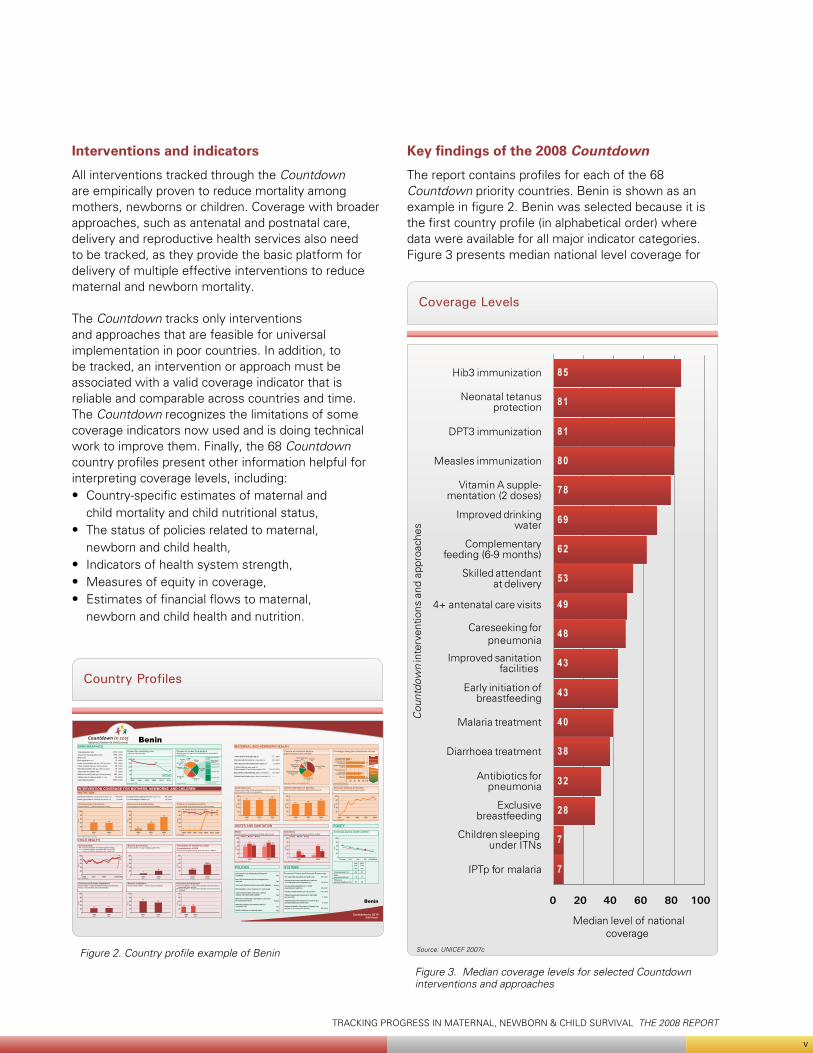
Country Profiles
Figure 2. Country profile example of Benin
Key findings of the 2008 Countdown
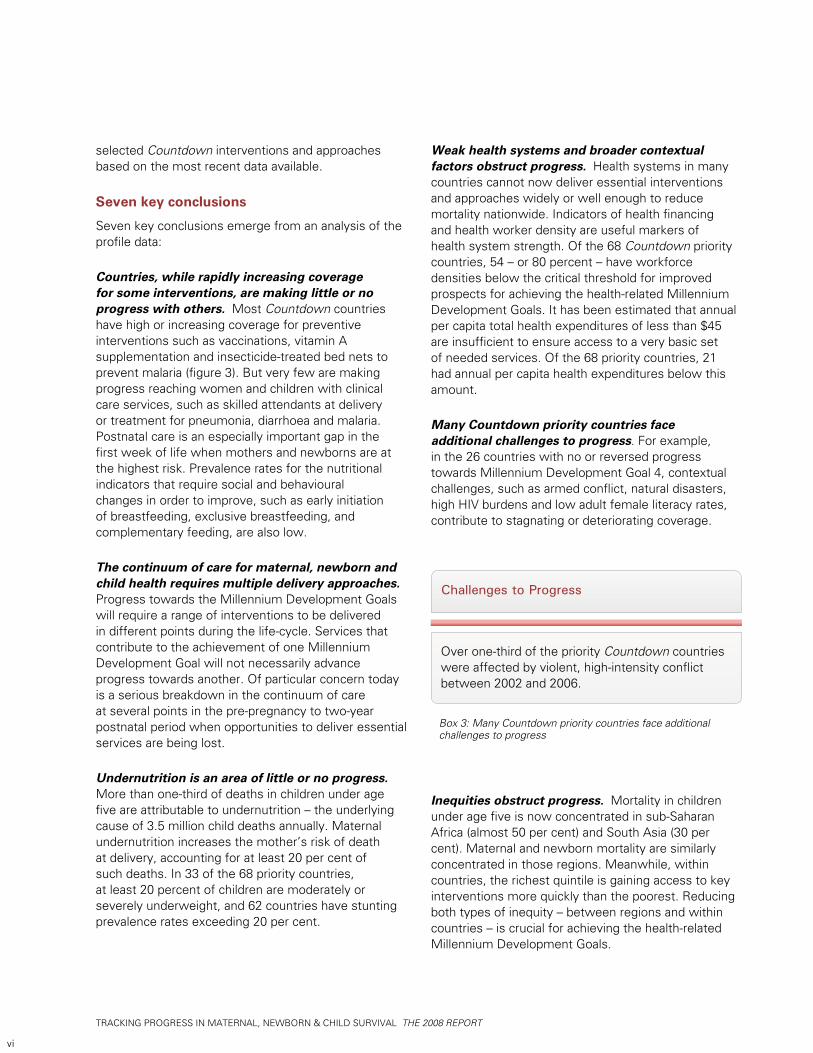
The report contains profiles for each of the 68 Countdown priority countries. Benin is shown as an example in figure 2. Benin was selected because it is the first country profile (in alphabetical order) where data were available for all major indicator categories. Figure 3 presents median national level coverage for
Coverage Levels
Figure 3. Median coverage levels for selected Countdown interventions and approaches
v
7
7
28
32
38
40
43
43
48
49
53
62
69
78
80
81
81
85
0 20 40 60 80 100
IPTp for malaria
Children sleeping under ITNs
Exclusivebreastfeeding
Antibiotics forpneumonia
Diarrhoea treatment
Malaria treatment
Early initiation ofbreastfeeding
Improved sanitationfacilities
Careseeking forpneumonia
4+ antenatal care visits
Skilled attendantat delivery
Complementaryfeeding (6-9 months)
Improved drinkingwater
Vitamin A supple-mentation (2 doses)
Measles immunization
DPT3 immunization
Neonatal tetanusprotection
Hib3 immunization
Median level of nationalcoverage
Cou
ntdo
wn
inte
rven
tions
and
app
roac
hes
Source: UNICEF 2007c
TRACKING PROGRESS IN MATERNAL, NEWBORN & CHILD SURVIVAL THE 2008 REPORT
4
selected Countdown interventions and approaches based on the most recent data available.
Seven key conclusions
Seven key conclusions emerge from an analysis of the profile data:
Countries, while rapidly increasing coverage for some interventions, are making little or no progress with others. Most Countdown countries have high or increasing coverage for preventive interventions such as vaccinations, vitamin A supplementation and insecticide-treated bed nets to prevent malaria (figure 3). But very few are making progress reaching women and children with clinical care services, such as skilled attendants at delivery or treatment for pneumonia, diarrhoea and malaria. Postnatal care is an especially important gap in the first week of life when mothers and newborns are at the highest risk. Prevalence rates for the nutritional indicators that require social and behavioural changes in order to improve, such as early initiation of breastfeeding, exclusive breastfeeding, and complementary feeding, are also low.
The continuum of care for maternal, newborn and child health requires multiple delivery approaches. Progress towards the Millennium Development Goals will require a range of interventions to be delivered in different points during the life-cycle. Services that contribute to the achievement of one Millennium Development Goal will not necessarily advance progress towards another. Of particular concern today is a serious breakdown in the continuum of care at several points in the pre-pregnancy to two-year postnatal period when opportunities to deliver essential services are being lost.
Undernutrition is an area of little or no progress. More than one-third of deaths in children under age five are attributable to undernutrition – the underlying cause of 3.5 million child deaths annually. Maternal undernutrition increases the mother’s risk of death at delivery, accounting for at least 20 per cent of such deaths. In 33 of the 68 priority countries, at least 20 percent of children are moderately or severely underweight, and 62 countries have stunting prevalence rates exceeding 20 per cent.
Weak health systems and broader contextual factors obstruct progress. Health systems in many countries cannot now deliver essential interventions and approaches widely or well enough to reduce mortality nationwide. Indicators of health financing and health worker density are useful markers of health system strength. Of the 68 Countdown priority countries, 54 – or 80 percent – have workforce densities below the critical threshold for improved prospects for achieving the health-related Millennium Development Goals. It has been estimated that annual per capita total health expenditures of less than $45 are insufficient to ensure access to a very basic set of needed services. Of the 68 priority countries, 21 had annual per capita health expenditures below this amount.
Many Countdown priority countries face additional challenges to progress. For example, in the 26 countries with no or reversed progress towards Millennium Development Goal 4, contextual challenges, such as armed conflict, natural disasters, high HIV burdens and low adult female literacy rates, contribute to stagnating or deteriorating coverage.
Inequities obstruct progress. Mortality in children under age five is now concentrated in sub-Saharan Africa (almost 50 per cent) and South Asia (30 per cent). Maternal and newborn mortality are similarly concentrated in those regions. Meanwhile, within countries, the richest quintile is gaining access to key interventions more quickly than the poorest. Reducing both types of inequity – between regions and within countries – is crucial for achieving the health-related Millennium Development Goals.
Over one-third of the priority Countdown countries were affected by violent, high-intensity conflict between 2002 and 2006.
Challenges to Progress
Box 3: Many Countdown priority countries face additional challenges to progress
vi
TRACKING PROGRESS IN MATERNAL, NEWBORN & CHILD SURVIVAL THE 2008 REPORT
5
The Countdown Call to Action
All institutions and individuals involved in the Countdown should use the information it provides – in combination with their diverse skills and resources – to promote the following immediate actions:
Sustain and expand successful efforts to achieve high • and equitable coverage for priority interventions. Recent areas of progress – especially immunizations, vitamin A supplementation and insecticide-treated bed nets – represent a major success for governments and their development partners. Such efforts should continue. But comparable efforts and investments are required for the case management of childhood illnesses, family planning services, and antenatal, childbirth, and postnatal care.
Focus on the priority period within the continuum of care, • from pre-pregnancy through 24 months – especially around the time of birth. To reduce mortality during childbirth and in the immediate days afterwards, programming efforts must focus on the effective and integrated delivery of interventions and approaches associated with this crucial period (e.g., antenatal, delivery, and postnatal care). Contraceptive services and efforts to improve infant feeding practices also need to be given high priority.
Within increased efforts to achieve the health-related • Millennium Development Goals, make improving maternal and child nutrition a priority. Nutrition must be central to both national and subnational development strategies.
Strengthen health systems, focusing on measurable results. • Health systems need to deliver on demand, creating a functional continuum of care over time and across places of service delivery. All new initiatives must focus on outcomes that measurably advance this aim.
Set geographic and population priorities, and stick to • them. The health-related Millennium Development Goals cannot be met globally without faster progress in sub-Saharan Africa and South Asia. Development efforts and official development assistance must increasingly target countries in these regions with large populations and poor performance.
Prioritize a programme for equity. Describing inequities, • though an important first step, is not enough. Programmatic efforts to address inequities must be supported by strong monitoring and evaluation activities.
Do even more to ensure predictable long-term aid flows • for maternal, newborn and child health. Governments and their development partners cannot meet the health-related Millennium Development Goals unless assistance is adequate, predictable and targeted to those goals.
Monitor. Evaluate. Conduct locally driven implementation • research. And act on the results. The ‘community of practice’ for maternal, newborn and child health must lead the change by improving monitoring and evaluation activities, and supporting efforts to rapidly disseminate and build-on important findings.
Lead the change for maternal, newborn and child survival. • It is time for all to work together as partners to improve the lives of women, newborns and children.
Aid needs to increase and become more predictable. Official development assistance to child, newborn and maternal health increased by 28 percent from 2004 to 2005, including increases of 49 per cent to child health and 21 per cent to maternal and newborn health. Such aid for maternal, newborn and child health and nutrition has increased in most Countdown priority countries, but has decreased in others. Of the 68 countries, 38 received more per capita official development assistance to child health in 2005 than in 2004, while 39 received more to maternal and newborn health per live birth in 2005 than in 2004. Although maternal, newborn, and child health programmes within the priority countries have benefited from these increases in official development assistance, such programmes are still grossly underfunded and much more needs to be done.
Countries need more and better coverage estimates and research on programme implementation. Since the first Countdown report in 2005, an unprecedented amount of household surveys have been conducted and include new MICS data from 54 countries and new DHS data for 35 countries. However, many countries are still determining coverage levels for essential interventions using data that is 5, 10 or even 15 years old. In consequence, the knowledge gained through current and ongoing efforts to promote maternal, newborn and child health and nutrition has not been adequately disseminated. Data collection and dissemination processes need improvement to make timely data more readily available, which is crucial for planning and implementation purposes.
Box 4: The Countdown Call to Action© U
NIC
EF/H
Q07
-130
9/A
nita
Khe
mka
vii
TRACKING PROGRESS IN MATERNAL, NEWBORN & CHILD SURVIVAL THE 2008 REPORT
6
© U
NIC
EF/H
Q05
-213
1/G
iaco
mo
Piro
zzi
TRACKING PROGRESS IN MATERNAL, NEWBORN & CHILD SURVIVAL THE 2008 REPORT
7
Contents
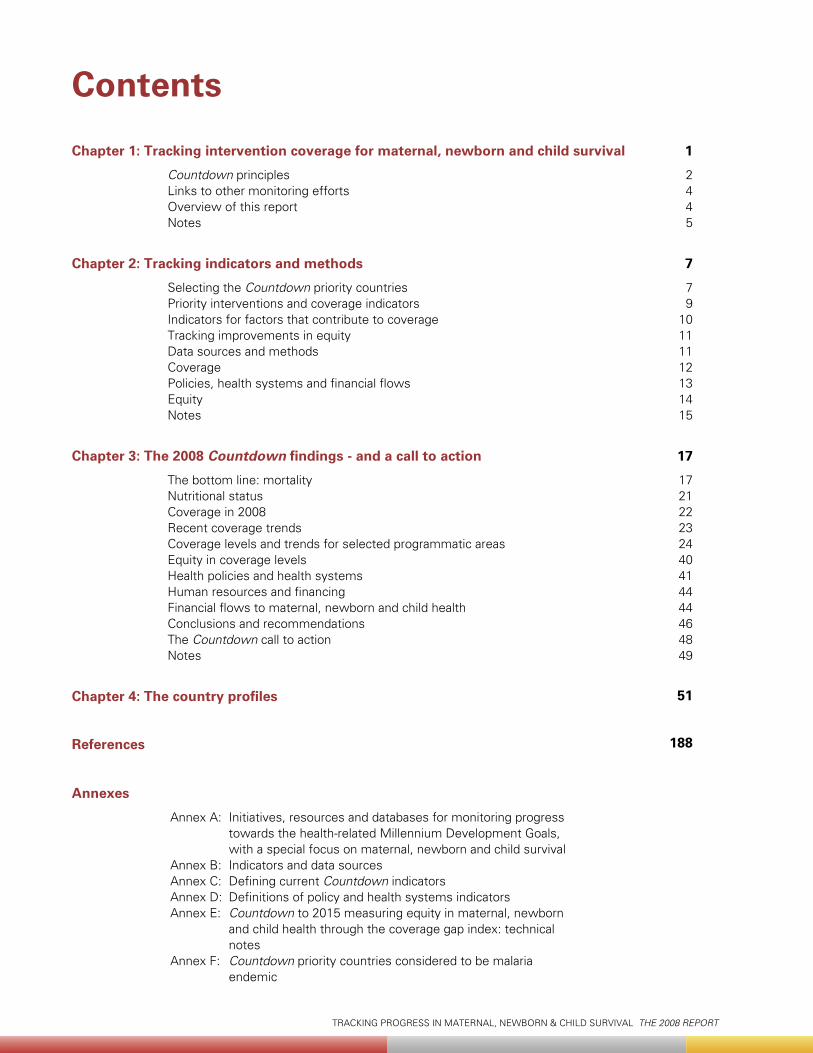
Chapter 1: Tracking intervention coverage for maternal, newborn and child survival
Countdown principles Links to other monitoring efforts Overview of this report Notes
Chapter 2: Tracking indicators and methods
Selecting the Countdown priority countries Priority interventions and coverage indicators Indicators for factors that contribute to coverage Tracking improvements in equity Data sources and methods Coverage Policies, health systems and financial flows Equity Notes
Chapter 3: The 2008 Countdown findings - and a call to action
The bottom line: mortality Nutritional status Coverage in 2008 Recent coverage trends Coverage levels and trends for selected programmatic areas Equity in coverage levels Health policies and health systems Human resources and financing Financial flows to maternal, newborn and child health Conclusions and recommendations The Countdown call to action Notes
Chapter 4: The country profiles
References
Annexes
Annex A: Initiatives, resources and databases for monitoring progress towards the health-related Millennium Development Goals, with a special focus on maternal, newborn and child survival
Annex B: Indicators and data sourcesAnnex C: Defining current Countdown indicatorsAnnex D: Definitions of policy and health systems indicatorsAnnex E: Countdown to 2015 measuring equity in maternal, newborn
and child health through the coverage gap index: technical notes
Annex F: Countdown priority countries considered to be malaria endemic
1
2445
7
79
10111112131415
17
172122232440414444464849
51
188
TRACKING PROGRESS IN MATERNAL, NEWBORN & CHILD SURVIVAL THE 2008 REPORT
viii
© U
NIC
EF/H
Q06
-139
1/G
iaco
mo
Piro
zzi
TRACKING PROGRESS IN MATERNAL, NEWBORN & CHILD SURVIVAL THE 2008 REPORT
1
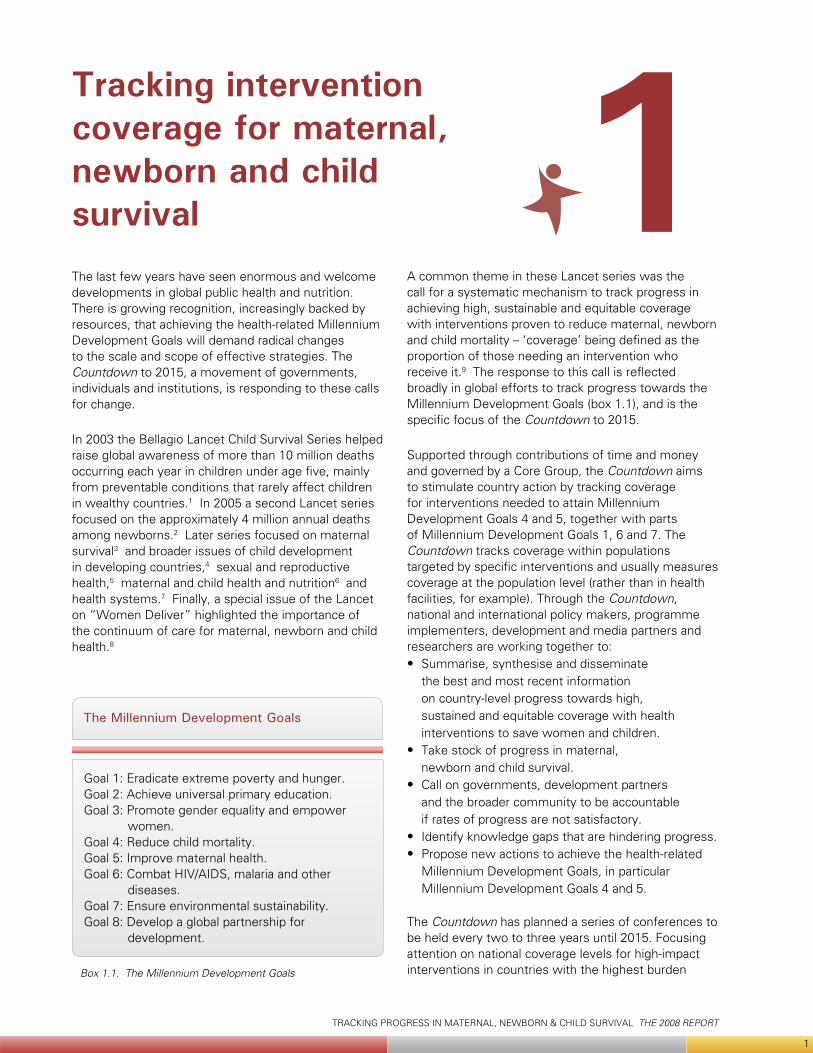
1Tracking intervention coverage for maternal, newborn and child survival
The last few years have seen enormous and welcome developments in global public health and nutrition. There is growing recognition, increasingly backed by resources, that achieving the health-related Millennium Development Goals will demand radical changes to the scale and scope of effective strategies. The Countdown to 2015, a movement of governments, individuals and institutions, is responding to these calls for change.
In 2003 the Bellagio Lancet Child Survival Series helped raise global awareness of more than 10 million deaths occurring each year in children under age five, mainly from preventable conditions that rarely affect children in wealthy countries.1 In 2005 a second Lancet series focused on the approximately 4 million annual deaths among newborns.2 Later series focused on maternal survival3 and broader issues of child development in developing countries,4 sexual and reproductive health,5 maternal and child health and nutrition6 and health systems.7 Finally, a special issue of the Lancet on “Women Deliver” highlighted the importance of the continuum of care for maternal, newborn and child health.8
A common theme in these Lancet series was the call for a systematic mechanism to track progress in achieving high, sustainable and equitable coverage with interventions proven to reduce maternal, newborn and child mortality – ‘coverage’ being defined as the proportion of those needing an intervention who receive it.9 The response to this call is reflected broadly in global efforts to track progress towards the Millennium Development Goals (box 1.1), and is the specific focus of the Countdown to 2015.
Supported through contributions of time and money and governed by a Core Group, the Countdown aims to stimulate country action by tracking coverage for interventions needed to attain Millennium Development Goals 4 and 5, together with parts of Millennium Development Goals 1, 6 and 7. The Countdown tracks coverage within populations targeted by specific interventions and usually measures coverage at the population level (rather than in health facilities, for example). Through the Countdown, national and international policy makers, programme implementers, development and media partners and researchers are working together to:
Summarise, synthesise and disseminate • the best and most recent information on country-level progress towards high, sustained and equitable coverage with health interventions to save women and children.Take stock of progress in maternal, • newborn and child survival.Call on governments, development partners • and the broader community to be accountable if rates of progress are not satisfactory.Identify knowledge gaps that are hindering progress.• Propose new actions to achieve the health-related • Millennium Development Goals, in particular Millennium Development Goals 4 and 5.
The Countdown has planned a series of conferences to be held every two to three years until 2015. Focusing attention on national coverage levels for high-impact interventions in countries with the highest burden
The Millennium Development Goals
Goal 1: Eradicate extreme poverty and hunger.Goal 2: Achieve universal primary education.Goal 3: Promote gender equality and empower
women.Goal 4: Reduce child mortality.Goal 5: Improve maternal health.Goal 6: Combat HIV/AIDS, malaria and other
diseases.Goal 7: Ensure environmental sustainability.Goal 8: Develop a global partnership for
development.
Box 1.1. The Millennium Development Goals
TRACKING PROGRESS IN MATERNAL, NEWBORN & CHILD SURVIVAL THE 2008 REPORT
2
of maternal and child mortality, the Countdown conferences will catalyse greater action and increase accountability for country and partner commitment to the Millennium Development Goals – in particular, to rapid reductions in maternal and child mortality.10 In addition, Countdown publications report on major determinants of coverage, including policies, health system performance measures and financial flows to maternal, newborn and child health.
The first international Countdown conference, focusing on child survival, was hosted in London in December 2005 by 12 organisations.11 Coverage reports were available for 60 countries, accounting for 94 per cent of child deaths worldwide.12 More information on the conference and the 2005 report can be found online (http://www.countdown2015mnch.org/).
Success for the Countdown, however, will be measured by country-level results. In 2006 Senegal was the first country to hold a national Countdown conference, bringing together government leaders, private and public partners and the research community to review progress in child survival. The second international Countdown conference is scheduled for 17–19 April 2008 in Cape Town, South Africa. Covering maternal, newborn and child survival, it will be held in tandem with an Inter-Parliamentary Union meeting, providing government leaders with opportunities for greater involvement in efforts to save women’s and children’s lives.
Participants in the 2005 international Countdown conference had already recognized the importance of working within a broader continuum of care – one that “promotes care for mothers and children from pre-pregnancy to delivery, the immediate postnatal period, and early childhood, recognising that safe childbirth is critical to the health of both the woman and the newborn child.”13 Such a continuum should also link service provision across various settings, from households to community-based care to primary care services to hospitals. The Countdown has explicitly adopted a continuum of care approach. In this report it tracks coverage across the continuum for the first time.
The Countdown has always made nutrition central to its efforts. Improving coverage for proven maternal and child nutrition interventions will contribute to Millennium Development Goal 1.14 At this time, however, only child nutritional status and nutrition interventions are tracked through the Countdown.
The Countdown also recognises the importance of reproductive health services. The target added to
Millennium Development Goal 5 to achieve universal access to reproductive health is an indication of its importance to maternal and newborn survival. Contraceptive prevalence and unmet need are tracked in the present Countdown cycle, and in the next cycle of technical work the Core Group will thoroughly review this area. The 2008 report is complimented by a corresponding Lancet special series on the major findings of the Countdown.
Countdown Principles
The activities of the Countdown are guided byfour principles:
1. Focus on coverage2. Build on existing goals and monitoring efforts3. Promote effective interventions4. Maintain a country orientation
Box 1.2. The Countdown principles
Countdown principles
1. Focus on coverageTimely data on intervention coverage are essential for good programme management. Governments and their partners need up-to-date information on whether their programmes are reaching targeted groups. Such coverage information must be supplemented, of course, with measures of intervention quality and effectiveness.
For interventions proven to reduce mortality, coverage is a useful indicator of progress. Increases in coverage show that policies and delivery strategies are reaching women and children. Failures to increase coverage – assuming that resources have been adequate and that planning has been good – are a cause for urgent concern. District, regional and national managers and their partners should address low coverage rates by examining how interventions are delivered and removing bottlenecks or revising service delivery plans.
This report, which provides the best and most recent information on country-level progress in achieving intervention coverage, is a central part of the Countdown effort. It offers a basis for documenting accomplishments and revitalising efforts where needed.
TRACKING PROGRESS IN MATERNAL, NEWBORN & CHILD SURVIVAL THE 2008 REPORT
3
2. Build on existing goals and monitoring effortsThe Countdown aims to sharpen and reinforce efforts already under way to support countries in meeting their commitments to global goals, and to further the effective use of information collected through existing monitoring mechanisms. Countdown indicators and measurement approaches build on efforts started in the 1990s to monitor progress towards the World Summit for Children goals, which evolved into monitoring strategies for the Millennium Development Goals.15
Emphasis on measuring progress towards international goals and targets has rapidly increased the availability of intervention coverage data. Today’s maternal and child survival indicators reflect a united effort to define and measure indicators consistently, permitting the assessment of trends over time. In some cases, however – notably the definition and measurement of indicators for oral rehydration therapy to prevent diarrhoea dehydration16 – changing public health recommendations made changes in definition and measurement unavoidable.
Tracking through the Countdown complements and promotes country-level monitoring of maternal, newborn and child health programmes. Country-level monitoring focuses on ensuring that policies, plans and resources are in place and that programmes and strategies are implemented fully and adequately; key outcomes for assessing programme implementation include access, quality, coverage and equity. Methods and indicators for monitoring purposes must provide timely information and must reflect country-level needs and decisions. The Countdown aims to build on country-level data, attracting attention and resources for addressing service delivery barriers and to further speed up progress towards the health-related Millennium Development Goals.
The Countdown complements country-level monitoring efforts by focusing on indicators that are closer to impact and that can be measured in ways that permit cross-country comparisons and the estimation of global trends. Coverage indicators meet these criteria, as do many indicators of the impact of programme activities on the nutrition and health status of women, newborns and children. Efforts to identify and define indicators of policies, financial flows and human resources that are sufficiently valid and reliable for global monitoring began in 2005 and are continuing.
The coverage information presented by the Countdown in this report required no new data collection. But the information on policies, health systems and financial flows – here and in future Countdown reports –
combines existing data with those collected specifically for the Countdown. The primary purpose of this report is to bring available data on the priority countries together in one place to facilitate evidence-based review and planning efforts designed to accelerate country-level actions in maternal, newborn and child health.
3. Promote effective interventionsThe Countdown monitors coverage for interventions and approaches feasible for universal implementation in poor countries and with proven effectiveness in improving maternal and child survival and nutrition. (The next chapter describes how the Countdown selects these interventions and approaches and explains the coverage indicators used.)
4. Maintain a country orientationThe Countdown aims to help countries and their development partners achieve the Millennium Development Goals and the World Fit for Children goals and targets.17 While the Countdown will not and should not supplant governments and their partners in their roles as policy makers and service providers, its role extends beyond monitoring – making public health science a basis for public health action. By bringing together diverse individuals with complementary experience, Countdown participants hope to spark and support new insights and concrete directions for improving the health and survival of women and children. So far the Countdown has not taken strong follow-up action in countries, but is a central element of the work scheduled to begin immediately after the April Conference.
© U
NIC
EF/H
Q02
-057
1/G
iaco
mo
Piro
zzi
TRACKING PROGRESS IN MATERNAL, NEWBORN & CHILD SURVIVAL THE 2008 REPORT
4
Links to other monitoring efforts
As part of a much larger effort to track progress towards the Millennium Development Goals, the Countdown aims to complement the work of others – not replace it. Annex A lists resources and initiatives related to Millennium Development Goal monitoring for mothers, newborns and children at the international level. Box 1.3 highlights the Countdown’s added value compared with other international monitoring efforts.
By maintaining a country focus. Individual country profiles • offer selected information about demographic and epidemiological contexts and key coverage determinants.
By tracking progress in 68 priority countries. Sharing the • highest burden of maternal and child mortality, these countries represented more than 97 per cent of all such deaths (deaths in children under 5 in 2006, and maternal deaths in 2005).
By maintaining continuity through 2015. The • Countdown will continue reporting on progress through 2015, the target date for achieving the Millennium Development Goals.
By remaining a supra-institutional effort. The • Countdown brings together representatives from United Nations agencies, civil society, governments, and the donor and development communities.
By promoting country-level action. The • Countdown presents information needed to assess progress and to speed up country-level actions in pursuit of Millennium Development Goals 4 and 5, together with parts of Millennium Development Goals 1, 6 and 7.
How the Countdown Adds Value
Box 1.3. How the Countdown adds value compared with other Millennium Development Goal Monitoring efforts
Country-level program monitoringCountry-level programme monitoring is the most important part of monitoring progress towards the Millennium Development Goals. The Countdown seeks to enhance such monitoring whenever possible. Yet countries bear the main responsibility for interpreting the Countdown results and using them to improve programming. (Quality monitoring and service provision monitoring are the responsibility of governments and their partners and are not addressed here.)
The Countdown as an evolving effortThe Countdown is a process, and will continue to expand and improve over time to address additional elements of the continuum of care. For example, although family planning is included as an essential intervention in the 2008 report, special health risks, vulnerabilities and barriers to access for adolescents are not addressed explicitly, nor is the full range of potential interventions to address undernutrition. We
present this report recognising its limitations, and accept the need to expand the range of interventions that can be tracked effectively in each Countdown cycle while preserving the quality of the effort, especially as new evidence about the impact of interventions becomes available
Overview of this report
This report is intended to help policy makers and their partners assess progress and prioritise actions to reduce maternal, newborn and child mortality. Almost all the data presented here can be found elsewhere. The Countdown adds value by collecting in one place the basic information needed to decide whether maternal and child mortality reductions can be expected in countries with the highest ratios/rates or numbers of such deaths. It adds further value by creating a context – the Countdown conferences – that can make policy makers, development agencies and donors more likely to notice challenges to progress and to respond to them with sound decisions.
Chapter 2 explains how and why the Countdown priority countries were selected, and summarises the selection of Countdown indicators and the data sources and methods used to track progress.
Chapter 3 summarises the findings of the 2008 Report. Specific note is taken of countries with demonstrated progress in raising coverage levels, and areas where intensified effort is needed within and across the priority countries. This preliminary discussion provides a starting point for more in-depth review, discussion and action planning that will take place at the Countdown conference scheduled for April 2008 in Cape Town, South Africa and subsequent regional- and country-level Countdown conferences.
Chapter 4 introduces the individual country profiles. These profiles represent the basic information to be analysed at Countdown conferences, and evidence for assessing progress since the first Countdown Report in 2005. Each profile presents the most recent available information on selected demographic measures of maternal, newborn and child survival and nutritional status, coverage rates for priority interventions, and selected indicators of equity, policy support, human resources and financial flows.
Because the Countdown is an ongoing process that represents an informal affiliation of individuals and agencies committed to accelerating progress toward the health MDGs, we encourage readers to engage with this material critically and to make suggestions about how its utility in promoting and guiding
TRACKING PROGRESS IN MATERNAL, NEWBORN & CHILD SURVIVAL THE 2008 REPORT
5
action can be improved. Comments, critiques and suggestions can be proposed through communication with any of the many Countdown co-sponsors, or sent directly to www.countdown2015mnch.org.
Notes1 Black, Morris and Bryce 2003; Jones, Steketee, Black and others
2003; Bryce, Arifeen, Pariyo, and others 2003; Victora, Wagstaff, Armstrong-Schellenberg and others 2003; The Bellagio Study Group on Child Survival 2003.
2 Lawn, Cousens and Zupan 2005; Darmstadt, Bhutto, Cousens and others 2005; Knippenberg, Lawn, Darmstadt and others 2005; Martines, Paul, Bhutta and others 2005.
3 Ronsmans and Graham 2006; Campbell and Graham 2006.
4 Grantham-McGregor, Cheung, Cueto and others 2007; Walker, Wachs, Gardner and others 2007; Engle, Black, Behrman and others 2007.
5 Glasier, Gülmezoglu, Schmid and others 2006; Wellings, Collumbien, Slaymaker and others 2006; Cleland, Bernstein, Ezeh and others 2006; Cleland, Bernstein, Ezeh and others 2006; Grimes, Benson, Singh and others 2006; Low, Broutet, Adu-Sarkodie and others 2006.
6 Black, Allen, Bhutta and others 2008; Victora, Adair, Fall and others 2008; Bhutta, Ahmed, Black and others 2008; Bryce, Coitinho, Darnton-Hill and others 2008; Morris, Cogill and Uauy 2008.
7 Haines and Victora 2004; Gwatkin, Bhuiya and Victora 2004; Palmer, Mueller, Gilson and others 2004; Hongoro and McPake 2004; Victora, Hanson, Bryce and others 2004; Lavis, Posada, Haines and others 2004.
8 Starrs 2007; Kerber, de Graft-Johnson, Bhutta and others 2007; Freedman, Graham, Brazier and others 2007.
9 Bryce, Arifeen, Pariyo and others 2003, p. 1068.
10 Bryce, Terreri, Victora and others 2006.
11 The hosting organisations were the London School of Hygiene & Tropical Medicine, the Bellagio Child Survival Group, UNICEF, World Health Organization, Lancet, Save the Children, United States Agency for International Development (USAID), USAID’s Basic Support for Institutionalizing Child Survival (BASICS), the UK’s Department for International Development (DFID), the World Bank, the International Paediatric Association and the Partnership for Maternal, Newborn and Child Health.
12 Bryce, Terreri, Victora and others 2006.
13 Tinker, ten Hoope-Bender, Azfar and others 2005, p. 823.
14 World Bank 2006.
15 The World Summit for Children goals can be found at UNICEF’s website (http://www.unicef.org/wsc/). Committed to by heads of state and government in 2002, they cover vital areas of children’s well-being and development and serve as stepping stones towards the Millennium Development Goals (UNICEF 2007b).
16 Victora, Bryce, Fontaine and others 2000.
17 The World Fit for Children goals and targets can be found at UNICEF’s website (http://www.unicef.org/specialsession/wffc/).
© U
NIC
EF/H
Q07
-150
6/A
nita
Khe
mka
TRACKING PROGRESS IN MATERNAL, NEWBORN & CHILD SURVIVAL THE 2008 REPORT
6
© U
NIC
EF/H
Q06
-269
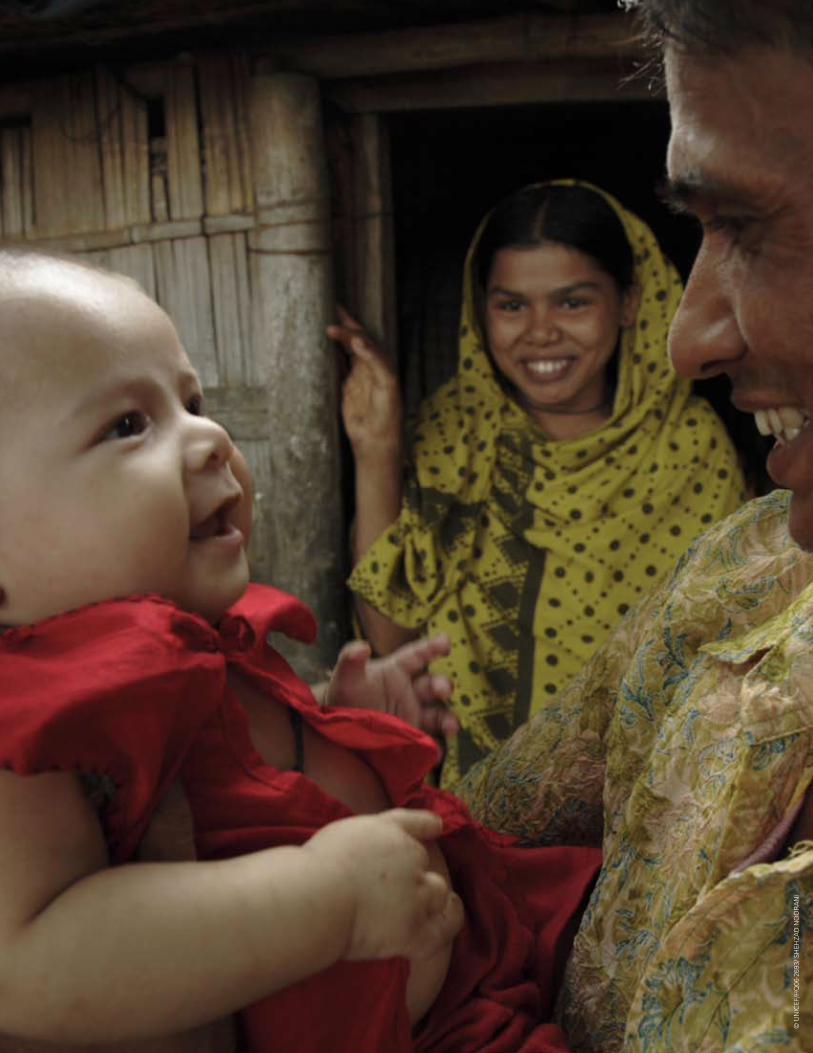
3/ S
HEH
ZAD
NO
OR
AN
I
TRACKING PROGRESS IN MATERNAL, NEWBORN & CHILD SURVIVAL THE 2008 REPORT
7
2Tracking indicators and methods
This chapter begins with an overview of how the priority Countdown countries were selected. In the second section we introduce the interventions and approaches within the continuum of care for maternal, newborn and child health that are tracked through the Countdown and the coverage indicators associated with each. The third section discusses determinants of coverage at the country level, such as policies, health system strength and financial flows, followed by a description of how equity is tracked through the Countdown. In the final section of the chapter we describe the data sources and methods used for the Countdown tracking effort.
Selecting the Countdown priority countries
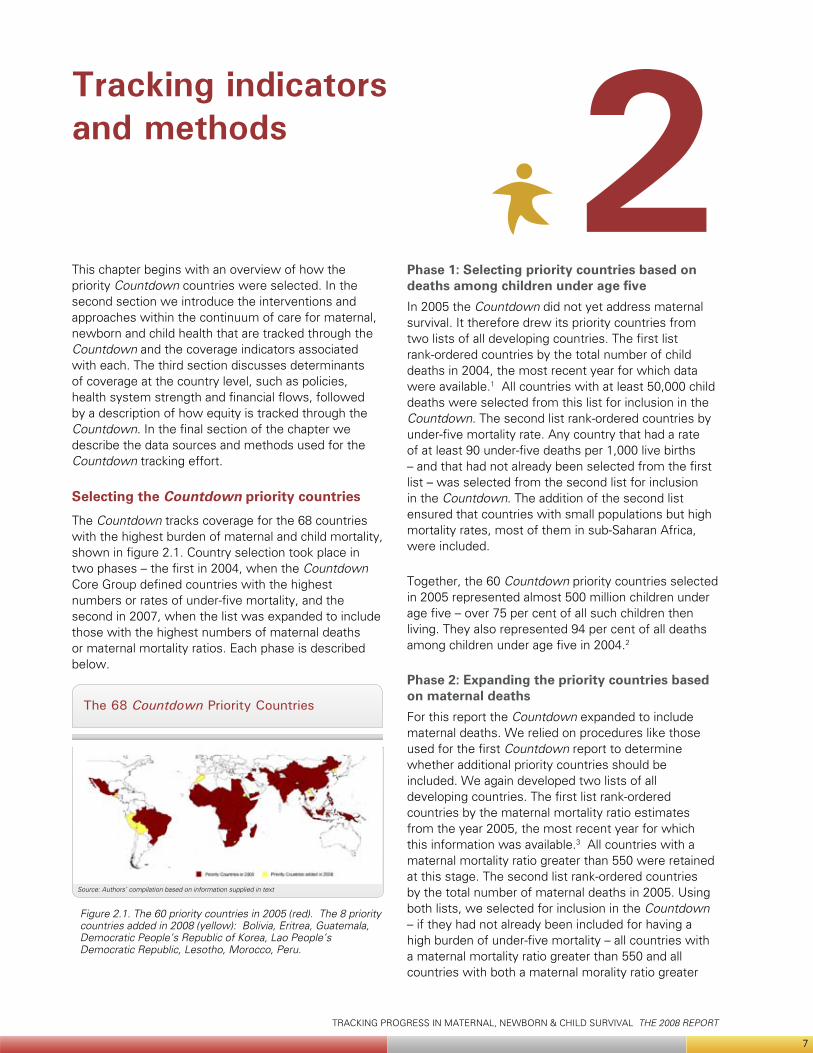
The Countdown tracks coverage for the 68 countries with the highest burden of maternal and child mortality, shown in figure 2.1. Country selection took place in two phases – the first in 2004, when the Countdown Core Group defined countries with the highest numbers or rates of under-five mortality, and the second in 2007, when the list was expanded to include those with the highest numbers of maternal deaths or maternal mortality ratios. Each phase is described below.
Phase 1: Selecting priority countries based on deaths among children under age fiveIn 2005 the Countdown did not yet address maternal survival. It therefore drew its priority countries from two lists of all developing countries. The first list rank-ordered countries by the total number of child deaths in 2004, the most recent year for which data were available.1 All countries with at least 50,000 child deaths were selected from this list for inclusion in the Countdown. The second list rank-ordered countries by under-five mortality rate. Any country that had a rate of at least 90 under-five deaths per 1,000 live births – and that had not already been selected from the first list – was selected from the second list for inclusion in the Countdown. The addition of the second list ensured that countries with small populations but high mortality rates, most of them in sub-Saharan Africa, were included.
Together, the 60 Countdown priority countries selected in 2005 represented almost 500 million children under age five – over 75 per cent of all such children then living. They also represented 94 per cent of all deaths among children under age five in 2004.2
Phase 2: Expanding the priority countries based on maternal deaths For this report the Countdown expanded to include maternal deaths. We relied on procedures like those used for the first Countdown report to determine whether additional priority countries should be included. We again developed two lists of all developing countries. The first list rank-ordered countries by the maternal mortality ratio estimates from the year 2005, the most recent year for which this information was available.3 All countries with a maternal mortality ratio greater than 550 were retained at this stage. The second list rank-ordered countries by the total number of maternal deaths in 2005. Using both lists, we selected for inclusion in the Countdown – if they had not already been included for having a high burden of under-five mortality – all countries with a maternal mortality ratio greater than 550 and all countries with both a maternal morality ratio greater
The 68 Countdown Priority Countries
Figure 2.1. The 60 priority countries in 2005 (red). The 8 priority countries added in 2008 (yellow): Bolivia, Eritrea, Guatemala, Democratic People’s Republic of Korea, Lao People’s Democratic Republic, Lesotho, Morocco, Peru.
Source: Authors’ compilation based on information supplied in text
TRACKING PROGRESS IN MATERNAL, NEWBORN & CHILD SURVIVAL THE 2008 REPORT
8
than 200 and at least 750 maternal deaths in 2005. Countries with high under-five mortality overlapped significantly with those that had high maternal mortality. This exercise led to the inclusion of just eight additional Countdown priority countries: Bolivia, the Democratic Republic of Korea, Eritrea, Guatemala, Lao People’s Democratic Republic, Lesotho, Morocco and Peru.
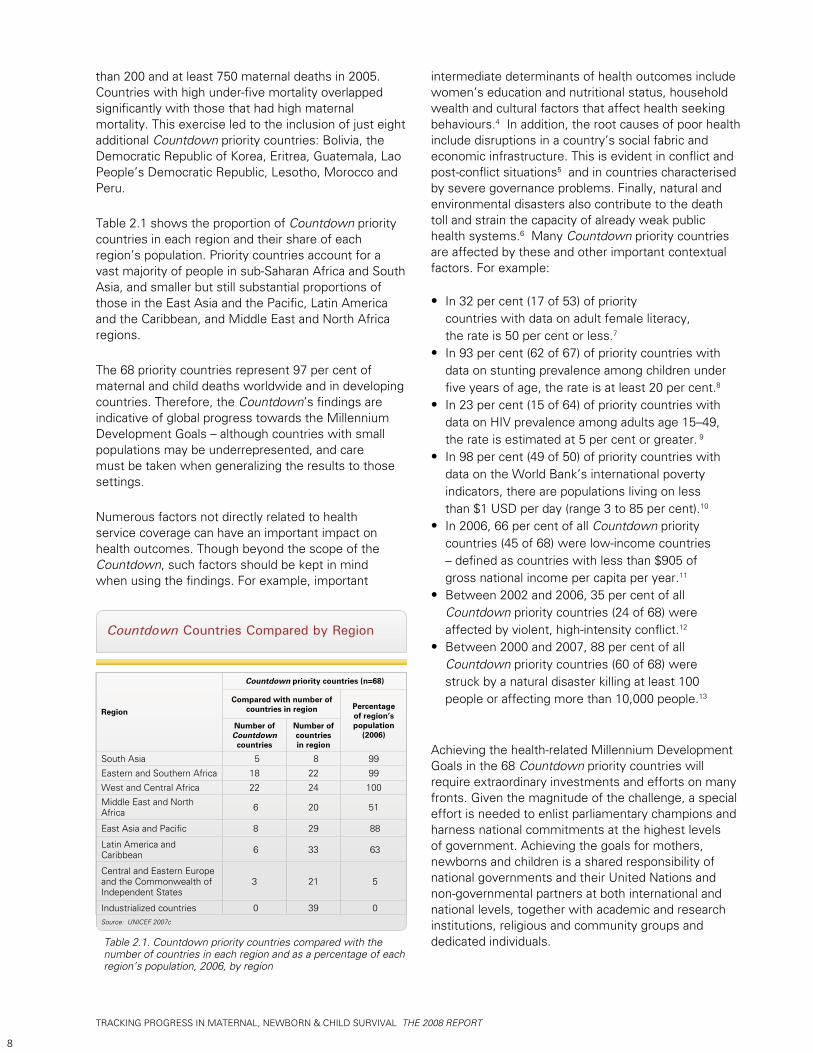
Table 2.1 shows the proportion of Countdown priority countries in each region and their share of each region’s population. Priority countries account for a vast majority of people in sub-Saharan Africa and South Asia, and smaller but still substantial proportions of those in the East Asia and the Pacific, Latin America and the Caribbean, and Middle East and North Africa regions.
The 68 priority countries represent 97 per cent of maternal and child deaths worldwide and in developing countries. Therefore, the Countdown’s findings are indicative of global progress towards the Millennium Development Goals – although countries with small populations may be underrepresented, and care must be taken when generalizing the results to those settings.
Numerous factors not directly related to health service coverage can have an important impact on health outcomes. Though beyond the scope of the Countdown, such factors should be kept in mind when using the findings. For example, important
intermediate determinants of health outcomes include women’s education and nutritional status, household wealth and cultural factors that affect health seeking behaviours.4 In addition, the root causes of poor health include disruptions in a country’s social fabric and economic infrastructure. This is evident in conflict and post-conflict situations5 and in countries characterised by severe governance problems. Finally, natural and environmental disasters also contribute to the death toll and strain the capacity of already weak public health systems.6 Many Countdown priority countries are affected by these and other important contextual factors. For example:
In 32 per cent (17 of 53) of priority • countries with data on adult female literacy, the rate is 50 per cent or less.7
In 93 per cent (62 of 67) of priority countries with • data on stunting prevalence among children under five years of age, the rate is at least 20 per cent.8
In 23 per cent (15 of 64) of priority countries with • data on HIV prevalence among adults age 15–49, the rate is estimated at 5 per cent or greater. 9
In 98 per cent (49 of 50) of priority countries with • data on the World Bank’s international poverty indicators, there are populations living on less than $1 USD per day (range 3 to 85 per cent).10
In 2006, 66 per cent of all • Countdown priority countries (45 of 68) were low-income countries – defined as countries with less than $905 of gross national income per capita per year.11
Between 2002 and 2006, 35 per cent of all • Countdown priority countries (24 of 68) were affected by violent, high-intensity conflict.12
Between 2000 and 2007, 88 per cent of all • Countdown priority countries (60 of 68) were struck by a natural disaster killing at least 100 people or affecting more than 10,000 people.13
Achieving the health-related Millennium Development Goals in the 68 Countdown priority countries will require extraordinary investments and efforts on many fronts. Given the magnitude of the challenge, a special effort is needed to enlist parliamentary champions and harness national commitments at the highest levels of government. Achieving the goals for mothers, newborns and children is a shared responsibility of national governments and their United Nations and non-governmental partners at both international and national levels, together with academic and research institutions, religious and community groups and dedicated individuals.Table 2.1. Countdown priority countries compared with the
number of countries in each region and as a percentage of each region’s population, 2006, by region
Countdown Countries Compared by Region
Source: UNICEF 2007c
Region
Countdown priority countries (n=68)
Compared with number of countries in region Percentage
of region’s population
(2006)Number of Countdown
countries
Number of countries in region
South Asia 5 8 99
Eastern and Southern Africa 18 22 99
West and Central Africa 22 24 100
Middle East and North Africa 6 20 51
East Asia and Pacific 8 29 88
Latin America and Caribbean 6 33 63
Central and Eastern Europe and the Commonwealth of Independent States
3 21 5
Industrialized countries 0 39 0
TRACKING PROGRESS IN MATERNAL, NEWBORN & CHILD SURVIVAL THE 2008 REPORT
9
Priority interventions and coverage indicators
Chapter 1 described the principles that guide the Countdown, including its focus on tracking population coverage for effective interventions and approaches that are feasible for universal implementation in poor countries. In this section we describe how the Countdown interventions and approaches were chosen, how indicators of coverage were selected for each and how we arrived at the coverage estimates in this report.
Inclusion criteria for interventions and approachesThe Countdown’s most important criterion for including an intervention is the availability of internationally accepted (peer-reviewed) evidence demonstrating that it can reduce mortality among mothers, newborns or children under age five. The first Countdown, in 2005, was able to draw on the 2003 and 2005 Lancet series on child and neonatal survival, respectively, which used systematic literature reviews to identify such interventions.14
As the Countdown expanded to include maternal survival, and in light of new thinking about the continuum of care,15 the Core Group recognized that the focus on single interventions was too narrow. Coverage with broader approaches such as antenatal and postnatal care, delivery care and reproductive health services – as basic platforms for delivering multiple interventions proven to reduce maternal and newborn mortality – also needed to be tracked. Beginning with this report, the Countdown will track both interventions and approaches, provided that at least one effective intervention is supported by each approach.
For this report a Countdown Working Group on Indicators and Coverage Data was convened and charged with reviewing new evidence on interventions included in the 2005 Countdown, as well as determining whether additional interventions or delivery platforms should be included in 2008. A full report of the Working Group’s deliberations and decisions is at the Countdown website (www.countdown2015mnch.org).
Among proven interventions, the Countdown includes only those judged feasible for delivery with universal coverage in low-income countries. Because intervention costs and delivery strategies can change, this criterion must be reassessed in each Countdown cycle.
The Countdown does not aim to be comprehensive and does not necessarily include all interventions and approaches meeting the criteria described above. For example, as explained below, interventions have been excluded if no appropriate coverage indicator is available. In addition, the Countdown strives to limit the total number of interventions and indicators to keep the effort manageable and focused.
The criteria used to assess potential coverage indicators were based on the normative principle that a ‘good’ coverage indicator should provide a valid measure of whether the target population for a given intervention receives it when it is needed and when it is clinically effective. In addition, though, indicators used for the Countdown must produce results that are:
Nationally representative.• Reliable and comparable across countries and time• Clear and easily interpreted by policy • makers and program managers.Available regularly in most of the • Countdown priority countries.
None of the 68 priority countries has a health information system that can now produce coverage estimates meeting the standards described above for all indicators.11 Fortunately, most of the Countdown coverage indicators tracked in 2005 have since been included in the protocols for the major population-based surveys used in the 68 priority countries – usually either the UNICEF-supported Multiple Indicator Cluster Surveys16 or the Demographic and Health Surveys supported by the United States Agency for International Development.17 Exceptions include interventions for which data collection and the analysis of coverage indicators are not yet routine or harmonised, such as unmet need for family planning or a postnatal visit for the newborn within two days of birth. In addition, coverage estimates for vaccinations, vitamin A supplementation and the prevention of mother-to-child transmission of HIV/AIDS reflect the synthesis of routine program data and data from household surveys. Annex B lists the data sources for all indicators included in the 2008 Countdown cycle.
The 2008 Countdown coverage indicators The Countdown builds on the work of others. Coverage estimates and trends for HIV-related interventions, immunisation, vitamin A supplementation and water and sanitation reflect the work of various interagency working groups described more fully below. For other indicators the Countdown reports available estimates but recognizes the need for improvement in data availability and estimation methods. (Annex C defines the Countdown 2008 coverage indicators.)
TRACKING PROGRESS IN MATERNAL, NEWBORN & CHILD SURVIVAL THE 2008 REPORT
10
Through its efforts the Countdown has acquired a clear view of the limitations of available coverage indicators, the data that support them and the process through which country-specific estimates are updated. A part of the Countdown work plan is addressing these issues.
Coverage indicators are summarized only for countries to which they are relevant. For example, only 45 of the 68 countries have endemic malaria, defined here as documented risk of Plasmodium falciparum transmission nationwide and throughout the year.18 The country profiles estimate coverage for countries with limited geographic areas of malaria risk, but such countries are not included in the results summarized in this chapter. All Countdown priority countries are considered to need antiretroviral treatment for pregnant women with HIV/AIDS to prevent mother-to-child transmission.19
Indicators for factors that contribute to coverage
The Countdown Core Group identified two prerequisites for success in attaining high, sustained and equitable levels of coverage for interventions and approaches proven to improve maternal and child survival: a supportive policy environment with adequate health systems support (including human resources) and predictable, longer term financial support. For the 2008 Countdown, technical groups were convened in each area and charged with reviewing the 2005 Countdown experience and improving on the tracking procedures.
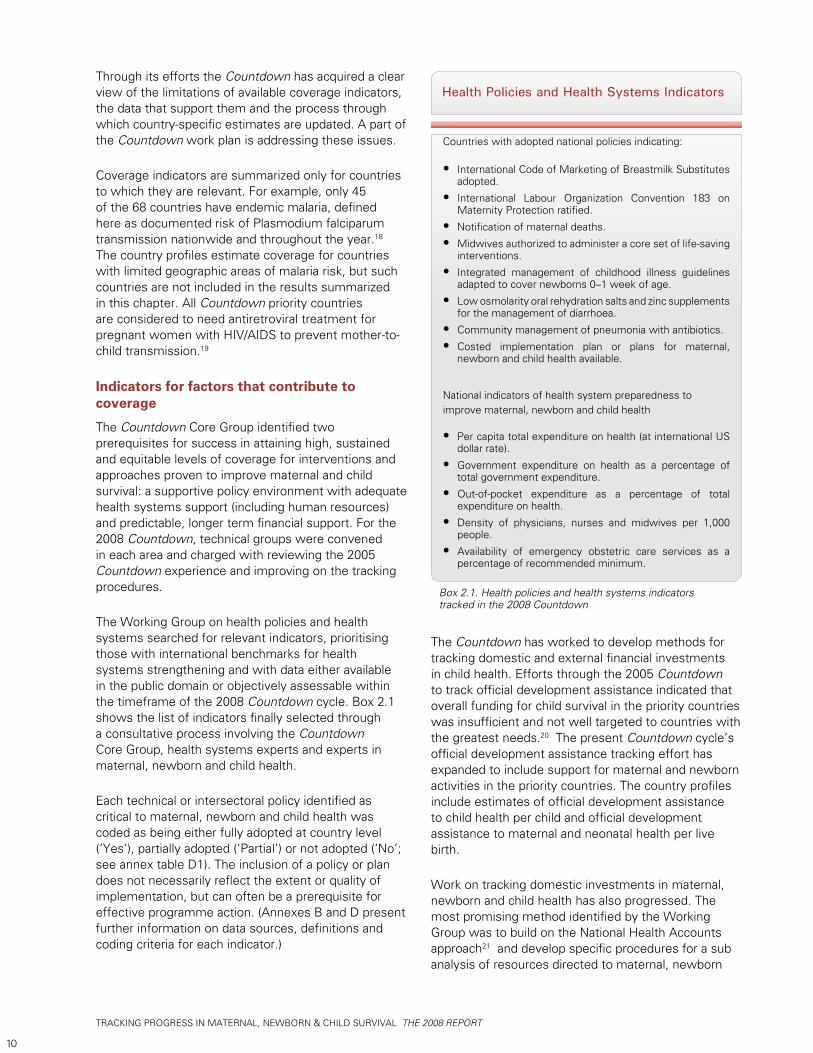
The Working Group on health policies and health systems searched for relevant indicators, prioritising those with international benchmarks for health systems strengthening and with data either available in the public domain or objectively assessable within the timeframe of the 2008 Countdown cycle. Box 2.1 shows the list of indicators finally selected through a consultative process involving the Countdown Core Group, health systems experts and experts in maternal, newborn and child health.
Each technical or intersectoral policy identified as critical to maternal, newborn and child health was coded as being either fully adopted at country level (‘Yes’), partially adopted (‘Partial’) or not adopted (‘No’; see annex table D1). The inclusion of a policy or plan does not necessarily reflect the extent or quality of implementation, but can often be a prerequisite for effective programme action. (Annexes B and D present further information on data sources, definitions and coding criteria for each indicator.)
The Countdown has worked to develop methods for tracking domestic and external financial investments in child health. Efforts through the 2005 Countdown to track official development assistance indicated that overall funding for child survival in the priority countries was insufficient and not well targeted to countries with the greatest needs.20 The present Countdown cycle’s official development assistance tracking effort has expanded to include support for maternal and newborn activities in the priority countries. The country profiles include estimates of official development assistance to child health per child and official development assistance to maternal and neonatal health per live birth.
Work on tracking domestic investments in maternal, newborn and child health has also progressed. The most promising method identified by the Working Group was to build on the National Health Accounts approach21 and develop specific procedures for a sub analysis of resources directed to maternal, newborn
Box 2.1. Health policies and health systems indicators tracked in the 2008 Countdown
Countries with adopted national policies indicating:
International Code of Marketing of Breastmilk Substitutes • adopted.
International Labour Organization Convention 183 on • Maternity Protection ratified.
Notification of maternal deaths.• Midwives authorized to administer a core set of life-saving • interventions.
Integrated management of childhood illness guidelines • adapted to cover newborns 0–1 week of age.
Low osmolarity oral rehydration salts and zinc supplements • for the management of diarrhoea.
Community management of pneumonia with antibiotics.• Costed implementation plan or plans for maternal, • newborn and child health available.
National indicators of health system preparedness to improve maternal, newborn and child health
Per capita total expenditure on health (at international US • dollar rate).
Government expenditure on health as a percentage of • total government expenditure.
Out-of-pocket expenditure as a percentage of total • expenditure on health.
Density of physicians, nurses and midwives per 1,000 • people.
Availability of emergency obstetric care services as a • percentage of recommended minimum.
Health Policies and Health Systems Indicators
TRACKING PROGRESS IN MATERNAL, NEWBORN & CHILD SURVIVAL THE 2008 REPORT
11
and child health, including reproductive health. Results on a greater number of countries are expected in the next Countdown cycle.
Tracking improvements in equity
Efforts to monitor coverage for interventions proven to reduce maternal and child mortality are incomplete without measures of equity, defined here as the extent to which mothers and children in different socioeconomic or ethnic groups or children of different sexes are equally likely to receive services. Each 2005 Countdown country profile included a graph showing the proportion of children under age five in two population quintiles – the poorest and the least poor – who were receiving six or more preventive child survival interventions.22
In the 2008 Countdown cycle we focus on socioeconomic inequities across a broader set of interventions. Because curative services are needed only by particular subpopulations in response to particular health events, we developed a new measure reflecting the gap between universal coverage for an intervention (100 per cent of the population in need) and current coverage for each country. This ‘coverage gap’ measure includes eight interventions grouped into four areas:
Family planning (need met or modern contraceptive 1. use).
Maternal and newborn care (antenatal care and 2. skilled birth attendance).
Immunisation (measles vaccine, Bacille Calmette-3. Guerin vaccine against tuberculosis and third dose of diphtheria and tetanus with pertussis vaccine).
Treatment of child illness (medical care sought 4. for acute respiratory infection and oral rehydration therapy with continued feeding for diarrhoea).
Larger coverage gaps indicate poorer coverage for these interventions; smaller coverage gaps indicate better coverage. Thus, while the coverage gap across wealth quintiles represents coverage inequities within a country, it can also be compared with other countries’ coverage gaps to suggest intercountry coverage inequities. (Annex E offers further details about the construction of the coverage gap measure and guidance on its interpretation.)
Data sources and methods
The Countdown aims to bring together data on coverage for interventions and approaches with proven effectiveness in reducing maternal, newborn and child survival, making this information readily accessible and spurring donors and policy makers to action. The Countdown does not normally collect new coverage data. This section describes the sources of Countdown data (listed for each indicator in annex B) and the quality control mechanisms that are already in place to assess and ensure their validity. Any secondary analysis carried out solely for the Countdown’s use is described in detail. The section follows the order in which indicators are presented on the country profiles available in chapter 4.
Child and maternal mortality Country-specific estimates of mortality in children under age five were abstracted from tables in The State of the World’s Children 2008.23 The methods and limitations associated with these estimates are available elsewhere.24 Country-specific cause-of-death profiles were abstracted from World Health Organization statistical databases,25 based on work by the Child Health Epidemiology Reference Group.26
Progress towards Millennium Development Goal 4 was assessed by determining whether the average annual rate of reduction in mortality in children under age five from 1990–2006 matched or exceeded the rate needed from 2007–2015 if the goal is to be met. If a country’s mortality rate in children under age five is less than 40 per 1,000 live births, or greater than or equal to 40 with an average annual reduction rate of at least 4 per cent for 1990–2006, it is considered ‘on track’. If the country’s mortality rate in children under age five is greater than or equal to 40 and the average annual reduction rate for 1990–2006 was between 1.0 per cent and 3.9 per cent, the country is considered to be making ‘insufficient progress’. If the mortality rate in children under age five is greater than or equal to 40 and the average annual reduction rate for 1990–2006 was less than 1.0 per cent, the country is considered to be making ‘no progress’.
Country-specific maternal mortality ratios per 100,000 live births reflect 2005 data,27 drawing on estimates developed by the Maternal Mortality Working Group. Because large uncertainty margins surround these estimates, progress towards Millennium Development Goal 5 – improve maternal health – was assessed using four broad categories for maternal mortality: low (maternal mortality ratio of less than 100), moderate (maternal mortality ratio of 100–299), high (maternal mortality ratio of 300–549) and very high (maternal mortality ratio of 550 or greater).28
TRACKING PROGRESS IN MATERNAL, NEWBORN & CHILD SURVIVAL THE 2008 REPORT
12
Nutritional statusThe Countdown country profiles include nutritional status indicators (such as underweight prevalence, stunting prevalence, wasting prevalence and incidence of low birthweight) as an important reference point for interpreting coverage. Country-specific estimates for nutritional status indicators29 were adjusted to reflect new World Health Organization growth standards.30 An exception is estimates of low birthweight, which are not dependent on the growth standards and have been adjusted here for high underreporting (especially in sub-Saharan Africa).31
Coverage
Data sources and quality. Household surveys are the primary data source for tracking progress in coverage for maternal, newborn and child survival. The main sources of coverage data for the Countdown are UNICEF’s global databases and the coverage estimates in its annual The State of the World’s Children reports. The two most important sources of household survey data are the Multiple Indicator Cluster Surveys (MICS) and the Demographic and Health Surveys (DHS). The latest protocols for these two surveys permit collecting harmonised information on most of the Countdown coverage indicators.
The remaining coverage estimates come from several sources. The latest available coverage data and methods of estimating coverage for antiretroviral treatment to prevent mother-to-child HIV transmission reflect harmonised estimates developed by the Joint United Nations Programme on HIV/AIDS (UNAIDS), UNICEF and the World Health Organization. Based on denominators derived from unpublished HIV estimates for 2007 by the Joint United Nations Programme on HIV/AIDS and the World Health Organization, these harmonised estimates are more recent than those published in UNICEF’s The State of the World’s Children 2008. Data on Caesarean section prevalence are drawn from the Demographic and Health Surveys.
Many groups share responsibility for the quality control of the coverage estimates for interventions and approaches effective in reducing maternal, newborn and child mortality. Table 2.2 summarizes quality review and improvement mechanisms for the maternal, newborn and child health coverage indicators, together with selected mortality measures.
A number of methodological challenges in coverage measurement have been known for some time. The Countdown throws these challenges into relief. They will be prioritized as part of the Countdown technical work plan in the next reporting cycle. One area that
needs urgent attention is the development of standard procedures for estimating uncertainty. The 2008 report presents point estimates and makes no attempt to estimate precision or provide uncertainty ranges.
Data summary and analysis. The Countdown focuses on accelerating coverage improvements at the country level. Therefore, in summarizing the results this report uses the country as its unit of analysis, consistent with the need for in-depth country-by-country analysis and action. The most appropriate summary measures for this purpose are the median, which gives each of the 68 countries an equal weight, and the range, which illustrates the extent of the variation among countries.
All Countdown Core Group members were invited to participate in a consultative process to agree on the most important aspects of the country-specific findings and their implications for achieving Millennium Development Goals 4 and 5. Meetings were held in Addis Ababa (2 December 2007), Geneva (10 December 2007) and New York (12 January 2008). At each meeting participants examined preliminary results and agreed on the most important findings and their implications for continued implementation efforts. These findings were then shared with the broader Countdown Core Group through a draft report, resulting in extensive further discussion and agreement on the conclusions presented here.
In 2005, summaries of performance across the priority countries for each indicator were categorized in three ways – ‘on track’, ‘watch and act’ or ‘high alert’ – based on international targets. For indicators without targets, categorizations across the priority countries were based on arbitrary thresholds for high, middle and low performance.
In 2008 the challenge was to compare progress over time as well as across countries. Countries were first grouped into the 2005 categories for each indicator. But since the number of countries had increased from 60 in 2005 to 68 in 2008 – resulting in a lack of data for one of the two years in some countries – summaries like those presented in 2005 proved difficult to produce, and an alternative approach to summary analysis was devised.
For the 2008 Countdown, then, progress is measured by the average annual percentage point change in coverage for each indicator, standardized to a three-year reference period to conform to the Countdown reporting cycle. Using the databases containing the trend information presented in the 2008 country profiles, we identified the subset of countries that had two data points for each indicator since 1998 with
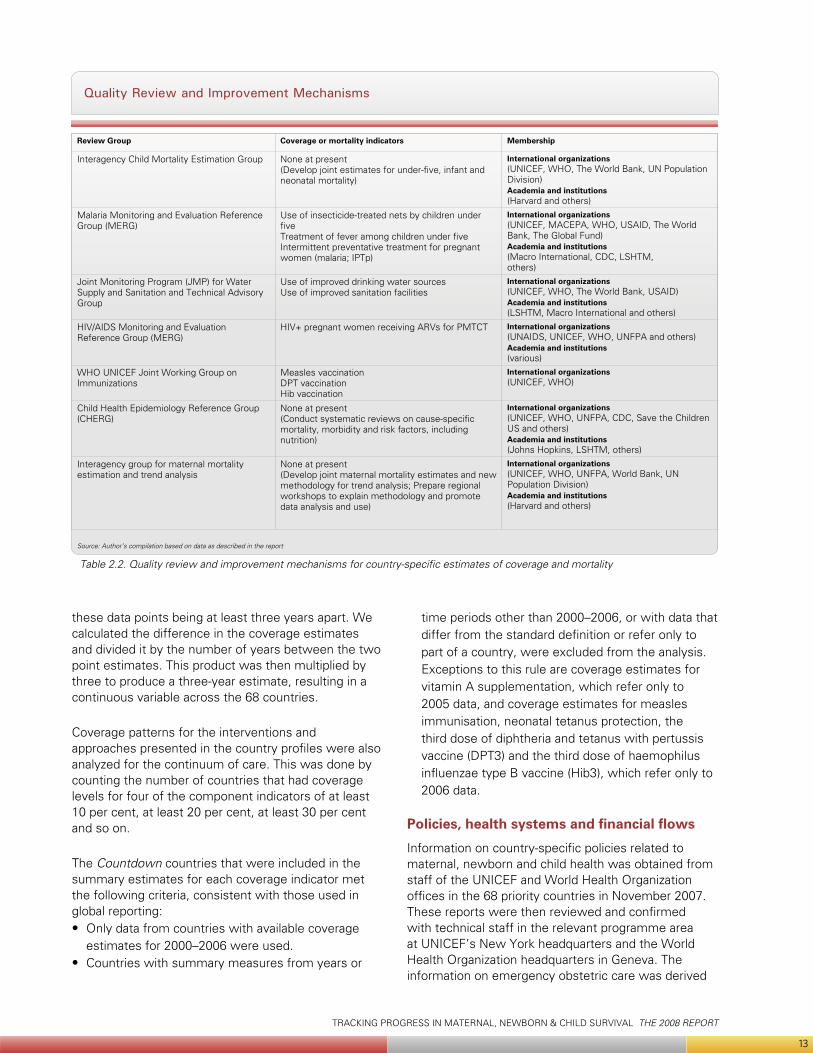
TRACKING PROGRESS IN MATERNAL, NEWBORN & CHILD SURVIVAL THE 2008 REPORT
13
these data points being at least three years apart. We calculated the difference in the coverage estimates and divided it by the number of years between the two point estimates. This product was then multiplied by three to produce a three-year estimate, resulting in a continuous variable across the 68 countries.
Coverage patterns for the interventions and approaches presented in the country profiles were also analyzed for the continuum of care. This was done by counting the number of countries that had coverage levels for four of the component indicators of at least 10 per cent, at least 20 per cent, at least 30 per cent and so on.
The Countdown countries that were included in the summary estimates for each coverage indicator met the following criteria, consistent with those used in global reporting:
Only data from countries with available coverage • estimates for 2000–2006 were used.Countries with summary measures from years or •
time periods other than 2000–2006, or with data that differ from the standard definition or refer only to part of a country, were excluded from the analysis. Exceptions to this rule are coverage estimates for vitamin A supplementation, which refer only to 2005 data, and coverage estimates for measles immunisation, neonatal tetanus protection, the third dose of diphtheria and tetanus with pertussis vaccine (DPT3) and the third dose of haemophilus influenzae type B vaccine (Hib3), which refer only to 2006 data.
Policies, health systems and financial flows
Information on country-specific policies related to maternal, newborn and child health was obtained from staff of the UNICEF and World Health Organization offices in the 68 priority countries in November 2007. These reports were then reviewed and confirmed with technical staff in the relevant programme area at UNICEF’s New York headquarters and the World Health Organization headquarters in Geneva. The information on emergency obstetric care was derived
Review Group Coverage or mortality indicators Membership
Interagency Child Mortality Estimation Group None at present (Develop joint estimates for under-five, infant and neonatal mortality)
International organizations(UNICEF, WHO, The World Bank, UN Population Division)Academia and institutions(Harvard and others)
Malaria Monitoring and Evaluation Reference Group (MERG)
Use of insecticide-treated nets by children under five Treatment of fever among children under five Intermittent preventative treatment for pregnant women (malaria; IPTp)
International organizations(UNICEF, MACEPA, WHO, USAID, The World Bank, The Global Fund) Academia and institutions(Macro International, CDC, LSHTM,others)
Joint Monitoring Program (JMP) for Water Supply and Sanitation and Technical Advisory Group
Use of improved drinking water sourcesUse of improved sanitation facilities
International organizations (UNICEF, WHO, The World Bank, USAID) Academia and institutions (LSHTM, Macro International and others)
HIV/AIDS Monitoring and Evaluation Reference Group (MERG)
HIV+ pregnant women receiving ARVs for PMTCT International organizations (UNAIDS, UNICEF, WHO, UNFPA and others) Academia and institutions(various)
WHO UNICEF Joint Working Group on Immunizations
Measles vaccinationDPT vaccinationHib vaccination
International organizations (UNICEF, WHO)
Child Health Epidemiology Reference Group (CHERG)
None at present (Conduct systematic reviews on cause-specific mortality, morbidity and risk factors, including nutrition)
International organizations (UNICEF, WHO, UNFPA, CDC, Save the Children US and others)Academia and institutions(Johns Hopkins, LSHTM, others)
Interagency group for maternal mortality estimation and trend analysis
None at present (Develop joint maternal mortality estimates and new methodology for trend analysis; Prepare regional workshops to explain methodology and promote data analysis and use)
International organizations (UNICEF, WHO, UNFPA, World Bank, UN Population Division)Academia and institutions(Harvard and others)
Table 2.2. Quality review and improvement mechanisms for country-specific estimates of coverage and mortality
Quality Review and Improvement Mechanisms
Source: Author’s compilation based on data as described in the report
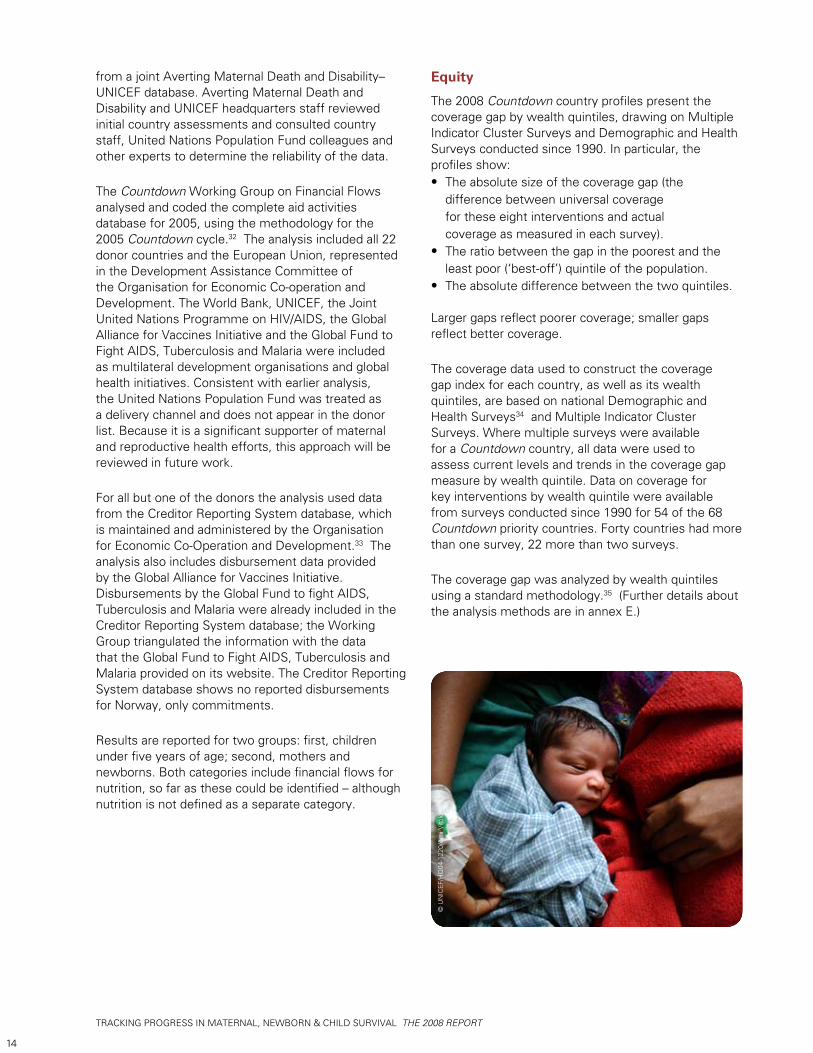
TRACKING PROGRESS IN MATERNAL, NEWBORN & CHILD SURVIVAL THE 2008 REPORT
14
from a joint Averting Maternal Death and Disability–UNICEF database. Averting Maternal Death and Disability and UNICEF headquarters staff reviewed initial country assessments and consulted country staff, United Nations Population Fund colleagues and other experts to determine the reliability of the data.
The Countdown Working Group on Financial Flows analysed and coded the complete aid activities database for 2005, using the methodology for the 2005 Countdown cycle.32 The analysis included all 22 donor countries and the European Union, represented in the Development Assistance Committee of the Organisation for Economic Co-operation and Development. The World Bank, UNICEF, the Joint United Nations Programme on HIV/AIDS, the Global Alliance for Vaccines Initiative and the Global Fund to Fight AIDS, Tuberculosis and Malaria were included as multilateral development organisations and global health initiatives. Consistent with earlier analysis, the United Nations Population Fund was treated as a delivery channel and does not appear in the donor list. Because it is a significant supporter of maternal and reproductive health efforts, this approach will be reviewed in future work.
For all but one of the donors the analysis used data from the Creditor Reporting System database, which is maintained and administered by the Organisation for Economic Co-Operation and Development.33 The analysis also includes disbursement data provided by the Global Alliance for Vaccines Initiative. Disbursements by the Global Fund to fight AIDS, Tuberculosis and Malaria were already included in the Creditor Reporting System database; the Working Group triangulated the information with the data that the Global Fund to Fight AIDS, Tuberculosis and Malaria provided on its website. The Creditor Reporting System database shows no reported disbursements for Norway, only commitments.
Results are reported for two groups: first, children under five years of age; second, mothers and newborns. Both categories include financial flows for nutrition, so far as these could be identified – although nutrition is not defined as a separate category.
Equity
The 2008 Countdown country profiles present the coverage gap by wealth quintiles, drawing on Multiple Indicator Cluster Surveys and Demographic and Health Surveys conducted since 1990. In particular, the profiles show:
The absolute size of the coverage gap (the • difference between universal coverage for these eight interventions and actual coverage as measured in each survey).The ratio between the gap in the poorest and the • least poor (‘best-off’) quintile of the population.The absolute difference between the two quintiles. •
Larger gaps reflect poorer coverage; smaller gaps reflect better coverage.
The coverage data used to construct the coverage gap index for each country, as well as its wealth quintiles, are based on national Demographic and Health Surveys34 and Multiple Indicator Cluster Surveys. Where multiple surveys were available for a Countdown country, all data were used to assess current levels and trends in the coverage gap measure by wealth quintile. Data on coverage for key interventions by wealth quintile were available from surveys conducted since 1990 for 54 of the 68 Countdown priority countries. Forty countries had more than one survey, 22 more than two surveys.
The coverage gap was analyzed by wealth quintiles using a standard methodology.35 (Further details about the analysis methods are in annex E.)
© U
NIC
EF/H
Q04
-122
0/A
mi V
itale
TRACKING PROGRESS IN MATERNAL, NEWBORN & CHILD SURVIVAL THE 2008 REPORT
15
1 UNICEF 2005.
2 UNICEF 2004.
3 WHO, UNICEF, UNFPA and World Bank 2007; UNICEF 2007c; Hill, Thomas, AbouZahr and others 2007.
4 Glewwe, 1999; Schell, Reilly, Rosling and others 2007.
5 Pedersen 2002; Al Gasseer, Dresden, Keeney and others 2004.
6 Noji 2000.
7 UNICEF 2006b.
8 UNICEF 2007c.
9 UNICEF 2007a; UNAIDS and WHO 2007; UNAIDS 2007.
10 UNICEF 2007c.
11 World Bank n.d.
12 Personal communication from Edilberto Loaiza, DPP/SIS UNICEF, 25 January 2008, based on a recent analysis by UNICEF of the Uppsala conflict database, the Conflict Barometer of the Heidelberg Institute for International Conflict Research, and Project Ploughshares 2007.the Project Ploughshares’ Armed Conflicts Report 2007.
13 Emergency Events Database n.d.
14 Jones, Steketee, Black and others 2003; Darmstadt, Bhutto, Cousens and others 2005.
15 Tinker, ten Hoope-Bender, Azfar and others 2005; Kerber, de Graft-Johnson, Bhutta and others 2007.
16 UNICEF n.d.
17 Measure DHS, MACRO International, Inc. n.d.
18 WHO 2007a.
19 UNICEF 2007c; UNICEF 2007a; UNAIDS and WHO 2007; UNAIDS 2007.
20 Powell-Jackson, Borghi, Mueller and others 2006.
21 World Bank, WHO and USAID 2003.
22 Bryce, Terreri, Victora and others 2006.
23 UNICEF 2007c.
24 UNICEF, WHO, World Bank and UNPD 2007.
25 WHO 2007b.
26 Bryce, Boschi-Pinto, Shibuya and others 2005.
27 UNICEF 2007b, p. 27.
28 Hill, Thomas, AbouZahr and others 2007.
29 UNICEF 2007c, pp. 118–21.
30 WHO 2006a.
31 Blanc and Wardlaw 2005.
32 Powell-Jackson, Borshi, Mueller and others 2006.
33 IDS n.d.
34 Gwatkin, Rutstein, Johnson and others 2007.
35 Filmer and Pritchett 2001.
Notes
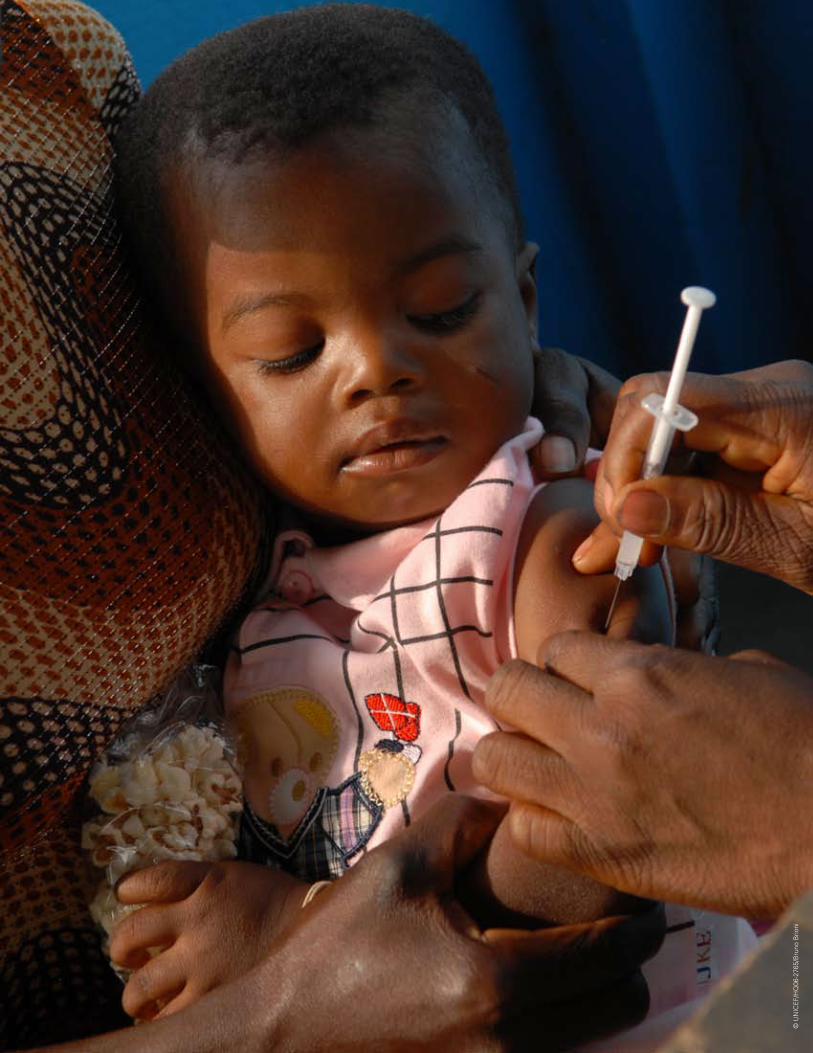
TRACKING PROGRESS IN MATERNAL, NEWBORN & CHILD SURVIVAL THE 2008 REPORT
16
© U
NIC
EF/H
Q06
-276
5/B
runo
Brio
ni
TRACKING PROGRESS IN MATERNAL, NEWBORN & CHILD SURVIVAL THE 2008 REPORT
17
3The 2008 Countdown findings – and a call to action
The Countdown’s most important findings appear in the individual country profiles, which answer basic questions about maternal, newborn and child survival. For example:
What proportion of women, newborns and children • have benefited from life-saving interventions?Are there coverage gaps?• Are supportive policies in place?• Are adequate resources directed to • maternal, newborn and child health?How equitable is existing coverage?•
Aggregated statistics often mask the answers to such questions, making it difficult to see where the problems are and the steps needed to address them.
This chapter summarises information from the 68 country profiles in simple ways that can be useful for planning country programmes and future analysis, and the text follows the layout of the country profiles. We begin with a summary of the epidemiological context in the 68 countries, continue by examining coverage levels and equity in coverage, and end with information about health system policies and financial flows. Where the data are sufficient we highlight trends, and especially progress or its absence, since about 2000.
Finally, this chapter presents the Core Group’s preliminary conclusions capped by a Countdown call to action.
The bottom line: mortality
Coverage indicators for effective interventions and approaches are linked to mortality reduction. The correlation between coverage indicators and mortality in children under age five is very strong.1
The correlation is less strong for maternal mortality2 – suggesting that coverage, though a necessary condition for impact, may not be sufficient when care is substandard.
Table 3.1 shows progress towards Millennium Development Goal 4 – reducing child mortality – in the 68 Countdown priority countries. Most have under-five mortality rates greater than 40. Such countries are considered ‘on track’ if their under-five mortality rates from 1990–2006 showed an average annual reduction rate of at least 4.0 per cent, roughly the improvement needed for all developing countries to achieve Millennium Development Goal 4. All countries with under-five mortality rates of less than 40 are considered ‘on track.’
For the 2008 Countdown cycle, 16 of 68 countries (24 per cent) were judged ‘on track,’ compared with 7 of 60 (12 per cent) in 2005. Seven countries which had been ‘on track’ in reducing child mortality in 2005 retained that status in 2008 (Bangladesh, Brazil, Egypt, Indonesia, Mexico, Nepal and the Philippines). Among the remaining nine ‘on track’ countries in 2008, three had been included in the Countdown in 2005 and made demonstrable progress in reducing child mortality since then (China, Haiti and Turkmenistan). The six remaining ‘on track’ countries participated in the Countdown for the first time in 2008 (Bolivia, Eritrea, Guatemala, Lao People’s Democratic Republic, Morocco and Peru).
Twenty-six of the 68 priority countries (38 per cent) were judged to have made insufficient progress in reducing child mortality, and 26 (38 per cent) no progress at all.3 In twelve countries the average annual rates of reduction in under-five mortality since 1990 were negative (Botswana, Cameroon, Central African Republic, Chad, Congo, Equatorial Guinea, Kenya, Lesotho, South Africa, Swaziland, Zambia and Zimbabwe), indicating that child mortality has increased.
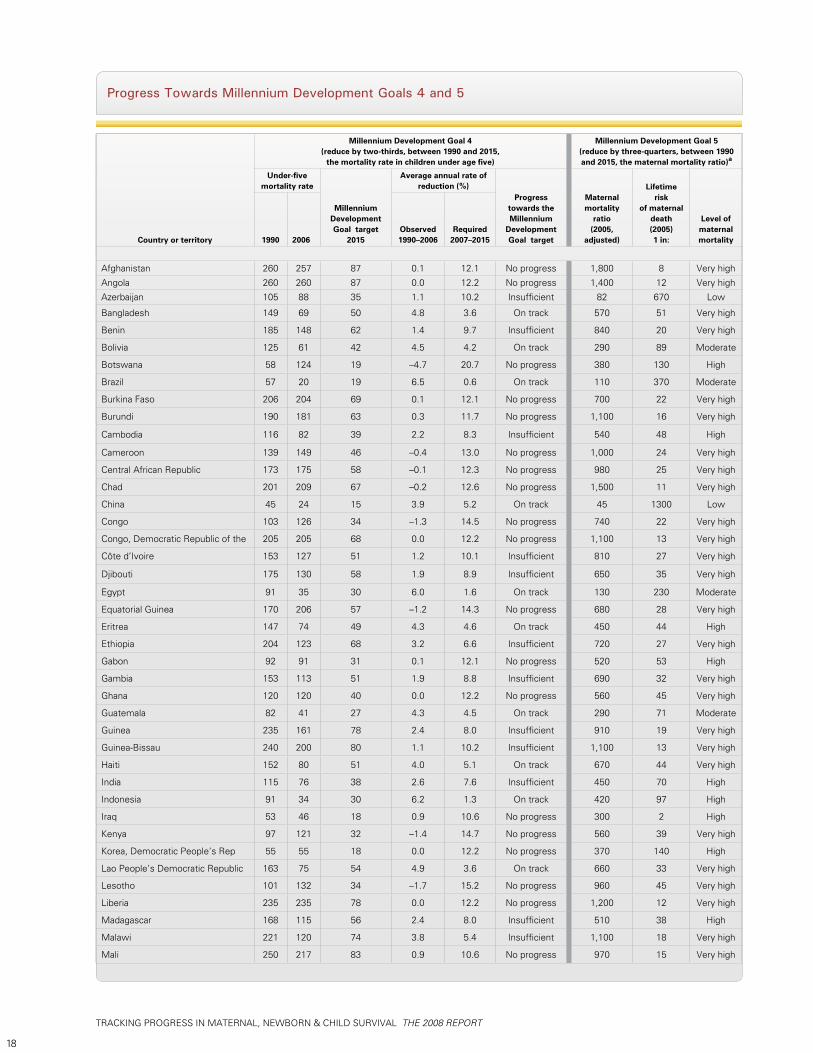
TRACKING PROGRESS IN MATERNAL, NEWBORN & CHILD SURVIVAL THE 2008 REPORT
18
Progress Towards Millennium Development Goals 4 and 5
Country or territory
Millennium Development Goal 4(reduce by two-thirds, between 1990 and 2015,
the mortality rate in children under age five)
Millennium Development Goal 5(reduce by three-quarters, between 1990 and 2015, the maternal mortality ratio)a
Under-five mortality rate
Millennium Development Goal target
2015
Average annual rate ofreduction (%)
Progress towards the Millennium
Development Goal target
Maternalmortality
ratio(2005,
adjusted)
Lifetime risk
of maternaldeath (2005)1 in:
Level of maternalmortality1990 2006
Observed1990–2006
Required2007–2015
Afghanistan 260 257 87 0.1 12.1 No progress 1,800 8 Very high
Angola 260 260 87 0.0 12.2 No progress 1,400 12 Very high
Azerbaijan 105 88 35 1.1 10.2 Insufficient 82 670 Low
Bangladesh 149 69 50 4.8 3.6 On track 570 51 Very high
Benin 185 148 62 1.4 9.7 Insufficient 840 20 Very high
Bolivia 125 61 42 4.5 4.2 On track 290 89 Moderate
Botswana 58 124 19 –4.7 20.7 No progress 380 130 High
Brazil 57 20 19 6.5 0.6 On track 110 370 Moderate
Burkina Faso 206 204 69 0.1 12.1 No progress 700 22 Very high
Burundi 190 181 63 0.3 11.7 No progress 1,100 16 Very high
Cambodia 116 82 39 2.2 8.3 Insufficient 540 48 High
Cameroon 139 149 46 –0.4 13.0 No progress 1,000 24 Very high
Central African Republic 173 175 58 –0.1 12.3 No progress 980 25 Very high
Chad 201 209 67 –0.2 12.6 No progress 1,500 11 Very high
China 45 24 15 3.9 5.2 On track 45 1300 Low
Congo 103 126 34 –1.3 14.5 No progress 740 22 Very high
Congo, Democratic Republic of the 205 205 68 0.0 12.2 No progress 1,100 13 Very high
Côte d’Ivoire 153 127 51 1.2 10.1 Insufficient 810 27 Very high
Djibouti 175 130 58 1.9 8.9 Insufficient 650 35 Very high
Egypt 91 35 30 6.0 1.6 On track 130 230 Moderate
Equatorial Guinea 170 206 57 –1.2 14.3 No progress 680 28 Very high
Eritrea 147 74 49 4.3 4.6 On track 450 44 High
Ethiopia 204 123 68 3.2 6.6 Insufficient 720 27 Very high
Gabon 92 91 31 0.1 12.1 No progress 520 53 High
Gambia 153 113 51 1.9 8.8 Insufficient 690 32 Very high
Ghana 120 120 40 0.0 12.2 No progress 560 45 Very high
Guatemala 82 41 27 4.3 4.5 On track 290 71 Moderate
Guinea 235 161 78 2.4 8.0 Insufficient 910 19 Very high
Guinea-Bissau 240 200 80 1.1 10.2 Insufficient 1,100 13 Very high
Haiti 152 80 51 4.0 5.1 On track 670 44 Very high
India 115 76 38 2.6 7.6 Insufficient 450 70 High
Indonesia 91 34 30 6.2 1.3 On track 420 97 High
Iraq 53 46 18 0.9 10.6 No progress 300 2 High
Kenya 97 121 32 –1.4 14.7 No progress 560 39 Very high
Korea, Democratic People’s Rep 55 55 18 0.0 12.2 No progress 370 140 High
Lao People’s Democratic Republic 163 75 54 4.9 3.6 On track 660 33 Very high
Lesotho 101 132 34 –1.7 15.2 No progress 960 45 Very high
Liberia 235 235 78 0.0 12.2 No progress 1,200 12 Very high
Madagascar 168 115 56 2.4 8.0 Insufficient 510 38 High
Malawi 221 120 74 3.8 5.4 Insufficient 1,100 18 Very high
Mali 250 217 83 0.9 10.6 No progress 970 15 Very high
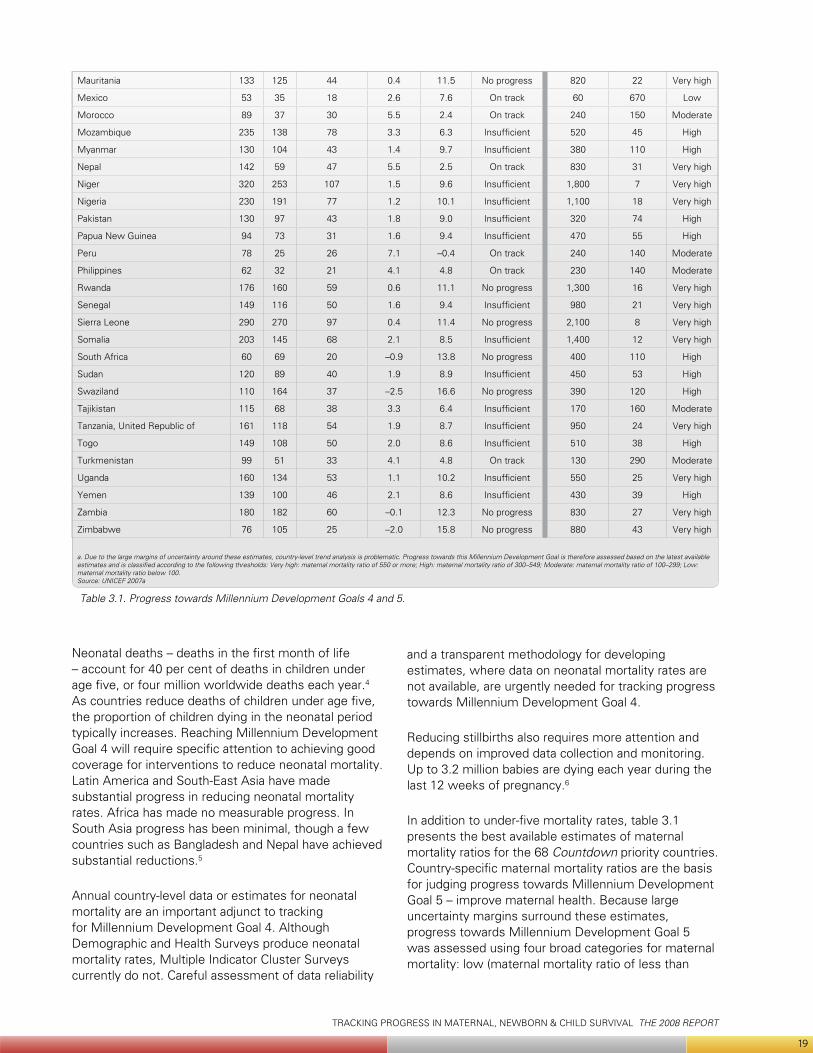
TRACKING PROGRESS IN MATERNAL, NEWBORN & CHILD SURVIVAL THE 2008 REPORT
19
Neonatal deaths – deaths in the first month of life – account for 40 per cent of deaths in children under age five, or four million worldwide deaths each year.4 As countries reduce deaths of children under age five, the proportion of children dying in the neonatal period typically increases. Reaching Millennium Development Goal 4 will require specific attention to achieving good coverage for interventions to reduce neonatal mortality. Latin America and South-East Asia have made substantial progress in reducing neonatal mortality rates. Africa has made no measurable progress. In South Asia progress has been minimal, though a few countries such as Bangladesh and Nepal have achieved substantial reductions.5
Annual country-level data or estimates for neonatal mortality are an important adjunct to tracking for Millennium Development Goal 4. Although Demographic and Health Surveys produce neonatal mortality rates, Multiple Indicator Cluster Surveys currently do not. Careful assessment of data reliability
and a transparent methodology for developing estimates, where data on neonatal mortality rates are not available, are urgently needed for tracking progress towards Millennium Development Goal 4.
Reducing stillbirths also requires more attention and depends on improved data collection and monitoring. Up to 3.2 million babies are dying each year during the last 12 weeks of pregnancy.6
In addition to under-five mortality rates, table 3.1 presents the best available estimates of maternal mortality ratios for the 68 Countdown priority countries. Country-specific maternal mortality ratios are the basis for judging progress towards Millennium Development Goal 5 – improve maternal health. Because large uncertainty margins surround these estimates, progress towards Millennium Development Goal 5 was assessed using four broad categories for maternal mortality: low (maternal mortality ratio of less than
Mauritania 133 125 44 0.4 11.5 No progress 820 22 Very high
Mexico 53 35 18 2.6 7.6 On track 60 670 Low
Morocco 89 37 30 5.5 2.4 On track 240 150 Moderate
Mozambique 235 138 78 3.3 6.3 Insufficient 520 45 High
Myanmar 130 104 43 1.4 9.7 Insufficient 380 110 High
Nepal 142 59 47 5.5 2.5 On track 830 31 Very high
Niger 320 253 107 1.5 9.6 Insufficient 1,800 7 Very high
Nigeria 230 191 77 1.2 10.1 Insufficient 1,100 18 Very high
Pakistan 130 97 43 1.8 9.0 Insufficient 320 74 High
Papua New Guinea 94 73 31 1.6 9.4 Insufficient 470 55 High
Peru 78 25 26 7.1 –0.4 On track 240 140 Moderate
Philippines 62 32 21 4.1 4.8 On track 230 140 Moderate
Rwanda 176 160 59 0.6 11.1 No progress 1,300 16 Very high
Senegal 149 116 50 1.6 9.4 Insufficient 980 21 Very high
Sierra Leone 290 270 97 0.4 11.4 No progress 2,100 8 Very high
Somalia 203 145 68 2.1 8.5 Insufficient 1,400 12 Very high
South Africa 60 69 20 –0.9 13.8 No progress 400 110 High
Sudan 120 89 40 1.9 8.9 Insufficient 450 53 High
Swaziland 110 164 37 –2.5 16.6 No progress 390 120 High
Tajikistan 115 68 38 3.3 6.4 Insufficient 170 160 Moderate
Tanzania, United Republic of 161 118 54 1.9 8.7 Insufficient 950 24 Very high
Togo 149 108 50 2.0 8.6 Insufficient 510 38 High
Turkmenistan 99 51 33 4.1 4.8 On track 130 290 Moderate
Uganda 160 134 53 1.1 10.2 Insufficient 550 25 Very high
Yemen 139 100 46 2.1 8.6 Insufficient 430 39 High
Zambia 180 182 60 –0.1 12.3 No progress 830 27 Very high
Zimbabwe 76 105 25 –2.0 15.8 No progress 880 43 Very high
a. Due to the large margins of uncertainty around these estimates, country-level trend analysis is problematic. Progress towards this Millennium Development Goal is therefore assessed based on the latest available estimates and is classified according to the following thresholds: Very high: maternal mortality ratio of 550 or more; High: maternal mortality ratio of 300–549; Moderate: maternal mortality ratio of 100–299; Low: maternal mortality ratio below 100. Source: UNICEF 2007a
Table 3.1. Progress towards Millennium Development Goals 4 and 5.
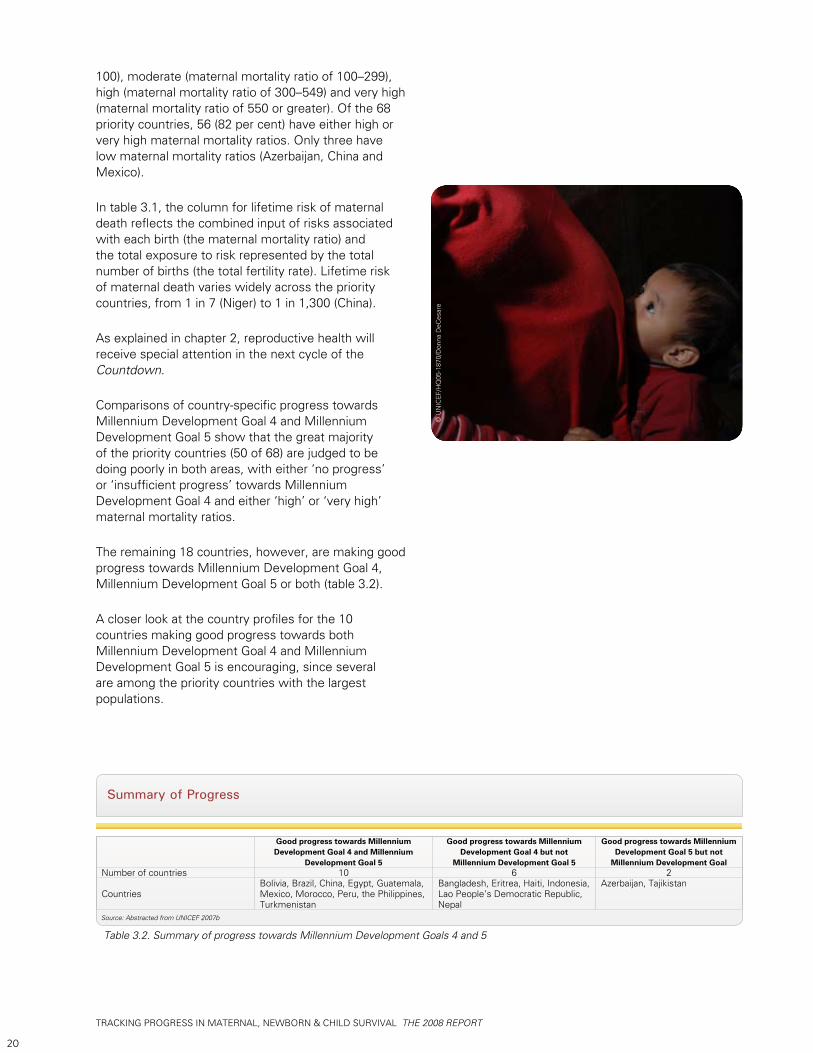
TRACKING PROGRESS IN MATERNAL, NEWBORN & CHILD SURVIVAL THE 2008 REPORT
20
100), moderate (maternal mortality ratio of 100–299), high (maternal mortality ratio of 300–549) and very high (maternal mortality ratio of 550 or greater). Of the 68 priority countries, 56 (82 per cent) have either high or very high maternal mortality ratios. Only three have low maternal mortality ratios (Azerbaijan, China and Mexico).
In table 3.1, the column for lifetime risk of maternal death reflects the combined input of risks associated with each birth (the maternal mortality ratio) and the total exposure to risk represented by the total number of births (the total fertility rate). Lifetime risk of maternal death varies widely across the priority countries, from 1 in 7 (Niger) to 1 in 1,300 (China).
As explained in chapter 2, reproductive health will receive special attention in the next cycle of the Countdown.
Comparisons of country-specific progress towards Millennium Development Goal 4 and Millennium Development Goal 5 show that the great majority of the priority countries (50 of 68) are judged to be doing poorly in both areas, with either ‘no progress’ or ‘insufficient progress’ towards Millennium Development Goal 4 and either ‘high’ or ‘very high’ maternal mortality ratios.
The remaining 18 countries, however, are making good progress towards Millennium Development Goal 4, Millennium Development Goal 5 or both (table 3.2).
A closer look at the country profiles for the 10 countries making good progress towards both Millennium Development Goal 4 and Millennium Development Goal 5 is encouraging, since several are among the priority countries with the largest populations.
Summary of Progress
Good progress towards Millennium Development Goal 4 and Millennium
Development Goal 5
Good progress towards Millennium Development Goal 4 but not
Millennium Development Goal 5
Good progress towards Millennium Development Goal 5 but not
Millennium Development Goal Number of countries 10 6 2
CountriesBolivia, Brazil, China, Egypt, Guatemala, Mexico, Morocco, Peru, the Philippines, Turkmenistan
Bangladesh, Eritrea, Haiti, Indonesia, Lao People’s Democratic Republic, Nepal
Azerbaijan, Tajikistan
© U
NIC
EF/H
Q05
-187
0/D
onna
DeC
esar
e
Source: Abstracted from UNICEF 2007b
Table 3.2. Summary of progress towards Millennium Development Goals 4 and 5
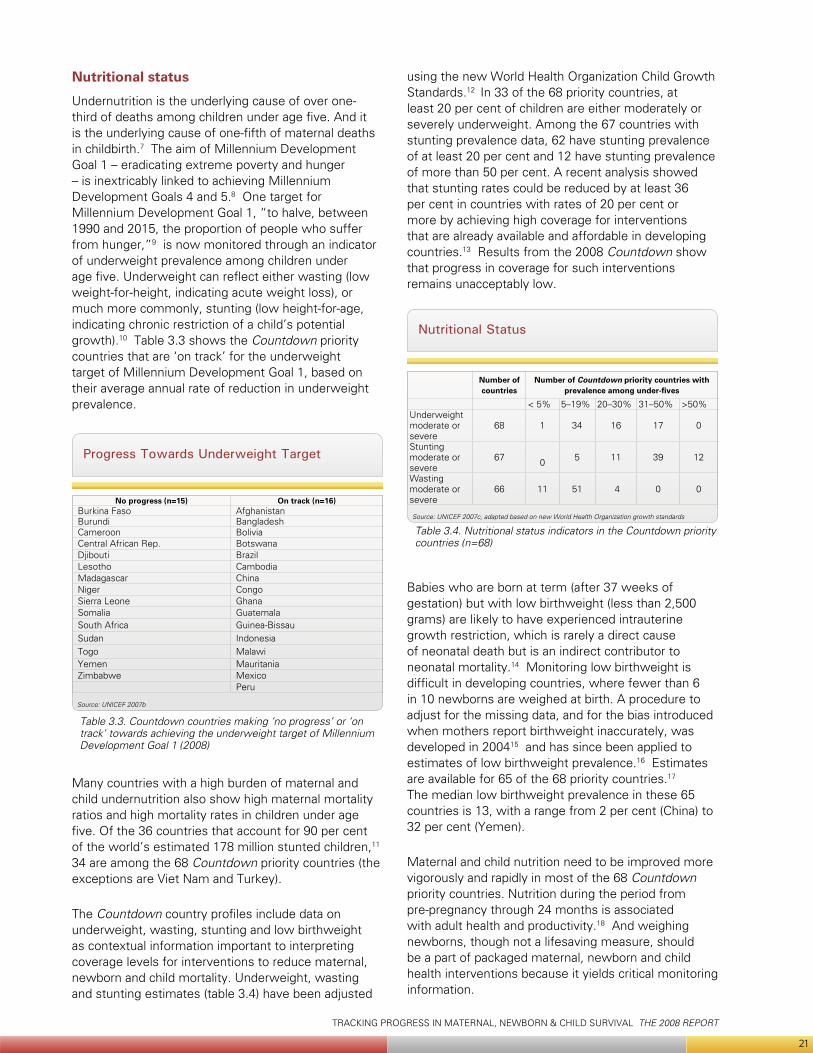
TRACKING PROGRESS IN MATERNAL, NEWBORN & CHILD SURVIVAL THE 2008 REPORT
21
Nutritional status
Undernutrition is the underlying cause of over one-third of deaths among children under age five. And it is the underlying cause of one-fifth of maternal deaths in childbirth.7 The aim of Millennium Development Goal 1 – eradicating extreme poverty and hunger – is inextricably linked to achieving Millennium Development Goals 4 and 5.8 One target for Millennium Development Goal 1, “to halve, between 1990 and 2015, the proportion of people who suffer from hunger,”9 is now monitored through an indicator of underweight prevalence among children under age five. Underweight can reflect either wasting (low weight-for-height, indicating acute weight loss), or much more commonly, stunting (low height-for-age, indicating chronic restriction of a child’s potential growth).10 Table 3.3 shows the Countdown priority countries that are ‘on track’ for the underweight target of Millennium Development Goal 1, based on their average annual rate of reduction in underweight prevalence.
Table 3.3. Countdown countries making ‘no progress’ or ‘on track’ towards achieving the underweight target of Millennium Development Goal 1 (2008)
Progress Towards Underweight Target
Source: UNICEF 2007b
No progress (n=15) On track (n=16)Burkina Faso AfghanistanBurundi BangladeshCameroon BoliviaCentral African Rep. BotswanaDjibouti BrazilLesotho CambodiaMadagascar ChinaNiger CongoSierra Leone GhanaSomalia GuatemalaSouth Africa Guinea-BissauSudan IndonesiaTogo MalawiYemen MauritaniaZimbabwe Mexico
Peru
Many countries with a high burden of maternal and child undernutrition also show high maternal mortality ratios and high mortality rates in children under age five. Of the 36 countries that account for 90 per cent of the world’s estimated 178 million stunted children,11 34 are among the 68 Countdown priority countries (the exceptions are Viet Nam and Turkey).
The Countdown country profiles include data on underweight, wasting, stunting and low birthweight as contextual information important to interpreting coverage levels for interventions to reduce maternal, newborn and child mortality. Underweight, wasting and stunting estimates (table 3.4) have been adjusted
using the new World Health Organization Child Growth Standards.12 In 33 of the 68 priority countries, at least 20 per cent of children are either moderately or severely underweight. Among the 67 countries with stunting prevalence data, 62 have stunting prevalence of at least 20 per cent and 12 have stunting prevalence of more than 50 per cent. A recent analysis showed that stunting rates could be reduced by at least 36 per cent in countries with rates of 20 per cent or more by achieving high coverage for interventions that are already available and affordable in developing countries.13 Results from the 2008 Countdown show that progress in coverage for such interventions remains unacceptably low.
Table 3.4. Nutritional status indicators in the Countdown priority countries (n=68)
Nutritional Status
Source: UNICEF 2007c, adapted based on new World Health Organization growth standards
Number of countries
Number of Countdown priority countries with prevalence among under-fives
< 5% 5–19% 20–30% 31–50% >50%Underweight moderate or severe
68 1 34 16 17 0
Stunting moderate or severe
67 0 5 11 39 12
Wasting moderate or severe
66 11 51 4 0 0
Babies who are born at term (after 37 weeks of gestation) but with low birthweight (less than 2,500 grams) are likely to have experienced intrauterine growth restriction, which is rarely a direct cause of neonatal death but is an indirect contributor to neonatal mortality.14 Monitoring low birthweight is difficult in developing countries, where fewer than 6 in 10 newborns are weighed at birth. A procedure to adjust for the missing data, and for the bias introduced when mothers report birthweight inaccurately, was developed in 200415 and has since been applied to estimates of low birthweight prevalence.16 Estimates are available for 65 of the 68 priority countries.17 The median low birthweight prevalence in these 65 countries is 13, with a range from 2 per cent (China) to 32 per cent (Yemen).
Maternal and child nutrition need to be improved more vigorously and rapidly in most of the 68 Countdown priority countries. Nutrition during the period from pre-pregnancy through 24 months is associated with adult health and productivity.18 And weighing newborns, though not a lifesaving measure, should be a part of packaged maternal, newborn and child health interventions because it yields critical monitoring information.
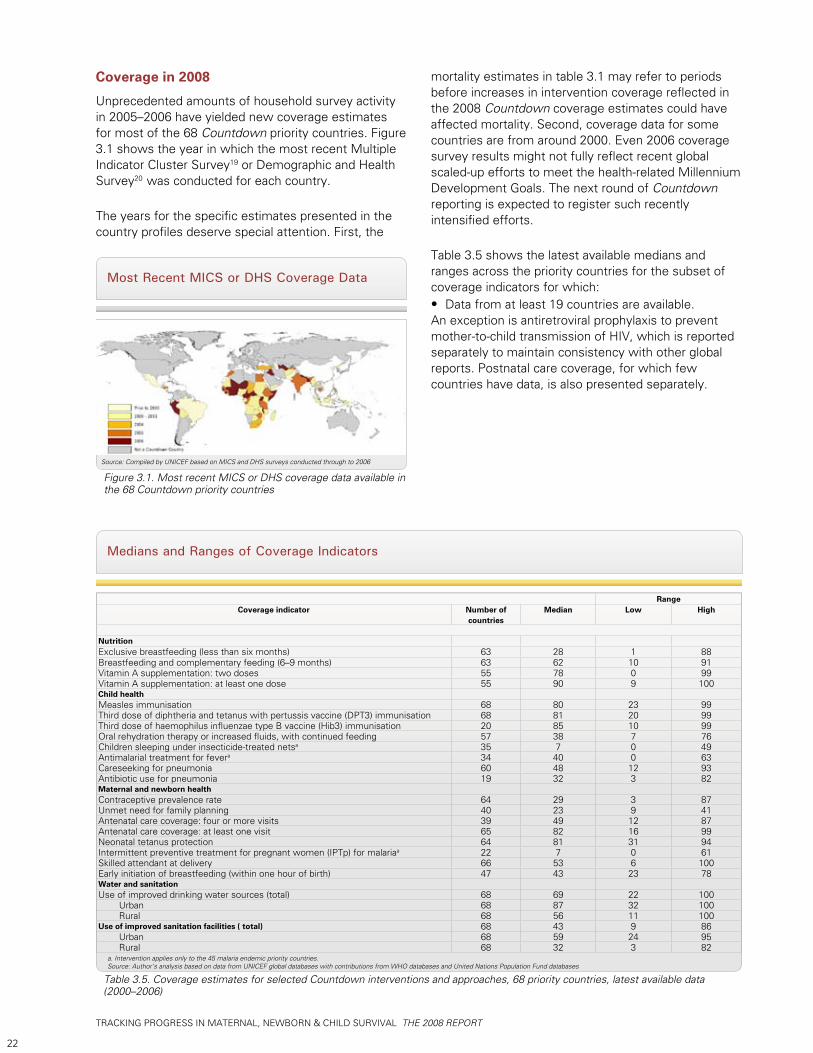
TRACKING PROGRESS IN MATERNAL, NEWBORN & CHILD SURVIVAL THE 2008 REPORT
22
Coverage in 2008
Unprecedented amounts of household survey activity in 2005–2006 have yielded new coverage estimates for most of the 68 Countdown priority countries. Figure 3.1 shows the year in which the most recent Multiple Indicator Cluster Survey19 or Demographic and Health Survey20 was conducted for each country.
The years for the specific estimates presented in the country profiles deserve special attention. First, the
Figure 3.1. Most recent MICS or DHS coverage data available in the 68 Countdown priority countries
Most Recent MICS or DHS Coverage Data
Source: Compiled by UNICEF based on MICS and DHS surveys conducted through to 2006
mortality estimates in table 3.1 may refer to periods before increases in intervention coverage reflected in the 2008 Countdown coverage estimates could have affected mortality. Second, coverage data for some countries are from around 2000. Even 2006 coverage survey results might not fully reflect recent global scaled-up efforts to meet the health-related Millennium Development Goals. The next round of Countdown reporting is expected to register such recently intensified efforts.
Table 3.5 shows the latest available medians and ranges across the priority countries for the subset of coverage indicators for which:
Data from at least 19 countries are available.• An exception is antiretroviral prophylaxis to prevent mother-to-child transmission of HIV, which is reported separately to maintain consistency with other global reports. Postnatal care coverage, for which few countries have data, is also presented separately.
Medians and Ranges of Coverage Indicators
Table 3.5. Coverage estimates for selected Countdown interventions and approaches, 68 priority countries, latest available data (2000–2006)
RangeCoverage indicator Number of
countriesMedian Low High
NutritionExclusive breastfeeding (less than six months) 63 28 1 88Breastfeeding and complementary feeding (6–9 months) 63 62 10 91Vitamin A supplementation: two doses 55 78 0 99Vitamin A supplementation: at least one dose 55 90 9 100Child healthMeasles immunisation 68 80 23 99Third dose of diphtheria and tetanus with pertussis vaccine (DPT3) immunisation 68 81 20 99Third dose of haemophilus influenzae type B vaccine (Hib3) immunisation 20 85 10 99Oral rehydration therapy or increased fluids, with continued feeding 57 38 7 76Children sleeping under insecticide-treated netsa 35 7 0 49Antimalarial treatment for fevera 34 40 0 63Careseeking for pneumonia 60 48 12 93Antibiotic use for pneumonia 19 32 3 82Maternal and newborn healthContraceptive prevalence rate 64 29 3 87Unmet need for family planning 40 23 9 41Antenatal care coverage: four or more visits 39 49 12 87Antenatal care coverage: at least one visit 65 82 16 99Neonatal tetanus protection 64 81 31 94Intermittent preventive treatment for pregnant women (IPTp) for malariaa 22 7 0 61Skilled attendant at delivery 66 53 6 100Early initiation of breastfeeding (within one hour of birth) 47 43 23 78Water and sanitationUse of improved drinking water sources (total) 68 69 22 100 Urban 68 87 32 100 Rural 68 56 11 100Use of improved sanitation facilities ( total) 68 43 9 86 Urban 68 59 24 95 Rural 68 32 3 82
a. Intervention applies only to the 45 malaria endemic priority countries.Source: Author’s analysis based on data from UNICEF global databases with contributions from WHO databases and United Nations Population Fund databases
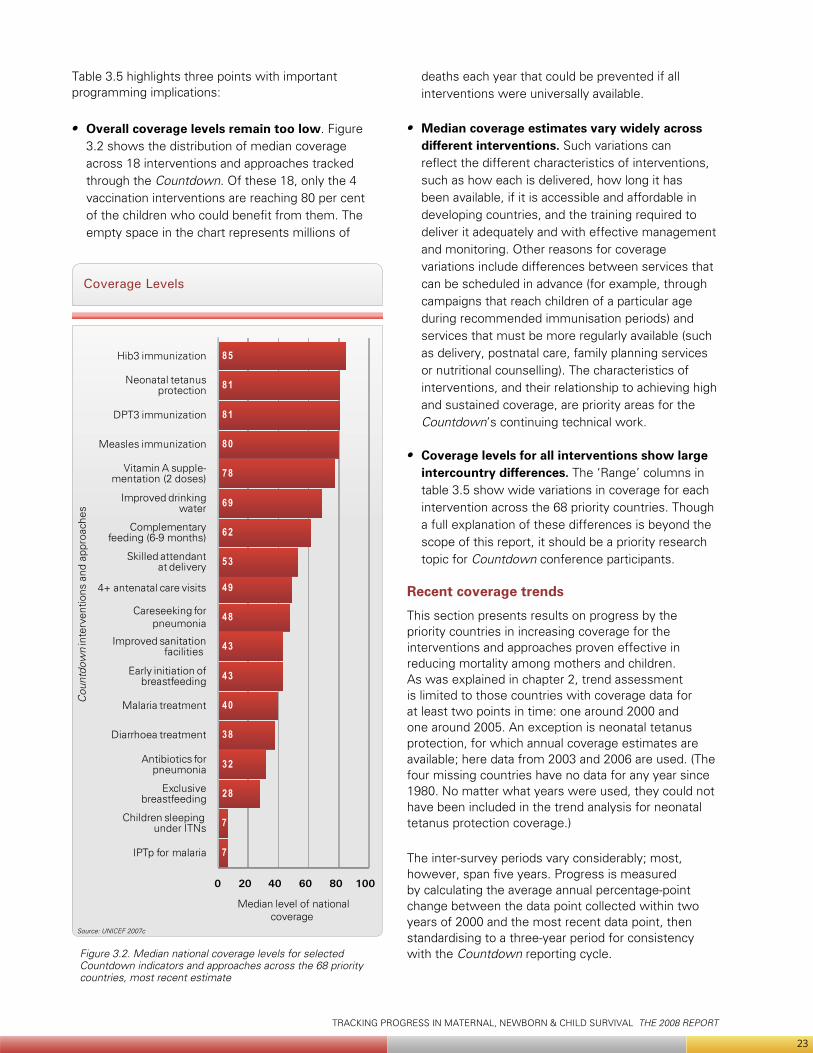
TRACKING PROGRESS IN MATERNAL, NEWBORN & CHILD SURVIVAL THE 2008 REPORT
23
Table 3.5 highlights three points with important programming implications:
Overall coverage levels remain too low• . Figure 3.2 shows the distribution of median coverage across 18 interventions and approaches tracked through the Countdown. Of these 18, only the 4 vaccination interventions are reaching 80 per cent of the children who could benefit from them. The empty space in the chart represents millions of
deaths each year that could be prevented if all interventions were universally available.
Median coverage estimates vary widely across • different interventions. Such variations can reflect the different characteristics of interventions, such as how each is delivered, how long it has been available, if it is accessible and affordable in developing countries, and the training required to deliver it adequately and with effective management and monitoring. Other reasons for coverage variations include differences between services that can be scheduled in advance (for example, through campaigns that reach children of a particular age during recommended immunisation periods) and services that must be more regularly available (such as delivery, postnatal care, family planning services or nutritional counselling). The characteristics of interventions, and their relationship to achieving high and sustained coverage, are priority areas for the Countdown’s continuing technical work.
Coverage levels for all interventions show large • intercountry differences. The ‘Range’ columns in table 3.5 show wide variations in coverage for each intervention across the 68 priority countries. Though a full explanation of these differences is beyond the scope of this report, it should be a priority research topic for Countdown conference participants.
Recent coverage trends
This section presents results on progress by the priority countries in increasing coverage for the interventions and approaches proven effective in reducing mortality among mothers and children. As was explained in chapter 2, trend assessment is limited to those countries with coverage data for at least two points in time: one around 2000 and one around 2005. An exception is neonatal tetanus protection, for which annual coverage estimates are available; here data from 2003 and 2006 are used. (The four missing countries have no data for any year since 1980. No matter what years were used, they could not have been included in the trend analysis for neonatal tetanus protection coverage.)
The inter-survey periods vary considerably; most, however, span five years. Progress is measured by calculating the average annual percentage-point change between the data point collected within two years of 2000 and the most recent data point, then standardising to a three-year period for consistency with the Countdown reporting cycle.
Coverage Levels
Figure 3.2. Median national coverage levels for selected Countdown indicators and approaches across the 68 priority countries, most recent estimate
Source: UNICEF 2007c
7
7
28
32
38
40
43
43
48
49
53
62
69
78
80
81
81
85
0 20 40 60 80 100
IPTp for malaria
Children sleeping under ITNs
Exclusivebreastfeeding
Antibiotics forpneumonia
Diarrhoea treatment
Malaria treatment
Early initiation ofbreastfeeding
Improved sanitationfacilities
Careseeking forpneumonia
4+ antenatal care visits
Skilled attendantat delivery
Complementaryfeeding (6-9 months)
Improved drinkingwater
Vitamin A supple-mentation (2 doses)
Measles immunization
DPT3 immunization
Neonatal tetanusprotection
Hib3 immunization
Median level of nationalcoverage
Cou
ntdo
wn
inte
rven
tions
and
app
roac
hes
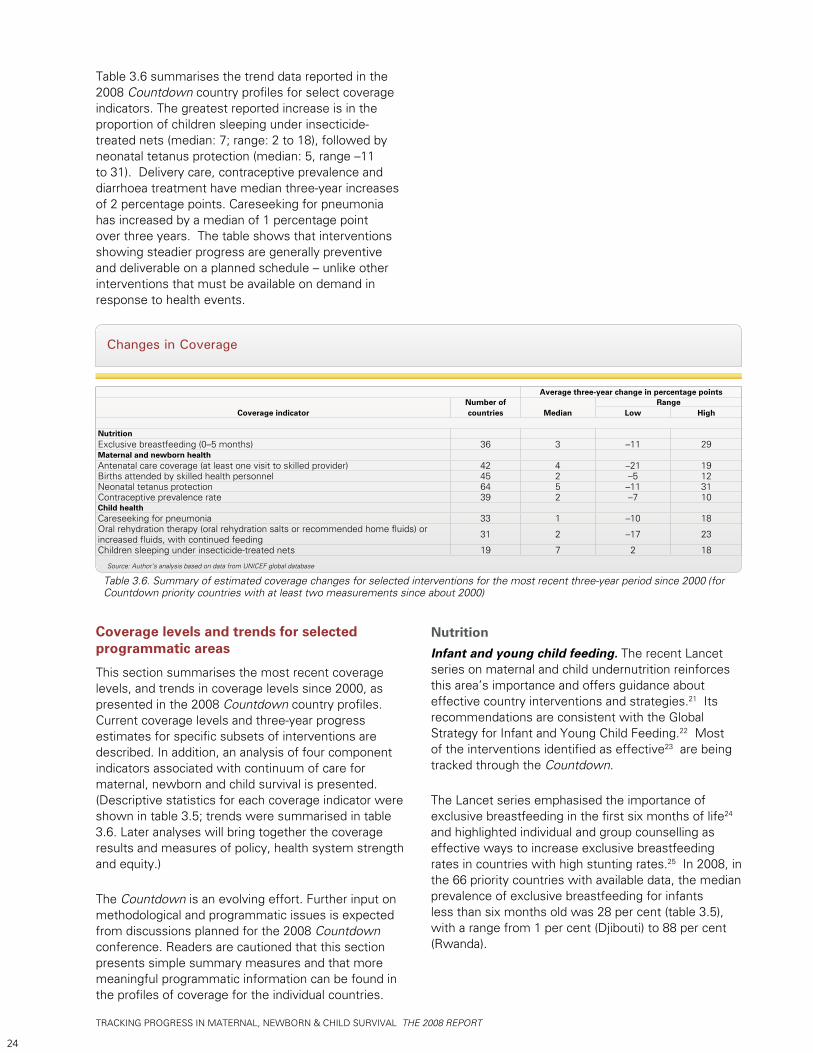
TRACKING PROGRESS IN MATERNAL, NEWBORN & CHILD SURVIVAL THE 2008 REPORT
24
Table 3.6 summarises the trend data reported in the 2008 Countdown country profiles for select coverage indicators. The greatest reported increase is in the proportion of children sleeping under insecticide-treated nets (median: 7; range: 2 to 18), followed by neonatal tetanus protection (median: 5, range –11 to 31). Delivery care, contraceptive prevalence and diarrhoea treatment have median three-year increases of 2 percentage points. Careseeking for pneumonia has increased by a median of 1 percentage point over three years. The table shows that interventions showing steadier progress are generally preventive and deliverable on a planned schedule – unlike other interventions that must be available on demand in response to health events.
Coverage levels and trends for selected programmatic areas
This section summarises the most recent coverage levels, and trends in coverage levels since 2000, as presented in the 2008 Countdown country profiles. Current coverage levels and three-year progress estimates for specific subsets of interventions are described. In addition, an analysis of four component indicators associated with continuum of care for maternal, newborn and child survival is presented. (Descriptive statistics for each coverage indicator were shown in table 3.5; trends were summarised in table 3.6. Later analyses will bring together the coverage results and measures of policy, health system strength and equity.)
The Countdown is an evolving effort. Further input on methodological and programmatic issues is expected from discussions planned for the 2008 Countdown conference. Readers are cautioned that this section presents simple summary measures and that more meaningful programmatic information can be found in the profiles of coverage for the individual countries.
Changes in Coverage
Table 3.6. Summary of estimated coverage changes for selected interventions for the most recent three-year period since 2000 (for Countdown priority countries with at least two measurements since about 2000)
Source: Author’s analysis based on data from UNICEF global database
Average three-year change in percentage points
Coverage indicatorNumber of countries Median
RangeLow High
NutritionExclusive breastfeeding (0–5 months) 36 3 –11 29Maternal and newborn healthAntenatal care coverage (at least one visit to skilled provider) 42 4 –21 19Births attended by skilled health personnel 45 2 –5 12Neonatal tetanus protection 64 5 –11 31Contraceptive prevalence rate 39 2 –7 10Child healthCareseeking for pneumonia 33 1 –10 18Oral rehydration therapy (oral rehydration salts or recommended home fluids) or increased fluids, with continued feeding 31 2 –17 23
Children sleeping under insecticide-treated nets 19 7 2 18
NutritionInfant and young child feeding. The recent Lancet series on maternal and child undernutrition reinforces this area’s importance and offers guidance about effective country interventions and strategies.21 Its recommendations are consistent with the Global Strategy for Infant and Young Child Feeding.22 Most of the interventions identified as effective23 are being tracked through the Countdown.
The Lancet series emphasised the importance of exclusive breastfeeding in the first six months of life24 and highlighted individual and group counselling as effective ways to increase exclusive breastfeeding rates in countries with high stunting rates.25 In 2008, in the 66 priority countries with available data, the median prevalence of exclusive breastfeeding for infants less than six months old was 28 per cent (table 3.5), with a range from 1 per cent (Djibouti) to 88 per cent (Rwanda).
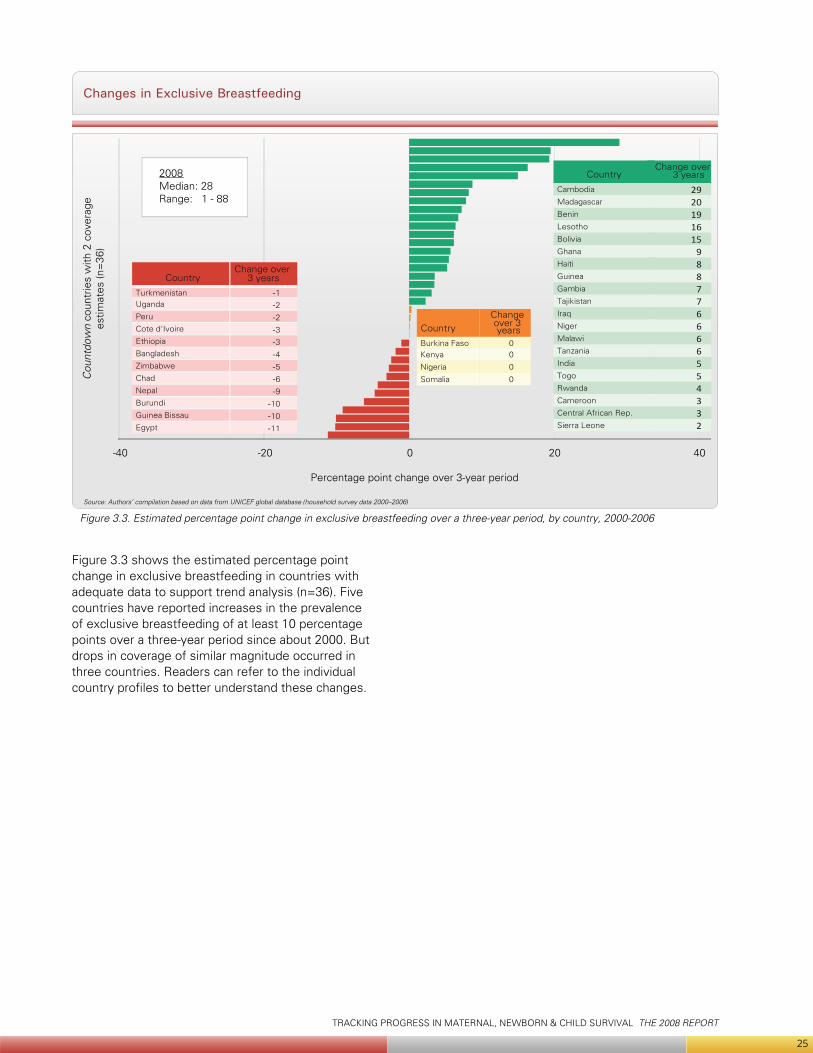
TRACKING PROGRESS IN MATERNAL, NEWBORN & CHILD SURVIVAL THE 2008 REPORT
25
Figure 3.3 shows the estimated percentage point change in exclusive breastfeeding in countries with adequate data to support trend analysis (n=36). Five countries have reported increases in the prevalence of exclusive breastfeeding of at least 10 percentage points over a three-year period since about 2000. But drops in coverage of similar magnitude occurred in three countries. Readers can refer to the individual country profiles to better understand these changes.
Changes in Exclusive Breastfeeding
Source: Authors’ compilation based on data from UNICEF global database (household survey data 2000–2006)
Figure 3.3. Estimated percentage point change in exclusive breastfeeding over a three-year period, by country, 2000-2006
CountryChange over
3 years
Cambodia 29Madagascar 20Benin 19Lesotho 16Bolivia 15Ghana 9Haiti 8Guinea 8Gambia 7Tajikistan 7Iraq 6Niger 6Malawi 6Tanzania 6India 5Togo 5Rwanda 4Cameroon 3Central African Rep. 3Sierra Leone 2
CountryChange over
3 years
Turkmenistan -1Uganda -2Peru -2Cote d'Ivoire -3Ethiopia -3Bangladesh -4Zimbabwe -5Chad -6Nepal -9Burundi -10Guinea Bissau -10Egypt -11
CountryChange over 3 years
Burkina Faso 0Kenya 0
Nigeria 0
Somalia 0
Percentage point change over 3-year period
Cou
ntdo
wn
coun
trie
s w
ith 2
cov
erag
ees
timat
es (n
=36
)
2008Median: 28Range: 1 - 88
-40 -20 0 20 40
TRACKING PROGRESS IN MATERNAL, NEWBORN & CHILD SURVIVAL THE 2008 REPORT
26
Breastfeeding plus complementary foods between six and nine months is a Countdown coverage indicator reflecting the importance of ensuring that children receive adequate quantities and quality of complementary foods after six months and up to 24 months of age. This is an essential intervention to prevent stunting.26 An evidence base pointing to specific effective interventions is described in detail elsewhere.27
Two methodological problems continue to constrain coverage monitoring for complementary feeding: the lack of a consensus about a valid and measurable indicator of complementary feeding behaviour and the use of a behavioural outcome (feeding behaviour) as a proxy for the intervention or interventions that could affect that outcome. The Steering Team of the Interagency Working Group on Infant and Young Child Feeding is addressing the first issue, having recently completed a five-year programme of research to develop new and more valid indicators.28 There has also been some progress in defining effective interventions and approaches.29 This Countdown cycle relies on the existing indicator, which is not adequate to support the estimation of trends.
As shown in table 3.5, among the 63 countries with coverage data available for this report, the median prevalence of complementary feeding from six to nine months was 62 per cent, with a range from 10 to 91 per cent. Ten countries reported rates of 80 per cent or more (Tanzania 91, Malawi 89, Burundi 88, Haiti and Zambia 87, Kenya 84, Cambodia 82, Peru 81, Mozambique and Uganda 80). Three countries reported prevalence rates of less than 20 per cent (Somalia 15, Tajikistan 15, Lao People’s Democratic Republic 10).
Vitamin A supplementation. Of the 68 Countdown priority countries, 66 are also priority countries for vitamin A supplementation, underscoring the importance of national-level programmes to ensure high two-dose coverage in almost all the Countdown countries.30 Table 3.5 shows fairly high coverage rates for 2005, when 55 of 68 priority countries (81 per cent) reported estimates. The median for two-dose coverage of children 6–59 months of age is 78 per cent, with a range from 0 per cent (Djibouti, Papua New Guinea) to 99 per cent (Rwanda). And the median coverage for at least one dose is 90 per cent, with a range from 9 per cent (Lesotho) to 100 per cent (Rwanda).
© U
NIC
EF/H
Q04
-017
4/R
oger
LeM
oyne
HA
ITI
© U
NIC
EF/H
Q04
-120
2/A
mi V
itale
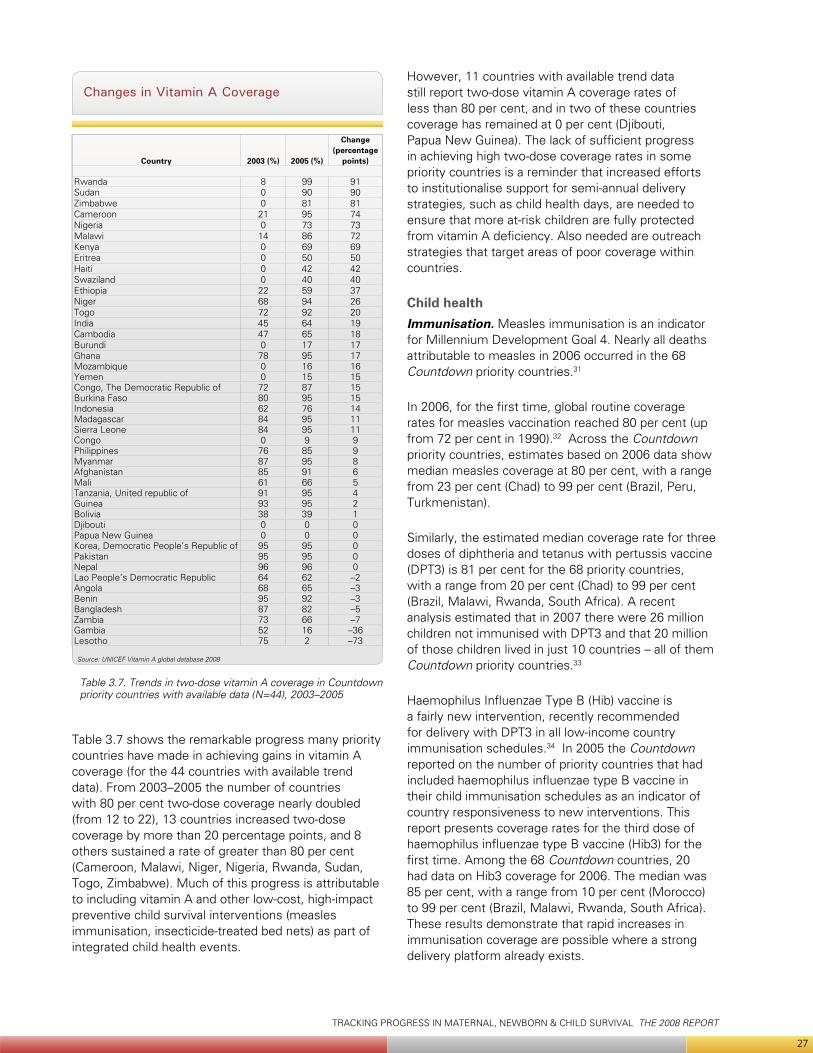
TRACKING PROGRESS IN MATERNAL, NEWBORN & CHILD SURVIVAL THE 2008 REPORT
27
Table 3.7 shows the remarkable progress many priority countries have made in achieving gains in vitamin A coverage (for the 44 countries with available trend data). From 2003–2005 the number of countries with 80 per cent two-dose coverage nearly doubled (from 12 to 22), 13 countries increased two-dose coverage by more than 20 percentage points, and 8 others sustained a rate of greater than 80 per cent (Cameroon, Malawi, Niger, Nigeria, Rwanda, Sudan, Togo, Zimbabwe). Much of this progress is attributable to including vitamin A and other low-cost, high-impact preventive child survival interventions (measles immunisation, insecticide-treated bed nets) as part of integrated child health events.
However, 11 countries with available trend data still report two-dose vitamin A coverage rates of less than 80 per cent, and in two of these countries coverage has remained at 0 per cent (Djibouti, Papua New Guinea). The lack of sufficient progress in achieving high two-dose coverage rates in some priority countries is a reminder that increased efforts to institutionalise support for semi-annual delivery strategies, such as child health days, are needed to ensure that more at-risk children are fully protected from vitamin A deficiency. Also needed are outreach strategies that target areas of poor coverage within countries.
Child healthImmunisation. Measles immunisation is an indicator for Millennium Development Goal 4. Nearly all deaths attributable to measles in 2006 occurred in the 68 Countdown priority countries.31
In 2006, for the first time, global routine coverage rates for measles vaccination reached 80 per cent (up from 72 per cent in 1990).32 Across the Countdown priority countries, estimates based on 2006 data show median measles coverage at 80 per cent, with a range from 23 per cent (Chad) to 99 per cent (Brazil, Peru, Turkmenistan).
Similarly, the estimated median coverage rate for three doses of diphtheria and tetanus with pertussis vaccine (DPT3) is 81 per cent for the 68 priority countries, with a range from 20 per cent (Chad) to 99 per cent (Brazil, Malawi, Rwanda, South Africa). A recent analysis estimated that in 2007 there were 26 million children not immunised with DPT3 and that 20 million of those children lived in just 10 countries – all of them Countdown priority countries.33
Haemophilus Influenzae Type B (Hib) vaccine is a fairly new intervention, recently recommended for delivery with DPT3 in all low-income country immunisation schedules.34 In 2005 the Countdown reported on the number of priority countries that had included haemophilus influenzae type B vaccine in their child immunisation schedules as an indicator of country responsiveness to new interventions. This report presents coverage rates for the third dose of haemophilus influenzae type B vaccine (Hib3) for the first time. Among the 68 Countdown countries, 20 had data on Hib3 coverage for 2006. The median was 85 per cent, with a range from 10 per cent (Morocco) to 99 per cent (Brazil, Malawi, Rwanda, South Africa). These results demonstrate that rapid increases in immunisation coverage are possible where a strong delivery platform already exists.
Changes in Vitamin A Coverage
Table 3.7. Trends in two-dose vitamin A coverage in Countdown priority countries with available data (N=44), 2003–2005
Source: UNICEF Vitamin A global database 2008
Country 2003 (%) 2005 (%)
Change (percentage
points)
Rwanda 8 99 91Sudan 0 90 90Zimbabwe 0 81 81Cameroon 21 95 74Nigeria 0 73 73Malawi 14 86 72Kenya 0 69 69Eritrea 0 50 50Haiti 0 42 42Swaziland 0 40 40Ethiopia 22 59 37Niger 68 94 26Togo 72 92 20India 45 64 19Cambodia 47 65 18Burundi 0 17 17Ghana 78 95 17Mozambique 0 16 16Yemen 0 15 15Congo, The Democratic Republic of 72 87 15Burkina Faso 80 95 15Indonesia 62 76 14Madagascar 84 95 11Sierra Leone 84 95 11Congo 0 9 9Philippines 76 85 9Myanmar 87 95 8Afghanistan 85 91 6Mali 61 66 5Tanzania, United republic of 91 95 4Guinea 93 95 2Bolivia 38 39 1Djibouti 0 0 0Papua New Guinea 0 0 0Korea, Democratic People’s Republic of 95 95 0Pakistan 95 95 0Nepal 96 96 0Lao People’s Democratic Republic 64 62 –2Angola 68 65 –3Benin 95 92 –3Bangladesh 87 82 –5Zambia 73 66 –7Gambia 52 16 –36Lesotho 75 2 –73
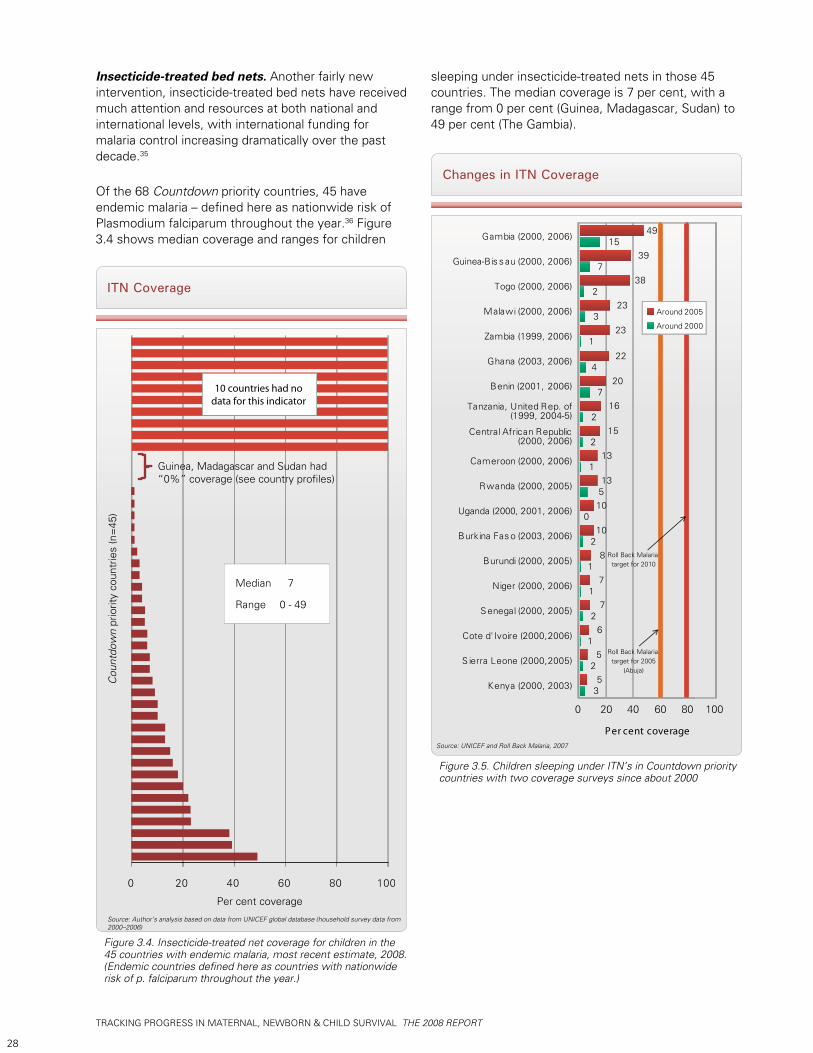
TRACKING PROGRESS IN MATERNAL, NEWBORN & CHILD SURVIVAL THE 2008 REPORT
28
Insecticide-treated bed nets. Another fairly new intervention, insecticide-treated bed nets have received much attention and resources at both national and international levels, with international funding for malaria control increasing dramatically over the past decade.35
Of the 68 Countdown priority countries, 45 have endemic malaria – defined here as nationwide risk of Plasmodium falciparum throughout the year.36 Figure 3.4 shows median coverage and ranges for children
Changes in ITN Coverage
Source: UNICEF and Roll Back Malaria, 2007
Kenya (2000, 2003)
S ierra Leone (2000,2005)
Cote d'Ivoire (2000,2006)
S enegal (2000, 2005)
Niger (2000, 2006)
Burundi (2000, 2005)
Burkina Fas o (2003, 2006)
Uganda (2000, 2001, 2006)
Rwanda (2000, 2005)
Cameroon (2000, 2006)
Central African Republic(2000, 2006)
Tanzania, United Rep. of (1999, 2004-5)
Benin (2001, 2006)
Ghana (2003, 2006)
Zambia (1999, 2006)
Malawi (2000, 2006)
Togo (2000, 2006)
Guinea-Bis s au (2000, 2006)
Gambia (2000, 2006)
Per cent coverage
35
2
1
2
1
1
2
5
6
7
7
8
100
510
131
2
2
7
4
13
15
16
20
22
1
3
2
7
15
23
23
38
39
49
6040200 80 100
Roll Back Malaria target for 2010
Roll Back Malaria target for 2005
(Abuja)
Around 2005
Around 2000
Figure 3.5. Children sleeping under ITN’s in Countdown priority countries with two coverage surveys since about 2000
ITN Coverage
Source: Author’s analysis based on data from UNICEF global database (household survey data from 2000–2006)
Figure 3.4. Insecticide-treated net coverage for children in the 45 countries with endemic malaria, most recent estimate, 2008. (Endemic countries defined here as countries with nationwide risk of p. falciparum throughout the year.)
Cou
ntdo
wn
prio
rity
coun
trie
s (n
=45
)
Per cent coverage
0 20 40 60 80 100
Guinea, Madagascar and Sudan had “0%” coverage (see country profiles)
10 countries had nodata for this indicator
Median 7
Range 0 - 49
sleeping under insecticide-treated nets in those 45 countries. The median coverage is 7 per cent, with a range from 0 per cent (Guinea, Madagascar, Sudan) to 49 per cent (The Gambia).
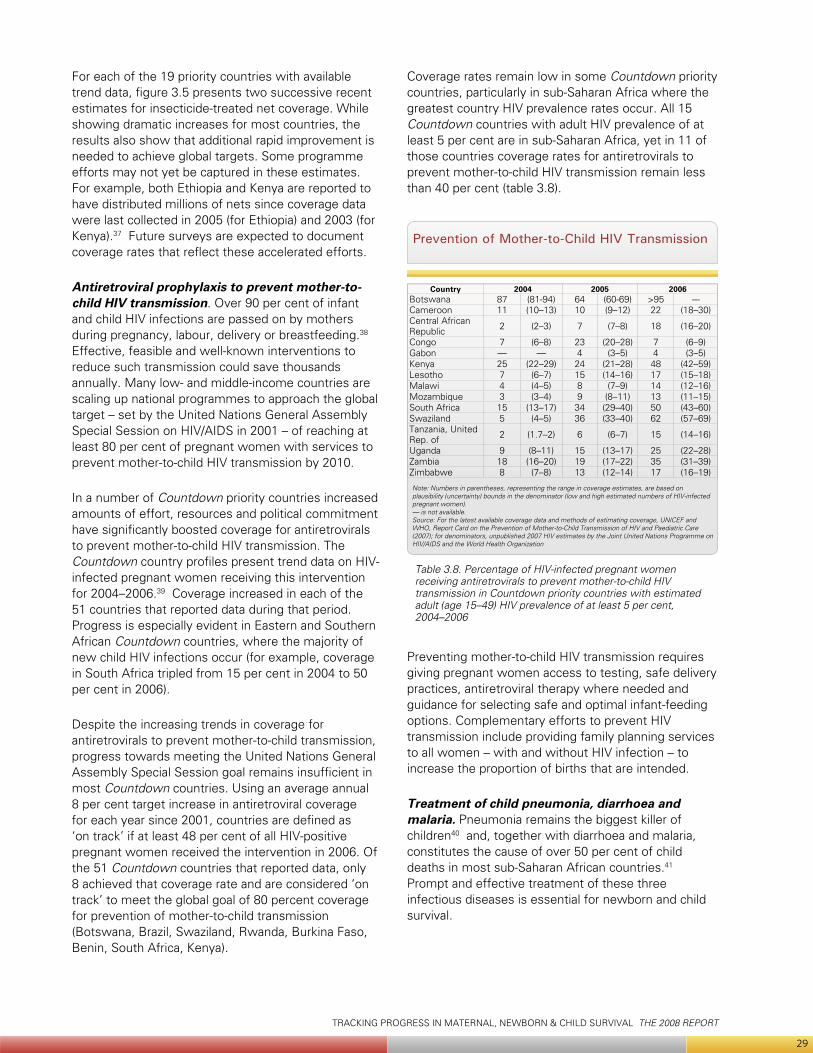
TRACKING PROGRESS IN MATERNAL, NEWBORN & CHILD SURVIVAL THE 2008 REPORT
29
For each of the 19 priority countries with available trend data, figure 3.5 presents two successive recent estimates for insecticide-treated net coverage. While showing dramatic increases for most countries, the results also show that additional rapid improvement is needed to achieve global targets. Some programme efforts may not yet be captured in these estimates. For example, both Ethiopia and Kenya are reported to have distributed millions of nets since coverage data were last collected in 2005 (for Ethiopia) and 2003 (for Kenya).37 Future surveys are expected to document coverage rates that reflect these accelerated efforts.
Antiretroviral prophylaxis to prevent mother-to-child HIV transmission. Over 90 per cent of infant and child HIV infections are passed on by mothers during pregnancy, labour, delivery or breastfeeding.38 Effective, feasible and well-known interventions to reduce such transmission could save thousands annually. Many low- and middle-income countries are scaling up national programmes to approach the global target – set by the United Nations General Assembly Special Session on HIV/AIDS in 2001 – of reaching at least 80 per cent of pregnant women with services to prevent mother-to-child HIV transmission by 2010.
In a number of Countdown priority countries increased amounts of effort, resources and political commitment have significantly boosted coverage for antiretrovirals to prevent mother-to-child HIV transmission. The Countdown country profiles present trend data on HIV-infected pregnant women receiving this intervention for 2004–2006.39 Coverage increased in each of the 51 countries that reported data during that period. Progress is especially evident in Eastern and Southern African Countdown countries, where the majority of new child HIV infections occur (for example, coverage in South Africa tripled from 15 per cent in 2004 to 50 per cent in 2006).
Despite the increasing trends in coverage for antiretrovirals to prevent mother-to-child transmission, progress towards meeting the United Nations General Assembly Special Session goal remains insufficient in most Countdown countries. Using an average annual 8 per cent target increase in antiretroviral coverage for each year since 2001, countries are defined as ‘on track’ if at least 48 per cent of all HIV-positive pregnant women received the intervention in 2006. Of the 51 Countdown countries that reported data, only 8 achieved that coverage rate and are considered ‘on track’ to meet the global goal of 80 percent coverage for prevention of mother-to-child transmission (Botswana, Brazil, Swaziland, Rwanda, Burkina Faso, Benin, South Africa, Kenya).
Coverage rates remain low in some Countdown priority countries, particularly in sub-Saharan Africa where the greatest country HIV prevalence rates occur. All 15 Countdown countries with adult HIV prevalence of at least 5 per cent are in sub-Saharan Africa, yet in 11 of those countries coverage rates for antiretrovirals to prevent mother-to-child HIV transmission remain less than 40 per cent (table 3.8).
Preventing mother-to-child HIV transmission requires giving pregnant women access to testing, safe delivery practices, antiretroviral therapy where needed and guidance for selecting safe and optimal infant-feeding options. Complementary efforts to prevent HIV transmission include providing family planning services to all women – with and without HIV infection – to increase the proportion of births that are intended.
Treatment of child pneumonia, diarrhoea and malaria. Pneumonia remains the biggest killer of children40 and, together with diarrhoea and malaria, constitutes the cause of over 50 per cent of child deaths in most sub-Saharan African countries.41 Prompt and effective treatment of these three infectious diseases is essential for newborn and child survival.
Prevention of Mother-to-Child HIV Transmission
Table 3.8. Percentage of HIV-infected pregnant women receiving antiretrovirals to prevent mother-to-child HIV transmission in Countdown priority countries with estimated adult (age 15–49) HIV prevalence of at least 5 per cent, 2004–2006
Note: Numbers in parentheses, representing the range in coverage estimates, are based on plausibility (uncertainty) bounds in the denominator (low and high estimated numbers of HIV-infected pregnant women). — is not available.Source: For the latest available coverage data and methods of estimating coverage, UNICEF and WHO, Report Card on the Prevention of Mother-to-Child Transmission of HIV and Paediatric Care (2007); for denominators, unpublished 2007 HIV estimates by the Joint United Nations Programme on HIV/AIDS and the World Health Organization
Country 2004 2005 2006Botswana 87 (81-94) 64 (60-69) >95 ---Cameroon 11 (10–13) 10 (9–12) 22 (18–30)Central African Republic 2 (2–3) 7 (7–8) 18 (16–20)
Congo 7 (6–8) 23 (20–28) 7 (6–9)Gabon — — 4 (3–5) 4 (3–5)Kenya 25 (22–29) 24 (21–28) 48 (42–59)Lesotho 7 (6–7) 15 (14–16) 17 (15–18)Malawi 4 (4–5) 8 (7–9) 14 (12–16)Mozambique 3 (3–4) 9 (8–11) 13 (11–15)South Africa 15 (13–17) 34 (29–40) 50 (43–60)Swaziland 5 (4–5) 36 (33–40) 62 (57–69)Tanzania, United Rep. of 2 (1.7–2) 6 (6–7) 15 (14–16)
Uganda 9 (8–11) 15 (13–17) 25 (22–28)Zambia 18 (16–20) 19 (17–22) 35 (31–39)Zimbabwe 8 (7–8) 13 (12–14) 17 (16–19)
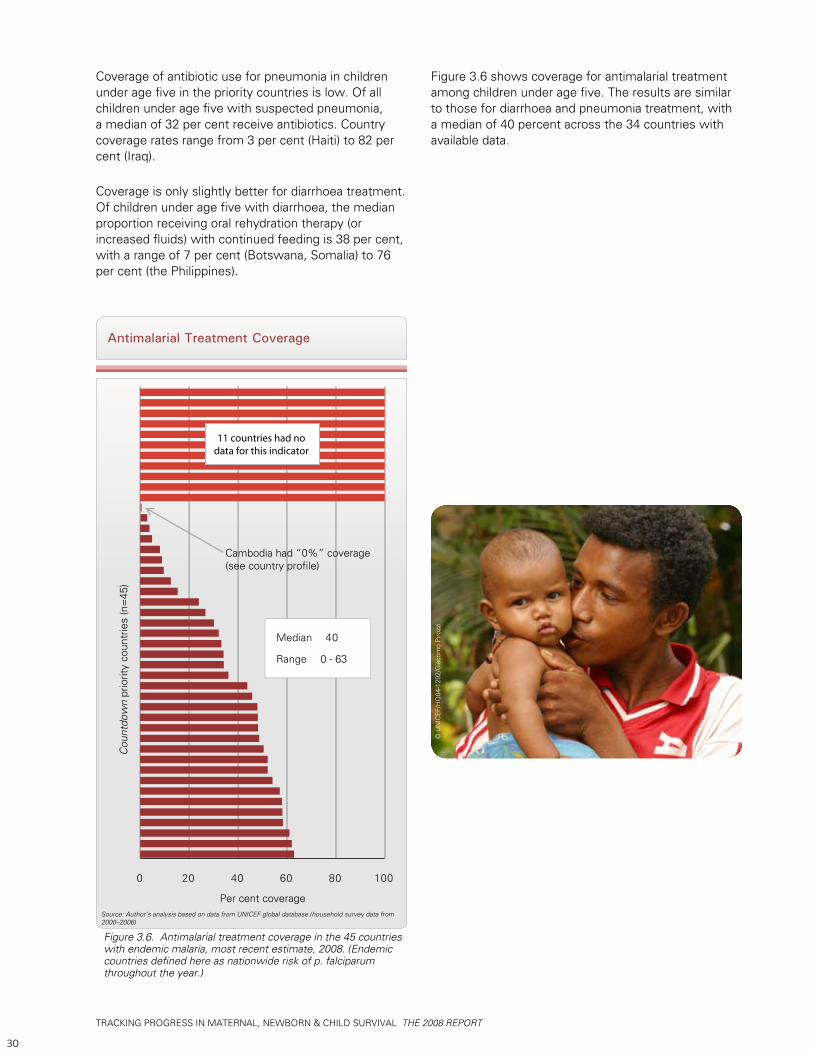
TRACKING PROGRESS IN MATERNAL, NEWBORN & CHILD SURVIVAL THE 2008 REPORT
30
Coverage of antibiotic use for pneumonia in children under age five in the priority countries is low. Of all children under age five with suspected pneumonia, a median of 32 per cent receive antibiotics. Country coverage rates range from 3 per cent (Haiti) to 82 per cent (Iraq).
Coverage is only slightly better for diarrhoea treatment. Of children under age five with diarrhoea, the median proportion receiving oral rehydration therapy (or increased fluids) with continued feeding is 38 per cent, with a range of 7 per cent (Botswana, Somalia) to 76 per cent (the Philippines).
Antimalarial Treatment Coverage
Source: Author’s analysis based on data from UNICEF global database (household survey data from 2000–2006)
Figure 3.6. Antimalarial treatment coverage in the 45 countries with endemic malaria, most recent estimate, 2008. (Endemic countries defined here as nationwide risk of p. falciparum throughout the year.)
Cou
ntdo
wn
prio
rity
coun
trie
s (n
=45
)
Per cent coverage
0 20 40 60 80 100
Cambodia had “0%” coverage(see country profile)
11 countries had nodata for this indicator
Median 40
Range 0 - 63
Figure 3.6 shows coverage for antimalarial treatment among children under age five. The results are similar to those for diarrhoea and pneumonia treatment, with a median of 40 percent across the 34 countries with available data.
© U
NIC
EF/H
Q04
-129
2/G
iaco
mo
Piro
zzi
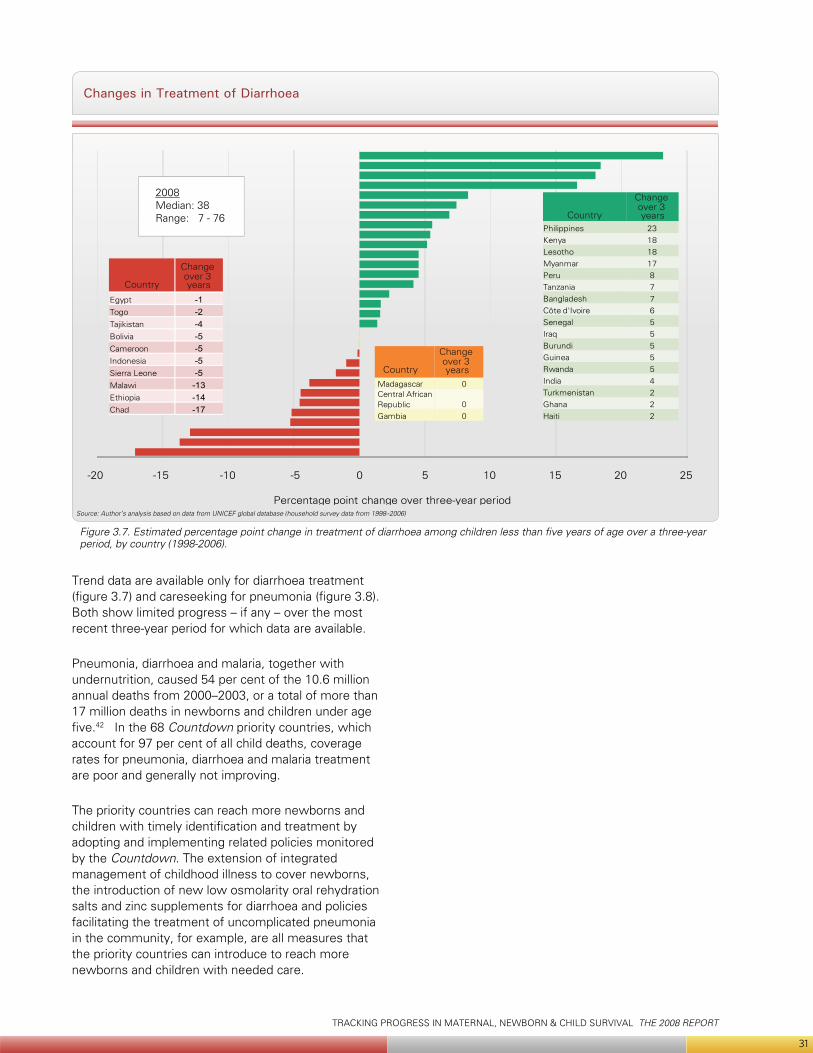
TRACKING PROGRESS IN MATERNAL, NEWBORN & CHILD SURVIVAL THE 2008 REPORT
31
Changes in Treatment of Diarrhoea
Source: Author’s analysis based on data from UNICEF global database (household survey data from 1998–2006)
Figure 3.7. Estimated percentage point change in treatment of diarrhoea among children less than five years of age over a three-year period, by country (1998-2006).
Trend data are available only for diarrhoea treatment (figure 3.7) and careseeking for pneumonia (figure 3.8). Both show limited progress – if any – over the most recent three-year period for which data are available.
Pneumonia, diarrhoea and malaria, together with undernutrition, caused 54 per cent of the 10.6 million annual deaths from 2000–2003, or a total of more than 17 million deaths in newborns and children under age five.42 In the 68 Countdown priority countries, which account for 97 per cent of all child deaths, coverage rates for pneumonia, diarrhoea and malaria treatment are poor and generally not improving.
The priority countries can reach more newborns and children with timely identification and treatment by adopting and implementing related policies monitored by the Countdown. The extension of integrated management of childhood illness to cover newborns, the introduction of new low osmolarity oral rehydration salts and zinc supplements for diarrhoea and policies facilitating the treatment of uncomplicated pneumonia in the community, for example, are all measures that the priority countries can introduce to reach more newborns and children with needed care.
-20 -15 -10 -5 0 5 10 15 20 25
Percentage point change over three-year period
Philippines 23Kenya 18Lesotho 18Myanmar 17Peru 8Tanzania 7Bangladesh 7Côte d'Ivoire 6Senegal 5Iraq 5Burundi 5Guinea 5Rwanda 5India 4Turkmenistan 2Ghana 2Haiti 2
Madagascar 0Central African Republic 0Gambia 0
Egypt -1Togo -2Tajikistan -4Bolivia -5Cameroon -5Indonesia -5Sierra Leone -5Malawi -13Ethiopia -14Chad -17
Country
Change over 3 years
Country
Change over 3 years
Country
Change over 3 years
2008Median: 38Range: 7 - 76
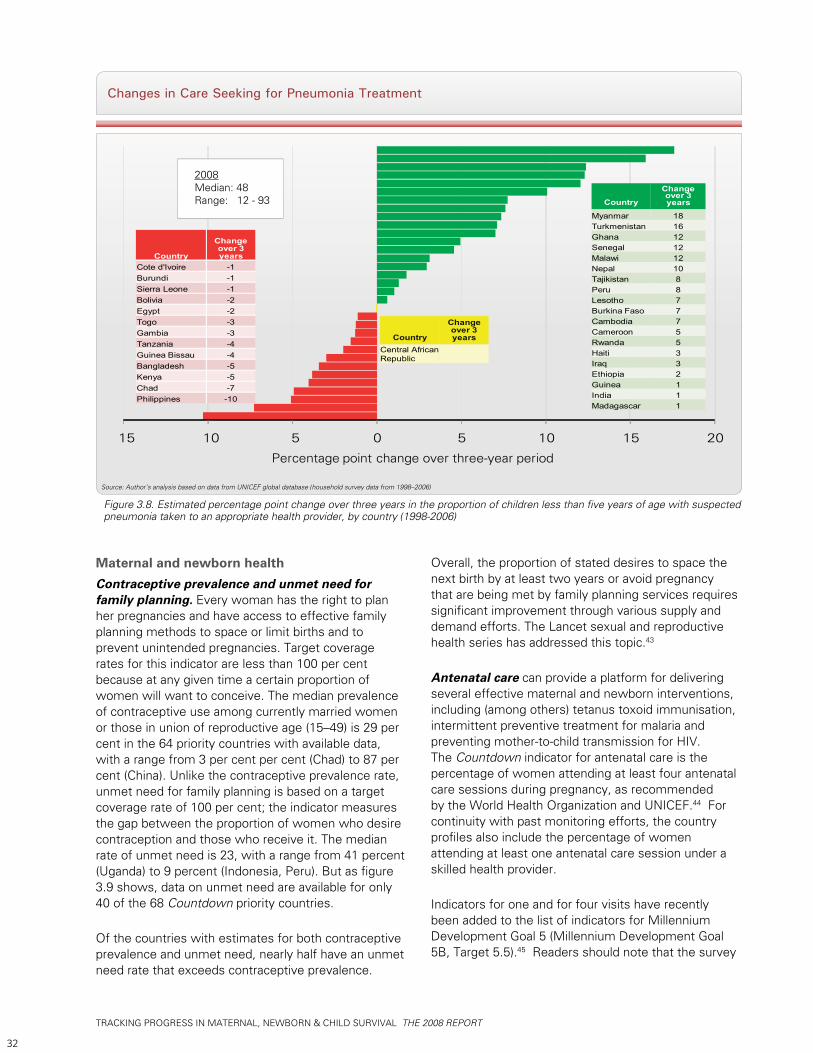
TRACKING PROGRESS IN MATERNAL, NEWBORN & CHILD SURVIVAL THE 2008 REPORT
32
Changes in Care Seeking for Pneumonia Treatment
Source: Author’s analysis based on data from UNICEF global database (household survey data from 1998–2006)
Figure 3.8. Estimated percentage point change over three years in the proportion of children less than five years of age with suspected pneumonia taken to an appropriate health provider, by country (1998-2006)
Maternal and newborn health Contraceptive prevalence and unmet need for family planning. Every woman has the right to plan her pregnancies and have access to effective family planning methods to space or limit births and to prevent unintended pregnancies. Target coverage rates for this indicator are less than 100 per cent because at any given time a certain proportion of women will want to conceive. The median prevalence of contraceptive use among currently married women or those in union of reproductive age (15–49) is 29 per cent in the 64 priority countries with available data, with a range from 3 per cent per cent (Chad) to 87 per cent (China). Unlike the contraceptive prevalence rate, unmet need for family planning is based on a target coverage rate of 100 per cent; the indicator measures the gap between the proportion of women who desire contraception and those who receive it. The median rate of unmet need is 23, with a range from 41 percent (Uganda) to 9 percent (Indonesia, Peru). But as figure 3.9 shows, data on unmet need are available for only 40 of the 68 Countdown priority countries.
Of the countries with estimates for both contraceptive prevalence and unmet need, nearly half have an unmet need rate that exceeds contraceptive prevalence.
Overall, the proportion of stated desires to space the next birth by at least two years or avoid pregnancy that are being met by family planning services requires significant improvement through various supply and demand efforts. The Lancet sexual and reproductive health series has addressed this topic.43
Antenatal care can provide a platform for delivering several effective maternal and newborn interventions, including (among others) tetanus toxoid immunisation, intermittent preventive treatment for malaria and preventing mother-to-child transmission for HIV. The Countdown indicator for antenatal care is the percentage of women attending at least four antenatal care sessions during pregnancy, as recommended by the World Health Organization and UNICEF.44 For continuity with past monitoring efforts, the country profiles also include the percentage of women attending at least one antenatal care session under a skilled health provider.
Indicators for one and for four visits have recently been added to the list of indicators for Millennium Development Goal 5 (Millennium Development Goal 5B, Target 5.5).45 Readers should note that the survey
15 10 5 0 5 10 15 20
Country
Change over 3 years
Myanmar 18Turkmenistan 16Ghana 12Senegal 12Malawi 12Nepal 10Tajikistan 8Peru 8Lesotho 7Burkina Faso 7Cambodia 7Cameroon 5Rwanda 5Haiti 3Iraq 3Ethiopia 2Guinea 1India 1Madagascar 1
Country
Change over 3 years
Central African Republic
Country
Change over 3 years
Cote d'Ivoire -1Burundi -1Sierra Leone -1Bolivia -2Egypt -2Togo -3Gambia -3Tanzania -4Guinea Bissau -4Bangladesh -5Kenya -5Chad -7Philippines -10
2008Median: 48Range: 12 - 93
Percentage point change over three-year period
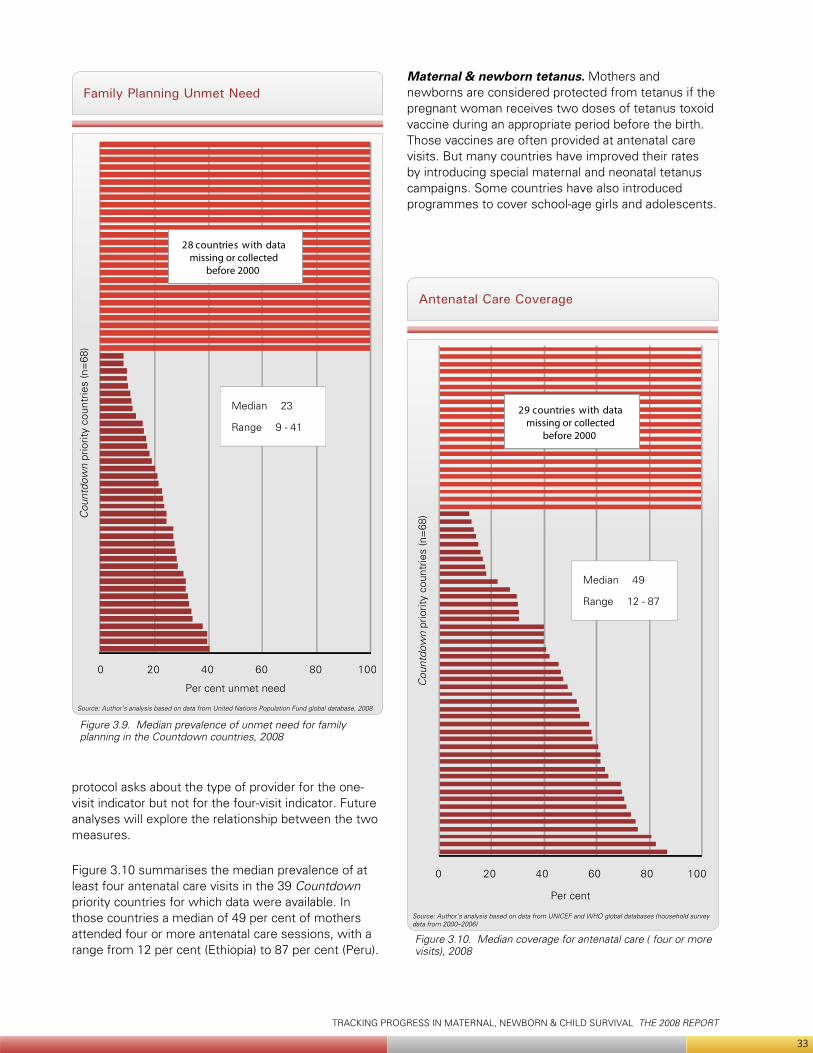
TRACKING PROGRESS IN MATERNAL, NEWBORN & CHILD SURVIVAL THE 2008 REPORT
33
protocol asks about the type of provider for the one-visit indicator but not for the four-visit indicator. Future analyses will explore the relationship between the two measures.
Figure 3.10 summarises the median prevalence of at least four antenatal care visits in the 39 Countdown priority countries for which data were available. In those countries a median of 49 per cent of mothers attended four or more antenatal care sessions, with a range from 12 per cent (Ethiopia) to 87 per cent (Peru).
Family Planning Unmet Need
Source: Author’s analysis based on data from United Nations Population Fund global database, 2008
Cou
ntdo
wn
prio
rity
coun
trie
s (n
=68
)
Per cent unmet need
0 20 40 60 80 100
28 countries with datamissing or collected
before 2000
Median 23
Range 9 - 41
Maternal & newborn tetanus. Mothers and newborns are considered protected from tetanus if the pregnant woman receives two doses of tetanus toxoid vaccine during an appropriate period before the birth. Those vaccines are often provided at antenatal care visits. But many countries have improved their rates by introducing special maternal and neonatal tetanus campaigns. Some countries have also introduced programmes to cover school-age girls and adolescents.
Antenatal Care Coverage
Source: Author’s analysis based on data from UNICEF and WHO global databases (household survey data from 2000–2006)
Figure 3.10. Median coverage for antenatal care ( four or more visits), 2008
0 20 40 60 80 100
29 countries with datamissing or collected
before 2000 C
ount
dow
n pr
iorit
y co
untr
ies
(n=
68)
Per cent
Median 49
Range 12 - 87
Figure 3.9. Median prevalence of unmet need for family planning in the Countdown countries, 2008
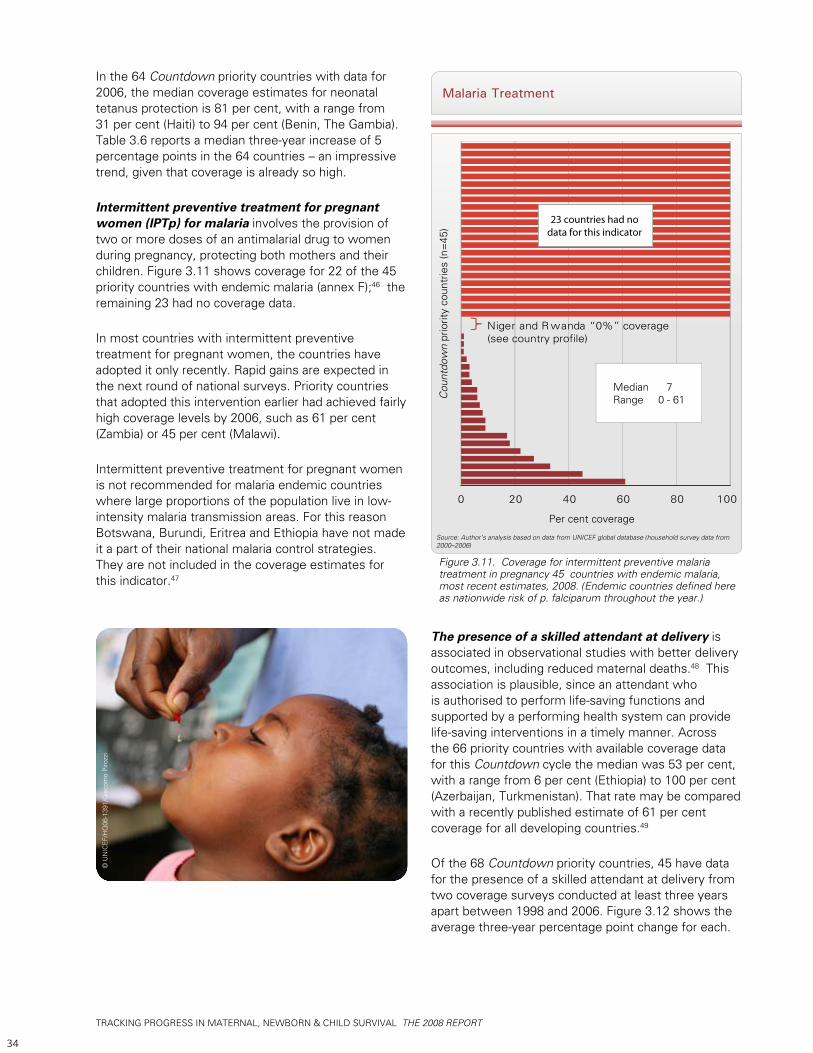
TRACKING PROGRESS IN MATERNAL, NEWBORN & CHILD SURVIVAL THE 2008 REPORT
34
In the 64 Countdown priority countries with data for 2006, the median coverage estimates for neonatal tetanus protection is 81 per cent, with a range from 31 per cent (Haiti) to 94 per cent (Benin, The Gambia). Table 3.6 reports a median three-year increase of 5 percentage points in the 64 countries – an impressive trend, given that coverage is already so high.
Intermittent preventive treatment for pregnant women (IPTp) for malaria involves the provision of two or more doses of an antimalarial drug to women during pregnancy, protecting both mothers and their children. Figure 3.11 shows coverage for 22 of the 45 priority countries with endemic malaria (annex F);46 the remaining 23 had no coverage data.
In most countries with intermittent preventive treatment for pregnant women, the countries have adopted it only recently. Rapid gains are expected in the next round of national surveys. Priority countries that adopted this intervention earlier had achieved fairly high coverage levels by 2006, such as 61 per cent (Zambia) or 45 per cent (Malawi).
Intermittent preventive treatment for pregnant women is not recommended for malaria endemic countries where large proportions of the population live in low-intensity malaria transmission areas. For this reason Botswana, Burundi, Eritrea and Ethiopia have not made it a part of their national malaria control strategies. They are not included in the coverage estimates for this indicator.47
Malaria Treatment
Source: Author’s analysis based on data from UNICEF global database (household survey data from 2000–2006)
Figure 3.11. Coverage for intermittent preventive malaria treatment in pregnancy 45 countries with endemic malaria, most recent estimates, 2008. (Endemic countries defined here as nationwide risk of p. falciparum throughout the year.)
0 20 40 60 80 100
Niger and Rwanda “0%” coverage(see country profile)
Cou
ntdo
wn
prio
rity
coun
trie
s (n
=45
)
Per cent coverage
23 countries had nodata for this indicator
Median 7Range 0 - 61
© U
NIC
EF/H
Q06
-139
1/G
iaco
mo
Piro
zzi
The presence of a skilled attendant at delivery is associated in observational studies with better delivery outcomes, including reduced maternal deaths.48 This association is plausible, since an attendant who is authorised to perform life-saving functions and supported by a performing health system can provide life-saving interventions in a timely manner. Across the 66 priority countries with available coverage data for this Countdown cycle the median was 53 per cent, with a range from 6 per cent (Ethiopia) to 100 per cent (Azerbaijan, Turkmenistan). That rate may be compared with a recently published estimate of 61 per cent coverage for all developing countries.49
Of the 68 Countdown priority countries, 45 have data for the presence of a skilled attendant at delivery from two coverage surveys conducted at least three years apart between 1998 and 2006. Figure 3.12 shows the average three-year percentage point change for each.
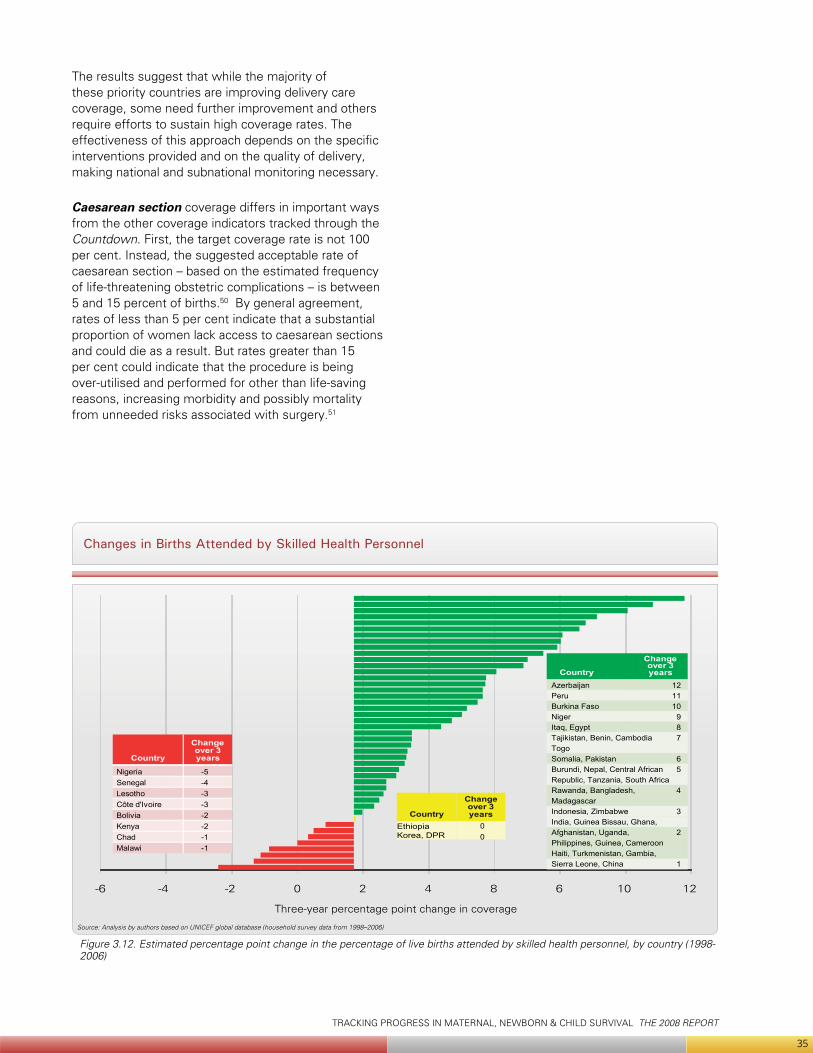
TRACKING PROGRESS IN MATERNAL, NEWBORN & CHILD SURVIVAL THE 2008 REPORT
35
The results suggest that while the majority of these priority countries are improving delivery care coverage, some need further improvement and others require efforts to sustain high coverage rates. The effectiveness of this approach depends on the specific interventions provided and on the quality of delivery, making national and subnational monitoring necessary.
Caesarean section coverage differs in important ways from the other coverage indicators tracked through the Countdown. First, the target coverage rate is not 100 per cent. Instead, the suggested acceptable rate of caesarean section – based on the estimated frequency of life-threatening obstetric complications – is between 5 and 15 percent of births.50 By general agreement, rates of less than 5 per cent indicate that a substantial proportion of women lack access to caesarean sections and could die as a result. But rates greater than 15 per cent could indicate that the procedure is being over-utilised and performed for other than life-saving reasons, increasing morbidity and possibly mortality from unneeded risks associated with surgery.51
Changes in Births Attended by Skilled Health Personnel
Source: Analysis by authors based on UNICEF global database (household survey data from 1998–2006)
-6 -4 -2 0 2 4 8 6 10 12
Country
Change over 3 years
Country
Change over 3 years
Ethiopia Korea, DPR
Country
Change over 3 years
Three-year percentage point change in coverage
NigeriaSenegalLesothoCôte d'IvoireBoliviaKenyaChadMalawi
AzerbaijanPeruBurkina FasoNigerItaq, EgyptTajikistan, Benin, CambodiaTogoSomalia, PakistanBurundi, Nepal, Central African Republic, Tanzania, South AfricaRawanda, Bangladesh, MadagascarIndonesia, ZimbabweIndia, Guinea Bissau, Ghana, Afghanistan, Uganda, Philippines, Guinea, CameroonHaiti, Turkmenistan, Gambia,Sierra Leone, China
-5-4-3-3-2-2-1-1
00
121110
987
65
4
3
2
1
Figure 3.12. Estimated percentage point change in the percentage of live births attended by skilled health personnel, by country (1998-2006)
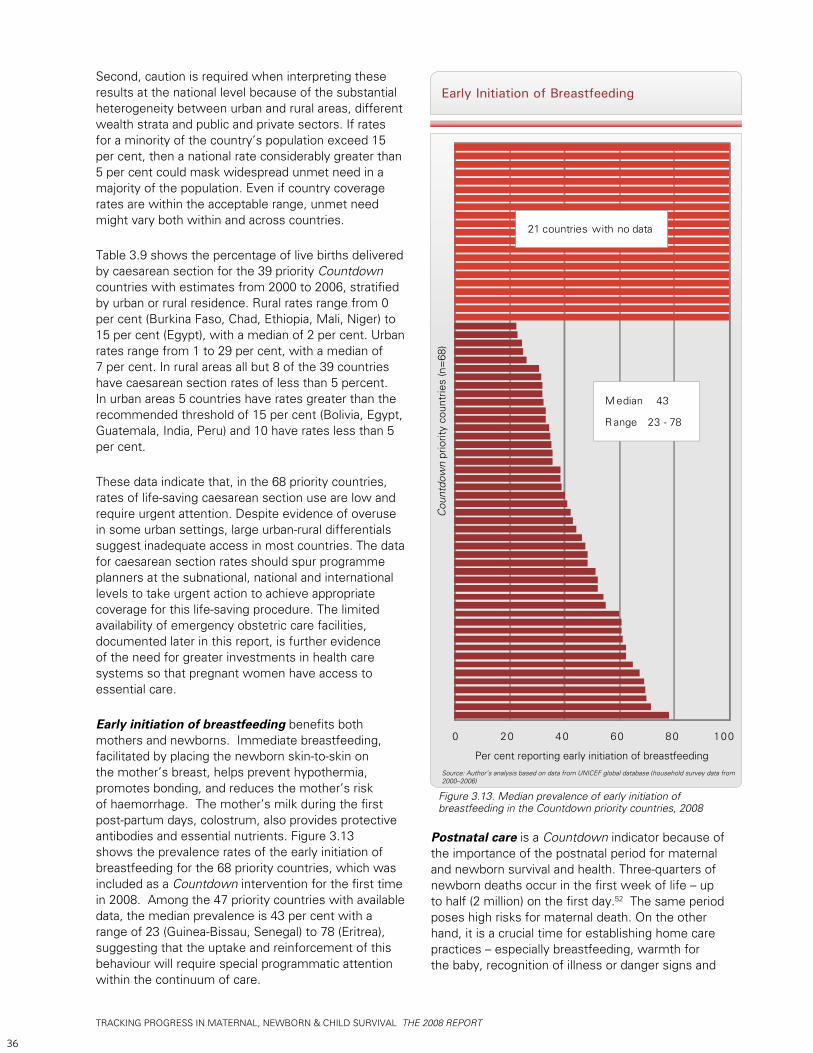
TRACKING PROGRESS IN MATERNAL, NEWBORN & CHILD SURVIVAL THE 2008 REPORT
36
Second, caution is required when interpreting these results at the national level because of the substantial heterogeneity between urban and rural areas, different wealth strata and public and private sectors. If rates for a minority of the country’s population exceed 15 per cent, then a national rate considerably greater than 5 per cent could mask widespread unmet need in a majority of the population. Even if country coverage rates are within the acceptable range, unmet need might vary both within and across countries.
Table 3.9 shows the percentage of live births delivered by caesarean section for the 39 priority Countdown countries with estimates from 2000 to 2006, stratified by urban or rural residence. Rural rates range from 0 per cent (Burkina Faso, Chad, Ethiopia, Mali, Niger) to 15 per cent (Egypt), with a median of 2 per cent. Urban rates range from 1 to 29 per cent, with a median of 7 per cent. In rural areas all but 8 of the 39 countries have caesarean section rates of less than 5 percent. In urban areas 5 countries have rates greater than the recommended threshold of 15 per cent (Bolivia, Egypt, Guatemala, India, Peru) and 10 have rates less than 5 per cent.
These data indicate that, in the 68 priority countries, rates of life-saving caesarean section use are low and require urgent attention. Despite evidence of overuse in some urban settings, large urban-rural differentials suggest inadequate access in most countries. The data for caesarean section rates should spur programme planners at the subnational, national and international levels to take urgent action to achieve appropriate coverage for this life-saving procedure. The limited availability of emergency obstetric care facilities, documented later in this report, is further evidence of the need for greater investments in health care systems so that pregnant women have access to essential care.
Early initiation of breastfeeding benefits both mothers and newborns. Immediate breastfeeding, facilitated by placing the newborn skin-to-skin on the mother’s breast, helps prevent hypothermia, promotes bonding, and reduces the mother’s risk of haemorrhage. The mother’s milk during the first post-partum days, colostrum, also provides protective antibodies and essential nutrients. Figure 3.13 shows the prevalence rates of the early initiation of breastfeeding for the 68 priority countries, which was included as a Countdown intervention for the first time in 2008. Among the 47 priority countries with available data, the median prevalence is 43 per cent with a range of 23 (Guinea-Bissau, Senegal) to 78 (Eritrea), suggesting that the uptake and reinforcement of this behaviour will require special programmatic attention within the continuum of care.
Postnatal care is a Countdown indicator because of the importance of the postnatal period for maternal and newborn survival and health. Three-quarters of newborn deaths occur in the first week of life – up to half (2 million) on the first day.52 The same period poses high risks for maternal death. On the other hand, it is a crucial time for establishing home care practices – especially breastfeeding, warmth for the baby, recognition of illness or danger signs and
Early Initiation of Breastfeeding
Source: Author’s analysis based on data from UNICEF global database (household survey data from 2000–2006)
Figure 3.13. Median prevalence of early initiation of breastfeeding in the Countdown priority countries, 2008
Cou
ntdo
wn
prio
rity
coun
trie
s (n
=68
)
Per cent reporting early initiation of breastfeeding
0 20 40 60 80 100
Median 43
R ange 23 - 78
21 countries with no data
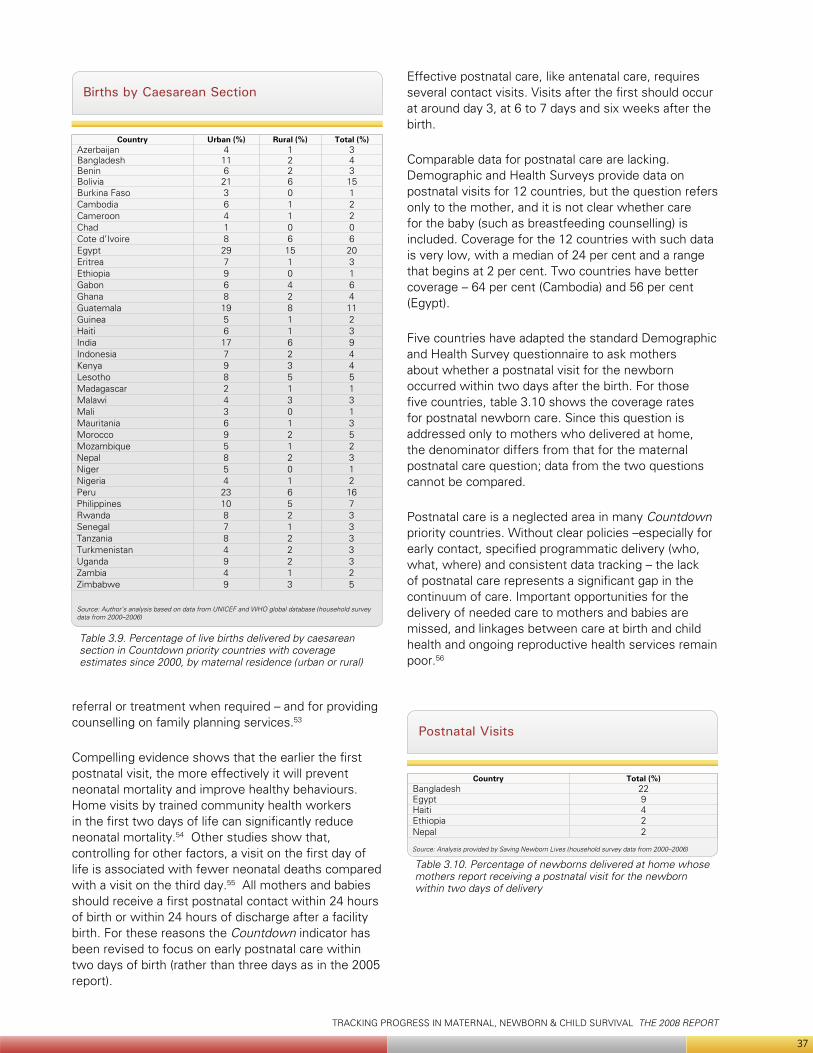
TRACKING PROGRESS IN MATERNAL, NEWBORN & CHILD SURVIVAL THE 2008 REPORT
37
referral or treatment when required – and for providing counselling on family planning services.53
Compelling evidence shows that the earlier the first postnatal visit, the more effectively it will prevent neonatal mortality and improve healthy behaviours. Home visits by trained community health workers in the first two days of life can significantly reduce neonatal mortality.54 Other studies show that, controlling for other factors, a visit on the first day of life is associated with fewer neonatal deaths compared with a visit on the third day.55 All mothers and babies should receive a first postnatal contact within 24 hours of birth or within 24 hours of discharge after a facility birth. For these reasons the Countdown indicator has been revised to focus on early postnatal care within two days of birth (rather than three days as in the 2005 report).
Births by Caesarean Section
Table 3.9. Percentage of live births delivered by caesarean section in Countdown priority countries with coverage estimates since 2000, by maternal residence (urban or rural)
Source: Author’s analysis based on data from UNICEF and WHO global database (household survey data from 2000–2006)
Country Urban (%) Rural (%) Total (%)Azerbaijan 4 1 3Bangladesh 11 2 4Benin 6 2 3Bolivia 21 6 15Burkina Faso 3 0 1Cambodia 6 1 2Cameroon 4 1 2Chad 1 0 0Cote d’Ivoire 8 6 6Egypt 29 15 20Eritrea 7 1 3Ethiopia 9 0 1Gabon 6 4 6Ghana 8 2 4Guatemala 19 8 11Guinea 5 1 2Haiti 6 1 3India 17 6 9Indonesia 7 2 4Kenya 9 3 4Lesotho 8 5 5Madagascar 2 1 1Malawi 4 3 3Mali 3 0 1Mauritania 6 1 3Morocco 9 2 5Mozambique 5 1 2Nepal 8 2 3Niger 5 0 1Nigeria 4 1 2Peru 23 6 16Philippines 10 5 7Rwanda 8 2 3Senegal 7 1 3Tanzania 8 2 3Turkmenistan 4 2 3Uganda 9 2 3Zambia 4 1 2Zimbabwe 9 3 5
Postnatal Visits
Table 3.10. Percentage of newborns delivered at home whose mothers report receiving a postnatal visit for the newborn within two days of delivery
Source: Analysis provided by Saving Newborn Lives (household survey data from 2000–2006)
Country Total (%)Bangladesh 22Egypt 9Haiti 4Ethiopia 2Nepal 2
Effective postnatal care, like antenatal care, requires several contact visits. Visits after the first should occur at around day 3, at 6 to 7 days and six weeks after the birth.
Comparable data for postnatal care are lacking. Demographic and Health Surveys provide data on postnatal visits for 12 countries, but the question refers only to the mother, and it is not clear whether care for the baby (such as breastfeeding counselling) is included. Coverage for the 12 countries with such data is very low, with a median of 24 per cent and a range that begins at 2 per cent. Two countries have better coverage – 64 per cent (Cambodia) and 56 per cent (Egypt).
Five countries have adapted the standard Demographic and Health Survey questionnaire to ask mothers about whether a postnatal visit for the newborn occurred within two days after the birth. For those five countries, table 3.10 shows the coverage rates for postnatal newborn care. Since this question is addressed only to mothers who delivered at home, the denominator differs from that for the maternal postnatal care question; data from the two questions cannot be compared.
Postnatal care is a neglected area in many Countdown priority countries. Without clear policies –especially for early contact, specified programmatic delivery (who, what, where) and consistent data tracking – the lack of postnatal care represents a significant gap in the continuum of care. Important opportunities for the delivery of needed care to mothers and babies are missed, and linkages between care at birth and child health and ongoing reproductive health services remain poor.56
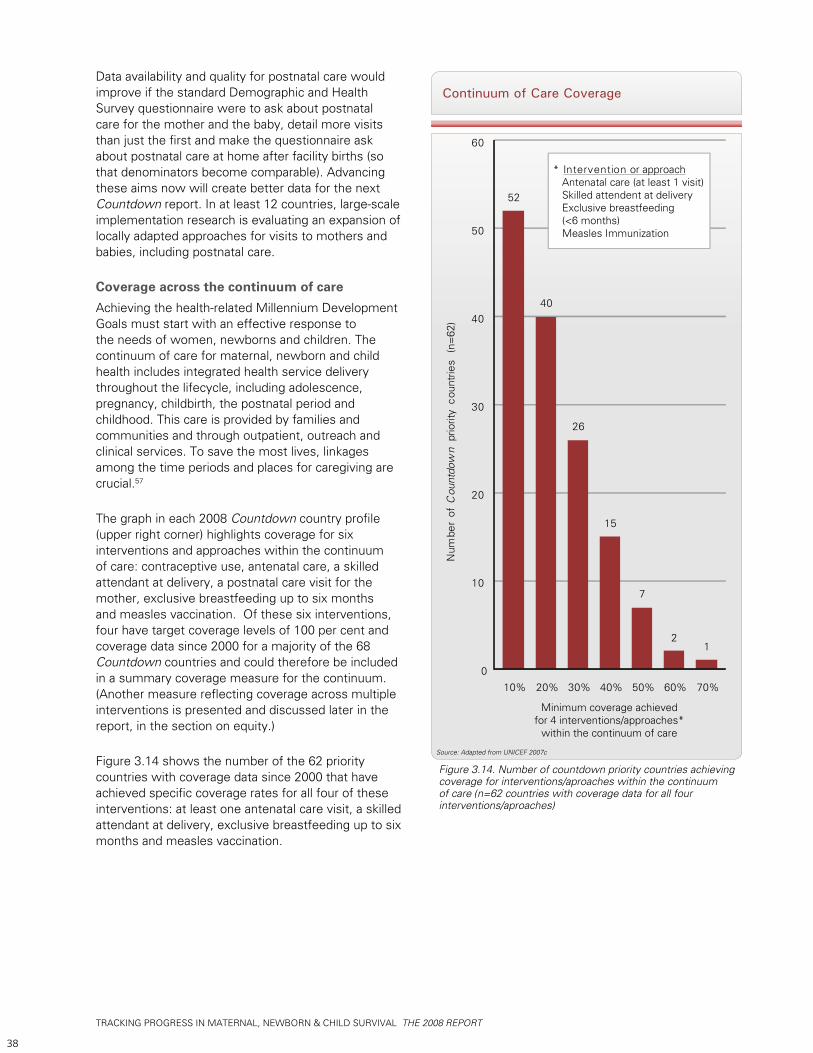
TRACKING PROGRESS IN MATERNAL, NEWBORN & CHILD SURVIVAL THE 2008 REPORT
38
Data availability and quality for postnatal care would improve if the standard Demographic and Health Survey questionnaire were to ask about postnatal care for the mother and the baby, detail more visits than just the first and make the questionnaire ask about postnatal care at home after facility births (so that denominators become comparable). Advancing these aims now will create better data for the next Countdown report. In at least 12 countries, large-scale implementation research is evaluating an expansion of locally adapted approaches for visits to mothers and babies, including postnatal care.
Coverage across the continuum of careAchieving the health-related Millennium Development Goals must start with an effective response to the needs of women, newborns and children. The continuum of care for maternal, newborn and child health includes integrated health service delivery throughout the lifecycle, including adolescence, pregnancy, childbirth, the postnatal period and childhood. This care is provided by families and communities and through outpatient, outreach and clinical services. To save the most lives, linkages among the time periods and places for caregiving are crucial.57
The graph in each 2008 Countdown country profile (upper right corner) highlights coverage for six interventions and approaches within the continuum of care: contraceptive use, antenatal care, a skilled attendant at delivery, a postnatal care visit for the mother, exclusive breastfeeding up to six months and measles vaccination. Of these six interventions, four have target coverage levels of 100 per cent and coverage data since 2000 for a majority of the 68 Countdown countries and could therefore be included in a summary coverage measure for the continuum. (Another measure reflecting coverage across multiple interventions is presented and discussed later in the report, in the section on equity.)
Figure 3.14 shows the number of the 62 priority countries with coverage data since 2000 that have achieved specific coverage rates for all four of these interventions: at least one antenatal care visit, a skilled attendant at delivery, exclusive breastfeeding up to six months and measles vaccination.
Continuum of Care Coverage
Source: Adapted from UNICEF 2007c
Figure 3.14. Number of countdown priority countries achieving coverage for interventions/aproaches within the continuum of care (n=62 countries with coverage data for all four interventions/aproaches)
52
40
26
15
7
21
0
10
20
30
40
50
60
10% 20% 30% 40% 50% 60% 70%
Num
ber
of C
ount
dow
n pr
iorit
y co
untr
ies
(n=
62)
* Intervention or approach Antenatal care (at least 1 visit) Skilled attendent at delivery Exclusive breastfeeding (<6 months) Measles Immunization
Minimum coverage achievedfor 4 interventions/approaches*
within the continuum of care
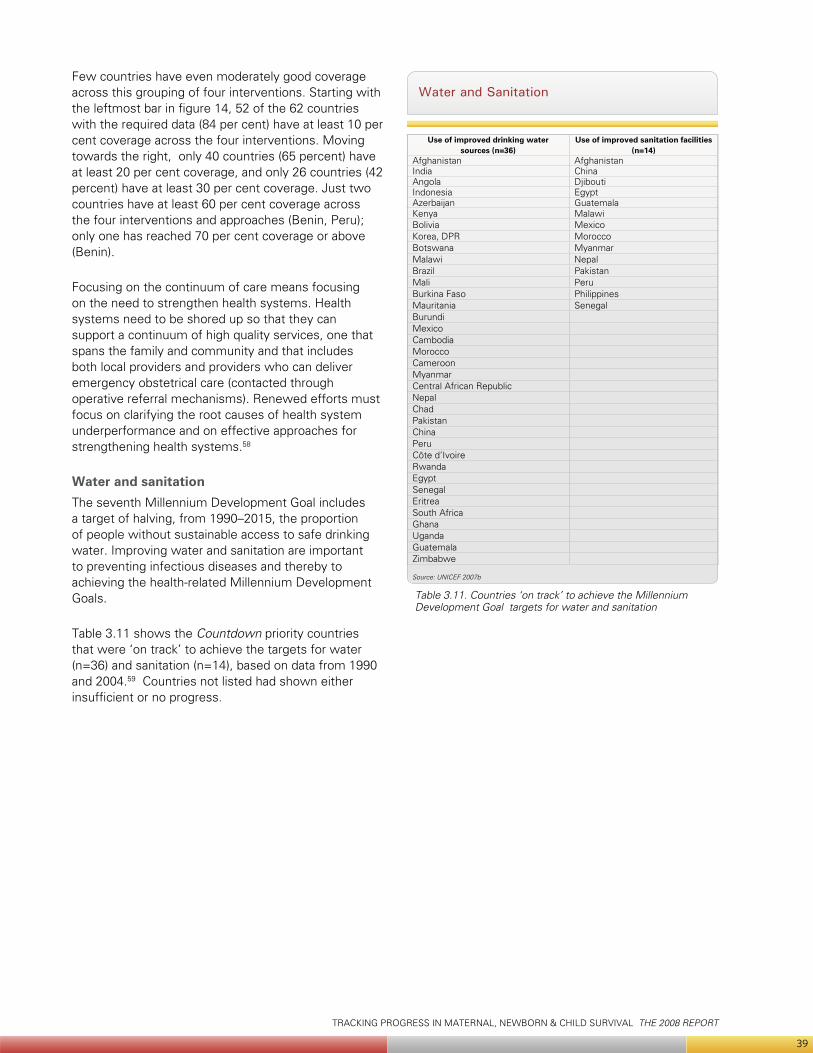
TRACKING PROGRESS IN MATERNAL, NEWBORN & CHILD SURVIVAL THE 2008 REPORT
39
Few countries have even moderately good coverage across this grouping of four interventions. Starting with the leftmost bar in figure 14, 52 of the 62 countries with the required data (84 per cent) have at least 10 per cent coverage across the four interventions. Moving towards the right, only 40 countries (65 percent) have at least 20 per cent coverage, and only 26 countries (42 percent) have at least 30 per cent coverage. Just two countries have at least 60 per cent coverage across the four interventions and approaches (Benin, Peru); only one has reached 70 per cent coverage or above (Benin).
Focusing on the continuum of care means focusing on the need to strengthen health systems. Health systems need to be shored up so that they can support a continuum of high quality services, one that spans the family and community and that includes both local providers and providers who can deliver emergency obstetrical care (contacted through operative referral mechanisms). Renewed efforts must focus on clarifying the root causes of health system underperformance and on effective approaches for strengthening health systems.58
Water and sanitationThe seventh Millennium Development Goal includes a target of halving, from 1990–2015, the proportion of people without sustainable access to safe drinking water. Improving water and sanitation are important to preventing infectious diseases and thereby to achieving the health-related Millennium Development Goals.
Table 3.11 shows the Countdown priority countries that were ‘on track’ to achieve the targets for water (n=36) and sanitation (n=14), based on data from 1990 and 2004.59 Countries not listed had shown either insufficient or no progress.
Water and Sanitation
Table 3.11. Countries ‘on track’ to achieve the Millennium Development Goal targets for water and sanitation
Source: UNICEF 2007b
Use of improved drinking water sources (n=36)
Use of improved sanitation facilities(n=14)
Afghanistan AfghanistanIndia ChinaAngola DjiboutiIndonesia EgyptAzerbaijan GuatemalaKenya MalawiBolivia MexicoKorea, DPR MoroccoBotswana MyanmarMalawi NepalBrazil PakistanMali PeruBurkina Faso PhilippinesMauritania SenegalBurundiMexicoCambodiaMoroccoCameroonMyanmarCentral African RepublicNepalChadPakistanChinaPeruCôte d’IvoireRwandaEgyptSenegalEritreaSouth AfricaGhanaUgandaGuatemalaZimbabwe
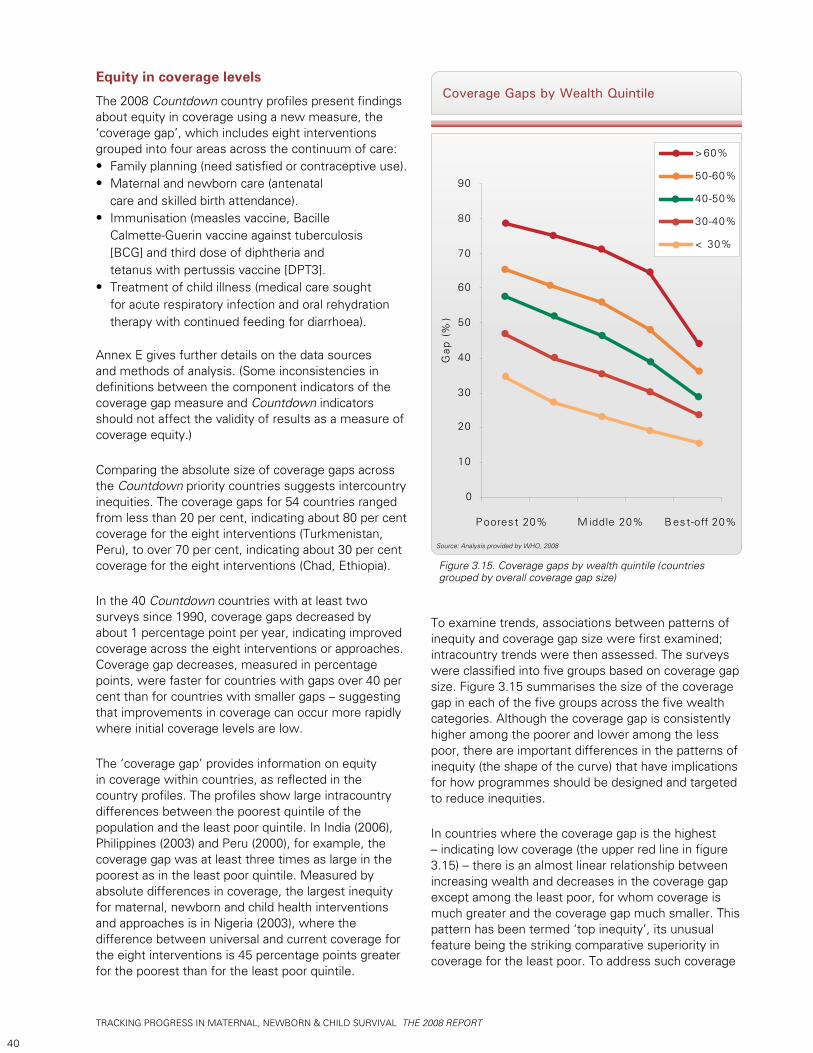
TRACKING PROGRESS IN MATERNAL, NEWBORN & CHILD SURVIVAL THE 2008 REPORT
40
Equity in coverage levels
The 2008 Countdown country profiles present findings about equity in coverage using a new measure, the ‘coverage gap’, which includes eight interventions grouped into four areas across the continuum of care:
Family planning (need satisfied or contraceptive use). • Maternal and newborn care (antenatal • care and skilled birth attendance).Immunisation (measles vaccine, Bacille • Calmette-Guerin vaccine against tuberculosis [BCG] and third dose of diphtheria and tetanus with pertussis vaccine [DPT3].Treatment of child illness (medical care sought • for acute respiratory infection and oral rehydration therapy with continued feeding for diarrhoea).
Annex E gives further details on the data sources and methods of analysis. (Some inconsistencies in definitions between the component indicators of the coverage gap measure and Countdown indicators should not affect the validity of results as a measure of coverage equity.)
Comparing the absolute size of coverage gaps across the Countdown priority countries suggests intercountry inequities. The coverage gaps for 54 countries ranged from less than 20 per cent, indicating about 80 per cent coverage for the eight interventions (Turkmenistan, Peru), to over 70 per cent, indicating about 30 per cent coverage for the eight interventions (Chad, Ethiopia).
In the 40 Countdown countries with at least two surveys since 1990, coverage gaps decreased by about 1 percentage point per year, indicating improved coverage across the eight interventions or approaches. Coverage gap decreases, measured in percentage points, were faster for countries with gaps over 40 per cent than for countries with smaller gaps – suggesting that improvements in coverage can occur more rapidly where initial coverage levels are low.
The ‘coverage gap’ provides information on equity in coverage within countries, as reflected in the country profiles. The profiles show large intracountry differences between the poorest quintile of the population and the least poor quintile. In India (2006), Philippines (2003) and Peru (2000), for example, the coverage gap was at least three times as large in the poorest as in the least poor quintile. Measured by absolute differences in coverage, the largest inequity for maternal, newborn and child health interventions and approaches is in Nigeria (2003), where the difference between universal and current coverage for the eight interventions is 45 percentage points greater for the poorest than for the least poor quintile.
Coverage Gaps by Wealth Quintile
Source: Analysis provided by WHO, 2008
Figure 3.15. Coverage gaps by wealth quintile (countries grouped by overall coverage gap size)
< 30%
30-40%
40-50%
50-60%
>60%
0
10
20
30
40
50
60
70
80
90
P oores t 20% M iddle 20% B est-off 20%
Gap
(%
)
To examine trends, associations between patterns of inequity and coverage gap size were first examined; intracountry trends were then assessed. The surveys were classified into five groups based on coverage gap size. Figure 3.15 summarises the size of the coverage gap in each of the five groups across the five wealth categories. Although the coverage gap is consistently higher among the poorer and lower among the less poor, there are important differences in the patterns of inequity (the shape of the curve) that have implications for how programmes should be designed and targeted to reduce inequities.
In countries where the coverage gap is the highest – indicating low coverage (the upper red line in figure 3.15) – there is an almost linear relationship between increasing wealth and decreases in the coverage gap except among the least poor, for whom coverage is much greater and the coverage gap much smaller. This pattern has been termed ‘top inequity’, its unusual feature being the striking comparative superiority in coverage for the least poor. To address such coverage
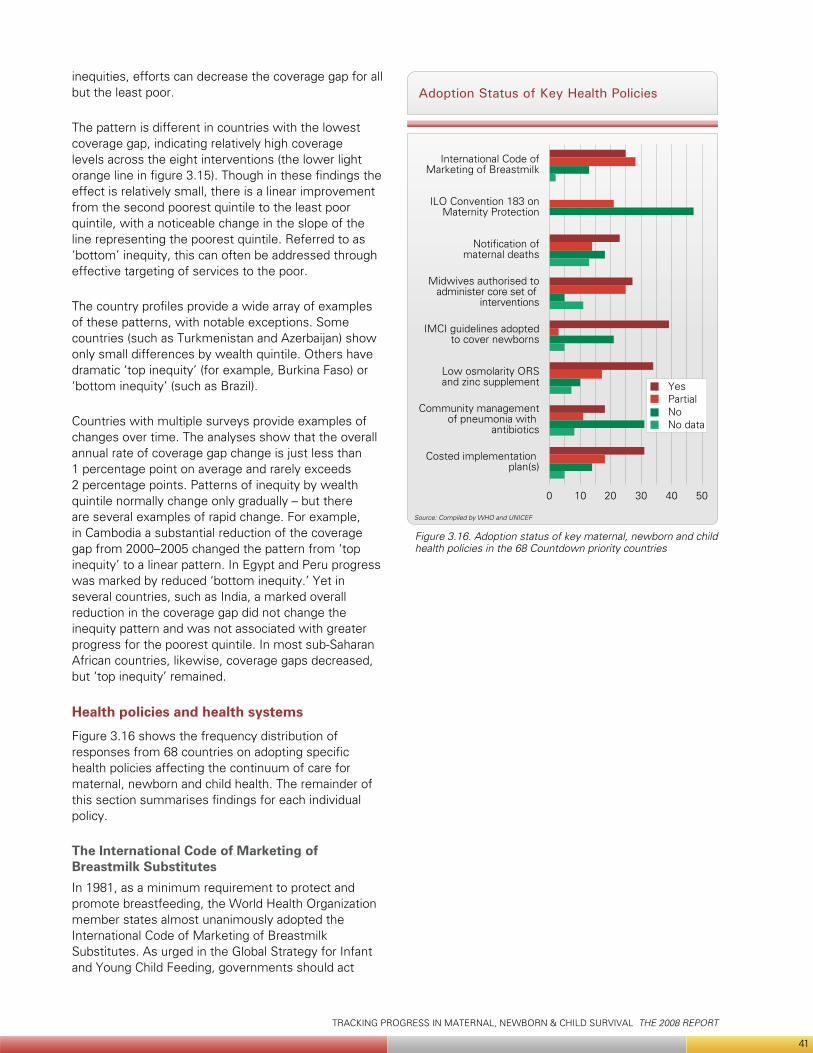
TRACKING PROGRESS IN MATERNAL, NEWBORN & CHILD SURVIVAL THE 2008 REPORT
41
inequities, efforts can decrease the coverage gap for all but the least poor.
The pattern is different in countries with the lowest coverage gap, indicating relatively high coverage levels across the eight interventions (the lower light orange line in figure 3.15). Though in these findings the effect is relatively small, there is a linear improvement from the second poorest quintile to the least poor quintile, with a noticeable change in the slope of the line representing the poorest quintile. Referred to as ‘bottom’ inequity, this can often be addressed through effective targeting of services to the poor.
The country profiles provide a wide array of examples of these patterns, with notable exceptions. Some countries (such as Turkmenistan and Azerbaijan) show only small differences by wealth quintile. Others have dramatic ‘top inequity’ (for example, Burkina Faso) or ‘bottom inequity’ (such as Brazil).
Countries with multiple surveys provide examples of changes over time. The analyses show that the overall annual rate of coverage gap change is just less than 1 percentage point on average and rarely exceeds 2 percentage points. Patterns of inequity by wealth quintile normally change only gradually – but there are several examples of rapid change. For example, in Cambodia a substantial reduction of the coverage gap from 2000–2005 changed the pattern from ‘top inequity’ to a linear pattern. In Egypt and Peru progress was marked by reduced ‘bottom inequity.’ Yet in several countries, such as India, a marked overall reduction in the coverage gap did not change the inequity pattern and was not associated with greater progress for the poorest quintile. In most sub-Saharan African countries, likewise, coverage gaps decreased, but ‘top inequity’ remained.
Health policies and health systems
Figure 3.16 shows the frequency distribution of responses from 68 countries on adopting specific health policies affecting the continuum of care for maternal, newborn and child health. The remainder of this section summarises findings for each individual policy.
The International Code of Marketing of Breastmilk Substitutes In 1981, as a minimum requirement to protect and promote breastfeeding, the World Health Organization member states almost unanimously adopted the International Code of Marketing of Breastmilk Substitutes. As urged in the Global Strategy for Infant and Young Child Feeding, governments should act
Adoption Status of Key Health Policies
Source: Compiled by WHO and UNICEF
Figure 3.16. Adoption status of key maternal, newborn and child health policies in the 68 Countdown priority countries
0 10 20 30 40 50
International Code ofMarketing of Breastmilk
ILO Convention 183 onMaternity Protection
Notification ofmaternal deaths
Midwives authorised toadminister core set of
interventions
IMCI guidelines adoptedto cover newborns
Low osmolarity ORSand zinc supplement
Community managementof pneumonia with
antibiotics
Costed implementation plan(s)
YesPartialNoNo data

TRACKING PROGRESS IN MATERNAL, NEWBORN & CHILD SURVIVAL THE 2008 REPORT
42
on the Code and on later World Health Assembly resolutions.60
By the end of 2007, 25 of the 68 Countdown priority countries had reported adopting legislation covering all provisions of the International Code while 28 reported having legislation or voluntary agreements covering some Code provisions. Another 13 countries had taken no action to adopt the Code and no information was available for 2 countries. These data reflect marked improvement since 2005, when the Countdown reported that 15 of 60 countries had fully adopted the Code and 39 had adopted parts of it (figure 3.17).61
The ILO Convention 183 on Maternity ProtectionInternational labour standards on maternity protection are important to protect the health and employment of women.62 Over the history of the International Labour Organization, member states have adopted three Conventions on maternity protection (No. 3, 1919; No. 103, 1952; No. 183, 2000), progressively expanding the scope and entitlements of maternity protection at work. Convention No. 183 provides for health protection at work, 14 weeks of maternity leave, cash and medical benefits, employment security and non-discrimination and rights to breastfeeding
breaks for nursing mothers. The Social Security (Minimum Standards) Convention, 1952 (No. 102), is also relevant to maternal health, setting minimum requirements for the provision of health care during pregnancy and confinement, cash maternity benefits replacing lost income and minimum standards for access to preventive and curative health services in general. Conventions are binding in ratifying countries. To date, none of the 68 priority countries has ratified Convention No. 183, while 21 have ratified one of the earlier maternity protection conventions. Of the countries that have ratified none of the maternity protection conventions, five have ratified Convention No. 102.
Forty-seven countries had not ratified any convention on maternity protection. Intensified advocacy is needed in this area. Measures stipulated under the Convention are critical for ensuring direct protection, maternity leave, cash and medical benefits, employment security and non-discrimination for women and newborns.
Midwives authorised to administer a core set of life-saving interventionsMidwives are the primary skilled care providers at birth in many countries. Often, though, they are not authorised to perform life-saving skills that can affect the survival of the mother or her newborn. As early as 1997 global guidelines called for authorising midwives, among others, to perform a set of signal functions.63 Essential care for women and newborns requires that midwives be authorised to administer perenteral antibiotics, perenteral oxytocics and perenteral anticonvulsants, to manually remove the placenta, to remove retained products of conception, to assist with vaginal delivery and to resuscitate newborns.
Of the 68 Countdown priority countries, 27 reported having a policy authorising midwives to perform these seven functions, 25 countries reported having a policy allowing midwives to perform part of them and 5 reported having no policy. For 11 countries no data were available.
Emergency obstetric care service availabilityThree-quarters of maternal deaths are caused by direct obstetric complications including haemorrhage, sepsis, eclampsia and prolonged or obstructed labour.64 The occurrence of these life-threatening complications is unpredictable and often unpreventable. But nearly all deaths from these causes can be averted through timely and appropriate intervention with quality emergency obstetric care, including caesarean section. It is critical that all pregnant women have access both to a basic emergency obstetric care facility for the seven signal functions (administer perenteral
Progress on Three Key Policies
Source: Compiled by WHO and UNICEF, 2008
Figure 3.17. Progress in implementing three policies (International Code of Marketing of Breastmilk Substitutes, low osmolarity oral rehydration salts and zinc supplementation and community treatment of pneumonia with antibiotics) in the 68 Countdown priority countries (2005–2007)
0 10 20 30 40 45
International Code ofMarketing of Breastmilk
2005
International Code ofMarketing of Breastmilk
2007
Low osmolarity ORSand zinc supplement for
management of diarrhoea2005
Low osmolarity ORSand zinc supplement for
management of diarrhoea2007
Community managementof pneumonia with
antibiotics 2007
Community managementof pneumonia with
antibiotics 2005
YesPartialNoNo dataNo. of countries not included
TRACKING PROGRESS IN MATERNAL, NEWBORN & CHILD SURVIVAL THE 2008 REPORT
43
antibiotics, perenteral oxytocics and perenteral anticonvulsants, manually remove the placenta, remove retained products of conception, assist with vaginal delivery and resuscitate newborns) and, if needed, a comprehensive emergency obstetric care facility that can also perform caesarean section and blood transfusion.
The availability of emergency obstetric care services provides one measurement of a health system’s capacity to prevent both maternal and newborn deaths. For every 500,000 people it is recommended to provide at least five basic emergency obstetric care facilities, of which at least one should also offer comprehensive emergency obstetric care.65 The geographic distribution of such facilities should ensure access for all women, not only those living in a few regions or urban centers.
The emergency obstetric care availability data in this report come from government surveys conducted with support from agencies and organisations such as UNICEF, the United Nations Population Fund, the World Health Organization and the Averting Maternal Death and Disability Program at Columbia University. The data are reported as percentages of needed facilities based on country populations. Data on geographic distribution, though available for several countries, are not reported.
Twenty-seven countries had comparable data that the Countdown could use. Of those 27, 11 had at least half of the recommended minimum number of functioning emergency obstetric care facilities. The remaining 16 countries with comparable and usable data had between 14 per cent and 48 per cent of the minimum. Even without knowing the geographical distribution of facilities within countries, one can see that a much greater investment is needed for emergency obstetric care services to reach all the women who need them. (Eighteen countries either had conducted smaller assessments, had not yet analysed their data or had conducted different types of facility surveys that were not comparable. For 23 other countries no data were available.)
All countries should be encouraged to conduct a national assessment and to routinely collect information on the signal functions and the availability, functioning and quality of care at emergency obstetric care facilities. It is expected that this set of indicators will be integrated into national health information systems so that the availability and quality of these services can be monitored more regularly.
Notification of maternal death
Maternal death is a rare event. It is also a very sensitive indicator of the health system functionality. A national policy requiring specific notification of maternal deaths can be a powerful instrument to examine the quality and responsiveness of health services and to help identify critical barriers in the continuum of care. In this cycle of the Countdown, 23 countries reported having a policy requiring notification of maternal death, 14 countries reported having a policy but no systematic implementation, and 18 countries reported having no such policy. No information was available for 13 countries.
Integrated management of childhood illness adapted to cover newborns 0–1 week oldA cost-effective way to diagnose and treat children with common illnesses, the integrated management of childhood illness approach (IMCI) has been adopted by over 100 countries. The first generic version of its guidelines was developed for children up to five years of age; it did not address newborns in the first week of life. Based on new evidence, revised generic guidelines have been promoted since 2006 to cover infants 0–2 months old.66
In this Countdown cycle, 39 of the 68 priority countries reported having national guidelines covering infants in the first week of life, in line with the generic guidelines. Three countries reported having partial adaptations for young infants; 21 reported having no such adaptations.
Low osmolarity oral rehydration salts and zinc supplementationStrong evidence demonstrating the effectiveness of both a new, low osmolarity formulation of oral rehydration solution (oral rehydration salts) and zinc supplementation in reducing the duration and incidence and severity of diarrhoeal episodes resulted in an international call for action to countries to adopt the new guidelines and intensify efforts to increase coverage for oral rehydration therapy.67 By the end of 2007, 34 Countdown priority countries had adopted the new guidelines and 17 had adopted one of the two improved interventions (either low osmolarity oral rehydration salts or zinc supplementation but not both), while 10 had not changed their policy to reflect the new technical advances. That was a marked improvement from 2005, when just 6 of 50 priority countries had adopted the new policy and 36 reported no policy (figure 3.17).
Although it might be too early to find nationwide increases in coverage for low osmolarity oral rehydration salts in countries that have updated their policy, future progress should be tracked to assess whether and how policy changes can affect coverage

TRACKING PROGRESS IN MATERNAL, NEWBORN & CHILD SURVIVAL THE 2008 REPORT
44
for an intervention.
Community treatment of pneumonia with antibioticsPneumonia remains the leading killer of children under five years of age.68 As table 3.5 shows, coverage levels for careseeking and the treatment of pneumonia with an effective antibiotic are alarmingly low in most of the 68 Countdown priority countries. Community health workers can manage uncomplicated pneumonia effectively and bring treatment closer to the home. In 2004, the World Health Organization and UNICEF called on countries to adopt and promote policies that would support community health workers in identifying and treating pneumonia, while improving service at first-level heath facilities.69
In 2005, of 60 Countdown priority countries, 16 had policies authorising community health workers to identify and manage pneumonia; 2 had no policies, but were implementing the approach in selected geographic areas; 41 explicitly prohibited community-based pneumonia management (one country lacked data). For the 2008 Countdown, 18 of 68 priority countries reported having community case management policies; 11 reported having no policies, but some implementation of the approach in selected areas; 31 reported having no policies or explicit prohibitions (figure 3.17). Country respondents to the Countdown survey offered reasons for the lack of progress, focusing on the complexities of decisions about which cadres of health providers would be permitted to administer antibiotics.
Costed implementation planFor the 2008 Countdown, 31 countries reported having developed costed implementation plans for maternal, newborn and child health; 18 countries reported having partial plans that were either not costed or did not cover the entire continuum of care; 14 countries indicated having no such plans. Information was not available for 5 countries. Interpretations of this indicator varied between countries, since in some an investment case has been made for achieving the Millennium Development Goals while in others it has not. For countries in which it has not, the indicator was rated as full when medium-term plans and related programme costs were available.
Human resources and financing
Density of health workers per 1,000 peopleThe World Health Organization estimates that to ensure adequate coverage for basic maternal and child health services, at least 2.5 health workers are needed per 1,000 people. Results from global databases that
include both facility- and community-based health workers show that in 54 out of the 68 Countdown priority countries (80 per cent), the numbers of such workers are too few to improve country prospects for achieving the health-related Millennium Development Goals.
There is no demonstrated association between health worker density and coverage for interventions. But these data show that many countries are facing a health worker crisis that could obstruct coverage increases.
Per capita total expenditure on healthIt has been estimated that less than $45 per capita total expenditure on health is insufficient to ensure access to a very basic set of needed services. Among the 68 Countdown priority countries, 21 had a total per capita expenditure smaller than $45.
General expenditure on health as a percentage of total expenditureThis indicator reflects government commitment to health. While there is no threshold, African heads of state have made a commitment to allocate at least 15 per cent of the overall budget to health. An ideal target, it has only been achieved by 7 of the 68 Countdown priority countries.
Out-of-pocket expenditure as a percentage of total expenditureVery high out-of-pocket payments prevent many people from seeking care. And they impoverish households. Where such payments comprise less than 15 per cent of total health spending, very few households tend to be harmed by catastrophic payments. Of the 68 Countdown priority countries, only 6 have a rate of out-of-pocket payments of less than 15 percent.
Financial flows to maternal, newborn and child health
The Countdown Financial Flows Working Group developed two new indicators for use in monitoring progress across the 68 priority countries: official development assistance to child health per child and official development assistance to maternal and neonatal health per live birth. Both indicators are included in the 2008 country profiles, with estimates for 2005.
The two new indicators are presented next to more
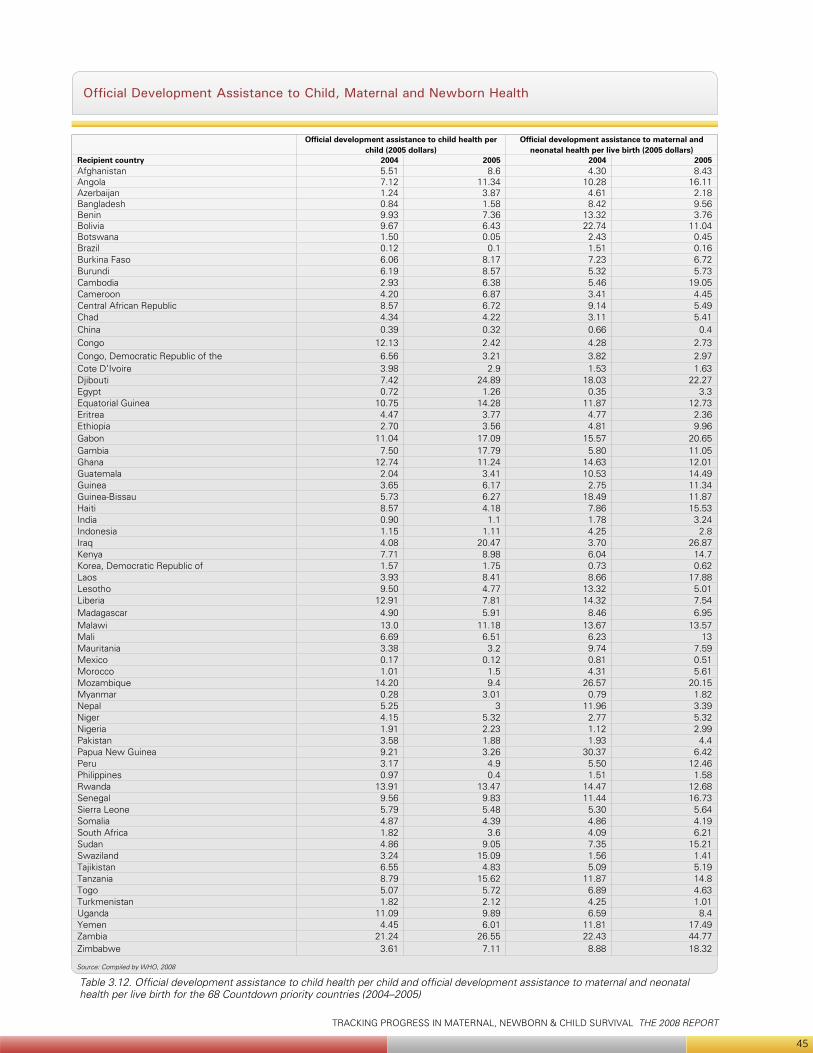
TRACKING PROGRESS IN MATERNAL, NEWBORN & CHILD SURVIVAL THE 2008 REPORT
45
Official Development Assistance to Child, Maternal and Newborn Health
Table 3.12. Official development assistance to child health per child and official development assistance to maternal and neonatal health per live birth for the 68 Countdown priority countries (2004–2005)
Source: Compiled by WHO, 2008
Official development assistance to child health per child (2005 dollars)
Official development assistance to maternal and neonatal health per live birth (2005 dollars)
Recipient country 2004 2005 2004 2005Afghanistan 5.51 8.6 4.30 8.43Angola 7.12 11.34 10.28 16.11Azerbaijan 1.24 3.87 4.61 2.18Bangladesh 0.84 1.58 8.42 9.56Benin 9.93 7.36 13.32 3.76Bolivia 9.67 6.43 22.74 11.04Botswana 1.50 0.05 2.43 0.45Brazil 0.12 0.1 1.51 0.16Burkina Faso 6.06 8.17 7.23 6.72Burundi 6.19 8.57 5.32 5.73Cambodia 2.93 6.38 5.46 19.05Cameroon 4.20 6.87 3.41 4.45Central African Republic 8.57 6.72 9.14 5.49Chad 4.34 4.22 3.11 5.41China 0.39 0.32 0.66 0.4Congo 12.13 2.42 4.28 2.73Congo, Democratic Republic of the 6.56 3.21 3.82 2.97Cote D’Ivoire 3.98 2.9 1.53 1.63Djibouti 7.42 24.89 18.03 22.27Egypt 0.72 1.26 0.35 3.3Equatorial Guinea 10.75 14.28 11.87 12.73Eritrea 4.47 3.77 4.77 2.36Ethiopia 2.70 3.56 4.81 9.96Gabon 11.04 17.09 15.57 20.65Gambia 7.50 17.79 5.80 11.05Ghana 12.74 11.24 14.63 12.01Guatemala 2.04 3.41 10.53 14.49Guinea 3.65 6.17 2.75 11.34Guinea-Bissau 5.73 6.27 18.49 11.87Haiti 8.57 4.18 7.86 15.53India 0.90 1.1 1.78 3.24Indonesia 1.15 1.11 4.25 2.8Iraq 4.08 20.47 3.70 26.87Kenya 7.71 8.98 6.04 14.7Korea, Democratic Republic of 1.57 1.75 0.73 0.62Laos 3.93 8.41 8.66 17.88Lesotho 9.50 4.77 13.32 5.01Liberia 12.91 7.81 14.32 7.54Madagascar 4.90 5.91 8.46 6.95Malawi 13.0 11.18 13.67 13.57Mali 6.69 6.51 6.23 13Mauritania 3.38 3.2 9.74 7.59Mexico 0.17 0.12 0.81 0.51Morocco 1.01 1.5 4.31 5.61Mozambique 14.20 9.4 26.57 20.15Myanmar 0.28 3.01 0.79 1.82Nepal 5.25 3 11.96 3.39Niger 4.15 5.32 2.77 5.32Nigeria 1.91 2.23 1.12 2.99Pakistan 3.58 1.88 1.93 4.4Papua New Guinea 9.21 3.26 30.37 6.42Peru 3.17 4.9 5.50 12.46Philippines 0.97 0.4 1.51 1.58Rwanda 13.91 13.47 14.47 12.68Senegal 9.56 9.83 11.44 16.73Sierra Leone 5.79 5.48 5.30 5.64Somalia 4.87 4.39 4.86 4.19South Africa 1.82 3.6 4.09 6.21Sudan 4.86 9.05 7.35 15.21Swaziland 3.24 15.09 1.56 1.41Tajikistan 6.55 4.83 5.09 5.19Tanzania 8.79 15.62 11.87 14.8Togo 5.07 5.72 6.89 4.63Turkmenistan 1.82 2.12 4.25 1.01Uganda 11.09 9.89 6.59 8.4Yemen 4.45 6.01 11.81 17.49Zambia 21.24 26.55 22.43 44.77Zimbabwe 3.61 7.11 8.88 18.32
TRACKING PROGRESS IN MATERNAL, NEWBORN & CHILD SURVIVAL THE 2008 REPORT
46
established general health expenditure indicators. Unlike the coverage indicators, there is little agreement on what makes a funding target desirable or adequate. The evidence points broadly towards a substantial funding gap in maternal, newborn and child health in developing countries, which must be filled partly by increased funding from donors.70
While acknowledging the unpredictability of international aid, the authors of this report make a tentative assessment of progress to increase official development assistance to maternal, newborn and child health by making a comparison across years. Table 3.12 presents estimates of the two official development assistance indicators by country for 2004–2005, expressed in constant 2005 dollars. The volume of official development assistance to child, newborn and maternal health increased by 28 per cent worldwide in 2005, representing increases of 49 per cent in official development assistance to child health and 21 per cent in official development assistance to maternal and newborn health. Of the 68 Countdown countries, 38 experienced increases in official development assistance to child health per capita in 2005; 39 countries also saw official development assistance to maternal and newborn health per live birth rise from 2004–2005. The Countdown Financial Flows Working Group is doing further statistical analysis of aid flow determinants.
Conclusions and recommendations
This second Countdown report, issued three years after the first report of findings at the 2005 conference,71 documents what can be done and what needs to be done. Coverage for selected interventions – such as vitamin A supplementation and the use of insecticide-treated bed nets to prevent malaria – has increased rapidly in many countries, but not in all. And coverage levels for other interventions have stagnated or even deteriorated. Examining country-by-country progress can yield important knowledge about hindrances to progress, spurring further action.
The power of the Countdown depends on the quality of the coverage data in the priority countries. Let us be the first to say that many improvements can and should be made in defining indicators, measuring them and interpreting the results. We, better than most, recognise that there is an urgent technical agenda to be pursued in strengthening the measurement of coverage. But do the methodological weaknesses invalidate the massive amounts of information presented in the country profiles? We believe not. Millions of person-hours have been invested in defining measurement strategies, developing protocols, visiting randomly selected villages and knocking on
doors to ask family members to participate in building an information base sufficient to guide policy. The answers have been recorded, checked, summarised, shared and interpreted in districts and capital cities throughout the world. If there is a better way to do things, let’s do it together – not just as a ‘community of practice,’ aiming at improving the health of women and children, but also as scientists wanting a fuller understanding and as policy makers and programme managers hoping to learn more about how to make programmes and services more effective.
The Countdown is an informal ‘community of practice’ that brings together information and interprets it for several purposes: for science, for policy and governance, for better development assistance and for easier access and ownership by women and children. Any conclusions drawn from the information in these pages is in a sense premature, since a full understanding requires more input from those working to achieve high, sustained and equitable coverage in individual countries, districts and communities. But the community of practice also includes those responsible for the international Countdown movement. In that spirit we present a summary of what we see as the most important conclusions of this Countdown cycle and what those conclusions might mean for the immediate next steps towards the health-related Millennium Development Goals.
Country representatives who participate in the April, 2008 Countdown conference in Cape Town, South Africa will issue a statement. We see that statement as a companion to this section and an essential complement to the remainder of the chapter.
Preliminary conclusions proposed by the Countdown Core Group
Countries, while rapidly increasing coverage for some interventions, are making little or no progress with others. Coverage trends are most promising for many preventive interventions, such as vitamin A supplementation, immunisation (including measles, neonatal tetanus protection, Hib3 and DPT3) and insecticide-treated bed nets to prevent malaria. But progress is lagging for most curative interventions and interventions requiring 24-hour service availability, such as antenatal, postnatal and delivery care or treatment for pneumonia, diarrhoea and malaria. Postnatal care is an especially important gap in the first week of life when mothers and newborns are at the highest risk. Progress on nutrition indicators requiring behavioural and social change – such as exclusive breastfeeding and complementary feeding practices – is mixed and often insufficient.
TRACKING PROGRESS IN MATERNAL, NEWBORN & CHILD SURVIVAL THE 2008 REPORT
47
The continuum of care for maternal, newborn and child health requires multiple delivery approaches. Progress towards the Millennium Development Goals will require a range of interventions to be delivered in different points in the life-cycle. Services that contribute to the achievement of one Millennium Development Goal will not necessarily advance progress towards another. Of particular concern today is a serious breakdown in the continuum of care at several points in the pre-pregnancy to two-year postnatal period when opportunities to deliver essential services are being lost.
Undernutrition is an area of little or no progress. More than one-third of deaths in children under age five are attributable to undernutrition – the underlying cause of 3.5 million child deaths annually. And maternal undernutrition increases the mother’s risk of death at delivery, accounting for at least 20 per cent of such deaths.72 In 33 of the 68 priority countries, at least 20 percent of children are moderately or severely underweight, and 62 countries have stunting prevalence rates exceeding 20 per cent.
Weak health systems and broader contextual factors obstruct progress. Health systems in many countries cannot now deliver essential interventions and approaches widely or well enough to reduce mortality nationwide. Indicators of health financing and health worker density are useful markers of health system strength. Of the 68 Countdown priority countries, 54 – or 80 percent – have workforce densities below the critical threshold for improved prospects for achieving the health-related Millennium Development Goals. It has been estimated that annual per capita total health expenditures of less than $45 are insufficient to ensure access to a very basic set of needed services. Of the 68 priority countries, 21 had less than $45. In addition, 11 out of the 12 countries with reversed progress towards Millennium Development Goal 4, contextual challenges – such as armed conflict, high HIV burdens and low female literacy rates – contribute to stagnating or deteriorating coverage.
Inequities obstruct progress. Mortality in children under age five is now concentrated in sub-Saharan Africa (almost 50 per cent) and South Asia (30 per cent).73 Maternal and newborn mortality are similarly concentrated in those regions. Meanwhile, the inequity analyses show that within countries the richest quintile is gaining access to key interventions more quickly than the poorest.74 Reducing both types of inequity – between regions and within countries – is a crucial part of achieving the health-related Millennium Development Goals.
Aid needs to increase and become more predictable. Overseas development assistance to child, newborn and maternal health increased by 28 percent from 2004 to 2005, including increases of 49 per cent to child health and 21 per cent to maternal and newborn health. Such aid for maternal, newborn and child health and nutrition has increased in most Countdown priority countries, but has decreased in some. Of the 68 countries, 38 received more per capita official development assistance to child health, and 39 received more to maternal and newborn health per live birth, in 2005 than in 2004.
Countries need more and better coverage estimates and research on local implementation. Since the first Countdown report in 2005, an unprecedented amount of household surveys have been conducted and include new MICS data from 54 countries and new DHS data for 35 countries. However, many countries are still determining coverage levels for essential interventions using data that is 5, 10 or even 15 years old. In consequence, the knowledge gained through current and ongoing efforts to promote maternal, newborn and child health and nutrition has not been adequately disseminated. The Countdown is drawing attention to the fact that data collection and dissemination need improvement to make timely data more readily available, which is crucial for planning and implementation.
TRACKING PROGRESS IN MATERNAL, NEWBORN & CHILD SURVIVAL THE 2008 REPORT
48
The Countdown call to action
All people involved in the Countdown, who together constitute a ‘community of practice’ for achieving the health-related Millennium Development Goals, are encouraged to use the Countdown results and products to improve their effectiveness in reducing mortality and improving nutrition among women, newborns and children – each in their own way, applying their diverse skills and resources.
Participants in this round of data review for the Countdown effort identified the following immediate actions to be promoted and discussed at the second international Countdown conference, Cape Town, South Africa, 17–19 April 2008.
Sustain and expand successful efforts to • achieve high and equitable coverage for priority interventions. Recent areas of progress – especially immunisations, vitamin A supplementation and insecticide-treated bed nets – represent a major success for governments and their development partners. Such efforts should continue. But comparable efforts and investments are required for childbirth care and the case management of childhood illness.
Focus on the priority period within the • continuum of care, from pre-pregnancy through 24 months – especially around the time of birth. To reduce mortality during childbirth and in newborns, programming efforts must focus on the effective and integrated delivery of interventions and approaches associated with this crucial period. Examples include contraceptive services, antenatal, delivery, and postnatal care and infant feeding practices.
Within increased efforts to achieve the health-• related Millennium Development Goals, make improving maternal and child nutrition a priority. Nutrition must be central to both national and subnational development strategies.
Strengthen health systems, focusing on • measurable results. Health systems need to deliver on demand, creating a functional continuum of care over time and in different places. All new initiatives must focus on outcomes that measurably advance this aim.
Set geographic and population priorities• , and stick to them. The health-related Millennium Development Goals cannot be met globally without faster progress in sub-Saharan Africa and South Asia. Development efforts and official development assistance must increasingly target countries in these regions with large populations and poor performance.
Programme for equity• . Describing inequities, though an important first step, is not enough. Programmatic efforts to address inequities must be supported by strong monitoring and evaluation activities.
Do even more to ensure predictable long-• term aid flows for maternal, newborn and child health. Governments and their development partners cannot meet the health-related Millennium Development Goals unless assistance is adequate, predictable and targeted to those goals.
Monitor. Evaluate. Conduct locally driven • implementation research. And act on the results. The ‘community of practice’ for maternal, newborn and child health must lead the change by improving monitoring, evaluation and dissemination. Lead the change for maternal, newborn • and child survival. It is time for all to work together as partners to improve the lives of women, newborns and children.
TRACKING PROGRESS IN MATERNAL, NEWBORN & CHILD SURVIVAL THE 2008 REPORT
49
Notes1 Boerma, Bryce, Kinfu and others (forthcoming).
2 Graham, Bell and Bullough 2001, pp.97–129; WHO, UNICEF, UNFPA and AMDD 2006.
3 UNICEF 2007b.
4 Lawn, Cousens and Zupan 2005.
5 Ibid.
6 Stanton, Lawn, Rahman and others 2006.
7 Black, Allen, Bhutta and others 2008.
8 World Bank 2006.
9 United Nations n.d.
10 Black, Allen, Bhutta and others 2008.
11 Ibid.
12 WHO 2006a.
13 Bhutta, Ahmed, Black and others 2008.
14 Black, Allen, Bhutta and others 2008.
15 Blanc and Wardlaw 2005.
16 UNICEF and WHO 2004.
17 UNICEF 2007c.
18 Victora, Adair, Fall and others 2008.
19 UNICEF n.d.
20 Measure DHS, MACRO International, Inc. n.d.
21 Bryce, Coitinho, Darnton-Hill and others 2008.
22 WHO and UNICEF 2003.
23 Bhutta, Ahmed, Black and others 2008.
24 Black, Allen, Bhutta and others 2008.
25 Bhutta, Ahmed, Black and others 2008.
26 Black, Allen, Bhutta and others 2008.
27 Bhutta, Ahmed, Black and others 2008; Bryce, Coitinho, Darnton-Hill and others 2008.
28 Arimond, Daelmans and Dewey 2008.
29 UNICEF 2007c.
30 UNICEF 2007d.
31 Dabbagh, Gacic-Dobo, Wolfson and others 2007.
32 UNICEF 2007b.
33 Ibid.
34 WHO 2006b.
35 Waddington, Martin, Walford and others 2005.
36 WHO 2007a.
37 UNICEF and Roll Back Malaria 2007.
38 UNICEF 2007b
39 Ibid.
40 UNICEF 2006a; Wardlaw, Salama, Johansson and others 2006.
41 Bryce, Boschi-Pinto, Shibuya and others 2005; WHO 2007b.
42 Bryce, Boschi-Pinto, Shibuya and others 2005.
43 Cleland, Bernstein, Ezeh and others 2006.
44 WHO and UNICEF 2003.
45 United Nations 2008a.
46 WHO 2007a.
47 UNICEF and Roll Back Malaria 2007.
48 Graham, Bell and Bullough 2001, pp.97-129; WHO, UNICEF, UNFPA and AMDD 2006.
49 UNICEF 2007b.
50 UNICEF, WHO and UNFPA 1997.
51 Villar, Carroli and Zavaleta 2007.
52 Lawn, Cousens and Zupan 2005.
53 Darmstadt, Bhutta, Cousens 2005.
54 Baqui, Ahmed, Arifeen and others n.d.
55 Baqui, Ahmed, Arifeen and others 2007.
56 Lawn, and Kerber 2006.
57 Tinker, ten Hoope-Bender, Azfar and others 2005; Kerber, de Graft-Johnson, Bhutta and others 2007.
58 Travis, Bennett, Haines and others 2004.
59 UNICEF 2007b.
60 WHO and UNICEF 2003.
61 Bryce, Terreri, Victora 2006.
62 ILO 2007.
63 UNICEF, WHO and UNFPA 1997.
64 Khan, Wojdyla, Say and others 2006; Ronsmans and Graham 2006.
65 UNICEF, WHO and UNFPA 1997.
66 The Young Infants Clinical Signs Study Group 2008.
67 WHO and UNICEF 2004.
68 Wardlaw, Salama, Johansson and others 2006.
69 WHO and UNICEF 2006.
70 Johns, Sigurbjörnsdóttir, Fogstad and others 2007; Stenberg, Johns, Scherpbier and others 2007; Greco, Powell-Jackson, Borghi and others (forthcoming).
71 Bryce, Terreri, Victora and others 2006.
72 Black, Allen, Bhutta and others 2008.
73 UNICEF 2007b.
74 Victora, Wagstaff, Armstrong-Schellenberg and others 2003.
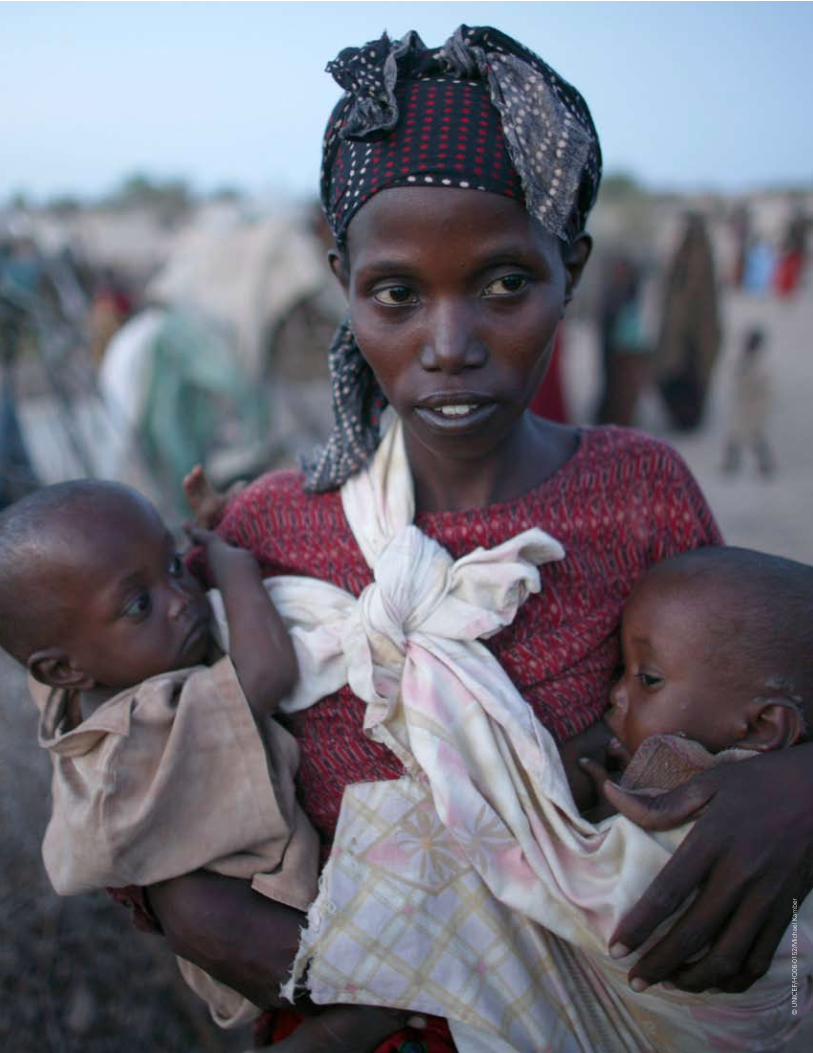
TRACKING PROGRESS IN MATERNAL, NEWBORN & CHILD SURVIVAL THE 2008 REPORT
50
© U
NIC
EF/H
Q06
-015
2/M
icha
el K
ambe
r
TRACKING PROGRESS IN MATERNAL, NEWBORN & CHILD SURVIVAL THE 2008 REPORT
188
ReferencesAl Gasseer, N., E. Dresden, G.B Keeney and others. 2004. “Status of women and infants in complex humanitarian emergencies.” Journal of Midwifery & Women’s Health 49(4, Supplement 1): 7–13.
Arimond, M, B. Daelmans and K. Dewey. 2008. “Indicators for feeding practices in children.” Lancet 371(9612): 541–42.
Baqui, A., S. Ahmed, S. Arifeen and others. 2007. “Effect of timing of first postnatal care home visit on neonatal mortality: An observational study” (working paper). Department of International Health, John Hopkins Bloomberg School of Public Health, Baltimore, Md., and the International Centre for Diarrhoeal Disease Research, Bangladesh.
Black, R.E., L.H. Allen, Z.A. Bhutta and others. 2008. “Maternal and child undernutrition: global and regional exposures and health consequences.” Lancet 371(9608): 243–60.
Black, R.E., S.S. Morris and J. Bryce. 2003. “Where and why are 10 million children dying every year?” Lancet 361(9351): 2226–34.
Blanc, A., and T. Wardlaw. 2005. “Monitoring low birthweight: an evaluation of international estimates and updated estimation procedure.” Bulletin of the World Health Organization 83(3):178–85.
Bhutta, Z.A., T. Ahmed, R.E Black and others. 2008. “What works? Interventions for maternal and child undernutrition and survival.” Lancet 371(9610):417–40.
Boerma, J.T. J. Bryce, Y. Kinfu and others. (forthcoming). “Mind the Gap: Equity and trends in coverage of maternal, newborn and child health services in 54 Countdown countries.” Lancet.
Bryce, J., S. Arifeen, G. Pariyo and others. 2003. “Reducing child mortality: Can public health deliver?” Lancet 362(9351): 159–64.
Bryce, J., C. Boschi-Pinto, K. Shibuya and others. 2005. “WHO estimates of the causes of death in children.” Lancet 365:1147–152.
Bryce, J., D. Coitinho, I. Darnton-Hill and others. 2008. “Maternal and child undernutrition: effective action at national level.” Lancet 371(9611): 510–26.
Bryce, J., N. Terreri, C.G. Victora and others. 2006. “Countdown to 2015: tracking intervention coverage for child survival.” Lancet 368: 1067–76.
Blanc, A., and T. Wardlaw. 2005. “Monitoring low birthweight: an evaluation of international estimates and an updated estimation procedure.” Bulletin of the World Health Organization 83(3): 178–85.
Campbell, O., and W. Graham. 2006. “Strategies for reducing maternal mortality: getting on with what works.” Lancet 368: 1284–99.
Cleland, J., S. Bernstein, A. Ezeh and others. 2006. “Family planning: the unfinished agenda.” Lancet 368: 1810–27.
Dabbagh, A., M. Gacic-Dobo, L. Wolfson and others 2007. “Progress in Global Measles Control and Mortality Reduction, 2000–2006.” MMWR 56(47): 1237–41.
Darmstadt, G.L., Z.A. Bhutto, S. Cousens and others. 2005. “Evidence-based, cost-effective interventions: how many newborn babies can we save?” Lancet 365: 977–88.
Engle, P.L., M.M Black, J.R. Behrman and others. 2007. “Strategies to avoid the loss of developmental potential in more than 200 million children in the developing world.” Lancet 369(9557): 229–42.
Filmer, D., and L.H. Pritchett. 2001. “Estimating wealth effects without expenditure data—or tears: an application to educational enrollments in states of India.” Demography 38(1): 115–32.
Freedman, L., W. Graham, E. Brazier and others. 2007. “Practical lessons from global safe motherhood initiatives: time for a new focus on implementation.” Lancet 370:1383–91.
Glasier, A., A.M. Gülmezoglu, G.P. Schmid and others. 2006. “Sexual and reproductive health: a matter of life and death.” Lancet 368: 1595–607.
Glewwe, P. 1999. “Why Does Mother’s Schooling Raise Child Health in DevelopingCountries? Evidence from Morocco.” Journal of Human Resources 34(1):124–159.
Graham, W.J., J.S. Bell and C.H.W. Bullough. 2001. “Can skilled attendance at delivery reduce maternal mortality in developing countries?” In V. de Brouwere and W. van Lerberghe, eds., Safe motherhood strategies: a review of the evidence . Antwerp: ITG Press, pp.97–129.
Grantham-McGregor, S., Y.B. Cheung, S. Cueto and others. 2007. “Developmental potential in the first 5 years for children in developing countries.” Lancet 369: 60–70. Greco, G., T. Powell-Jackson, J. Borghi and others. Forthcoming. “Economic and Financial Analysis of Scaling Up Child, Newborn and Maternal Health.” Lancet (special issue Countdown 2008).
Grimes, D.A., J. Benson, S. Singh and others. 2006. “Unsafe abortion: the preventable pandemic.” Lancet 368: 1908–19.
Gwatkin, D.R., A. Bhuiya and C.G. Victora. 2004. “Making health systems more equitable.” Lancet 364(9441): 1273–80.
Gwatkin, D.R., S. Rutstein, K. Johnson and others. 2007. “Socio-economic differences in health, nutrition, and population within developing countries” (overview report). World Bank, Washington, D.C. http://siteresources.worldbank.org/INTPAH/Resources/IndicatorsOverview.pdf
Haines A. and C. Victora. 2004. “Evidence-based action needed on health systems.” Lancet 364(9441): 1204.
Hill, K., K. Thomas, C. AbouZahr and others. 2007. “Estimates of maternal mortality worldwide between 1990 and 2005: an assessment of available data.” Lancet 370(9595): 1311–19.
Hongoro, C., and B. McPake. 2004. “How to bridge the gap in human resources for health.” Lancet 364(9443): 1451–56.
IDS (International Development Statistics). n.d. Online databases. [www.oecd.org/dac/stats/idsonline]. 19 February 2008.
Johns, B., K. Sigurbjörnsdóttir, H. Fogstad and others. 2007. “Estimated global resources needed to attainuniversal coverage of maternal and newborn health services.” Bulletin of the World Health Organization; 85(4): 256–63.
Jones, G., R. Steketee, R.E. Black and others. 2003. “How many child deaths can we prevent this year?” Lancet 362: 65–71.
Kerber, K.J., J.E. de Graft-Johnson, Z.A. Bhutta and others. 2007. “Continuum of care for maternal, newborn, and child health: from slogan to service delivery.” Lancet 370(9595): 1358–69.
Khan, K.S., D. Wojdyla, L. Say and others. 2006. “WHO analysis of causes of maternal deaths: a systematic review.” Lancet 367: 1066–74.
Knippenberg, R., J.E. Lawn, G.L. Darmstadt and others. 2005. “Systematic scaling up of neonatal care in countries.” Lancet 365: 1087–98.
Lavis, J.N., F.B. Posada A. Haines and others. 2004. “Use of research to inform public policymaking.” Lancet 364(9445): 1615–21.
Lawn, J.E., S. Cousens and J. Zupan. 2005. “4 million neonatal deaths: When? Where? Why?” Lancet 365: 891–900.
Lawn, J.E., and K. Kerber, eds. 2006. Opportunities for Africa’s Newborns: practical data, policy and programmatic support for newborn care in Africa. Cape Town: Partnership for Maternal Newborn and Child Health, Save the Children, UN Population Fund, UN Children’s Fund, United States Agency for International Development, World Health Organization.
Low, N., N. Broutet, Y. Adu-Sarkodie and others. 2006. “Global control of sexually transmitted infections.” Lancet 368: 2001–16.
Martines, J., V.K. Paul Z.A. Bhutta and others. 2005. “Neonatal Survival: a call for action.” Lancet 365: 1189–97.
Measure DHS, MACRO International, Inc. n.d. Demographic and Health Surveys. [http://www.measuredhs.com/aboutsurveys/dhs/start.cfm]. 8 February 2008.
Morris, S.S., B. Cogill, and R. Uauy. 2008. “Effective international action against undernutrition: why has it proven so difficult and what can be done to accelerate progress?” Lancet 371(9612): 608–21.
TRACKING PROGRESS IN MATERNAL, NEWBORN & CHILD SURVIVAL THE 2008 REPORT
189
Noji, E.K. 2000. “The public health consequences of disasters. Prehospital Disaster Medicine 15(4): 147–57.Ronsmans C., and Graham W. 2006. “Maternal mortality: who, when, where, and why?” Lancet 368: 1189–1200.
OFDA (Office of U.S. Foreign Disaster Assistance) and CRED (Collaborating Centre for Research on the Epidemiology of Disasters). 2007. Emergency Events Database (EM-DAT). Database. [http://www.em-dat.net/who.htm] 8 February 2008.
Palmer, N., D.H. Mueller, L. Gilson and others. 2004. “Health financing to promote access in low income settings—how much do we know?” Lancet 364(9442): 1365–70.
Pedersen D. 2002. “Political violence, ethnic conflict, and contemporary wars: broad implications for health and social well-being.” Social Science & Medicine 55(2): 175–90
Powell-Jackson, T., J. Borghi, D.H. Mueller and others. 2006. “Countdown to 2015: tracking donor assistance to maternal, newborn, and child health.” Lancet 368(9541): 1077–87.
Project Ploughshares. 2007. Armed Conflict Report 2007. Project Ploughshares, Waterloo, ON. [http://www.ploughshares.ca/libraries/ACRText/ACR-TitlePageRev.htm]. 16 March 2008.
Ronsmans, C., and W.J. Graham. 2006. “Maternal mortality: who, when, where, and why.” Lancet 368(9542):1189–200.
Rutstein, Shea O., and K. Johnson. 2004. The DHS Wealth Index. DHS Comparative Reports 6. Calverton, Md: ORC Macro.
Schell, C.O., M. Reilly, H. Rosling and others. 2007. “Socioeconomic determinants of infant mortality: a worldwide study of 152 low-, middle-, and high-income countries.” Scandinavian Journal of Public Health 35(3): 288–97.
Stanton, C., J.E. Lawn, H. Rahman and others. 2006. Stillbirth rates: delivering estimates in 190 countries. Lancet 367(9521): 1487–94
Starrs, A. 2007. “Delivering for women.” Lancet 370(9595): 1285–87.
Stenberg, K., B. Johns, R.W. Scherpbier and others. 2007. “A financial road map to scaling up essential child health interventions in 75 countries.” Bulletin of the World Health Organization 85(4): 305–14.
The Bellagio Study Group on Child Survival. 2003. “Knowledge into action for child survival.” Lancet 362(9351): 323–7.
The Young Infants Clinical Signs Study Group. 2008. “Clinical signs that predict severe illness in children under age 2 months: a multicentre study.” Lancet 371: 135–42.
Tinker A., P. ten Hoope-Bender, S. Azfar and others. 2005. “A continuum of care to save newborn lives.” Lancet 365: 822–25.
Travis, P., S. Bennett, A. Haines and others. 2004. “Overcoming health-systems constraints to achieve the Millennium Development Goals.” Lancet 364(9437): 900–6.
UNAIDS (United Nations Joint Programme on HIV/AIDS). 2007. AIDS Epidemic Update. Geneva.
UNAIDS (United Nations Joint Programme on HIV/AIDS) and WHO (World Health Organization). 2007. Global Aids Report 2007. Geneva.
United Nations. 2008a. UN Millennium Development Goals. [http://www.un.org/millenniumgoals/]. February 2008.———. 2008b. UN Millennium Development Goals Indicators. [http://unstats.un.org/unsd/mdg/Host.aspx?Content=Indicators/OfficialList.htm]. 9 February 2008.
UNICEF (United Nations Children’s Fund). 2004. The State of the World’s Children, 2005, Children under threat. New York.
———. 2006a. Pneumonia–The Forgotten Killer of Children. New York.
———. 2006b. The State of the World’s Children, 2007, Women and Children, the Double dividend of gender equity. New York.
———. 2007a. “A Report Card on Prevention of Mother-to-Child Transmission of HIV and Paediatric HIV Care and Treatment in Low- and Middle-Income Countries. Scaling up Progress from 2004 to 2005.” Working Paper. Expanded Inter-Agency Task Team (IATT) on Prevention of HIV Infection in Pregnant Women, Mothers and their Children,
UNICEF, New York.
———. 2007b. Progress for Children: A World Fit for Children Statistical Review. New York.
———. 2007c. The State of the World’s Children, 2008: Child Survival. New York.
———. 2007d. Vitamin A supplementation: A decade of progress. New York.
———. n.d. Multiple Indicator Cluster Surveys. [http://childinfo.org/]. 8 February 2008.UNICEF (United Nations Children’s Fund) and Roll Back Malaria. 2007. Malaria & children: Progress in intervention coverage. New York.
UNICEF (United Nations Children’s Fund) and WHO (World Health Organization). 2004. Low Birthweight - Country, Regional and Global Estimates. New York.
UNICEF (United Nations Children’s Fund), WHO (World Health Organization), and UNFPA (United Nations Populations Fund). 1997. Guidelines for monitoring the availability and use of obstetric services. New York. [http://www.who.int/reproductive-health/publications/unicef/monitoring_obstetric_services.pdf]. 18 February 2008.
UNICEF (United Nations Children’s Fund), WHO (World Health Organization), World Bank and UNPD (United Nations Development Programme). 2007. “Levels and trends of child mortality in 2006: Estimates developed by the Inter-Agency Group for Child Mortality Estimation” (working paper). [http://www.childinfo.org/areas/childmortality/methodology.php]. UNICEF, New York. 8 February.
Victora, C.G., L. Adair, C. Fall and others. 2008. “Maternal and child undernutrition: consequences for adult health and human capital.” Lancet 371(9609): 340–57.
Victora, C.G., J. Bryce, O. Fontaine and others. 2000. “Reducing deaths from diarrhoea through oral rehydration therapy.” Bulletin of the World Health Organization 78(10): 1246–55.
Victora C.G., B. Fenn, J. Bryce, and B.R. Kirkwood. 2005. “Co-coverage of preventive interventions and implications for child survival strategies: evidence from national surveys.” Lancet 366: 1460–66.
Victora, C.G., K. Hanson, J. Bryce and others. 2004. “Achieving universal coverage with health interventions.” Lancet 364(9444): 1541–48.
Victora, C.G., A. Wagstaff, J. Armstrong-Schellenberg and others. 2003. “Applying an equity lens to child health and mortality: More of the same is not enough.” Lancet 362(9351): 233–41.
Villar, J, G. Carroli, N. Zavaleta, and others. 2007. “Maternal and neonatal individual risks and benefits associated with caesarean delivery: multicentre prospective study.” BMJ 335(7628): 1025–36.
Waddington, C., J. Martin and V. Walford. 2005. “Trends in International Funding for Malaria Control.” Paper prepared for the Roll Back Malaria Partnership. http://www.rbm.who.int/docs/hlsp_report.pdf]. 9 February 2008.
Wagstaff A., and N. Watanabe. 2003. “What difference does the choice of SES make in health inequality measurement?” Health Economics 12: 885–90.
Walker, S.P., T.D. Wachs, J.M Gardner and others. 2007. “Child development: risk factors for adverse outcomes in developing countries.” Lancet 369(9556): 145–57.
Wardlaw, T., P. Salama, E.W. Johansson and others. 2006. “Pneumonia: the leading killer of children.” Lancet 368:1048–50.
Wellings, K., M. Collumbien, E. Slaymaker and others. 2006. “Sexual behaviour in context: a global perspective.” Lancet 368: 1706–28.
WHO (World Health Organization). 2006a. WHO Child Growth Standards: Length/height-for-age, weight-for-age, weight-for-length, weight-for-height and body mass index-for-age: methods and development. Geneva. [http://www.who.int/childgrowth/publications/technical_report_pub/en/index.html]. 19 February 2008.
———. 2006b. “WHO Position Paper on Haemophilus influenza type b conjugate vaccines.” Weekly Epidemiological Record 47(81): 445–52. [ http://www.who.int/wer]. 29 February 2008.
TRACKING PROGRESS IN MATERNAL, NEWBORN & CHILD SURVIVAL THE 2008 REPORT
190
———. 2007a. International Travel and Health, 2007. Geneva. [http://www.who.int/itn/en].
———. 2007b. World Health Statistics 2007. Geneva. WHO (World Health Organization) and UNICEF (United Nations Children’s Fund). 2003a. Antenatal care in developing countries: Promises, achievements and missed opportunities. Geneva.
———. 2003b. Global strategy for infant and young child feeding. Geneva. [http://www.who.int/nutrition/topics/global_strategy/en/]
———. 2004a. WHO–UNICEF Joint Statement on Management of Pneumonia in Community Settings. Geneva.
———. 2004b. WHO–UNICEF Joint Statement on Clinical management of acute diarrhoea. Geneva.
WHO (World Health Organization), UNICEF (United Nations Children’s Fund), UNFPA (United Nations Populations Fund) and AMDD (Averting Maternal Deaths and Disabilities Programme). 2006. Technical consultations on guidelines for monitoring the availability and use of obstetric services (summary report). Geneva. In preparation.
WHO (World Health Organization), UNICEF (United Nations Children’s Fund), UNFPA (United Nations Populations Fund) and World Bank. 2007. Maternal mortality in 2005: Estimates developed by WHO, UNICEF, UNFPA and the World Bank. Geneva.
World Bank. 2006. Repositioning nutrition as central to development: a strategy for large-scale action. Washington, D.C.
———. n.d. World Bank list of economies. Mimeograph. [http://siteresources.worldbank.org/DATASTATISTICS/Resources/CLASS.XLS] 2 Feb 2008.
World Bank, WHO (World Health Organization) and USAID (United States Agency for International Development). 2003. Guide to producing national health accounts: with special applications for low-income and middle income countries. Canada: WHO.
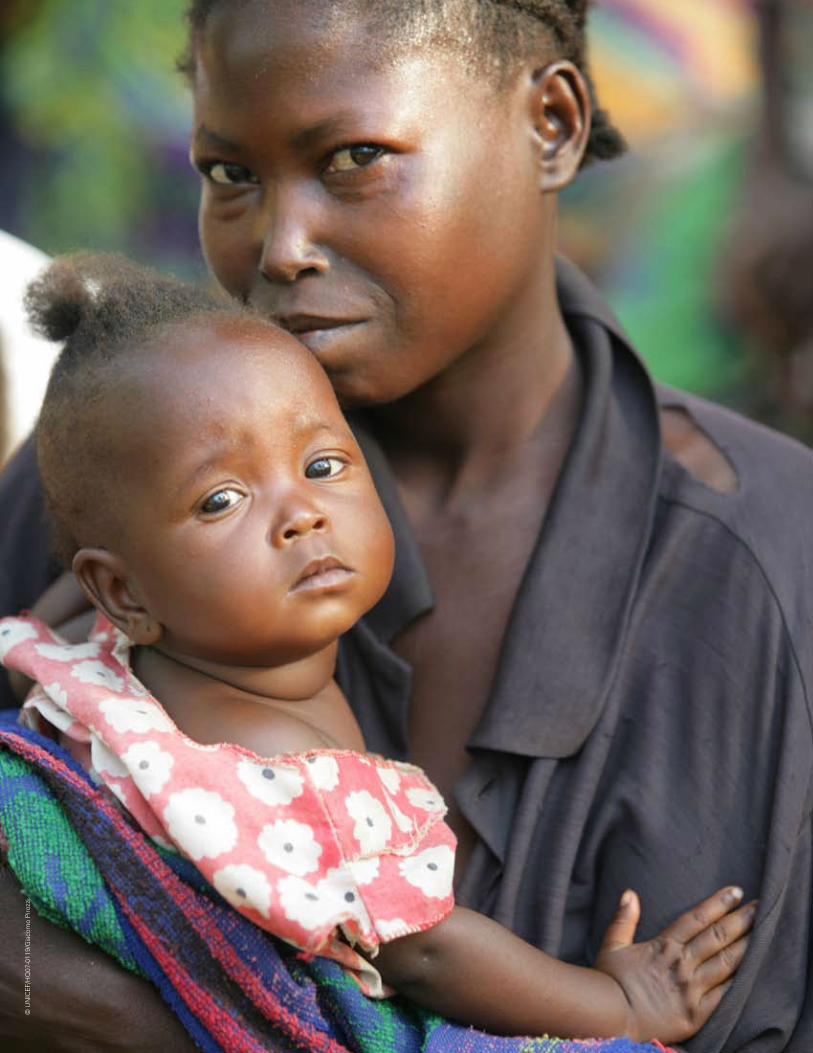
TRACKING PROGRESS IN MATERNAL, NEWBORN & CHILD SURVIVAL THE 2008 REPORT
191
© U
NIC
EF/H
Q07
-011
9/G
iaco
mo
Piro
zzi
TRACKING PROGRESS IN MATERNAL, NEWBORN & CHILD SURVIVAL THE 2008 REPORT
192
Annex A
Initiatives, resources and databases for monitoring progress towards the health-related Millennium Development Goals, with a special focus on maternal, newborn and child survival
This list is not comprehensive but includes important resources, reports and databases related to monitoring progress towards the Millennium Development Goals for women, newborns and children.
Reports
The State of the World’s Children is UNICEF’s flagship publication. Each year the report focuses on a key issue affecting children and provides a set of detailed statistical tables that include individual country and regional estimates on a range of key indicators for monitoring the situation of women and children in the world. The report’s focus in 2008 is child survival (http://www.unicef.org/sowc/). This publication is the primary source for the coverage estimates used in the Countdown.
Progress for Children (PFC) is a UNICEF flagship publication reporting on progress towards the Millennium Development Goals. The World Fit for Children (WFFC) Statistical Review was a special issue of PFC to report on progress towards the WFFC goals and targets included in the May 2002 Special Session of the United Nations General Assembly outcome document. Heads of state and government committed themselves to targets in vital areas of children’s well-being and development to be achieved by 2010, and UNICEF was specifically called upon to prepare a mid-decade progress report (http://www.unicef.org/publications/files/ Progress_for_Children_ No_6.pdf).
State of the World’s Mothers has been published by Save the Children each year since 1999, as a complement to UNICEF’s The State of the World’s Children report. This document brings together information on the world’s mothers and newborns, with the aim of bringing attention to the urgent need to reduce maternal and infant mortality around the world. The report also identifies countries that are succeeding in improving the health and saving the lives of women and babies and shows that effective solutions to this challenge are affordable – even in the world’s poorest countries. (http://www.savethechildren.org/publications/mothers/2006/SOWM_2006_final.pdf)
The World Health Report is published annually by the World Health Organization (World Health Organization) (http://www.who.int/whr). Each year the report combines an expert assessment of global health, including statistics relating to all countries, with a focus on a specific subject (in 2008, primary health care). Some of the data and benchmarks presented here on health policy and health systems, including human resources and financial flows, were taken from previous reports.
World Health Statistics Report (http://www.who.int/whosis): “This annual report presents comprehensive health data on all of the 193 World Health Organization Member States. The data, selected on the basis of quality and availability, relevance to global health, and comparability across member nations, cover over 50 core health indicators, which are organized into six major areas: mortality and burden of disease, health service coverage, risk factors, health system inputs, differentials in health outcome and coverage, as well as basic sociodemographic statistics.”
The World Development Report, published by the World Bank, aims to provide a “guide to the economic, social and environmental state of the world today” (http://go.worldbank.org/LOTTGBE9I0, accessed 2 February 2008). Each year the WDR provides in-depth analysis of a specific aspect of development. Past reports have considered such topics as youth, equity, public services delivery, the role of the state, transition economies, labour, infrastructure, health, the environment and poverty. The most recent report examines the role of agriculture in development.
The Global Millennium Development Goal Monitoring Report is published annually by the World Bank (http://go.worldbank.org/XE4070LV80m). This publication focuses on the responsibilities and accountability of donor countries, developing countries and the international financial institutions to support achievement of the Millennium Development Goals and monitors progress towards the Millennium Development Goal targets. The 2007 report focuses on gender equality and the empowerment of women.
State of the World Population Report is the United Nations Populations Fund flagship publication (http://www.unfpa.org/swp/2007/english/
introduction.html). Each year the report focuses on a key issue addressing population, reproductive and maternal health and development concerns and provides statistical tables on a range of key demographic, health and socioeconomic indicators. Past reports have addressed such topics as urbanization, adolescent health, poverty, the environment, international migration, gender equality and changing population age structures. The relation of the thematic focus to maternal and reproductive health is a feature of every report.
Resources and monitoring activities
Millennium Development Goal monitoring occurs within the United Nations system. The UN Statistics Division (UNSD) coordinates the preparation of the UN Secretary General’s report on progress towards the Millennium Development Goals and is responsible for maintaining the Millennium Indicators database. The UN Statistics Division also coordinates the Inter-Agency and Experts Group on Millennium Development Goal reporting (IAEG), which is responsible for the preparation of data and analysis to monitor progress towards the Millennium Development Goals. The Group also reviews and defines methodologies and technical issues in relation to the indicators, produces guidelines and helps define priorities and strategies to support countries in data collection, analysis and reporting on Millennium Development Goals.
Lead agencies have been assigned to report on progress towards specific goals and targets. UNICEF and World Health Organization are the lead agencies for reporting on the health-related Millennium Development Goals. United Nations Population Fund is also involved in reporting on Millennium Development Goal 5. UNDP is responsible for providing support to countries in the preparation of country reports on progress towards the Millennium Development Goals.
The Child Health Epidemiology Reference Group (CHERG) was established in 2001 and has worked since that time to improve the quality of global estimates on maternal and child mortality and morbidity, intervention coverage and the potential effects of health services and interventions. The coverage estimates reported through the Countdown process are reviewed by the Child Health Epidemiology Reference Group for consistency with mortality estimates.
The Country Profiles on Maternal and Newborn Health produced in 2008 by the World Health Organization Department of Making Pregnancy Safer (MPS) complements the Countdown with country-specific reports focusing specifically on maternal and newborn health indicators, including subnational distributions and disaggregated reporting by measures of equity and location. In 2007 the Department initiated creation of a maternal and neonatal health epidemiology reference group (MNHERG) of global experts to catalyze improved capacity and use of country-level data to guide implementation and decisionmaking.
The Partnership for Maternal, Newborn and Child Health has collaborated closely with the Countdown in its efforts to monitor progress and to promote the use of the monitoring results for political advocacy related to maternal, newborn and child health.
Publicly accessible databases
UNICEF maintains a series of publicly accessible databases for tracking the situation of children and women globally. These databases contain both the current (presented in The State of the World’s Children) and trend data for tracking progress on the situation of women and children. UNICEF’s global databases include only statistically sound and nationally representative data from household surveys and other sources. These databases are updated annually through a process that draws on the wealth of data maintained by UNICEF’s wide network of 140 field offices and other sources. All these data have undergone a rigorous data quality review based on a series of objective criteria. UNICEF includes survey data in global estimates after reviewing them for quality based on the following criteria:
The survey is based on a nationally representative sampling frame. •
Standard protocols for collecting and analyzing data for the • Countdown indicators were used in the survey.
To the extent determinable, the survey was carried out • using procedures to ensure data quality in the recruitment, training and supervision of data collection teams and in the transfer and management of the survey data.
One of the databases maintained by UNICEF is DevInfo, a technical platform designed for use in monitoring progress towards the Millennium Development Goals. Nationally, 103 countries are now using DevInfo to develop national socioeconomic databases for Millennium Development
TRACKING PROGRESS IN MATERNAL, NEWBORN & CHILD SURVIVAL THE 2008 REPORT
193
Goal monitoring. (More information is available at http://www.devinfo.org/.)
The World Development Indicators Online (WDI) provide direct access to more than 700 development indicators, with time series for 208 countries and 18 country groups from 1960 to 2006, where data are available for interactive queries and can be downloaded by users (http://go.worldbank.org/6HAYAHG8H0).
The website for the Millennium Development Goals Indicators is maintained by the United Nations Statistics Division. The home page states that the site presents the official data, definitions, methodologies and sources for the 48 indicators to measure progress towards the Millennium Development Goals. The data and analyses are the product of the work of the Inter-agency and Expert Group (IAEG) on Millennium Development Goal Indicators, coordinated by the United Nations Statistics Division (http://mdgs.un.org/unsd/mdg/Host.aspx?Content=Indicators/OfficialList.htm).
Household survey protocols
The Multiple Indicator Cluster Survey (MICS) is a household survey programme developed by UNICEF to assist countries in filling data gaps to monitor the situation of children and women. It is capable of producing statistically sound data that are internationally comparable. The Multiple Indicator Cluster Survey was developed after the World Summit for Children to measure progress towards an internationally agreed-upon set of mid-decade goals. The first round of Multiple Indicator Cluster Surveys was conducted around 1995 in more than 60 countries. A second round of about 65 surveys was conducted in 2000. The 2005–06 round of Multiple Indicator Cluster Surveys was planned to provide a monitoring tool for the Millennium Development Goals and other major international commitments including the publication of A World Fit for Children, the UN General Assembly Special Session on HIV/AIDS, and the Abuja targets for malaria. Multiple Indicator Cluster Surveys are usually carried out by government organisations, with the support and assistance of UNICEF and other partners. Results from the different rounds of surveys, as well as related technical background materials, are available at www.childinfo.org.
The USAID-supported Demographic and Health Surveys (DHS) have been conducted in many countries over the last 20 years. They provide national and subnational data on family planning, maternal and child health, child survival, HIV/AIDS and sexually transmitted infections, infectious diseases and reproductive health and nutrition. More information is available at www.measuredhs.com. The MICS and DHS programmes have coordinated efforts both in terms of standardizing survey questions and methods for data analysis, as well as data collection on the ground. Coordinating both the countries surveyed and the questions included in the questionnaire modules ensures maximum coverage of countries and provides comparability across surveys.
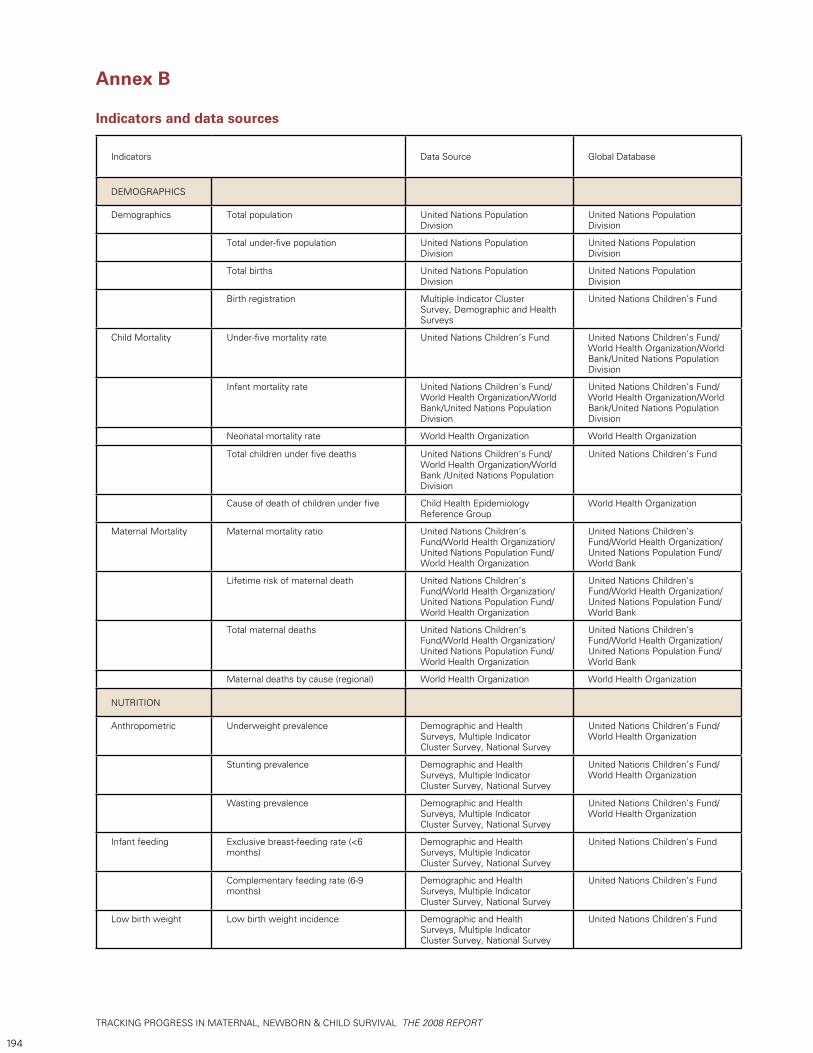
TRACKING PROGRESS IN MATERNAL, NEWBORN & CHILD SURVIVAL THE 2008 REPORT
194
Annex B Indicators and data sources
Indicators Data Source Global Database
DEMOGRAPHICS
Demographics Total population United Nations Population Division
United Nations Population Division
Total under-five population United Nations Population Division
United Nations Population Division
Total births United Nations Population Division
United Nations Population Division
Birth registration Multiple Indicator Cluster Survey, Demographic and Health Surveys
United Nations Children’s Fund
Child Mortality Under-five mortality rate United Nations Children’s Fund United Nations Children’s Fund/World Health Organization/World Bank/United Nations Population Division
Infant mortality rate United Nations Children’s Fund/World Health Organization/World Bank/United Nations Population Division
United Nations Children’s Fund/World Health Organization/World Bank/United Nations Population Division
Neonatal mortality rate World Health Organization World Health Organization
Total children under five deaths United Nations Children’s Fund/World Health Organization/World Bank /United Nations Population Division
United Nations Children’s Fund
Cause of death of children under five Child Health Epidemiology Reference Group
World Health Organization
Maternal Mortality Maternal mortality ratio United Nations Children’s Fund/World Health Organization/United Nations Population Fund/World Health Organization
United Nations Children’s Fund/World Health Organization/United Nations Population Fund/World Bank
Lifetime risk of maternal death United Nations Children’s Fund/World Health Organization/United Nations Population Fund/World Health Organization
United Nations Children’s Fund/World Health Organization/United Nations Population Fund/World Bank
Total maternal deaths United Nations Children’s Fund/World Health Organization/United Nations Population Fund/World Health Organization
United Nations Children’s Fund/World Health Organization/United Nations Population Fund/World Bank
Maternal deaths by cause (regional) World Health Organization World Health Organization
NUTRITION
Anthropometric Underweight prevalence Demographic and Health Surveys, Multiple Indicator Cluster Survey, National Survey
United Nations Children’s Fund/World Health Organization
Stunting prevalence Demographic and Health Surveys, Multiple Indicator Cluster Survey, National Survey
United Nations Children’s Fund/World Health Organization
Wasting prevalence Demographic and Health Surveys, Multiple Indicator Cluster Survey, National Survey
United Nations Children’s Fund/World Health Organization
Infant feeding Exclusive breast-feeding rate (<6 months)
Demographic and Health Surveys, Multiple Indicator Cluster Survey, National Survey
United Nations Children’s Fund
Complementary feeding rate (6-9 months)
Demographic and Health Surveys, Multiple Indicator Cluster Survey, National Survey
United Nations Children’s Fund
Low birth weight Low birth weight incidence Demographic and Health Surveys, Multiple Indicator Cluster Survey, National Survey
United Nations Children’s Fund
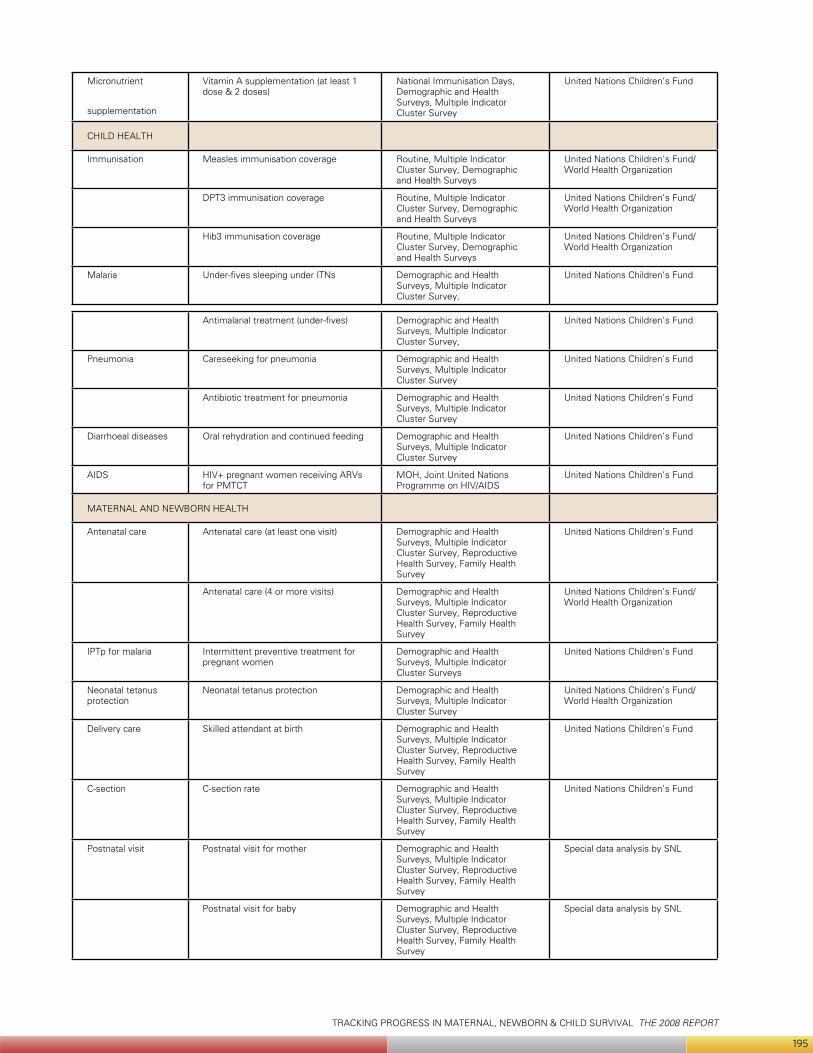
TRACKING PROGRESS IN MATERNAL, NEWBORN & CHILD SURVIVAL THE 2008 REPORT
195
Micronutrient
supplementation
Vitamin A supplementation (at least 1 dose & 2 doses)
National Immunisation Days, Demographic and Health Surveys, Multiple Indicator Cluster Survey
United Nations Children’s Fund
CHILD HEALTH
Immunisation Measles immunisation coverage Routine, Multiple Indicator Cluster Survey, Demographic and Health Surveys
United Nations Children’s Fund/World Health Organization
DPT3 immunisation coverage Routine, Multiple Indicator Cluster Survey, Demographic and Health Surveys
United Nations Children’s Fund/World Health Organization
Hib3 immunisation coverage Routine, Multiple Indicator Cluster Survey, Demographic and Health Surveys
United Nations Children’s Fund/World Health Organization
Malaria Under-fives sleeping under ITNs Demographic and Health Surveys, Multiple Indicator Cluster Survey,
United Nations Children’s Fund
Antimalarial treatment (under-fives) Demographic and Health Surveys, Multiple Indicator Cluster Survey,
United Nations Children’s Fund
Pneumonia Careseeking for pneumonia Demographic and Health Surveys, Multiple Indicator Cluster Survey
United Nations Children’s Fund
Antibiotic treatment for pneumonia Demographic and Health Surveys, Multiple Indicator Cluster Survey
United Nations Children’s Fund
Diarrhoeal diseases Oral rehydration and continued feeding Demographic and Health Surveys, Multiple Indicator Cluster Survey
United Nations Children’s Fund
AIDS HIV+ pregnant women receiving ARVs for PMTCT
MOH, Joint United Nations Programme on HIV/AIDS
United Nations Children’s Fund
MATERNAL AND NEWBORN HEALTH
Antenatal care Antenatal care (at least one visit) Demographic and Health Surveys, Multiple Indicator Cluster Survey, Reproductive Health Survey, Family Health Survey
United Nations Children’s Fund
Antenatal care (4 or more visits) Demographic and Health Surveys, Multiple Indicator Cluster Survey, Reproductive Health Survey, Family Health Survey
United Nations Children’s Fund/World Health Organization
IPTp for malaria Intermittent preventive treatment for pregnant women
Demographic and Health Surveys, Multiple Indicator Cluster Surveys
United Nations Children’s Fund
Neonatal tetanus protection
Neonatal tetanus protection Demographic and Health Surveys, Multiple Indicator Cluster Survey
United Nations Children’s Fund/World Health Organization
Delivery care Skilled attendant at birth Demographic and Health Surveys, Multiple Indicator Cluster Survey, Reproductive Health Survey, Family Health Survey
United Nations Children’s Fund
C-section C-section rate Demographic and Health Surveys, Multiple Indicator Cluster Survey, Reproductive Health Survey, Family Health Survey
United Nations Children’s Fund
Postnatal visit Postnatal visit for mother Demographic and Health Surveys, Multiple Indicator Cluster Survey, Reproductive Health Survey, Family Health Survey
Special data analysis by SNL
Postnatal visit for baby Demographic and Health Surveys, Multiple Indicator Cluster Survey, Reproductive Health Survey, Family Health Survey
Special data analysis by SNL
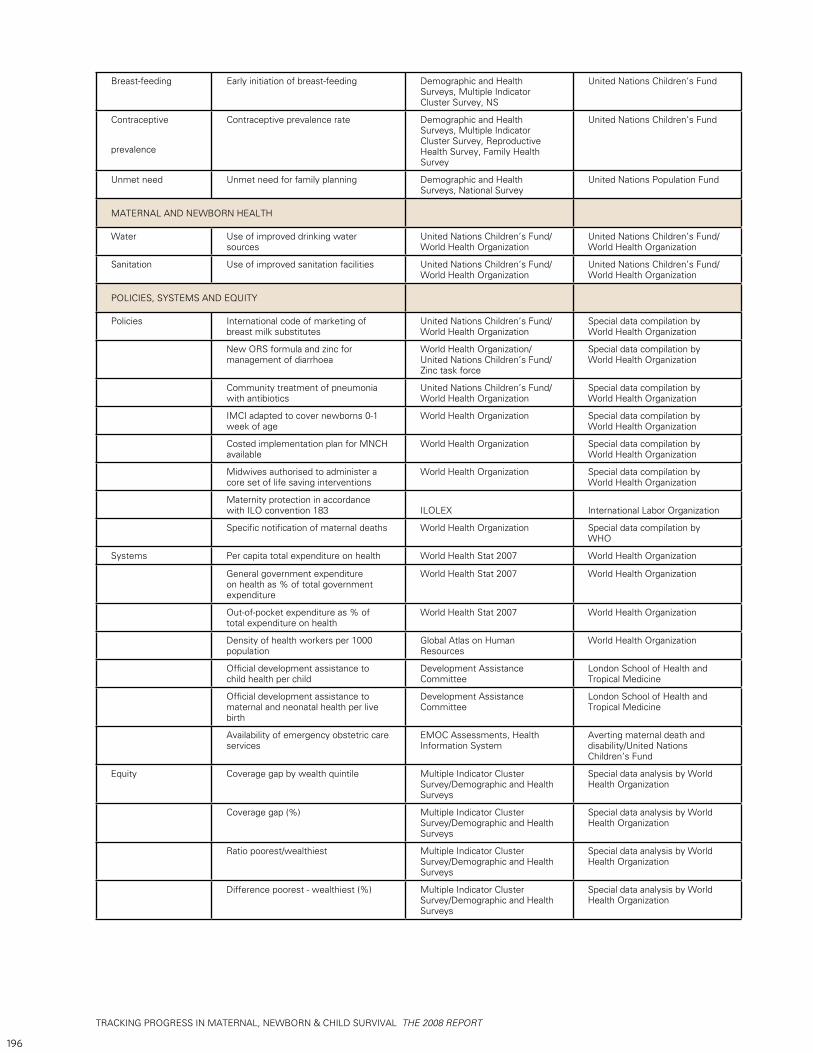
TRACKING PROGRESS IN MATERNAL, NEWBORN & CHILD SURVIVAL THE 2008 REPORT
196
Breast-feeding Early initiation of breast-feeding Demographic and Health Surveys, Multiple Indicator Cluster Survey, NS
United Nations Children’s Fund
Contraceptive
prevalence
Contraceptive prevalence rate Demographic and Health Surveys, Multiple Indicator Cluster Survey, Reproductive Health Survey, Family Health Survey
United Nations Children’s Fund
Unmet need Unmet need for family planning Demographic and Health Surveys, National Survey
United Nations Population Fund
MATERNAL AND NEWBORN HEALTH
Water Use of improved drinking water sources
United Nations Children’s Fund/World Health Organization
United Nations Children’s Fund/World Health Organization
Sanitation Use of improved sanitation facilities United Nations Children’s Fund/World Health Organization
United Nations Children’s Fund/World Health Organization
POLICIES, SYSTEMS AND EQUITY
Policies International code of marketing of breast milk substitutes
United Nations Children’s Fund/World Health Organization
Special data compilation by World Health Organization
New ORS formula and zinc for management of diarrhoea
World Health Organization/United Nations Children’s Fund/Zinc task force
Special data compilation by World Health Organization
Community treatment of pneumonia with antibiotics
United Nations Children’s Fund/World Health Organization
Special data compilation by World Health Organization
IMCI adapted to cover newborns 0-1 week of age
World Health Organization Special data compilation by World Health Organization
Costed implementation plan for MNCH available
World Health Organization Special data compilation by World Health Organization
Midwives authorised to administer a core set of life saving interventions
World Health Organization Special data compilation by World Health Organization
Maternity protection in accordance with ILO convention 183 ILOLEX International Labor Organization
Specific notification of maternal deaths World Health Organization Special data compilation by WHO
Systems Per capita total expenditure on health World Health Stat 2007 World Health Organization
General government expenditure on health as % of total government expenditure
World Health Stat 2007 World Health Organization
Out-of-pocket expenditure as % of total expenditure on health
World Health Stat 2007 World Health Organization
Density of health workers per 1000 population
Global Atlas on Human Resources
World Health Organization
Official development assistance to child health per child
Development Assistance Committee
London School of Health and Tropical Medicine
Official development assistance to maternal and neonatal health per live birth
Development Assistance Committee
London School of Health and Tropical Medicine
Availability of emergency obstetric care services
EMOC Assessments, Health Information System
Averting maternal death and disability/United Nations Children’s Fund
Equity Coverage gap by wealth quintile Multiple Indicator Cluster Survey/Demographic and Health Surveys
Special data analysis by World Health Organization
Coverage gap (%) Multiple Indicator Cluster Survey/Demographic and Health Surveys
Special data analysis by World Health Organization
Ratio poorest/wealthiest Multiple Indicator Cluster Survey/Demographic and Health Surveys
Special data analysis by World Health Organization
Difference poorest - wealthiest (%) Multiple Indicator Cluster Survey/Demographic and Health Surveys
Special data analysis by World Health Organization

TRACKING PROGRESS IN MATERNAL, NEWBORN & CHILD SURVIVAL THE 2008 REPORT
197
NO. INDICATOR NAME INDICATOR DEFINITION NUMERATOR DENOMINATOR
NUTRITION
1 Exclusive breast-feeding (<6 months)
Percentage of infants aged 0-5 months who are exclusively breastfed
Number of infants aged 0-5 months who are exclusively breastfed
Total number of infants aged 0-5 months surveyed
2 Breast-feeding plus complementary food (6-9 months)
Percentage of infants aged 6-9 months who are breastfed and receive complementary food
Number of infants aged 6-9 months who are breastfed and receive complementary food
Total number of infants aged 6-9 months surveyed
3 Vitamin A supplementation coverage
Percentage of children aged 6-59 months who received at least one high dose vitamin A supplement in the last six months (and at least two doses in the last 12 months).
Number of children aged 6-59 months receiving at least one high dose vitamin A supplement in the 6 months prior to the survey (and atleast two doses in the last 12 months).
Total number of children aged 6-59 months
CHILD HEALTH
4 Measles immunisation coverage
Percentage of children aged 12-23 months who are immunized against measles
Number of children aged 12-23 months who are immunized against measles
Total number of children aged 12-23 months surveyed
5 DPT3 immunisation coverage
Percentage of children aged 12-23 months who received 3 doses of DPT vaccine
Number of children aged 12-23 months receiving 3 doses of DPT vaccine
Total number of children aged 12-23 months surveyed
6 HiB3 immunisation coverage Percentage of children aged 12-23 months who received 3 doses of HiB vaccine.
Number of children aged 12-23 months receiving 3 doses of Haemophilus influenzae type B (HiB) vaccine
Total number of children aged 12-23 months surveyed
7 Oral rehydration and continued feeding
Percentage of children aged 0-59 months with diarrhoea receiving oral rehydration and continued feeding
Number of children aged 0-59 months with diarrhoea in the 2 weeks prior to the survey receiving oral rehydration therapy (oral rehydration solution and/or recommended homemade fluids or increased fluids) and continued feeding
Total number of children aged 0-59 months with diarrhoea in the 2 weeks prior to the survey
8 Insecticide-treated net coverage
Percentage of children aged 0-59 months sleeping under an insecticide-treated mosquito net
Number of children aged 0-59 months sleeping under an insecticide-treated mosquito net the night before the survey
Total number of children aged 0-59 months surveyed
9 Antimalarial treatment Percentage of children aged 0-59 months with fever receiving appropriate antimalarial drugs
Number of children aged 0-59 months reported to have fever in the 2 weeks prior to the survey who were treated with an appropriate antimalarial within 24 hours of the onset of symptoms
Total number of children aged 0-59 months reported to have fever in the 2 weeks prior to the survey
10 Prevention of mother-to-child transmission of HIV
Percentage of all HIV-positive pregnant women who received a complete course of ART prophylaxis
Number of HIV-positive pregnant women given ART prophylaxis in the preceding 12 months
Estimated number of HIV-positive pregnant women giving birth in the preceding 12 monthsa
Annex C
Defining current Countdown indicators
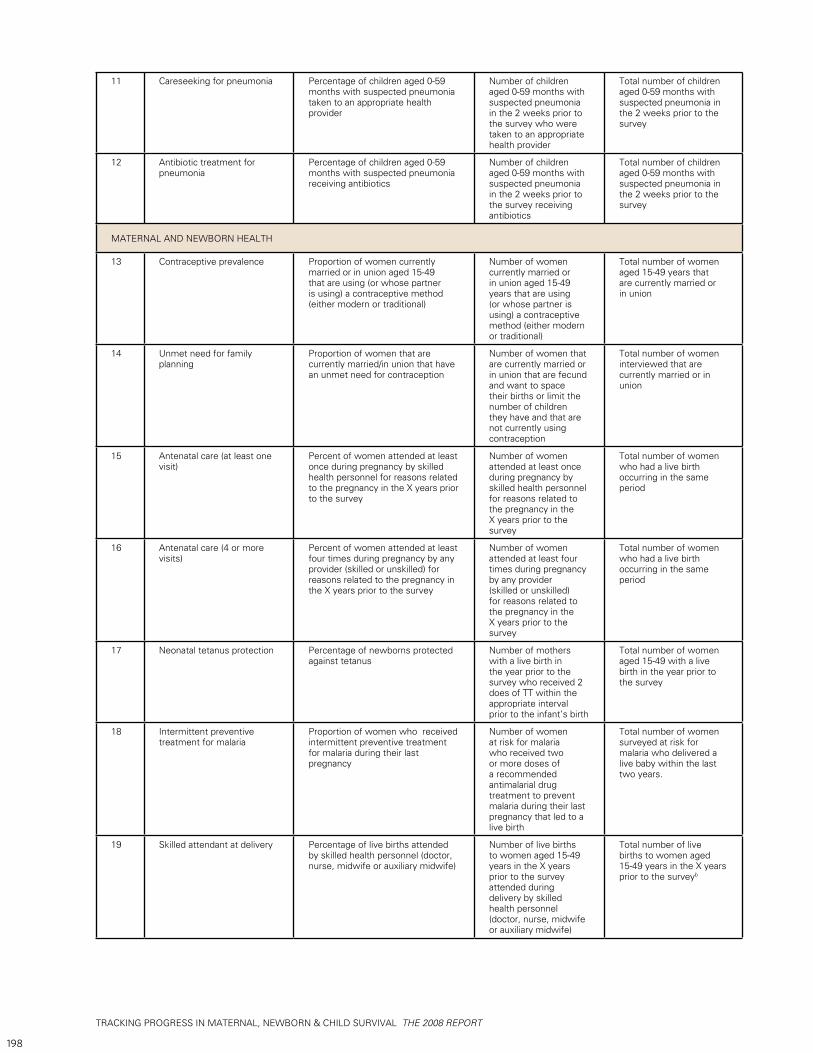
TRACKING PROGRESS IN MATERNAL, NEWBORN & CHILD SURVIVAL THE 2008 REPORT
198
11 Careseeking for pneumonia Percentage of children aged 0-59 months with suspected pneumonia taken to an appropriate health provider
Number of children aged 0-59 months with suspected pneumonia in the 2 weeks prior to the survey who were taken to an appropriate health provider
Total number of children aged 0-59 months with suspected pneumonia in the 2 weeks prior to the survey
12 Antibiotic treatment for pneumonia
Percentage of children aged 0-59 months with suspected pneumonia receiving antibiotics
Number of children aged 0-59 months with suspected pneumonia in the 2 weeks prior to the survey receiving antibiotics
Total number of children aged 0-59 months with suspected pneumonia in the 2 weeks prior to the survey
MATERNAL AND NEWBORN HEALTH
13 Contraceptive prevalence Proportion of women currently married or in union aged 15-49 that are using (or whose partner is using) a contraceptive method (either modern or traditional)
Number of women currently married or in union aged 15-49 years that are using (or whose partner is using) a contraceptive method (either modern or traditional)
Total number of women aged 15-49 years that are currently married or in union
14 Unmet need for family planning
Proportion of women that are currently married/in union that have an unmet need for contraception
Number of women that are currently married or in union that are fecund and want to space their births or limit the number of children they have and that are not currently using contraception
Total number of women interviewed that are currently married or in union
15 Antenatal care (at least one visit)
Percent of women attended at least once during pregnancy by skilled health personnel for reasons related to the pregnancy in the X years prior to the survey
Number of women attended at least once during pregnancy by skilled health personnel for reasons related to the pregnancy in the X years prior to the survey
Total number of women who had a live birth occurring in the same period
16 Antenatal care (4 or more visits)
Percent of women attended at least four times during pregnancy by any provider (skilled or unskilled) for reasons related to the pregnancy in the X years prior to the survey
Number of women attended at least four times during pregnancy by any provider (skilled or unskilled) for reasons related to the pregnancy in the X years prior to the survey
Total number of women who had a live birth occurring in the same period
17 Neonatal tetanus protection Percentage of newborns protected against tetanus
Number of mothers with a live birth in the year prior to the survey who received 2 does of TT within the appropriate interval prior to the infant’s birth
Total number of women aged 15-49 with a live birth in the year prior to the survey
18 Intermittent preventive treatment for malaria
Proportion of women who received intermittent preventive treatment for malaria during their last pregnancy
Number of women at risk for malaria who received two or more doses of a recommended antimalarial drug treatment to prevent malaria during their last pregnancy that led to a live birth
Total number of women surveyed at risk for malaria who delivered a live baby within the last two years.
19 Skilled attendant at delivery Percentage of live births attended by skilled health personnel (doctor, nurse, midwife or auxiliary midwife)
Number of live births to women aged 15-49 years in the X years prior to the survey attended during delivery by skilled health personnel (doctor, nurse, midwife or auxiliary midwife)
Total number of live births to women aged 15-49 years in the X years prior to the surveyb
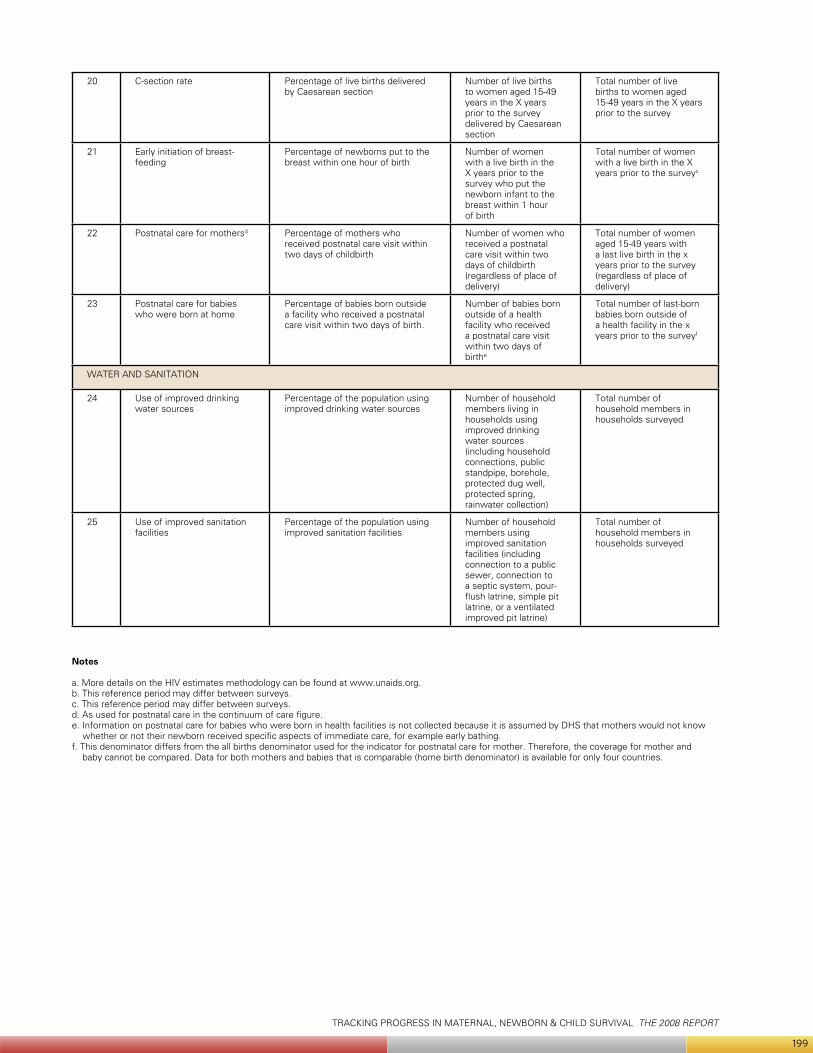
TRACKING PROGRESS IN MATERNAL, NEWBORN & CHILD SURVIVAL THE 2008 REPORT
199
20 C-section rate Percentage of live births delivered by Caesarean section
Number of live births to women aged 15-49 years in the X years prior to the survey delivered by Caesarean section
Total number of live births to women aged 15-49 years in the X years prior to the survey
21 Early initiation of breast-feeding
Percentage of newborns put to the breast within one hour of birth
Number of women with a live birth in the X years prior to the survey who put the newborn infant to the breast within 1 hour of birth
Total number of women with a live birth in the X years prior to the surveyc
22 Postnatal care for mothersd Percentage of mothers who received postnatal care visit within two days of childbirth
Number of women who received a postnatal care visit within two days of childbirth (regardless of place of delivery)
Total number of women aged 15-49 years with a last live birth in the x years prior to the survey (regardless of place of delivery)
23 Postnatal care for babies who were born at home
Percentage of babies born outside a facility who received a postnatal care visit within two days of birth.
Number of babies born outside of a health facility who received a postnatal care visit within two days of birthe
Total number of last-born babies born outside of a health facility in the x years prior to the surveyf
WATER AND SANITATION
24 Use of improved drinking water sources
Percentage of the population using improved drinking water sources
Number of household members living in households using improved drinking water sources (including household connections, public standpipe, borehole, protected dug well, protected spring, rainwater collection)
Total number of household members in households surveyed
25 Use of improved sanitation facilities
Percentage of the population using improved sanitation facilities
Number of household members using improved sanitation facilities (including connection to a public sewer, connection to a septic system, pour-flush latrine, simple pit latrine, or a ventilated improved pit latrine)
Total number of household members in households surveyed
Notes
a. More details on the HIV estimates methodology can be found at www.unaids.org.b. This reference period may differ between surveys.c. This reference period may differ between surveys.d. As used for postnatal care in the continuum of care figure.e. Information on postnatal care for babies who were born in health facilities is not collected because it is assumed by DHS that mothers would not know
whether or not their newborn received specific aspects of immediate care, for example early bathing.f. This denominator differs from the all births denominator used for the indicator for postnatal care for mother. Therefore, the coverage for mother and
baby cannot be compared. Data for both mothers and babies that is comparable (home birth denominator) is available for only four countries.
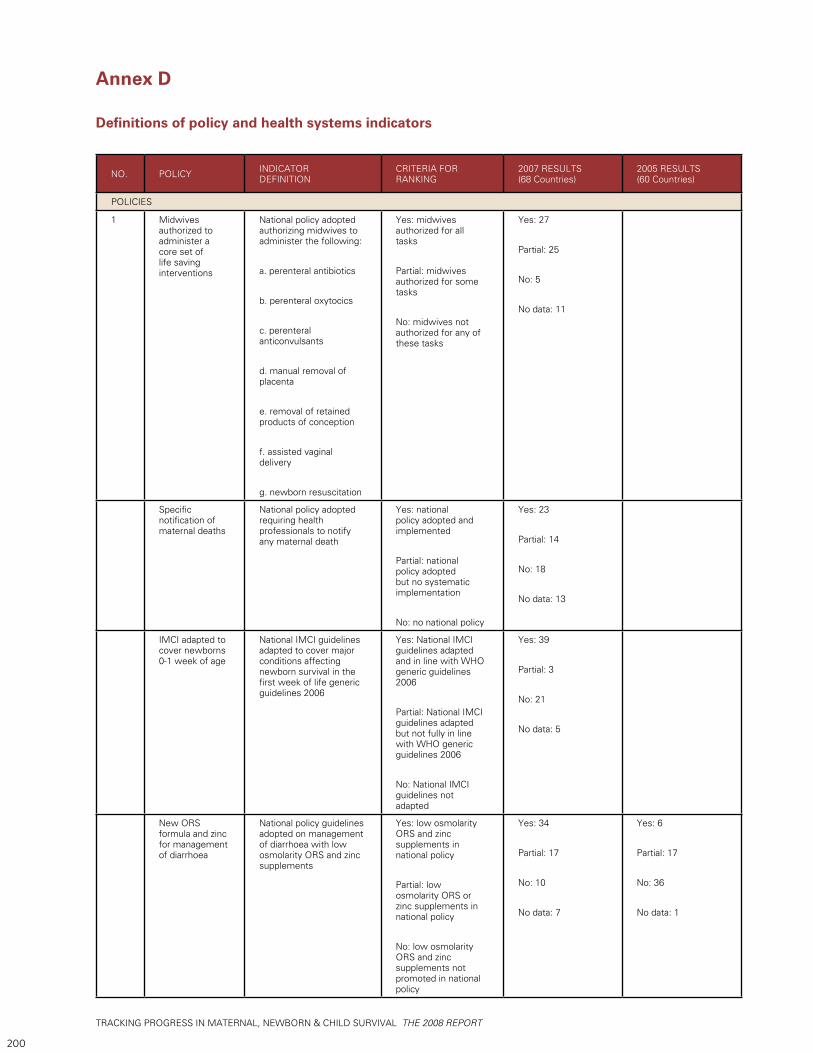
TRACKING PROGRESS IN MATERNAL, NEWBORN & CHILD SURVIVAL THE 2008 REPORT
200
Annex D
Definitions of policy and health systems indicators
NO. POLICY INDICATOR DEFINITION
CRITERIA FOR RANKING
2007 RESULTS (68 Countries)
2005 RESULTS (60 Countries)
POLICIES
1 Midwives authorized to administer a core set of life saving interventions
National policy adopted authorizing midwives to administer the following:
a. perenteral antibiotics
b. perenteral oxytocics
c. perenteral anticonvulsants
d. manual removal of placenta
e. removal of retained products of conception
f. assisted vaginal delivery
g. newborn resuscitation
Yes: midwives authorized for all tasks
Partial: midwives authorized for some tasks
No: midwives not authorized for any of these tasks
Yes: 27
Partial: 25
No: 5
No data: 11
Specific notification of maternal deaths
National policy adopted requiring health professionals to notify any maternal death
Yes: national policy adopted and implemented
Partial: national policy adopted but no systematic implementation
No: no national policy
Yes: 23
Partial: 14
No: 18
No data: 13
IMCI adapted to cover newborns 0-1 week of age
National IMCI guidelines adapted to cover major conditions affecting newborn survival in the first week of life generic guidelines 2006
Yes: National IMCI guidelines adapted and in line with WHO generic guidelines 2006
Partial: National IMCI guidelines adapted but not fully in line with WHO generic guidelines 2006
No: National IMCI guidelines not adapted
Yes: 39
Partial: 3
No: 21
No data: 5
New ORS formula and zinc for management of diarrhoea
National policy guidelines adopted on management of diarrhoea with low osmolarity ORS and zinc supplements
Yes: low osmolarity ORS and zinc supplements in national policy
Partial: low osmolarity ORS or zinc supplements in national policy
No: low osmolarity ORS and zinc supplements not promoted in national policy
Yes: 34
Partial: 17
No: 10
No data: 7
Yes: 6
Partial: 17
No: 36
No data: 1
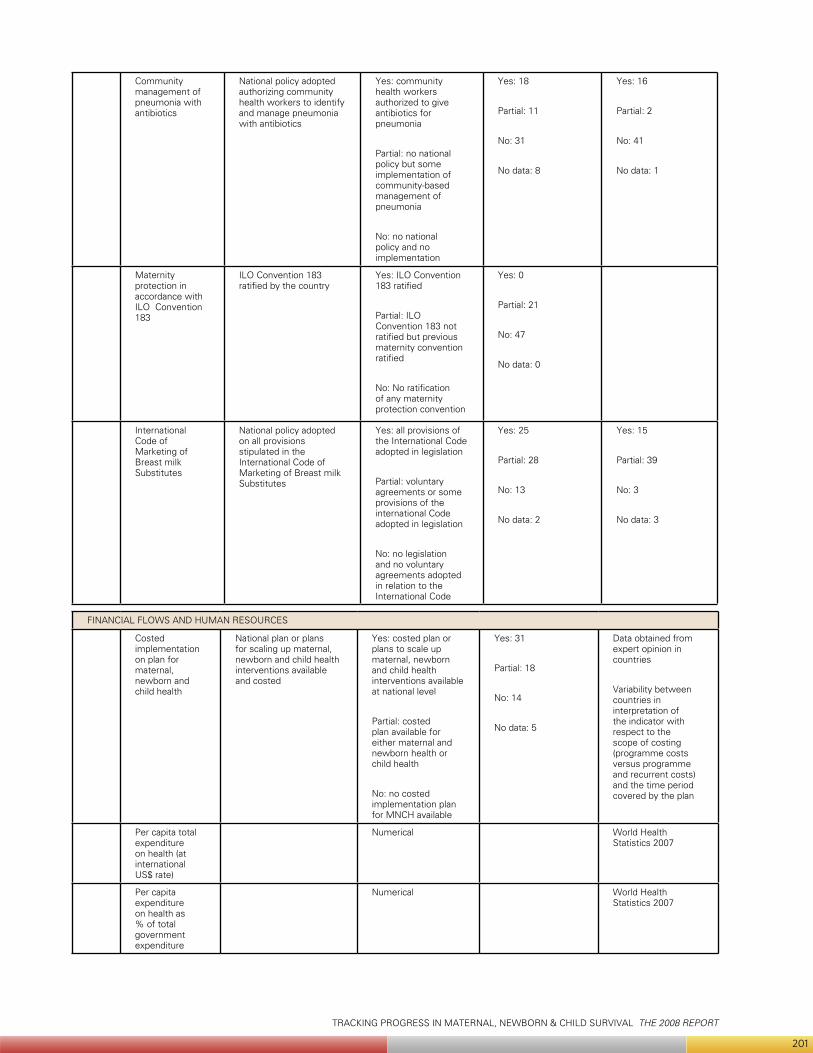
TRACKING PROGRESS IN MATERNAL, NEWBORN & CHILD SURVIVAL THE 2008 REPORT
201
Community management of pneumonia with antibiotics
National policy adopted authorizing community health workers to identify and manage pneumonia with antibiotics
Yes: community health workers authorized to give antibiotics for pneumonia
Partial: no national policy but some implementation of community-based management of pneumonia
No: no national policy and no implementation
Yes: 18
Partial: 11
No: 31
No data: 8
Yes: 16
Partial: 2
No: 41
No data: 1
Maternity protection in accordance with ILO Convention 183
ILO Convention 183 ratified by the country
Yes: ILO Convention 183 ratified
Partial: ILO Convention 183 not ratified but previous maternity convention ratified
No: No ratification of any maternity protection convention
Yes: 0
Partial: 21
No: 47
No data: 0
International Code of Marketing of Breast milk Substitutes
National policy adopted on all provisions stipulated in the International Code of Marketing of Breast milk Substitutes
Yes: all provisions of the International Code adopted in legislation
Partial: voluntary agreements or some provisions of the international Code adopted in legislation
No: no legislation and no voluntary agreements adopted in relation to the International Code
Yes: 25
Partial: 28
No: 13
No data: 2
Yes: 15
Partial: 39
No: 3
No data: 3
FINANCIAL FLOWS AND HUMAN RESOURCES
Costed implementation on plan for maternal, newborn and child health
National plan or plans for scaling up maternal, newborn and child health interventions available and costed
Yes: costed plan or plans to scale up maternal, newborn and child health interventions available at national level
Partial: costed plan available for either maternal and newborn health or child health
No: no costed implementation plan for MNCH available
Yes: 31
Partial: 18
No: 14
No data: 5
Data obtained from expert opinion in countries
Variability between countries in interpretation of the indicator with respect to the scope of costing (programme costs versus programme and recurrent costs) and the time period covered by the plan
Per capita total expenditure on health (at international US$ rate)
Numerical World Health Statistics 2007
Per capita expenditure on health as % of total government expenditure
Numerical World Health Statistics 2007
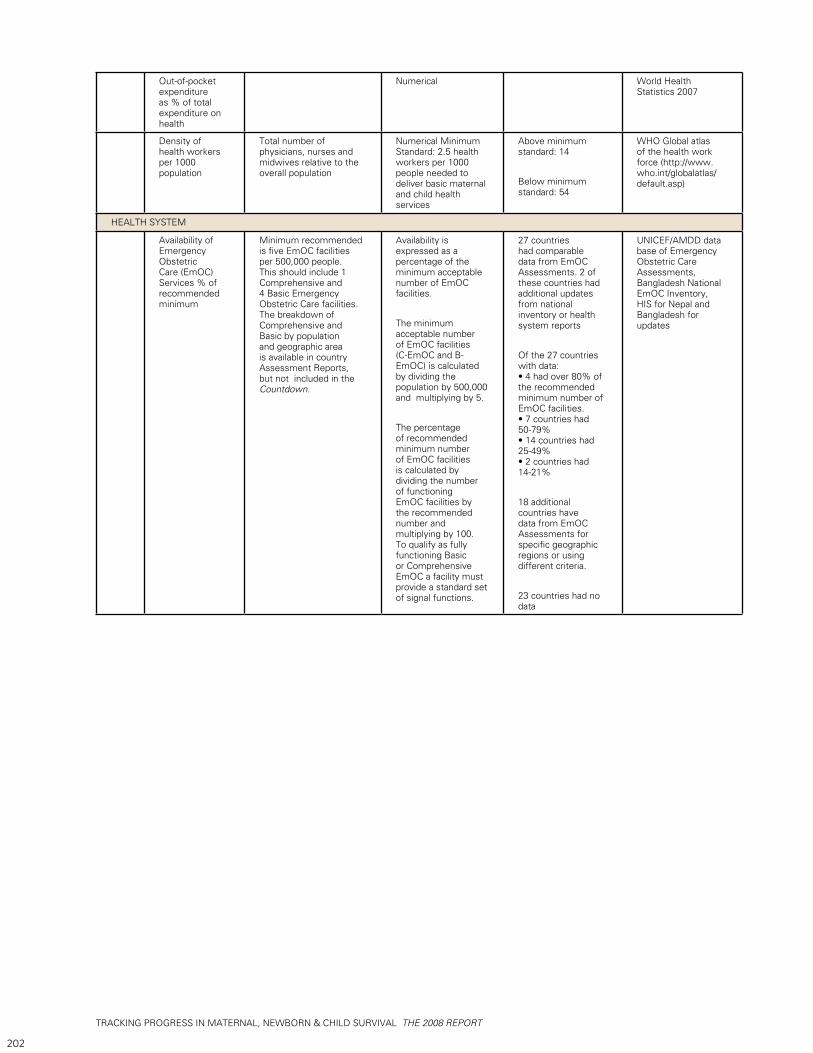
TRACKING PROGRESS IN MATERNAL, NEWBORN & CHILD SURVIVAL THE 2008 REPORT
202
Out-of-pocket expenditure as % of total expenditure on health
Numerical World Health Statistics 2007
Density of health workers per 1000 population
Total number of physicians, nurses and midwives relative to the overall population
Numerical Minimum Standard: 2.5 health workers per 1000 people needed to deliver basic maternal and child health services
Above minimum standard: 14
Below minimum standard: 54
WHO Global atlas of the health work force (http://www.who.int/globalatlas/default.asp)
HEALTH SYSTEM
Availability of Emergency Obstetric Care (EmOC) Services % of recommended minimum
Minimum recommended is five EmOC facilities per 500,000 people. This should include 1 Comprehensive and 4 Basic Emergency Obstetric Care facilities. The breakdown of Comprehensive and Basic by population and geographic area is available in country Assessment Reports, but not included in the Countdown.
Availability is expressed as a percentage of the minimum acceptable number of EmOC facilities.
The minimum acceptable number of EmOC facilities (C-EmOC and B-EmOC) is calculated by dividing the population by 500,000 and multiplying by 5.
The percentage of recommended minimum number of EmOC facilities is calculated by dividing the number of functioning EmOC facilities by the recommended number and multiplying by 100. To qualify as fully functioning Basic or Comprehensive EmOC a facility must provide a standard set of signal functions.
27 countries had comparable data from EmOC Assessments. 2 of these countries had additional updates from national inventory or health system reports
Of the 27 countries with data: • 4 had over 80% of the recommended minimum number of EmOC facilities. • 7 countries had 50-79% • 14 countries had 25-49% • 2 countries had 14-21%
18 additional countries have data from EmOC Assessments for specific geographic regions or using different criteria.
23 countries had no data
UNICEF/AMDD data base of Emergency Obstetric Care Assessments, Bangladesh National EmOC Inventory, HIS for Nepal and Bangladesh for updates
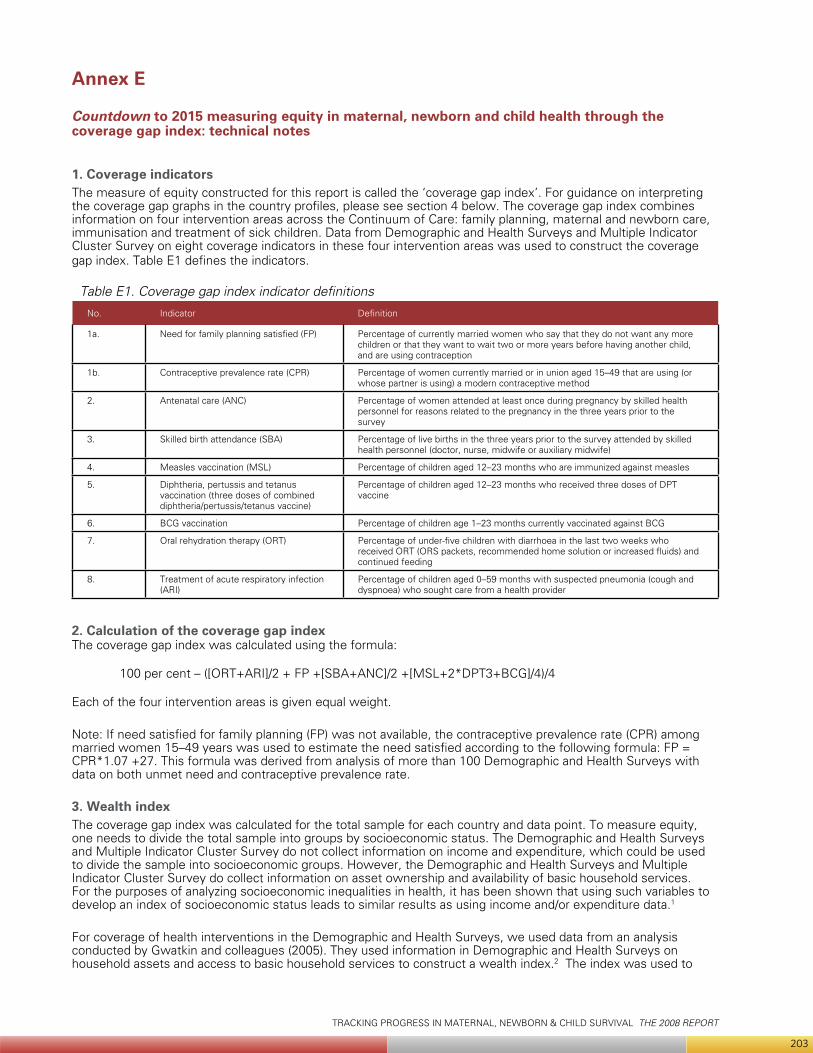
TRACKING PROGRESS IN MATERNAL, NEWBORN & CHILD SURVIVAL THE 2008 REPORT
203
Annex E
Countdown to 2015 measuring equity in maternal, newborn and child health through the coverage gap index: technical notes
1. Coverage indicatorsThe measure of equity constructed for this report is called the ‘coverage gap index’. For guidance on interpreting the coverage gap graphs in the country profiles, please see section 4 below. The coverage gap index combines information on four intervention areas across the Continuum of Care: family planning, maternal and newborn care, immunisation and treatment of sick children. Data from Demographic and Health Surveys and Multiple Indicator Cluster Survey on eight coverage indicators in these four intervention areas was used to construct the coverage gap index. Table E1 defines the indicators.
Table E1. Coverage gap index indicator definitions
No. Indicator Definition
1a. Need for family planning satisfied (FP) Percentage of currently married women who say that they do not want any more children or that they want to wait two or more years before having another child, and are using contraception
1b. Contraceptive prevalence rate (CPR) Percentage of women currently married or in union aged 15–49 that are using (or whose partner is using) a modern contraceptive method
2. Antenatal care (ANC) Percentage of women attended at least once during pregnancy by skilled health personnel for reasons related to the pregnancy in the three years prior to the survey
3. Skilled birth attendance (SBA) Percentage of live births in the three years prior to the survey attended by skilled health personnel (doctor, nurse, midwife or auxiliary midwife)
4. Measles vaccination (MSL) Percentage of children aged 12–23 months who are immunized against measles
5. Diphtheria, pertussis and tetanus vaccination (three doses of combined diphtheria/pertussis/tetanus vaccine)
Percentage of children aged 12–23 months who received three doses of DPT vaccine
6. BCG vaccination Percentage of children age 1–23 months currently vaccinated against BCG
7. Oral rehydration therapy (ORT) Percentage of under-five children with diarrhoea in the last two weeks who received ORT (ORS packets, recommended home solution or increased fluids) and continued feeding
8. Treatment of acute respiratory infection (ARI)
Percentage of children aged 0–59 months with suspected pneumonia (cough and dyspnoea) who sought care from a health provider
2. Calculation of the coverage gap indexThe coverage gap index was calculated using the formula:
100 per cent – ([ORT+ARI]/2 + FP +[SBA+ANC]/2 +[MSL+2*DPT3+BCG]/4)/4
Each of the four intervention areas is given equal weight.
Note: If need satisfied for family planning (FP) was not available, the contraceptive prevalence rate (CPR) among married women 15–49 years was used to estimate the need satisfied according to the following formula: FP = CPR*1.07 +27. This formula was derived from analysis of more than 100 Demographic and Health Surveys with data on both unmet need and contraceptive prevalence rate.
3. Wealth indexThe coverage gap index was calculated for the total sample for each country and data point. To measure equity, one needs to divide the total sample into groups by socioeconomic status. The Demographic and Health Surveys and Multiple Indicator Cluster Survey do not collect information on income and expenditure, which could be used to divide the sample into socioeconomic groups. However, the Demographic and Health Surveys and Multiple Indicator Cluster Survey do collect information on asset ownership and availability of basic household services. For the purposes of analyzing socioeconomic inequalities in health, it has been shown that using such variables to develop an index of socioeconomic status leads to similar results as using income and/or expenditure data.1
For coverage of health interventions in the Demographic and Health Surveys, we used data from an analysis conducted by Gwatkin and colleagues (2005). They used information in Demographic and Health Surveys on household assets and access to basic household services to construct a wealth index.2 The index was used to
TRACKING PROGRESS IN MATERNAL, NEWBORN & CHILD SURVIVAL THE 2008 REPORT
204
rank households and then divide the household population into quintiles. Results from recent Demographic and Health Surveys results were also included. For Multiple Indicator Cluster Surveys, we used data provided by UNICEF through the MICS website (http://childinfo.org) for those countries and data points for which a wealth index had been constructed.3
4. Explanation and interpretation of coverage gap graphThe x-axis shows the wealth quintiles; from the poorest 20 per cent to the best-off 20 per cent. The y-axis shows the coverage gap, which is measured as a percentage as explained in section 2. No percentage gap implies maximum coverage for all interventions. A 20 per cent gap means that the coverage as calculated in the index is 80 per cent. Given that the gap is measured as maximum coverage minus actual coverage, a low figure is preferable to a high figure.The difference between the poorest and richest quintiles and shape of the line show the patterns of inequality within a country. First, the greater the inequality between the poorest and richest quintiles, the steeper the downward slope. With a few exceptions, the coverage gap line declines as one moves from the poorest quintile to the best-off quintile in the country profiles. A horizontal line indicates relative equity, which was observed in some of the surveys in Central Asian Republics.
The shape is equally important.4 The way the lines are curved can illustrate where inequities are concentrated. There are three main patterns. First, bottom inequity occurs when the poorest lag behind. Second, top inequity occurs when the richest do substantially better than the other quintiles. The intermediate pattern is more or less linear. The coverage gap increases by a similar fraction as one goes from the richest to the poorest quintile.
The shape of the coverage gap line can inform policies to address inequities. Many country graphs have relatively straight downward-sloping lines from the poorest to the best-off quintile, which would suggest that efforts should be made to increase the overall coverage of interventions, but with special attention paid to the poor. A top inequity pattern, as illustrated in the Burkina Faso and Niger country profiles, with a relatively small coverage gap among the best off 20 per cent, suggests that inequities would be reduced by raising the overall population coverage of interventions.
A downward slope from the poorest quintile to the second-poorest quintile and then a more or less straight line (or at least less steep) to the best-off quintile would be an example of bottom inequity, as shown in the Brazil country profile. Such a pattern indicates that inequities are concentrated among the poorest and that the most appropriate policy response would be to target that particular group.
For coverage gap graphs with data from two or more surveys, it can also be used to analyze trends, both by overall levels by wealth quintile and patterns between quintiles. A good example of the change from top inequity to linear pattern to bottom inequity as the overall coverage gap is reduced over time is Nepal between 1996 and 2006.
5. Explanation and interpretation of coverage gap ratioThe ‘coverage gap ratio’ was derived by dividing the coverage gap for the poorest quintile with that of the best-off quintile. A ratio of 1 indicates equity in coverage in terms of comparing those two quintiles (there could still be inequities with regards to the three middle quintiles). A ratio of less than 1 indicates a lower coverage gap (higher coverage of interventions) among the poor, while a ratio of more than 1 indicates a lower coverage gap among the best-off. The higher the ratio, the more inequity there is in coverage of interventions.
6. Explanation and interpretation of coverage gap differenceThe difference is derived by subtracting the coverage gap of the best-off quintile from that of the poorest quintile. A positive difference implies that the coverage gap is larger among the poor; that is, coverage of interventions is lower among the poor. A relatively large poorest–best-off difference can occur in all patterns: top or bottom inequality or linear patterns. A small difference tends to occur in countries with smaller coverage gaps.
Notes:1 Wagstaff and Watanabe 2003.2 Gwatkin, Rutstein, Johnson, and others 2005.3 For more information on the calculation of the wealth index from DHS and MICS data, please refer to Rutstein and Johnson 2004. 4 Victora, Fenn, Bryce and Kirkwood 2005.
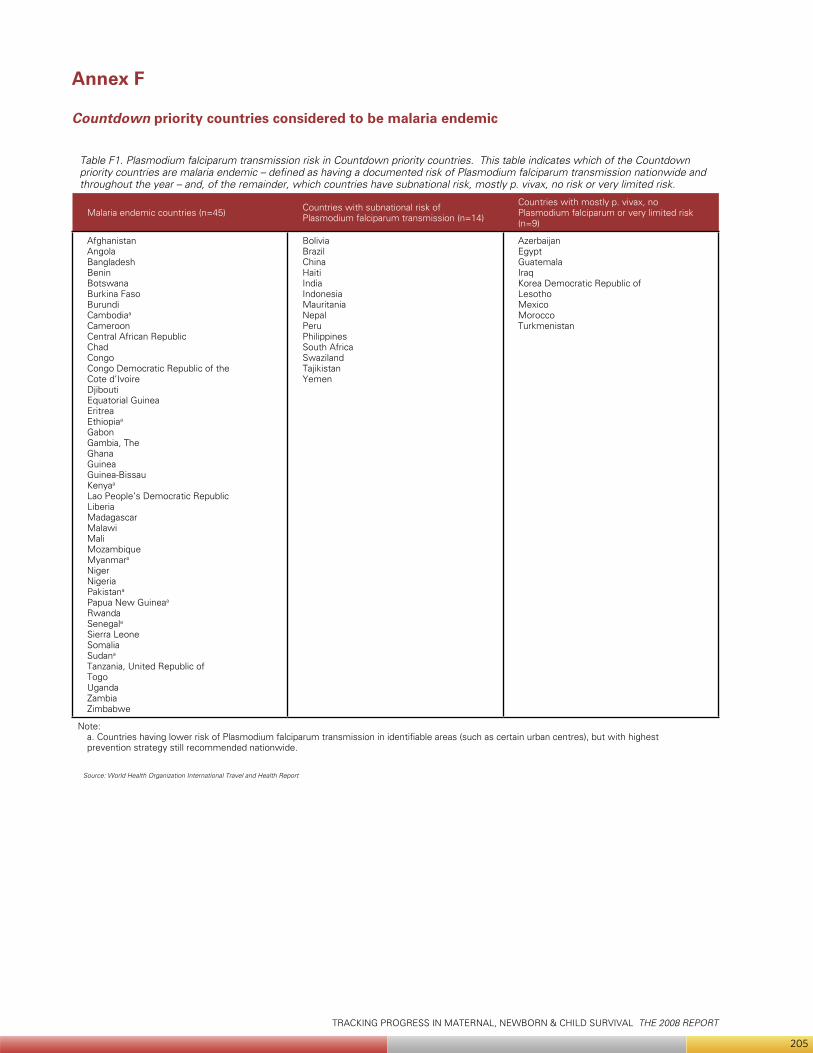
TRACKING PROGRESS IN MATERNAL, NEWBORN & CHILD SURVIVAL THE 2008 REPORT
205
Annex F
Countdown priority countries considered to be malaria endemic
Table F1. Plasmodium falciparum transmission risk in Countdown priority countries. This table indicates which of the Countdown priority countries are malaria endemic – defined as having a documented risk of Plasmodium falciparum transmission nationwide and throughout the year – and, of the remainder, which countries have subnational risk, mostly p. vivax, no risk or very limited risk.
Malaria endemic countries (n=45) Countries with subnational risk of Plasmodium falciparum transmission (n=14)
Countries with mostly p. vivax, no Plasmodium falciparum or very limited risk (n=9)
Afghanistan Angola Bangladesh Benin Botswana Burkina Faso Burundi Cambodiaa
Cameroon Central African Republic Chad Congo Congo Democratic Republic of the Cote d’Ivoire Djibouti Equatorial Guinea Eritrea Ethiopiaa
Gabon Gambia, The Ghana Guinea Guinea-Bissau Kenyaa
Lao People’s Democratic Republic Liberia Madagascar Malawi Mali Mozambique Myanmara
Niger Nigeria Pakistana Papua New Guineaa
Rwanda Senegala
Sierra Leone Somalia Sudana
Tanzania, United Republic of Togo Uganda Zambia Zimbabwe
Bolivia Brazil China Haiti India Indonesia Mauritania Nepal Peru Philippines South Africa Swaziland Tajikistan Yemen
Azerbaijan Egypt Guatemala Iraq Korea Democratic Republic of Lesotho Mexico Morocco Turkmenistan
Note:a. Countries having lower risk of Plasmodium falciparum transmission in identifiable areas (such as certain urban centres), but with highest prevention strategy still recommended nationwide.
Source: World Health Organization International Travel and Health Report

TRACKING PROGRESS IN MATERNAL, NEWBORN & CHILD SURVIVAL THE 2008 REPORT
206

TRACKING PROGRESS IN MATERNAL, NEWBORN & CHILD SURVIVAL THE 2008 REPORT
207
TRACKING PROGRESS IN MATERNAL, NEWBORN & CHILD SURVIVAL THE 2008 REPORT
208
FAMILY CARE I N T E R N A T I O N A L
pantone
322 C
321 U
pantone
382 C
381 U
CMYK (process)
DS 302-3 C
C 25, Y 95
DS 302-5 U
C 20, Y 65
CMYK (process)
DS 249-3 C
C 95, Y 25, K 35
DS 248-2 U
C 100, Y 30, K 30
www.countdown2015mnch.org