Embed Size (px)
Citation preview
8/2/2019 Trade Creation and Trade DXiversion in the European Common Market
http://slidepdf.com/reader/full/trade-creation-and-trade-dxiversion-in-the-european-common-market 1/22
Trade Creation and Trade Diversion in the European Common MarketAuthor(s): Bela BalassaReviewed work(s):Source: The Economic Journal, Vol. 77, No. 305 (Mar., 1967), pp. 1-21Published by: Blackwell Publishing for the Royal Economic SocietyStable URL: http://www.jstor.org/stable/2229344 .Accessed: 03/04/2012 13:20
Your use of the JSTOR archive indicates your acceptance of the Terms & Conditions of Use, available at .http://www.jstor.org/page/info/about/policies/terms.jsp
JSTOR is a not-for-profit service that helps scholars, researchers, and students discover, use, and build upon a wide range of
content in a trusted digital archive. We use information technology and tools to increase productivity and facilitate new formsof scholarship. For more information about JSTOR, please contact [email protected].
Blackwell Publishing and Royal Economic Society are collaborating with JSTOR to digitize, preserve andextend access to The Economic Journal.
http://www.jstor.org
8/2/2019 Trade Creation and Trade DXiversion in the European Common Market
http://slidepdf.com/reader/full/trade-creation-and-trade-dxiversion-in-the-european-common-market 2/22
T H E ECONOMIC JOURNAL
MARCH 1967
TRADE CREATION AND TRADE DIVERSIONIN THE EUROPEAN COMMON MARKET1
IFOLLOWING the lead provided by Jacob Viner, several contributors to
the theory of customs unions have suggested that the desirability of a unionbe evaluated with reference to its trade-creating and trade-diverting effects.2At the same time, while a number of criteria have been put forward forappraising the chances of trade creation and trade diversion in a union, itseems to be generally agreed that an a priori judgment regarding the neteffect of customs unions on trade flows cannot be made.3 This circumstancelends especial interest to empirical studies of trade creation and trade diver-sion in a customs union. Such investigations can be of an ex ante or an ex
post character; one may attempt to evaluate the possible repercussions nadvance or after the union has been established.Among ex ante estimates, those of P. J. Verdoorn, L. H. Janssen and L. B.
Krause may be mentioned.4 Verdoorn and Janssen used a general-equilibrium framework in their investigation and inquired into the effectsof changing one variable-eliminating internal tariffs n the union-on tradeflows and on the terms of trade. Their work has been subject to criticismon theoretical as well as on empirical grounds, and they have been said tohave underestimated prospective trade creation-in part because of their
1 At various stages in the preparation of this paper I have had the able collaboration of M. AlainCamu, Economic Adviser to the Belgian Prime Minister. I am also indebted to Messrs. Mesnageof the Commission of the E.E.C. and Nederveen of the O.E.C.D. for helpful discussions. Much ofthe research on this paper was financed by the Economic Growth Center of Yale University.
2 Cf. Jacob Viner, The Customs Union Issue (London: Carnegie Endowment for InternationalPeace, 1950); H. Makower and G. Morton, " A Contribution Towards a Theory of CustomsUnions," ECONOMIC OURNAL, March 1953, pp. 33-49; and J. E. Meade, The Theory of CustomsUnions (Amsterdam, North Holland, 1955).
8 On this point, see R. G. Lipsey, " The Theory of Customs Unions: A General Survey,"ECONOMICJOURNAL, eptember, 1960, pp. 496-513; and Bela Balassa, The Theory of Economic nte-gration (Homewood, Illinois: Richard D. Irwin, 1961), Ch. 2.
4 P. J. Verdoorn, " A Customs Union for Western Europe-Advantages and Feasibility,"World Politics, July, 1954, pp. 482-500; L. H. Janssen, Free Trade, Protection and Customs Union(Leiden: H. E. Stenfert Kroese, 1961); and L. B. Krause, " European Economic Integration andthe United States," American EconomicReview, Papers and Proceedings, May 1963, pp. 185-96, and" The European Economic Community and the United States Balance of Payments," W. S.Salant, ed., The United States Balance of Payments n 1968 (Washington: The Brookings Institution,1963).
No. 305.-VOL. LXXVII. B
8/2/2019 Trade Creation and Trade DXiversion in the European Common Market
http://slidepdf.com/reader/full/trade-creation-and-trade-dxiversion-in-the-european-common-market 3/22
2 THE ECONOMIC JOURNAL [MARCH
failure to take account of intra-industry specialisation following the elimina-tion of tariffs within a union.1 On the other hand, Krause appears to haveover-estimated the trade-diverting effects of the European Common Market
for United States exports by assuming a high supply elasticity for the " domi-nant suppliers " within the E.E.C.2In discussions on the actual effects of integration on trade flows, the rise
of intra-area trade as a proportion of the total (intra -and extra-area) ex-ports and imports of the E.E.C. countries has often been interpreted as evi-dence for the trade-creating effects of the Common Market.3 But theseresults may conceivably be explained by the increasing importance of theE.E.C. in world markets and by changes in its competitive position. To ab-stract from the influence of the latter factors, Alexandre Lamfalussy hassuggested that we should compare changes in the share of the EuropeanEconomic Community, as an import market, in the exports of participatingand non-participating countries, and should examine the relative perform-ance of the E.E.C. countries in the markets of the Community and elsewhere.
Having considered changes in trade flows between 1958 and 1960, aswell as between 1960 and 1962 (first three quarters), Lamfalussy has notfound clear evidence for either a positive (trade-creating) or a negative(trade-diverting) effect of the Common Market.4 Similar conclusions havebeen reached by R. L. Major of the United Kingdom National Institute ofEconomic and Social Research, who has examined the share of individualexporters n Common Market imports for eleven commodity groups.5
While the method used by Lamfalussy avoids the pitfalls of arguing froma comparison of the relative proportions of intra-area and extra-area trade,it is open to the objection that, by proceeding in a piecemeal fashion, it doesnot provide fully consistent results. To remedy this deficiency, Jean Wael-broeck has proposed that comparisons be made between actual and hypo-thetical trade flows, the latter being calculated under the assumption that
the structure of world trade indicated by the world trade matrix of an earlieryear has remained unchanged.6 This solution amounts to the applicationof a procedure suggested by Richard Stone and Alan Brown for examiningchanges in input-output matrices.
Extrapolating the 1951-52 world trade matrix to 1959-60, and the 1960
1 Cf. B. Balassa, op. cit., pp. 49-51; and H. G.Johnson's review ofJanssen's book in the Journalof Political Economy, April 1964, pp. 208-9.
2 B. Balassa, " Tariff Reductions and Trade in Manufactures among the Industrial Countries,"American EconomicReview, une 1966, pp. 466-72.
3 Between 1959 and 1965, the share of intra-area trade in total exports rose from 32 4 to 43.5%,and in total imports from 33 3 to 41.7%.
4 Alexandre Lamfalussy, " Intra-European Trade, and the Competitive Position of the E.E.C.,"paper read at The Manchester Statistical Society, on March 13, 1963.
5 R. L. Major, " The Common Market: Production and Trade," National Institute EconomicReview, August 1962, pp. 24-36.
6 J. Waelbroeck, " Le Commnerce de la Communaut6 Europeene avec les Pays Tiers," inIntigration Europeene t Realite Economique Bruges, 1964), pp. 139-64.
8/2/2019 Trade Creation and Trade DXiversion in the European Common Market
http://slidepdf.com/reader/full/trade-creation-and-trade-dxiversion-in-the-european-common-market 4/22
1967] TRADE CREATION AND TRADE DIVERSION 3
matrix to 1962 and first half of 1963, Waelbroeck has concluded that " theexistence of a ' Common Market effect' on the composition of world tradecan hardly be doubted."' Analogous conclusions have been reached by
P. J. Verdoorn and F. J. M. Meyer zu Schlochtern who used a similarmethod.2 But, as Waelbroeck notes, results obtained by the use of theseprocedures do not permit us to judge whether the observed " deformation "of the world trade matrix has been due to trade creation or to trade diversion.The finding that actual intra-E.E.C. trade exceeds hypothetical trade, cal-culated under the assumption of an unchanged composition of world trade,is compatible with trade creation as well as trade diversion: the CommonMarket countries trade more with each other, either because the reduction ofintra-area tariffs has created new trade or because trade has been divertedfrom extra-area to intra-area channels.
To provide an indication of the trade-creating and trade-diverting effectsof the E.E.C., Waelbroeck has suggested the application of a method used byTinbergen and two Finnish economists, P. Poyh6nen and K. Pullianinen,to the problem at hand.3 These authors attempted to explain trade flowsby regression analysis, with gross national products and geographical dis-tance as the principal determining variables. In the Finnish study thefollowing formula was used to describe the influences affecting the exportsof country i to countryj:
jj ci yiay;b,(1) = dCiC
when yi and yj are the gross national products of the two countries, cj and c1are their export and import parameters ndicating the " openness " of theireconomies, ri1 s the distance between them and c is a scale factor.
Waelbroeck has assumed that the coefficients c, ci and cj would remainunchanged over time, and has utilised the values of coefficients a and b,estimated from a cross-section nvestigation of world trade in the year 1958,to extrapolate the matrix of world trade from 1958 to 1962. Comparing thehypothetical trade figures derived by the use of this method with actualtrade, Waelbroeck has found that intra-E.E.C. trade has increased con-siderably more than the Finnish model would have led us to expect. At thesame time there is no evidence for trade diversion on imports from NorthAmerica and from the countries of the European Free Trade Association,
1 op. cit., p. 157.2 P. J. Verdoorn and F. J. M. Meyer zu Schlochtern, " Trade Creation and Trade Diversion
in the Common Market," in Int6gration uropeene t R6alitd Economique, p. 95-137. These calcula-tions are also cited in L. Duquesne de la Vinelle, " La creation du commerce attribuable au March6commun et son incidence sur le valeur du produit national de la Communaute," InformationsStatistiques, 1965, No. 4.
'Jan Tinbergen, Shaping the World Economy New York: Twentieth Century Fund, 1963; P.P6yh6nen, " Toward a General Theory of International Trade," Ekonomiska amfundets Tidskrift,1963 (2), pp. 69-77; and K. Pulliainen, " A World Trade Study: An Econometric Study of thePattern of the Commodity Flows in Intcrnational Trade, 1948-60," ibid., pp. 78-91.
8/2/2019 Trade Creation and Trade DXiversion in the European Common Market
http://slidepdf.com/reader/full/trade-creation-and-trade-dxiversion-in-the-european-common-market 5/22
4 THE ECONOMIC JOURNAL [MARCH
inasmuch as actual imports exceed hypothetical imports in trade with theseareas, too.
But similar developments had taken place between 1954 and 1958, and
hence the results do not provide a clear indication of the trade-creating andthe trade-diverting effects of the Common Market.' At any rate, one mayquestion the validity of a method that applies average income elasticities ofexport supply and import demand, calculated in a cross-section analysis ofall trading countries, to the European Economic Community. In fact, theseelasticities are generally higher in the industrial economies, and lower in less-developed areas, since increased nternational specialisation within the manu-facturing sector tends to raise the share of foreign trade in G.N.P. in theformer group of countries, while industrialisation cum protectionism have
the opposite effect in the latter. Thus, the relatively high income elasticitiesof export supply and import demand in the Common Market countries willexplain, in part, the presumed nternal andexternal rade creation.2 Further,a consideration of total exports and imports has only limited interest, sincethe aggregate results may conceal changes in opposite directions with respectto individual commodities and commodity groups.
In turn, in a cross-section study of thirty-eight commodities, Verdoornand Meyer zu Schlochtern have attempted to explain inter-commoditydifferences n the expansion of imports into the Common Market by utilisingas explanatory variables a weighted average of internal and external tariffreductions and an index representing "effective import demand." Thelatter has been calculated as an unweighted average of the rates of change ofimports of the commodities in question into the United Kingdom, Sweden,Denmark and Switzerland, and is taken to reflect the expansion of trade thatwould have taken place in the absence of the E.E.C.'s establishment.3
Depending on the form of the regression equation used, the apparentimpact of tariff changes on trade corresponds to an elasticity of -2. 1 or
-39 with respect to price, when the latter, but not the former, s significantlydifferent from zero at the 5% confidence level. The results thus providesome evidence of the trade-creating and rade-diverting effects of the E.E.C.4But the method utilised is open to the usual objections against calculatingsubstitution elasticities from cross-section data. Further, one may questionthe validity of using the data of four E.F.T.A. countries with lower growthrates and rather different economic structure as a yardstick for the expansion
1 Waelbroeck, " Le Commerce de la Communaut6 Europ6enne avec les Pays Tiers," op. cit., pp.160-3.
2The expression
"external trade creation
"is used in this paper to refer to increased importsfrom third countries, accompanying the establishment of a union, and is therefore the opposite of
trade diversion.8 P.J. Verdoorn and F.J. M. Meyer zu Schlochtern, " Trade Creation and Trade Diversion in
the Common Market," op. cit., pp. 113-14.' Verdoom and Schlochtern use the results as evidence for trade creation only; yet if tariff
reductions lead to increased trade, the opposite conclusion also holds: an increase in relative arifflevels will lead to a shift in imports from third-country to partner-country suppliers.
8/2/2019 Trade Creation and Trade DXiversion in the European Common Market
http://slidepdf.com/reader/full/trade-creation-and-trade-dxiversion-in-the-european-common-market 6/22
1967] TRADE CREATION AND TRADE DIVERSION 5
of trade that would have taken place in the absence of the Common Market'sestablishment, especially in view of the fact that by 1962-the terminal yearof the calculations-there might have already been an " E.F.T.A. effect."
IIThis short survey indicates some of the problems encountered in theestimation of trade creation and trade diversion in a customs union. Inparticular, we note the need for: (a) abstracting rom the effects of economicgrowth on trade flows; (b) ensuring the comparability of the estimates oftrade creation and trade diversion; (c) providing for a disaggregation of theresults according to the main commodity categories; and (d) indicating theeffects on individual supplying areas.
I earlier suggested that a comparison of expost income elasticities of im-port demand1 in intra-area and extra-area trade, for periods precedingand following integration, may provide a way of dealing with the first twoproblems.2 Under the assumption that income elasticities of import de-mand would have remained unchanged in the absence of integration, a risein the income elasticity of demand for intra-area imports would indicategross trade creation, while an increase in the income elasticity of demand forimports from all sources of supply would give expression to trade creationproper. In turn, a fall in the income elasticity of demand for extra-area im-ports would provide evidence of the trade-diverting effects of the union.3
In other words, it is assumed that the Common Market's establishmenthas been the single largest influence affecting trade flows in the E.E.C., andlong-run influences or special factors would not have appreciably altered therelationships between imports and G.N.P.-expressed by the income elasti-cities of import demand for the period preceding integration-during theperiod that has elapsed since.4 At the same time, by comparing the relation-ship of internal and external trade to G.N.P. between the pre-integration andthe post-integration periods, the proposed method abstracts from changes
in the growth rate of national income, and provides comparable estimates oftrade creation and trade diversion.5
1 Ex post income elasticities of import demand have been defined as the ratio of the averageannual rate of change of imports to that of G.N.P. In carrying out the present investigation, I havealso experimented with regression analysis but, given the shortness of the time series and the vari-ability of data, satisfactory results have not been obtained. The introduction of variables expressingchanges in relative prices and tariffs have not improved the results either.
2 Bela Balassa, " European Integration: Problems and Issues," American conomic Review, Papersand Proceedings, May 1963, pp. 175-84. For an application of this method to the 1953-63 period,see Bela Balassa and Alain Camu, " Les effets du march6 commun sur les courants d'echangesinternationaux," Revued'Economie olitique, 1966 (2), pp. 201-27.
3 Gross trade creation refers to increases in intra-area trade, irrespective of whether this has beendue to substitution for domestic or for foreign source of supply. In tum, trade creation in theVinerian sense relates to newly created trade due to a shift from domestic to partner-country sourcesof supply, while trade diversion entails a shift from foreign to partner-country producers.
4 The effects of autonomous price changes on trade flows provide a further problem; I willreturn to this at a later point.
5 The reader will note that, rather than comparing trade shares at the beginning and the end ofthe period, this method implicitly considers trends in shares over time.
8/2/2019 Trade Creation and Trade DXiversion in the European Common Market
http://slidepdf.com/reader/full/trade-creation-and-trade-dxiversion-in-the-european-common-market 7/22
6 THE ECONOMIC JOURNAL [MARCH
In applying this method, separate consideration can also be given toindividual commodity categories and supplying areas. The commoditycategories distinguished in the present study are Temperate zone foods,
beverages and tobacco (SITC 0 + 1 less 07), Raw materials (2 + 4),Fuels
(3), Chemicals (5), Machinery (71 + 72), Transport equipment (73) andOther manufactured goods (6 + 8).1 Estimates relating to these commoditycategories have further been utilised to indicate the impact of the CommonMarket's establishment on imports from various groups of non-membercountries.2
In the calculations the pre-integration period has been taken to includethe years 1953-59, and the post-integration period 1959-65. Thus, 1959,the year when the actual operation of the Common Market began, has been
chosen as the " benchmark " year that separates the two periods. Althoughtariff reductions were undertaken already on January 1 of that year, thesewere extended to non-member countries, so that there was no discriminationagainst outsiders until 1960. At the same time the choice of the year 1959has appeared preferable to using an average of the years 1958-60. With theexception of trade in ships and aeroplanes, 1959was apparently a " normal "year as far as the internal and external trade relations of the CommonMarket are concerned. On the other hand, imports in 1958 declined dueto the recession in that year, and trade flows in 1960 were already affectedby the E.E.C.'s establishment.
By abstracting from the influence of changes in the rate of growth ofG.N.P. on trade, this method purports to indicate the static effects of inte-gration, i.e., the impact of the elimination of internal duties on trade underceteris aribus assumptions. But the results are not meant to reflect the fullimpact of the union's establishment on trade flows, since no account is takenof the possible influence of integration on economic growth. Should theactual growth rate exceed the rate that would have been obtained in the ab-
sence of integration, the increase in intra-area trade resulting from theestablishment of the union would be understated, and the decrease in extra-area imports generally overestimated.3
The influence of non-recurring factors, structural changes and un-certainties relating to the underlying relationships also gives rise to errors.
1 It may be suggested that the imports of the various groups of commodities be related to someother variable that would have a more direct influence on imports than G.N.P. does. I havechosen to use G.N.P. in the calculations, in part because of the difficulties encountered in ascertain-ing the " proximate " income variable for some of the commodity groups and in part for ensuringthe comparability of the results. Nevertheless, calculations have also been carried out with alterna-tive explanatory variables in the case of the imports of food, raw materials and machinery.
2 On the other hand, no account has been taken of differential changes in tariffs within theCommon Market.
8 The latter conclusion would not hold, however, if economic growth had a strong anti-tradebias (cf. Bela Balassa, " The Future of Common Market Imports," Weltwirtschaftliches rchiv, Vol. 90,2, 1963, pp. 308-9). Pro- or anti-trade bias in Common Market growth would also affect theresults obtained by the use of the proposed method, but these influences cannot be separated fromtrade creation and trade diversion proper.
8/2/2019 Trade Creation and Trade DXiversion in the European Common Market
http://slidepdf.com/reader/full/trade-creation-and-trade-dxiversion-in-the-european-common-market 8/22
1967] TRADE CREATION AND TRADE DIVERSION 7
A further consideration s that the statistical reliability of the estimates can-not be tested. Correspondingly, the results shown in the following sectionsshould be considered as being indicative of general tendencies rather than
expressing exact magnitudes.III
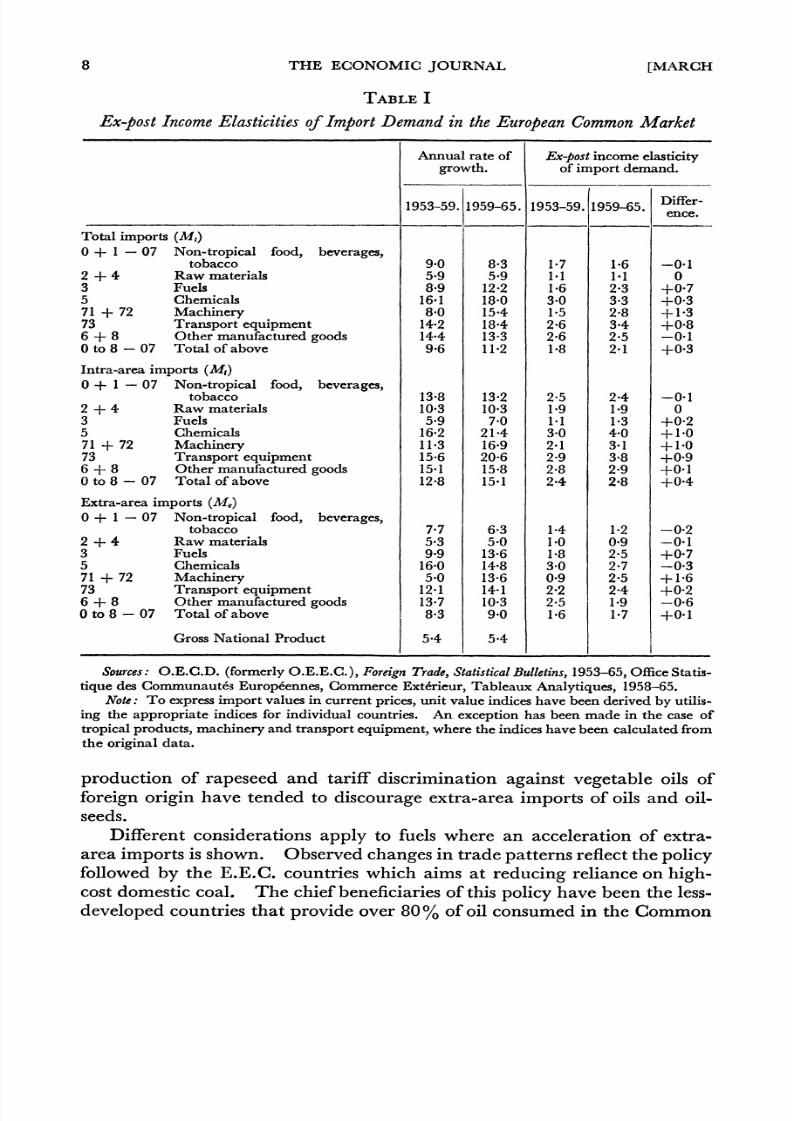
A consideration of expost ncome elasticities of demand for imports of allcommodities, taken together, provides evidence of trade creation in theEuropean Common Market, while there is no indication of trade diversion(Table I). Between the periods 1953-59 and 1959-65 the income elasticityof demand increased from 1-8 to 2 1 with respect to total (intra- and extra-area) imports, it rose from 2-4 to 2-8 for intra-area trade and it hardlychanged in regard to extra-area mports (1 6 as against 17). But the resultsvary to a considerable extent between commodity groups, and more usefulconclusions can be reached if the data are appropriately disaggregated.
To begin with, the data of Table I do not show trade creation in food,beverages and tobacco. This conclusion is not affected if, instead of thegross national product, food consumption is used as the explanatory variable,since the income elasticity of demand for food failed to decline between thepre-integration and the post-integration period. On the other hand, there
is some indication of trade creation in the raw materials category if importsare related to industrial production rather than to G.N.P.'Further, the data point to the existence of trade diversion n food and raw
materials, inasmuch as changes in income elasticities of demand between thetwo periods show a shift from foreign to partner-country sources of supply.Within the food, beverages and tobacco group, member-country producershave increased their share to a considerable extent in imports of live animals,dairy products, wheat and sugar into the food-deficit countries of the E.E.C.In the case of these products, the actual-and anticipated-effects of Com-mon Market agricultural policy appear to have been of importance.2 Thereduction in the preferential advantages accorded to Algerian wine inFrance and the lowering of internal tariffs on tobacco have further contri-buted to this result.
Tariff preferences have affected the pattern of trade n some raw materials,too. Shifts from foreign producers to partner-country sources of supplyhave taken place in the case of rubber, where the reduction of internalduties has been accompanied by substitution against natural and syntheticrubber originating in non-member countries. Moreover, subsidies
to the1 The total import elasticities for raw materials, calculated with respect to industrial production,are 0-8 in the period 1953-59 and 0 9 in the period 1959-65; the relevant figures for intra-area tradeare 1b4 and 1i5 and for extra-area trade 0 7 and 07.
2 The common agricultural policy entails the use of variable levies designed to bring the pricesof foreign exporters to the domestic level. The variable levy system, in fact, amounts to the applica-tion of variable quotas since the purpose of the levy is to ensure that imports from non-membercountries are admitted only after all produce of member country suppliers has been sold.
8/2/2019 Trade Creation and Trade DXiversion in the European Common Market
http://slidepdf.com/reader/full/trade-creation-and-trade-dxiversion-in-the-european-common-market 9/22
8 THE ECONOMIC JOURNAL [MARCH
TABLE I
Ex-post ncome Elasticities f Import Demand n the European ommonMarket
Annual rate of Ex-post ncome elasticitygrowth. of import demand.
1953-59. 1959-65. 1953-59. 1959-65. Differ-ence.
Total imports (MI)0 + 1 - 07 Non-tropical food, beverages,
tobacco 9 0 8-3 1P7 1P6 -0.12 + 4 Raw materials 5.9 5.9 1.1 11 03 Fuels 8-9 12-2 1P6 2-3 +0o75 Chemicals 1641 18.0 3 0 3-3 +0 371 + 72 Machinery 8.0 15-4 1P5 2-8 +1P373 Transport equipment 14*2 18-4 2*6 3-4 +0-86 + 8 Other manufactured goods 14*4 13-3 2*6 2*5 -0*10 to 8-07 Total of above 9-6 11P2 1.8 2*1 +0 3
Intra-area imports (M,)O+ 1 - 07 Non-tropical food, beverages,
tobacco 13-8 13-2 2-5 2-4 -0412 + 4 Raw materials 10-3 10-3 1.9 1P9 03 Fuels 5 9 7 0 1.1 1-3 +0-25 Chemicals 16-2 21-4 3 0 4 0 +1P071 + 72 Machinery 113 16*9 2*1 3*l +1-073 Transport equipment 15-6 20-6 2-9 3-8 +0 96 + 8 Other manufactured goods 15-1 15-8 2-8 2-9 +0 10 to 8 - 07 Total of above 12-8 15.1 2-4 2*8 +04
Extra-area imports (Me)0 + 1 - 07 Non-tropical food, beverages,
tobacco 7-7 6-3 1-4 1-2 -0-22 + 4 Raw materials 5.3 5-0 1.0 0 9 -0413 Fuels 9.9 13-6 1P8 2-5 +0 75 Chemicals 16-0 14-8 3 0 2-7 -0 371 + 72 Machinery 5^0 13-6 09 2-5 +1-673 Transport equipment 12*1 1441 2-2 2-4 +0-26 + 8 Other manufactured goods 13-7 10-3 2-5 19 -0-60 to 8-07 Total of above 8*3 9*0 1*6 17 +04 I
Gross National Product 5.4 5-4
Sources: O.E.C.D. (formerly O.E.E.C.), Foreign Trade, Statistical Bulletins, 1953-65, Office Statis-tique des Communaut6s Europeennes, Commerce Ext6rieur, Tableaux Analytiques, 1958-65.
Note: To express import values in current prices, unit value indices have been derived by utilis-ing the appropriate indices for individual countries. An exception has been made in the case oftropical products, machinery and transport equipment, where the indices have been calculated fromthe original data.
production of rapeseed and tariff discrimination against vegetable oils offoreign origin have tended to discourage extra-area imports of oils and oil-seeds.
Different considerations apply to fuels where an acceleration of extra-area imports is shown. Observed changes in trade patterns reflect the policyfollowed by the E.E.C. countries which aims at reducing reliance on high-cost domestic coal. The chief beneficiaries of this policy have been the less-developed countries that provide over 80% of oil consumed in the Common
8/2/2019 Trade Creation and Trade DXiversion in the European Common Market
http://slidepdf.com/reader/full/trade-creation-and-trade-dxiversion-in-the-european-common-market 10/22
1967] TRADE CREATION AND TRADE DIVERSION 9
Market. In view of the considerations underlying the energy policy of theCommunity, recent trends in regard to oil imports are expected to continue.
With the exception of semi-manufactures and non-durable consumer
goods, included in the group of other manufactures, the establishment of theCommon Market appears to have led to trade creation in manufacturedproducts. At the same time there is evidence of trade diversion in two ofthese groups of commodities, whereas the increase in the income elasticity ofdemand for extra-area imports of machinery and transport equipmentpoints to " external trade creation." It is the latter result that requires ex-planation, since tariff discrimination against outsiders would have been ex-pected to lead to a deceleration rather than an acceleration of purchases romnon-member countries.
I noted above that the choice of the year 1959 as the benchmark betweenthe pre-integration and the post-integration periods gives rise to distortionsin the calculations concerning transport equipment. By reason of a largedecline in the imports of ships and aeroplanes occurring in 1959, the extra-area imports of transport equipment of that year were considerably belowthe level of the preceding and the following years.' Thus, if we replace thedata for 1959 by an average of the years 1958-60, trade diversion ratherthan external trade creation is shown.
As regards machinery, one may argue that it is incorrect to relate importsto gross national product in the calculations, since an accelerator-typerelationship may exist between investment in machinery and national in-come. However, the results are hardly affected if, instead of G.N.P., pur-chases of machinery and equipment are used as the explanatory variable,inasmuch as the ratio of these purchases to the gross national product hardlychanged between the two periods.2 It would appear, then, that the ex-planation must lie elsewhere.
It is suggested here that the observed acceleration in Common Market
imports of machinery from non-participating countries can, in great part,be explained by reference to the investment boom that accompanied theestablishment of the E.E.C. The investment boom necessitated substantialpurchases of machinery and equipment which domestic capacities could notcope with. In turn, the rate of increase of extra-area imports of machinerydeclined as the investment boom subsided and domestic machine-buildingcapacities caught up with demand.
According to this explanation, an accelerator-type relationship existsbetween machinery purchases, on the one hand, and the imports of machineryfrom non-member countries, on the other, so that the share of foreignsuppliers in the incremental purchases of machinery will tend to rise with
1 The relevant figures (in 1953 prices) are: 1958, $538 million; 1959, $318 million; and 1960,$564 million.
2 The ratio of the annual rate of change of machinery purchases to that of the gross nationalproduct was 1b5 n the period 1953-59 and 1-6 in 1959-64. Data on machinery purchases in 1965are not available.
8/2/2019 Trade Creation and Trade DXiversion in the European Common Market
http://slidepdf.com/reader/full/trade-creation-and-trade-dxiversion-in-the-european-common-market 11/22
10 THE ECONOMIC JOURNAL [MARCH
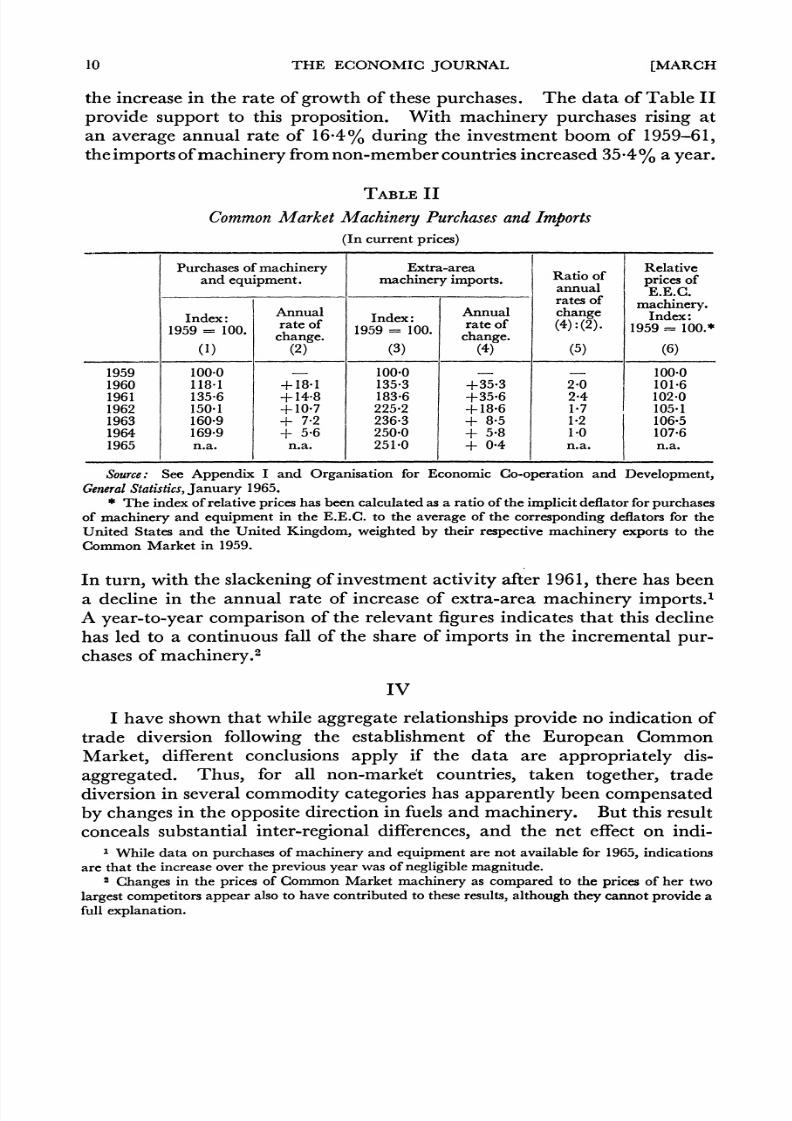
the increase in the rate of growth of these purchases. The data of Table IIprovide support to this proposition. With machinery purchases rising atan average annual rate of 16.4% during the investment boom of 1959-61,
the imports of machinery from non-member countries ncreased 35 4% a year.TABLE II
CommonMarket Machinery urchases nd Imports(In current prices)
Purchases of machinery Extra-area R Relativeand equipment. machinery imports. atio of prices of
rates of maehinery.
Index: Annual Annual change Index:1959 d100 rate of Index: rate of (4):(2). 1959In99
I-0 change. 1959 = 100. change.
15 0.
_________ (1) (2) (3) (4) (5) (6)
1959 100-0 - 100*0 - - 100-01960 118.1 +1841 135*3 +35-3 2-0 101*61961 135 6 +14 8 183*6 +35-6 2-4 102*01962 150*1 +?107 225-2 +18-6 1*7 105*11963 160*9 + 7 2 236*3 + 8 5 1-2 106*51964 169*9 + 56 250*0 + 5*8 1.0 107*61965 n.a. n.a. 251b0 + 0 4 n.a. n.a.
Source: See Appendix I and Organisation for Economic Co-operation and Development,
General Statistics, January 1965.* The index of relative prices has been calculated as a ratio of the implicit deflator for purchasesof machinery and equipment in the E.E.C. to the average of the corresponding deflators for theUnited States and the United Kingdom, weighted by their respective machinery exports to theCommon Market in 1959.
In turn, with the slackening of investment activity after 1961, there has beena decline in the annual rate of increase of extra-area machinery imports.'A year-to-year comparison of the relevant figures indicates that this declinehas led to a continuous fall of the share of imports in the incremental pur-chases of machinery.2
IV
I have shown that while aggregate relationships provide no indication oftrade diversion following the establishment of the European CommonMarket, different conclusions apply if the data are appropriately dis-aggregated. Thus, for all non-market countries, taken together, tradediversion in several commodity categories has apparently been compensated
by changes in the opposite direction in fuels and machinery. But this resultconceals substantial inter-regional differences, and the net effect on indi-1 While data on purchases of machinery and equipment are not available for 1965, indications
are that the increase over the previous year was of negligible magnitude.2 Changes in the prices of Common Market machinery as compared to the prices of her two
largest competitors appear also to have contributed to these results, although they cannot provide afull explanation.
8/2/2019 Trade Creation and Trade DXiversion in the European Common Market
http://slidepdf.com/reader/full/trade-creation-and-trade-dxiversion-in-the-european-common-market 12/22
1967] TRADE CREATION AND TRADE DIVERSION 11
vidual suppliers will depend on the composition of their exports to theCommon Market.
In the present section I will examine some of the factors determining the
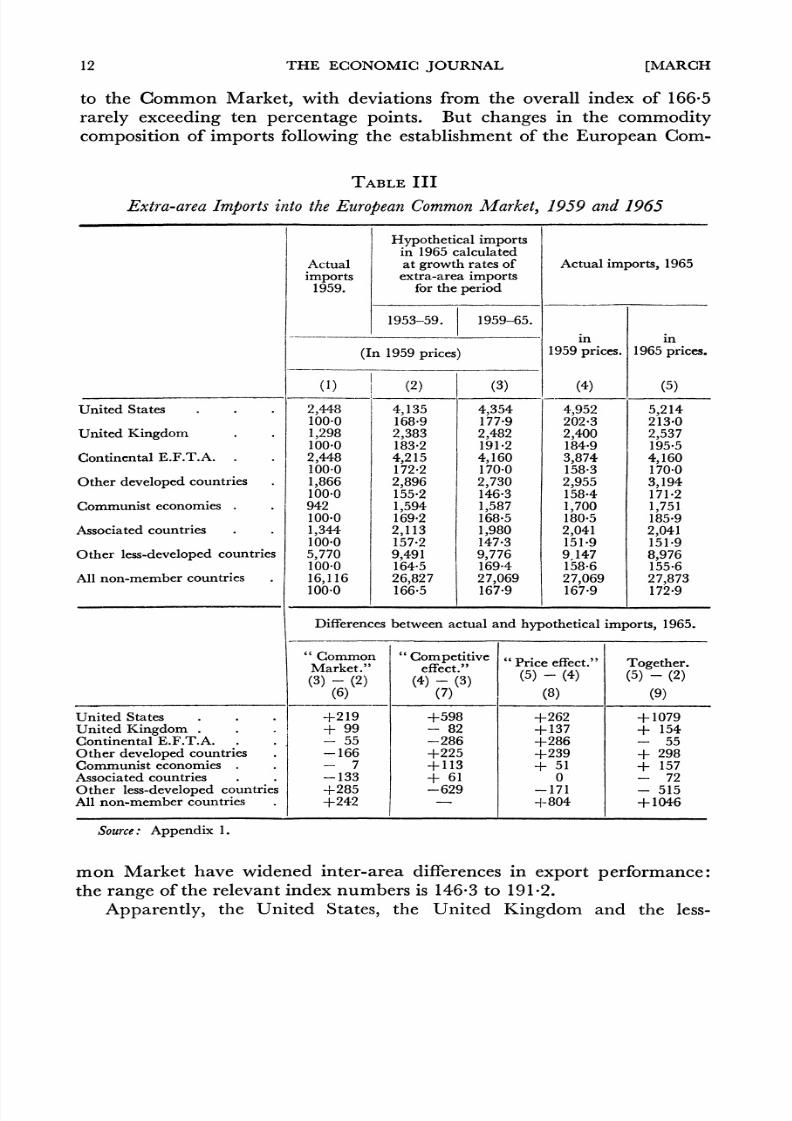
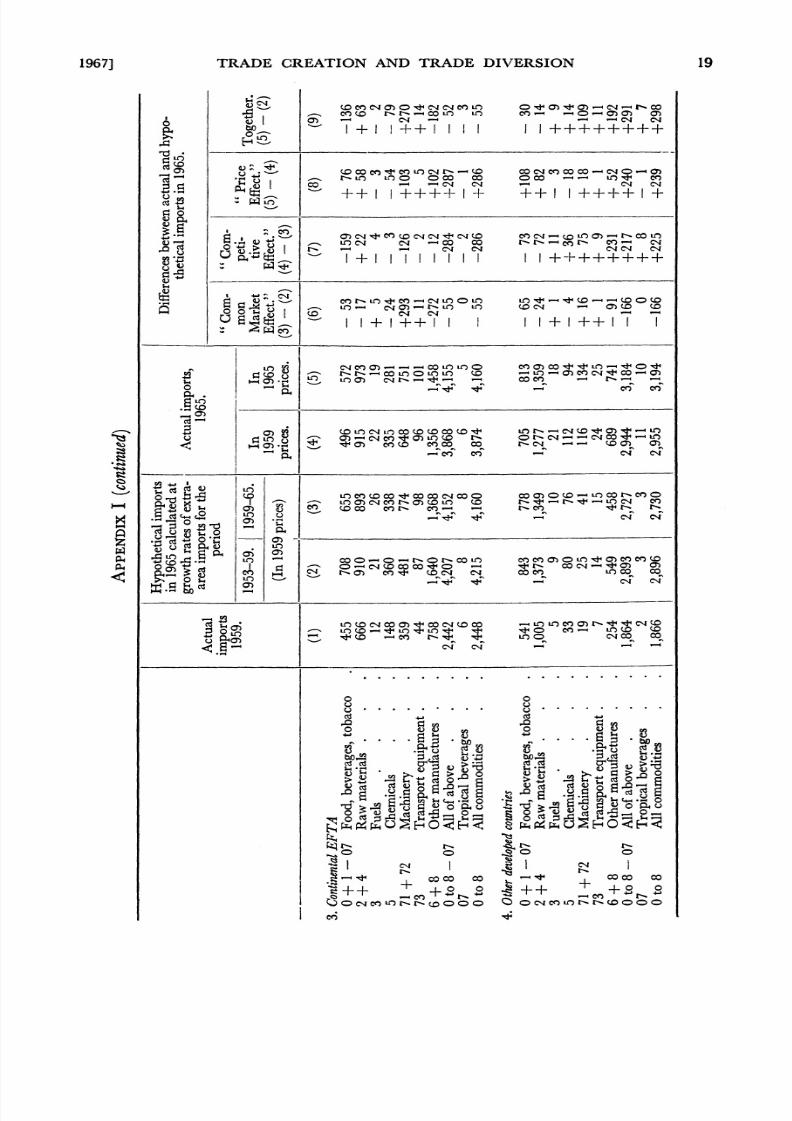
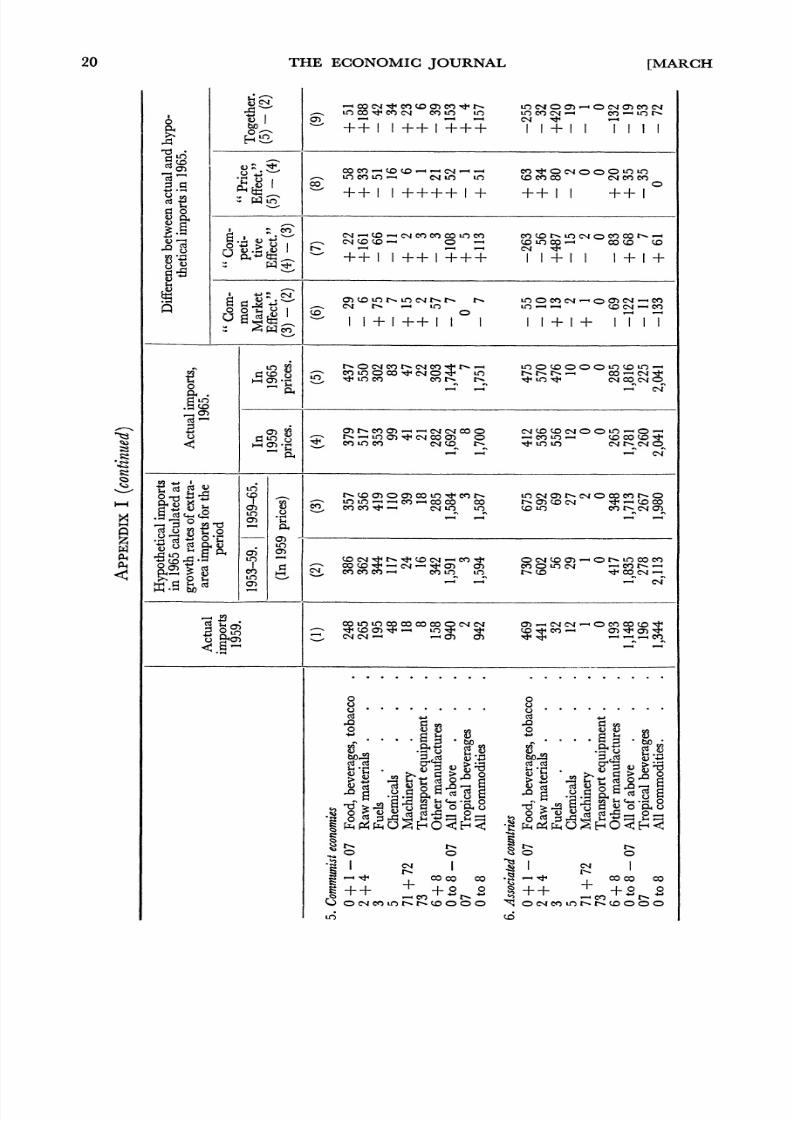
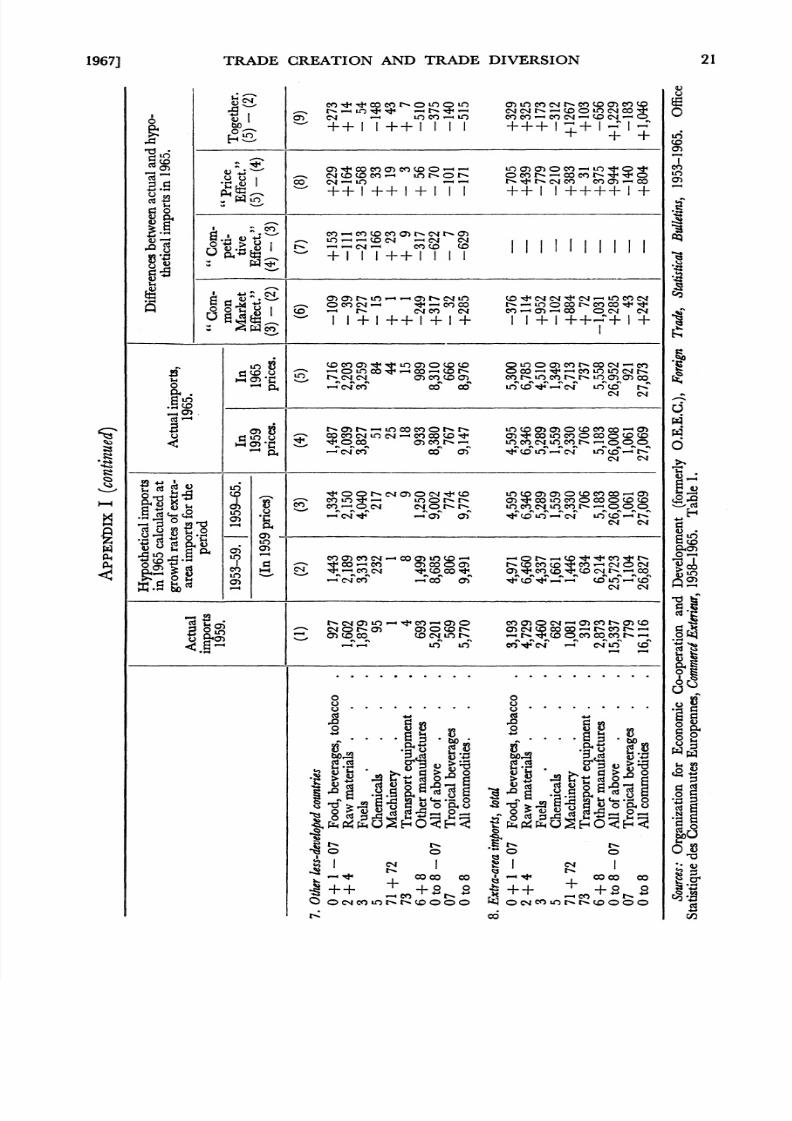
export performance of non-member countries in E.E.C. markets. Non-member countries have been classified in seven groups: (1) the UnitedStates; (2) the United Kingdom; (3) the Continental countries of theEuropean Free Trade Association; (4) Other developed countries;1 (5)Communist economies; (6) Countries and territories associated with theCommon Market; and (7) Other less-developed countries. Among thefactors determining export performance, I have attempted to separate a"Common Market effect," a " competitive effect," and have further cal-culated differences in the value of exports expressed in current and in con-stant prices.
For each supplying area the " Common Market effect " has been takenas the difference between two sets of estimates of hypothetical imports intothe E.E.C., calculated by applying actual growth rates of total extra-areaimports in the periods 1959-65 and 1953-59, respectively, to the 1959 importsof the main commodity categories. In turn, the " competitive effect " givesexpression to changes in the shares of the seven supplying areas in the extra-area imports of these groups of commodities into the Common Market; ithas been derived by summing up the differences between actual imports,measured in constant prices, and hypothetical imports, calculated by apply-ing growth rates of total extra-area imports in the post-integration period tothe 1959 imports of each commodity category.2
Price changes between 1959 and 1965 provide the third influence onexport values. However, in the absence of reliable information on priceelasticities and on changes in relative prices in the appropriate commoditybreakdown, the impact of changes in price-relationships on import volumehas not been estimated. Thus, the " price effect " of Table III refers to the
difference between imports expressed in current and in constant prices. Inthis connection, it should be noted that the use of the same price deflator inregard to the imports of a given commodity category from all suppliers islikely to give rise to errors in estimating the area breakdown of importvolumes.
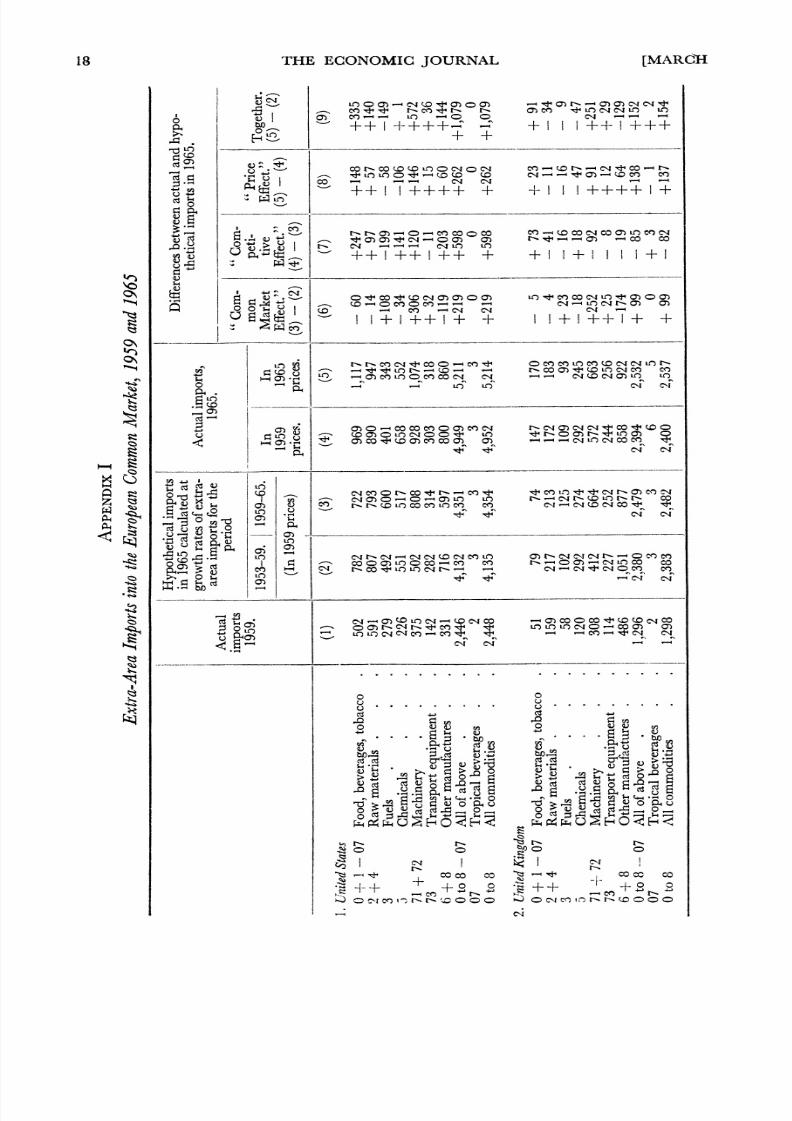
The results of the calculations are shown in Table III and in Appendix1. It appears that a continuation of past trends in the extra-area importsof the eight commodity groups under consideration3 would have led torelatively small discrepancies n the exports of the seven groups of countries
1 This group includes, in addition to the Western European countries that are not members ofeither of the two trade blocs (Finland, Greece, Iceland, Ireland, Spain, Turkey), Canada, Japan,Australia and New Zealand.
2 The " competitive effect " as defined here reflects the influence of supply as well as demandfactors, and it is affected by the commodity composition of exports within each category.
3 To include all commodities in SITC classes 0-8, I have added here tropical beverages (SITC07).
8/2/2019 Trade Creation and Trade DXiversion in the European Common Market
http://slidepdf.com/reader/full/trade-creation-and-trade-dxiversion-in-the-european-common-market 13/22
12 THE ECONOMIC JOURNAL [MARCH
to the Common Market, with deviations from the overall index of 166-5rarely exceeding ten percentage points. But changes in the commoditycomposition of imports following the establishment of the European Com-
TABLE III
Extra-area mports nto the European ommonMarket, 1959 and 1965
Hypothetical importsin 1965 calculated
Actual at growth rates of Actual imports, 1965imports extra-area imports
1959. for the period
1953-59. 1959-65.in in
(In 1959 prices) 1959 prices. 1965 prices.
(1) (2) (3) (4) (5)
United States . 2,448 4,135 4,354 4,952 5,214100 0 168-9 177-9 202-3 213-0
United Kingdom . 1,298 2,383 2,482 2,400 2,537100-0 183*2 191*2 184*9 195-5
Continental E.F.T.A. . 2,448 4,215 4,160 3,874 4 160100-0 172-2 170-0 158-3 170-0
Other developedcountries
1,866 2,896 2,730 2,955 3,194100-0 155*2 146-3 158*4 171*2Communist economies 942 1,594 1,587 1,700 1,751
100.0 169-2 168*5 180*5 185*9Associated countries . 1,344 2,113 1,980 2,041 2,041
100-0 157X2 147X3 151X9 151-9Other less-developed countries 5,770 9,491 9,776 9 147 8,976
100 0 164-5 169-4 158-6 155-6All non-member countries . 16,116 26,827 27,069 27,069 27,873
100-0 166*5 167*9 167*9 172*9
Differences between actual and hypothetical imports, 1965.
"Common "Competitive "Price effect." Together.Mark-et." effect." 5 (4 () (2(3) - (2) (4) - (3) (5-(4 ()-(2
(6) (7) (8) (9)
United States . . +219 +598 +262 +1079United Kingdom . . + 99 - 82 +137 + 154Continental E.F.T.A. . . - 55 -286 +286 - 55Other developed countries . -166 +225 +239 + 298Communist economies . - 7 +113 + 51 + 157Associated countries . . -133 + 61 0 - 72Other less-developed countries +285 -629 -171 - 515All non-member countries +242 --804 +1046
Source: Appendix 1.
mon Market have widened inter-area differences in export performance:the range of the relevant index numbers is 146*3 o 191*2.
Apparently, the United States, the United Kingdom and the less-
8/2/2019 Trade Creation and Trade DXiversion in the European Common Market
http://slidepdf.com/reader/full/trade-creation-and-trade-dxiversion-in-the-european-common-market 14/22
1967] TRADE CREATION AND TRADE DIVERSION 13
developed countries other than those associated with the E.E.C. have, onbalance, benefited from the " Common Market effect " while other countrygroupings have suffered a loss. The United States and the United King-
dom have derived a gain from the highshare of machinery in their exports
to the Community; the less-developed countries have profited from therapid expansion of E.E.C. petroleum imports. In turn, all other areas havebeen handicapped by their reliance on exports of food, raw materials, semi-manufactured and non-durable consumer goods, for which trade diversion sshown. In 1965 sales of these commodities accounted for 90% of the exportsof the group of other developed countries to the Common Market; thecorresponding proportions were 72% for Continental E.F.T.A., 70% forSoviet-type economies, 65% for the associated countries and territories, 55%
for other less-developed countries and the United States, and 47% for theUnited Kingdom.
In addition to benefiting from the " Common Market effect," the UnitedStates has also improved her competitive performance in most commoditycategories, the major exception being fuels. American producers haveincreased their share in Common Market imports of cereals, fruit, fruitpreparations and animal feed within the food, beverages and tobacco group,while the rapid expansion of soybean exports has given rise to above-average gains in the raw materials category. Further, the availability ofnew, technologically advanced, products1 and the existence of excess capacityin American machine-building industries have contributed to the favourableUnited States performance in machinery exports, and United States pro-ducers have also gained in exporting a variety of non-durable consumergoods. On the other hand, the shift from coal to oil in E.E.C. imports,associated with falling prices of petroleum and petroleum products, hasadversely affected the United States performance within the fuels group.
Increases in her exports of livestock to the E.E.C. from $4 million to $64
million largely explain the positive competitive effect shown for the UnitedKingdom in the food, beverages and tobacco group, with rising exports ofwhisky as a further contributing factor. However, Britain's competitiveposition has apparently deteriorated n most other commodity groups. These" competitive " losses have largely wiped out the gain Britain has derivedfrom the " Common Market effect."
A negative " competitive effect " is indicated also in the case of theContinental E.F.T.A. countries. Among these countries, Denmark hasbeen the main loser following the reduction of butter imports into the Com-mon Market, and she also experienced a fall in her share of E.E.C. imports oflivestock, fresh meat, cereals and cheese. Furthermore, with capacitylimitations restricting the- expansion of machinery production and a rela-tively unfavourable product-mix, the Continental E.F.T.A. countries have
1 The commodities n question nclude computer equipment, elecommunication quipment,electronic ubes and measuring devices, special machine tools, etc.
8/2/2019 Trade Creation and Trade DXiversion in the European Common Market
http://slidepdf.com/reader/full/trade-creation-and-trade-dxiversion-in-the-european-common-market 15/22
14 THE ECONOMIC JOURNAL [MARCH
not been able fully to utilise the opportunities offered through the growth ofdemand for machinery in the Common Market.
With the exception of food and raw materials, other developed countries
appear to have improved their competitive position in all commodity cate-gories. The greatest improvements have taken place in semi-manufacturesand non-durable consumer goods, where Japanese exports to the CommonMarket rose from $46 million in 1959 to $239 million in 1965. Increases havebeen especially pronounced in exports of steel, clothing as well as photo-graphic, medical and scientific instruments. Japan has also gained in themachinery group, with exports rising from $5 million to $65 million in thisperiod. On the other hand, Australian exports of wheat have been acasualty of Common Market agricultural policy and have accounted for much
of the " competitive " losses shown in the food, beverages and tobaccogroup.
Communist countries have experienced " competitive" gains in food andraw materials, as against losses in fuels. Within the first group much of theexpansion has taken place in live animals, meat preparations and fruits ex-ported chiefly from Hungary and Poland. Among raw materials, the SovietUnion has made considerable gains in wood and lumber, where resourcelimitations have restricted the expansion of exports from other areas; inturn, the reduced reliance on Soviet sources of supply of petroleum has foundits origin in the energy policy followed by the E.E.C. countries.
The performance of the countries and territories associated with theCommon Market has largely been determined by changes in the patternof French trade with Algeria. On the one hand, the decline in French im-ports of Algerian wine to a great extent explains the loss shown in regard tothe food, beverages and tobacco group; on the other, the rise in imports ofAlgerian oil from $17 million in 1959 to $418 million in 1965 accounts forthe spectacular increase in the associated countries' fuel exports.
But while increased Algerian exports of petroleum cut into the share ofthe Middle East, there is no evidence that the establishment of the CommonMarket would have led to a shift in the sources of supply of imports fromother developing countries to the associated countries and territories. Therehas been no change in the relative share of competing suppliers in E.E.C.imports of tropical beverages, for example. On the other hand, among non-associated countries, Zambia has benefited from the relatively slow increasein the exports of copper from the former Belgian Congo that accounts formuch of the decline in the share of the associated countries in E.E.C. im-ports of semi-manufactures.
Finally, in the exports of non-member countries to the Common Marketimproved prices of some foods and metals, machinery and transport equip-ment, as well as consumer non-durables and semi-manufactures, have notbeen fully offset by the fall in the prices of petroleum and chemicals. Still,the " price effect " has been unfavourable for the group of other developing
8/2/2019 Trade Creation and Trade DXiversion in the European Common Market
http://slidepdf.com/reader/full/trade-creation-and-trade-dxiversion-in-the-european-common-market 16/22
1967] TRADE CREATION AND TRADE DIVERSION 15
countries, in whose exports fuels play a major part. And, were we to con-sider the purchasing power of the exports of non-member countries, itwould appear that increases in the prices of their imports from the E.E.C.
havemore than counterbalanced the rise in export prices.
V
The evidence provided in this paper points to the trade-creative effectsof the Common Market. In turn, while trade diversion is indicated in re-gard to several commodity categories, the " external trade creation " ob-served in the case of fuels and machinery has apparently compensated thenon-member countries, taken together, for these trade-diverting effects.At the same time the impact of the Common Market on individual suppliershas been shown to vary greatly, depending on the commodity compositionof their exports to the E.E.C.
The reader will recall that the analysis hinges on the assumption that theexpost ncome elasticities of import demand would have remained unchangedin the absence of integration. Structural changes may indeed have affectedthe measured expost income elasticities, yet one can hardly find an explana-tion other than the Common Market effect for the systematic differences
observed n regard to changes in the rate of expansion of intra-area and extra-area imports between the two periods.' With the exception of the fuelsand machinery group, expost ncome elasticities of import demand are higherfor intra-area trade than for imports from non-member countries, and thelatter have a negative sign. Autonomous price changes cannot account forthe results either, since the competitive position of E.E.C. producers hasdeteriorated in recent years.
Price (unit value) indices in international trade are subject to a consider-able margin of error, hence I have compared changes in domestic prices in-stead. In the Common Market countries the G.N.P. price deflator inmanufacturing rose, on the average, 2.6% a year between 1959 and 1965, asagainst an annual increase of 1.0% in the United States and 1.6% in theUnited Kingdom.2 Thus, price changes have benefited foreign suppliers,and disparities in changes of intra-area and extra-area import demand
I In this connection it should be emphasised that the impact of the formation of the E.E.C. ontrade flows is hardly confined to the effects of tariff reductions actually undertaken. Rather, inmaking decisions regarding production, investment and trade, entrepreneurs take account of
future reductions-and the prospect of an ultimate and irrevocable elimination-of tariffs. Ac-cordingly, the Common Market effect can be assumed to operate through actual tariff changes,anticipations of future changes in tariffs and the decrease in the risk and uncertainty associated withthe possibility of a reimposition of tariffs and other trade barriers.
2 Organization for Economic Co-operation and Development, General Statistics, January 1965,and National AccountsStatistics, 1955-64 (Paris, 1966). To ensure intemational comparability, Ihave adjusted the domestic price indices for changes in the exchange rates. United States data referto the period 1959-64.
8/2/2019 Trade Creation and Trade DXiversion in the European Common Market
http://slidepdf.com/reader/full/trade-creation-and-trade-dxiversion-in-the-european-common-market 17/22
16 THE ECONOMIC JOURNAL [MARCH
elasticities between pre-integration and post-integration periods would havebeen larger rather than smaller in the absence of price increases n the Com-mon Market relative to its competitors.
This paper has presented some tentative conclusions regarding the impactof the European Economic Community on trade flows during the six-yearperiod that has elapsed since the Common Market's establishment. Thus,the results pertain to the short-term effects of the E.E.C., and cannot be im-mediately applied in judging the possible long-term repercussions of theE.E.C. on trade flows. Nevertheless, they can be used to speculate on pos-sible future changes.
There is little doubt that the trade creation observed in regard to manu-factured goods will continue as internal tariffs and the uncertainty associatedwith the possibility of the reimposition of tariffs and other trade barriersdisappear. Indications point to an increased exchange of consumer goods,specialisation in narrower ranges of products in machine building and thesubdivision of production processes without regard to national frontiers.At the same time the application of the common agricultural policy and in-creasing tariff discrimination against outsiders can be expected to augmentthe trade-diverting effects of the Common Market.
In fact, the rate of discrimination and changes in extra-area mports havebeen negatively correlated during the period under consideration: the
expost ncome elasticity of demand for extra-area mports of manufactured goodshas declined pari passu with the increase in tariff discrimination against non-member countries. This elasticity fell from 2-7 in the years 1959-61 to 2.3in 1961-63 and again to 1-4 in 1963-65, while internal duties were at 70%of their pre-Common Market levels in 1961, 60% in 1963 and 30% in 1965.Similar observations pertain to the individual categories of manufacturedgoods as well as to raw materials.
In turn, it has been argued that the trade-diverting effects of the Com-
mon Market would be offset by an expansion of imports associated with theacceleration of economic growth resulting from the E.E.C.'s establishment.But has the rate of growth of national income in the E.E.C. countries ex-ceeded the growth rate that would have been obtained in the absence ofintegration? While it is difficult to provide an answer to this question, anindication can be provided of the absolute magnitude of trade creation andits possible implications for the rate of growth.
According to the results shown in Table I, a I % increase in the grossnational product has been accompanied by a rise of 2 1% in the total importsof the E.E.C. countries in the period 1959-65, while the correspondingelasticity was 1-8 in 1953-59. Assuming that this difference has been due tothe Common Market effect, the question remains to what extent the increasein trade has contributed to the growth of G.N.P. Rather than estimatingthe once-for-all static gains from improved resource allocation, I will con-sider the dynamic benefits of increased trade that are derived from economies
8/2/2019 Trade Creation and Trade DXiversion in the European Common Market
http://slidepdf.com/reader/full/trade-creation-and-trade-dxiversion-in-the-european-common-market 18/22
1967] TRADE CREATION AND TRADE DIVERSION 17
of scale, longer production runs and increased specialisation.1 In this con-nection, reference can be made to the results obtained by A. A. Walters onthe probable extent of large-scale economies in the United States. Accord-ing to Walters, in the first half of the century a doubling of inputs in theUnited States non-agricultural sector has been accompanied by an approxi-mately 130% increase in output due to the economies of large-scale produc-don.2
Assuming that increases in trade in the Common Market entail a cor-responding rise in the output of firms producing for export, we may applyWalters' results to indicate the impact of the expansion of trade on pro-ductivity, and hence on G.N.P. It would appear, then, that the 0 3 per-centage point rise in the ratio of the annual increment of trade to that of
G.N.P. would be accompanied by a one-tenth of one percentage point in-crease in the growth rate. By 1965 the cumulative effect of the CommonMarket's establishment on the gross national product of the member countrieswould thus have reached one-half of 1% of G.N.P.3
While the application of Walters' findings to the Common Market isopen to criticism, the results may provide a general order of magnitude.Assume, for example, that the complete elimination of tariffs would doublethe trade creating effects of the E.E.C. estimated for the period 1959-1965.The impact of the corresponding rise in the growth rate of G.N.P. (from,say, 5-3 to 5 5%) on extra-area imports would then offset a decrease in theincome elasticity of import demand not exceeding one-twentieth of onepercentage point (from 1 6 to 1.55). Needless to say, these figures serve forillustrative purposes only, since trade creation and trade diversion for thecase of the complete elimination of tariffs have not been estimated.
BELA BALASSAYale University nd International ank or
Reconstruction nd Development.
' On the static gains of tariff reductions, see Bela Balassa and M. E. Kreinen, " Trade Liberaliza-tion and the Kennedy Round: The Static Effects," Reviewof Economics nd Statistics, forthcoming.
2 A. A. Walters, " A Note on Economies of Scale," ibid., November, 1963, pp. 425-27.3 In the paper cited above, Duquesne de la Vinelle concludes that, by 1964, trade creation has
contributed to an increase of the gross national product of the Common Market by 4-5%. But thisresult does not stand up to close scrutiny since it is predicated on the assumption that the statisticalrelationship between increases in G.N.P. and in trade is bidirectional. With an income elasticityof import demand of 2, this would mean that a 1% increase in trade would lead to a i% risein the gross national product. Since in the Common Market trade accounts for about one-fourthof G.N.P., and Duquesne de la Vinelle calculated with a 9% increase in trade, the absolute increasein the gross national product due to trade creation would be double the increment in E.E.C. trade.
No. 305.-VOL. LXXVII. C
8/2/2019 Trade Creation and Trade DXiversion in the European Common Market
http://slidepdf.com/reader/full/trade-creation-and-trade-dxiversion-in-the-european-common-market 19/22
18 THE ECONOMIC JOURNAL [MARCH
APPENDIXI
Extra-Area
Imports
intothe
European
Common
Market,
1959
and
1965
Hypothetical
imports
Differences
between
actual
and
hypo-
in
1965
calculatedat
D
between
actu
an
hypo-
growth
ratesof
extra-
Actual
imports,
thetical
importsin
1965.
Actual
area
imports
for
the
1965.
_
___
imports
period
Com-
"Com-
1959.
-mon
peti-
"Price
1953-59.
1
1959-65.
In
In
Market
tive
Effect
Together.
1959
1965
Effect."
Effect."
(5)-
(4)
(5)-(2)
(In
1959
prices)
prices.
prices.
(3)-
(2)
(4)-
(3)
(1)
(2)
(3)
(4)
(5)
(6)
(7)
(8)
(9)
1
United
States
0+1-
07
Food,
beverages,
tobacco.
502
782
722
969
1,117
-
60
+247
+148
+335
2+4
Raw
materials.
.
591
807
793
890
947
-
14
+
97
+
57
+140
3
Fuels
.
,
.
.
279
492
600
401
343
+108
-199
-
58
-149
Chemicals
.
.
.
226
551
517
658
552
-
34
+141
-106
+
1
71+
72
Machinery
.
.
.
375
502
808
928
1,074
+306
+120
+146
+572
73
Transport
equipment.
.
142
282
314
303
318
+
32
-11
+
15
+
36
+8
Other
manufactures.
.
331
716
597
800
860
-119
+203
+
60
+144
0to
8-07
Allof
above
.
.
2,446
4,132
4,351
4,949
5,211
+219
+598
+262
+1,079
07
Tropical
beverages
.
2
3
3
3
3
0
0
0
0
0to8
All
commodities
.
.
2,448
4,135
4,354
4,952
5,214
+219
+598
+262
+1,079
2.
U,nited
Kingdom
I
0+I-
07
Food,
beverages,
tobacco.
51
1
79
74
147
170
-
5
+
73
+
23
+91
2+4
Raw
materials.
.
.
159
217
213
172
183
-
4
-41
-
11
-
34
3
Fuels
.
.
.
.
58
102
125
109
93
+
23
16
-16
-
9
5
Chemicals
.
.
120
292
274
292
245
-
18
+
18
-
47
-
47
71
+
72
Machinery
.
.
.
308
412
664
572
663
+252
-
92
+
91
+251
73
Transport
equipment.
.
114
227
252
244
256
+
25
-
8
+
12
+-
29
6+8
Other
manufactures.
.
486
1,051
877
858
922
-174
-
19
+
64
-129
0to8
--07
Allof
above
.
.
1,296
2,380
2,479
2,394
2,532
+
99
-1
85
+138
d-
152
07
Tropical
beverages
.
.
2
3
3
6
5
0j
+
3
-1
+
2
0to8
All
commodities
.
.
1,298
2,383
l
2,482
1
2,400
2,537
+
99
-82I
+137
I
+154
_________
_________
_____1,____
_____
___
_____
_______
t_____
___j_______
___
__
___._______
.___I__
__
I_______
________
8/2/2019 Trade Creation and Trade DXiversion in the European Common Market
http://slidepdf.com/reader/full/trade-creation-and-trade-dxiversion-in-the-european-common-market 20/22
1967] TRADE CREATION AND TRADE DIVERSION 19
APPENDIXI
(continued)
Hypothetical
imports
Differences
between
actual
and
hypo-
in
1965
calculatedat
growth
ratesof
extra-
Actual
imports,
thetical
importsin
1965.
Actual
area
imports
for
the
1965.
imports
period
"Com-
"Com-
1959.
mon__
___eti__
_
__Price___
1953-59.
|
1959-65.
P
Togetherm
__________________
In
In
Market
tive
Effect."
Together
1959
1965
Effect."
Effect."
(5)-
(4)
(5)-(2)
(In
1959
prices)
prices.
prices.
(3)-
(2)
(4)-
(3)
(1)
(2)
(3)
(4)
(5)
(6)
(7)
(8)
(9)
3.
Continental
EFTA
0+1-07
Food,
beverages,
tobacco
455
708
655
496
572
-
53
-159
+
76
-136
2+4
Raw
materials
.
.
666
910
893
915
973
-
17
+
22
+
58
+
63
3
Fuels
.
.
.
12
21
26
22
19
+
5
-4
-3
-2
5
Chemicals
148
360
338
335
281
-
24
-
3
-
54
-
79
71+
72
Machinery
.
359
481
774
648
751
+293
-126
+103
+270
73
Transport
equipment.
.
44
87
98
96
101
+11
-
2
+
5
+
14
6+8
Other
manufactures.
.
758
1,640
1,368
1,356
1,458
-272
-
12
+102
-182
0to8
-07
Allof
above
.
2,442
4,207
4,152
3,868
4,155
-
55
-284
+287
-
52
07
Tropical
beverages
.
6
8
8
6
5
0
-2
-1
-3
Oto8
All
commodities
.
2,448
4,215
4,160
3,874
4,160
-
55
-286
+286
-
55
4.
Other
developed
countries
0+1-07
Food,
beverages,
tobacco.
541
843
778
705
813
-
65
-
73
+108
-
30
2+4
Raw
materials
.
.
1,005
1,373
1,349
1,277
1,359
-
24
-
72
+
82
-
14
3
Fuels
.
.
.
5
9
10
21
18
+
1
+11
3
+
9
5
Chemicals
.
33
80
76
112
94
-
4
+36
-18
+
14
71+
72
Machinery
.
19
25
41
116
134
+
16
+
75
+
18
+109
73
Transport
equipment
7
14
15
24
25
+1
+
9
+1
+11
6+8
Other
manufactures.
.
254
549
458
689
741
-91
+231
+
52
+192
0to
8-07
Allof
above
.
.
1,864
2,893
2,727
2,944
3,184
-166
+217
+240
+291
07
Tropical
beverages
.
.
2
3
3
11
10
0
+
8
-1
+
7
0to8
All
commodities
1,866
2,896
2,730
2,955
3,194
-166
+225
+239
+298
8/2/2019 Trade Creation and Trade DXiversion in the European Common Market
http://slidepdf.com/reader/full/trade-creation-and-trade-dxiversion-in-the-european-common-market 21/22
20 THE ECONOMIC JOURNAL [MARCH
APPENDIXI
(continued)
Hypothetical
imports
Differences
between
actual
and
hypo-
in
1965
calculatedat
growth
ratesof
extra-
Actual
imports,
Actual
area
importsfor
the
1965.
imports
period
"Com-
"Com-
1959.
i
1953-59.|
1959-65.1
In
l
2
mon
peti-
"Price
1953-59.
1959-65.
In
In
Market
tive
Effect."
Together.
1959
1965
Effect."
Effect."
(5)-
(4)(5
(2
(In
1959
prices)
prices.
prices.
(3)-
(2)
(4)-
(3)
(1)
(2)
(3)
(4)
(5)
(6)
(7)
(8)
(9)
5.
Communist
economies
0+1-
07
Food,
beverages,
tobacco
.
248
386
357
379
437
-
29
+
22
+
58
+51
2+4
Raw
materials.
.
265
362
356
517
550
-
6
+161
+
33
+188
3
Fuels
.
.
.
.
195
344
419
353
302
+
75
-
66
-
51
-
42
5
Chemicals
.
.
48
117
110
99
83
-
7
-11
-
16
-
34
71+72
Machinery
.
.
.
18
24
39
41
47
+
15
+
2
+
6
+
23
73
Transport
equipment.
.
8
16
18
21
22
+
2
+
3
+1
+
6
6+8
Other
manufactures.
.
158
342
285
282
303
-
57
-
3
+
21
-
39
0to
8-07
Allof
above
.
.
.
940
1,591
1,584
1,692
1,744
-
7
+108
+
52
+153
07
Tropical
beverages
.
.
2
3
3
8
7
0
+
5
-1
+
4
0to8
All
commodities
.
942
1,594
1,587
1,700
1,751
-
7
+113
+
51
+157
6.
Associated
countries
0+1-
07
Food,
beverages,
tobacco
469
730
675
412
475
-
55
-263
+
63
-255
2+4
Raw
materials.
.
.
441
602
592
536
570
-
10
-
56
+
34
-
32
3
Fuels
.
.
.
32
56
69
556
476
+
13
+487
-
80
+420
5
Chemicals
.
.
12
29
27
12
10
-
2
-
15
-2
-
19
71+72
Machinery
.
.
.
1
1
2
0
0
+1
-2
0
-1
73
Transport
equipment.
.
0
0
0
0
0
0
0
0
0
6+8
Other
manufactures.
.
193
417
348
265
285
-
69
-
83
+
20
-132
Oto
8-07
Allof
above
.
.
1,148
1,835
1,713
1,781
1,816
-122
+
68
+
35
-
19
07
Tropical
beverages
196
278
267
260
225
-11
-
7
-
35
-
53
0to8
All
commodities.
.
.
1,344
2,113
1,980
2,041
2,041
-133
+61
0
-
72
8/2/2019 Trade Creation and Trade DXiversion in the European Common Market
http://slidepdf.com/reader/full/trade-creation-and-trade-dxiversion-in-the-european-common-market 22/22
1967] TRADE CREATION AND TRADE DIVERSION 21
APPENDIXI
(continued)
Hypothetical
imports
Differences
between
actual
and
hypo-
in
1965
calculatedat
thetc
al
an1965
-
growth
ratesof
extra-
Actual
imports,
Actual
area
imports
for
the
1965.
imports
period
"Com-
"Com-
1959
195-59.
1565mon
peti-
"Price
| 1959
1953-59.
|1959-65.
|In
In
Market
tive
Effect."
1
9|.5
1965
Effect."
Effect."
(5)-
(4)
(5)
(In
1959
prices)
prices,
prices.
(3)-
(2)
(4)-
(3)
(1)
(2)
(3)
(4)
(5)
(6)
(7)
(8)
(9)
7.
Other
less-developed
countries
0+1-07
Food,
beverages,
tobacco.
927
1,443
1,334
1,487
1,716
-109
+153
+229
+273
2+4
Raw
materials.
.
.
1,602
2,189
2,150
2,039
2,203
-
39
-111
+164
+
14
3
Fuels
.
.
.
.
1,879
3,313
4,040
3,827
3,259
+727
-213
-568
-
4
5
Chemicals
.
.
.
95
232
217
51
84
-
15
-166
+
33
148
71+
72
Machinery
.
.
.
1
1
2
25
44
+1
+
23
+
19
+
43
73
Transport
equipment.
.
4
8
9
18
15
+1
+
9
-
3
+
7
6+8
Other
manufactures.
.
693
1,499
1,250
933
989
-249
-317
+
56
510
0to8
-07
Allof
above
.
.
.
5,201
8,685
9,002
8,380
8,310
+317
-622
-
70
375
07
Tropical
beverages
.
.
569
806
774
767
666
-
32
-
7
-101
140
0to8
All
commodities.
.
.
5,770
9,491
9,776
9,147
8,976
+285
-629
-171
515
8.
Extra-area
imports,
total
0+1-07
Food,
beverages,
tobacco.
3,193
4,971
4,595
4,595
5,300
-376
+705
329
2+4
Raw
materials.
.
.
4,729
6,460
6,346
6,346
6,785
-114
+439
+325
3
Fuels
.
.
.
.
2,460
4,337
5,289
5,289
4,510
+952
-779
173
5
Chemicals
.
.
.
682
1,661
1,559
1,559
1,349
-102
-210
312
71+
72
Machinery
.
.
.
1,081
1,446
2,330
2,330
2,713
+884
+383
+
1267
73
Transport
equipment.
.
319
634
706
706
737
+
72
+31
103
6+8
Other
manufactures.
.
2,873
6,214
5,183
5,183
5,558
-1,031
-
+375
656
0to8
-07
Allof
above
.
.
.
15,337
25,723
26,008
26,008
26,952
+285
1
+944
+
07
Tropical
beverages
.
.
779
1,104
1,061
1,061
921
-
43
_
-140
0to8
All
commodities
.
.
16,116
26,827
27,069
27,069
27,873
+242
-
+804
0 6
Sources:
Organization
for
Economic
Co-operation
and
Development
(formerly
O.E.E.C.),
Foreign
Trade,
Statistical
Bulletins,
1953-1965.
Statistiquedes
Communautes
Europennes,
Commerci
Exterieur,
1958-1965.
Table1.