Embed Size (px)
Citation preview
Traffic Modelling
Network Management & Information Centre
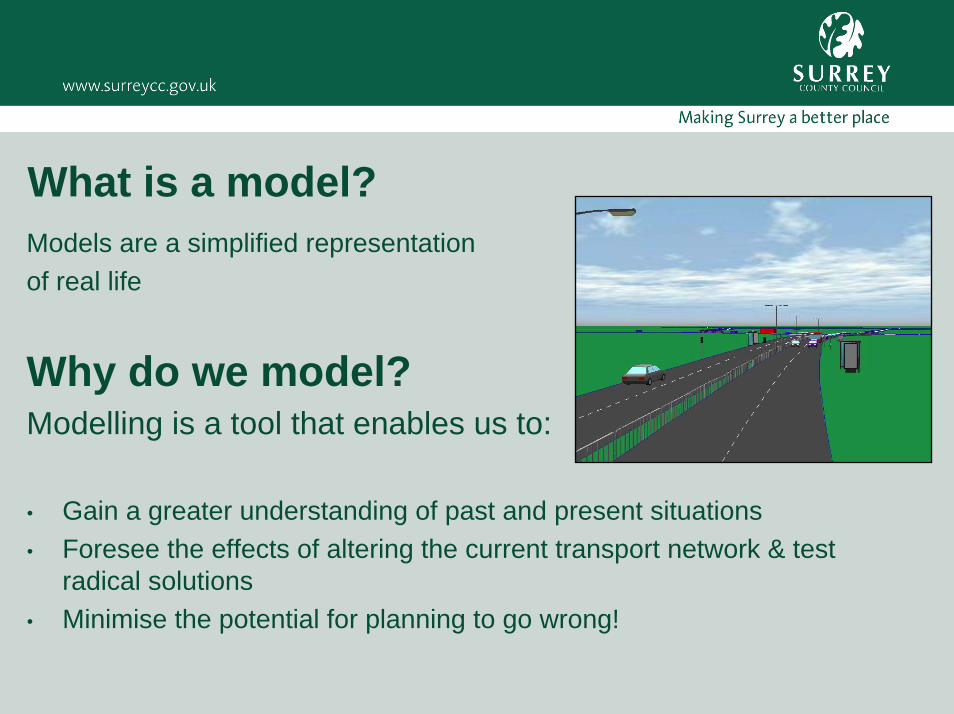
What is a model?Models are a simplified representationof real life
Why do we model?Modelling is a tool that enables us to:
• Gain a greater understanding of past and present situations• Foresee the effects of altering the current transport network & test
radical solutions• Minimise the potential for planning to go wrong!
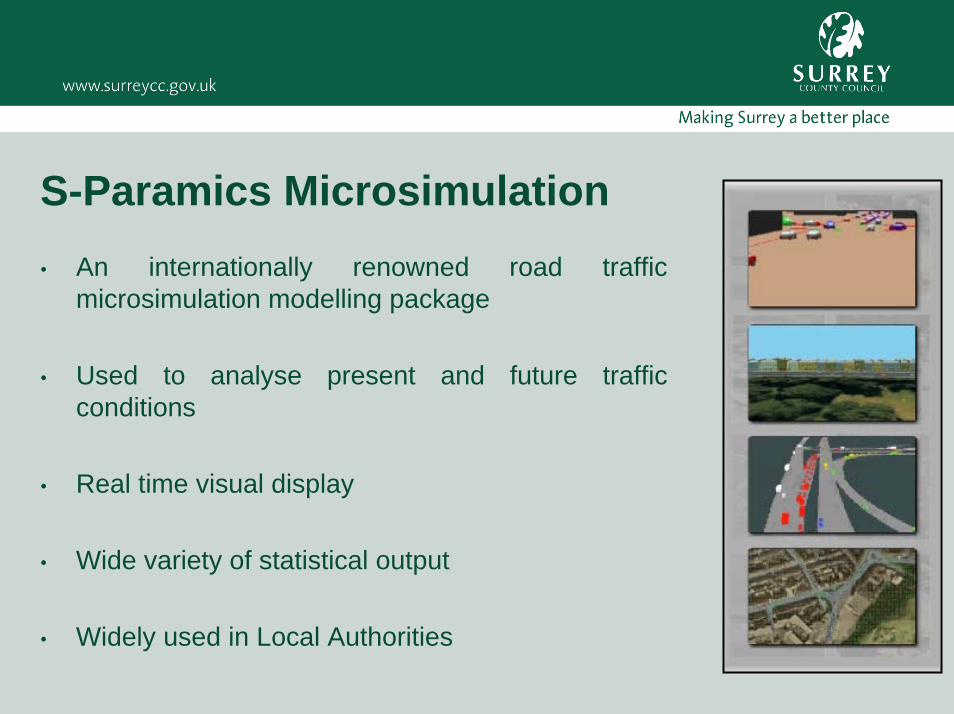
S-Paramics Microsimulation• An internationally renowned road traffic
microsimulation modelling package
• Used to analyse present and future traffic conditions
• Real time visual display
• Wide variety of statistical output
• Widely used in Local Authorities
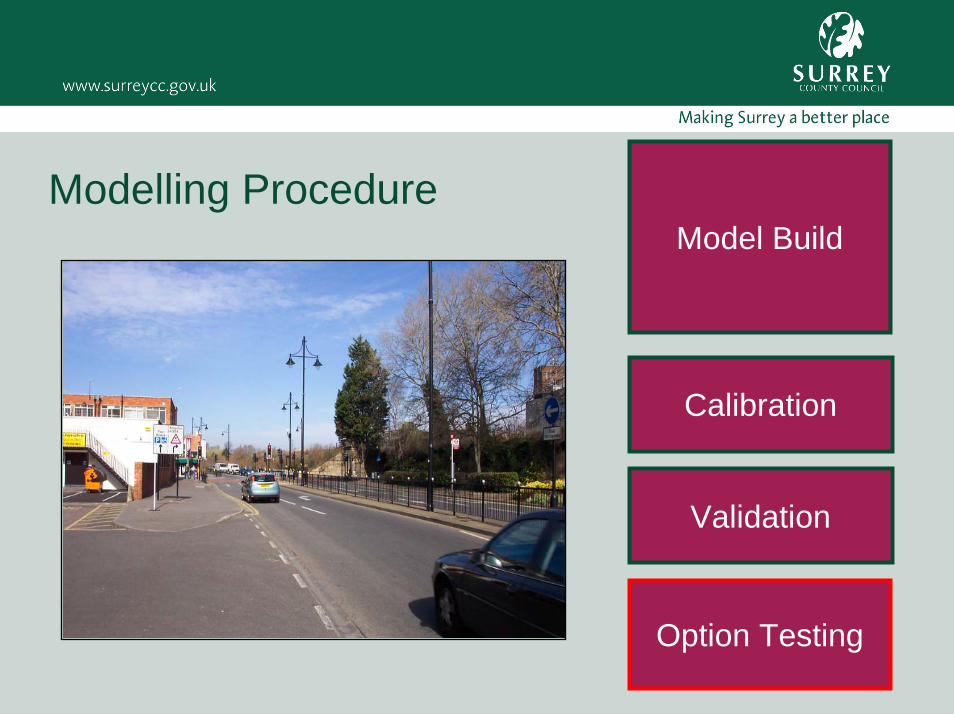
Model BuildModelling Procedure
Calibration
Validation
Option Testing
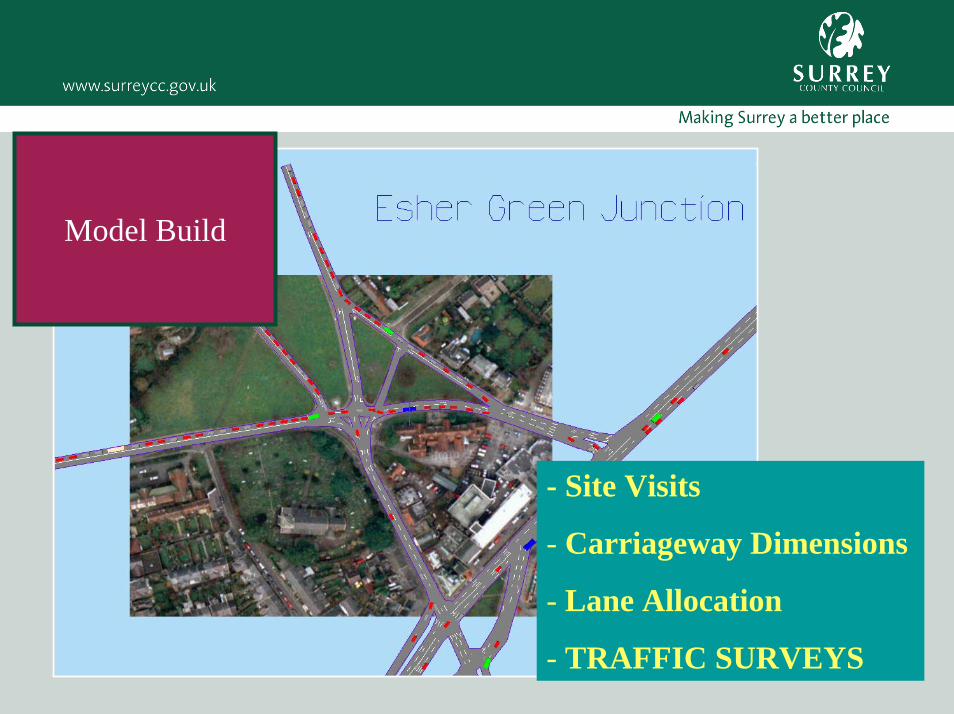
Model Build
- Site Visits
- Carriageway Dimensions
- Lane Allocation
- TRAFFIC SURVEYS
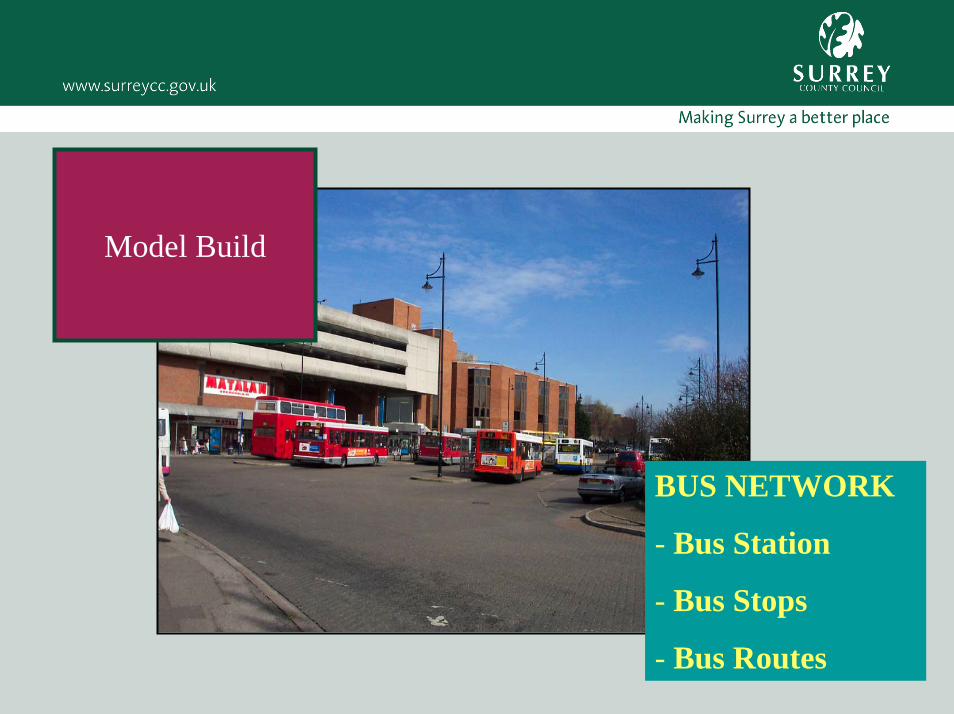
Model Build
BUS NETWORK
- Bus Station
- Bus Stops
- Bus Routes
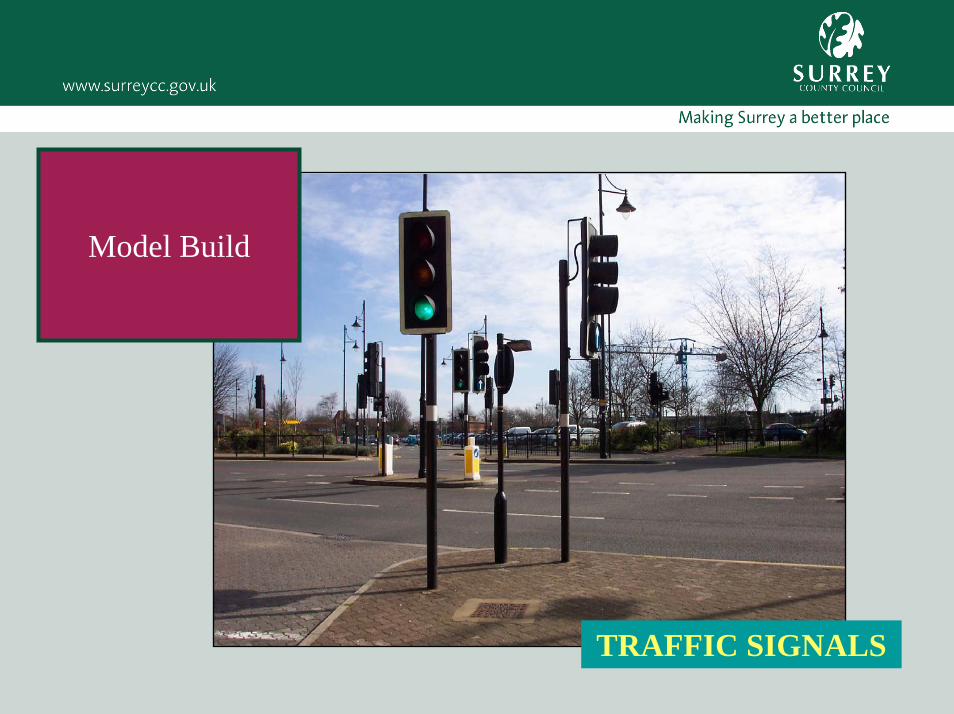
Model Build
TRAFFIC SIGNALS
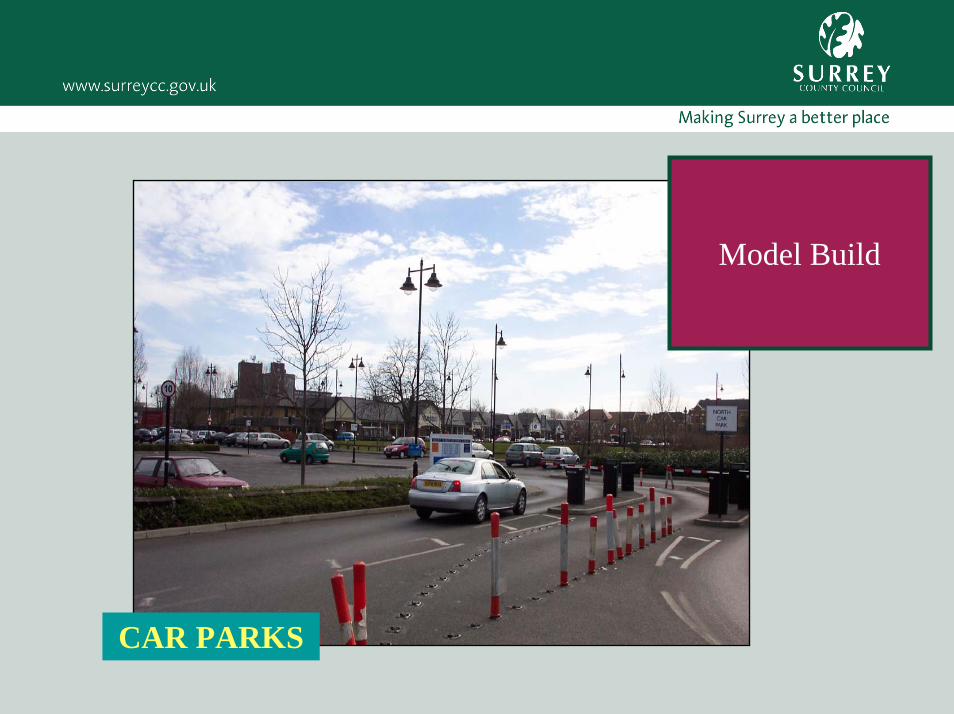
Model Build
CAR PARKS
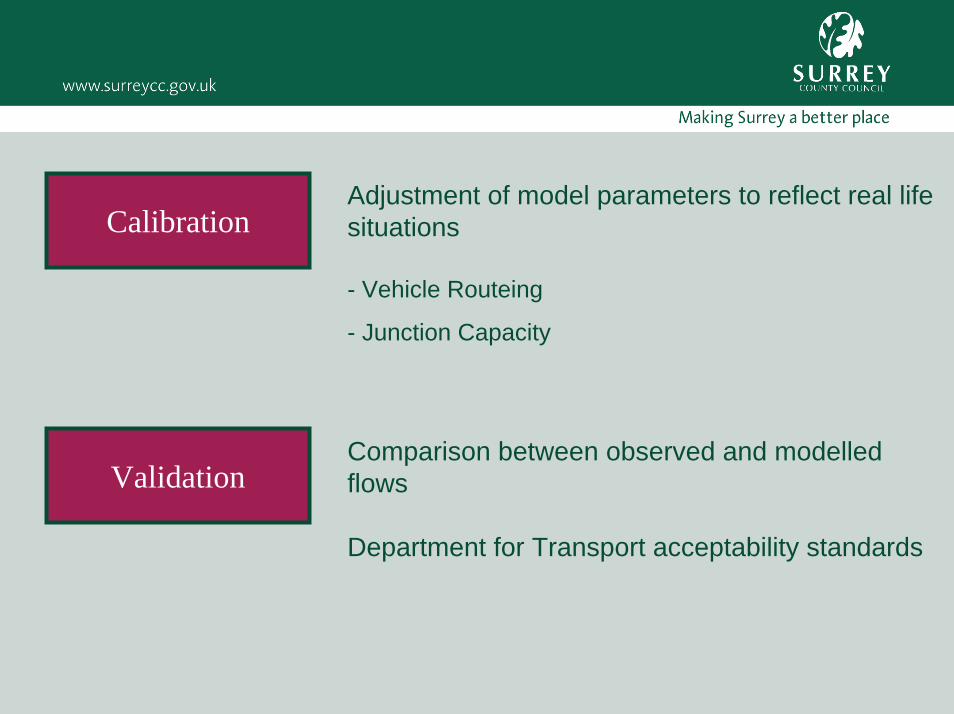
CalibrationAdjustment of model parameters to reflect real life situations
- Vehicle Routeing
- Junction Capacity
ValidationComparison between observed and modelled flows
Department for Transport acceptability standards
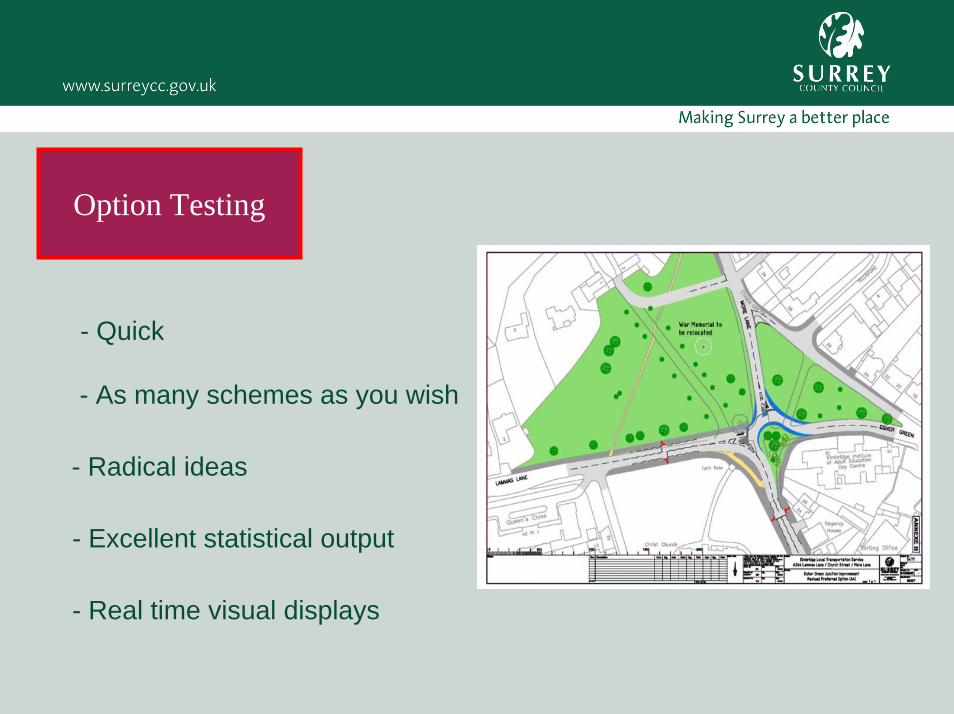
Option Testing
- Quick
- As many schemes as you wish
- Radical ideas
- Excellent statistical output
- Real time visual displays
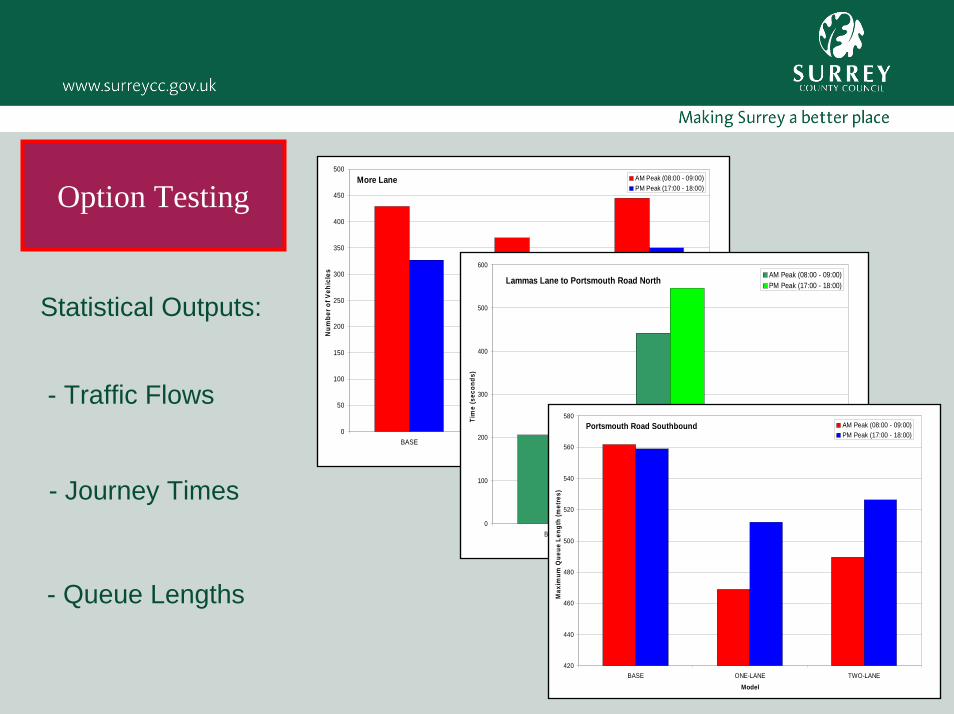
Option Testing
0
50
100
150
200
250
300
350
400
450
500
BASE ONE-LANE TWO-LANE
Model
Num
ber o
f Veh
icle
s
AM Peak (08:00 - 09:00)PM Peak (17:00 - 18:00)
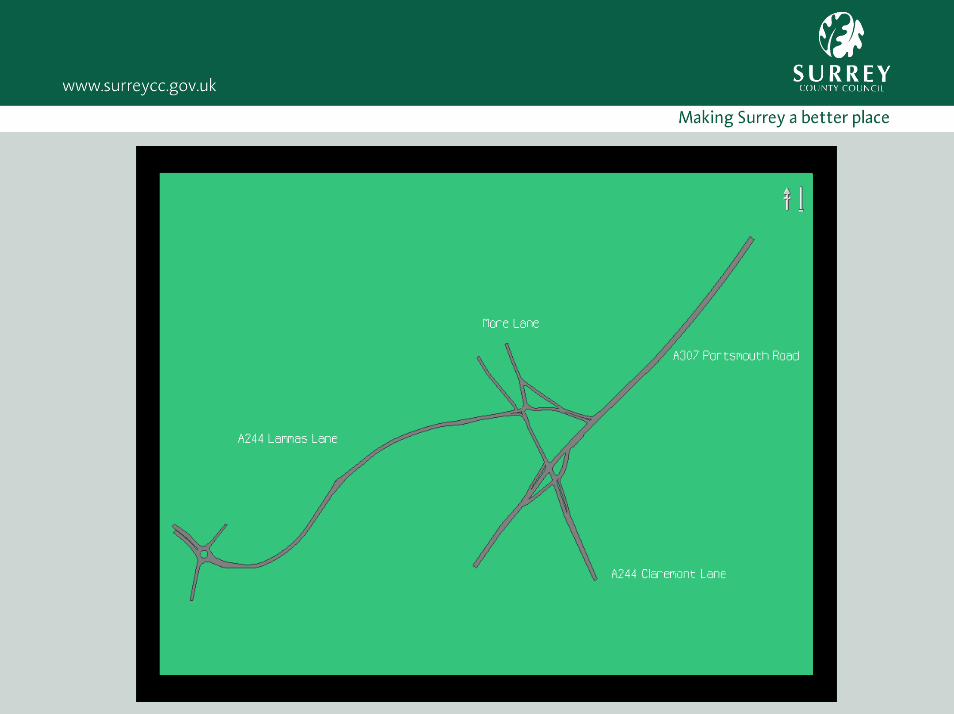
More Lane
0
100
200
300
400
500
600
BASE ONE-LANE TWO-LANE
Model
Tim
e (s
econ
ds)
AM Peak (08:00 - 09:00)PM Peak (17:00 - 18:00)Lammas Lane to Portsmouth Road North
420
440
460
480
500
520
540
560
580
BASE ONE-LANE TWO-LANE
Model
Max
imum
Que
ue L
engt
h (m
etre
s)
AM Peak (08:00 - 09:00)PM Peak (17:00 - 18:00)
Portsmouth Road Southbound
Statistical Outputs:
- Traffic Flows
- Journey Times
- Queue Lengths
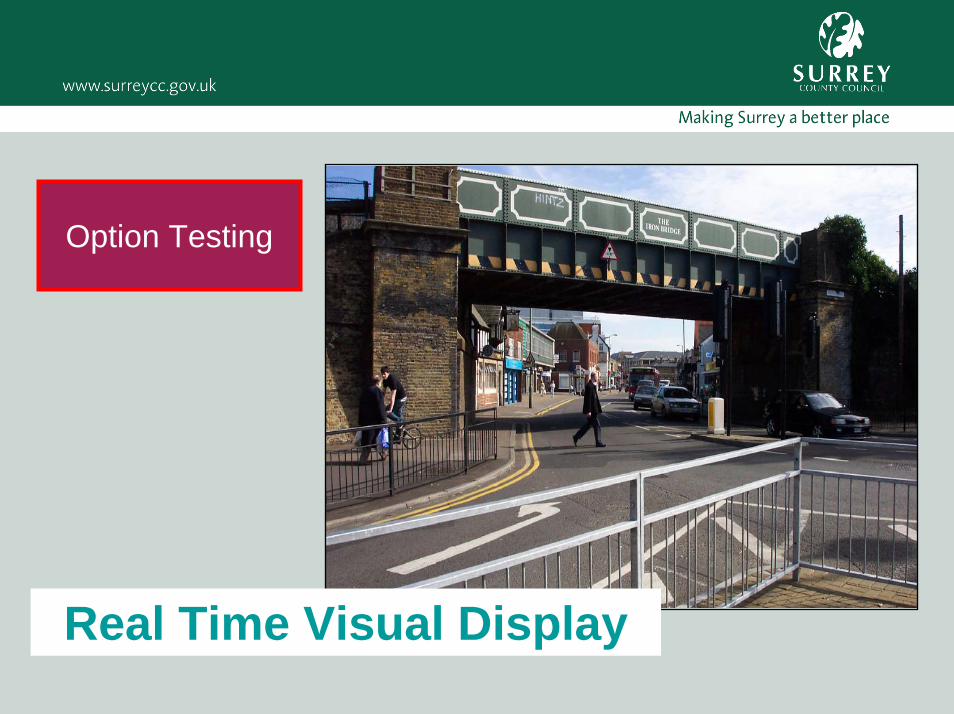
Option Testing
Real Time Visual Display
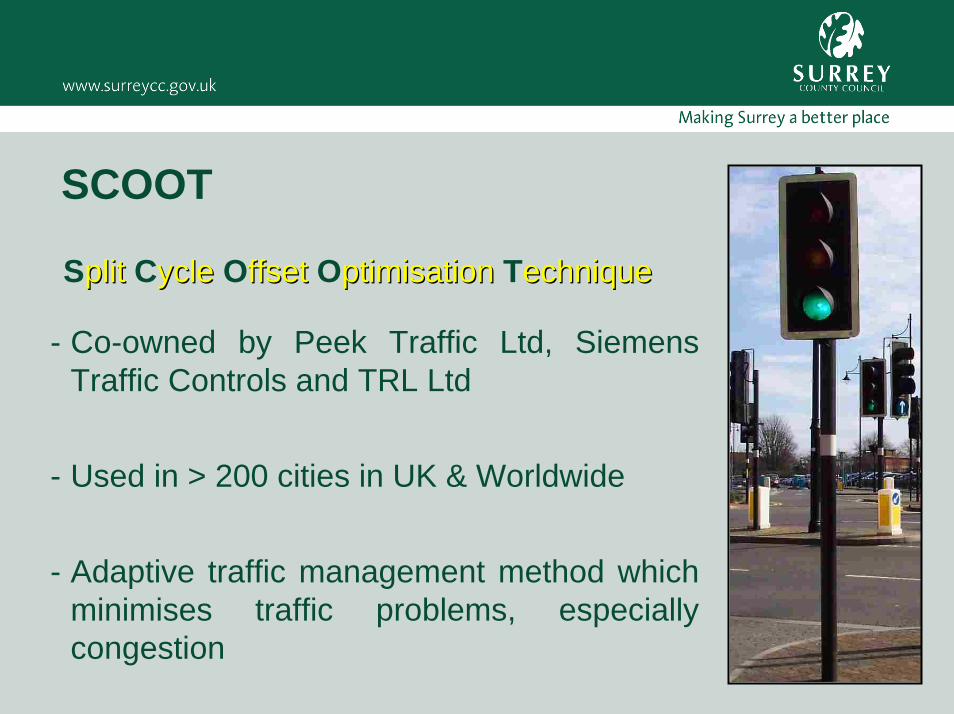
SCOOT
Splitplit Cycleycle Offsetffset Optimisationptimisation Techniqueechnique
- Co-owned by Peek Traffic Ltd, Siemens Traffic Controls and TRL Ltd
- Used in > 200 cities in UK & Worldwide
- Adaptive traffic management method which minimises traffic problems, especially congestion
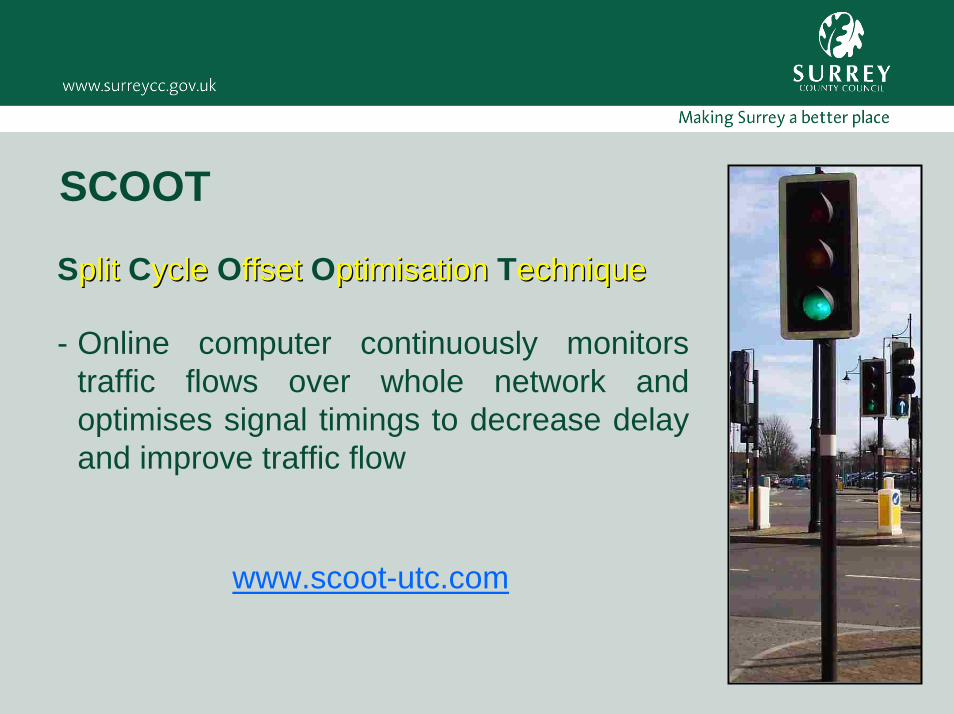
SCOOT
Splitplit Cycleycle Offsetffset Optimisationptimisation Techniqueechnique
- Online computer continuously monitors traffic flows over whole network and optimises signal timings to decrease delay and improve traffic flow
www.scoot-utc.com
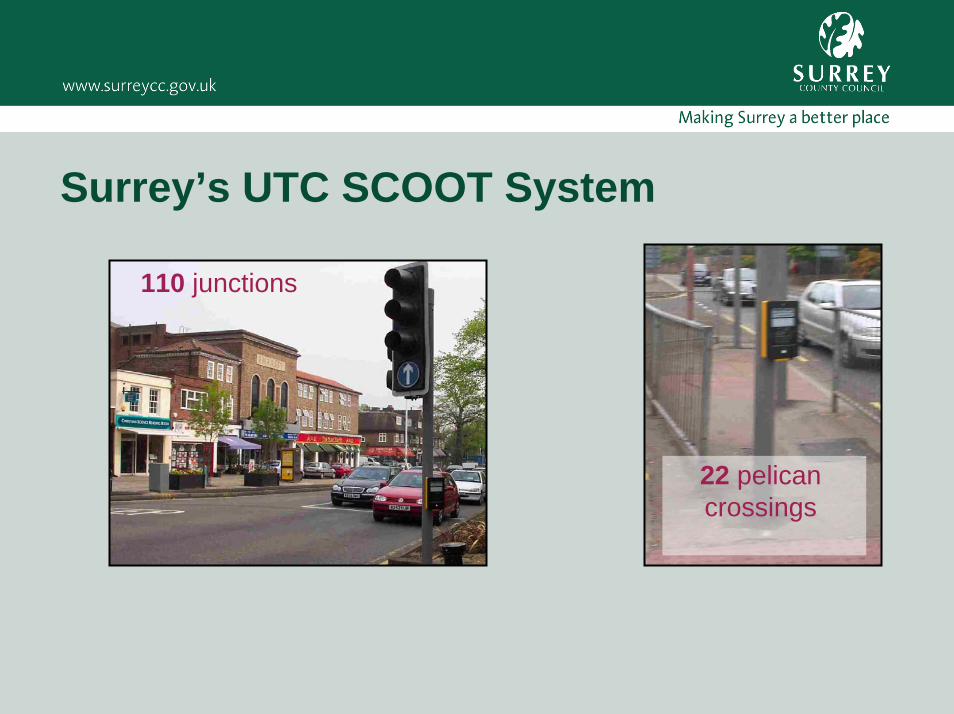
Surrey’s UTC SCOOT System
22 pelican crossings
110 junctions
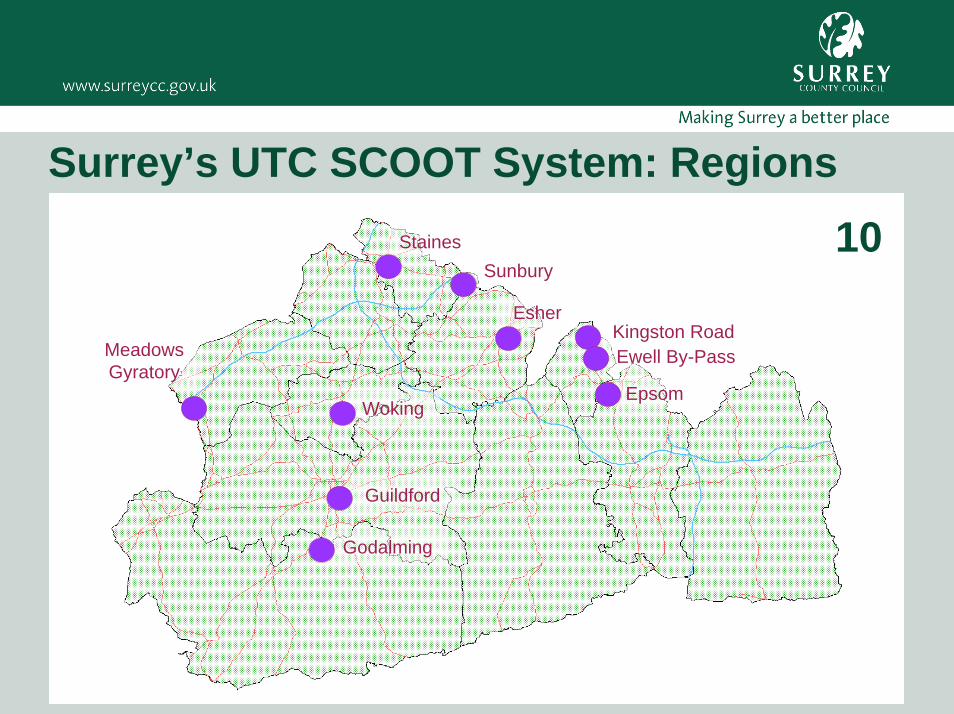
Epsom
Ewell By-PassKingston Road
Esher
SunburyStaines
Guildford
Godalming
Woking
Meadows Gyratory
Surrey’s UTC SCOOT System: Regions
10
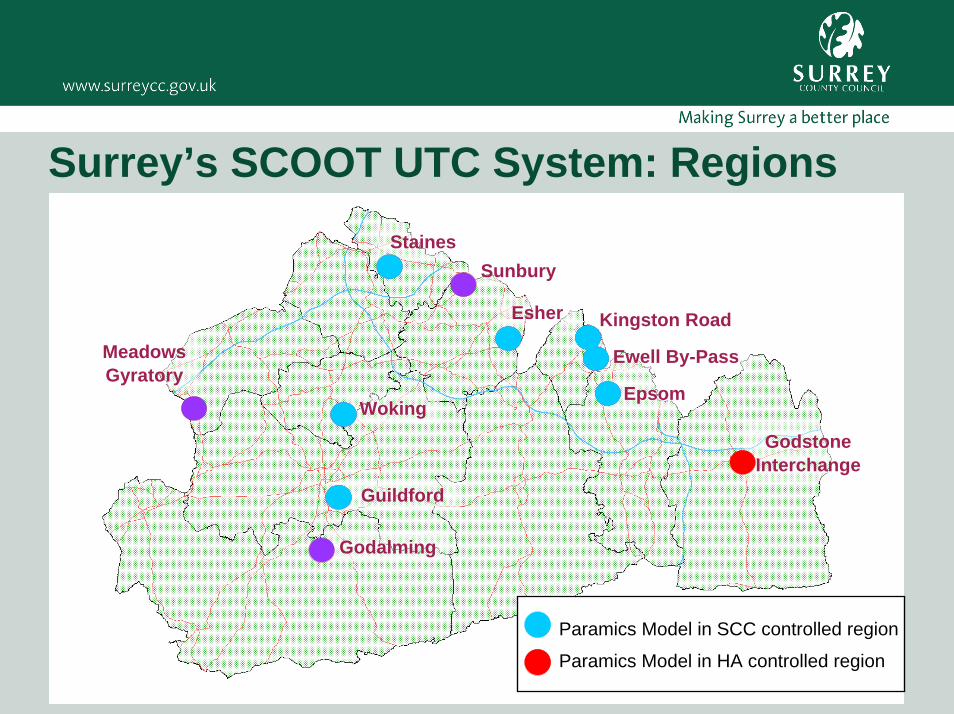
Epsom
Ewell By-Pass
Kingston RoadEsher
SunburyStaines
Guildford
Godalming
Woking
MeadowsGyratory
Surrey’s SCOOT UTC System: Regions
Paramics Model in SCC controlled region
Paramics Model in HA controlled region
GodstoneInterchange
Past Problems with Modelling SCOOTSIMULATING “GATING”
What is Gating?
The control of inflow of traffic into sensitive areas where it is especially important to prevent serious congestion
Used to prevent gyratory systems from being blocked
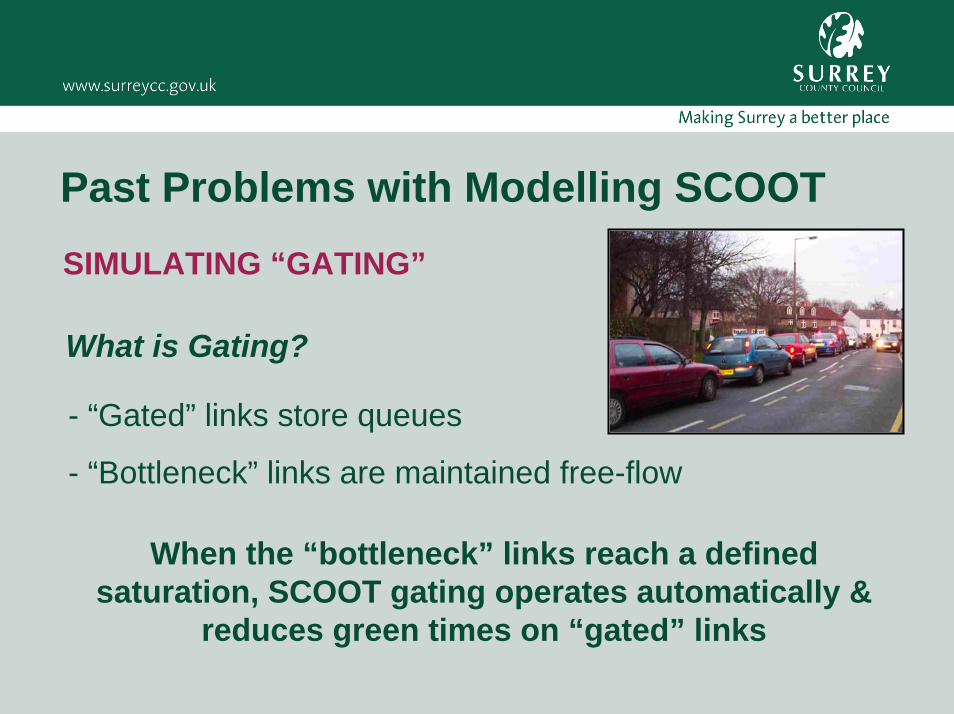
Past Problems with Modelling SCOOTSIMULATING “GATING”
What is Gating?
- “Gated” links store queues
- “Bottleneck” links are maintained free-flow
When the “bottleneck” links reach a defined saturation, SCOOT gating operates automatically &
reduces green times on “gated” links
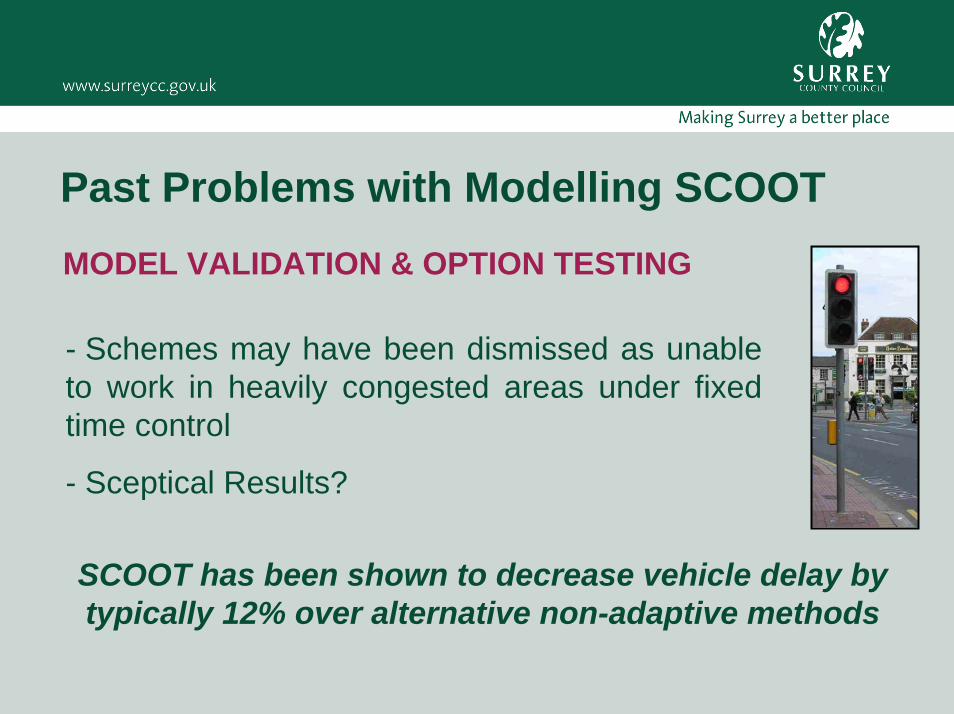
Past Problems with Modelling SCOOTMODEL VALIDATION & OPTION TESTING
- Schemes may have been dismissed as unable to work in heavily congested areas under fixed time control
- Sceptical Results?
SCOOT has been shown to decrease vehicle delay by typically 12% over alternative non-adaptive methods
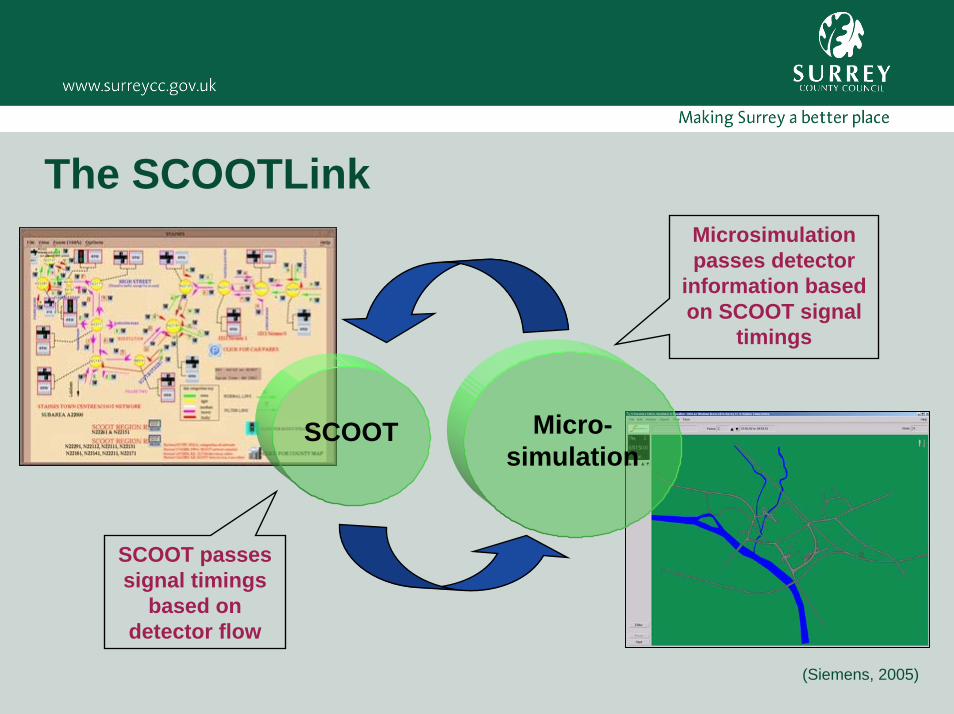
The SCOOTLinkMicrosimulation passes detector
information based on SCOOT signal
timings
SCOOT Micro-simulation
SCOOT passes signal timings
based on detector flow
(Siemens, 2005)
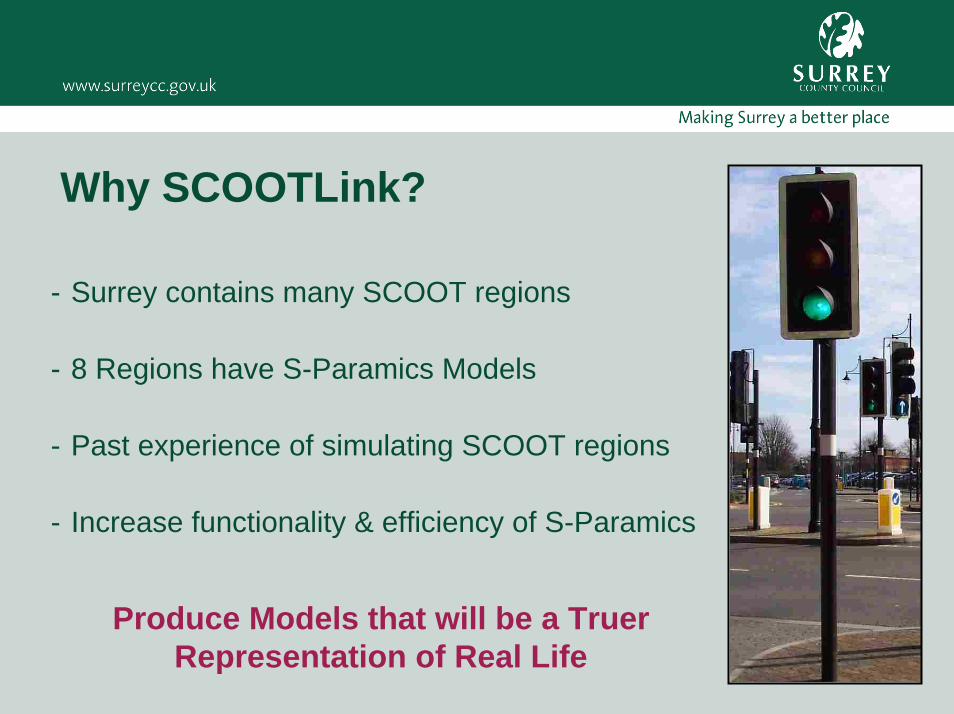
Why SCOOTLink?
- Surrey contains many SCOOT regions
- 8 Regions have S-Paramics Models
- Past experience of simulating SCOOT regions
- Increase functionality & efficiency of S-Paramics
Produce Models that will be a Truer Representation of Real Life
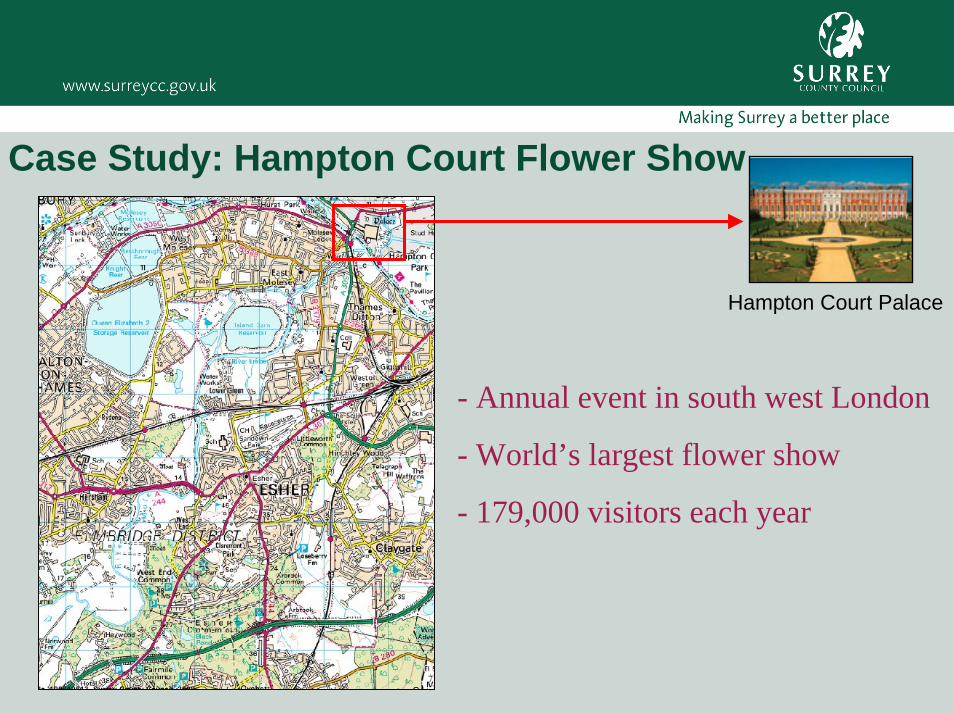
Hampton Court Palace
Case Study: Hampton Court Flower Show
- Annual event in south west London
- World’s largest flower show
- 179,000 visitors each year
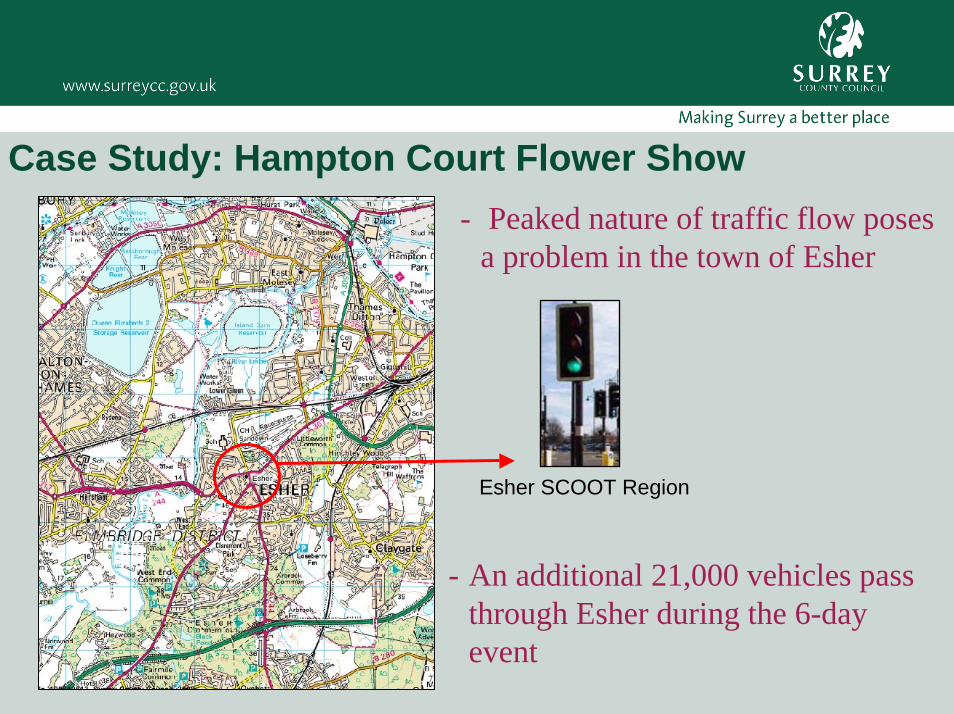
Esher SCOOT Region
Case Study: Hampton Court Flower Show
- An additional 21,000 vehicles pass through Esher during the 6-day event
- Peaked nature of traffic flow poses a problem in the town of Esher
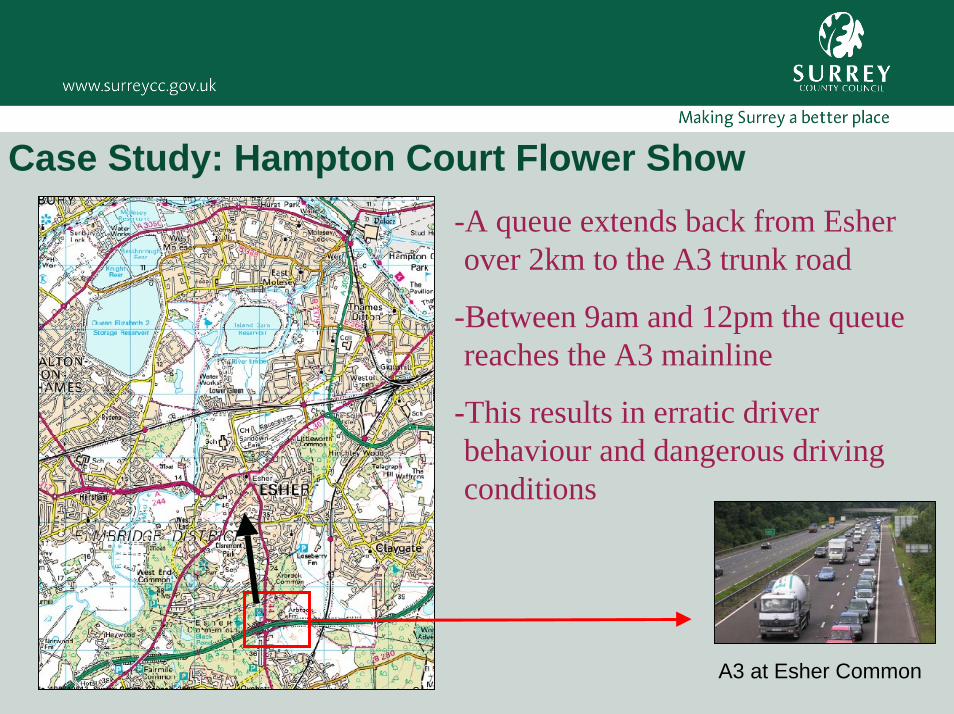
Case Study: Hampton Court Flower Show
A3 at Esher Common
-A queue extends back from Esher over 2km to the A3 trunk road
-Between 9am and 12pm the queue reaches the A3 mainline
-This results in erratic driver behaviour and dangerous driving conditions
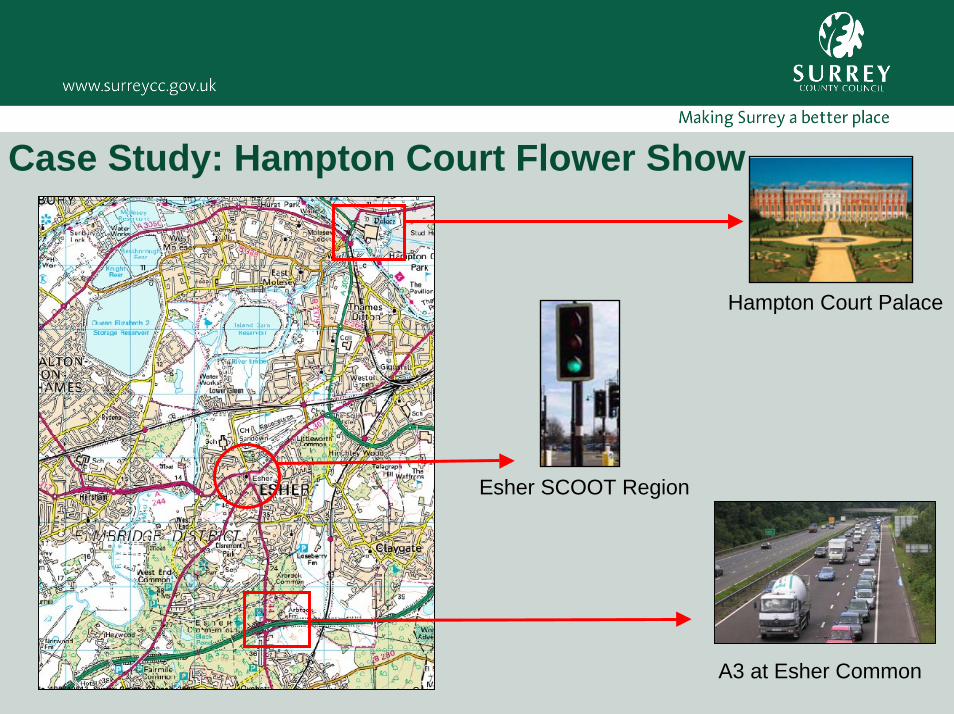
Esher SCOOT Region
A3 at Esher Common
Hampton Court Palace
Case Study: Hampton Court Flower Show
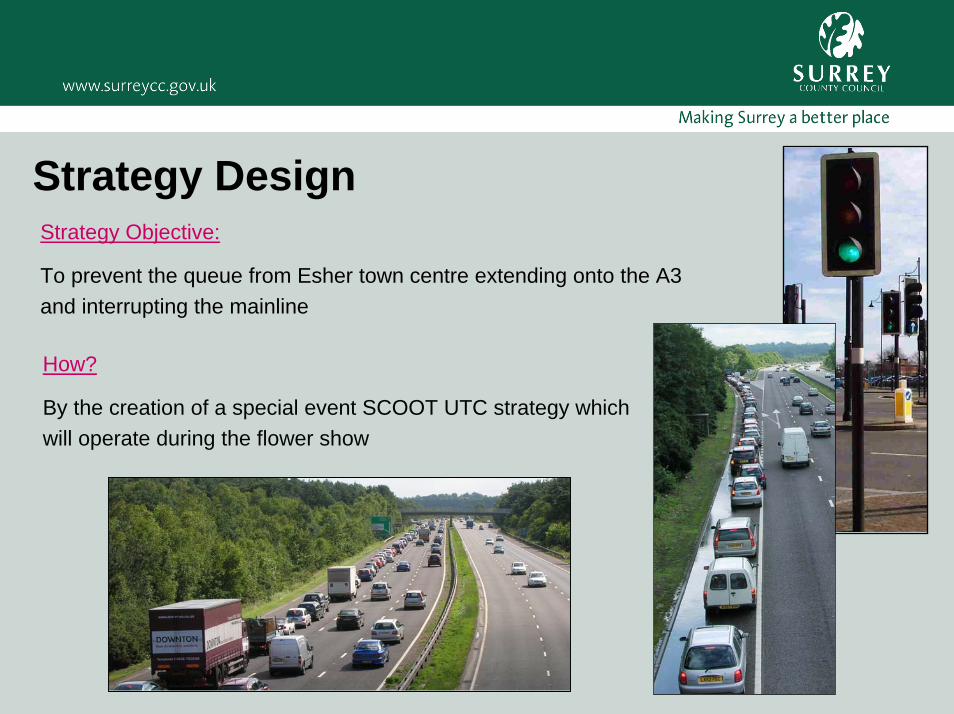
Strategy DesignStrategy Objective:
To prevent the queue from Esher town centre extending onto the A3 and interrupting the mainline
How?
By the creation of a special event SCOOT UTC strategy which will operate during the flower show
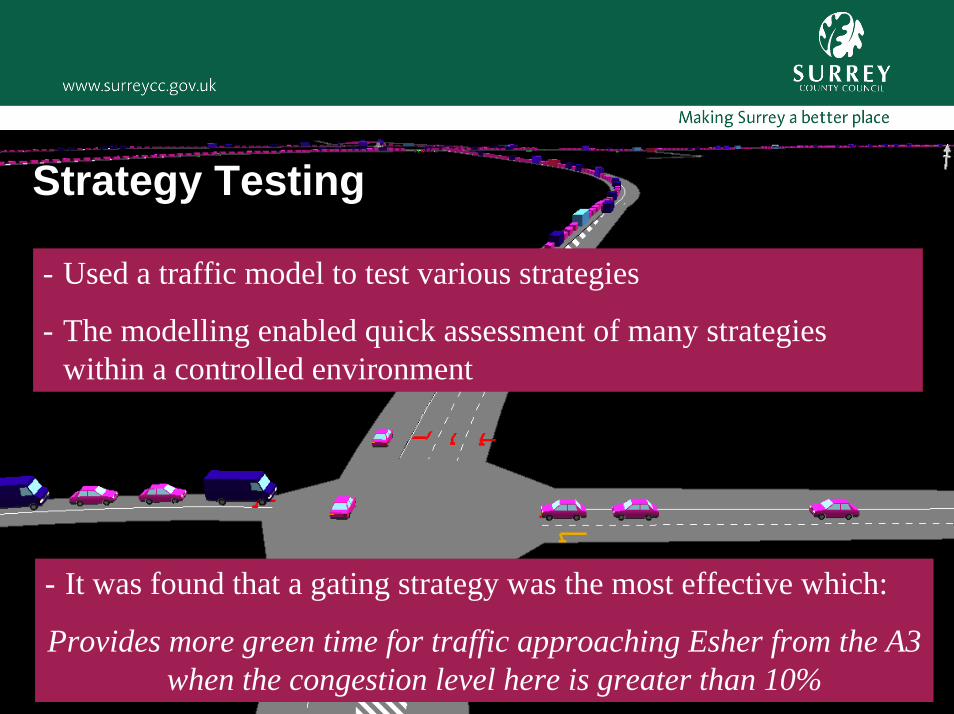
Strategy Testing
- Used a traffic model to test various strategies
- The modelling enabled quick assessment of many strategies within a controlled environment
- It was found that a gating strategy was the most effective which:
Provides more green time for traffic approaching Esher from the A3 when the congestion level here is greater than 10%
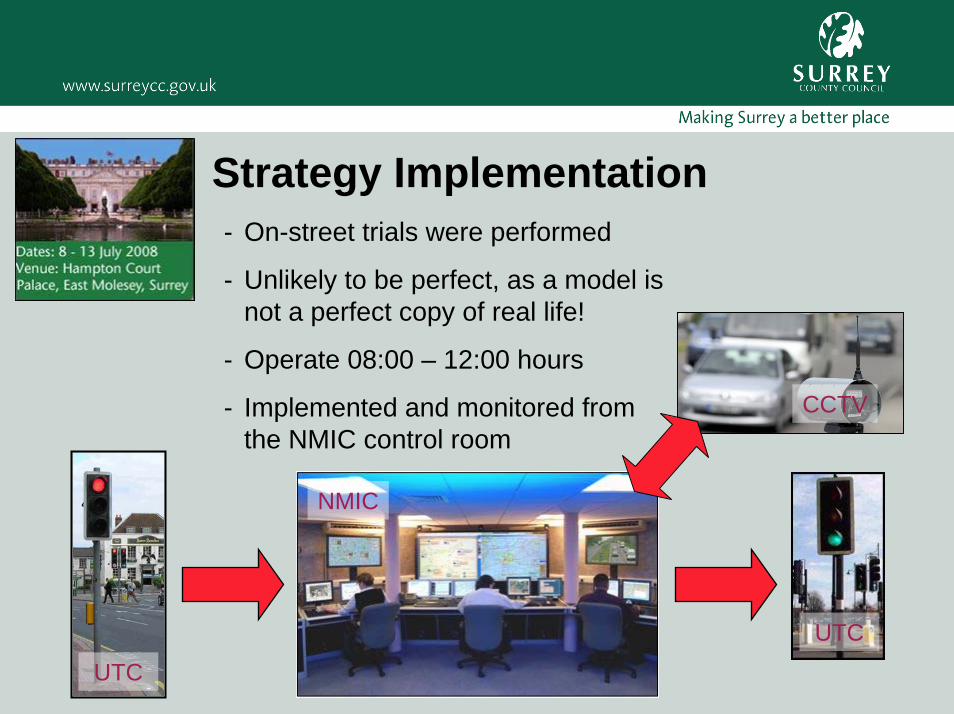
- On-street trials were performed
- Unlikely to be perfect, as a model is not a perfect copy of real life!
- Operate 08:00 – 12:00 hours
- Implemented and monitored from the NMIC control room
Strategy Implementation
CCTV
UTCUTC
NMIC
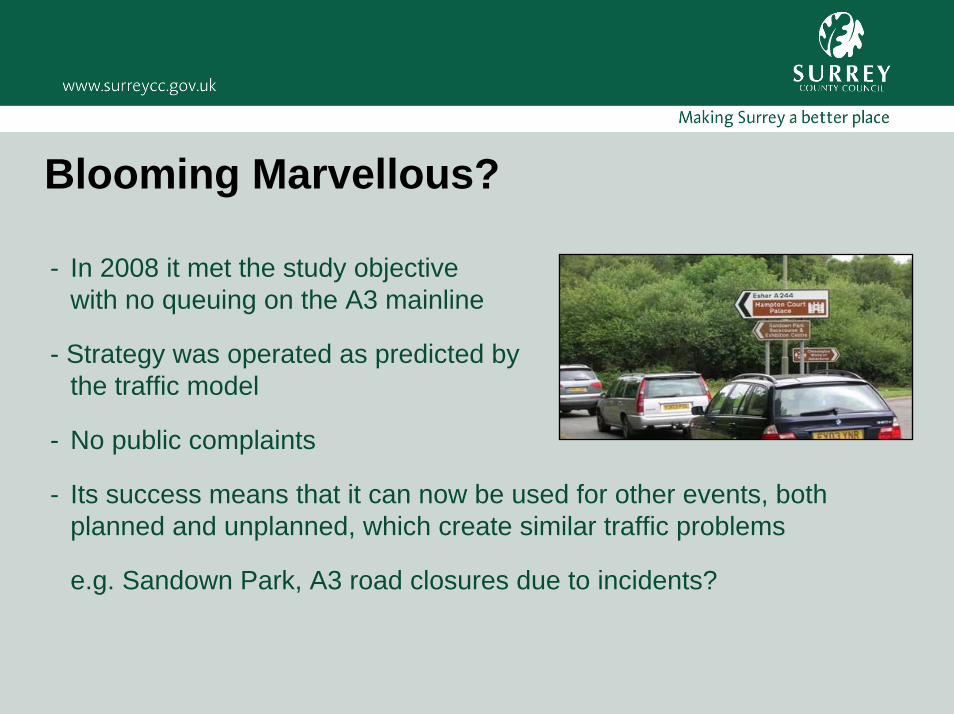
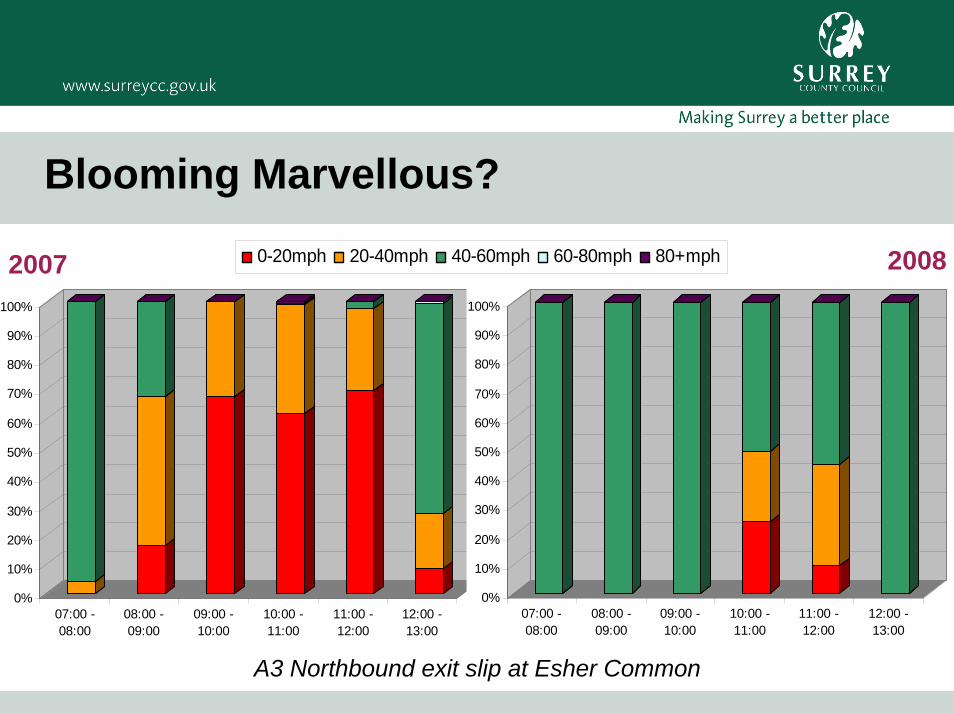
Blooming Marvellous?
- In 2008 it met the study objective with no queuing on the A3 mainline
- Strategy was operated as predicted by the traffic model
- No public complaints
- Its success means that it can now be used for other events, bothplanned and unplanned, which create similar traffic problems
e.g. Sandown Park, A3 road closures due to incidents?
Blooming Marvellous?
0%
10%
20%
30%
40%
50%
60%
70%
80%
90%
100%
07:00 -08:00
08:00 -09:00
09:00 -10:00
10:00 -11:00
11:00 -12:00
12:00 -13:00
0%
10%
20%
30%
40%
50%
60%
70%
80%
90%
100%
07:00 -08:00
08:00 -09:00
09:00 -10:00
10:00 -11:00
11:00 -12:00
12:00 -13:00
2007 20080-20mph 20-40mph 40-60mph 60-80mph 80+mph
A3 Northbound exit slip at Esher Common