Embed Size (px)
Citation preview
Trafficking Kinesin Protein (TRAK)-mediated Transport ofMitochondria in Axons of Hippocampal Neurons*□S
Received for publication, March 3, 2011 Published, JBC Papers in Press, March 30, 2011, DOI 10.1074/jbc.M111.236018
Kieran Brickley and F. Anne Stephenson1
From the School of Pharmacy, University of London, 29/39 Brunswick Square, London WC1N 1AX, United Kingdom
In neurons, the proper distribution of mitochondria is essen-tial because of a requirement for high energy and calcium buff-ering during synaptic neurotransmission. The efficient, regu-lated transport of mitochondria along axons to synapses istherefore crucial formaintaining function. The trafficking kine-sin protein (TRAK)/Milton family of proteins comprises kinesinadaptors that have been implicated in theneuronal traffickingofmitochondria via their association with the mitochondrial pro-teinMiro and kinesinmotors. In this study, we used gene silenc-ing by targeted shRNAi and dominant negative approaches inconjunction with live imaging to investigate the contribution ofendogenous TRAKs, TRAK1 and TRAK2, to the transport ofmitochondria in axons of hippocampal pyramidal neurons. Wereport that both strategies resulted in impairing mitochondrialmobility in axonal processes. Differences were apparent interms of the contribution of TRAK1 and TRAK2 to this trans-port because knockdown of TRAK1 but not TRAK2 impairedmitochondrial mobility, yet both TRAK1 and TRAK2 wereshown to rescue transport impaired by TRAK1 gene knock-out.Thus, we demonstrate for the first time the pivotal contributionof the endogenous TRAK family of kinesin adaptors to the reg-ulation of mitochondrial mobility.
Mitochondria serve several functions in cells. These func-tions include the generation of energy in the form of ATP, thebuffering of calcium ions, and the regulation of apoptosis. Thus,within cells, mitochondria need tomove so they can respond tolocal needs. In the nervous system, mitochondria and mito-chondrial transport are particularly important because of arequirement for high energy and calcium buffering during syn-aptic neurotransmission. The mitochondrial population inneurons is therefore highly mobile, and the dynamics of theirtransport are tightly regulated to satisfy these demands. Mito-chondria can move in both anterograde and retrograde direc-tions, utilizing motor proteins and the microtubule network(for reviews, see Refs. 1–3). Furthermore, they can be anchoredat defined sites; one example is mitochondrial immobilizationby a Ca2�-dependent mechanism at synaptic sites (4–7).Recently, there has been significant progress in the understand-ing ofmitochondrial transport processeswith the identificationof several proteins implicated in their trafficking mechanisms.
The best characterized of these include the trafficking kinesinprotein (TRAK)2/Milton family of kinesin adaptors; Miro1 andMiro2, atypical Rho GTPases that reside in the mitochondrialouter membrane that are purported receptors for TRAKs; syn-tabulin, also a kinesin adaptor protein; and syntaphilin, anaxonal mitochondrial docking protein (for reviews, see Refs. 3and 8).There are twomammalian TRAKs, TRAK1 andTRAK2, that
share �58% amino acid homology (9, 10). The TRAKs, liketheir Drosophila orthologue Milton (11), have been shown tofunction as kinesin adaptors linking kinesin heavy chain (KHC)to mitochondria by their association with Miro1/2. Thus,TRAK1, TRAK2, or Milton each co-immunoprecipitate withKHC from detergent extracts of neuronal tissue (11, 12). Theassociation between the TRAKs and KHC is direct and involvesinteraction betweenTRAKs and theKHCnon-motor, C-termi-nal cargo binding domain (13). In heterologous expression,TRAKs and Milton are targeted to mitochondria (11, 12, 14).The co-expression of TRAK1, TRAK2, or Milton with KHCresults in the redistribution of mitochondria such that they co-localize withTRAK1, TRAK2,Milton, and kinesin heavy chainsat the tips of cellular processes (13, 15, 16). Miro1 and Miro2co-distribute and co-immunoprecipitate with Milton, TRAK1,or TRAK2 following overexpression in mammalian cells (15,16, 17). Furthermore, Miro1 co-immunoprecipitates withTRAK2 from brain extracts (18). Overexpression of fluores-cently taggedTRAK2 orMiro1 constructs in hippocampal neu-rons results in an increase in the number of mitochondriatransported to the periphery of hippocampal neurons (18). Fur-thermore, expression of the Miro1 binding domain of TRAK2,uncoupling Miro1 from TRAK2, results in prevention of thisinduced redistribution ofmitochondria into the periphery (18).Finally, in dendrites of hippocampal neurons, overexpression ofMiro1 results in a percent increase in the number of movingmitochondria. Conversely, knockdown of Miro1 in hippocam-pal neurons by targeted shRNAi results in a decrease in themobilemitochondrial fraction (6). Surprisingly, thiswas not thecase in axons in these same neurons because mitochondrialvelocity and mobility were unaffected by overexpression ofMiro1 (7). In dorsal root ganglia neurons, knockdown ofMiro2but not Miro1 disrupts axonal mitochondrial transport (19).
* This work was supported by the Biotechnology and Biological SciencesResearch Council (United Kingdom).
□S The on-line version of this article (available at http://www.jbc.org) containssupplemental Figs. 1 and 2 and Videos 1–13.
1 To whom correspondence should be addressed. Tel.: 44-207-753-5877; Fax:44-207-753-5964; E-mail: [email protected].
2 The abbreviations used are: TRAK, trafficking kinesin protein; DIV, days invitro; DN, dominant negative; EGFP, enhanced green fluorescent protein;EYFP, enhanced yellow fluorescent protein; hrGFP, humanized recombi-nant green fluorescent protein; hrs, hepatocyte growth factor-regulatedtyrosine kinase substrate; KHC, kinesin heavy chain; scr, scrambled; rTRAK,rat TRAK.
THE JOURNAL OF BIOLOGICAL CHEMISTRY VOL. 286, NO. 20, pp. 18079 –18092, May 20, 2011© 2011 by The American Society for Biochemistry and Molecular Biology, Inc. Printed in the U.S.A.
MAY 20, 2011 • VOLUME 286 • NUMBER 20 JOURNAL OF BIOLOGICAL CHEMISTRY 18079
by guest on March 18, 2019
http://ww
w.jbc.org/
Dow
nloaded from
All the above studies are supportive of a kinesin-TRAK-Miromitochondrial trafficking complex. However, apart from theMiro1 shRNAi studies, the findings all result from overexpres-sion of fluorescently taggedTRAK2/Milton, KHC, orMiro con-structs. In this study, we investigated the role of endogenousTRAKs in the trafficking of mitochondria in axons of hip-pocampal pyramidal neurons using both gene silencing by tar-geted shRNAi and dominant negative approaches. We reportthat inhibiting the formation or the availability of the TRAKkinesin adaptor resulted in a decrease in mitochondrial mobil-ity. Thus, we show definitively and for the first time that endog-enous TRAKs are indeed mediators of axonal mitochondrialtransport. Furthermore, we report that the contributions ofTRAK1 andTRAK2 to themovement ofmitochondria differed,suggesting that possibly the selective binding by TRAK1 and/orTRAK2 to different members of the kinesin transport family orto Miro1 and Miro2 may represent crucial regulatory points incontrolling the traffic of mitochondrial cargoes in neurons.
EXPERIMENTAL PROCEDURES
Constructs and Antibodies—pCISTRAK2 (formerly pCIS-GRIF-1, splice form GRIF-1a; hereafter referred to as TRAK2)was as described previously (12). Full-length rat TRAK1 cDNA(NCBI accession number NM_001134565.1) was amplifiedfrom rat brain by Eurogentec Ltd. (Southampton, UK), and thesequence was verified by nucleotide sequencing. It was sub-cloned into the XhoI and EcoRI sites of pEGFP-C2 to yieldpEGFP-ratTRAK1 (pEGFP-rTRAK1). (Note, to simplifynomenclature, plasmids encoding proteins that were taggedwith fluorescent proteins at the N terminus were named withthe tag name preceding the protein; i.e. pEGFP-TRAK1encodes TRAK1 with the EGFP tag at the N terminus. Con-versely, plasmids encoding proteins that were tagged at the Cterminus were named with the tag name following, the protein,e.g. pKIF5C-EYFP.) Three silent base mutations, T1852C,A1855G, and G1858C, were introduced into pEGFP-rTRAK1using the QuikChangeTMmutagenesis kit (Stratagene, La Jolla,CA) to generate pEGFP-rTRAK1silent. DNA encoding thedominant negative TRAK2(124–283) (hereafter termedTRAK2 DN) was excised from pCMVc-MycTRAK2(124–283)and cloned in-frame in the EcoRI and XhoI sites of the vectorpIRES-hrGFP-1a (Agilent Technologies Inc., Basel, Switzer-land) to generate pIRES-GFPTRAK2 DN. For the TRAK2shRNAi studies, two double-stranded oligonucleotide pairsencoding rat TRAK2 bp 785–805 and rat TRAK2 bp 1886–1905 siRNA sequences as in Ref. 20 were purchased. The oligo-nucleotide sequences were as follows: TRAK2 785–805,5�-GGAACCATGTCTTATCTGAGC plus the complemen-tary sequence with 5�-GGGAACCTTCTTAAATCTGGC asthe scrambled control; and TRAK2-2 1886–1905, 5�-GAACG-GAAGCTCCAGATTCT with 5�-TTGCAAGCCAAGGTTC-GACA as the scrambled control. The respective oligonucleo-tides and their complementary counterparts were eachsubcloned into the BamHI and EcoRI sites of pSIREN-Ret-roQ-ZsGreen (Clontech) to generate pSIRENGreenTRAK2(pGreenTRAK2), pSIRENGreenTRAK2-2 (pGrenTRAK2-2), and the scrambled controls pSIRENGreenTRAK2scr(pGreenTRAK2scr) and pSIRENGrenTRAK2-2scr. For
TRAK1, the oligonucleotide encoding the siRNA sequence wasas in Ref. 21 but adapted for the rat TRAK2DNA sequence. Theoligonucleotide was 5�-CGAAAGAGTTGGCCAGATG corre-sponding to rat TRAK1 bp 294–312. The scrambled controlwas 5�-AACCGGTTTGGAACGAGAG. The respective oligo-nucleotidesandtheircomplementarycounterpartswereeachsub-cloned into the BamHI and EcoRI sites of pSIREN-RetroQ-Zs-Green andpSIREN-RetroQ-ZsRedExpress (Clontech) to generatepSIRENGreenTRAK1 (pGreenTRAK1), pSIRENRedTRAK1(pRedTRAK1), and the scrambled control pSIRENGreen-TRAK1scr (pGreenTRAK1scr). pCMVTag4aTRAK2 (C-terminalFLAG-tagged TRAK2) was as in Ref. 9; pcDNAHisMaxKIF5C(N-terminal His tag), pCMVTRAK2(283–913) (N-terminalc-Myc tag), and pCIShumanTRAK1 (pCIShTRAK1) were as inRef. 12; pDsRed1-Mito for visualization of mitochondria,pECFP-TRAK2, and pKIF5C-EYFP were as in Ref. 13; andpECFP-hTRAK1 was as in Ref. 16. Rat TRAK2 was cloned in-frame into the EcoRI site of pEGFPC2 to yield pEGFP-rTRAK2.The far-red fluorescent construct pTurboFP635-NMito1 wasgenerated by cloning theDNAmitochondrial targeting domainof cytochrome oxidase 8A into the EcoRI and BamHI sites ofpTurboFP635-N (Evrogen, Moscow, Russia). pSynaptophysin-EYFP was a kind gift from Dr. Ann-Marie Craig, Vancouver,Canada. Table 1 contains a descriptive summary of all clonesused.Affinity-purified sheep anti-TRAK2(874–889) (formerly
anti-GRIF-1(874–889)) antibodies were generated as in Ref.12; anti-TRAK2(8–633) (formerly anti-GRIF-1(8–633)) anti-bodies generated as in Ref. 9, and in-house rabbit anti-FLAGantibodies were generated as in Ref. 13. Anti-His G and anti-rabbit Alexa Fluor 680 antibodies were from Invitrogen; anti-GFP antibodies were from Abcam Ltd. (Cambridge, UK); anti-�-actin antibodies were from Sigma-Aldrich; and rabbit,mouse, and sheep horseradish peroxidase-linked secondaryantibodies were from Amersham Biosciences.Culturing and Transfection of Hippocampal Neurons—Cul-
tures of rat hippocampal neurons were prepared at a density of�30,000 cells/cm2 on poly-D-lysine- (1 �g/ml) and laminin (2�g/ml)-coated coverslips from hippocampi that were dissectedfrom P0 rat brain (22). Cultures were grown for 3–4 days incomplete Neurobasal medium, which was Neurobasal medium(Invitrogen) containing a 1 in 50 dilution of B27 (Invitrogen),0.5 mM GlutaMax (Invitrogen), and 0.4% (w/v) glucose. Trans-fection of neurons was by a calciumphosphatemethod adaptedfrom Ref. 23 always using DNA clones that had been purifiedusing EndoFree purification kits for the maxipreparation ofplasmid DNA (Qiagen, Crawley, Sussex, UK). The transfectionmixture was prepared by addition of the appropriate plasmidDNAs to a solution containing 0.25 M CaCl2. This was addeddropwise to an equal volume of 2� HEPES-buffered saline, pH7.14. The culture medium was removed and stored at 37 °C in5% CO2. Fresh complete Neurobasal medium was added to theneurons followed by dropwise addition of the transfectionmix-ture. Neurons were incubated at 37 °C in 5% CO2 for 30 min.The cell culture medium was aspirated, and neurons werewashed quickly once with fresh Neurobasal medium. Freshcomplete Neurobasal medium that had been preincubated at37 °C in 10%CO2was added, and the neuronswere incubated at
TRAK-mediated Transport of Mitochondria
18080 JOURNAL OF BIOLOGICAL CHEMISTRY VOLUME 286 • NUMBER 20 • MAY 20, 2011
by guest on March 18, 2019
http://ww
w.jbc.org/
Dow
nloaded from
37 °C and 5% CO2 for 20 min. The cell culture medium wasreplaced with the original stored medium, and neurons weremaintained at 37 °C in the presence of 5% CO2 until analysis bylive imaging confocal microscopy. Transfections were carriedout for the shRNAi knockdown studies at 3 days in vitro (DIV)and for the DN knockdown studies at 4 DIV with imaging forboth at 6 DIV. For all transfections, 1 �g of DNAwas added perdish, i.e. per �30,000 cells. The ratio of DNAs for transfectionmixtures for TRAK2DN studies was 25 pIRES-GFPTRAK2DNor pIRES-GFP to 1 pDsRed1-Mito. For shRNAi knockdownstudies, the ratio was 25 pGreenTRAK1, pGreenTRAK2,pGreenTRAK1scr, or pGreenTRAK2scr to 1 pDsRed1-Mito.For the shRNAi rescue experiments, the ratio was 12.5pRedTRAK1 to 12.5 pEGFP-rTRAK1silent or 12.5 pEGFP-TRAK2 to 1 pTurboFP635-N. For the synaptophysin studies,the DNA ratio was 25 pEYFP-synaptophysin to 1 pDsRed1-Mito. Transfection efficiencies were in the range of 0.1–1%,which corresponded to between four and 10 transfected neu-rons per dish.Live Cell Imaging and Analysis—Confocal imaging was car-
ried out using a Zeiss LSM 510 or a Zeiss LSM 710 oil immer-sion 40� objective with sequential acquisition setting. Neuronswere maintained for imaging at 37 °C in 5% CO2. Transfectedcells were identified under UV light with the fluorescein iso-thiocyanate (FITC) filter to enable visualization of the greenfluorescence of the respective reporter followed by visualiza-tion under UV light with the rhodamine filter to check for thepresence of DsRed1-Mito. For the identified transfected neu-ron, live imaging was carried out using � � 561-nm excitationat 2% of the intensity of the diode-pumped solid-state laser tominimize bleaching and damage to neurons. Images of 512 �512-pixel resolution with the pinhole at a setting of 3 �mweretaken at 6-s intervals for 50 frames in a single focal plane. Theshort interval was used to minimize laser-induced neuronaldamage. The axons of selected transfected neurons were iden-tified morphologically by their uniform diameter, length, andlack of branching. Only those processes that satisfied these cri-teria were imaged. The polarity was determined by tracing the
axon back to the cell body. The section of the axon selected forimaging was �70–100 �m in length, was at least 100 �m fromthe cell body, and contained at least eight mitochondria. Imag-ing data were analyzed using VolocityTM software (Perkin-Elmer Life Sciences). Individual mitochondria were analyzedusing the Volocity point tool to track objects manually to yieldvelocity, displacement (i.e. distance moved), and bearing (direc-tion). Oscillating mitochondria are defined as those that aredisplaced �2 �m from one site. Fusion events were deter-mined by visualization of two mitochondria merging with asubsequent change in both velocity and direction for each.Fission events were determined by visualization of one mito-chondrion becoming two. Videos of live imaging were cre-ated by import of the original confocal image file into Voloc-ity and then exported as an AVI movie or as a kymograph todepict mitochondrial movement.Mammalian Cell Transfections—For immunoprecipitation
assays, human embryonic kidney (HEK) 293 cells were trans-fected with the constructs shown by the calcium phosphatemethod using 10 �g of DNA/250-ml culture flask. For doubletransfections, a 1:1 ratio for a total of 10 �g of DNA was used,and for triple transfections, a 1:1:1 ratio was used again with 10�g of DNA/250-ml culture flask. Cells were harvested 24–48h post-transfection, and either cell homogenates were ana-lyzed by immunoblotting, or transfected cell homogenateswere 1% (v/v) Triton X-100 detergent-solubilized, andextracts were collected following centrifugation for 40 minat 4 °C at 100,000 � g (9).
For confocal microscopy studies, COS-7 cells were platedonto poly-D-lysine (0.1 mg/ml)-coated coverslips and trans-fected using the calcium phosphate method and plasmidDNA ratios as above. Transfections using pDsRed1-Mito tovisualize mitochondria in triple transfections used a ratio of1 pDsRed1-Mito to 12.5 pECFP-TRAK2 to 12.5 pKIF5C-EYFP or 1 pDsRed1-Mito to 12.5 pECFP-TRAK2 DN to 12.5pKIF5C-EYFP for a total of 10 �g of DNA. Transfectionsusing pDsRed1-Mito to visualize mitochondria in quadrupletransfections used a ratio of 1 pDsRed1-Mito to 8.3 pECFP-
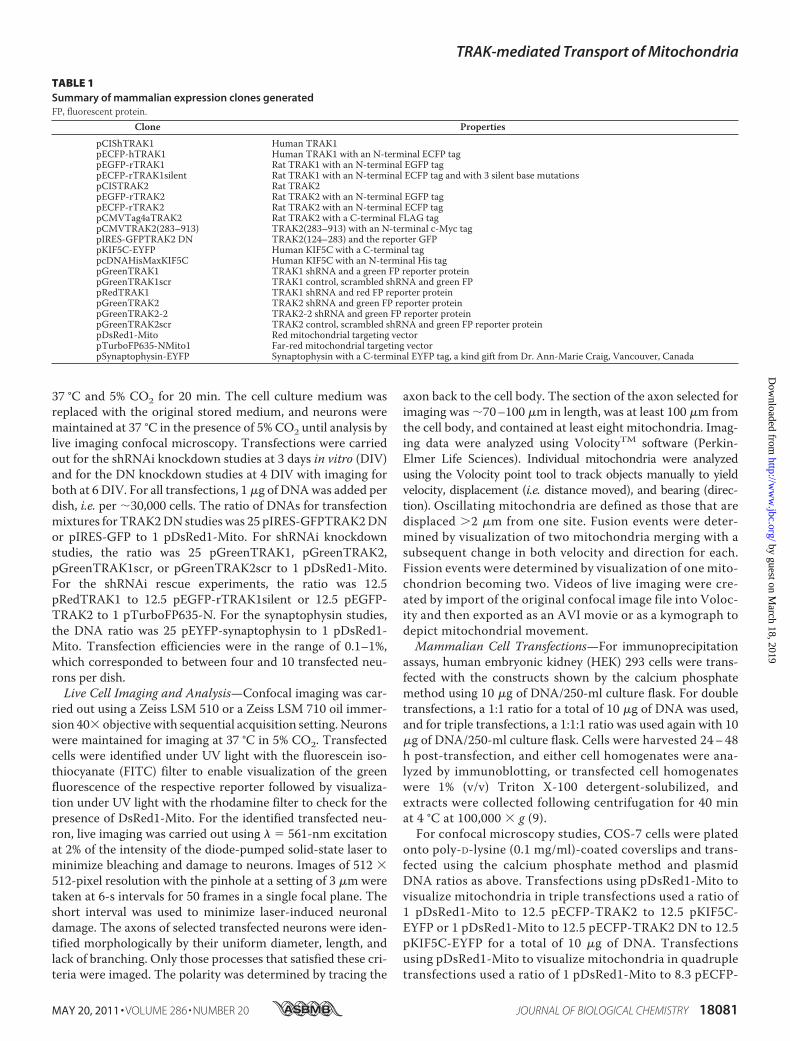
TABLE 1Summary of mammalian expression clones generatedFP, fluorescent protein.
Clone Properties
pCIShTRAK1 Human TRAK1pECFP-hTRAK1 Human TRAK1 with an N-terminal ECFP tagpEGFP-rTRAK1 Rat TRAK1 with an N-terminal EGFP tagpECFP-rTRAK1silent Rat TRAK1 with an N-terminal ECFP tag and with 3 silent base mutationspCISTRAK2 Rat TRAK2pEGFP-rTRAK2 Rat TRAK2 with an N-terminal EGFP tagpECFP-rTRAK2 Rat TRAK2 with an N-terminal ECFP tagpCMVTag4aTRAK2 Rat TRAK2 with a C-terminal FLAG tagpCMVTRAK2(283–913) TRAK2(283–913) with an N-terminal c-Myc tagpIRES-GFPTRAK2 DN TRAK2(124–283) and the reporter GFPpKIF5C-EYFP Human KIF5C with a C-terminal tagpcDNAHisMaxKIF5C Human KIF5C with an N-terminal His tagpGreenTRAK1 TRAK1 shRNA and a green FP reporter proteinpGreenTRAK1scr TRAK1 control, scrambled shRNA and green FPpRedTRAK1 TRAK1 shRNA and red FP reporter proteinpGreenTRAK2 TRAK2 shRNA and green FP reporter proteinpGreenTRAK2-2 TRAK2-2 shRNA and green FP reporter proteinpGreenTRAK2scr TRAK2 control, scrambled shRNA and green FP reporter proteinpDsRed1-Mito Red mitochondrial targeting vectorpTurboFP635-NMito1 Far-red mitochondrial targeting vectorpSynaptophysin-EYFP Synaptophysin with a C-terminal EYFP tag, a kind gift from Dr. Ann-Marie Craig, Vancouver, Canada
TRAK-mediated Transport of Mitochondria
MAY 20, 2011 • VOLUME 286 • NUMBER 20 JOURNAL OF BIOLOGICAL CHEMISTRY 18081
by guest on March 18, 2019
http://ww
w.jbc.org/
Dow
nloaded from
TRAK2 to 8.3 pKIF5C-EYFP to 8.3 pIRES-GFPTRAK2 DN; 1pDsRed1-Mito to 8.3 pKIF5C-EYFP to 8.3 pEGFP-rTRAK1to 8.3 pEGFP-rTRAK1silent, 8.3 pGreenTRAK1 orpGreenTRAK1scr; or 1 pDsRed1-Mito to 8.3 pKIF5C-EYFP to8.3 pEGFP-TRAK2 to 8.3 pGreenTRAK2 or pGreenTRAK2scrfor a total of 10 �g of DNA.Immunoblotting and Immunoprecipitations—Both immu-
noblotting and immunoprecipitations were carried out exactlyas previously described in Refs. 12, 13, and 16.
RESULTS
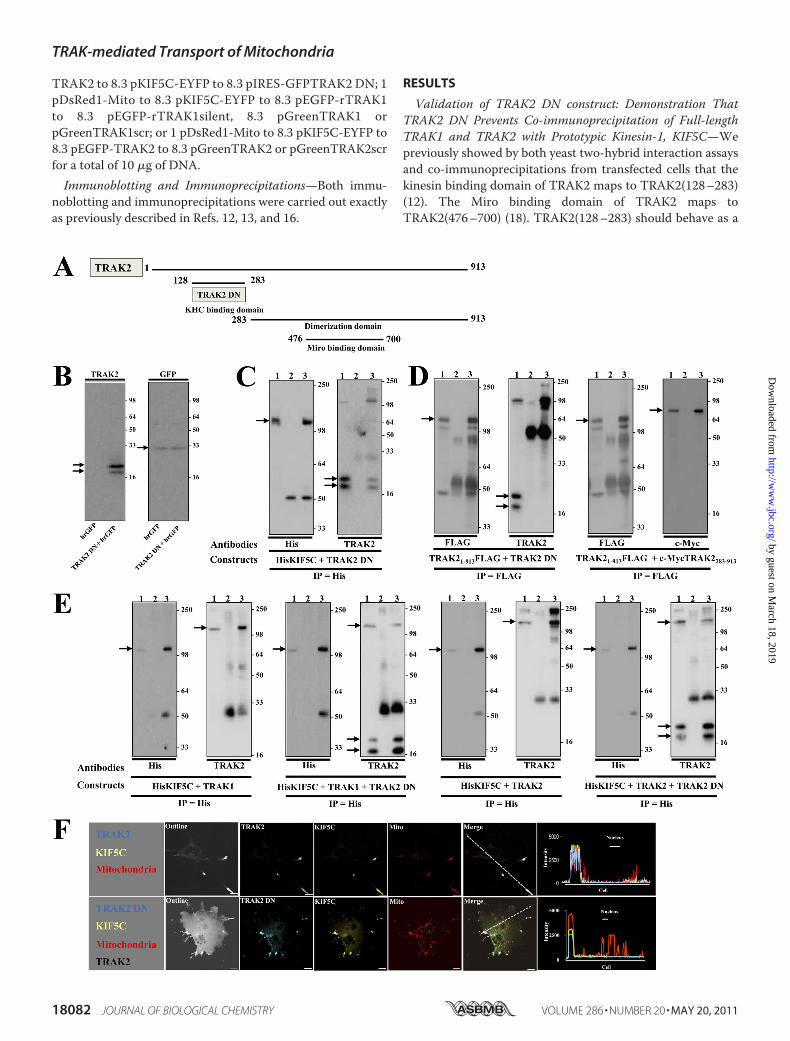
Validation of TRAK2 DN construct: Demonstration ThatTRAK2 DN Prevents Co-immunoprecipitation of Full-lengthTRAK1 and TRAK2 with Prototypic Kinesin-1, KIF5C—Wepreviously showed by both yeast two-hybrid interaction assaysand co-immunoprecipitations from transfected cells that thekinesin binding domain of TRAK2 maps to TRAK2(128–283)(12). The Miro binding domain of TRAK2 maps toTRAK2(476–700) (18). TRAK2(128–283) should behave as a
TRAK-mediated Transport of Mitochondria
18082 JOURNAL OF BIOLOGICAL CHEMISTRY VOLUME 286 • NUMBER 20 • MAY 20, 2011
by guest on March 18, 2019
http://ww
w.jbc.org/
Dow
nloaded from
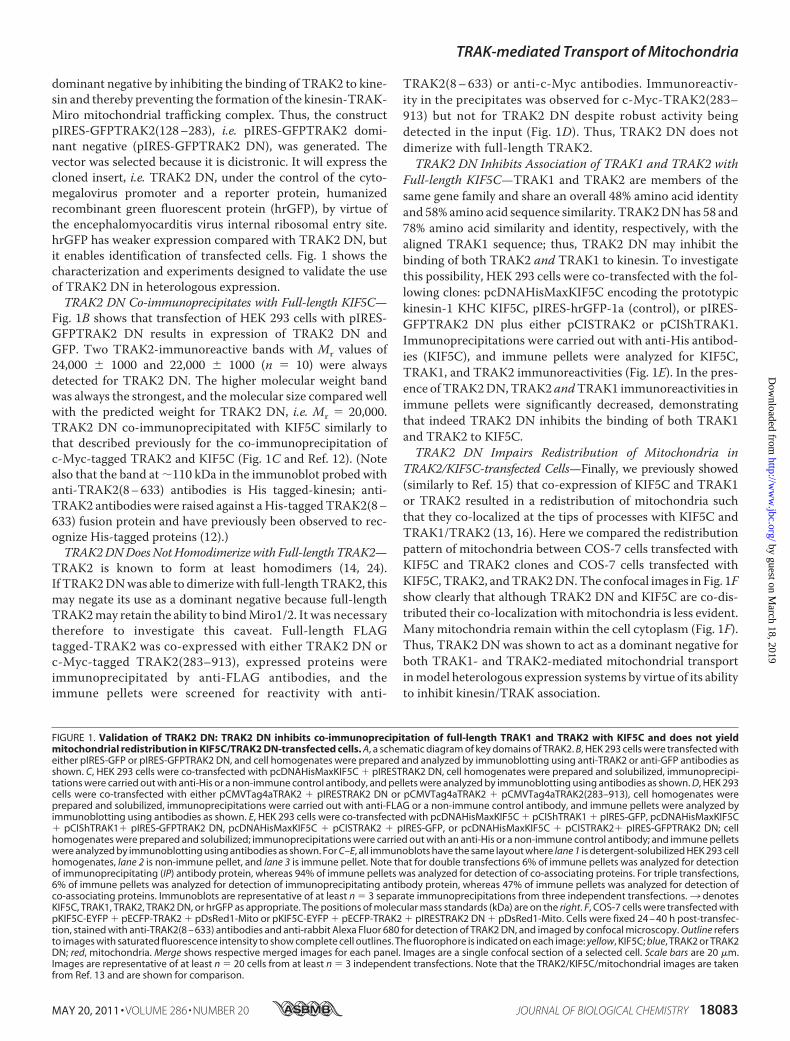
dominant negative by inhibiting the binding of TRAK2 to kine-sin and thereby preventing the formation of the kinesin-TRAK-Miro mitochondrial trafficking complex. Thus, the constructpIRES-GFPTRAK2(128–283), i.e. pIRES-GFPTRAK2 domi-nant negative (pIRES-GFPTRAK2 DN), was generated. Thevector was selected because it is dicistronic. It will express thecloned insert, i.e. TRAK2 DN, under the control of the cyto-megalovirus promoter and a reporter protein, humanizedrecombinant green fluorescent protein (hrGFP), by virtue ofthe encephalomyocarditis virus internal ribosomal entry site.hrGFP has weaker expression compared with TRAK2 DN, butit enables identification of transfected cells. Fig. 1 shows thecharacterization and experiments designed to validate the useof TRAK2 DN in heterologous expression.TRAK2 DN Co-immunoprecipitates with Full-length KIF5C—
Fig. 1B shows that transfection of HEK 293 cells with pIRES-GFPTRAK2 DN results in expression of TRAK2 DN andGFP. Two TRAK2-immunoreactive bands with Mr values of24,000 � 1000 and 22,000 � 1000 (n � 10) were alwaysdetected for TRAK2 DN. The higher molecular weight bandwas always the strongest, and themolecular size compared wellwith the predicted weight for TRAK2 DN, i.e. Mr � 20,000.TRAK2 DN co-immunoprecipitated with KIF5C similarly tothat described previously for the co-immunoprecipitation ofc-Myc-tagged TRAK2 and KIF5C (Fig. 1C and Ref. 12). (Notealso that the band at�110 kDa in the immunoblot probed withanti-TRAK2(8–633) antibodies is His tagged-kinesin; anti-TRAK2 antibodies were raised against aHis-taggedTRAK2(8–633) fusion protein and have previously been observed to rec-ognize His-tagged proteins (12).)TRAK2DNDoesNotHomodimerize with Full-length TRAK2—
TRAK2 is known to form at least homodimers (14, 24).If TRAK2DNwas able to dimerizewith full-lengthTRAK2, thismay negate its use as a dominant negative because full-lengthTRAK2may retain the ability to bindMiro1/2. It was necessarytherefore to investigate this caveat. Full-length FLAGtagged-TRAK2 was co-expressed with either TRAK2 DN orc-Myc-tagged TRAK2(283–913), expressed proteins wereimmunoprecipitated by anti-FLAG antibodies, and theimmune pellets were screened for reactivity with anti-
TRAK2(8–633) or anti-c-Myc antibodies. Immunoreactiv-ity in the precipitates was observed for c-Myc-TRAK2(283–913) but not for TRAK2 DN despite robust activity beingdetected in the input (Fig. 1D). Thus, TRAK2 DN does notdimerize with full-length TRAK2.TRAK2 DN Inhibits Association of TRAK1 and TRAK2 with
Full-length KIF5C—TRAK1 and TRAK2 are members of thesame gene family and share an overall 48% amino acid identityand 58% amino acid sequence similarity. TRAK2DNhas 58 and78% amino acid similarity and identity, respectively, with thealigned TRAK1 sequence; thus, TRAK2 DN may inhibit thebinding of both TRAK2 and TRAK1 to kinesin. To investigatethis possibility, HEK 293 cells were co-transfected with the fol-lowing clones: pcDNAHisMaxKIF5C encoding the prototypickinesin-1 KHC KIF5C, pIRES-hrGFP-1a (control), or pIRES-GFPTRAK2 DN plus either pCISTRAK2 or pCIShTRAK1.Immunoprecipitations were carried out with anti-His antibod-ies (KIF5C), and immune pellets were analyzed for KIF5C,TRAK1, and TRAK2 immunoreactivities (Fig. 1E). In the pres-ence of TRAK2DN,TRAK2 andTRAK1 immunoreactivities inimmune pellets were significantly decreased, demonstratingthat indeed TRAK2 DN inhibits the binding of both TRAK1and TRAK2 to KIF5C.TRAK2 DN Impairs Redistribution of Mitochondria in
TRAK2/KIF5C-transfected Cells—Finally, we previously showed(similarly to Ref. 15) that co-expression of KIF5C and TRAK1or TRAK2 resulted in a redistribution of mitochondria suchthat they co-localized at the tips of processes with KIF5C andTRAK1/TRAK2 (13, 16). Here we compared the redistributionpattern of mitochondria between COS-7 cells transfected withKIF5C and TRAK2 clones and COS-7 cells transfected withKIF5C,TRAK2, andTRAK2DN.The confocal images in Fig. 1Fshow clearly that although TRAK2 DN and KIF5C are co-dis-tributed their co-localization withmitochondria is less evident.Many mitochondria remain within the cell cytoplasm (Fig. 1F).Thus, TRAK2 DN was shown to act as a dominant negative forboth TRAK1- and TRAK2-mediated mitochondrial transportinmodel heterologous expression systems by virtue of its abilityto inhibit kinesin/TRAK association.
FIGURE 1. Validation of TRAK2 DN: TRAK2 DN inhibits co-immunoprecipitation of full-length TRAK1 and TRAK2 with KIF5C and does not yieldmitochondrial redistribution in KIF5C/TRAK2 DN-transfected cells. A, a schematic diagram of key domains of TRAK2. B, HEK 293 cells were transfected witheither pIRES-GFP or pIRES-GFPTRAK2 DN, and cell homogenates were prepared and analyzed by immunoblotting using anti-TRAK2 or anti-GFP antibodies asshown. C, HEK 293 cells were co-transfected with pcDNAHisMaxKIF5C � pIRESTRAK2 DN, cell homogenates were prepared and solubilized, immunoprecipi-tations were carried out with anti-His or a non-immune control antibody, and pellets were analyzed by immunoblotting using antibodies as shown. D, HEK 293cells were co-transfected with either pCMVTag4aTRAK2 � pIRESTRAK2 DN or pCMVTag4aTRAK2 � pCMVTag4aTRAK2(283–913), cell homogenates wereprepared and solubilized, immunoprecipitations were carried out with anti-FLAG or a non-immune control antibody, and immune pellets were analyzed byimmunoblotting using antibodies as shown. E, HEK 293 cells were co-transfected with pcDNAHisMaxKIF5C � pCIShTRAK1 � pIRES-GFP, pcDNAHisMaxKIF5C� pCIShTRAK1� pIRES-GFPTRAK2 DN, pcDNAHisMaxKIF5C � pCISTRAK2 � pIRES-GFP, or pcDNAHisMaxKIF5C � pCISTRAK2� pIRES-GFPTRAK2 DN; cellhomogenates were prepared and solubilized; immunoprecipitations were carried out with an anti-His or a non-immune control antibody; and immune pelletswere analyzed by immunoblotting using antibodies as shown. For C–E, all immunoblots have the same layout where lane 1 is detergent-solubilized HEK 293 cellhomogenates, lane 2 is non-immune pellet, and lane 3 is immune pellet. Note that for double transfections 6% of immune pellets was analyzed for detectionof immunoprecipitating (IP) antibody protein, whereas 94% of immune pellets was analyzed for detection of co-associating proteins. For triple transfections,6% of immune pellets was analyzed for detection of immunoprecipitating antibody protein, whereas 47% of immune pellets was analyzed for detection ofco-associating proteins. Immunoblots are representative of at least n � 3 separate immunoprecipitations from three independent transfections.3 denotesKIF5C, TRAK1, TRAK2, TRAK2 DN, or hrGFP as appropriate. The positions of molecular mass standards (kDa) are on the right. F, COS-7 cells were transfected withpKIF5C-EYFP � pECFP-TRAK2 � pDsRed1-Mito or pKIF5C-EYFP � pECFP-TRAK2 � pIRESTRAK2 DN � pDsRed1-Mito. Cells were fixed 24 – 40 h post-transfec-tion, stained with anti-TRAK2(8 – 633) antibodies and anti-rabbit Alexa Fluor 680 for detection of TRAK2 DN, and imaged by confocal microscopy. Outline refersto images with saturated fluorescence intensity to show complete cell outlines. The fluorophore is indicated on each image: yellow, KIF5C; blue, TRAK2 or TRAK2DN; red, mitochondria. Merge shows respective merged images for each panel. Images are a single confocal section of a selected cell. Scale bars are 20 �m.Images are representative of at least n � 20 cells from at least n � 3 independent transfections. Note that the TRAK2/KIF5C/mitochondrial images are takenfrom Ref. 13 and are shown for comparison.
TRAK-mediated Transport of Mitochondria
MAY 20, 2011 • VOLUME 286 • NUMBER 20 JOURNAL OF BIOLOGICAL CHEMISTRY 18083
by guest on March 18, 2019
http://ww
w.jbc.org/
Dow
nloaded from
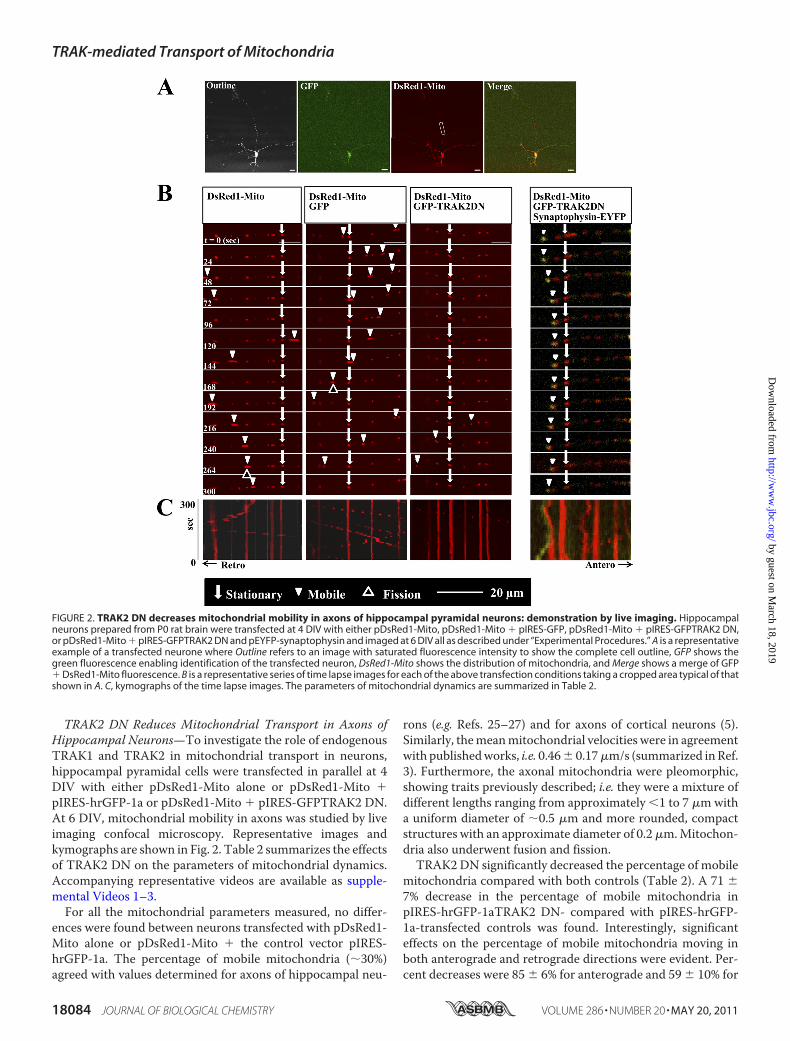
TRAK2 DN Reduces Mitochondrial Transport in Axons ofHippocampal Neurons—To investigate the role of endogenousTRAK1 and TRAK2 in mitochondrial transport in neurons,hippocampal pyramidal cells were transfected in parallel at 4DIV with either pDsRed1-Mito alone or pDsRed1-Mito �pIRES-hrGFP-1a or pDsRed1-Mito � pIRES-GFPTRAK2 DN.At 6 DIV, mitochondrial mobility in axons was studied by liveimaging confocal microscopy. Representative images andkymographs are shown in Fig. 2. Table 2 summarizes the effectsof TRAK2 DN on the parameters of mitochondrial dynamics.Accompanying representative videos are available as supple-mental Videos 1–3.For all the mitochondrial parameters measured, no differ-
ences were found between neurons transfected with pDsRed1-Mito alone or pDsRed1-Mito � the control vector pIRES-hrGFP-1a. The percentage of mobile mitochondria (�30%)agreed with values determined for axons of hippocampal neu-
rons (e.g. Refs. 25–27) and for axons of cortical neurons (5).Similarly, themeanmitochondrial velocities were in agreementwith publishedworks, i.e. 0.46� 0.17�m/s (summarized inRef.3). Furthermore, the axonal mitochondria were pleomorphic,showing traits previously described; i.e. they were a mixture ofdifferent lengths ranging from approximately �1 to 7 �mwitha uniform diameter of �0.5 �m and more rounded, compactstructures with an approximate diameter of 0.2�m.Mitochon-dria also underwent fusion and fission.TRAK2 DN significantly decreased the percentage of mobile
mitochondria compared with both controls (Table 2). A 71 �7% decrease in the percentage of mobile mitochondria inpIRES-hrGFP-1aTRAK2 DN- compared with pIRES-hrGFP-1a-transfected controls was found. Interestingly, significanteffects on the percentage of mobile mitochondria moving inboth anterograde and retrograde directions were evident. Per-cent decreases were 85 � 6% for anterograde and 59 � 10% for
FIGURE 2. TRAK2 DN decreases mitochondrial mobility in axons of hippocampal pyramidal neurons: demonstration by live imaging. Hippocampalneurons prepared from P0 rat brain were transfected at 4 DIV with either pDsRed1-Mito, pDsRed1-Mito � pIRES-GFP, pDsRed1-Mito � pIRES-GFPTRAK2 DN,or pDsRed1-Mito � pIRES-GFPTRAK2 DN and pEYFP-synaptophysin and imaged at 6 DIV all as described under “Experimental Procedures.” A is a representativeexample of a transfected neurone where Outline refers to an image with saturated fluorescence intensity to show the complete cell outline, GFP shows thegreen fluorescence enabling identification of the transfected neuron, DsRed1-Mito shows the distribution of mitochondria, and Merge shows a merge of GFP� DsRed1-Mito fluorescence. B is a representative series of time lapse images for each of the above transfection conditions taking a cropped area typical of thatshown in A. C, kymographs of the time lapse images. The parameters of mitochondrial dynamics are summarized in Table 2.
TRAK-mediated Transport of Mitochondria
18084 JOURNAL OF BIOLOGICAL CHEMISTRY VOLUME 286 • NUMBER 20 • MAY 20, 2011
by guest on March 18, 2019
http://ww
w.jbc.org/
Dow
nloaded from
retrograde transport. No significant differences were inducedbyTRAK2DNover the 5-min time frame of study inmitochon-drial density in the imaged section of axon, in the mean veloc-ities, and in the percentage of oscillating mitochondria (Table2). Further analysis found no significant difference between themean velocities for anterograde versus retrograde transport.The values were 0.44 � 0.2 �m/s for anterograde velocity and0.53 � 0.22 �m/s for retrograde velocity. There were no obvi-ous changes in mitochondrial morphology. Interestingly, thenumber of fusion and fission events was decreased, althoughthe significance was less than that found for the TRAK2 DN-induced mitochondrial mobility (Table 2).Synaptophysin-EYFP mobility was also imaged in neurons
co-transfectedwith this construct, pIRESGFP-TRAK2DN, andpDsRed1-Mito to determine whether the transport of otherorganelles was affected by TRAK2 DN. A representative exam-ple of a transfected neuron is shown in Fig. 2. As above, littlemovement ofmitochondria was evident due to TRAK2DN, butfluorescence associated with synaptophysin was observed tomove albeit at a reduced velocity compared withmitochondria.TRAK1 and TRAK2 Knockdown Studies—Because we showed
that the TRAK2 DN inhibited the association of both TRAK1and TRAK2 to kinesin, it was of interest to investigate the con-tribution of each to axonal mitochondrial transport. Thus, agene knockdown approach was used utilizing TRAK1- andTRAK2-gene targeted shRNAs. Each shRNAi (and the respec-tive scrambled control) was validated by immunoblotting andconfocal microscopy imaging following expression in HEK 293cells and COS-7 cells, respectively (Fig. 3). By quantitativeimmunoblotting, TRAK1 shRNAi yielded a 97 � 3% (n � 3)knockdown of exogenously expressed TRAK1 with respect totheTRAK1scr shRNAi control (Fig. 3). Therewas no significantknockdown of exogenously expressed TRAK2; the value forTRAK2 expression was 115 � 17% (n � 3) for TRAK1 shRNAicompared with 100% for TRAK1scr shRNAi. Similarly, TRAK2shRNAi yielded a 96 � 2% (n � 3) knockdown of exogenouslyexpressed TRAK2 with respect to the TRAK2scr shRNAi con-trol. There was no significant knockdown of exogenouslyexpressed TRAK1; the value for TRAK1 expression was 86 �17% (n � 3) for TRAK2 shRNAi compared with 100% forTRAK2scr shRNAi (Fig. 3). TRAK2-2 shRNAi yielded a knock-down of exogenous TRAK2 similar to that found for TRAK2shRNAi, i.e. � 95% (data not shown).The shRNAi probes were also characterized with respect to
their ability to inhibit kinesin/TRAK-mediated redistributionof mitochondria in COS-7 cells co-transfected with pDsRed1-Mito � pKIF5C-EYFP � pEGFP-rTRAK1 and either pGreen-TRAK1/pGreenTRAK2 or the respective scrambled controls,i.e. pGreenTRAK1scr/pGreenTRAK2scr. Thus, cells express-ing the various test and control shRNAis were identified bygreen fluorescence, mitochondria were identified by red fluo-rescence, and the presence of both KIF5C-EYFP and TRAK1/2was identified by the characteristic pattern of green and redfluorescence at the tips of processes, the latter due to theKIF5C/TRAK1(and 2) redistribution of mitochondria. Repre-sentative results are shown in Fig. 3. For both TRAK1 andTRAK2, the respective scrambled shRNAis had no effect onKIF5C/TRAK-mediated redistribution of mitochondria; i.e.T
AB
LE2
Sum
mar
yo
feff
ect
ofT
RA
KD
No
nm
ito
cho
nd
rial
dyn
amic
sin
axo
ns
ofh
ipp
oca
mp
alp
yram
idal
neu
ron
sHippo
campaln
eurons
weretransfectedat
4DIV
with
either
pDsRed1-Mito
,pDsRed1-Mito
�pIRE
S-hrGFP
-1a,or
pDsRed1-Mito
�pIRE
S-GFP
TRA
K2DN.A
t6DIV
,co-transfectedcells
wereidentified,
mito
chon
drial
dynamicsw
ereimaged
byconfocalmicroscop
y,andther
esultswerea
nalyzedusingVolocity
softw
area
llas
describ
edun
der“Ex
perim
entalProcedu
res.”
Oscillatingmito
chon
driaared
efined
asthosethatare
displaced
�2
�m
from
onesite.Valuesa
rethemeans
�S.E.
from
n�
33im
ages
from
n�
23neuron
sfor
pDsRed1-Mito
(295
mito
chon
driaim
aged),n
�18
images
from
n�
14neuron
sfor
pDsRed1-Mito
�pIRE
S-hrGFP
-1atransfectio
ns(267
mito
chon
driaim
aged),andn
�33
images
from
n�
21neuron
sfor
pDsRed1-Mito
�pIRE
S-GFP
TRA
K2DN
(406
mito
chon
driaim
aged)for
n�
4independ
enttransfectionexperim
ents.Statistic
alsig
nificancesw
ere
obtained
usingtheStud
entsttest.
Clone
stransfected
Mito
chon
drial
density
Veloc
ityFu
sion
even
ts/
10mito
chon
dria
Fissioneven
ts/
10mito
chon
dria
Oscillating
mito
chon
dria
Stationa
rymito
chon
dria
Mob
ilemito
chon
dria
Anterog
rade
mito
chon
dria
Retrograd
emito
chon
dria
�m
1
�m/s
%%
%%
%pD
sRed1-Mito
0.18
�0.03
0.46
�0.17
1.1
1.0
1�
168
�4
32�
417
�3
14�
3pD
sRed1-Mito
pIRE
S-GFP
0.16
�0.03
0.66
�0.25
0.9
0.9
2�
260
�10
40�
1019
�2
19�
4pD
sRed1-Mito
pIRE
S-FP
TRA
K2DN
0.18
�0.03
0.48
�0.18
0.6a
0.5a
1�
189
�4b
11�
4b4
�2c
7�
2aap
�0.05
.bp
�0.00
1.cp
�0.00
05.
TRAK-mediated Transport of Mitochondria
MAY 20, 2011 • VOLUME 286 • NUMBER 20 JOURNAL OF BIOLOGICAL CHEMISTRY 18085
by guest on March 18, 2019
http://ww
w.jbc.org/
Dow
nloaded from
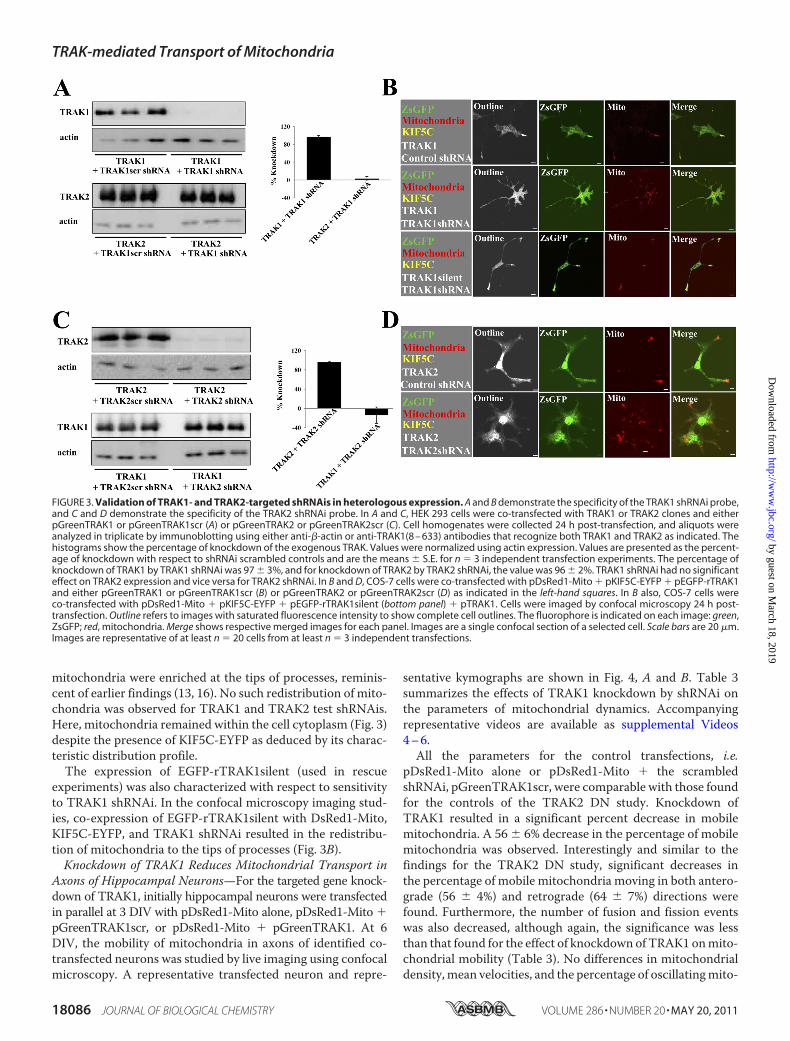
mitochondria were enriched at the tips of processes, reminis-cent of earlier findings (13, 16). No such redistribution of mito-chondria was observed for TRAK1 and TRAK2 test shRNAis.Here, mitochondria remained within the cell cytoplasm (Fig. 3)despite the presence of KIF5C-EYFP as deduced by its charac-teristic distribution profile.The expression of EGFP-rTRAK1silent (used in rescue
experiments) was also characterized with respect to sensitivityto TRAK1 shRNAi. In the confocal microscopy imaging stud-ies, co-expression of EGFP-rTRAK1silent with DsRed1-Mito,KIF5C-EYFP, and TRAK1 shRNAi resulted in the redistribu-tion of mitochondria to the tips of processes (Fig. 3B).Knockdown of TRAK1 Reduces Mitochondrial Transport in
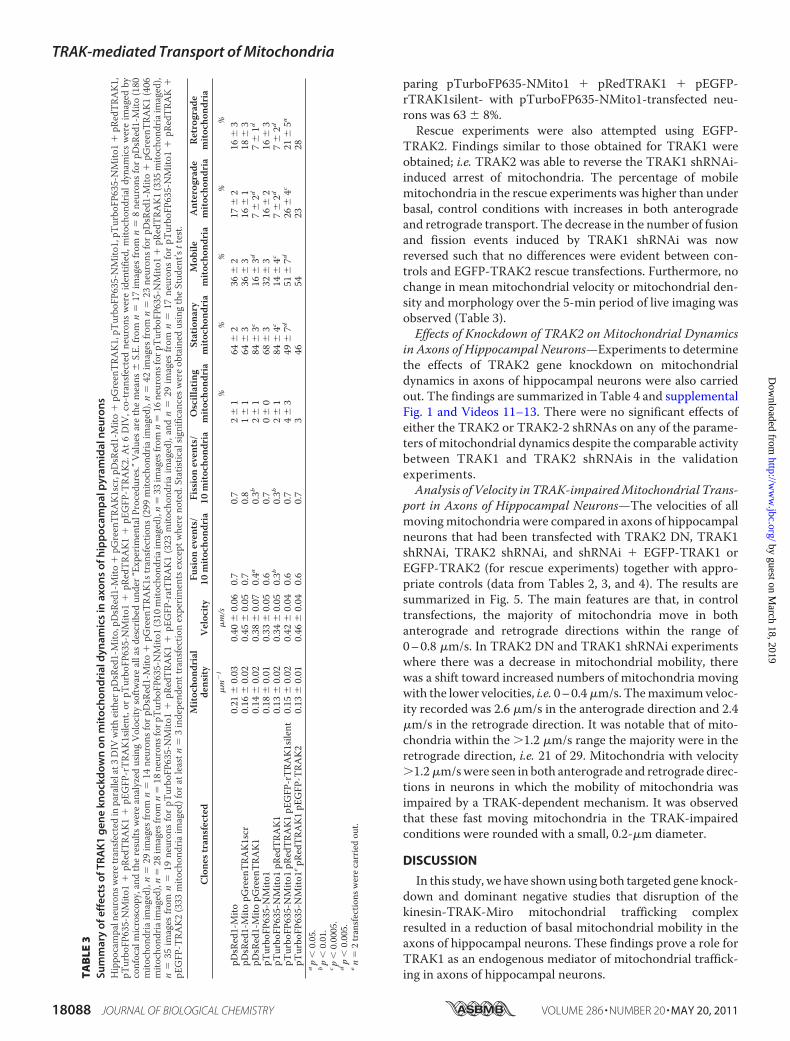
Axons of Hippocampal Neurons—For the targeted gene knock-down of TRAK1, initially hippocampal neurons were transfectedin parallel at 3 DIV with pDsRed1-Mito alone, pDsRed1-Mito �pGreenTRAK1scr, or pDsRed1-Mito � pGreenTRAK1. At 6DIV, the mobility of mitochondria in axons of identified co-transfected neurons was studied by live imaging using confocalmicroscopy. A representative transfected neuron and repre-
sentative kymographs are shown in Fig. 4, A and B. Table 3summarizes the effects of TRAK1 knockdown by shRNAi onthe parameters of mitochondrial dynamics. Accompanyingrepresentative videos are available as supplemental Videos4–6.All the parameters for the control transfections, i.e.
pDsRed1-Mito alone or pDsRed1-Mito � the scrambledshRNAi, pGreenTRAK1scr, were comparable with those foundfor the controls of the TRAK2 DN study. Knockdown ofTRAK1 resulted in a significant percent decrease in mobilemitochondria. A 56 � 6% decrease in the percentage of mobilemitochondria was observed. Interestingly and similar to thefindings for the TRAK2 DN study, significant decreases inthe percentage of mobile mitochondria moving in both antero-grade (56 � 4%) and retrograde (64 � 7%) directions werefound. Furthermore, the number of fusion and fission eventswas also decreased, although again, the significance was lessthan that found for the effect of knockdown of TRAK1 onmito-chondrial mobility (Table 3). No differences in mitochondrialdensity,mean velocities, and the percentage of oscillatingmito-
FIGURE 3. Validation of TRAK1- and TRAK2-targeted shRNAis in heterologous expression. A and B demonstrate the specificity of the TRAK1 shRNAi probe,and C and D demonstrate the specificity of the TRAK2 shRNAi probe. In A and C, HEK 293 cells were co-transfected with TRAK1 or TRAK2 clones and eitherpGreenTRAK1 or pGreenTRAK1scr (A) or pGreenTRAK2 or pGreenTRAK2scr (C). Cell homogenates were collected 24 h post-transfection, and aliquots wereanalyzed in triplicate by immunoblotting using either anti-�-actin or anti-TRAK1(8 – 633) antibodies that recognize both TRAK1 and TRAK2 as indicated. Thehistograms show the percentage of knockdown of the exogenous TRAK. Values were normalized using actin expression. Values are presented as the percent-age of knockdown with respect to shRNAi scrambled controls and are the means � S.E. for n � 3 independent transfection experiments. The percentage ofknockdown of TRAK1 by TRAK1 shRNAi was 97 � 3%, and for knockdown of TRAK2 by TRAK2 shRNAi, the value was 96 � 2%. TRAK1 shRNAi had no significanteffect on TRAK2 expression and vice versa for TRAK2 shRNAi. In B and D, COS-7 cells were co-transfected with pDsRed1-Mito � pKIF5C-EYFP � pEGFP-rTRAK1and either pGreenTRAK1 or pGreenTRAK1scr (B) or pGreenTRAK2 or pGreenTRAK2scr (D) as indicated in the left-hand squares. In B also, COS-7 cells wereco-transfected with pDsRed1-Mito � pKIF5C-EYFP � pEGFP-rTRAK1silent (bottom panel) � pTRAK1. Cells were imaged by confocal microscopy 24 h post-transfection. Outline refers to images with saturated fluorescence intensity to show complete cell outlines. The fluorophore is indicated on each image: green,ZsGFP; red, mitochondria. Merge shows respective merged images for each panel. Images are a single confocal section of a selected cell. Scale bars are 20 �m.Images are representative of at least n � 20 cells from at least n � 3 independent transfections.
TRAK-mediated Transport of Mitochondria
18086 JOURNAL OF BIOLOGICAL CHEMISTRY VOLUME 286 • NUMBER 20 • MAY 20, 2011
by guest on March 18, 2019
http://ww
w.jbc.org/
Dow
nloaded from
chondria were induced by TRAK1 gene knockdown. Therewere no obvious changes in mitochondrial morphology.Experiments designed to rescue the decrease in TRAK1 gene
knockdown mitochondrial mobility were also carried out. Todo this, it was necessary to be able to visualize neurons in whichthree fluorescent constructs were expressed. Thus, the newmitochondrial targeting vector pTurboFP635-NMito1 wasgenerated. This enabled visualization of mitochondria in thefar-red fluorescence by setting the emission filter detectionbands between � � 650 and 700 nm. The TRAK1 shRNAisequence was subcloned into the vector pSIRENRed for visual-ization of red fluorescence, setting the emission filter detectionbands between � � 550 and 590 nm.The pEGFP-rTRAK1silentconstruct was visualized by setting the emission filter detectionbands between � � 500 and 550 nm. Fig. 4C shows a represen-tative transfected neuron. EGFP fluorescence (i.e. rTRAK1)wasenriched in the cell body and at the tips of some processes,probably the growth cones. It was also evident at lower concen-trations as puncta throughoutmost processes. The live imaging
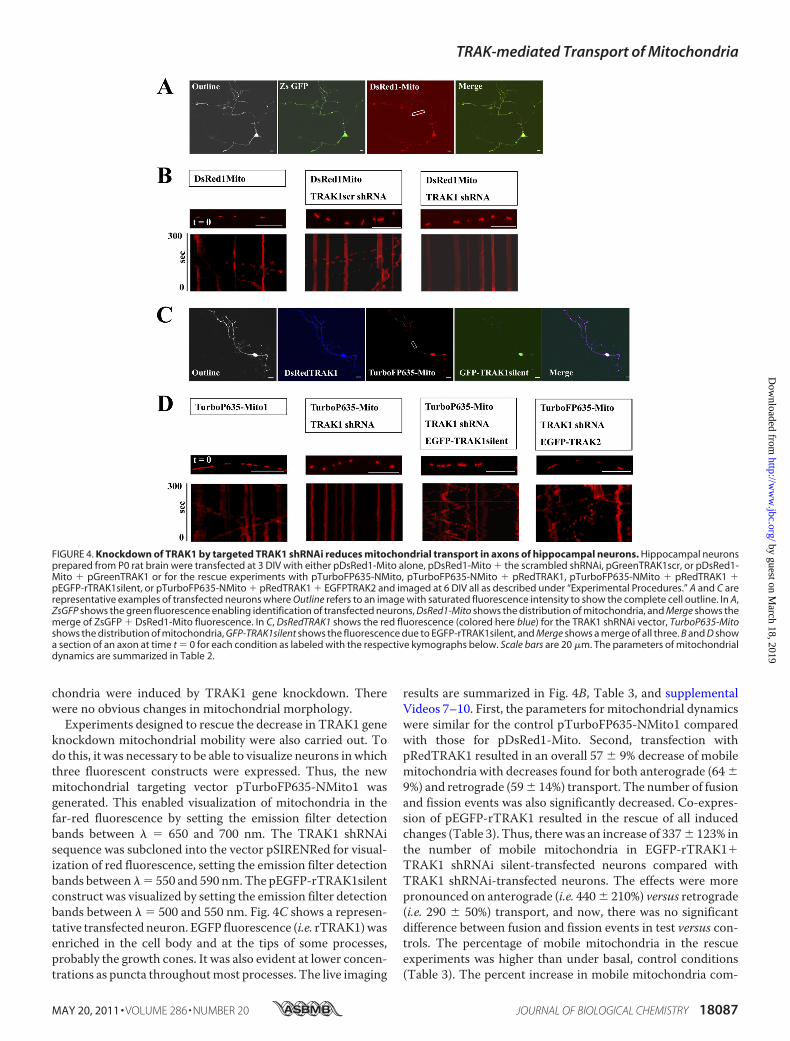
results are summarized in Fig. 4B, Table 3, and supplementalVideos 7–10. First, the parameters for mitochondrial dynamicswere similar for the control pTurboFP635-NMito1 comparedwith those for pDsRed1-Mito. Second, transfection withpRedTRAK1 resulted in an overall 57 � 9% decrease of mobilemitochondria with decreases found for both anterograde (64�9%) and retrograde (59� 14%) transport. The number of fusionand fission events was also significantly decreased. Co-expres-sion of pEGFP-rTRAK1 resulted in the rescue of all inducedchanges (Table 3). Thus, therewas an increase of 337� 123% inthe number of mobile mitochondria in EGFP-rTRAK1�TRAK1 shRNAi silent-transfected neurons compared withTRAK1 shRNAi-transfected neurons. The effects were morepronounced on anterograde (i.e. 440� 210%) versus retrograde(i.e. 290 � 50%) transport, and now, there was no significantdifference between fusion and fission events in test versus con-trols. The percentage of mobile mitochondria in the rescueexperiments was higher than under basal, control conditions(Table 3). The percent increase in mobile mitochondria com-
FIGURE 4. Knockdown of TRAK1 by targeted TRAK1 shRNAi reduces mitochondrial transport in axons of hippocampal neurons. Hippocampal neuronsprepared from P0 rat brain were transfected at 3 DIV with either pDsRed1-Mito alone, pDsRed1-Mito � the scrambled shRNAi, pGreenTRAK1scr, or pDsRed1-Mito � pGreenTRAK1 or for the rescue experiments with pTurboFP635-NMito, pTurboFP635-NMito � pRedTRAK1, pTurboFP635-NMito � pRedTRAK1 �pEGFP-rTRAK1silent, or pTurboFP635-NMito � pRedTRAK1 � EGFPTRAK2 and imaged at 6 DIV all as described under “Experimental Procedures.” A and C arerepresentative examples of transfected neurons where Outline refers to an image with saturated fluorescence intensity to show the complete cell outline. In A,ZsGFP shows the green fluorescence enabling identification of transfected neurons, DsRed1-Mito shows the distribution of mitochondria, and Merge shows themerge of ZsGFP � DsRed1-Mito fluorescence. In C, DsRedTRAK1 shows the red fluorescence (colored here blue) for the TRAK1 shRNAi vector, TurboP635-Mitoshows the distribution of mitochondria, GFP-TRAK1silent shows the fluorescence due to EGFP-rTRAK1silent, and Merge shows a merge of all three. B and D showa section of an axon at time t � 0 for each condition as labeled with the respective kymographs below. Scale bars are 20 �m. The parameters of mitochondrialdynamics are summarized in Table 2.
TRAK-mediated Transport of Mitochondria
MAY 20, 2011 • VOLUME 286 • NUMBER 20 JOURNAL OF BIOLOGICAL CHEMISTRY 18087
by guest on March 18, 2019
http://ww
w.jbc.org/
Dow
nloaded from
paring pTurboFP635-NMito1 � pRedTRAK1 � pEGFP-rTRAK1silent- with pTurboFP635-NMito1-transfected neu-rons was 63 � 8%.Rescue experiments were also attempted using EGFP-
TRAK2. Findings similar to those obtained for TRAK1 wereobtained; i.e. TRAK2 was able to reverse the TRAK1 shRNAi-induced arrest of mitochondria. The percentage of mobilemitochondria in the rescue experiments was higher than underbasal, control conditions with increases in both anterogradeand retrograde transport. The decrease in the number of fusionand fission events induced by TRAK1 shRNAi was nowreversed such that no differences were evident between con-trols and EGFP-TRAK2 rescue transfections. Furthermore, nochange in mean mitochondrial velocity or mitochondrial den-sity and morphology over the 5-min period of live imaging wasobserved (Table 3).Effects of Knockdown of TRAK2 on Mitochondrial Dynamics
in Axons of Hippocampal Neurons—Experiments to determinethe effects of TRAK2 gene knockdown on mitochondrialdynamics in axons of hippocampal neurons were also carriedout. The findings are summarized in Table 4 and supplementalFig. 1 and Videos 11–13. There were no significant effects ofeither the TRAK2 or TRAK2-2 shRNAs on any of the parame-ters of mitochondrial dynamics despite the comparable activitybetween TRAK1 and TRAK2 shRNAis in the validationexperiments.Analysis of Velocity in TRAK-impairedMitochondrial Trans-
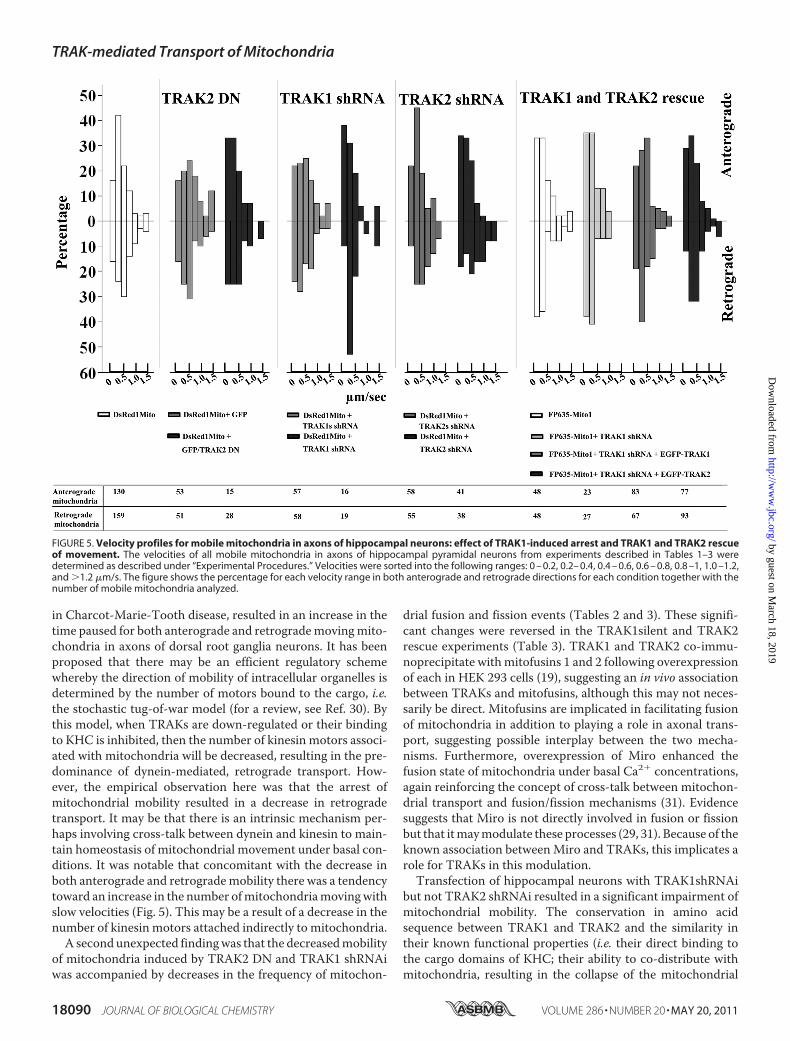
port in Axons of Hippocampal Neurons—The velocities of allmovingmitochondria were compared in axons of hippocampalneurons that had been transfected with TRAK2 DN, TRAK1shRNAi, TRAK2 shRNAi, and shRNAi � EGFP-TRAK1 orEGFP-TRAK2 (for rescue experiments) together with appro-priate controls (data from Tables 2, 3, and 4). The results aresummarized in Fig. 5. The main features are that, in controltransfections, the majority of mitochondria move in bothanterograde and retrograde directions within the range of0–0.8 �m/s. In TRAK2 DN and TRAK1 shRNAi experimentswhere there was a decrease in mitochondrial mobility, therewas a shift toward increased numbers of mitochondria movingwith the lower velocities, i.e. 0–0.4�m/s. Themaximumveloc-ity recorded was 2.6 �m/s in the anterograde direction and 2.4�m/s in the retrograde direction. It was notable that of mito-chondria within the �1.2 �m/s range the majority were in theretrograde direction, i.e. 21 of 29. Mitochondria with velocity�1.2�m/swere seen in both anterograde and retrograde direc-tions in neurons in which the mobility of mitochondria wasimpaired by a TRAK-dependent mechanism. It was observedthat these fast moving mitochondria in the TRAK-impairedconditions were rounded with a small, 0.2-�m diameter.
DISCUSSION
In this study, we have shownusing both targeted gene knock-down and dominant negative studies that disruption of thekinesin-TRAK-Miro mitochondrial trafficking complexresulted in a reduction of basal mitochondrial mobility in theaxons of hippocampal neurons. These findings prove a role forTRAK1 as an endogenous mediator of mitochondrial traffick-ing in axons of hippocampal neurons.T
AB
LE3
Sum
mar
yo
feff
ects
ofT
RA
K1
gen
ekn
ock
do
wn
on
mit
och
on
dri
ald
ynam
ics
inax
on
so
fhip
po
cam
pal
pyr
amid
aln
euro
ns
Hippo
campaln
eurons
weretransfectedin
parallelat3
DIV
with
either
pDsRed1-Mito
,pDsRed1-Mito
�pG
reenTRA
K1scr,pDsRed1-Mito
�pG
reenTRA
K1,pT
urbo
FP635-NMito
1,pT
urbo
FP635-NMito
1�
pRedTRA
K1,
pTurbo
FP635-NMito
1�
pRedTRA
K1
�pE
GFP
-rTRA
K1silent,o
rpT
urbo
FP635-NMito
1�
pRedTRA
K1
�pE
GFP
-TRA
K2.
At6
DIV
,co-transfectedneuron
swereidentified,
mito
chon
driald
ynam
icswereim
aged
byconfocalmicroscop
y,andtheresults
wereanalyzed
usingVolocity
softw
areallasd
escribed
under“Ex
perim
entalP
rocedu
res.”
Valuesa
rethemeans
�S.E.
from
n�
17im
ages
from
n�
8neuron
sfor
pDsRed1-Mito
(180
mito
chon
driaim
aged),n
�29
images
from
n�
14neuron
sfor
pDsRed1-Mito
�pG
reenTRA
K1s
transfectio
ns(299
mito
chon
driaim
aged),n
�42
images
from
n�
23neuron
sfor
pDsRed1-Mito
�pG
reenTRA
K1(406
mito
chon
driaim
aged),n
�28
images
from
n�
18neuron
sfor
pTurbo
FP635-NMito
1(310
mito
chon
driaim
aged),n
�33
images
from
n�
16neuron
sfor
pTurbo
FP635-NMito
1�
pRedTRA
K1(335
mito
chon
driaim
aged),
n�
35im
ages
from
n�
19neuron
sforpT
urbo
FP635-NMito
1�
pRedTRA
K1
�pE
GFP
-ratTRA
K1(323
mito
chon
dria
imaged),andn
�29
images
from
n�
17neuron
sforpT
urbo
FP635-NMito
1�
pRedTRA
K�
pEGFP
-TRA
K2(333
mito
chon
driaim
aged)for
atleastn
�3independ
enttransfectionexperim
entsexcept
where
noted.Statisticalsig
nificancesw
ereob
tained
usingtheStud
ent’s
ttest.
Clone
stransfected
Mito
chon
drial
density
Veloc
ityFu
sion
even
ts/
10mito
chon
dria
Fissioneven
ts/
10mito
chon
dria
Oscillating
mito
chon
dria
Stationa
rymito
chon
dria
Mob
ilemito
chon
dria
Anterog
rade
mito
chon
dria
Retrograd
emito
chon
dria
�m
1
�m/s
%%
%%
%pD
sRed1-Mito
0.21
�0.03
0.40
�0.06
0.7
0.7
2�
164
�2
36�
217
�2
16�
3pD
sRed1-Mito
pGreen
TRA
K1scr
0.16
�0.02
0.45
�0.05
0.7
0.8
1�
164
�3
36�
316
�1
18�
3pD
sRed1-Mito
pGreen
TRA
K1
0.14
�0.02
0.38
�0.07
0.4a
0.3b
2�
184
�3c
16�
3d7
�2d
7�
1dpT
urbo
FP63
5-NMito
10.18
�0.01
0.33
�0.05
0.6
0.7
0�
068
�3
32�
316
�2
16�
3pT
urbo
FP63
5-NMito
1pR
edTRA
K1
0.13
�0.02
0.34
�0.05
0.3b
0.3b
2�
184
�4c
14�
4c7
�2d
7�
2dpT
urbo
FP63
5-NMito
1pR
edTRA
K1pE
GFP
-rTRA
K1silent
0.15
�0.02
0.42
�0.04
0.6
0.7
4�
349
�7d
51�
7d26
�4c
21�
5apT
urbo
FP63
5-NMito
1epR
edTRA
K1pE
GFP
-TRA
K2
0.13
�0.01
0.46
�0.04
0.6
0.7
346
5423
28ap
�0.05
.bp
�0.01
.cp
�0.00
05.
dp
�0.00
5.en
�2tran
sfectio
nswerecarriedou
t.
TRAK-mediated Transport of Mitochondria
18088 JOURNAL OF BIOLOGICAL CHEMISTRY VOLUME 286 • NUMBER 20 • MAY 20, 2011
by guest on March 18, 2019
http://ww
w.jbc.org/
Dow
nloaded from
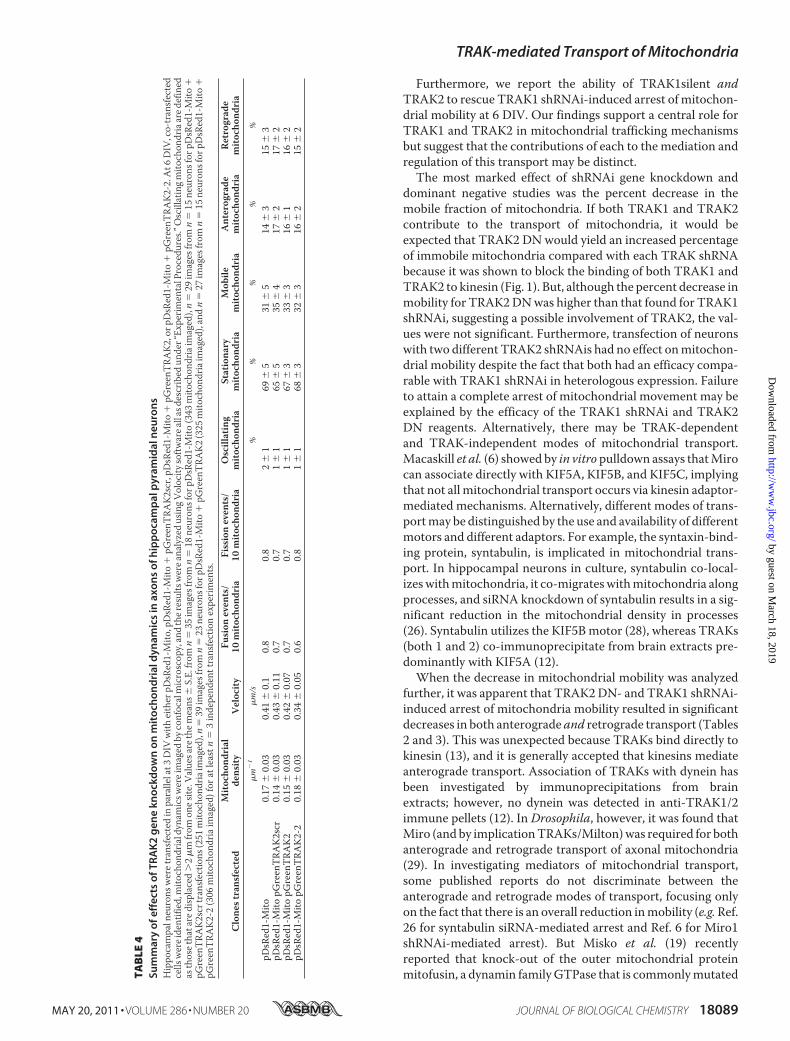
Furthermore, we report the ability of TRAK1silent andTRAK2 to rescue TRAK1 shRNAi-induced arrest of mitochon-drial mobility at 6 DIV. Our findings support a central role forTRAK1 and TRAK2 in mitochondrial trafficking mechanismsbut suggest that the contributions of each to the mediation andregulation of this transport may be distinct.The most marked effect of shRNAi gene knockdown and
dominant negative studies was the percent decrease in themobile fraction of mitochondria. If both TRAK1 and TRAK2contribute to the transport of mitochondria, it would beexpected that TRAK2 DN would yield an increased percentageof immobile mitochondria compared with each TRAK shRNAbecause it was shown to block the binding of both TRAK1 andTRAK2 to kinesin (Fig. 1). But, although the percent decrease inmobility for TRAK2DNwas higher than that found for TRAK1shRNAi, suggesting a possible involvement of TRAK2, the val-ues were not significant. Furthermore, transfection of neuronswith two different TRAK2 shRNAis had no effect onmitochon-drial mobility despite the fact that both had an efficacy compa-rable with TRAK1 shRNAi in heterologous expression. Failureto attain a complete arrest of mitochondrial movement may beexplained by the efficacy of the TRAK1 shRNAi and TRAK2DN reagents. Alternatively, there may be TRAK-dependentand TRAK-independent modes of mitochondrial transport.Macaskill et al. (6) showed by in vitro pulldown assays thatMirocan associate directly with KIF5A, KIF5B, and KIF5C, implyingthat not all mitochondrial transport occurs via kinesin adaptor-mediated mechanisms. Alternatively, different modes of trans-portmay be distinguished by the use and availability of differentmotors and different adaptors. For example, the syntaxin-bind-ing protein, syntabulin, is implicated in mitochondrial trans-port. In hippocampal neurons in culture, syntabulin co-local-izeswithmitochondria, it co-migrateswithmitochondria alongprocesses, and siRNA knockdown of syntabulin results in a sig-nificant reduction in the mitochondrial density in processes(26). Syntabulin utilizes the KIF5Bmotor (28), whereas TRAKs(both 1 and 2) co-immunoprecipitate from brain extracts pre-dominantly with KIF5A (12).When the decrease in mitochondrial mobility was analyzed
further, it was apparent that TRAK2DN- and TRAK1 shRNAi-induced arrest of mitochondria mobility resulted in significantdecreases in both anterograde and retrograde transport (Tables2 and 3). This was unexpected because TRAKs bind directly tokinesin (13), and it is generally accepted that kinesins mediateanterograde transport. Association of TRAKs with dynein hasbeen investigated by immunoprecipitations from brainextracts; however, no dynein was detected in anti-TRAK1/2immune pellets (12). In Drosophila, however, it was found thatMiro (andby implicationTRAKs/Milton)was required for bothanterograde and retrograde transport of axonal mitochondria(29). In investigating mediators of mitochondrial transport,some published reports do not discriminate between theanterograde and retrograde modes of transport, focusing onlyon the fact that there is an overall reduction inmobility (e.g.Ref.26 for syntabulin siRNA-mediated arrest and Ref. 6 for Miro1shRNAi-mediated arrest). But Misko et al. (19) recentlyreported that knock-out of the outer mitochondrial proteinmitofusin, a dynamin familyGTPase that is commonlymutatedT
AB
LE4
Sum
mar
yo
feff
ects
ofT
RA
K2
gen
ekn
ock
do
wn
on
mit
och
on
dri
ald
ynam
ics
inax
on
so
fhip
po
cam
pal
pyr
amid
aln
euro
ns
Hippo
campaln
eurons
weretransfected
inparallelat3
DIV
with
either
pDsRed1-Mito
,pDsRed1-Mito
�pG
reenTRA
K2scr,pDsRed1-Mito
�pG
reenTRA
K2,or
pDsRed1-Mito
�pG
reenTRA
K2-2.At6
DIV
,co-transfected
cells
wereidentified,m
itochon
drialdynam
icsw
ereimaged
byconfocalmicroscop
y,andtheresultswerea
nalyzedusingV
olocity
softw
area
llasdescrib
edun
der“Ex
perim
entalProcedu
res.”
Oscillatingm
itochon
driaared
efined
asthosethatare
displaced
�2
�m
from
ones
ite.V
aluesa
rethem
eans
�S.E.from
n�
35im
ages
from
n�
18neuron
sfor
pDsRed1-Mito
(343
mito
chon
driaim
aged),n
�29
images
from
n�
15neuron
sfor
pDsRed1-Mito
�pG
reenTRA
K2scr
transfectio
ns(251
mito
chon
driaim
aged),n
�39
images
from
n�
23neuron
sfor
pDsRed1-Mito
�pG
reenTRA
K2(325
mito
chon
driaim
aged),andn
�27
images
from
n�
15neuron
sfor
pDsRed1-Mito
�pG
reenTRA
K2-2(306
mito
chon
driaim
aged)for
atleastn
�3independ
enttransfectionexperim
ents.
Clone
stransfected
Mito
chon
drial
density
Veloc
ityFu
sion
even
ts/
10mito
chon
dria
Fissioneven
ts/
10mito
chon
dria
Oscillating
mito
chon
dria
Stationa
rymito
chon
dria
Mob
ilemito
chon
dria
Anterog
rade
mito
chon
dria
Retrograd
emito
chon
dria
�m
1
�m/s
%%
%%
%pD
sRed1-Mito
0.17
�0.03
0.41
�0.1
0.8
0.8
2�
169
�5
31�
514
�3
15�
3pD
sRed1-Mito
pGreen
TRA
K2scr
0.14
�0.03
0.43
�0.11
0.7
0.7
1�
165
�5
35�
417
�2
17�
2pD
sRed1-Mito
pGreen
TRA
K2
0.15
�0.03
0.42
�0.07
0.7
0.7
1�
167
�3
33�
316
�1
16�
2pD
sRed1-Mito
pGreen
TRA
K2-2
0.18
�0.03
0.34
�0.05
0.6
0.8
1�
168
�3
32�
316
�2
15�
2
TRAK-mediated Transport of Mitochondria
MAY 20, 2011 • VOLUME 286 • NUMBER 20 JOURNAL OF BIOLOGICAL CHEMISTRY 18089
by guest on March 18, 2019
http://ww
w.jbc.org/
Dow
nloaded from
in Charcot-Marie-Tooth disease, resulted in an increase in thetime paused for both anterograde and retrogrademovingmito-chondria in axons of dorsal root ganglia neurons. It has beenproposed that there may be an efficient regulatory schemewhereby the direction of mobility of intracellular organelles isdetermined by the number of motors bound to the cargo, i.e.the stochastic tug-of-war model (for a review, see Ref. 30). Bythis model, when TRAKs are down-regulated or their bindingto KHC is inhibited, then the number of kinesin motors associ-ated with mitochondria will be decreased, resulting in the pre-dominance of dynein-mediated, retrograde transport. How-ever, the empirical observation here was that the arrest ofmitochondrial mobility resulted in a decrease in retrogradetransport. It may be that there is an intrinsic mechanism per-haps involving cross-talk between dynein and kinesin to main-tain homeostasis of mitochondrial movement under basal con-ditions. It was notable that concomitant with the decrease inboth anterograde and retrogrademobility there was a tendencytoward an increase in the number ofmitochondriamovingwithslow velocities (Fig. 5). This may be a result of a decrease in thenumber of kinesin motors attached indirectly to mitochondria.A secondunexpected findingwas that the decreasedmobility
of mitochondria induced by TRAK2 DN and TRAK1 shRNAiwas accompanied by decreases in the frequency of mitochon-
drial fusion and fission events (Tables 2 and 3). These signifi-cant changes were reversed in the TRAK1silent and TRAK2rescue experiments (Table 3). TRAK1 and TRAK2 co-immu-noprecipitate withmitofusins 1 and 2 following overexpressionof each in HEK 293 cells (19), suggesting an in vivo associationbetween TRAKs and mitofusins, although this may not neces-sarily be direct. Mitofusins are implicated in facilitating fusionof mitochondria in addition to playing a role in axonal trans-port, suggesting possible interplay between the two mecha-nisms. Furthermore, overexpression of Miro enhanced thefusion state of mitochondria under basal Ca2� concentrations,again reinforcing the concept of cross-talk between mitochon-drial transport and fusion/fission mechanisms (31). Evidencesuggests that Miro is not directly involved in fusion or fissionbut that itmaymodulate these processes (29, 31). Because of theknown association betweenMiro and TRAKs, this implicates arole for TRAKs in this modulation.Transfection of hippocampal neurons with TRAK1shRNAi
but not TRAK2 shRNAi resulted in a significant impairment ofmitochondrial mobility. The conservation in amino acidsequence between TRAK1 and TRAK2 and the similarity intheir known functional properties (i.e. their direct binding tothe cargo domains of KHC; their ability to co-distribute withmitochondria, resulting in the collapse of the mitochondrial
FIGURE 5. Velocity profiles for mobile mitochondria in axons of hippocampal neurons: effect of TRAK1-induced arrest and TRAK1 and TRAK2 rescueof movement. The velocities of all mobile mitochondria in axons of hippocampal pyramidal neurons from experiments described in Tables 1–3 weredetermined as described under “Experimental Procedures.” Velocities were sorted into the following ranges: 0 – 0.2, 0.2– 0.4, 0.4 – 0.6, 0.6 – 0.8, 0.8 –1, 1.0 –1.2,and �1.2 �m/s. The figure shows the percentage for each velocity range in both anterograde and retrograde directions for each condition together with thenumber of mobile mitochondria analyzed.
TRAK-mediated Transport of Mitochondria
18090 JOURNAL OF BIOLOGICAL CHEMISTRY VOLUME 286 • NUMBER 20 • MAY 20, 2011
by guest on March 18, 2019
http://ww
w.jbc.org/
Dow
nloaded from
network when overexpressed in cells; the redistribution ofmitochondria to the tips of processes when either TRAK1 orTRAK2 are co-expressed with KHC; and the co-immunopre-cipitation of Miro1 or Miro2 with either TRAK1 or TRAK2following overexpression inmammalian cells) suggest that bothproteins have similar functions (9, 12, 13, 15, 17). Yet despitethe finding that TRAK1 and TRAK2 shRNAs had similar effi-cacies in heterologous expression, TRAK2 shRNAis had noeffect on mitochondrial mobility. There are several possibleexplanations for this apparent inconsistency. Themost obviousis that TRAK2 is not expressed in axons of hippocampal pyram-idal neurons at this early stage in development, i.e. 6 DIV fromP0 animals. However, we have previously described the distri-bution of TRAK2 using specific anti-TRAK2 antibodies in neu-ronal cultures prepared from hippocampi of E18 rats at 14 DIV(equivalent to 11 DIV for P0 cultures as used here; Ref. 18).Anti-TRAK2 immunoreactivity was present throughout allneuronal processes, and �50% was co-distributed with mito-chondria (18). The developmental profiles of TRAKs 1 and 2were determined by analyzing their time-dependent expressionin P0hippocampal neurons in culture by immunoblotting usinganti-TRAK2(8–633) (which recognizes TRAK1 and TRAK2)and anti-TRAK2(874–889) (which recognizes TRAK2 only)antibodies (supplemental Fig. 2). Immunoreactive signals wereobserved at all DIV for both antibodies, but the signal wasmorerobust for anti-TRAK2(8–633), suggesting that although bothTRAK1 and TRAK2 are expressed TRAK1 is present at higherlevels. Other possible explanations for the observed differencesbetween the effects of TRAK1 versusTRAK2 shRNAs onmito-chondrial mobility may include their distinct subcellular distri-butions such as dendritic versus axonal localization within asingle neuronal cell type, different turnover times of the twoproteins, and the availability and specificity of kinesin motorproteins.A further consideration is that TRAKs may serve different
functions. TRAK1 and TRAK2 have both been implicated inregulating endosome to lysosome trafficking by virtue of theirassociation in HeLa and pheochromocytoma 12 cells with hep-atocyte growth factor-regulated tyrosine kinase substrate (Hrs;Refs. 20 and 21). Also, overexpression ofHrs recruits TRAK2 toHrs-positive endosomal compartments (18). Thus, TRAK1 andTRAK2 may participate in microtubule-based transport ofearly endosomes by acting as an adaptor linkingHrs-containingendosomes to kinesin (20, 21). TRAKs have also been linked tothe forward trafficking of inhibitory GABAA neurotransmitterreceptors (9, 32) and Kir2.1 inwardly rectifying potassiumchannels (33). TRAKs may therefore be promiscuous in termsof the cargo they transport. Cargoes may be determined byavailability and the needs of the cell. It is of note that although atany one time all mitochondria containMiro under resting con-ditions (i.e. in the culture conditions in which the neurons weregrown) only �50% are co-distributed with TRAK2 immunore-activity (18). This value is comparable with the �35% of themitochondrial population that are mobile. Increasing the levelof Miro enhances association of TRAKs with mitochondria asdoes regulating Miro GTPase activity (18). It is not clearwhether these manipulations are sufficient to engage kinesinand to enhance mobility via the formation of the kinesin-
TRAK-Miro trafficking complex. Additional studies are neces-sary to elucidate the signaling mechanisms that initiate the for-mation and indeed the dissociation of the kinesin-TRAK-Mirotrafficking complex. Furthermore, it will be important to deter-mine the role of TRAK2 compared with TRAK1 in regulatingmitochondrial transport. It may be that both TRAK1 andTRAK2 mediate transport but that there is a preference forTRAK1, so although TRAK1 is present, this is dominant. ButshouldTRAK1 levels be compromised as in the shRNAi studies,TRAK2 has the capacity to compensate for the lack of TRAK1availability. Finally, it is of importance to determine whetherneuronal function is compromised in neurons in which mito-chondrial mobility is impaired. This may be central to under-standing the pathogenesis of neurodegenerative diseases inwhich mitochondrial mislocalization has been observed.
Acknowledgments—We thank Dr. Karine Pozo for help and advice onthe culturing and transfection of hippocampal pyramidal neurons.We also thank Dr. Sarah Cousins for generating the clonespTurboFP635-NMito1, pEGFP-ratTRAK1silent, and pIRES-GFPTRAK2 DN; Tom Randall for help with Fig. 5; and Dr. CarolynMoores, Birkbeck College, London, UK for insightful discussions. Wegratefully acknowledge the financial contribution fromTheWellcomeTrust for the purchase of the Zeiss 710 confocal microscope.
REFERENCES1. Boldogh, I. R., and Pon, L. A. (2007) Trends Cell Biol. 17, 502–5102. Detmer, S. A., and Chan, D. C. (2007) Nat. Rev. Mol. Cell Biol. 8,
870–8793. MacAskill, A. F., and Kittler, J. T. (2010) Trends Cell Biol. 20, 102–1124. Yi, M., Weaver, D., and Hajnoczky, G. (2004) J. Cell Biol. 167, 661–6725. Chang, D. T., Honick, A. S., and Reynolds, I. J. (2006) J. Neurosci. 26,
7035–70456. Macaskill, A. F., Rinholm, J. E., Twelvetrees, A. E., Arancibia-Carcamo,
I. L., Muir, J., Fransson, A., Aspenstrom, P., Attwell, D., and Kittler, J. T.(2009) Neuron 61, 541–555
7. Wang, X., and Schwarz, T. L. (2009) Cell 136, 163–1748. Stephenson, F. A., and Brickley, K. (2010) in Protein Folding for the Syn-
apse (Wittenbach, A., andO’Connor, V., eds) pp. 105–119, Springer, NewYork
9. Beck, M., Brickley, K., Wilkinson, H. L., Sharma, S., Smith, M., Chazot,P. L., Pollard, S., and Stephenson, F. A. (2002) J. Biol. Chem. 277,30079–30090
10. Iyer, S. P., Akimoto, Y., and Hart, G. W. (2003) J. Biol. Chem. 278,5399–5409
11. Stowers, R. S., Megeath, L. J., Gorska-Andrzejak, J., Meinertzhagen, I. A.,and Schwarz, T. L. (2002) Neuron 36, 1063–1077
12. Brickley, K., Smith, M. J., Beck, M., and Stephenson, F. A. (2005) J. Biol.Chem. 280, 14723–14732
13. Smith, M. J., Pozo, K., Brickley, K., and Stephenson, F. A. (2006) J. Biol.Chem. 281, 27216–27228
14. Koutsopoulos, O. S., Laine, D., Osellame, L., Chudakov, D. M., Parton,R. G., Frazier, A. E., and Ryan, M. T. (2010) Biochim. Biophys. Acta 1803,564–574
15. Glater, E. E., Megeath, L. J., Stowers, R. S., and Schwarz, T. L. (2006) J. CellBiol. 173, 545–557
16. Brickley, K., Pozo, K., and Stephenson, F. A. (2011) Biochim. Biophys. Acta1813, 269–281
17. Fransson, S., Ruusala, A., and Aspenstrom, P. (2006) Biochem. Biophys.Res. Commun. 344, 500–510
18. MacAskill, A. F., Brickley, K., Stephenson, F. A., and Kittler, J. T. (2009)Mol. Cell. Neurosci. 40, 301–312
19. Misko, A., Jiang, S.,Wegorzewska, I., Milbrandt, J., and Baloh, R. H. (2010)
TRAK-mediated Transport of Mitochondria
MAY 20, 2011 • VOLUME 286 • NUMBER 20 JOURNAL OF BIOLOGICAL CHEMISTRY 18091
by guest on March 18, 2019
http://ww
w.jbc.org/
Dow
nloaded from
J. Neurosci. 30, 4232–424020. Kirk, E., Chin, L. S., and Li, L. (2006) J. Cell Sci. 119, 4689–470121. Webber, E., Li, L., and Chin, L. S. (2008) J. Mol. Biol. 382, 638–65122. Goslin, K., Asmussen, H., and Banker, G. (1998) in Culturing Nerve Cells
(Banker, G., and Goslin, K., eds) 2nd Ed., pp. 339–370, MIT Press, Cam-bridge, MA
23. Jiang, M., and Chen, G. (2006) Nat. Protoc. 1, 695–70024. Ojla, G., Beck, M., Brickley, K., and Stephenson, F. A. (2003) Br. Neurosci.
Abstr. 17, P26.1225. Ligon L. A., and Steward, O. (2000) J. Comp. Neurol. 427, 340–35026. Cai, Q., Gerwin, C., and Sheng, Z. H. (2005) J. Cell Biol. 170, 959–96927. Kang, J. S., Tian, J. H., Pan, P. Y., Zald, P., Li, C., Deng, C., and Sheng, Z. H.
(2008) Cell 132, 137–148
28. Cai, Q., Pan, P. Y., and Sheng, Z. H. (2007) J. Neurosci. 27, 7284–729629. Russo, G. J., Louie, K., Wellington, A., Macleod, G. T., Hu, F., Pan-
chumarthi, S., and Zinsmaier, K. E. (2009) J. Neurosci. 29, 5443–545530. Hendricks, A. G., Perlson, E., Ross, J. L., Schroeder, H.W., 3rd, Tokito,M.,
and Holzbaur, E. L. (2010) Curr. Biol. 20, 697–70231. Saotome, M., Safiulina, D., Szabadkai, G., Das, S., Fransson, A., Aspen-
strom, P., Rizzuto, R., and Hajnoczky, G. (2008) Proc. Natl. Acad. Sci.U.S.A. 105, 20728–20733
32. Gilbert, S. L., Zhang, L., Forster, M. L., Anderson, J. R., Iwase, T., Soliven,B., Donahue, L. R., Sweet, H. O., Bronson, R. T., Davisson, M. T., Woll-mann, R. L., and Lahn, B. T. (2006) Nat. Genet. 38, 245–250
33. Grishin, A., Li, H., Levitan, E. S., and Zaks-Makhina, E. (2006) J. Biol.Chem. 281, 30104–30111
TRAK-mediated Transport of Mitochondria
18092 JOURNAL OF BIOLOGICAL CHEMISTRY VOLUME 286 • NUMBER 20 • MAY 20, 2011
by guest on March 18, 2019
http://ww
w.jbc.org/
Dow
nloaded from
Kieran Brickley and F. Anne StephensonAxons of Hippocampal Neurons
Trafficking Kinesin Protein (TRAK)-mediated Transport of Mitochondria in
doi: 10.1074/jbc.M111.236018 originally published online March 30, 20112011, 286:18079-18092.J. Biol. Chem.
10.1074/jbc.M111.236018Access the most updated version of this article at doi:
Alerts:
When a correction for this article is posted•
When this article is cited•
to choose from all of JBC's e-mail alertsClick here
Supplemental material:
http://www.jbc.org/content/suppl/2011/03/30/M111.236018.DC1
http://www.jbc.org/content/286/20/18079.full.html#ref-list-1
This article cites 31 references, 14 of which can be accessed free at
by guest on March 18, 2019
http://ww
w.jbc.org/
Dow
nloaded from