Embed Size (px)
Citation preview
WW
W.IP
SOS-
REI
D.C
OM
RReeppoorrtt ooff CCAAOO SSuurrvveeyy 22000044::
TTrraaiinniinngg,, PPrriioorriittiieess && SSuucccceessssiioonn PPllaannnniinngg
AApprriill 22000044
LLooccaall GGoovveerrnnmmeenntt SSeerrvviicceess DDiivviissiioonn
CCAAOO SSuurrvveeyy 22000044:: TTrraaiinniinngg,, PPrriioorriittiieess && SSuucccceessssiioonn PPllaannnniinngg
TABLE OF CONTENTS
EXECUTIVE SUMMARY....................................................................................... 1
METHODOLOGY ................................................................................................. 4
EMPLOYMENT, EDUCATION AND TRAINING..................................................... 6
EMPLOYMENT ........................................................................................................... 6 Duration as CAO................................................................................................. 6 Anticipated CAO Duration.................................................................................... 7 Future Plans....................................................................................................... 8 Employment History............................................................................................ 9
EDUCATION & TRAINING .......................................................................................... 10 Educational Background.................................................................................... 10 Municipal Management Courses......................................................................... 10 Workshops and Seminars .................................................................................. 13 Professional Organizations ................................................................................ 15 Training Interests ............................................................................................. 16
CAO RESPONSIBILITIES, MUNICIPAL PRIORITIES AND SUCCESSION PLANNING ....................................................................................................... 18
CAO RESPONSIBILITIES ........................................................................................... 18 CAOs’ Allocation of Time ................................................................................... 18 CAO Responsibilities Compared to Training Interests .......................................... 20 Trends in CAOs’ Allocation of Time .................................................................... 21 Changes in CAO Responsibilities ........................................................................ 22 Comparing Changes in CAO Responsibilities: 2004 vs. 2001 ............................... 24
MUNICIPAL PRIORITIES ............................................................................................ 25 Major Municipal Issues: Past Three Years.......................................................... 25 Major Municipal Issues: Next Three Years ......................................................... 27 Major Municipal Issues: Trends ........................................................................ 28 Preparedness to Deal with Issues ...................................................................... 29 Dealing with Priority Issues ............................................................................... 30 Beneficial Sources of Information ...................................................................... 31 Dealing with Public Involvement ........................................................................ 33
BUSINESS PLANS..................................................................................................... 35 Reasons for Not Having a Business Plan............................................................. 36 Current Business Plan Components.................................................................... 37
SUCCESSION PLANNING ............................................................................................ 38 Prevalence of Succession Plans.......................................................................... 38 Source of Future CAO Replacement ................................................................... 39 Advancement Opportunities .............................................................................. 42 Difficult Positions to Fill ..................................................................................... 43 Positions Left Unfilled........................................................................................ 45
CCAAOO SSuurrvveeyy 22000044:: TTrraaiinniinngg,, PPrriioorriittiieess && SSuucccceessssiioonn PPllaannnniinngg
1
EEXXEECCUUTTIIVVEE SSUUMMMMAARRYY
The following executive summary represents the most salient findings gleaned from questions related to training, priorities and succession planning via an on-line survey conducted among 273 CAOs of Alberta municipalities between February 9th and March 15th, 2004.
The predicted exodus of CAOs in the next six years has increased.
Almost one-half (44%) of CAOs anticipate they will leave their current position as CAO within six years, increased 10-points from 34% in 2001. One-half of these CAOs plan to retire, while others will aim to work in private sector roles, as CAOs for other municipalities, or outside of municipal government in different public sector positions.
CAOs are making use of workshops and seminars.
Overall, CAOs are more likely to have participated in workshops or seminars than in municipal management courses within the past three years. Currently, almost three-quarters of CAOs have embarked on training provided by Municipal Affairs representing the most common provider of educational workshops and seminars available to CAOs. In addition, more than one-half of CAOs have turned to the AUMA and LGAA to supplement their education and training.
Further training is desired in specific areas.
More than six-in-ten CAOs express an interest in receiving training in strategic thinking and planning. Further, slightly more than one-half of CAOs indicate an interest to receive training to enhance their skills in drafting by-laws and policy. Importantly, more than one-half of CAOs are also interested in receiving training to improve their knowledge and understanding of municipal roles and responsibilities. In addition, a similar proportion of CAOs are interested in training to improve their financial management and budgeting skills, as well as their knowledge of the Municipal Government Act and/or other legislation.
CAO responsibilities are escalating.
CAOs report experiencing a great deal of increased responsibility in almost all aspects of their role, particularly with respect to budgeting and strategic planning – one of the most coveted areas of desired training. Interactions with council have also notably increased in recent years.
CCAAOO SSuurrvveeyy 22000044:: TTrraaiinniinngg,, PPrriioorriittiieess && SSuucccceessssiioonn PPllaannnniinngg
2
CAOs need to discuss urgent matters with trusted informed sources.
When CAOs are faced with responsibilities and issues they have not yet tackled, they wish to discuss these matters with another informed person rather than using reference materials (Internet, Menet, publications). Phoning colleagues in other municipalities remains the most beneficial source of information for CAOs. However, CAOs today are less likely than they were in 2001 to identify Municipal Advisors at Municipal Affairs as the most beneficial source of information to assist them with time-sensitive issues. Nonetheless, CAOs consider Municipal Affairs as one of the main sources of information they would turn to in crisis.
CAOs are not well prepared to deal with major upcoming issues.
The major municipal issues CAOs will face over the next three years focus primarily on keeping pace with infrastructure and services (roads, building, water, sewer). Planning and development issues related to economic growth strategies or real estate developments, and addressing growth and sustainability issues are also key issues facing CAOs in upcoming years. Further, inter-municipal relations and human resource staffing issues are now major issues in some municipalities.
A minority of municipalities, however, reports being prepared to deal with these concerns. CAOs express a need for financial assistance, improved cooperation with other government bodies, additional training or advisory services, strategic planning, and human resource management planning to assist them with addressing these challenges.
Citizen engagement in local municipal issues is weak.
Dealing with the public is one of the most time-consuming responsibilities CAOs undertake. However, CAOs indicate that the public is not overly engaged in municipal issues and is not very well informed about local municipal issues. Even so, less than one-half of municipalities have been actively introducing new efforts to improve citizen participation.
Most CAOs cannot find the time or encouragement to develop a business plan.
More than one-half of CAOs do not currently have a business plan, and this has not changed significantly from measures taken three years ago. In general, the business planning process is not perceived as complicated, but is prohibited by a lack of human resources and/or support from council.
CCAAOO SSuurrvveeyy 22000044:: TTrraaiinniinngg,, PPrriioorriittiieess && SSuucccceessssiioonn PPllaannnniinngg
3
Municipalities are not prepared to deal with the impending exodus of CAOs.
Although 44% of CAOs report they will leave their post within the next six years, just 6% report having a formal succession plan in place. Poaching will be a strategy many municipalities will adopt, targeting CAOs and other managers to succeed them in their role. However, the homegrown approach to internally develop future CAOs is now a more prominent strategy to succession planning than it has been in the past.
Staffing issues are prevalent among two-thirds of municipalities.
The majority of CAOs have had difficulty in filling certain types of positions within the past three years. These positions typically relate to public works (operators, labourers, foremen, administrative positions (office support, clerks, secretaries), building and development positions (planners, assessors, safety code officers), and finance and accounting posts (treasurers, accountants). While many of these positions were eventually filled, more than one-in-ten Alberta CAOs were unable to fill specific vacant positions within their municipal administration.
* * *
Please refer to the complete report for more detailed information.
CCAAOO SSuurrvveeyy 22000044:: TTrraaiinniinngg,, PPrriioorriittiieess && SSuucccceessssiioonn PPllaannnniinngg
4
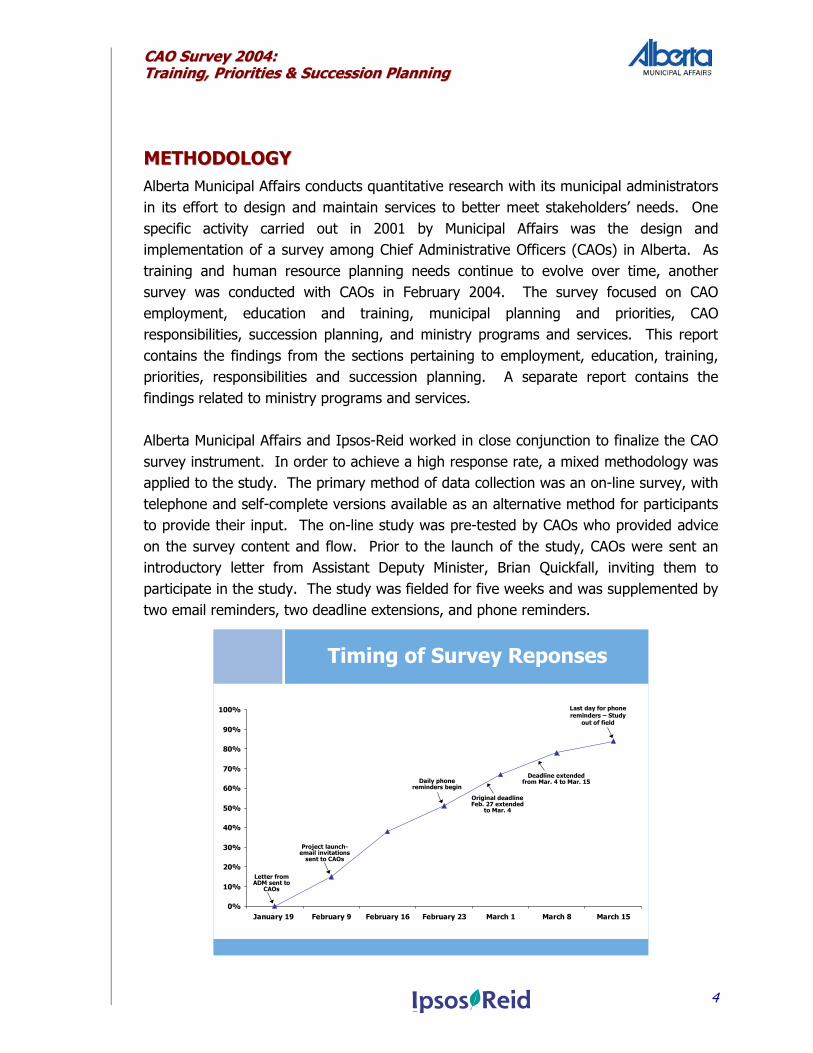
MMEETTHHOODDOOLLOOGGYY Alberta Municipal Affairs conducts quantitative research with its municipal administrators in its effort to design and maintain services to better meet stakeholders’ needs. One specific activity carried out in 2001 by Municipal Affairs was the design and implementation of a survey among Chief Administrative Officers (CAOs) in Alberta. As training and human resource planning needs continue to evolve over time, another survey was conducted with CAOs in February 2004. The survey focused on CAO employment, education and training, municipal planning and priorities, CAO responsibilities, succession planning, and ministry programs and services. This report contains the findings from the sections pertaining to employment, education, training, priorities, responsibilities and succession planning. A separate report contains the findings related to ministry programs and services. Alberta Municipal Affairs and Ipsos-Reid worked in close conjunction to finalize the CAO survey instrument. In order to achieve a high response rate, a mixed methodology was applied to the study. The primary method of data collection was an on-line survey, with telephone and self-complete versions available as an alternative method for participants to provide their input. The on-line study was pre-tested by CAOs who provided advice on the survey content and flow. Prior to the launch of the study, CAOs were sent an introductory letter from Assistant Deputy Minister, Brian Quickfall, inviting them to participate in the study. The study was fielded for five weeks and was supplemented by two email reminders, two deadline extensions, and phone reminders.
Timing of Survey Reponses
0%
10%
20%
30%
40%
50%
60%
70%
80%
90%
100%
January 19 February 9 February 16 February 23 March 1 March 8 March 15
Letter from ADM sent to
CAOs
Project launch-email invitations
sent to CAOs
Daily phone reminders begin
Last day for phone reminders – Study
out of field
Original deadline Feb. 27 extended
to Mar. 4
Deadline extended from Mar. 4 to Mar. 15
CCAAOO SSuurrvveeyy 22000044:: TTrraaiinniinngg,, PPrriioorriittiieess && SSuucccceessssiioonn PPllaannnniinngg
5
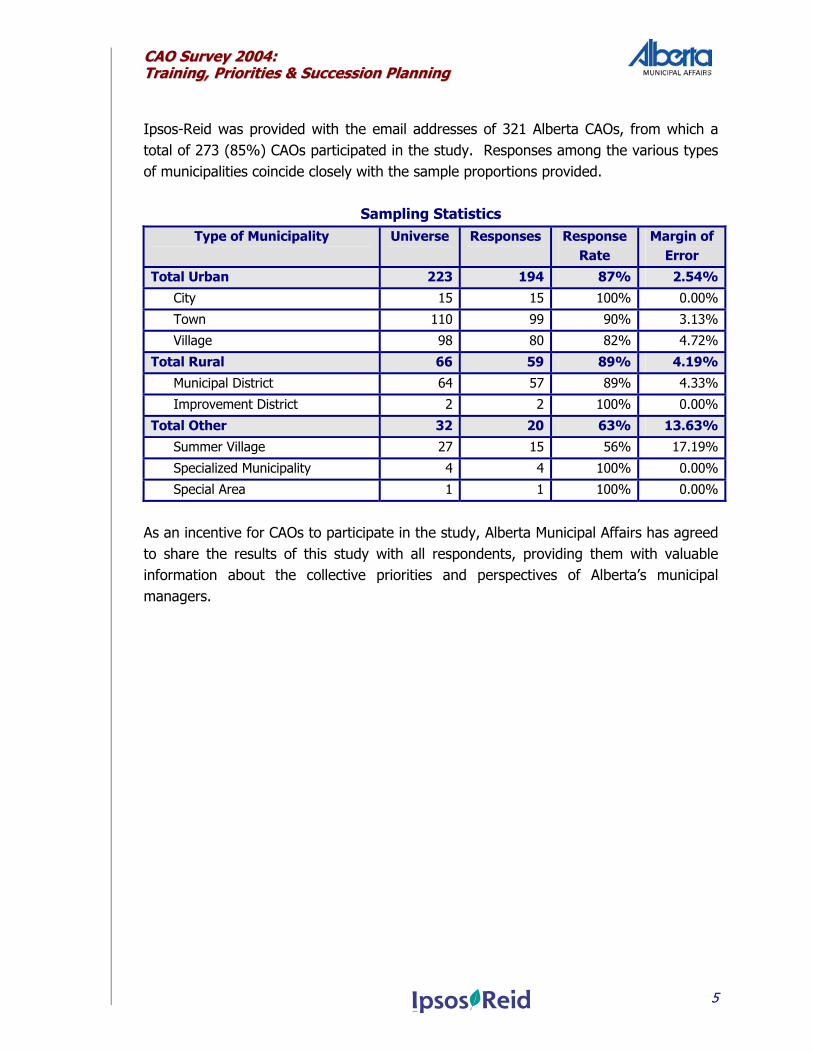
Ipsos-Reid was provided with the email addresses of 321 Alberta CAOs, from which a total of 273 (85%) CAOs participated in the study. Responses among the various types of municipalities coincide closely with the sample proportions provided.
Sampling Statistics Type of Municipality Universe Responses Response
Rate Margin of
Error
Total Urban 223 194 87% 2.54%
City 15 15 100% 0.00%
Town 110 99 90% 3.13%
Village 98 80 82% 4.72%
Total Rural 66 59 89% 4.19%
Municipal District 64 57 89% 4.33%
Improvement District 2 2 100% 0.00%
Total Other 32 20 63% 13.63%
Summer Village 27 15 56% 17.19%
Specialized Municipality 4 4 100% 0.00%
Special Area 1 1 100% 0.00%
As an incentive for CAOs to participate in the study, Alberta Municipal Affairs has agreed to share the results of this study with all respondents, providing them with valuable information about the collective priorities and perspectives of Alberta’s municipal managers.
CCAAOO SSuurrvveeyy 22000044:: TTrraaiinniinngg,, PPrriioorriittiieess && SSuucccceessssiioonn PPllaannnniinngg
6
EEMMPPLLOOYYMMEENNTT,, EEDDUUCCAATTIIOONN AANNDD TTRRAAIINNIINNGG To better understand the current demographics of Alberta’s Chief Administrative Officers and to allow for a more detailed and meaningful analysis of the survey results, respondents were initially asked a series of basic questions relating to their employment experience, education, training, and future career plans.
EEmmppllooyymmeenntt
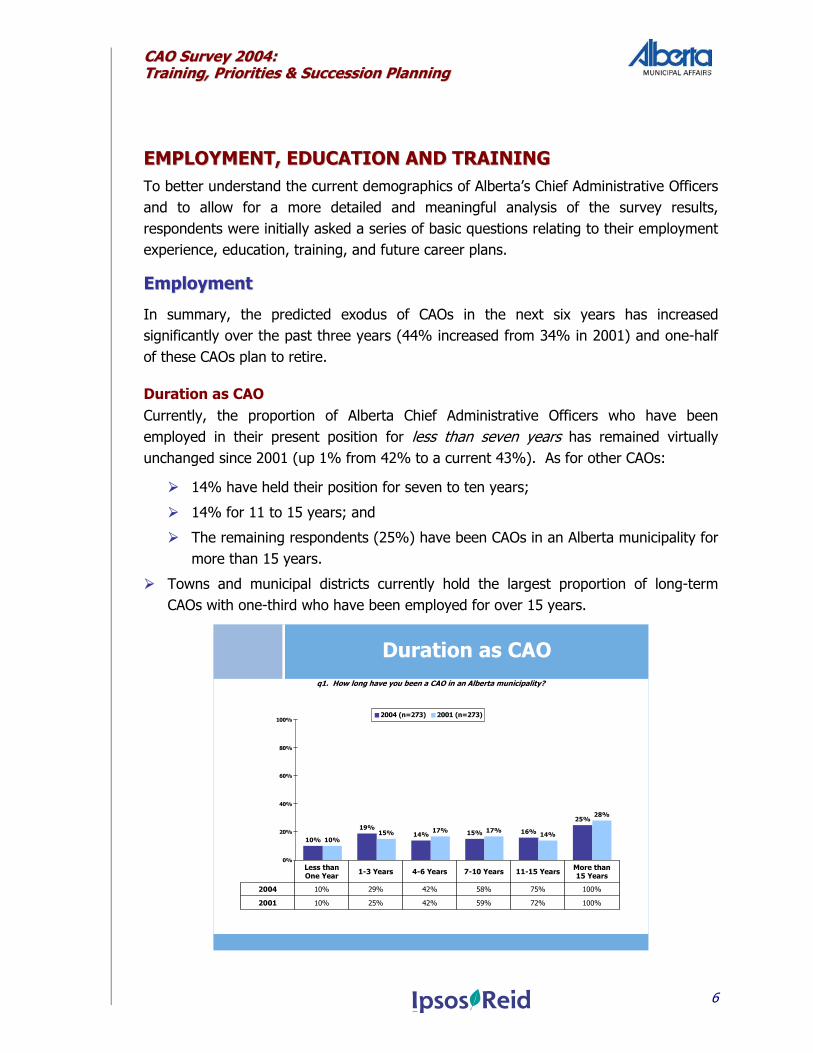
In summary, the predicted exodus of CAOs in the next six years has increased significantly over the past three years (44% increased from 34% in 2001) and one-half of these CAOs plan to retire.
Duration as CAO Currently, the proportion of Alberta Chief Administrative Officers who have been employed in their present position for less than seven years has remained virtually unchanged since 2001 (up 1% from 42% to a current 43%). As for other CAOs:
14% have held their position for seven to ten years;
14% for 11 to 15 years; and
The remaining respondents (25%) have been CAOs in an Alberta municipality for more than 15 years.
Towns and municipal districts currently hold the largest proportion of long-term CAOs with one-third who have been employed for over 15 years.
Duration as CAO
16%
25%
15%14%19%
10%14%
28%
17%17%15%10%
0%
20%
40%
60%
80%
100%2004 (n=273) 2001 (n=273)
100%72%59%42%25%10%2001
100%75%58%42%29%10%2004
More than 15 Years11-15 Years7-10 Years4-6 Years1-3 YearsLess than
One Year
q1. How long have you been a CAO in an Alberta municipality?
CCAAOO SSuurrvveeyy 22000044:: TTrraaiinniinngg,, PPrriioorriittiieess && SSuucccceessssiioonn PPllaannnniinngg
7
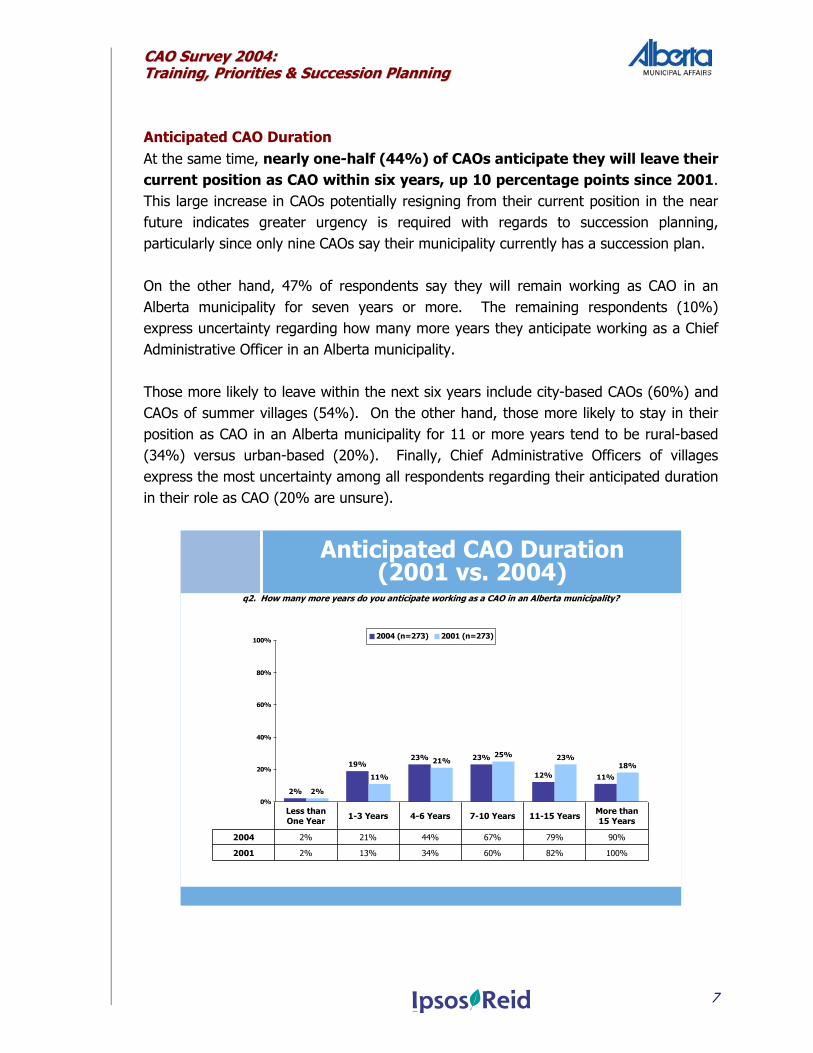
Anticipated CAO Duration At the same time, nearly one-half (44%) of CAOs anticipate they will leave their current position as CAO within six years, up 10 percentage points since 2001. This large increase in CAOs potentially resigning from their current position in the near future indicates greater urgency is required with regards to succession planning, particularly since only nine CAOs say their municipality currently has a succession plan. On the other hand, 47% of respondents say they will remain working as CAO in an Alberta municipality for seven years or more. The remaining respondents (10%) express uncertainty regarding how many more years they anticipate working as a Chief Administrative Officer in an Alberta municipality. Those more likely to leave within the next six years include city-based CAOs (60%) and CAOs of summer villages (54%). On the other hand, those more likely to stay in their position as CAO in an Alberta municipality for 11 or more years tend to be rural-based (34%) versus urban-based (20%). Finally, Chief Administrative Officers of villages express the most uncertainty among all respondents regarding their anticipated duration in their role as CAO (20% are unsure).
Anticipated CAO Duration(2001 vs. 2004)
q2. How many more years do you anticipate working as a CAO in an Alberta municipality?
12% 11%
2%
19%23% 23%
2%
11%
21%25%
18%23%
0%
20%
40%
60%
80%
100% 2004 (n=273) 2001 (n=273)
100%82%60%34%13%2%2001
90%79%67%44%21%2%2004
More than 15 Years11-15 Years7-10 Years4-6 Years1-3 YearsLess than
One Year
CCAAOO SSuurrvveeyy 22000044:: TTrraaiinniinngg,, PPrriioorriittiieess && SSuucccceessssiioonn PPllaannnniinngg
8
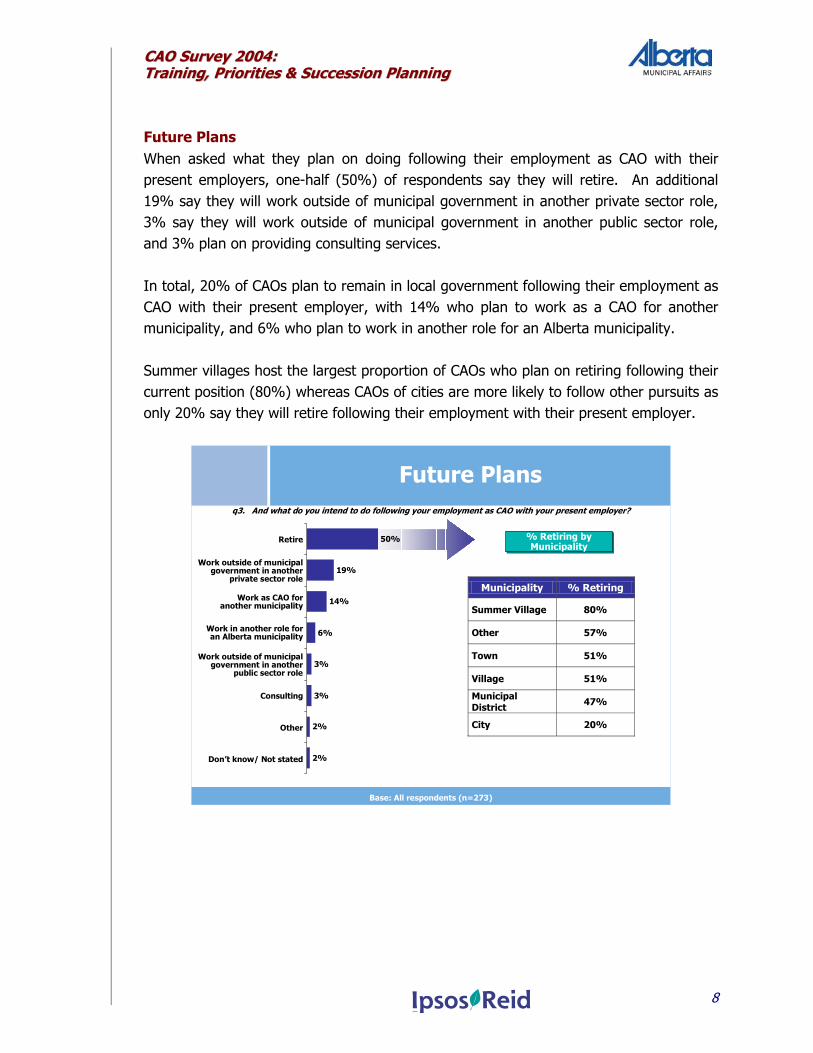
Future Plans When asked what they plan on doing following their employment as CAO with their present employers, one-half (50%) of respondents say they will retire. An additional 19% say they will work outside of municipal government in another private sector role, 3% say they will work outside of municipal government in another public sector role, and 3% plan on providing consulting services. In total, 20% of CAOs plan to remain in local government following their employment as CAO with their present employer, with 14% who plan to work as a CAO for another municipality, and 6% who plan to work in another role for an Alberta municipality. Summer villages host the largest proportion of CAOs who plan on retiring following their current position (80%) whereas CAOs of cities are more likely to follow other pursuits as only 20% say they will retire following their employment with their present employer.
50%
19%
14%
6%
3%
3%
2%
2%
Municipality % Retiring
Summer Village 80%
Other 57%
Town 51%
Village 51%
Municipal District 47%
City 20%
Future Plansq3. And what do you intend to do following your employment as CAO with your present employer?
Work as CAO for another municipality
Work in another role for an Alberta municipality
Work outside of municipal government in another
private sector role
Work outside of municipal government in another
public sector role
Retire
Other
Consulting
Don’t know/ Not stated
% Retiring by Municipality
% Retiring by Municipality
Base: All respondents (n=273)
CCAAOO SSuurrvveeyy 22000044:: TTrraaiinniinngg,, PPrriioorriittiieess && SSuucccceessssiioonn PPllaannnniinngg
9
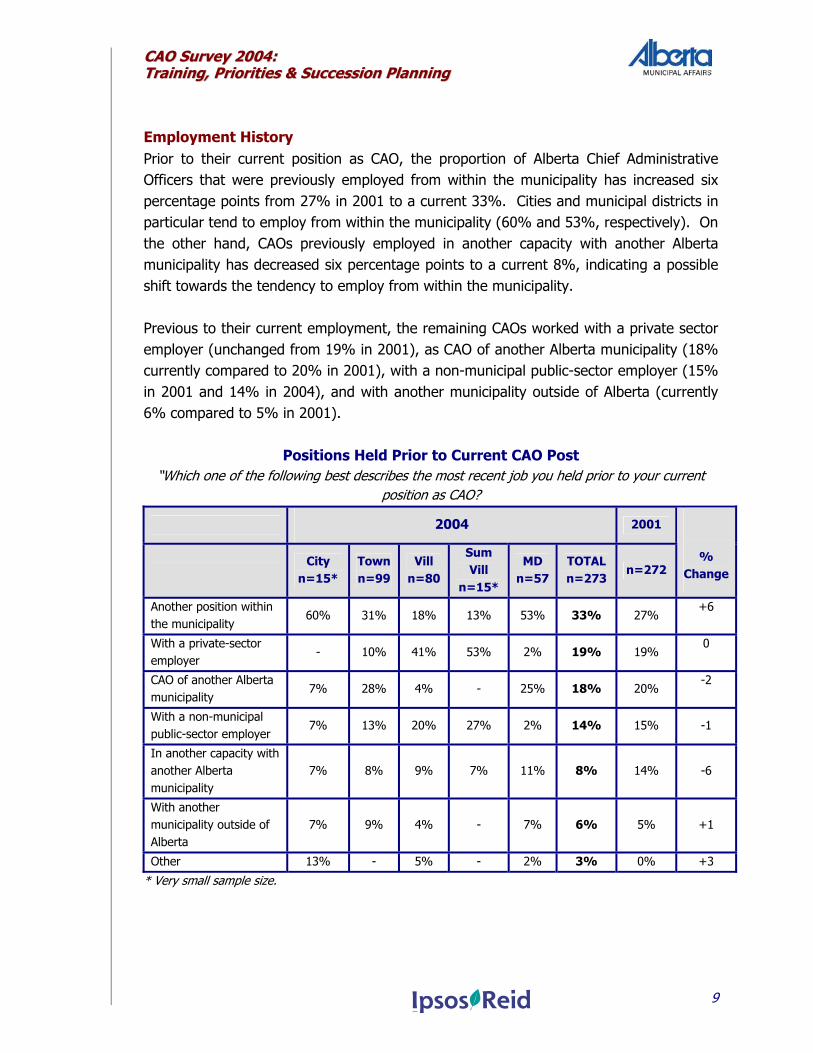
Employment History Prior to their current position as CAO, the proportion of Alberta Chief Administrative Officers that were previously employed from within the municipality has increased six percentage points from 27% in 2001 to a current 33%. Cities and municipal districts in particular tend to employ from within the municipality (60% and 53%, respectively). On the other hand, CAOs previously employed in another capacity with another Alberta municipality has decreased six percentage points to a current 8%, indicating a possible shift towards the tendency to employ from within the municipality. Previous to their current employment, the remaining CAOs worked with a private sector employer (unchanged from 19% in 2001), as CAO of another Alberta municipality (18% currently compared to 20% in 2001), with a non-municipal public-sector employer (15% in 2001 and 14% in 2004), and with another municipality outside of Alberta (currently 6% compared to 5% in 2001).
Positions Held Prior to Current CAO Post “Which one of the following best describes the most recent job you held prior to your current
position as CAO?
2004 2001
City
n=15* Townn=99
Vill n=80
Sum Vill
n=15*
MD n=57
TOTAL n=273
n=272
% Change
Another position within the municipality
60% 31% 18% 13% 53% 33% 27% +6
With a private-sector employer
- 10% 41% 53% 2% 19% 19% 0
CAO of another Alberta municipality
7% 28% 4% - 25% 18% 20% -2
With a non-municipal public-sector employer
7% 13% 20% 27% 2% 14% 15% -1
In another capacity with another Alberta municipality
7% 8% 9% 7% 11% 8% 14% -6
With another municipality outside of Alberta
7% 9% 4% - 7% 6% 5% +1
Other 13% - 5% - 2% 3% 0% +3
* Very small sample size.
CCAAOO SSuurrvveeyy 22000044:: TTrraaiinniinngg,, PPrriioorriittiieess && SSuucccceessssiioonn PPllaannnniinngg
10
EEdduuccaattiioonn && TTrraaiinniinngg
In general, CAOs are making the greatest use of Municipal Affairs’ workshops and seminars, as well as training provided by both the AUMA and LGAA, in comparison to other training opportunities available. However, further training is desired in specific areas.
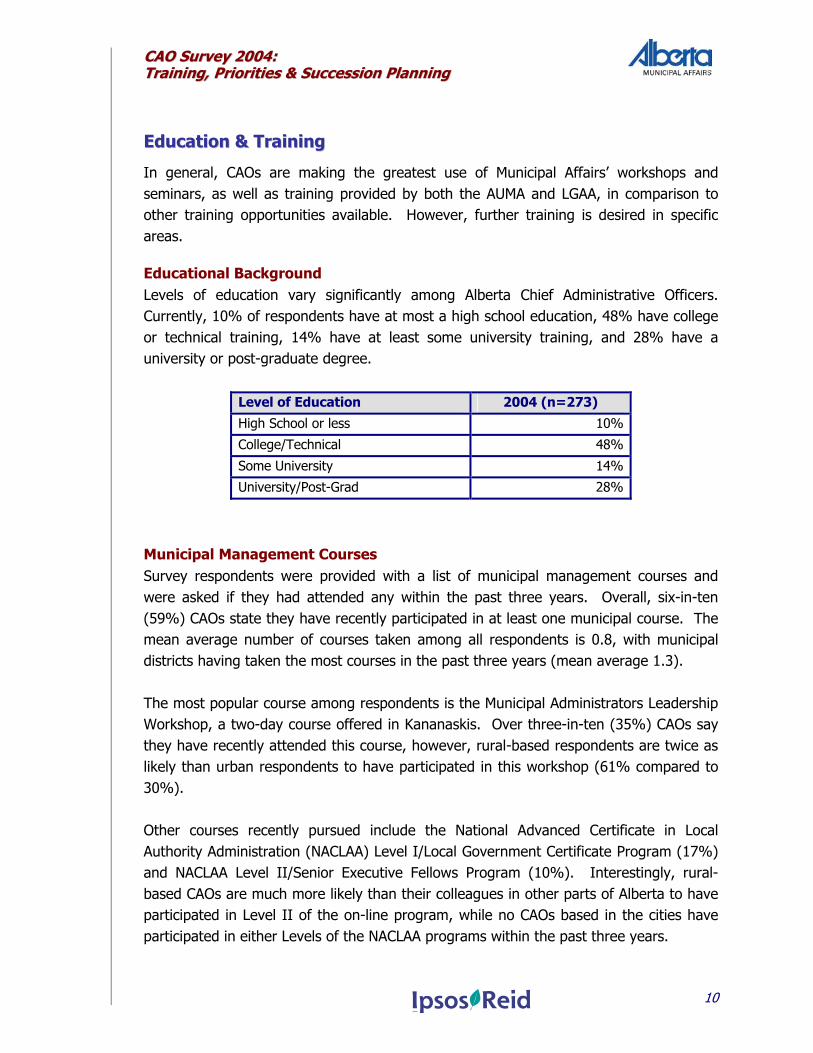
Educational Background Levels of education vary significantly among Alberta Chief Administrative Officers. Currently, 10% of respondents have at most a high school education, 48% have college or technical training, 14% have at least some university training, and 28% have a university or post-graduate degree.
Level of Education 2004 (n=273)
High School or less 10%
College/Technical 48%
Some University 14%
University/Post-Grad 28%
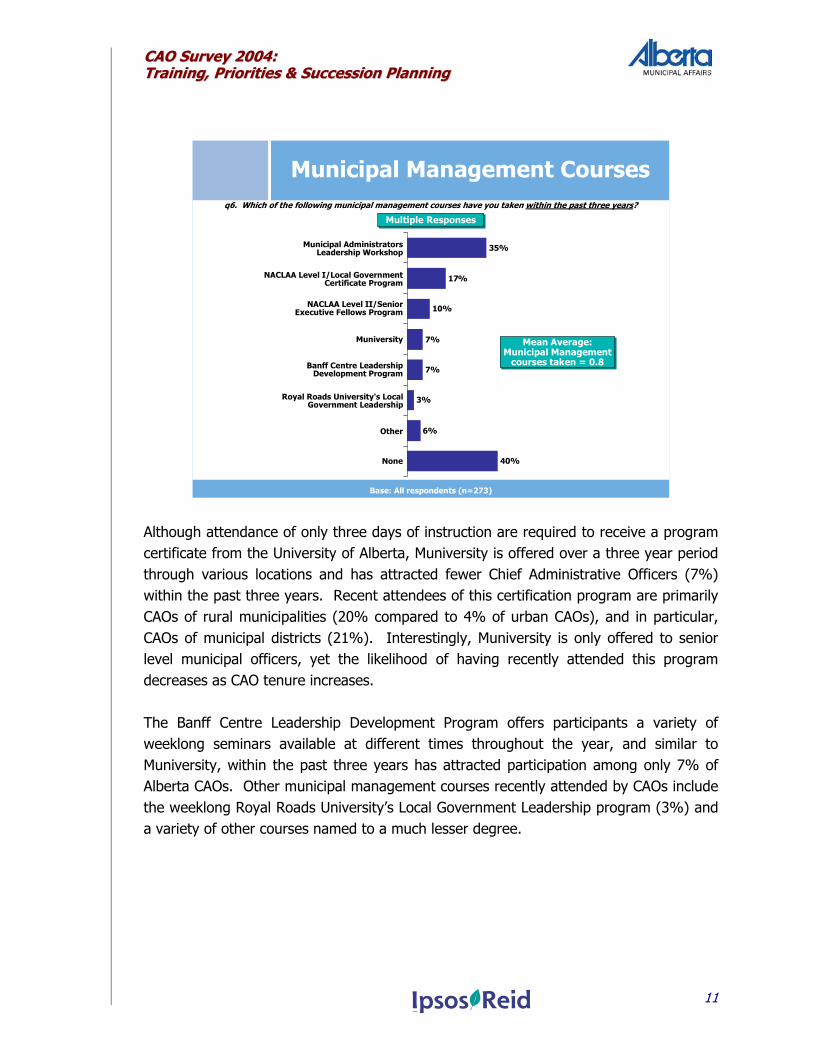
Municipal Management Courses Survey respondents were provided with a list of municipal management courses and were asked if they had attended any within the past three years. Overall, six-in-ten (59%) CAOs state they have recently participated in at least one municipal course. The mean average number of courses taken among all respondents is 0.8, with municipal districts having taken the most courses in the past three years (mean average 1.3).
The most popular course among respondents is the Municipal Administrators Leadership Workshop, a two-day course offered in Kananaskis. Over three-in-ten (35%) CAOs say they have recently attended this course, however, rural-based respondents are twice as likely than urban respondents to have participated in this workshop (61% compared to 30%). Other courses recently pursued include the National Advanced Certificate in Local Authority Administration (NACLAA) Level I/Local Government Certificate Program (17%) and NACLAA Level II/Senior Executive Fellows Program (10%). Interestingly, rural-based CAOs are much more likely than their colleagues in other parts of Alberta to have participated in Level II of the on-line program, while no CAOs based in the cities have participated in either Levels of the NACLAA programs within the past three years.
CCAAOO SSuurrvveeyy 22000044:: TTrraaiinniinngg,, PPrriioorriittiieess && SSuucccceessssiioonn PPllaannnniinngg
11
35%
17%
10%
7%
7%
3%
6%
40%
Municipal Management Coursesq6. Which of the following municipal management courses have you taken within the past three years?
Base: All respondents (n=273)
Multiple ResponsesMultiple Responses
Municipal Administrators Leadership Workshop
NACLAA Level I/Local Government Certificate Program
NACLAA Level II/Senior Executive Fellows Program
Muniversity
Banff Centre Leadership Development Program
Royal Roads University's Local Government Leadership
Other
None
Mean Average:Municipal Management
courses taken = 0.8
Mean Average:Municipal Management
courses taken = 0.8
Although attendance of only three days of instruction are required to receive a program certificate from the University of Alberta, Muniversity is offered over a three year period through various locations and has attracted fewer Chief Administrative Officers (7%) within the past three years. Recent attendees of this certification program are primarily CAOs of rural municipalities (20% compared to 4% of urban CAOs), and in particular, CAOs of municipal districts (21%). Interestingly, Muniversity is only offered to senior level municipal officers, yet the likelihood of having recently attended this program decreases as CAO tenure increases. The Banff Centre Leadership Development Program offers participants a variety of weeklong seminars available at different times throughout the year, and similar to Muniversity, within the past three years has attracted participation among only 7% of Alberta CAOs. Other municipal management courses recently attended by CAOs include the weeklong Royal Roads University’s Local Government Leadership program (3%) and a variety of other courses named to a much lesser degree.
CCAAOO SSuurrvveeyy 22000044:: TTrraaiinniinngg,, PPrriioorriittiieess && SSuucccceessssiioonn PPllaannnniinngg
12
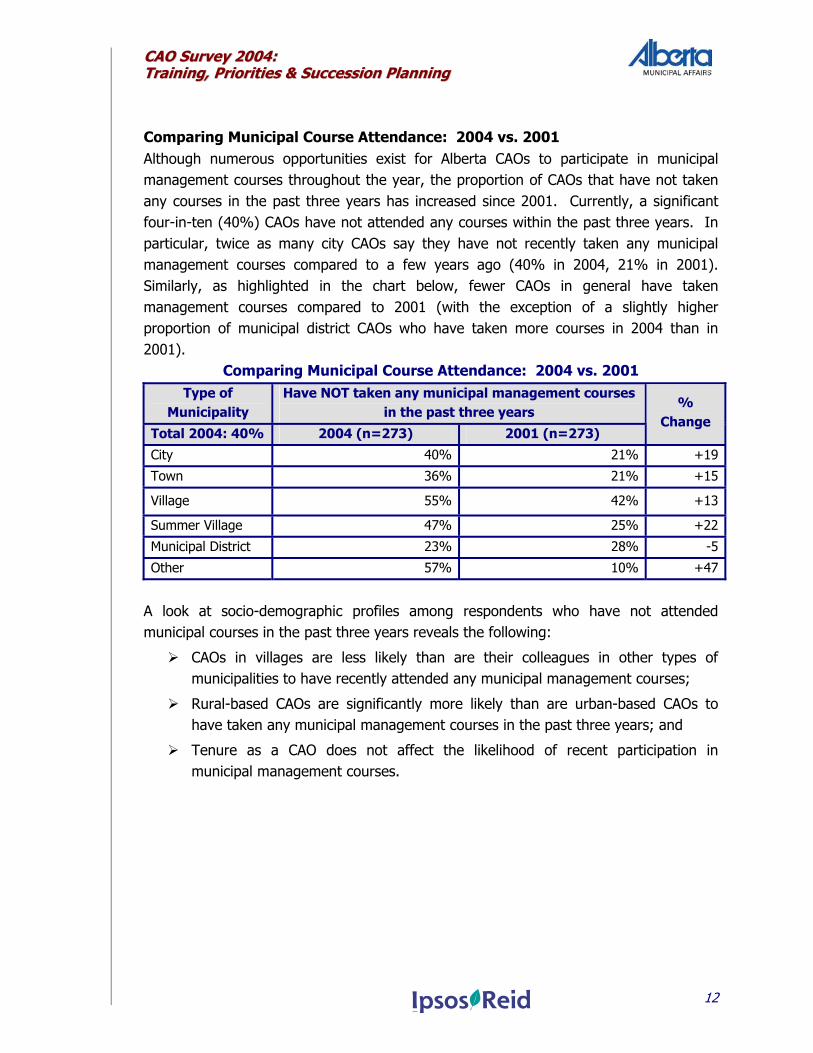
Comparing Municipal Course Attendance: 2004 vs. 2001 Although numerous opportunities exist for Alberta CAOs to participate in municipal management courses throughout the year, the proportion of CAOs that have not taken any courses in the past three years has increased since 2001. Currently, a significant four-in-ten (40%) CAOs have not attended any courses within the past three years. In particular, twice as many city CAOs say they have not recently taken any municipal management courses compared to a few years ago (40% in 2004, 21% in 2001). Similarly, as highlighted in the chart below, fewer CAOs in general have taken management courses compared to 2001 (with the exception of a slightly higher proportion of municipal district CAOs who have taken more courses in 2004 than in 2001).
Comparing Municipal Course Attendance: 2004 vs. 2001 Type of
Municipality Have NOT taken any municipal management courses
in the past three years
Total 2004: 40% 2004 (n=273) 2001 (n=273)
% Change
City 40% 21% +19
Town 36% 21% +15
Village 55% 42% +13
Summer Village 47% 25% +22
Municipal District 23% 28% -5
Other 57% 10% +47
A look at socio-demographic profiles among respondents who have not attended municipal courses in the past three years reveals the following:
CAOs in villages are less likely than are their colleagues in other types of municipalities to have recently attended any municipal management courses;
Rural-based CAOs are significantly more likely than are urban-based CAOs to have taken any municipal management courses in the past three years; and
Tenure as a CAO does not affect the likelihood of recent participation in municipal management courses.
CCAAOO SSuurrvveeyy 22000044:: TTrraaiinniinngg,, PPrriioorriittiieess && SSuucccceessssiioonn PPllaannnniinngg
13
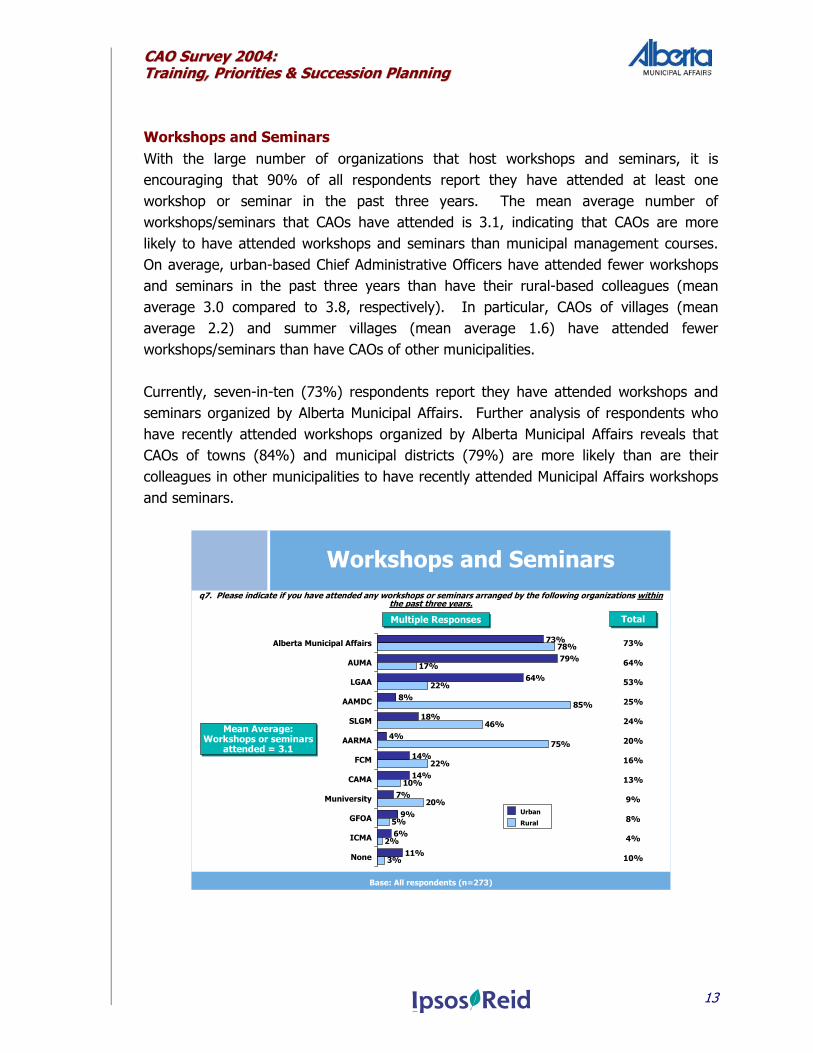
Workshops and Seminars With the large number of organizations that host workshops and seminars, it is encouraging that 90% of all respondents report they have attended at least one workshop or seminar in the past three years. The mean average number of workshops/seminars that CAOs have attended is 3.1, indicating that CAOs are more likely to have attended workshops and seminars than municipal management courses. On average, urban-based Chief Administrative Officers have attended fewer workshops and seminars in the past three years than have their rural-based colleagues (mean average 3.0 compared to 3.8, respectively). In particular, CAOs of villages (mean average 2.2) and summer villages (mean average 1.6) have attended fewer workshops/seminars than have CAOs of other municipalities. Currently, seven-in-ten (73%) respondents report they have attended workshops and seminars organized by Alberta Municipal Affairs. Further analysis of respondents who have recently attended workshops organized by Alberta Municipal Affairs reveals that CAOs of towns (84%) and municipal districts (79%) are more likely than are their colleagues in other municipalities to have recently attended Municipal Affairs workshops and seminars.
Workshops and Seminarsq7. Please indicate if you have attended any workshops or seminars arranged by the following organizations within
the past three years.
Base: All respondents (n=273)
73%
79%
64%
8%
18%
4%
14%
14%
7%
9%
6%
11%
78%
17%
22%
85%
46%
75%
22%
10%
20%
5%
2%
3%
Alberta Municipal Affairs
AUMA
LGAA
AAMDC
SLGM
AARMA
FCM
CAMA
Muniversity
GFOA
ICMA
None
Multiple ResponsesMultiple Responses
Mean Average:Workshops or seminars
attended = 3.1
Mean Average:Workshops or seminars
attended = 3.1
TotalTotal
Urban
Rural
73%
64%
53%
25%
24%
20%
16%
13%
9%
8%
4%
10%
CCAAOO SSuurrvveeyy 22000044:: TTrraaiinniinngg,, PPrriioorriittiieess && SSuucccceessssiioonn PPllaannnniinngg
14
As for CAOs of urban municipalities, 79% report they have recently attended workshops/seminars arranged by AUMA, an organization that acts as a voice and advocate specifically for urban municipalities. Participation is also high among urban CAOs for LGAA workshops/seminars (64%), an organization that acts as a representative/spokesperson for its members to the Provincial Government and as a liaison with other agencies. Among CAOs of rural municipalities, 85% report attending workshops and seminars arranged by AAMDC, and 75% have attended workshops and seminars arranged by AARMA (20%). Further, 18% of CAOs in urban municipalities and 46% of CAOs in rural municipalities report having attended workshops and seminars put on by the SLGM. Other workshops and seminars that CAOs have attended include those organized by FCM (16%) and CAMA (13%). City CAOs are most likely to attend these workshops with 53% who say they have participated in FCM workshops and 67% who have attended CAMA workshops. CAOs of cities who are responsible for larger municipalities are possibly attracted to FCM and CAMA’s focus on issues that are of a national scope. Interestingly, survey participants who have attended FCM and CAMA workshops/seminars are significantly more likely than are their colleagues who have not attended these workshops to have business and succession plans. A variety of other organizations were identified by respondents, however to a much lesser degree. Conversely, 10% of survey respondents say they have not attended any of the noted workshops or seminars in the past three years. Analyses across socio-demographic measurements reveal that:
CAOs of villages and summer villages are much less likely than are CAOs of other municipalities to have attended any workshops/seminars in the past three years;
The proportion of respondents who have not recently attended workshops/seminars decreases as CAO tenure increases; and
CAOs who have attended workshops or seminars are also more likely to have attended municipal management courses, and are more likely to be affiliated with professional organizations – apparently more engaged in education and networking overall.
CCAAOO SSuurrvveeyy 22000044:: TTrraaiinniinngg,, PPrriioorriittiieess && SSuucccceessssiioonn PPllaannnniinngg
15
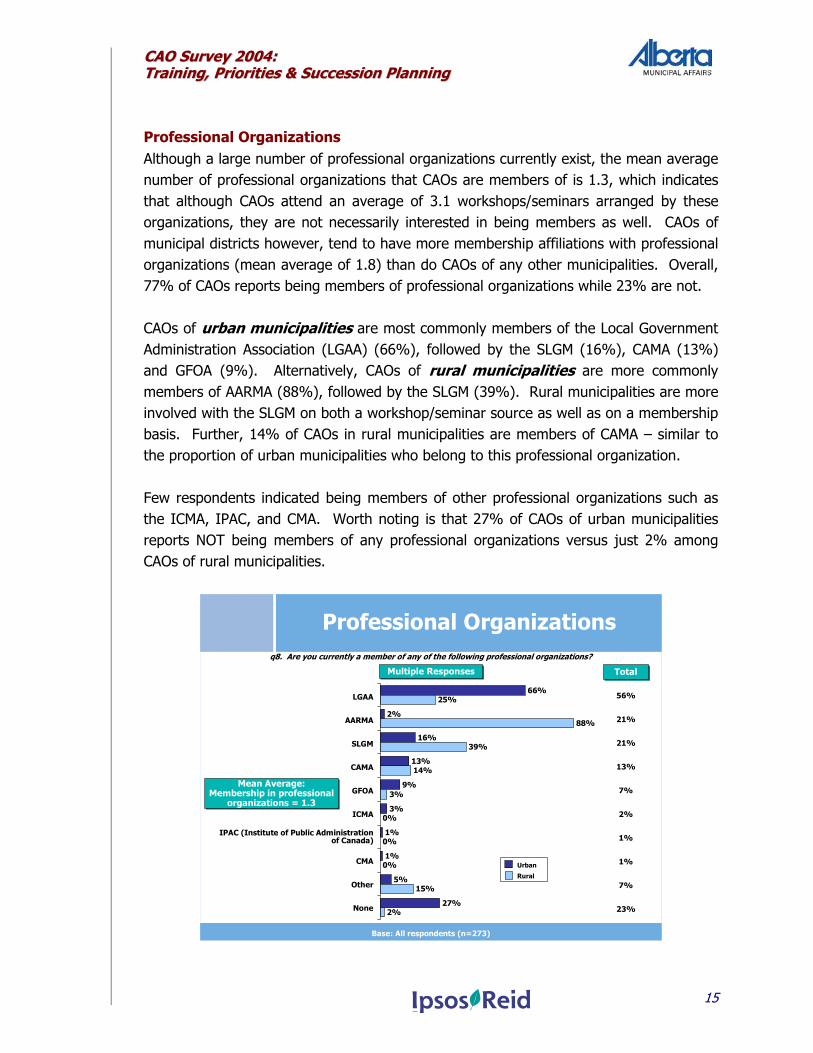
Professional Organizations Although a large number of professional organizations currently exist, the mean average number of professional organizations that CAOs are members of is 1.3, which indicates that although CAOs attend an average of 3.1 workshops/seminars arranged by these organizations, they are not necessarily interested in being members as well. CAOs of municipal districts however, tend to have more membership affiliations with professional organizations (mean average of 1.8) than do CAOs of any other municipalities. Overall, 77% of CAOs reports being members of professional organizations while 23% are not. CAOs of urban municipalities are most commonly members of the Local Government Administration Association (LGAA) (66%), followed by the SLGM (16%), CAMA (13%) and GFOA (9%). Alternatively, CAOs of rural municipalities are more commonly members of AARMA (88%), followed by the SLGM (39%). Rural municipalities are more involved with the SLGM on both a workshop/seminar source as well as on a membership basis. Further, 14% of CAOs in rural municipalities are members of CAMA – similar to the proportion of urban municipalities who belong to this professional organization. Few respondents indicated being members of other professional organizations such as the ICMA, IPAC, and CMA. Worth noting is that 27% of CAOs of urban municipalities reports NOT being members of any professional organizations versus just 2% among CAOs of rural municipalities.
Professional Organizationsq8. Are you currently a member of any of the following professional organizations?
Base: All respondents (n=273)
Multiple ResponsesMultiple Responses
LGAA
AARMA
SLGM
CAMA
GFOA
ICMA
CMA
Other
None
IPAC (Institute of Public Administration of Canada)
66%
2%
16%
13%
9%
3%
1%
1%
5%
27%
25%
88%
39%
14%
3%
0%
0%
0%
15%
2%
Mean Average:Membership in professional
organizations = 1.3
Mean Average:Membership in professional
organizations = 1.3
Urban
Rural
TotalTotal
56%
21%
21%
13%
7%
2%
1%
1%
7%
23%
CCAAOO SSuurrvveeyy 22000044:: TTrraaiinniinngg,, PPrriioorriittiieess && SSuucccceessssiioonn PPllaannnniinngg
16
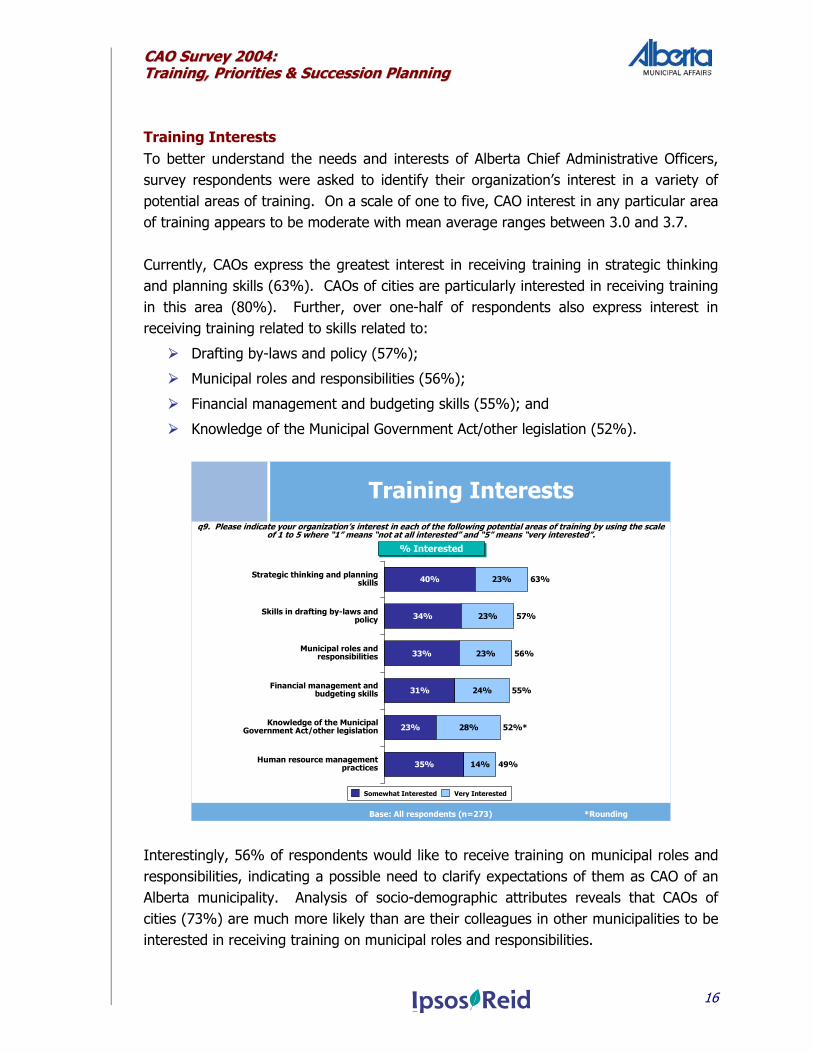
Training Interests To better understand the needs and interests of Alberta Chief Administrative Officers, survey respondents were asked to identify their organization’s interest in a variety of potential areas of training. On a scale of one to five, CAO interest in any particular area of training appears to be moderate with mean average ranges between 3.0 and 3.7. Currently, CAOs express the greatest interest in receiving training in strategic thinking and planning skills (63%). CAOs of cities are particularly interested in receiving training in this area (80%). Further, over one-half of respondents also express interest in receiving training related to skills related to:
Drafting by-laws and policy (57%);
Municipal roles and responsibilities (56%);
Financial management and budgeting skills (55%); and
Knowledge of the Municipal Government Act/other legislation (52%).
Training Interestsq9. Please indicate your organization’s interest in each of the following potential areas of training by using the scale
of 1 to 5 where “1” means “not at all interested” and “5” means “very interested”.
Base: All respondents (n=273)
40%
34%
33%
31%
23%
35%
23%
23%
24%
28%
14%
63%
57%
56%
55%
49%
23%
52%*
Somewhat Interested Very Interested
% Interested% Interested
Strategic thinking and planning skills
Skills in drafting by-laws and policy
Municipal roles and responsibilities
Financial management and budgeting skills
Knowledge of the Municipal Government Act/other legislation
Human resource management practices
*Rounding Interestingly, 56% of respondents would like to receive training on municipal roles and responsibilities, indicating a possible need to clarify expectations of them as CAO of an Alberta municipality. Analysis of socio-demographic attributes reveals that CAOs of cities (73%) are much more likely than are their colleagues in other municipalities to be interested in receiving training on municipal roles and responsibilities.
CCAAOO SSuurrvveeyy 22000044:: TTrraaiinniinngg,, PPrriioorriittiieess && SSuucccceessssiioonn PPllaannnniinngg
17
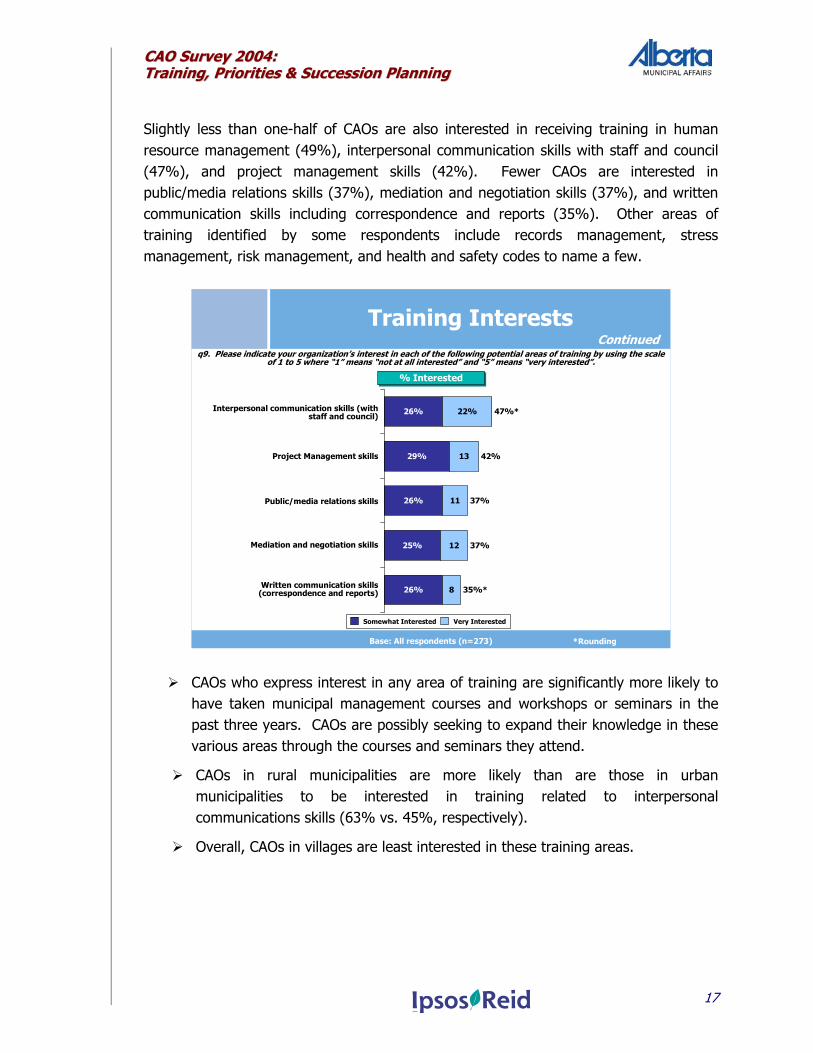
Slightly less than one-half of CAOs are also interested in receiving training in human resource management (49%), interpersonal communication skills with staff and council (47%), and project management skills (42%). Fewer CAOs are interested in public/media relations skills (37%), mediation and negotiation skills (37%), and written communication skills including correspondence and reports (35%). Other areas of training identified by some respondents include records management, stress management, risk management, and health and safety codes to name a few.
Training Interestsq9. Please indicate your organization’s interest in each of the following potential areas of training by using the scale
of 1 to 5 where “1” means “not at all interested” and “5” means “very interested”.
Base: All respondents (n=273)
Continued
26%
29%
26%
25%
26%
22%
42%
37%
37%
13
12
11
8 35%*
47%*
Somewhat Interested Very Interested
Project Management skills
% Interested% Interested
Written communication skills (correspondence and reports)
Interpersonal communication skills (with staff and council)
Public/media relations skills
Mediation and negotiation skills
*Rounding
CAOs who express interest in any area of training are significantly more likely to have taken municipal management courses and workshops or seminars in the past three years. CAOs are possibly seeking to expand their knowledge in these various areas through the courses and seminars they attend.
CAOs in rural municipalities are more likely than are those in urban municipalities to be interested in training related to interpersonal communications skills (63% vs. 45%, respectively).
Overall, CAOs in villages are least interested in these training areas.
CCAAOO SSuurrvveeyy 22000044:: TTrraaiinniinngg,, PPrriioorriittiieess && SSuucccceessssiioonn PPllaannnniinngg
18
CCAAOO RREESSPPOONNSSIIBBIILLIITTIIEESS,, MMUUNNIICCIIPPAALL PPRRIIOORRIITTIIEESS AANNDD SSUUCCCCEESSSSIIOONN PPLLAANNNNIINNGG Participating CAOs were asked a series of questions related to their allocation of time spent on their various responsibilities, the major issues facing their municipalities, beneficial sources of information, as well as questions pertaining to business planning and succession planning.
CCAAOO RReessppoonnssiibbiilliittiieess CAOs report experiencing a great deal of increased responsibilities in almost all of their roles, particularly with respect to budgeting and strategic planning – one of the most coveted areas of desired training. Interactions with council are also escalating.
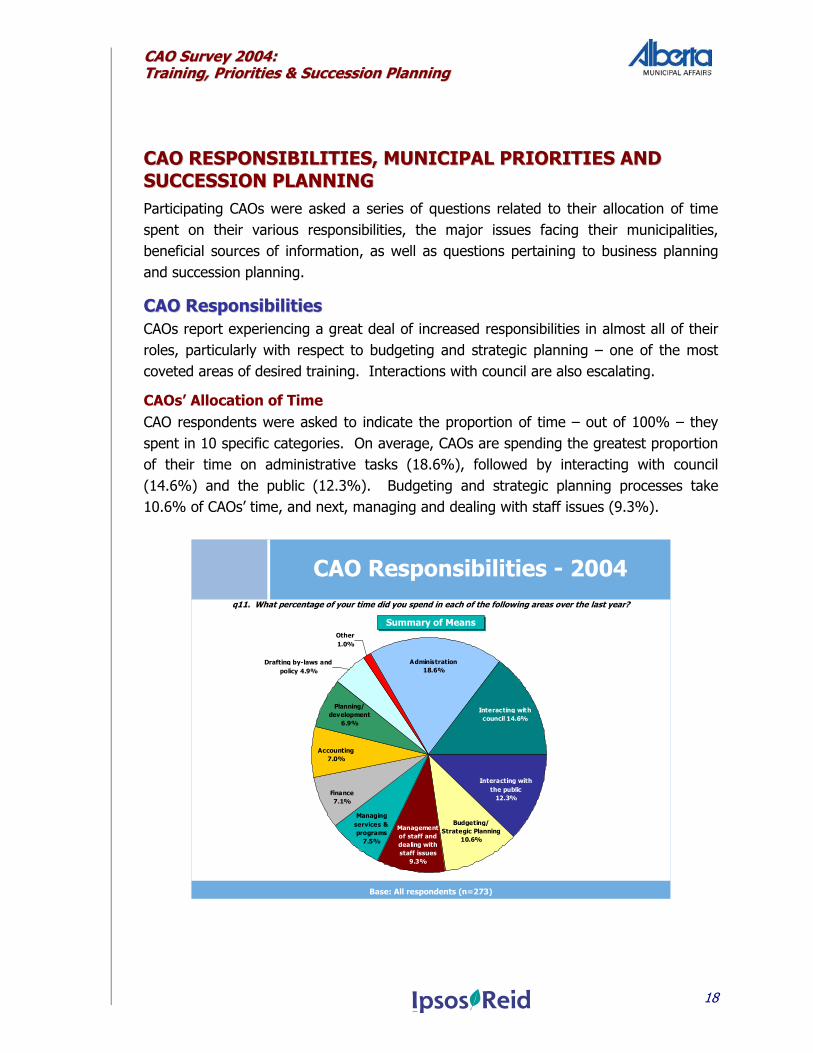
CAOs’ Allocation of Time CAO respondents were asked to indicate the proportion of time – out of 100% – they spent in 10 specific categories. On average, CAOs are spending the greatest proportion of their time on administrative tasks (18.6%), followed by interacting with council (14.6%) and the public (12.3%). Budgeting and strategic planning processes take 10.6% of CAOs’ time, and next, managing and dealing with staff issues (9.3%).
CAO Responsibilities - 2004q11. What percentage of your time did you spend in each of the following areas over the last year?
Base: All respondents (n=273)
Planning/ development
6.9%
Other1.0%
Drafting by-laws and policy 4.9%
Accounting7.0%
Finance7.1%
Managing services & programs
7.5%
Budgeting/ Strategic Planning
10.6%
Interacting with the public
12.3%
Interacting with council 14.6%
Administration18.6%
Management of staff and dealing with staff issues
9.3%
Summary of MeansSummary of Means
CCAAOO SSuurrvveeyy 22000044:: TTrraaiinniinngg,, PPrriioorriittiieess && SSuucccceessssiioonn PPllaannnniinngg
19
CAOs allocate less than 10% of their time to the remaining tasks: managing services and programs (7.5%); finance (7.1%); accounting (7.0%); planning/development (6.9%); and, drafting by-laws and policy (4.9%). Further, CAOs indicate that one percent of their time was allocated to other areas including inter-municipal/inter-governmental interaction and leadership issues.
Urban municipalities are significantly more likely than are rural municipalities to spend time interacting with the public, and in finance and accounting, especially in villages.
Rural municipalities are significantly more likely than are urban municipalities to spend time dealing with staff issues and interacting with council, particularly in municipal districts.
CAOs who report having a business plan are significantly more likely than are those who do not to be spending time in budgeting and strategic planning.
CCAAOO SSuurrvveeyy 22000044:: TTrraaiinniinngg,, PPrriioorriittiieess && SSuucccceessssiioonn PPllaannnniinngg
20
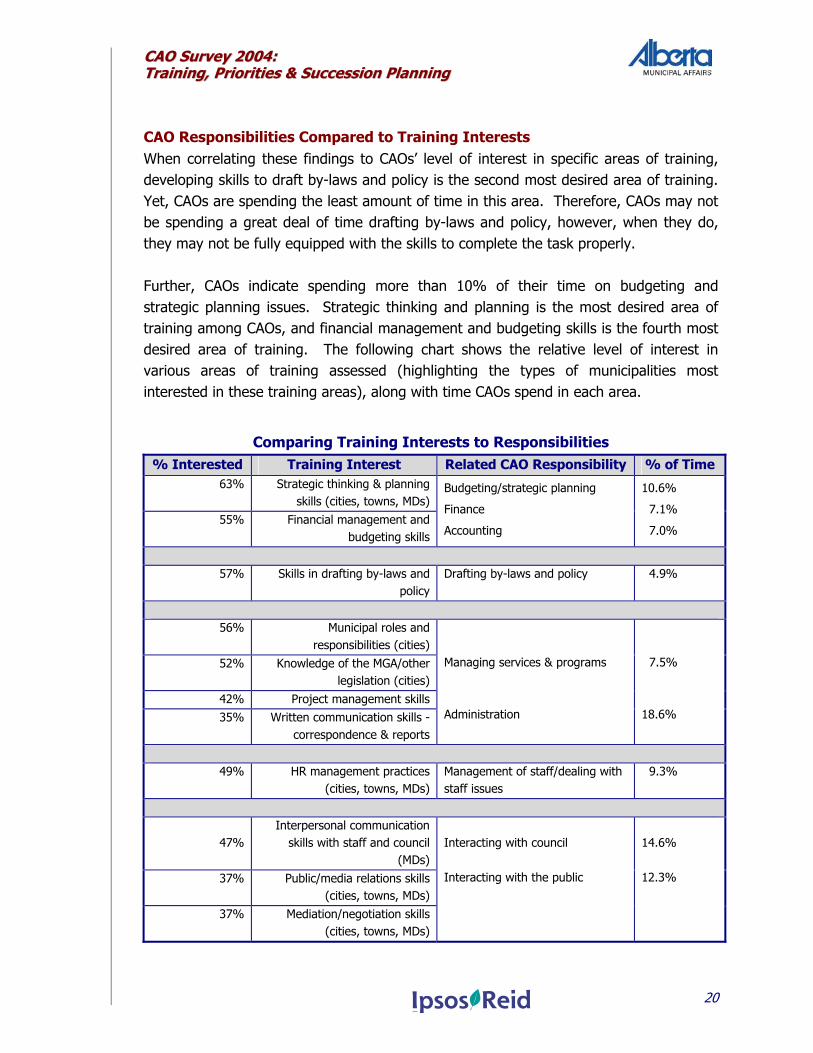
CAO Responsibilities Compared to Training Interests When correlating these findings to CAOs’ level of interest in specific areas of training, developing skills to draft by-laws and policy is the second most desired area of training. Yet, CAOs are spending the least amount of time in this area. Therefore, CAOs may not be spending a great deal of time drafting by-laws and policy, however, when they do, they may not be fully equipped with the skills to complete the task properly. Further, CAOs indicate spending more than 10% of their time on budgeting and strategic planning issues. Strategic thinking and planning is the most desired area of training among CAOs, and financial management and budgeting skills is the fourth most desired area of training. The following chart shows the relative level of interest in various areas of training assessed (highlighting the types of municipalities most interested in these training areas), along with time CAOs spend in each area.
Comparing Training Interests to Responsibilities % Interested Training Interest Related CAO Responsibility % of Time
63% Strategic thinking & planning skills (cities, towns, MDs)
55% Financial management and budgeting skills
Budgeting/strategic planning
Finance
Accounting
10.6%
7.1%
7.0%
57% Skills in drafting by-laws and
policy Drafting by-laws and policy 4.9%
56% Municipal roles and
responsibilities (cities) 52% Knowledge of the MGA/other
legislation (cities) 42% Project management skills 35% Written communication skills -
correspondence & reports
Managing services & programs Administration
7.5% 18.6%
49% HR management practices
(cities, towns, MDs) Management of staff/dealing with staff issues
9.3%
47% Interpersonal communication
skills with staff and council (MDs)
37% Public/media relations skills (cities, towns, MDs)
37% Mediation/negotiation skills (cities, towns, MDs)
Interacting with council Interacting with the public
14.6% 12.3%
CCAAOO SSuurrvveeyy 22000044:: TTrraaiinniinngg,, PPrriioorriittiieess && SSuucccceessssiioonn PPllaannnniinngg
21
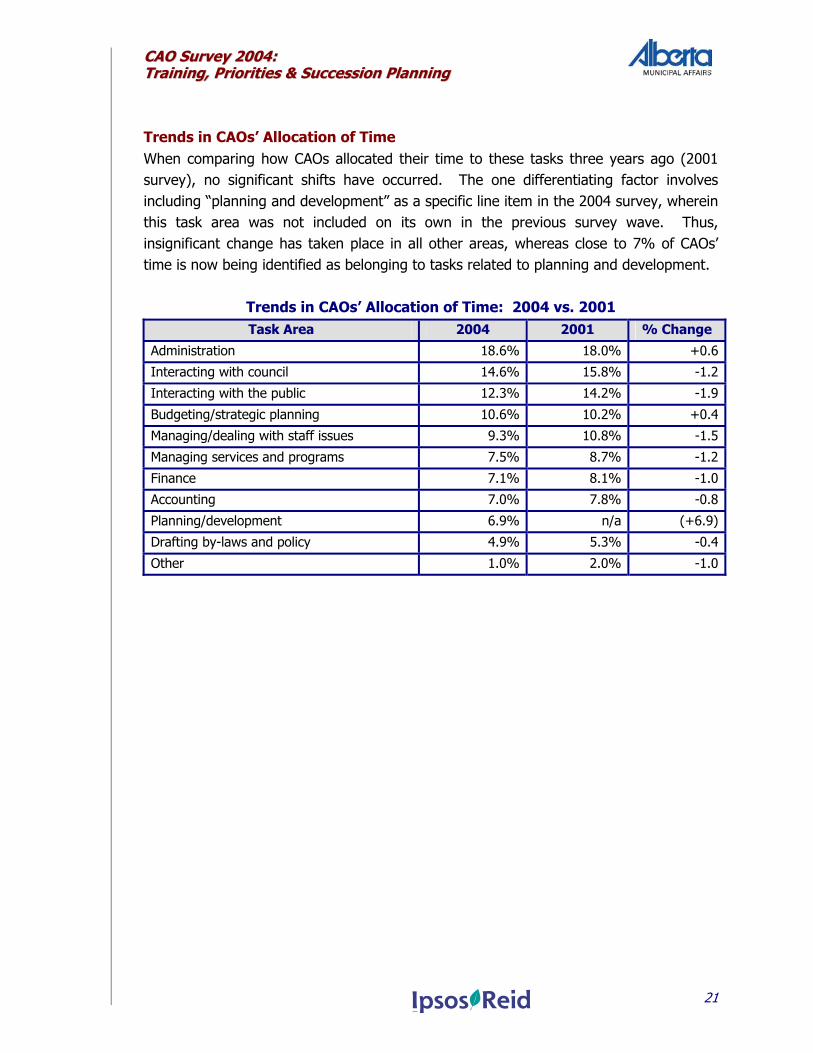
Trends in CAOs’ Allocation of Time When comparing how CAOs allocated their time to these tasks three years ago (2001 survey), no significant shifts have occurred. The one differentiating factor involves including “planning and development” as a specific line item in the 2004 survey, wherein this task area was not included on its own in the previous survey wave. Thus, insignificant change has taken place in all other areas, whereas close to 7% of CAOs’ time is now being identified as belonging to tasks related to planning and development.
Trends in CAOs’ Allocation of Time: 2004 vs. 2001 Task Area 2004 2001 % Change
Administration 18.6% 18.0% +0.6
Interacting with council 14.6% 15.8% -1.2
Interacting with the public 12.3% 14.2% -1.9
Budgeting/strategic planning 10.6% 10.2% +0.4
Managing/dealing with staff issues 9.3% 10.8% -1.5
Managing services and programs 7.5% 8.7% -1.2
Finance 7.1% 8.1% -1.0
Accounting 7.0% 7.8% -0.8
Planning/development 6.9% n/a (+6.9)
Drafting by-laws and policy 4.9% 5.3% -0.4
Other 1.0% 2.0% -1.0
CCAAOO SSuurrvveeyy 22000044:: TTrraaiinniinngg,, PPrriioorriittiieess && SSuucccceessssiioonn PPllaannnniinngg
22
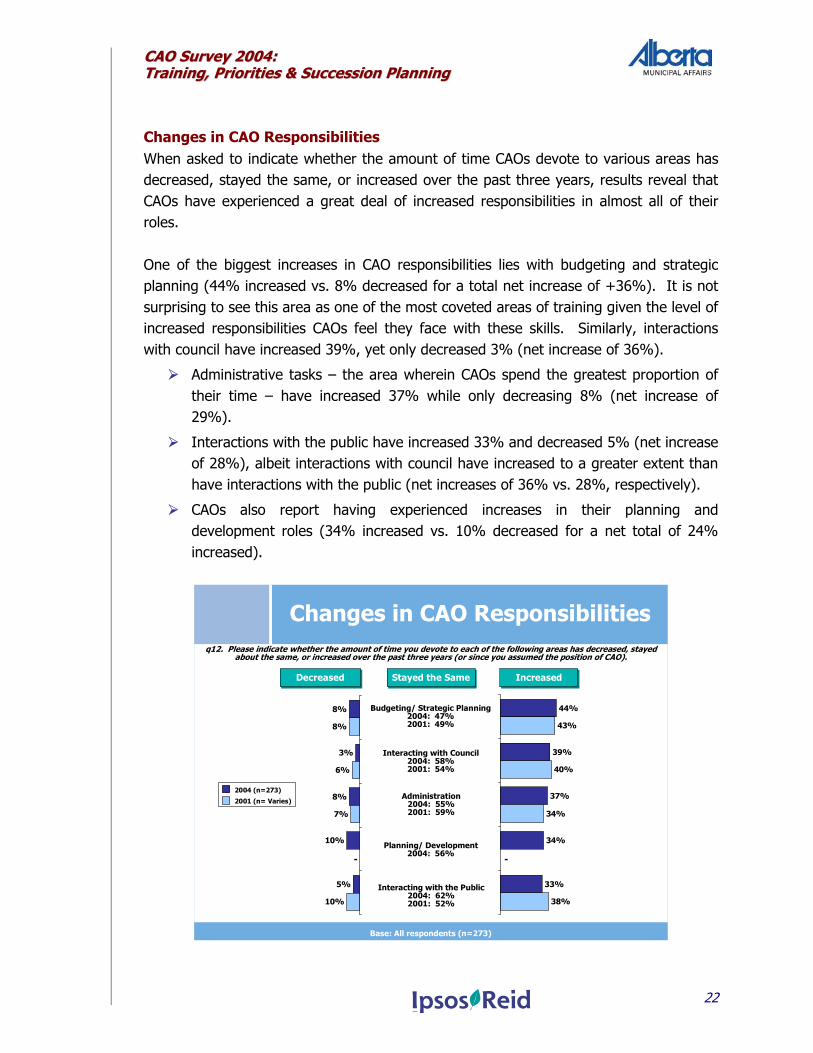
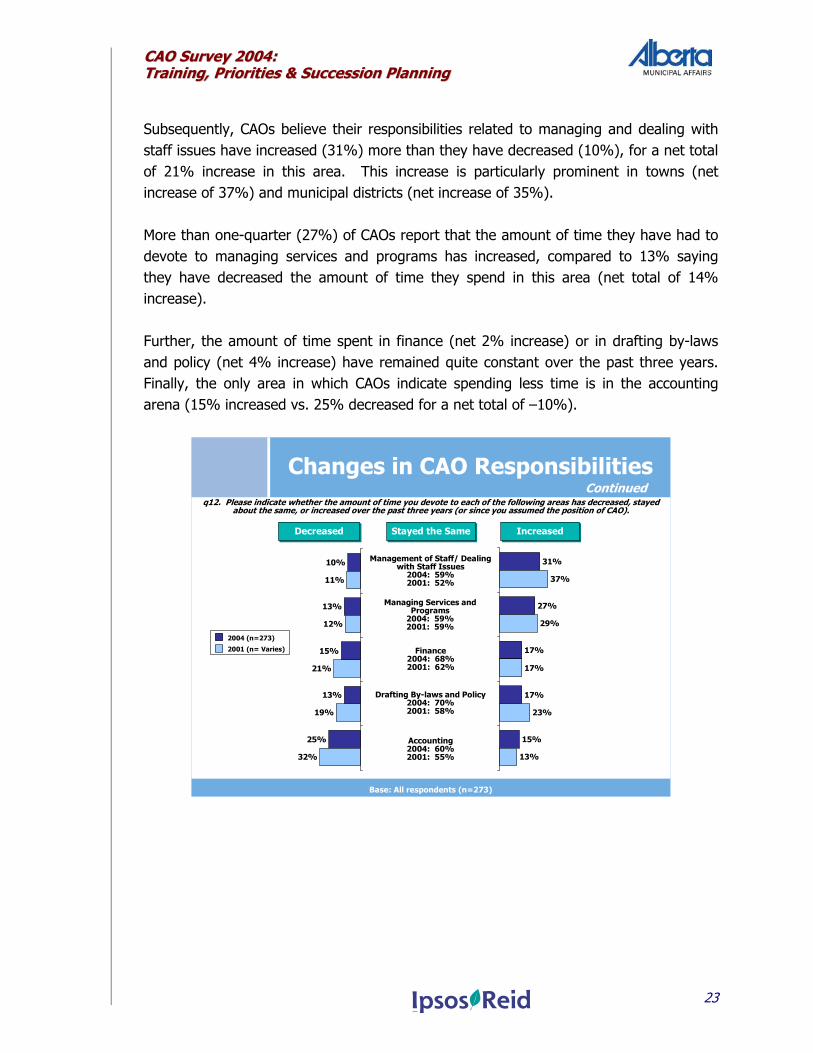
Changes in CAO Responsibilities When asked to indicate whether the amount of time CAOs devote to various areas has decreased, stayed the same, or increased over the past three years, results reveal that CAOs have experienced a great deal of increased responsibilities in almost all of their roles. One of the biggest increases in CAO responsibilities lies with budgeting and strategic planning (44% increased vs. 8% decreased for a total net increase of +36%). It is not surprising to see this area as one of the most coveted areas of training given the level of increased responsibilities CAOs feel they face with these skills. Similarly, interactions with council have increased 39%, yet only decreased 3% (net increase of 36%).
Administrative tasks – the area wherein CAOs spend the greatest proportion of their time – have increased 37% while only decreasing 8% (net increase of 29%).
Interactions with the public have increased 33% and decreased 5% (net increase of 28%), albeit interactions with council have increased to a greater extent than have interactions with the public (net increases of 36% vs. 28%, respectively).
CAOs also report having experienced increases in their planning and development roles (34% increased vs. 10% decreased for a net total of 24% increased).
Changes in CAO Responsibilities q12. Please indicate whether the amount of time you devote to each of the following areas has decreased, stayed
about the same, or increased over the past three years (or since you assumed the position of CAO).
Base: All respondents (n=273)
44%
39%
37%
34%
33%
43%
40%
34%
38%
8%
3%
8%
10%
5%
8%
6%
7%
10%
Budgeting/ Strategic Planning2004: 47%2001: 49%
Interacting with Council2004: 58%2001: 54%
Administration2004: 55%2001: 59%
Planning/ Development2004: 56%
Interacting with the Public2004: 62%2001: 52%
IncreasedIncreasedStayed the SameStayed the SameDecreasedDecreased
- -
2004 (n=273)
2001 (n= Varies)
CCAAOO SSuurrvveeyy 22000044:: TTrraaiinniinngg,, PPrriioorriittiieess && SSuucccceessssiioonn PPllaannnniinngg
23
Subsequently, CAOs believe their responsibilities related to managing and dealing with staff issues have increased (31%) more than they have decreased (10%), for a net total of 21% increase in this area. This increase is particularly prominent in towns (net increase of 37%) and municipal districts (net increase of 35%). More than one-quarter (27%) of CAOs report that the amount of time they have had to devote to managing services and programs has increased, compared to 13% saying they have decreased the amount of time they spend in this area (net total of 14% increase). Further, the amount of time spent in finance (net 2% increase) or in drafting by-laws and policy (net 4% increase) have remained quite constant over the past three years. Finally, the only area in which CAOs indicate spending less time is in the accounting arena (15% increased vs. 25% decreased for a net total of –10%).
Changes in CAO Responsibilities
Base: All respondents (n=273)
q12. Please indicate whether the amount of time you devote to each of the following areas has decreased, stayed about the same, or increased over the past three years (or since you assumed the position of CAO).
Accounting2004: 60%2001: 55%
Managing Services and Programs
2004: 59%2001: 59%
Finance 2004: 68%2001: 62%
Drafting By-laws and Policy2004: 70%2001: 58%
Continued
Management of Staff/ Dealing with Staff Issues
2004: 59%2001: 52%
31%
27%
17%
17%
15%
37%
29%
17%
23%
13%
10%
13%
15%
13%
25%
11%
12%
21%
19%
32%
IncreasedIncreasedStayed the SameStayed the SameDecreasedDecreased
2004 (n=273)
2001 (n= Varies)
CCAAOO SSuurrvveeyy 22000044:: TTrraaiinniinngg,, PPrriioorriittiieess && SSuucccceessssiioonn PPllaannnniinngg
24
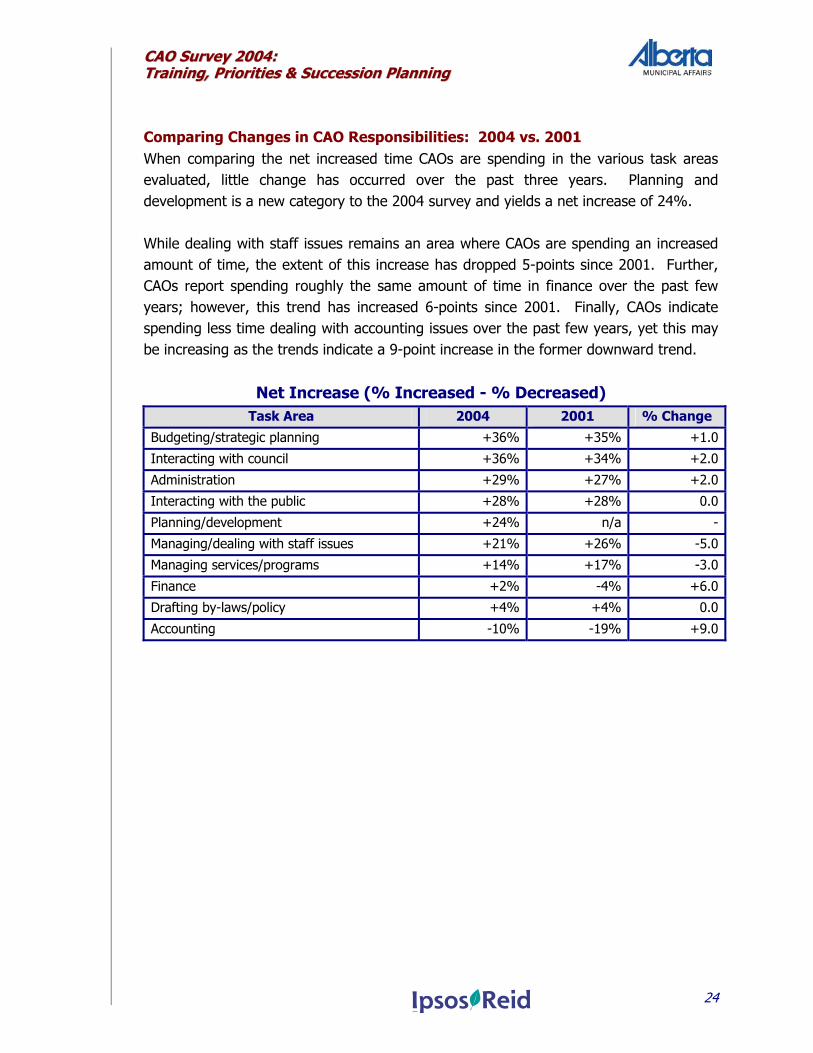
Comparing Changes in CAO Responsibilities: 2004 vs. 2001 When comparing the net increased time CAOs are spending in the various task areas evaluated, little change has occurred over the past three years. Planning and development is a new category to the 2004 survey and yields a net increase of 24%. While dealing with staff issues remains an area where CAOs are spending an increased amount of time, the extent of this increase has dropped 5-points since 2001. Further, CAOs report spending roughly the same amount of time in finance over the past few years; however, this trend has increased 6-points since 2001. Finally, CAOs indicate spending less time dealing with accounting issues over the past few years, yet this may be increasing as the trends indicate a 9-point increase in the former downward trend.
Net Increase (% Increased - % Decreased) Task Area 2004 2001 % Change
Budgeting/strategic planning +36% +35% +1.0
Interacting with council +36% +34% +2.0
Administration +29% +27% +2.0
Interacting with the public +28% +28% 0.0
Planning/development +24% n/a -
Managing/dealing with staff issues +21% +26% -5.0
Managing services/programs +14% +17% -3.0
Finance +2% -4% +6.0
Drafting by-laws/policy +4% +4% 0.0
Accounting -10% -19% +9.0
CCAAOO SSuurrvveeyy 22000044:: TTrraaiinniinngg,, PPrriioorriittiieess && SSuucccceessssiioonn PPllaannnniinngg
25
MMuunniicciippaall PPrriioorriittiieess
The major municipal issues CAOs will face over the next three years focus primarily on keeping pace with infrastructure and services (roads, building, water, sewer). Planning and development issues related to economic growth strategies or real estate developments, and addressing growth and sustainability issues are also key issues facing CAOs in upcoming years. Further, inter-municipal relations and human resource staffing issues are now major issues in some municipalities.
A minority of municipalities, however, reports being prepared to deal with these concerns. CAOs express a need for financial assistance, improved cooperation with other government bodies, additional training or advisory services, strategic planning, and human resource planning to assist them with addressing these challenges.
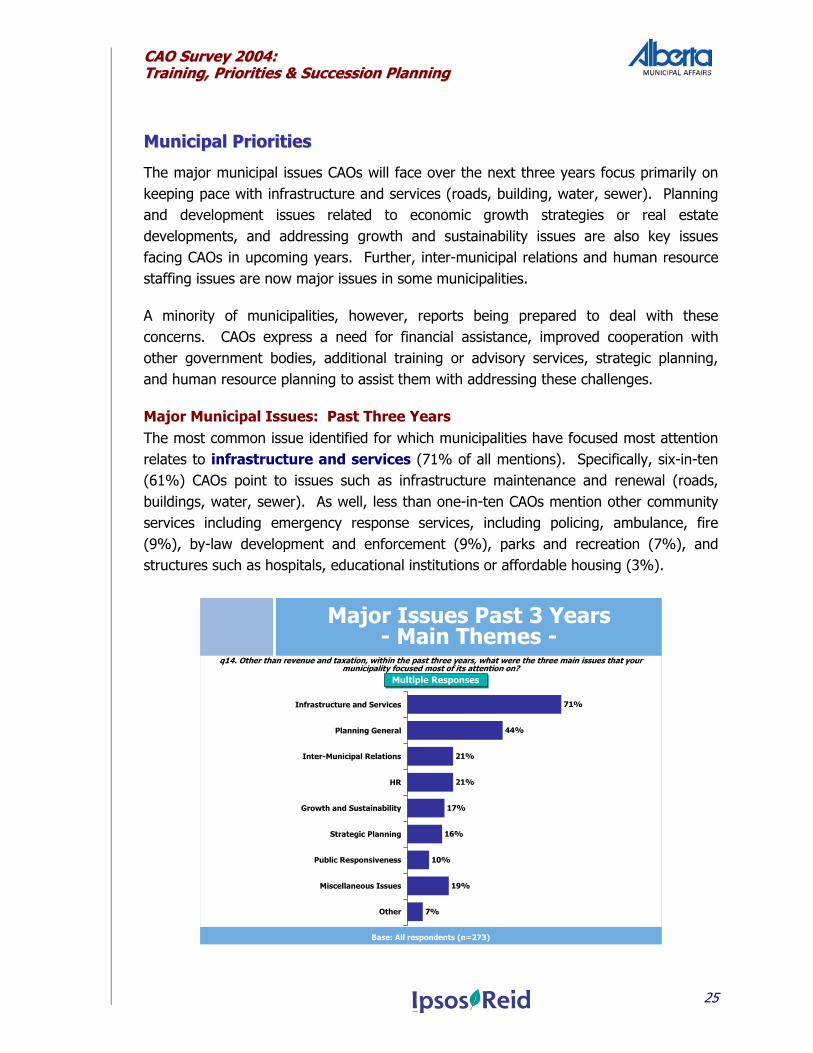
Major Municipal Issues: Past Three Years The most common issue identified for which municipalities have focused most attention relates to infrastructure and services (71% of all mentions). Specifically, six-in-ten (61%) CAOs point to issues such as infrastructure maintenance and renewal (roads, buildings, water, sewer). As well, less than one-in-ten CAOs mention other community services including emergency response services, including policing, ambulance, fire (9%), by-law development and enforcement (9%), parks and recreation (7%), and structures such as hospitals, educational institutions or affordable housing (3%).
q14. Other than revenue and taxation, within the past three years, what were the three main issues that your municipality focused most of its attention on?
Major Issues Past 3 Years- Main Themes -
Base: All respondents (n=273)
71%
44%
21%
21%
17%
16%
10%
19%
7%
Multiple ResponsesMultiple Responses
Infrastructure and Services
Planning General
Inter-Municipal Relations
HR
Growth and Sustainability
Strategic Planning
Public Responsiveness
Miscellaneous Issues
Other
CCAAOO SSuurrvveeyy 22000044:: TTrraaiinniinngg,, PPrriioorriittiieess && SSuucccceessssiioonn PPllaannnniinngg
26
Next, CAOs report having had to deal with planning issues a great deal over the past three years (44% of all mentions). Here, CAOs either generally mention planning or development issues (21%), or point to economic strategies, development and diversification (17%), long-term planning and development (4%), subdivisions (4%), land development management (2%), or general planning issues (2%). Inter-municipal relations is another main issue that CAOs have had to address over the past few years (21% of all mentions). Specific descriptions of this issue largely deal with inter-municipal relations and cooperation such as the sharing of services and agreements (15%). Also, certain CAOs point to annexation (2%), amalgamation in general (2%), or dissolution studies (1%). Similar to the proportion of CAOs facing amalgamation issues, 21% of CAOs mention having placed the most effort on human resource issues. These efforts have focused on staffing and succession planning (14%), relations and negotiations with council and unions regarding staff issues (3%), and organizational changes (3%). Subsequently, 17% of CAOs say their municipalities have focused most of their attention on issues related to growth and sustainability. A similar proportion of CAOs (16%) reports having focused on strategic planning issues over the past three years, including general strategic planning (8%), budgets (4%), and grants and funding (4%). Finally, 10% of CAOs point to public responsiveness as an area they have focused on the most, including public relations (5%) and dealing with public on service delivery levels (5%). Other miscellaneous issues which CAOs report to have focused on during the past few years are each mentioned 5% or less in total, such as:
Environmental issues (5%);
Capital projects (4%);
Agricultural issues – BSE (3%);
Government downloading/regulations (2%); and
GIS/GPS/technology advancements (2%).
CCAAOO SSuurrvveeyy 22000044:: TTrraaiinniinngg,, PPrriioorriittiieess && SSuucccceessssiioonn PPllaannnniinngg
27
Certain differences emerge with respect to issues among types of municipalities, as follows:
CAOs of villages are significantly more likely to have focused on community services over the past three years;
Those in municipal districts and towns are notably more likely to have dealt with amalgamation issues;
CAOs of towns are significantly more likely to have focused on human resource issues in the recent past; and
CAOs of cities are notably more likely to have been dealing with strategic planning issues over the past three years.
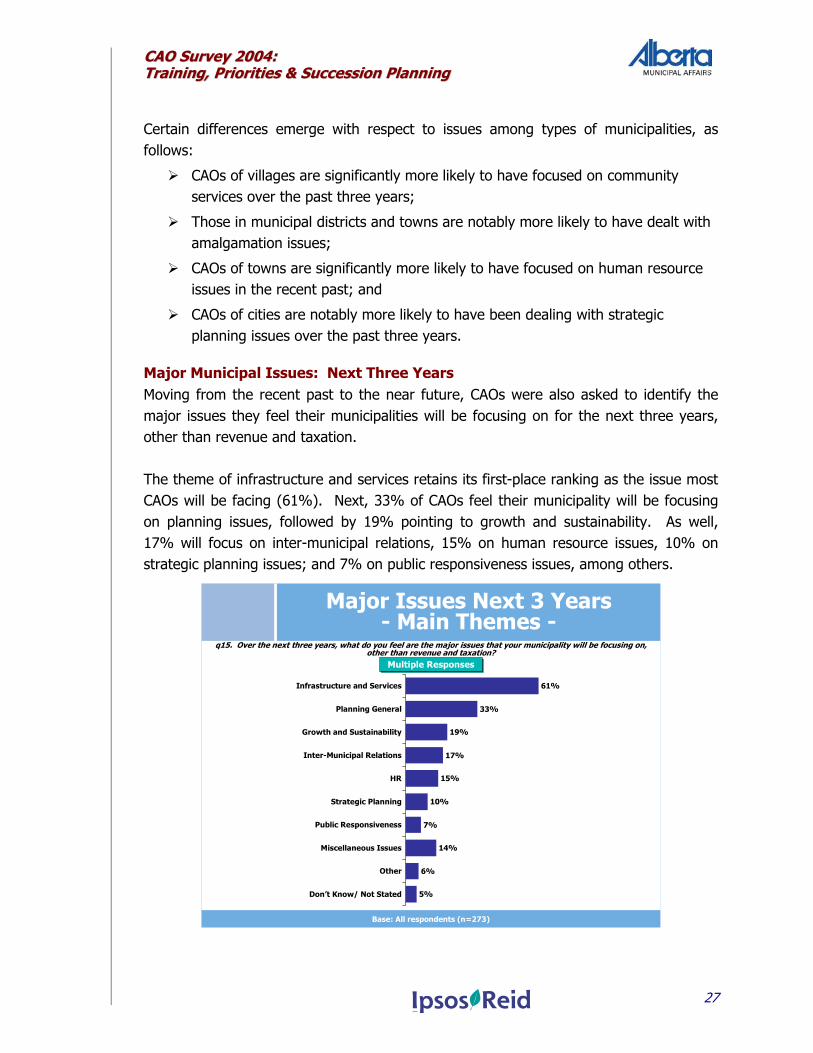
Major Municipal Issues: Next Three Years Moving from the recent past to the near future, CAOs were also asked to identify the major issues they feel their municipalities will be focusing on for the next three years, other than revenue and taxation. The theme of infrastructure and services retains its first-place ranking as the issue most CAOs will be facing (61%). Next, 33% of CAOs feel their municipality will be focusing on planning issues, followed by 19% pointing to growth and sustainability. As well, 17% will focus on inter-municipal relations, 15% on human resource issues, 10% on strategic planning issues; and 7% on public responsiveness issues, among others.
Major Issues Next 3 Years- Main Themes -
q15. Over the next three years, what do you feel are the major issues that your municipality will be focusing on, other than revenue and taxation?
Base: All respondents (n=273)
Multiple ResponsesMultiple Responses
61%
33%
19%
17%
15%
10%
7%
14%
6%
5%
Infrastructure and Services
Planning General
Growth and Sustainability
Inter-Municipal Relations
HR
Strategic Planning
Public Responsiveness
Miscellaneous Issues
Other
Don’t Know/ Not Stated
CCAAOO SSuurrvveeyy 22000044:: TTrraaiinniinngg,, PPrriioorriittiieess && SSuucccceessssiioonn PPllaannnniinngg
28
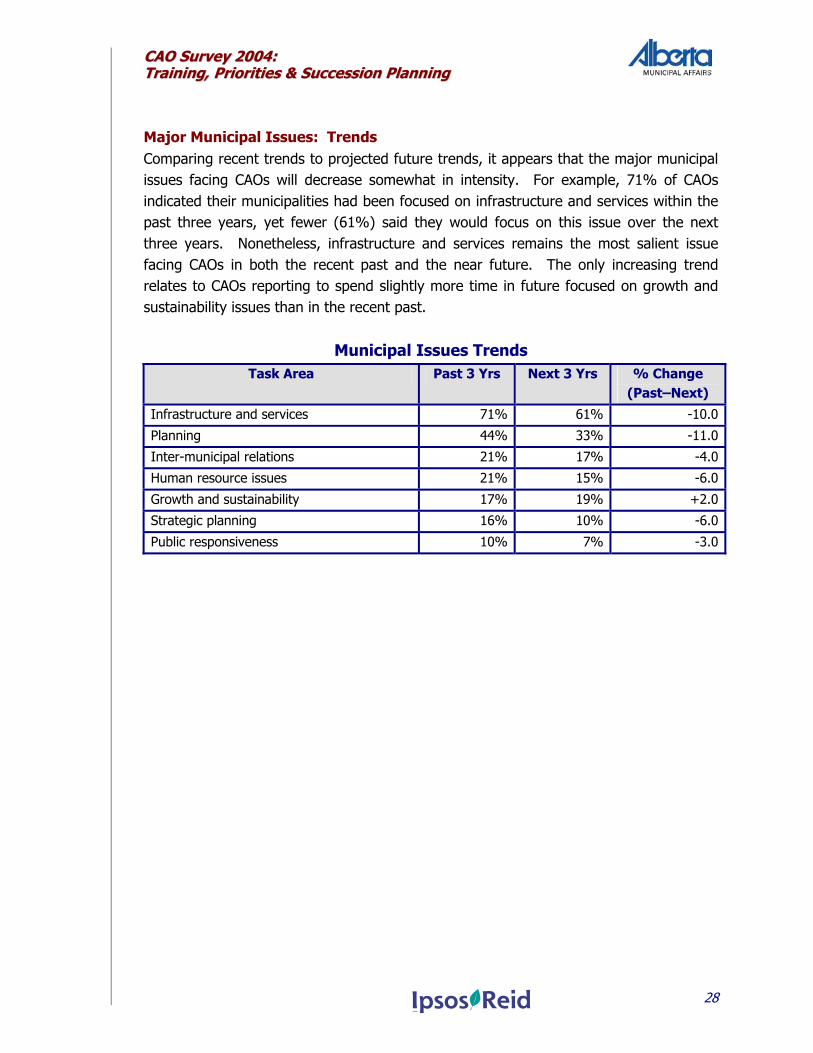
Major Municipal Issues: Trends Comparing recent trends to projected future trends, it appears that the major municipal issues facing CAOs will decrease somewhat in intensity. For example, 71% of CAOs indicated their municipalities had been focused on infrastructure and services within the past three years, yet fewer (61%) said they would focus on this issue over the next three years. Nonetheless, infrastructure and services remains the most salient issue facing CAOs in both the recent past and the near future. The only increasing trend relates to CAOs reporting to spend slightly more time in future focused on growth and sustainability issues than in the recent past.
Municipal Issues Trends Task Area Past 3 Yrs Next 3 Yrs % Change
(Past–Next)
Infrastructure and services 71% 61% -10.0
Planning 44% 33% -11.0
Inter-municipal relations 21% 17% -4.0
Human resource issues 21% 15% -6.0
Growth and sustainability 17% 19% +2.0
Strategic planning 16% 10% -6.0
Public responsiveness 10% 7% -3.0
CCAAOO SSuurrvveeyy 22000044:: TTrraaiinniinngg,, PPrriioorriittiieess && SSuucccceessssiioonn PPllaannnniinngg
29
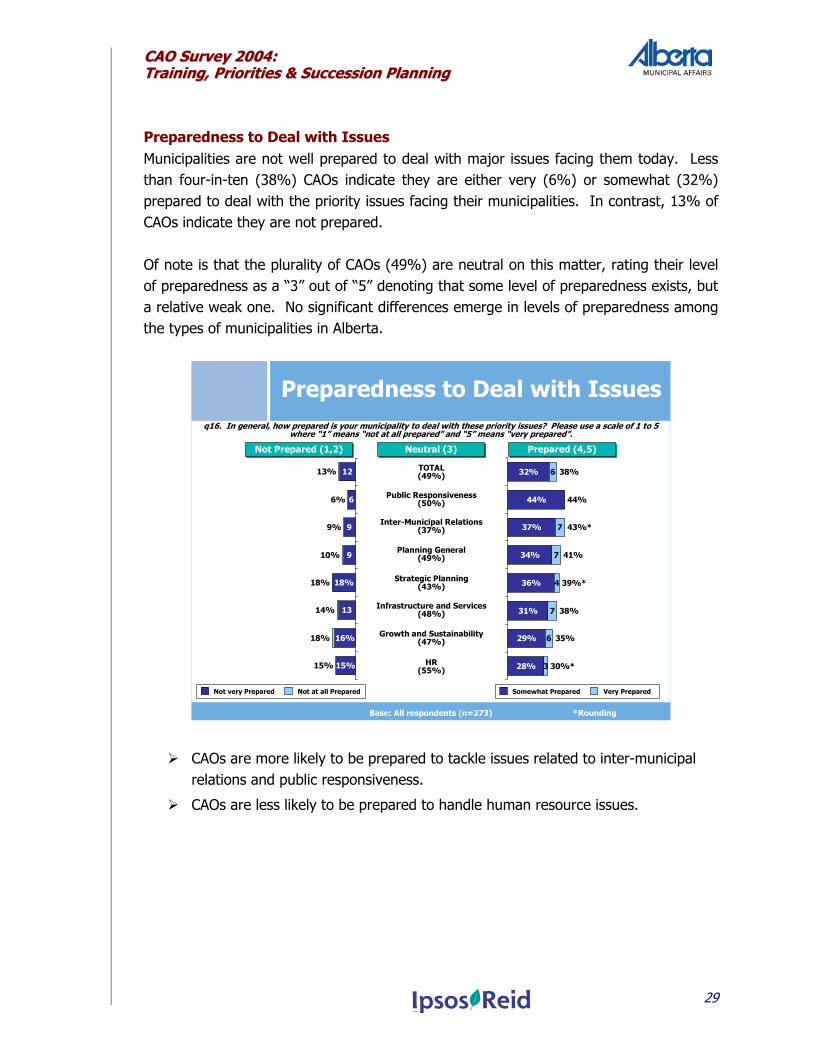
Preparedness to Deal with Issues Municipalities are not well prepared to deal with major issues facing them today. Less than four-in-ten (38%) CAOs indicate they are either very (6%) or somewhat (32%) prepared to deal with the priority issues facing their municipalities. In contrast, 13% of CAOs indicate they are not prepared. Of note is that the plurality of CAOs (49%) are neutral on this matter, rating their level of preparedness as a “3” out of “5” denoting that some level of preparedness exists, but a relative weak one. No significant differences emerge in levels of preparedness among the types of municipalities in Alberta.
Preparedness to Deal with Issues q16. In general, how prepared is your municipality to deal with these priority issues? Please use a scale of 1 to 5
where “1” means “not at all prepared” and “5” means “very prepared”.
Base: All respondents (n=273)
32%
44%
37%
34%
36%
31%
29%
28%
38%
44%
41%
38%
35%
3
6
7
4
7
7
6
30%*
39%*
43%*
Somewhat Prepared Very Prepared
15%
13%
6%
9%
10%
18%
14%
18%
15%
16%
13
18%
9
9
6
12
Not very Prepared Not at all Prepared
Prepared (4,5)Prepared (4,5)Not Prepared (1,2)Not Prepared (1,2)
TOTAL(49%)
Public Responsiveness(50%)
Inter-Municipal Relations(37%)
Neutral (3)Neutral (3)
*Rounding
Planning General(49%)
Strategic Planning(43%)
Infrastructure and Services(48%)
Growth and Sustainability (47%)
HR (55%)
CAOs are more likely to be prepared to tackle issues related to inter-municipal relations and public responsiveness.
CAOs are less likely to be prepared to handle human resource issues.
CCAAOO SSuurrvveeyy 22000044:: TTrraaiinniinngg,, PPrriioorriittiieess && SSuucccceessssiioonn PPllaannnniinngg
30
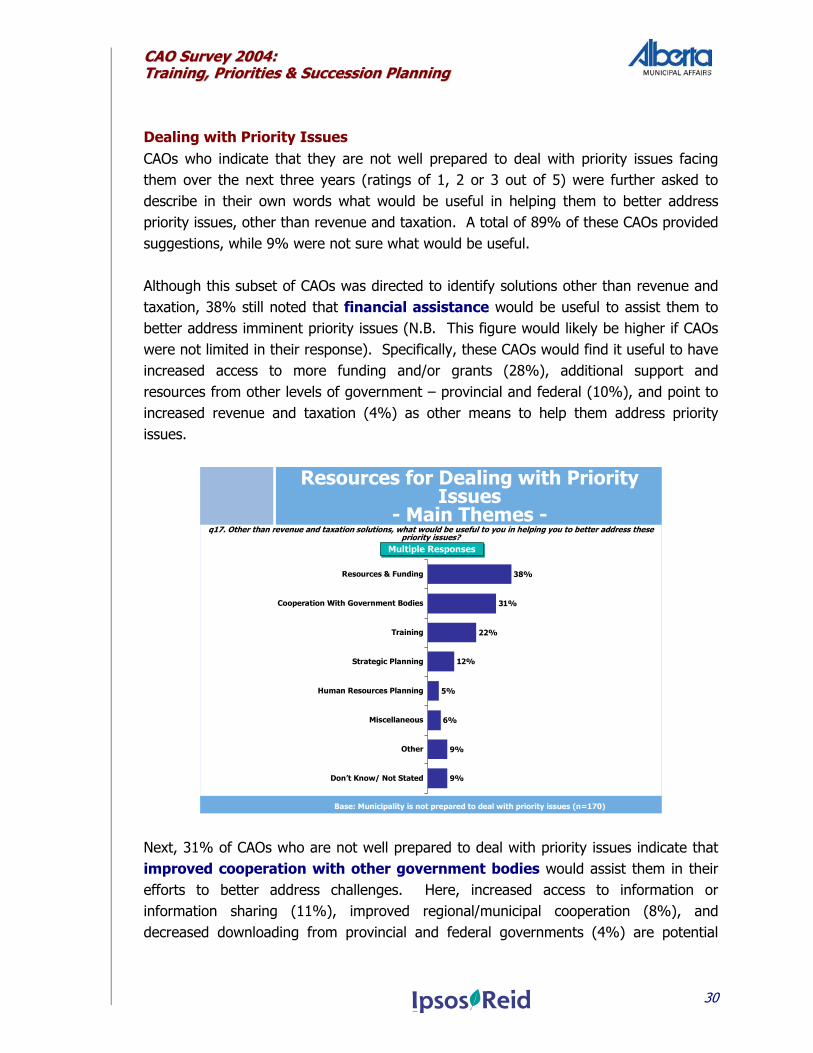
Dealing with Priority Issues CAOs who indicate that they are not well prepared to deal with priority issues facing them over the next three years (ratings of 1, 2 or 3 out of 5) were further asked to describe in their own words what would be useful in helping them to better address priority issues, other than revenue and taxation. A total of 89% of these CAOs provided suggestions, while 9% were not sure what would be useful. Although this subset of CAOs was directed to identify solutions other than revenue and taxation, 38% still noted that financial assistance would be useful to assist them to better address imminent priority issues (N.B. This figure would likely be higher if CAOs were not limited in their response). Specifically, these CAOs would find it useful to have increased access to more funding and/or grants (28%), additional support and resources from other levels of government – provincial and federal (10%), and point to increased revenue and taxation (4%) as other means to help them address priority issues.
Resources for Dealing with Priority Issues
- Main Themes -q17. Other than revenue and taxation solutions, what would be useful to you in helping you to better address these
priority issues?
Multiple ResponsesMultiple Responses
38%
31%
22%
12%
5%
6%
9%
9%
Base: Municipality is not prepared to deal with priority issues (n=170)
Resources & Funding
Cooperation With Government Bodies
Training
Strategic Planning
Human Resources Planning
Miscellaneous
Other
Don’t Know/ Not Stated
Next, 31% of CAOs who are not well prepared to deal with priority issues indicate that improved cooperation with other government bodies would assist them in their efforts to better address challenges. Here, increased access to information or information sharing (11%), improved regional/municipal cooperation (8%), and decreased downloading from provincial and federal governments (4%) are potential
CCAAOO SSuurrvveeyy 22000044:: TTrraaiinniinngg,, PPrriioorriittiieess && SSuucccceessssiioonn PPllaannnniinngg
31
solutions to help CAOs address priority issues over the next few years. In addition, CAOs point to improved performance of councils (3%), improved urban/rural relations (3%), the delegation of additional roles to municipal governments (2%), and reduced provincial/federal regulations (1%) as methods to help municipalities deal with priority issues in the near future. Training is another method of assisting CAOs to better address priority issues. More than two-in-ten (22%) CAOs in this subset point to training as a potential solution, including increased training and education (14%) and additional consulting services/professional assistance or advisory services (9%). Further, certain CAOs (12%) identify strategic planning as a means to help them better address priority issues. Specifically, these CAOs feel that undertaking a strategic planning process (8%), focusing on a plan for business attraction and retention (3%), or simply allocating the time to prepare strategic plans to address priority issues (2%) would help them better address challenges facing them in the near future. As well, a small proportion (5%) of CAOs point to human resource planning to help them better address priority issues, including the creation of succession plans, developing strategies to attract and retain employees, and increasing staffing levels. Other potential solutions to help these CAOs better address priority issues were identified by three percent or less of CAOs and point to:
Improved communication in general;
Conflict resolution/mediation;
Reduced political influence; and
Population increases.
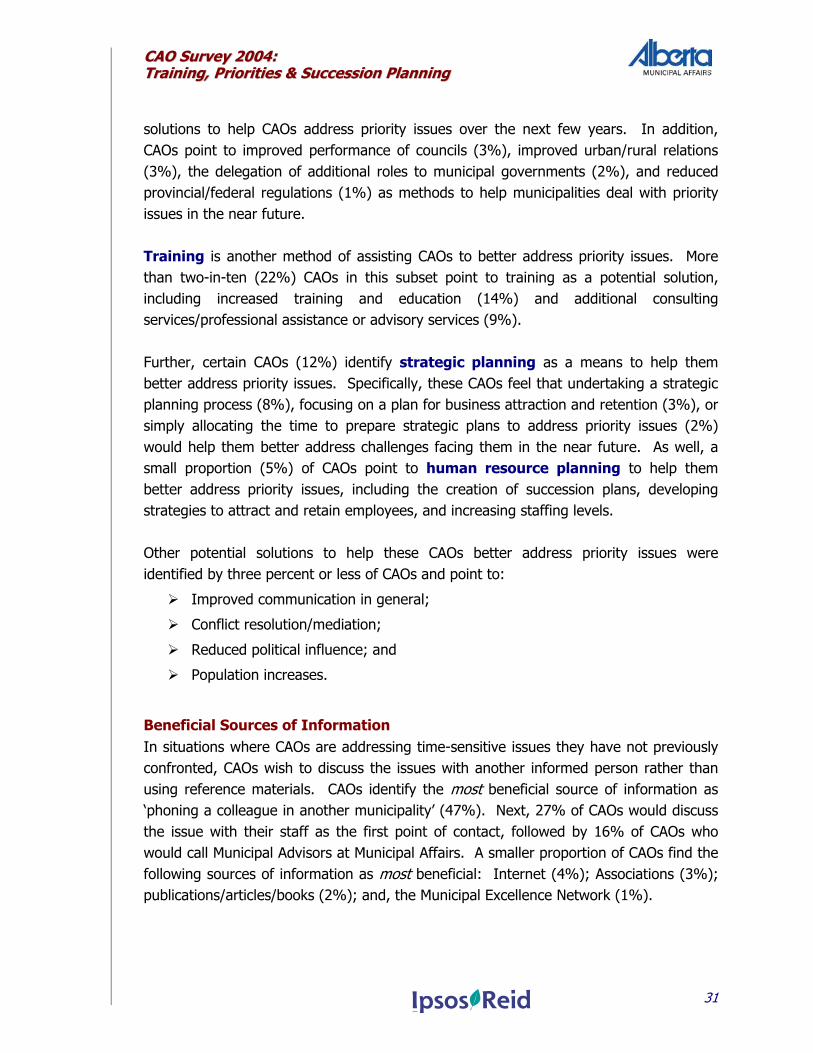
Beneficial Sources of Information In situations where CAOs are addressing time-sensitive issues they have not previously confronted, CAOs wish to discuss the issues with another informed person rather than using reference materials. CAOs identify the most beneficial source of information as ‘phoning a colleague in another municipality’ (47%). Next, 27% of CAOs would discuss the issue with their staff as the first point of contact, followed by 16% of CAOs who would call Municipal Advisors at Municipal Affairs. A smaller proportion of CAOs find the following sources of information as most beneficial: Internet (4%); Associations (3%); publications/articles/books (2%); and, the Municipal Excellence Network (1%).
CCAAOO SSuurrvveeyy 22000044:: TTrraaiinniinngg,, PPrriioorriittiieess && SSuucccceessssiioonn PPllaannnniinngg
32
When looking at the total of the first, second and third most beneficial sources of information for CAOs, phoning colleagues in other municipalities still ranks first (86%), followed now by Municipal Advisors at Municipal Affairs (63%) and discussing issues with staff (60%). Overall, Municipal Advisors are not seen as the most beneficial source of information for CAOs, yet are clearly one of the top information sources CAOs will turn to in crisis.
q13. Please indicate which of the following sources of information is most beneficial to you when you are addressing a time-sensitive issue that you have not previously confronted.
Beneficial Sources of Information
Saying Most BeneficialSaying Most Beneficial
Base: All respondents
47%
27%
16%
4%
3%
2%
1%
47%
25%
24%
2%
1%
1%
-
Phoning a colleague in another Municipality
Discussing the issue with your staff
Calling Municipal advisors at Municipal Affairs
Accessing information about the issue on the Internet
Calling one of the Associations
Referring to publications/ articles/ books
The Municipal Excellence Network
2004 (n=273)
2001 (n=268)
CAOs of villages are significantly more likely (56%) to identify colleagues in another municipality as the most beneficial source of information.
CAOs of cities are significantly more likely (80%) to indicate they would discuss the issue with their staff as the most beneficial source of information.
Phoning colleagues in other municipalities remains the most beneficial source of information to CAOs; no change has taken place since 2001. However, CAOs today are less likely than they were in 2001 to identify Municipal Advisors at Municipal Affairs as the most beneficial source of information to assist them with a time-sensitive issue they have not previously confronted (16% currently vs. 24% in 2001). Similar patterns are reported for identifying the Internet (4% currently vs. 2% in 2001), Associations (3% currently vs. 1% in 2001), or publications/articles/books (2% currently vs. 1% in 2001) as the most beneficial sources of information to CAOs. Further, in 2004, a total of 1% of CAOs pinpoint the Municipal Excellence Network as the most beneficial source of information – a new reference tool which was not available in 2001.
CCAAOO SSuurrvveeyy 22000044:: TTrraaiinniinngg,, PPrriioorriittiieess && SSuucccceessssiioonn PPllaannnniinngg
33
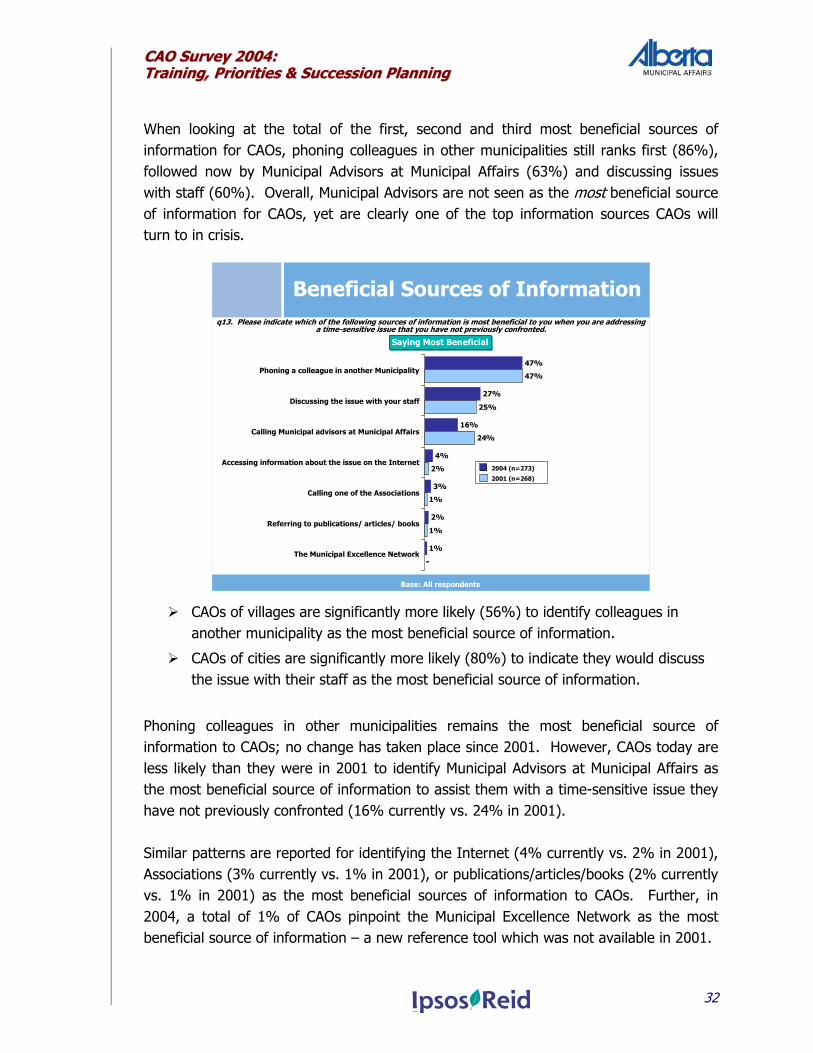
Dealing with Public Involvement When looking at CAOs’ responsibilities, 12.3% of their time, on average, is devoted to interacting with the public – the third most demanding portion of their overall role. Indeed, this particular responsibility has been increasing over the past three years (a net total of 28% of CAOs have spent an increased amount of time in this area). Looking at the issue of public involvement more closely, more than four-in-ten (42%) CAOs report their municipalities have been actively introducing new efforts to improve citizen participation in municipal issues within the past year. One-third (33%) of CAOs are neutral, indicating that their municipalities put forth efforts, but have not necessarily increased their efforts in this area. Further, one-quarter (25%) of CAOs indicate they have not actively introduced new efforts to improve citizen participation in municipal issues within the past year.
CAOs of municipal districts are significantly more likely (53%) to indicate they have undertaken efforts to improve citizen participation than are CAOs of other types of municipalities.
29%
30%
19%
14%
39%
26%7
9
42%*
Public Involvementq18. Please indicate the extent to which you agree or disagree with each of the following statements using a scale
of 1 to 5 where “1” means “completely disagree” and “5” means “completely agree”.
Base: All respondents (n=273)
Public interest and participation in municipal
issues in my municipality is strong(37%)
My municipality has been actively introducing new efforts to improve citizen participation in municipal issues within the
past year(33%)
17%
37%
22%
14%
27%10
25%
Agree (4,5)Agree (4,5)Disagree (1,2)Disagree (1,2)
Citizens in my municipality are well informed about our local
municipal issues(44%)
Somewhat Agree Completely AgreeSomewhat Disagree Completely Disagree
Neutral (3)Neutral (3)
*Rounding
CCAAOO SSuurrvveeyy 22000044:: TTrraaiinniinngg,, PPrriioorriittiieess && SSuucccceessssiioonn PPllaannnniinngg
34
In relation, roughly four-in-ten (39%) CAOs feel that citizens in their municipality are well informed about their local municipal issues. In contrast, 17% disagree with this view and an additional 44% of CAOs are neutral on this matter. Overall, CAOs indicate that the public is not overly engaged in municipal issues. A total of 37% of CAOs disagree that public interest and participation in municipal issues in their municipality is strong, versus 26% who agree with this point of view. An additional 37% of CAOs are neutral on this issue.
CCAAOO SSuurrvveeyy 22000044:: TTrraaiinniinngg,, PPrriioorriittiieess && SSuucccceessssiioonn PPllaannnniinngg
35
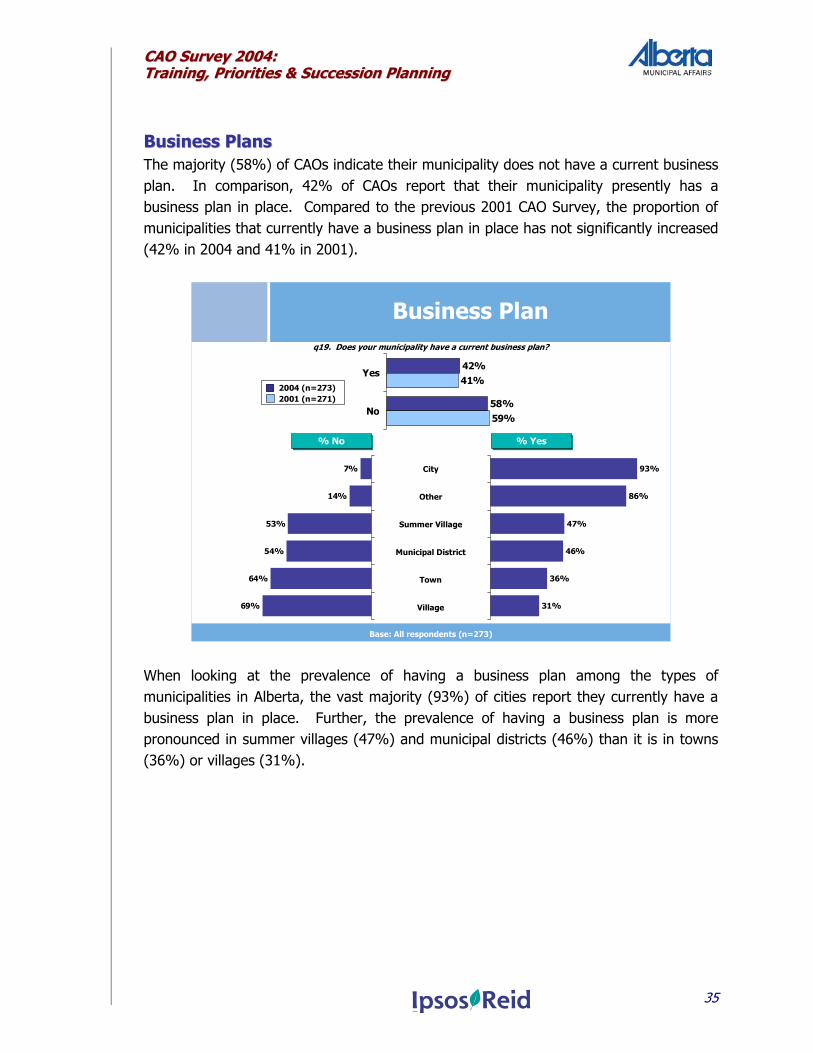
BBuussiinneessss PPllaannss The majority (58%) of CAOs indicate their municipality does not have a current business plan. In comparison, 42% of CAOs report that their municipality presently has a business plan in place. Compared to the previous 2001 CAO Survey, the proportion of municipalities that currently have a business plan in place has not significantly increased (42% in 2004 and 41% in 2001).
Business Planq19. Does your municipality have a current business plan?
Base: All respondents (n=273)
42%
58%
41%
59%
Yes
No
% Yes% Yes% No% No
93%
86%
47%
46%
36%
31%
7%
14%
53%
54%
64%
69%
City
Other
Summer Village
Municipal District
Town
Village
2004 (n=273)2001 (n=271)
When looking at the prevalence of having a business plan among the types of municipalities in Alberta, the vast majority (93%) of cities report they currently have a business plan in place. Further, the prevalence of having a business plan is more pronounced in summer villages (47%) and municipal districts (46%) than it is in towns (36%) or villages (31%).
CCAAOO SSuurrvveeyy 22000044:: TTrraaiinniinngg,, PPrriioorriittiieess && SSuucccceessssiioonn PPllaannnniinngg
36
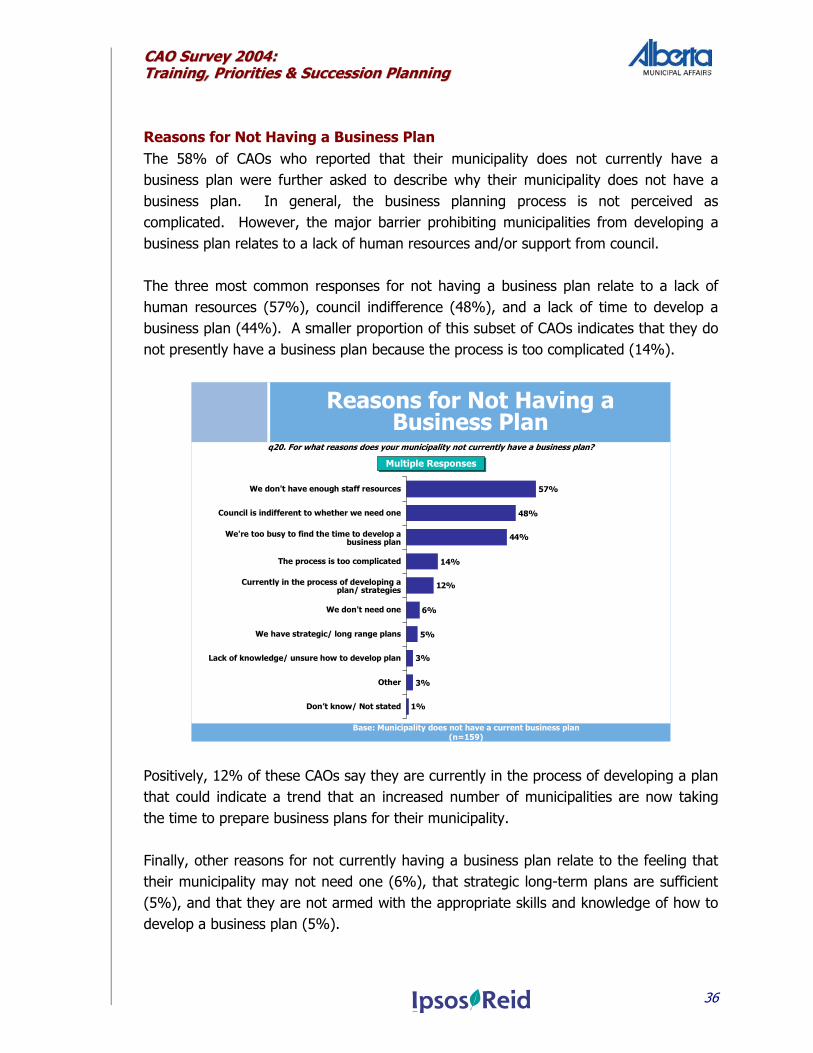
Reasons for Not Having a Business Plan The 58% of CAOs who reported that their municipality does not currently have a business plan were further asked to describe why their municipality does not have a business plan. In general, the business planning process is not perceived as complicated. However, the major barrier prohibiting municipalities from developing a business plan relates to a lack of human resources and/or support from council. The three most common responses for not having a business plan relate to a lack of human resources (57%), council indifference (48%), and a lack of time to develop a business plan (44%). A smaller proportion of this subset of CAOs indicates that they do not presently have a business plan because the process is too complicated (14%).
Reasons for Not Having a Business Plan
q20. For what reasons does your municipality not currently have a business plan?
Base: Municipality does not have a current business plan (n=159)
Multiple ResponsesMultiple Responses
57%
48%
44%
14%
12%
6%
5%
3%
3%
1%
We don't have enough staff resources
Council is indifferent to whether we need one
The process is too complicated
We don't need one
We have strategic/ long range plans
Lack of knowledge/ unsure how to develop plan
Other
Don’t know/ Not stated
We're too busy to find the time to develop a business plan
Currently in the process of developing a plan/ strategies
Positively, 12% of these CAOs say they are currently in the process of developing a plan that could indicate a trend that an increased number of municipalities are now taking the time to prepare business plans for their municipality. Finally, other reasons for not currently having a business plan relate to the feeling that their municipality may not need one (6%), that strategic long-term plans are sufficient (5%), and that they are not armed with the appropriate skills and knowledge of how to develop a business plan (5%).
CCAAOO SSuurrvveeyy 22000044:: TTrraaiinniinngg,, PPrriioorriittiieess && SSuucccceessssiioonn PPllaannnniinngg
37
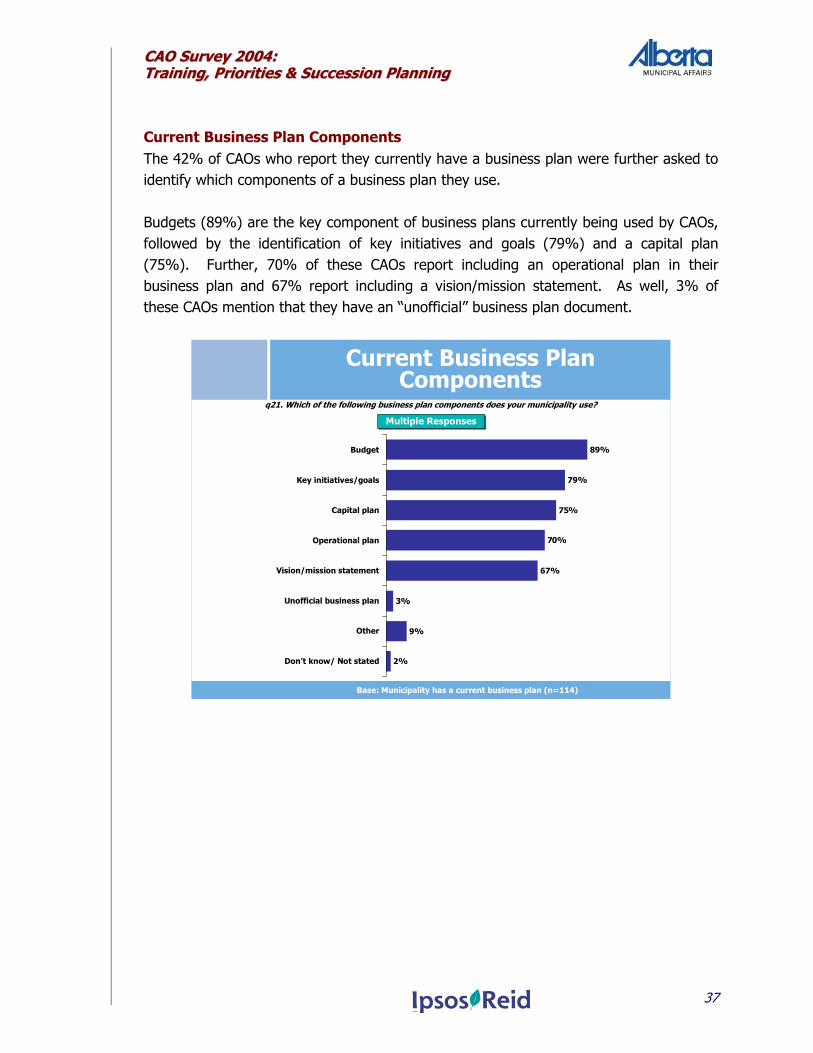
Current Business Plan Components The 42% of CAOs who report they currently have a business plan were further asked to identify which components of a business plan they use. Budgets (89%) are the key component of business plans currently being used by CAOs, followed by the identification of key initiatives and goals (79%) and a capital plan (75%). Further, 70% of these CAOs report including an operational plan in their business plan and 67% report including a vision/mission statement. As well, 3% of these CAOs mention that they have an “unofficial” business plan document.
Current Business Plan Components
q21. Which of the following business plan components does your municipality use?
89%
79%
75%
70%
67%
3%
9%
2%
Multiple ResponsesMultiple Responses
Base: Municipality has a current business plan (n=114)
Budget
Key initiatives/goals
Capital plan
Operational plan
Vision/mission statement
Unofficial business plan
Other
Don’t know/ Not stated
CCAAOO SSuurrvveeyy 22000044:: TTrraaiinniinngg,, PPrriioorriittiieess && SSuucccceessssiioonn PPllaannnniinngg
38
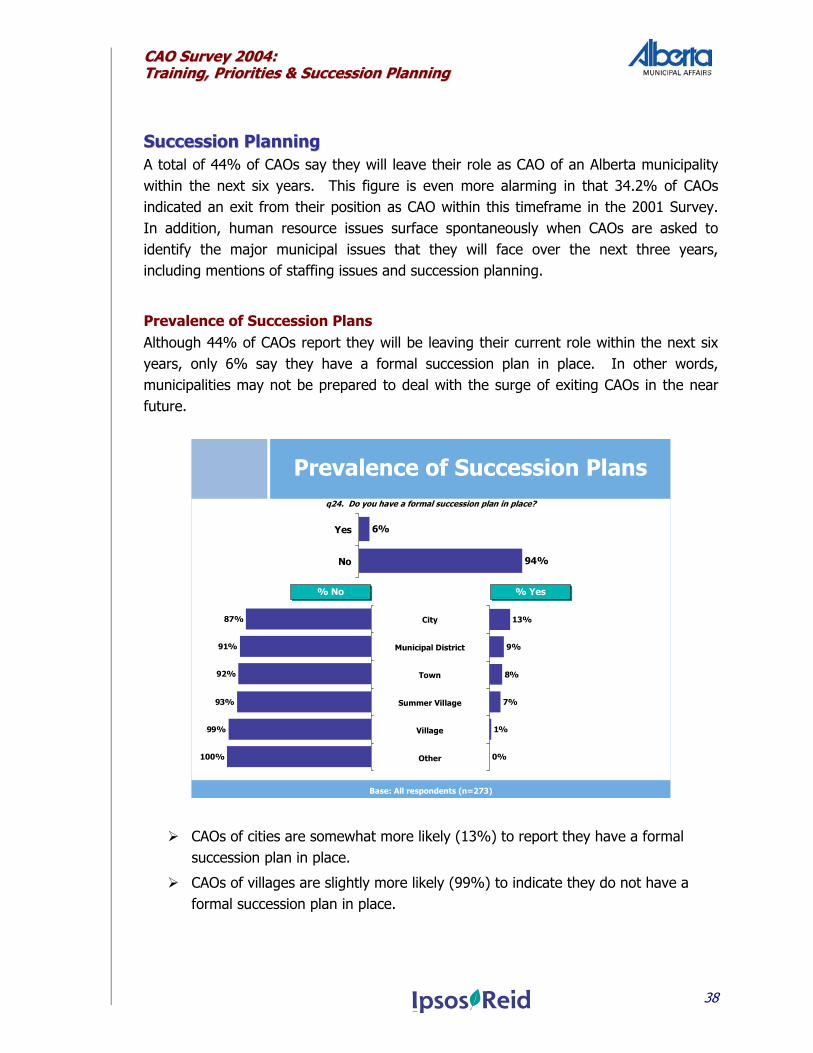
SSuucccceessssiioonn PPllaannnniinngg A total of 44% of CAOs say they will leave their role as CAO of an Alberta municipality within the next six years. This figure is even more alarming in that 34.2% of CAOs indicated an exit from their position as CAO within this timeframe in the 2001 Survey. In addition, human resource issues surface spontaneously when CAOs are asked to identify the major municipal issues that they will face over the next three years, including mentions of staffing issues and succession planning.
Prevalence of Succession Plans Although 44% of CAOs report they will be leaving their current role within the next six years, only 6% say they have a formal succession plan in place. In other words, municipalities may not be prepared to deal with the surge of exiting CAOs in the near future.
Prevalence of Succession Plansq24. Do you have a formal succession plan in place?
Base: All respondents (n=273)
6%
94%
Yes
No
% Yes% Yes% No% No
13%
9%
8%
7%
1%
0%
87%
91%
92%
93%
99%
100%
City
Municipal District
Town
Summer Village
Village
Other
CAOs of cities are somewhat more likely (13%) to report they have a formal succession plan in place.
CAOs of villages are slightly more likely (99%) to indicate they do not have a formal succession plan in place.
CCAAOO SSuurrvveeyy 22000044:: TTrraaiinniinngg,, PPrriioorriittiieess && SSuucccceessssiioonn PPllaannnniinngg
39
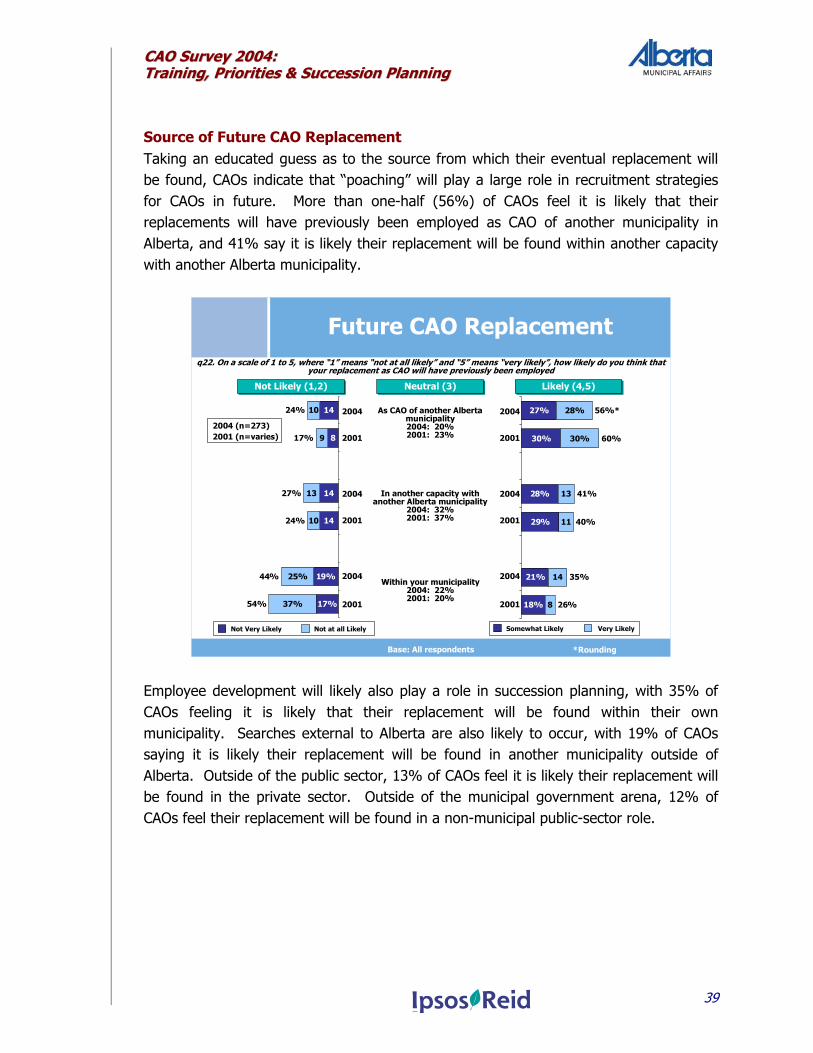
Source of Future CAO Replacement Taking an educated guess as to the source from which their eventual replacement will be found, CAOs indicate that “poaching” will play a large role in recruitment strategies for CAOs in future. More than one-half (56%) of CAOs feel it is likely that their replacements will have previously been employed as CAO of another municipality in Alberta, and 41% say it is likely their replacement will be found within another capacity with another Alberta municipality.
Future CAO Replacement q22. On a scale of 1 to 5, where “1” means “not at all likely” and “5” means “very likely”, how likely do you think that
your replacement as CAO will have previously been employed
Base: All respondents
27%
30%
28%
29%
21%
18%
28%
30% 60%
41%
40%
35%
26%8
14
13
11
56%*
Somewhat Likely Very Likely
19%
17%
25%
37%
17%
24%
44%
54%
14
14
8
14
10
13
9
10
27%
24%
Not Very Likely Not at all Likely
Likely (4,5)Likely (4,5)Not Likely (1,2)Not Likely (1,2)
As CAO of another Alberta municipality2004: 20%2001: 23%
In another capacity with another Alberta municipality
2004: 32%2001: 37%
Within your municipality2004: 22%2001: 20%
Neutral (3)Neutral (3)
*Rounding
2004 (n=273)2001 (n=varies)
2004
2001
2004
2001
2004
2001
2004
2001
2004
2001
2004
2001
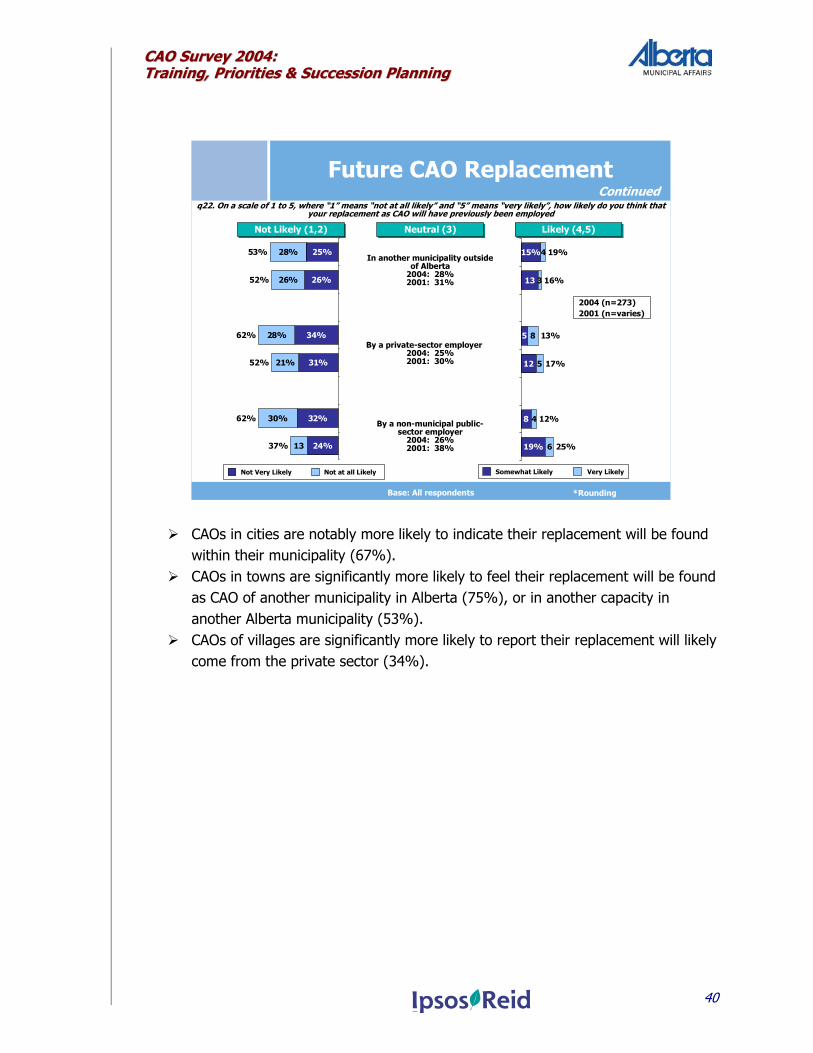
Employee development will likely also play a role in succession planning, with 35% of CAOs feeling it is likely that their replacement will be found within their own municipality. Searches external to Alberta are also likely to occur, with 19% of CAOs saying it is likely their replacement will be found in another municipality outside of Alberta. Outside of the public sector, 13% of CAOs feel it is likely their replacement will be found in the private sector. Outside of the municipal government arena, 12% of CAOs feel their replacement will be found in a non-municipal public-sector role.
CCAAOO SSuurrvveeyy 22000044:: TTrraaiinniinngg,, PPrriioorriittiieess && SSuucccceessssiioonn PPllaannnniinngg
40
Future CAO Replacement q22. On a scale of 1 to 5, where “1” means “not at all likely” and “5” means “very likely”, how likely do you think that
your replacement as CAO will have previously been employed
Base: All respondents
15%
19%
19%
16%
13%
17%
12%
25%
13
8
12
5
6
4
5
8
3
4
Somewhat Likely Very Likely
26%
34%
31%
32%
24%
28%
26%
28%
21%
30%
52%
52%
62%
37%
25%
13
62%
53%
Not Very Likely Not at all Likely
Likely (4,5)Likely (4,5)Not Likely (1,2)Not Likely (1,2)
In another municipality outside of Alberta
2004: 28%2001: 31%
By a private-sector employer2004: 25%2001: 30%
By a non-municipal public-sector employer
2004: 26%2001: 38%
Neutral (3)Neutral (3)
*Rounding
2004 (n=273)2001 (n=varies)
Continued
CAOs in cities are notably more likely to indicate their replacement will be found within their municipality (67%). CAOs in towns are significantly more likely to feel their replacement will be found
as CAO of another municipality in Alberta (75%), or in another capacity in another Alberta municipality (53%). CAOs of villages are significantly more likely to report their replacement will likely
come from the private sector (34%).
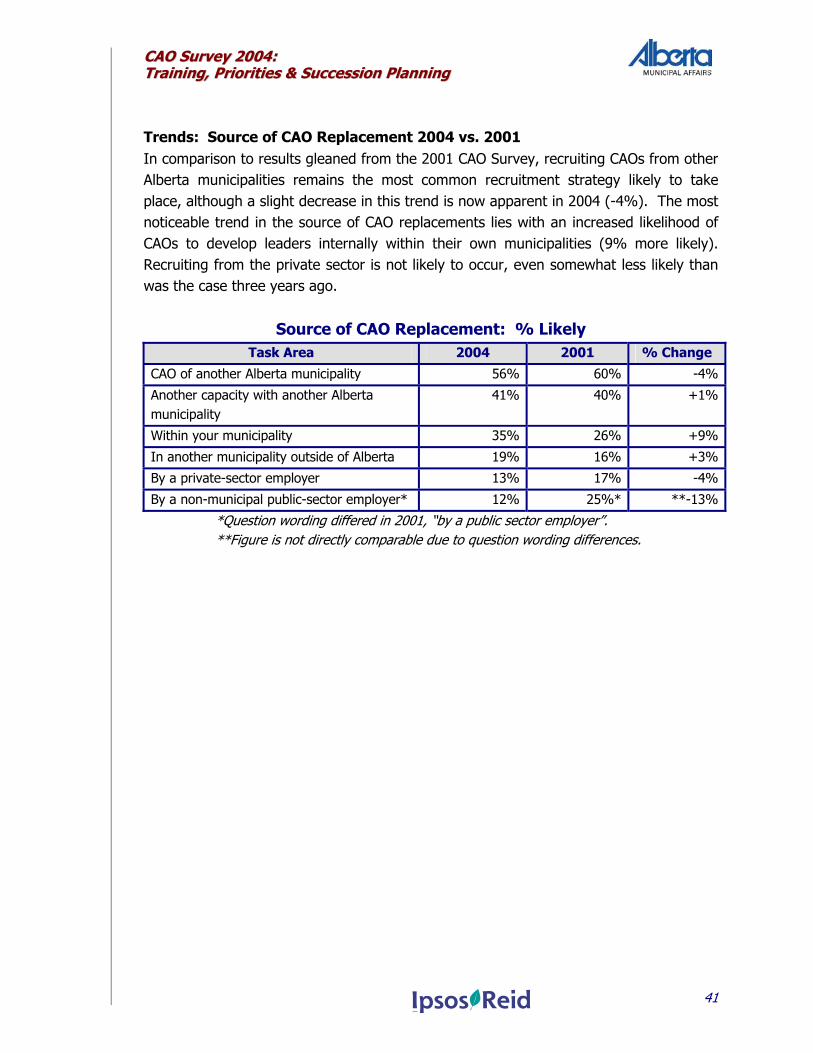
CCAAOO SSuurrvveeyy 22000044:: TTrraaiinniinngg,, PPrriioorriittiieess && SSuucccceessssiioonn PPllaannnniinngg
41
Trends: Source of CAO Replacement 2004 vs. 2001 In comparison to results gleaned from the 2001 CAO Survey, recruiting CAOs from other Alberta municipalities remains the most common recruitment strategy likely to take place, although a slight decrease in this trend is now apparent in 2004 (-4%). The most noticeable trend in the source of CAO replacements lies with an increased likelihood of CAOs to develop leaders internally within their own municipalities (9% more likely). Recruiting from the private sector is not likely to occur, even somewhat less likely than was the case three years ago.
Source of CAO Replacement: % Likely Task Area 2004 2001 % Change
CAO of another Alberta municipality 56% 60% -4%
Another capacity with another Alberta municipality
41% 40% +1%
Within your municipality 35% 26% +9%
In another municipality outside of Alberta 19% 16% +3%
By a private-sector employer 13% 17% -4%
By a non-municipal public-sector employer* 12% 25%* **-13%
*Question wording differed in 2001, “by a public sector employer”. **Figure is not directly comparable due to question wording differences.
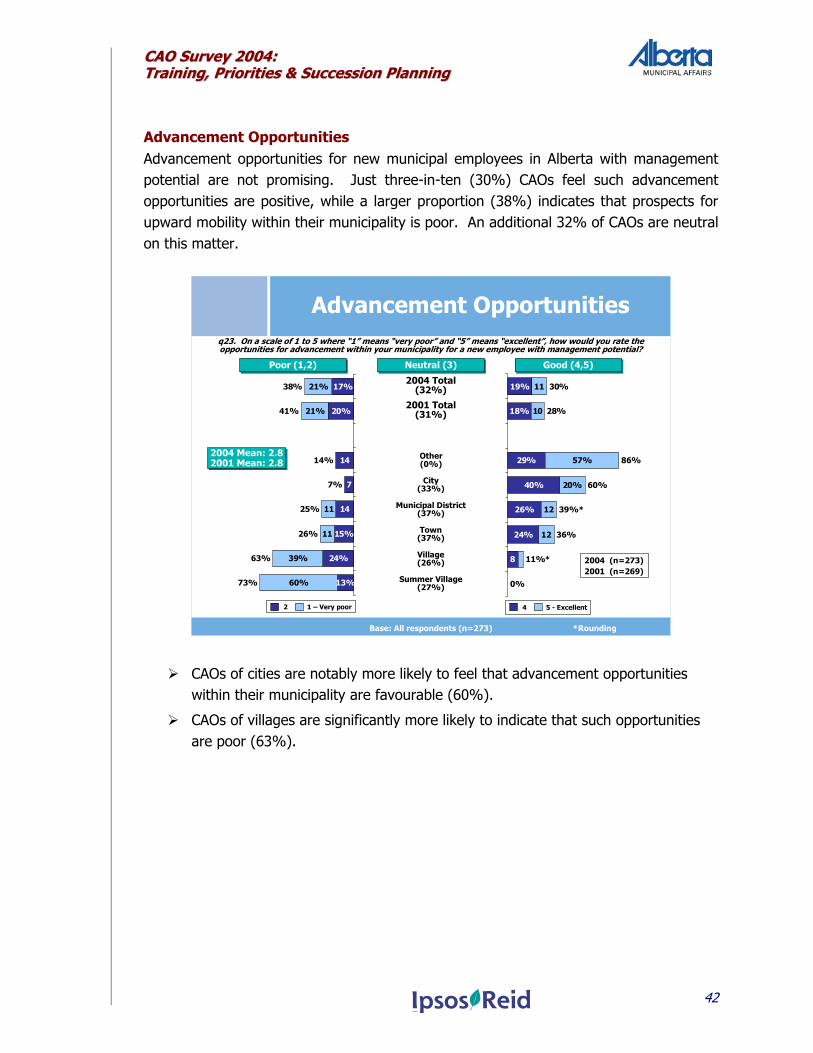
CCAAOO SSuurrvveeyy 22000044:: TTrraaiinniinngg,, PPrriioorriittiieess && SSuucccceessssiioonn PPllaannnniinngg
42
Advancement Opportunities Advancement opportunities for new municipal employees in Alberta with management potential are not promising. Just three-in-ten (30%) CAOs feel such advancement opportunities are positive, while a larger proportion (38%) indicates that prospects for upward mobility within their municipality is poor. An additional 32% of CAOs are neutral on this matter.
Advancement Opportunitiesq23. On a scale of 1 to 5 where “1” means “very poor” and “5” means “excellent”, how would you rate the opportunities for advancement within your municipality for a new employee with management potential?
Base: All respondents (n=273)
19%
18%
29%
40%
26%
24%
57%
20%
30%
28%
86%
60%
36%
0%
8
12
12
10
11
11%*
39%*
4 5 - Excellent
17%
20%
15%
24%
13%
21%
21%
39%
60%
38%
41%
14%
7%
25%
26%
63%
73%
14
7
14
11
11
Good (4,5)Good (4,5)Poor (1,2)Poor (1,2)
2004 Total(32%)
Other(0%)
Municipal District(37%)
Town(37%)
Village(26%)
Neutral (3)Neutral (3)
2 1 – Very poor
Summer Village(27%)
City(33%)
*Rounding
2004 Mean: 2.82001 Mean: 2.82004 Mean: 2.82001 Mean: 2.8
2001 Total(31%)
2004 (n=273)2001 (n=269)
CAOs of cities are notably more likely to feel that advancement opportunities within their municipality are favourable (60%).
CAOs of villages are significantly more likely to indicate that such opportunities are poor (63%).
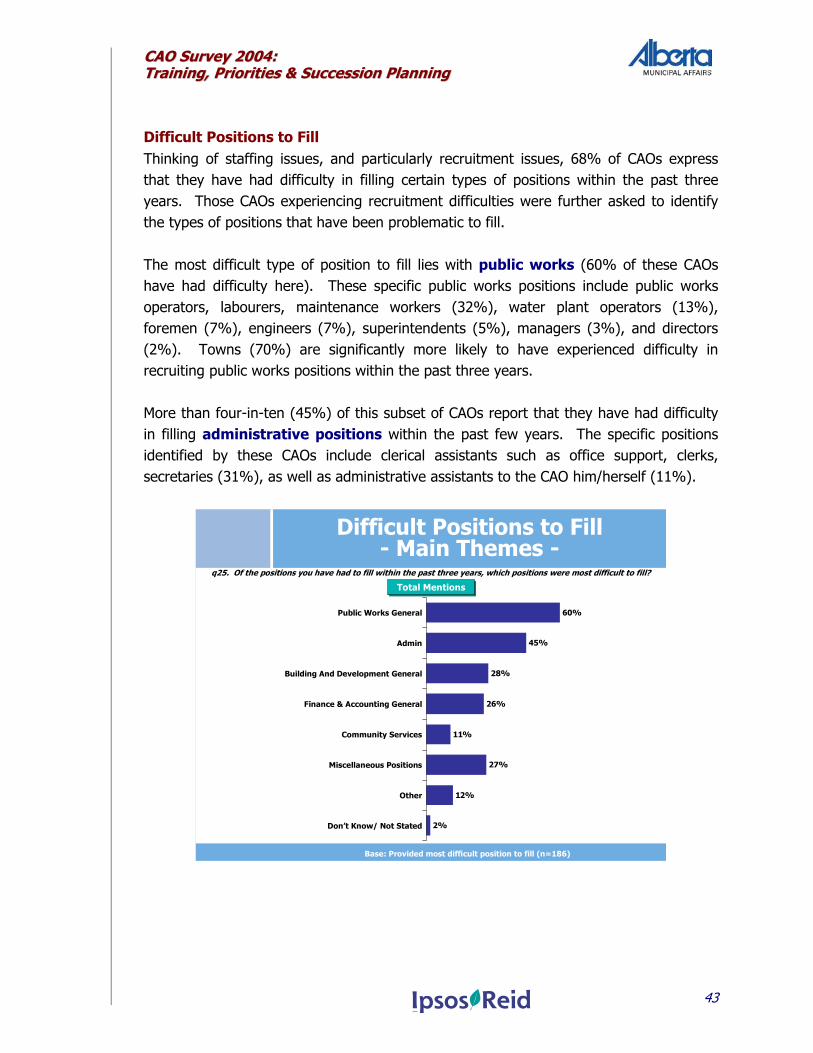
CCAAOO SSuurrvveeyy 22000044:: TTrraaiinniinngg,, PPrriioorriittiieess && SSuucccceessssiioonn PPllaannnniinngg
43
Difficult Positions to Fill Thinking of staffing issues, and particularly recruitment issues, 68% of CAOs express that they have had difficulty in filling certain types of positions within the past three years. Those CAOs experiencing recruitment difficulties were further asked to identify the types of positions that have been problematic to fill. The most difficult type of position to fill lies with public works (60% of these CAOs have had difficulty here). These specific public works positions include public works operators, labourers, maintenance workers (32%), water plant operators (13%), foremen (7%), engineers (7%), superintendents (5%), managers (3%), and directors (2%). Towns (70%) are significantly more likely to have experienced difficulty in recruiting public works positions within the past three years. More than four-in-ten (45%) of this subset of CAOs report that they have had difficulty in filling administrative positions within the past few years. The specific positions identified by these CAOs include clerical assistants such as office support, clerks, secretaries (31%), as well as administrative assistants to the CAO him/herself (11%).
Difficult Positions to Fill- Main Themes -
q25. Of the positions you have had to fill within the past three years, which positions were most difficult to fill?
Total MentionsTotal Mentions
60%
45%
28%
26%
11%
27%
12%
2%
Base: Provided most difficult position to fill (n=186)
Public Works General
Admin
Building And Development General
Finance & Accounting General
Community Services
Miscellaneous Positions
Other
Don’t Know/ Not Stated
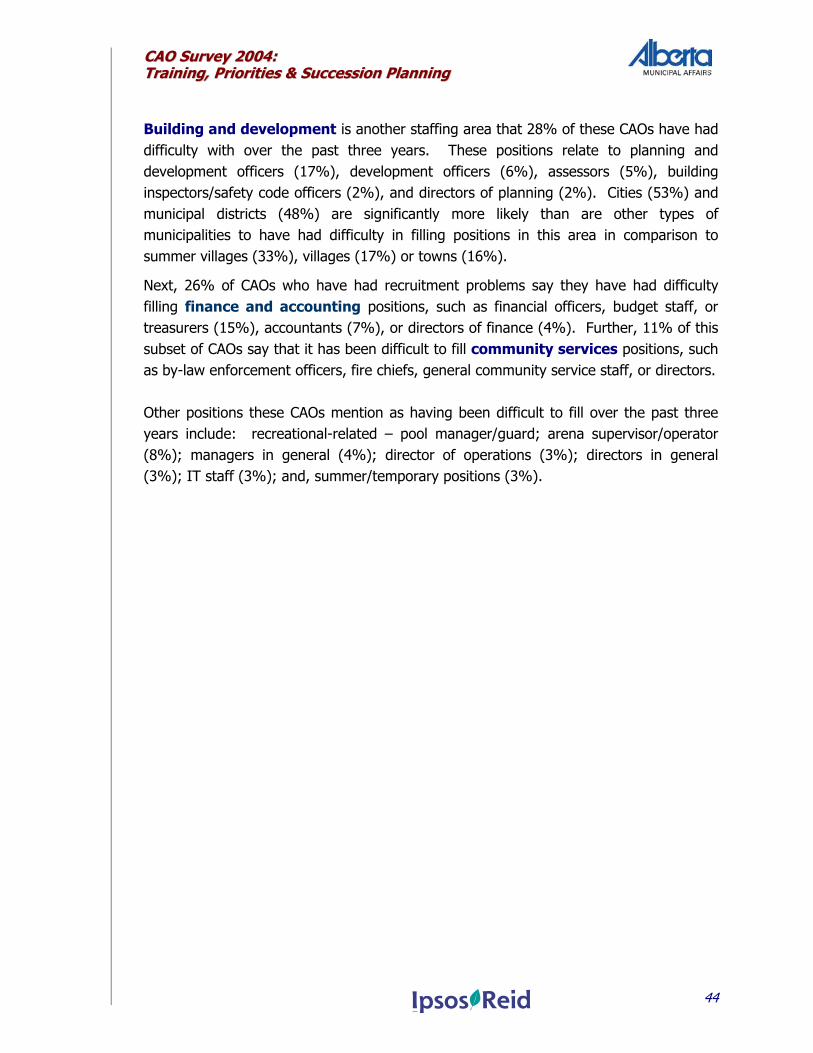
CCAAOO SSuurrvveeyy 22000044:: TTrraaiinniinngg,, PPrriioorriittiieess && SSuucccceessssiioonn PPllaannnniinngg
44
Building and development is another staffing area that 28% of these CAOs have had difficulty with over the past three years. These positions relate to planning and development officers (17%), development officers (6%), assessors (5%), building inspectors/safety code officers (2%), and directors of planning (2%). Cities (53%) and municipal districts (48%) are significantly more likely than are other types of municipalities to have had difficulty in filling positions in this area in comparison to summer villages (33%), villages (17%) or towns (16%).
Next, 26% of CAOs who have had recruitment problems say they have had difficulty filling finance and accounting positions, such as financial officers, budget staff, or treasurers (15%), accountants (7%), or directors of finance (4%). Further, 11% of this subset of CAOs say that it has been difficult to fill community services positions, such as by-law enforcement officers, fire chiefs, general community service staff, or directors. Other positions these CAOs mention as having been difficult to fill over the past three years include: recreational-related – pool manager/guard; arena supervisor/operator (8%); managers in general (4%); director of operations (3%); directors in general (3%); IT staff (3%); and, summer/temporary positions (3%).
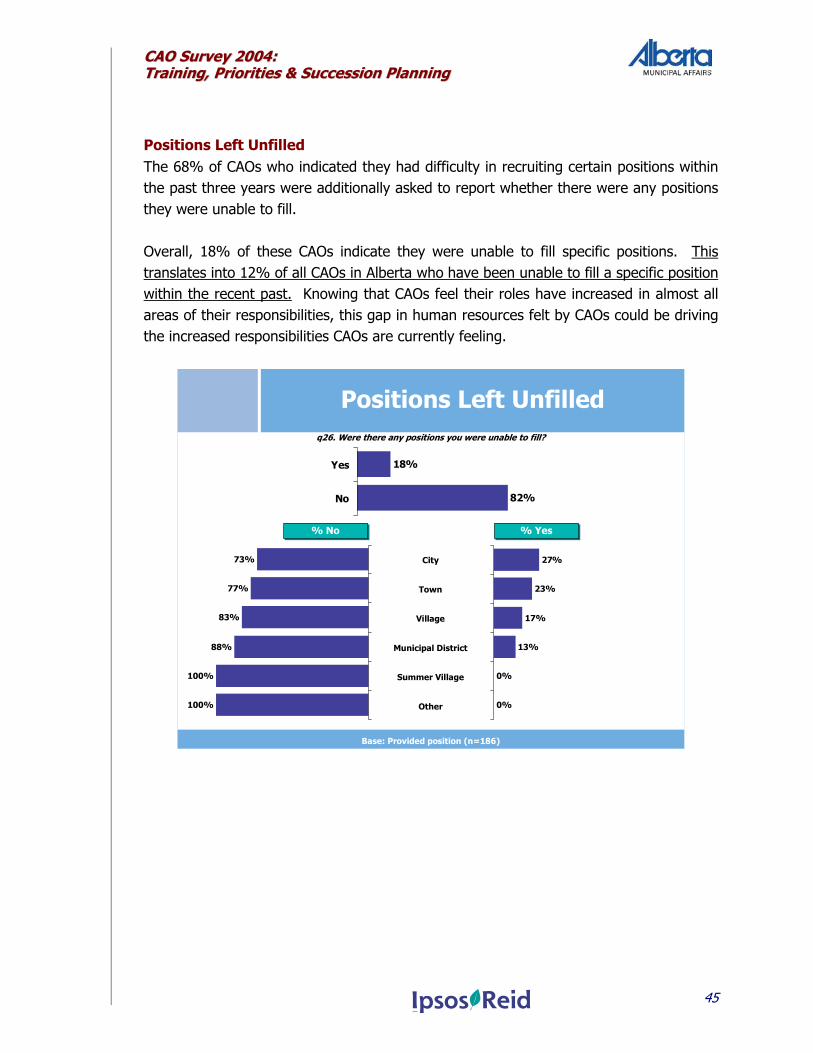
CCAAOO SSuurrvveeyy 22000044:: TTrraaiinniinngg,, PPrriioorriittiieess && SSuucccceessssiioonn PPllaannnniinngg
45
Positions Left Unfilled The 68% of CAOs who indicated they had difficulty in recruiting certain positions within the past three years were additionally asked to report whether there were any positions they were unable to fill. Overall, 18% of these CAOs indicate they were unable to fill specific positions. This translates into 12% of all CAOs in Alberta who have been unable to fill a specific position within the recent past. Knowing that CAOs feel their roles have increased in almost all areas of their responsibilities, this gap in human resources felt by CAOs could be driving the increased responsibilities CAOs are currently feeling.
Positions Left Unfilled
Base: Provided position (n=186)
q26. Were there any positions you were unable to fill?
18%
82%
Yes
No
% Yes% Yes% No% No
27%
23%
17%
13%
0%
0%
73%
77%
83%
88%
100%
100%
City
Town
Village
Municipal District
Summer Village
Other
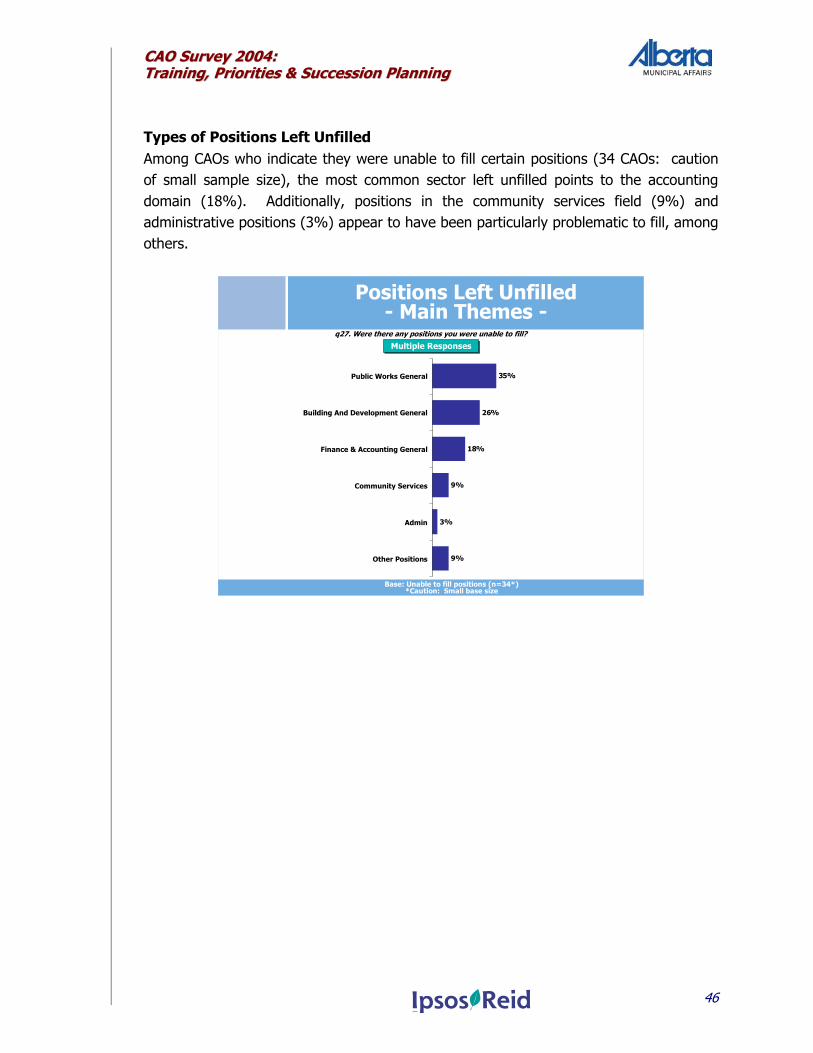
CCAAOO SSuurrvveeyy 22000044:: TTrraaiinniinngg,, PPrriioorriittiieess && SSuucccceessssiioonn PPllaannnniinngg
46
Types of Positions Left Unfilled Among CAOs who indicate they were unable to fill certain positions (34 CAOs: caution of small sample size), the most common sector left unfilled points to the accounting domain (18%). Additionally, positions in the community services field (9%) and administrative positions (3%) appear to have been particularly problematic to fill, among others.
35%
26%
18%
9%
3%
9%
Positions Left Unfilled- Main Themes -
Base: Unable to fill positions (n=34*)*Caution: Small base size
q27. Were there any positions you were unable to fill?
Public Works General
Building And Development General
Finance & Accounting General
Community Services
Admin
Other Positions
Multiple ResponsesMultiple Responses