Embed Size (px)
Citation preview
© European Bank for Reconstruction and Development
TRANSITION REPORT 2016-17
TRANSITION FOR ALL: EQUAL OPPORTUNITIES IN AN UNEQUAL WORLD
tr.ebrd.com
READ ONLINE
NOW
TRANSITION FOR ALL: EQUAL OPPORTUNITIES IN AN UNEQUAL WORLD Transition Report 2016-17
TRANSITION REPORT 2016-17
READ ONLINE
NOW
TRANSITION FOR ALL: EQUAL OPPORTUNITIES IN AN UNEQUAL WORLD tr-ebrd.com
Transition for all: equal opportunities in an unequal world
TRANSITION REPORT 2016-17
© European Bank for Reconstruction and Development
TRANSITION REPORT 2016-17
TRANSITION FOR ALL: EQUAL OPPORTUNITIES IN AN UNEQUAL WORLD
EBRD Transition Report 2016-17
2
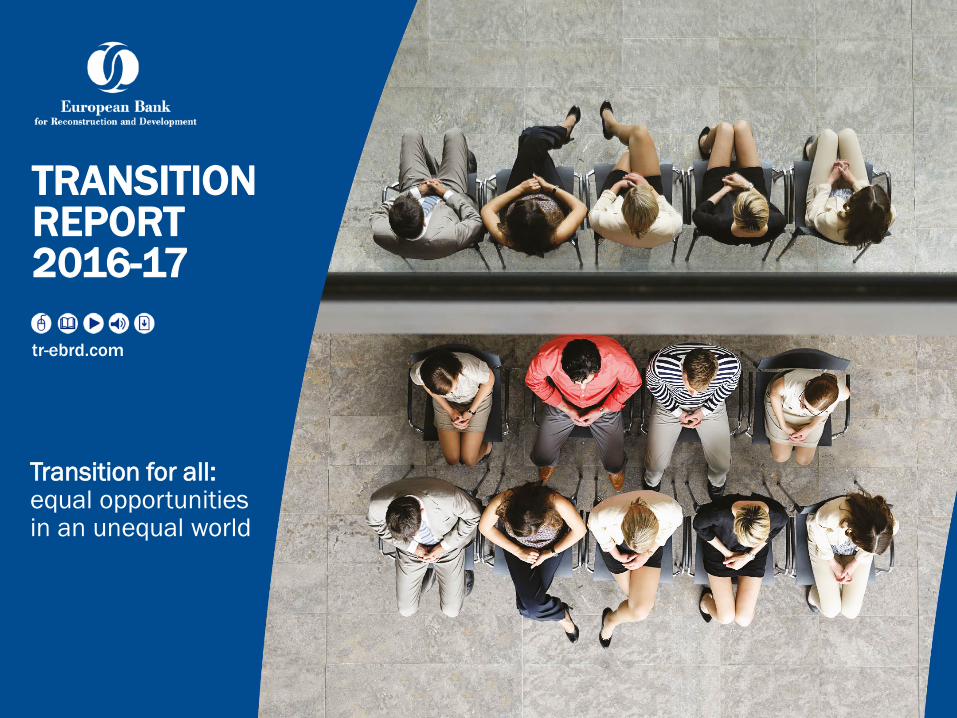
• What have individual experiences of transition been like in terms of income, happiness and health?
• Who benefited from transition and globalisation? Who did not?
• Who currently lacks economic opportunities?
• How can equality of opportunity be improved?
For the first time, a Transition Report focused on inequality
A look beyond average growth
© European Bank for Reconstruction and Development
TRANSITION REPORT 2016-17
TRANSITION FOR ALL: EQUAL OPPORTUNITIES IN AN UNEQUAL WORLD
EBRD Transition Report 2016-17
3
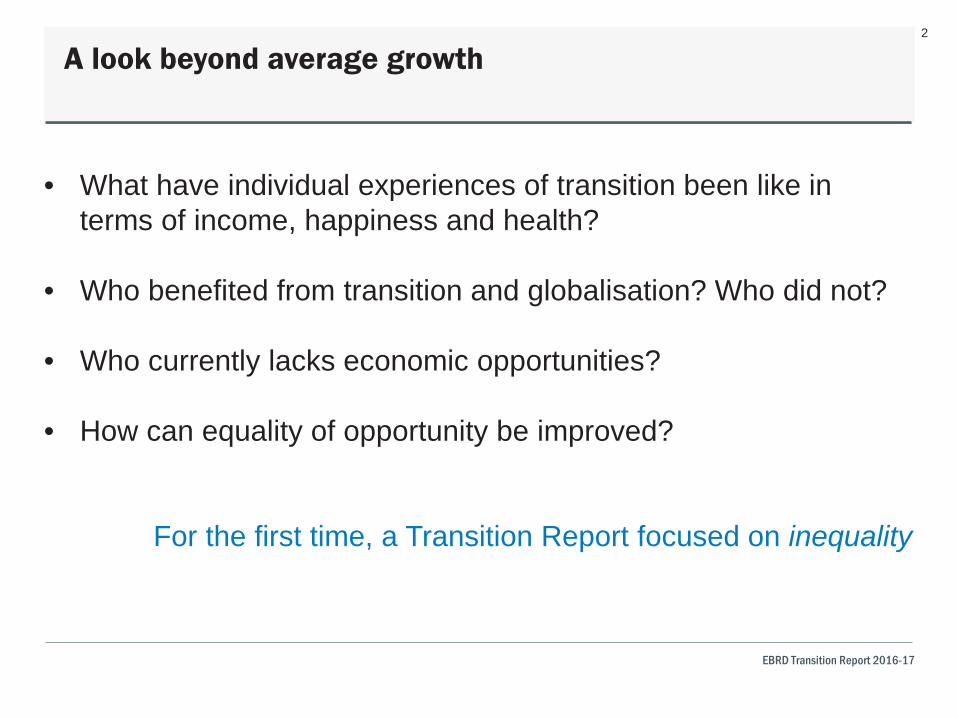
A unique survey: Life in Transition III
51,000 respondents in 34 countries (Germany, Italy, Czech
Republic as comparators)
© European Bank for Reconstruction and Development
TRANSITION REPORT 2016-17
TRANSITION FOR ALL: EQUAL OPPORTUNITIES IN AN UNEQUAL WORLD
EBRD Transition Report 2016-17
4
I. Income convergence – how did individual experiences vary?
II. The impact of transition on people’s well being
III. Inequality of opportunity
IV. Financial inclusion
A look beyond average growth
© European Bank for Reconstruction and Development
TRANSITION REPORT 2016-17
TRANSITION FOR ALL: EQUAL OPPORTUNITIES IN AN UNEQUAL WORLD 5
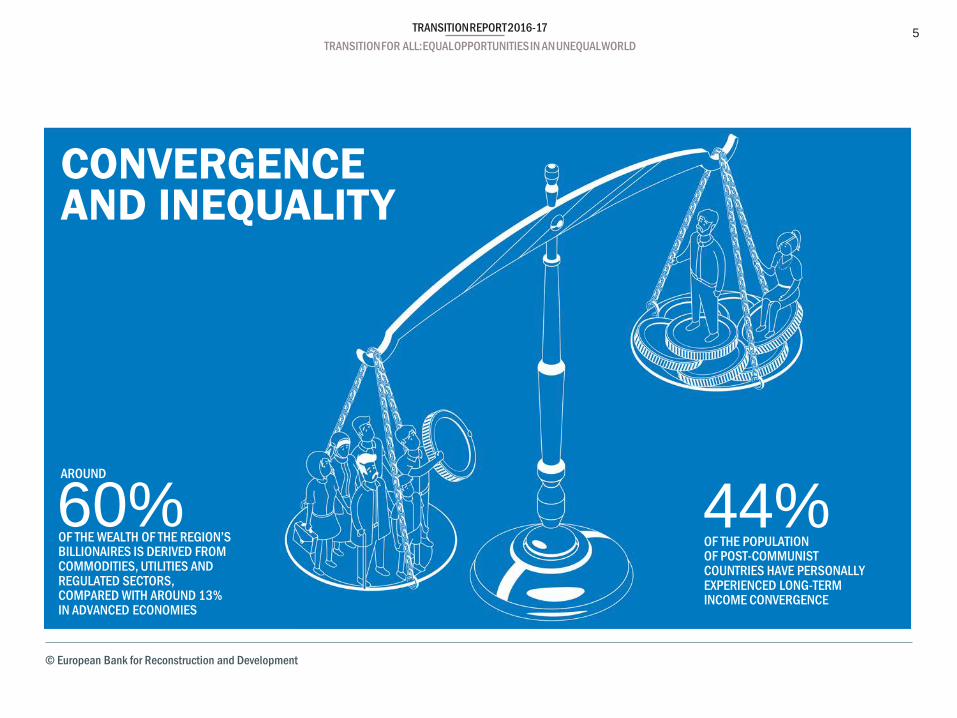
CONVERGENCE AND INEQUALITY
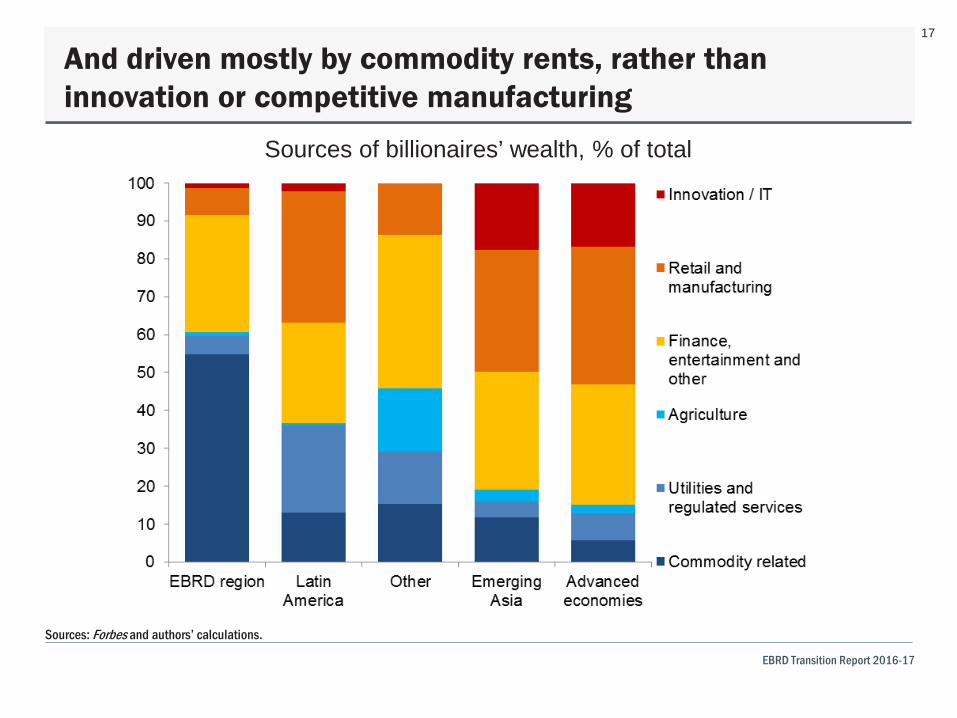
60% OF THE WEALTH OF THE REGION’S BILLIONAIRES IS DERIVED FROM COMMODITIES, UTILITIES AND REGULATED SECTORS, COMPARED WITH AROUND 13% IN ADVANCED ECONOMIES
44% OF THE POPULATION OF POST-COMMUNIST COUNTRIES HAVE PERSONALLY EXPERIENCED LONG-TERM INCOME CONVERGENCE
AROUND
© European Bank for Reconstruction and Development
TRANSITION REPORT 2016-17
TRANSITION FOR ALL: EQUAL OPPORTUNITIES IN AN UNEQUAL WORLD
EBRD Transition Report 2016-17
6
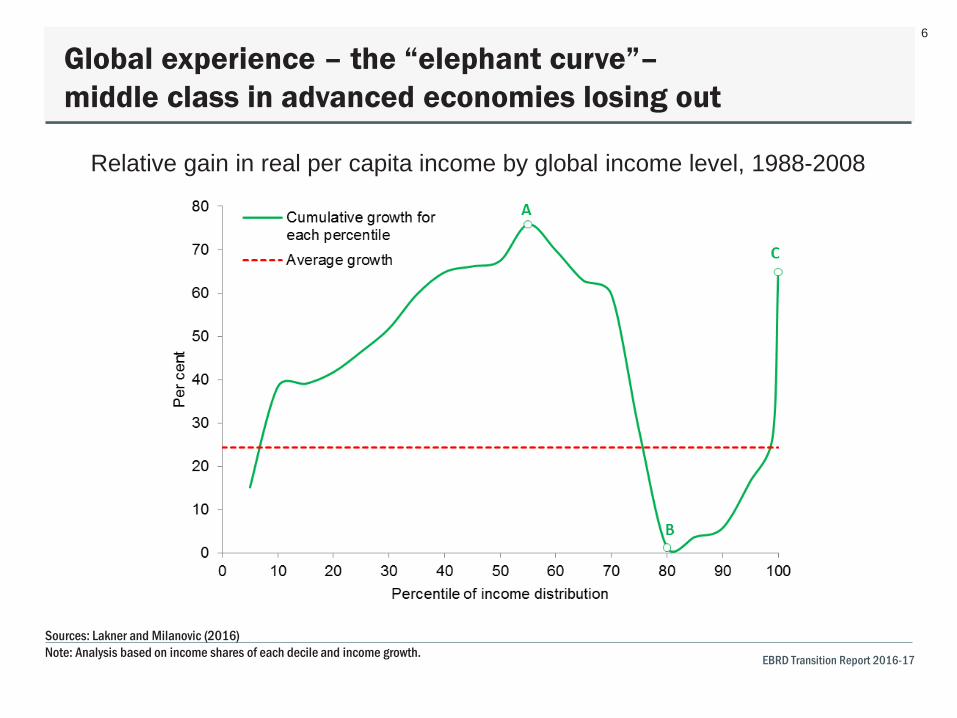
Global experience – the “elephant curve”– middle class in advanced economies losing out
Relative gain in real per capita income by global income level, 1988-2008
Sources: Lakner and Milanovic (2016) Note: Analysis based on income shares of each decile and income growth.
© European Bank for Reconstruction and Development
TRANSITION REPORT 2016-17
TRANSITION FOR ALL: EQUAL OPPORTUNITIES IN AN UNEQUAL WORLD
EBRD Transition Report 2016-17
7
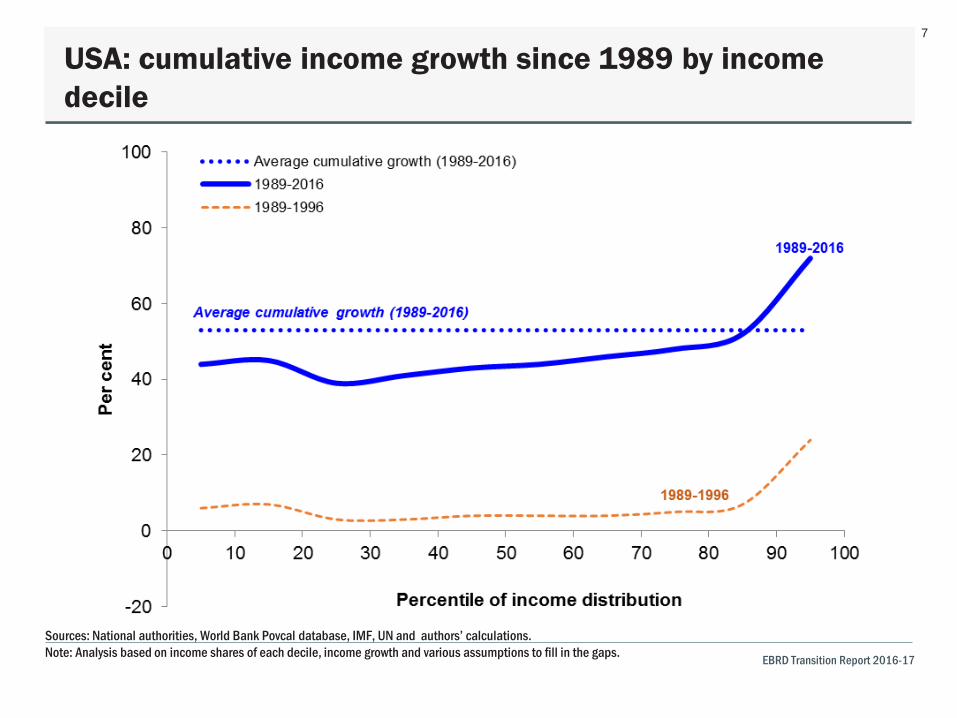
USA: cumulative income growth since 1989 by income decile
Sources: National authorities, World Bank Povcal database, IMF, UN and authors’ calculations. Note: Analysis based on income shares of each decile, income growth and various assumptions to fill in the gaps.
© European Bank for Reconstruction and Development
TRANSITION REPORT 2016-17
TRANSITION FOR ALL: EQUAL OPPORTUNITIES IN AN UNEQUAL WORLD
EBRD Transition Report 2016-17
8
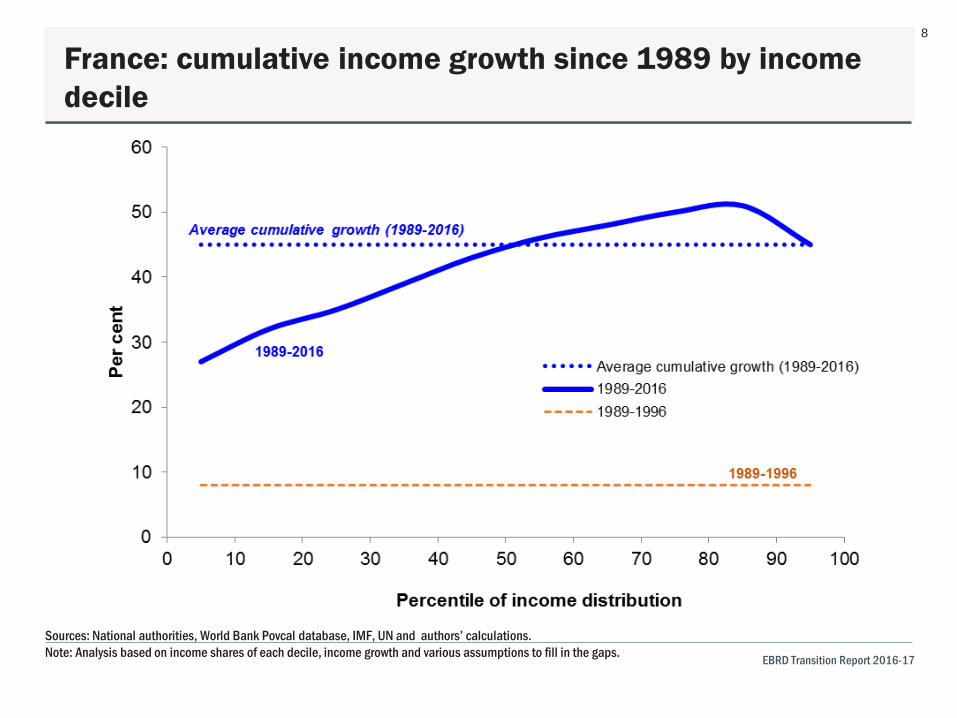
France: cumulative income growth since 1989 by income decile
Sources: National authorities, World Bank Povcal database, IMF, UN and authors’ calculations. Note: Analysis based on income shares of each decile, income growth and various assumptions to fill in the gaps.
© European Bank for Reconstruction and Development
TRANSITION REPORT 2016-17
TRANSITION FOR ALL: EQUAL OPPORTUNITIES IN AN UNEQUAL WORLD
EBRD Transition Report 2016-17
9
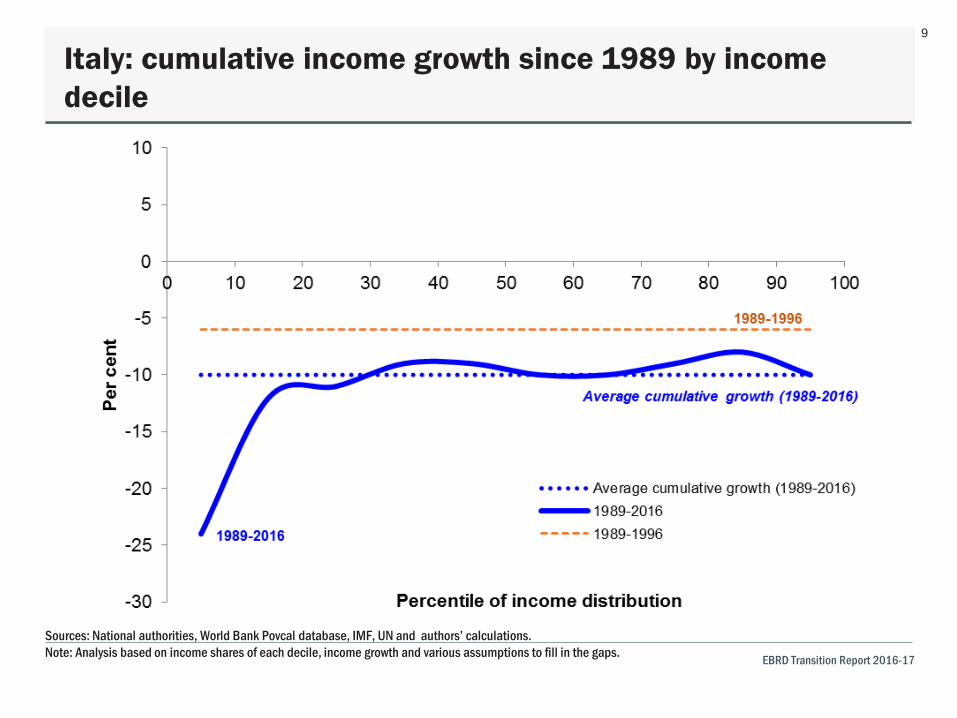
Italy: cumulative income growth since 1989 by income decile
Sources: National authorities, World Bank Povcal database, IMF, UN and authors’ calculations. Note: Analysis based on income shares of each decile, income growth and various assumptions to fill in the gaps.
© European Bank for Reconstruction and Development
TRANSITION REPORT 2016-17
TRANSITION FOR ALL: EQUAL OPPORTUNITIES IN AN UNEQUAL WORLD
EBRD Transition Report 2016-17
10
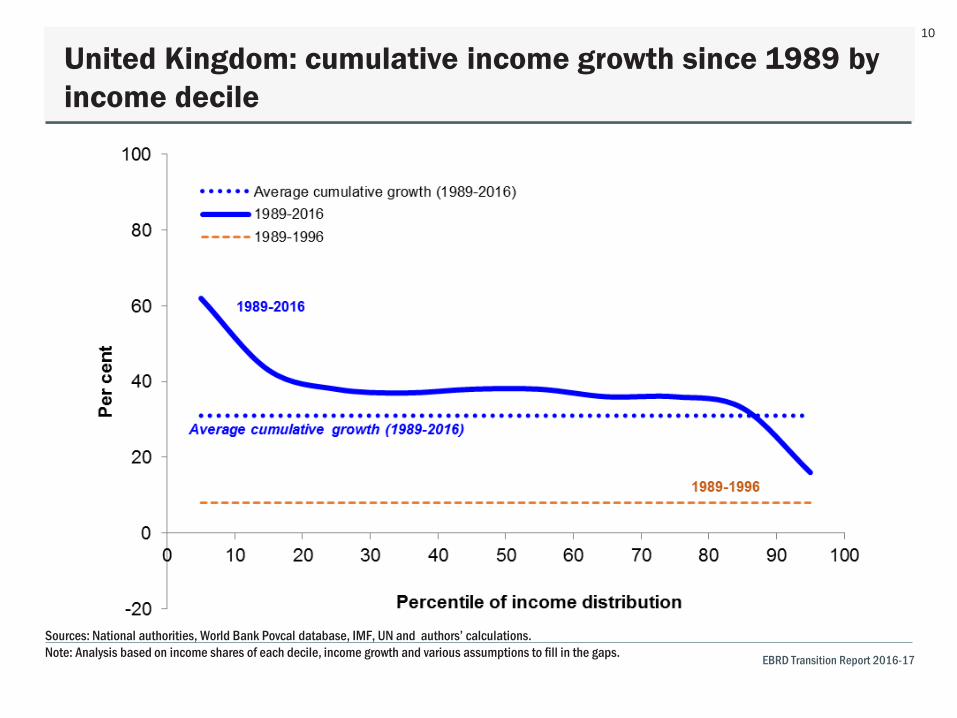
United Kingdom: cumulative income growth since 1989 by income decile
Sources: National authorities, World Bank Povcal database, IMF, UN and authors’ calculations. Note: Analysis based on income shares of each decile, income growth and various assumptions to fill in the gaps.
© European Bank for Reconstruction and Development
TRANSITION REPORT 2016-17
TRANSITION FOR ALL: EQUAL OPPORTUNITIES IN AN UNEQUAL WORLD
EBRD Transition Report 2016-17
11
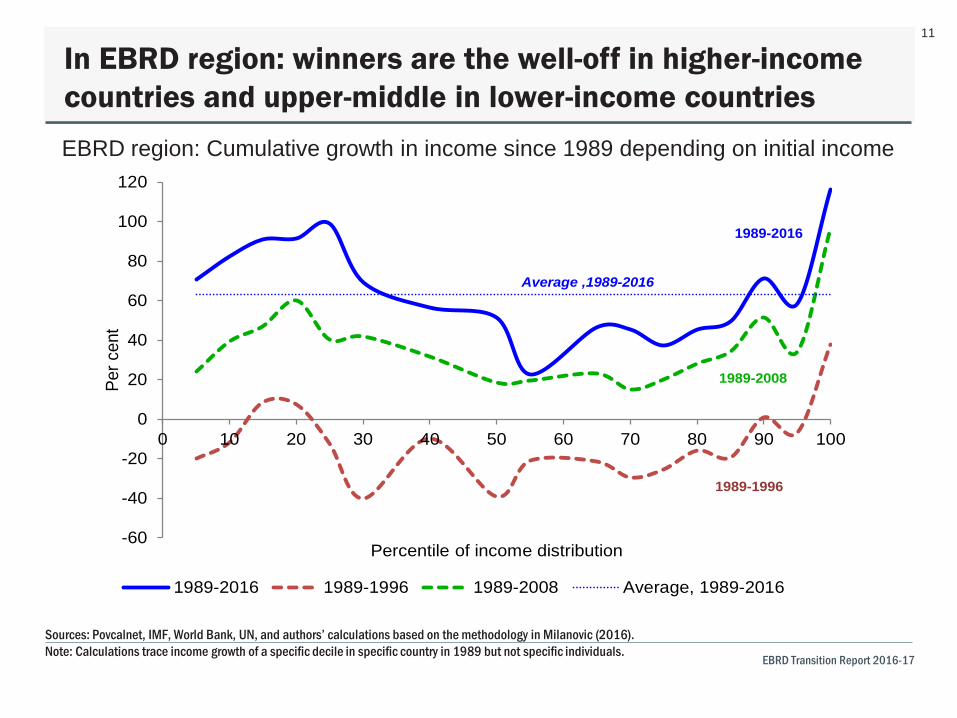
In EBRD region: winners are the well-off in higher-income countries and upper-middle in lower-income countries EBRD region: Cumulative growth in income since 1989 depending on initial income
Sources: Povcalnet, IMF, World Bank, UN, and authors’ calculations based on the methodology in Milanovic (2016). Note: Calculations trace income growth of a specific decile in specific country in 1989 but not specific individuals.
-60
-40
-20
0
20
40
60
80
100
120
0 10 20 30 40 50 60 70 80 90 100
Per c
ent
Percentile of income distribution
1989-2016 1989-1996 1989-2008 Average, 1989-2016
1989-2016
1989-2008
1989-1996
Average ,1989-2016
© European Bank for Reconstruction and Development
TRANSITION REPORT 2016-17
TRANSITION FOR ALL: EQUAL OPPORTUNITIES IN AN UNEQUAL WORLD
EBRD Transition Report 2016-17
12
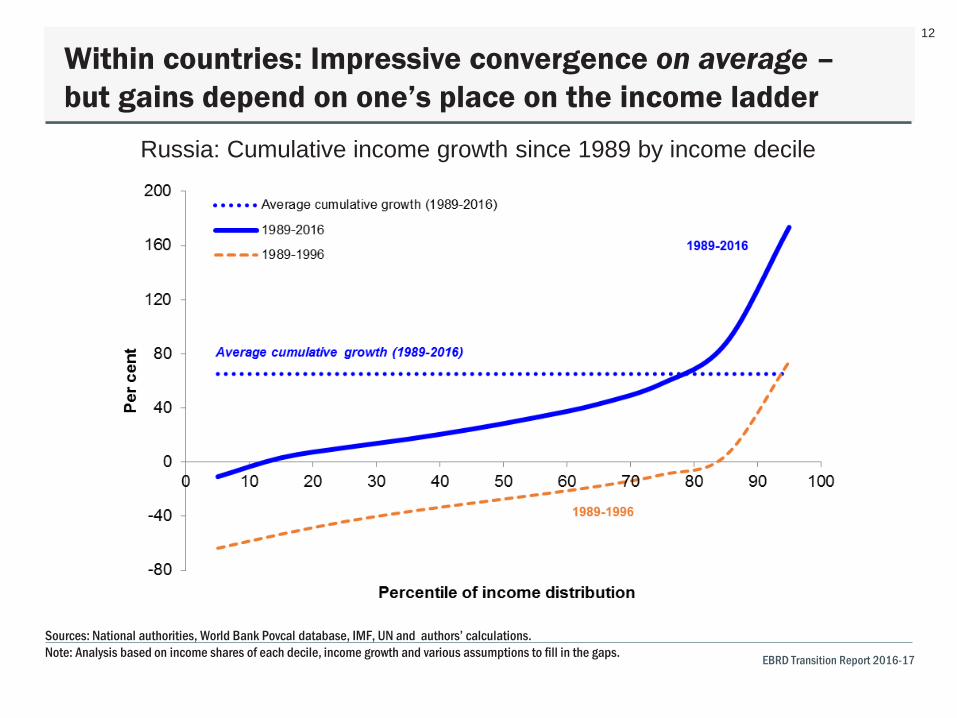
Within countries: Impressive convergence on average – but gains depend on one’s place on the income ladder
Russia: Cumulative income growth since 1989 by income decile
Sources: National authorities, World Bank Povcal database, IMF, UN and authors’ calculations. Note: Analysis based on income shares of each decile, income growth and various assumptions to fill in the gaps.
© European Bank for Reconstruction and Development
TRANSITION REPORT 2016-17
TRANSITION FOR ALL: EQUAL OPPORTUNITIES IN AN UNEQUAL WORLD
EBRD Transition Report 2016-17
13
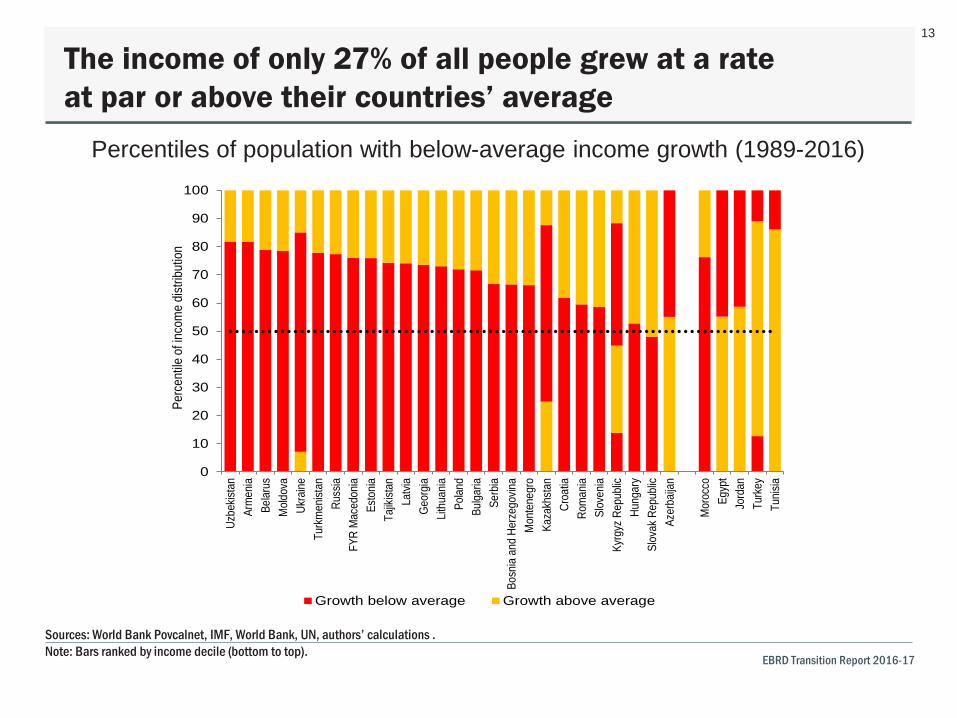
The income of only 27% of all people grew at a rate at par or above their countries’ average
Percentiles of population with below-average income growth (1989-2016)
Sources: World Bank Povcalnet, IMF, World Bank, UN, authors’ calculations . Note: Bars ranked by income decile (bottom to top).
0
10
20
30
40
50
60
70
80
90
100
Uzbe
kista
nAr
men
iaBe
larus
Mold
ova
Ukra
ineTu
rkm
enist
anRu
ssia
FYR
Mac
edon
iaEs
tonia
Tajik
istan
Latvi
aGe
orgia
Lithu
ania
Polan
dBu
lgaria
Serb
iaBo
snia
and
Herz
egov
inaM
onte
negr
oKa
zakh
stan
Croa
tiaRo
man
iaSl
oven
iaKy
rgyz
Rep
ublic
Hung
ary
Slov
ak R
epub
licAz
erba
ijan
Mor
occo
Egyp
tJo
rdan
Turk
eyTu
nisia
Perc
entile
of i
ncom
e di
strib
utio
n
Growth below average Growth above average
© European Bank for Reconstruction and Development
TRANSITION REPORT 2016-17
TRANSITION FOR ALL: EQUAL OPPORTUNITIES IN AN UNEQUAL WORLD
EBRD Transition Report 2016-17
14
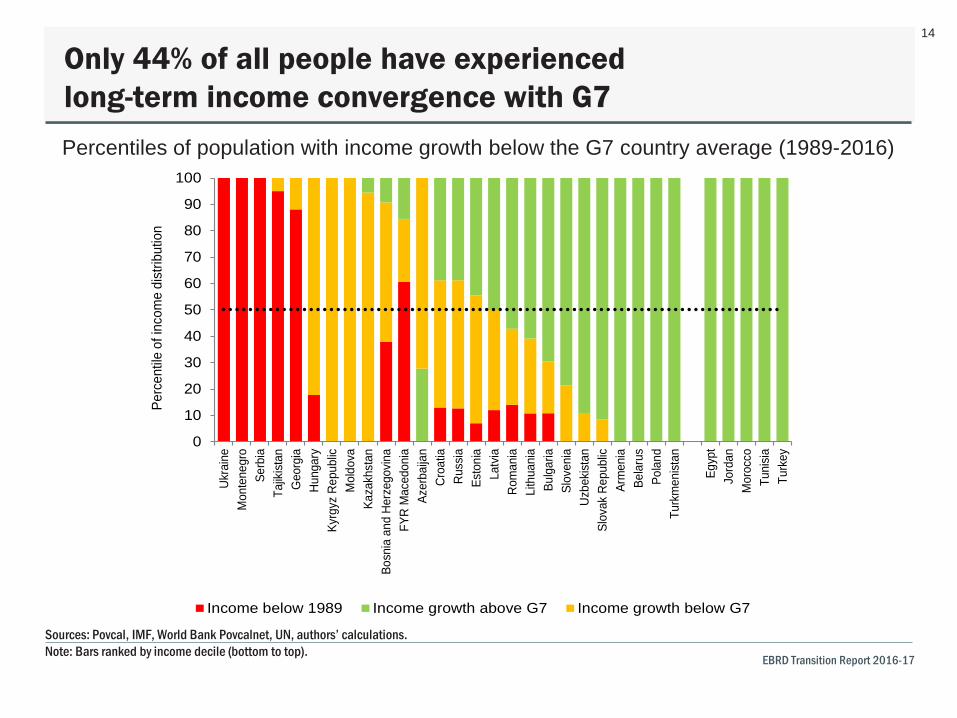
Only 44% of all people have experienced long-term income convergence with G7 Percentiles of population with income growth below the G7 country average (1989-2016)
Sources: Povcal, IMF, World Bank Povcalnet, UN, authors’ calculations. Note: Bars ranked by income decile (bottom to top).
0
10
20
30
40
50
60
70
80
90
100
Ukra
ine
Mon
tene
gro
Serb
iaTa
jikist
anG
eorg
iaHu
ngar
yKy
rgyz
Rep
ublic
Mol
dova
Kaza
khst
anBo
snia
and
Her
zego
vina
FYR
Mac
edon
iaAz
erba
ijan
Croa
tiaRu
ssia
Esto
nia
Latv
iaRo
man
iaLi
thua
nia
Bulg
aria
Slov
enia
Uzbe
kista
nSl
ovak
Rep
ublic
Arm
enia
Bela
rus
Pola
ndTu
rkm
enist
an
Egyp
tJo
rdan
Mor
occo
Tuni
siaTu
rkey
Income below 1989 Income growth above G7 Income growth below G7
Perc
entil
e of
inco
me
dist
ribut
ion
© European Bank for Reconstruction and Development
TRANSITION REPORT 2016-17
TRANSITION FOR ALL: EQUAL OPPORTUNITIES IN AN UNEQUAL WORLD
EBRD Transition Report 2016-17
15
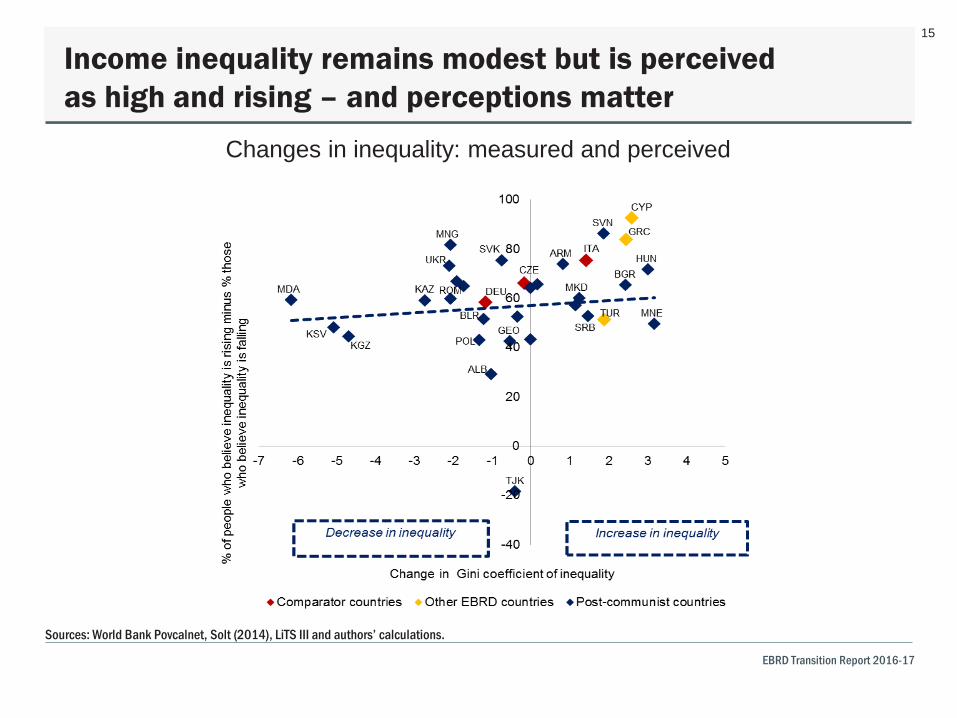
Income inequality remains modest but is perceived as high and rising – and perceptions matter
Changes in inequality: measured and perceived
Sources: World Bank Povcalnet, Solt (2014), LiTS III and authors’ calculations.
© European Bank for Reconstruction and Development
TRANSITION REPORT 2016-17
TRANSITION FOR ALL: EQUAL OPPORTUNITIES IN AN UNEQUAL WORLD
EBRD Transition Report 2016-17
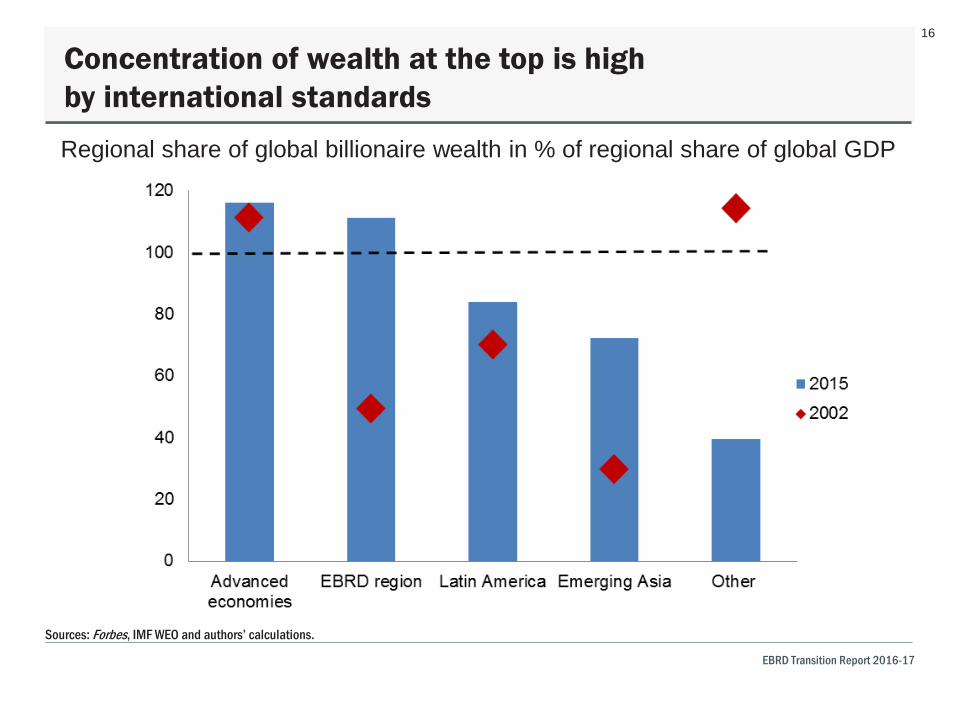
16
Concentration of wealth at the top is high by international standards
Regional share of global billionaire wealth in % of regional share of global GDP
Sources: Forbes, IMF WEO and authors’ calculations.
© European Bank for Reconstruction and Development
TRANSITION REPORT 2016-17
TRANSITION FOR ALL: EQUAL OPPORTUNITIES IN AN UNEQUAL WORLD
EBRD Transition Report 2016-17
17
And driven mostly by commodity rents, rather than innovation or competitive manufacturing
Sources of billionaires’ wealth, % of total
Sources: Forbes and authors’ calculations.
© European Bank for Reconstruction and Development
TRANSITION REPORT 2016-17
TRANSITION FOR ALL: EQUAL OPPORTUNITIES IN AN UNEQUAL WORLD
EBRD Transition Report 2016-17
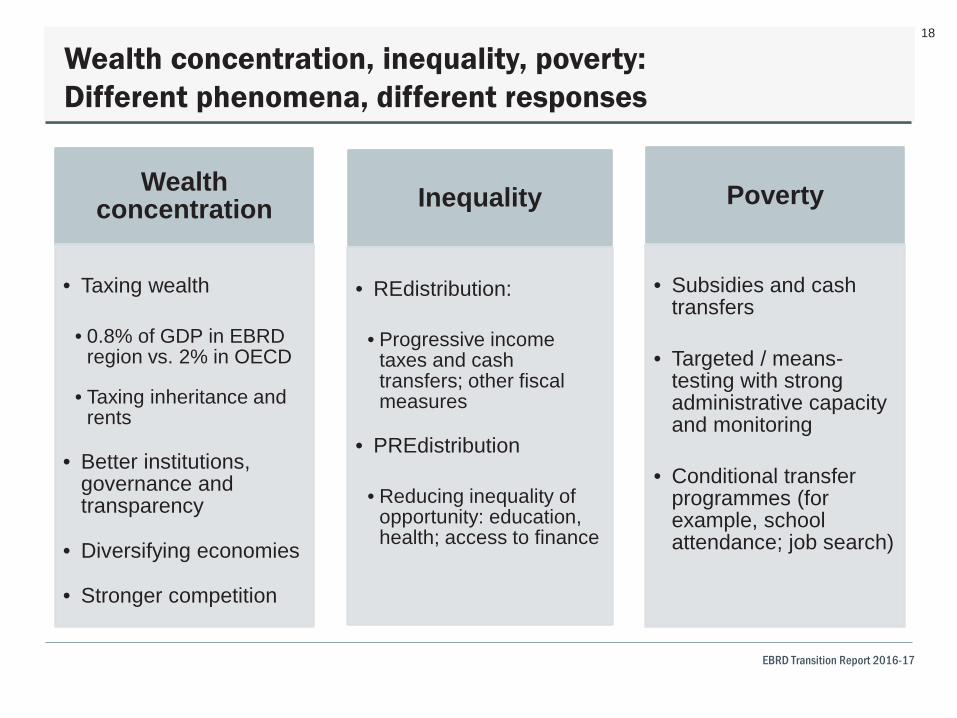
18
Wealth concentration, inequality, poverty: Different phenomena, different responses
Wealth concentration
• Taxing wealth
• 0.8% of GDP in EBRD
region vs. 2% in OECD • Taxing inheritance and
rents
• Better institutions, governance and transparency
• Diversifying economies
• Stronger competition
Inequality
• REdistribution:
• Progressive income
taxes and cash transfers; other fiscal measures
• PREdistribution
• Reducing inequality of
opportunity: education, health; access to finance
Poverty
• Subsidies and cash
transfers
• Targeted / means-testing with strong administrative capacity and monitoring
• Conditional transfer programmes (for example, school attendance; job search)
© European Bank for Reconstruction and Development
TRANSITION REPORT 2016-17
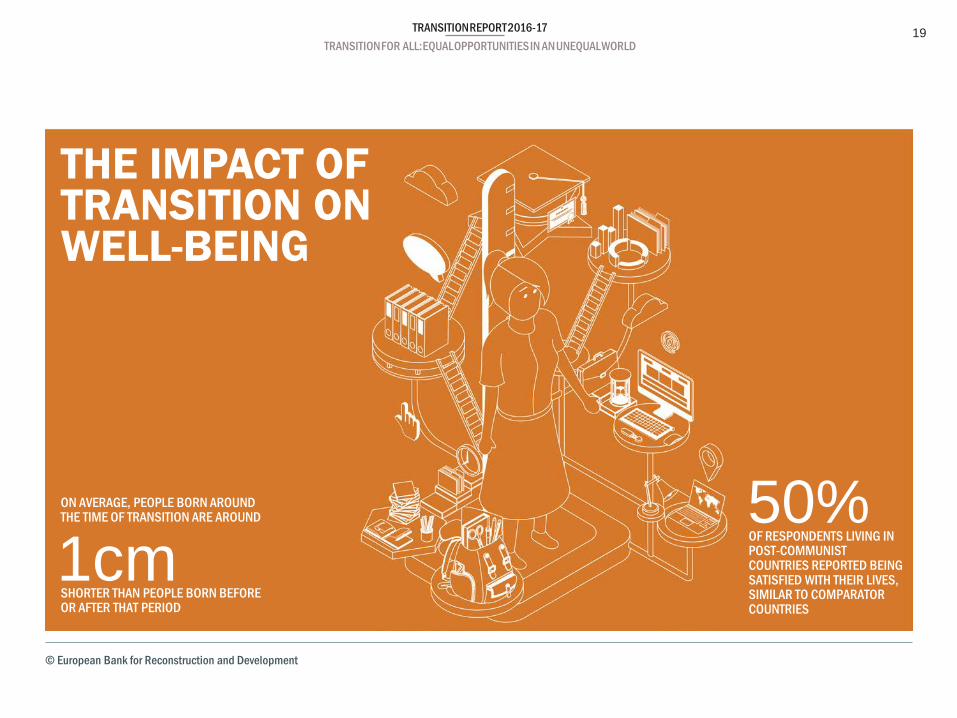
TRANSITION FOR ALL: EQUAL OPPORTUNITIES IN AN UNEQUAL WORLD 19
THE IMPACT OF TRANSITION ON WELL-BEING
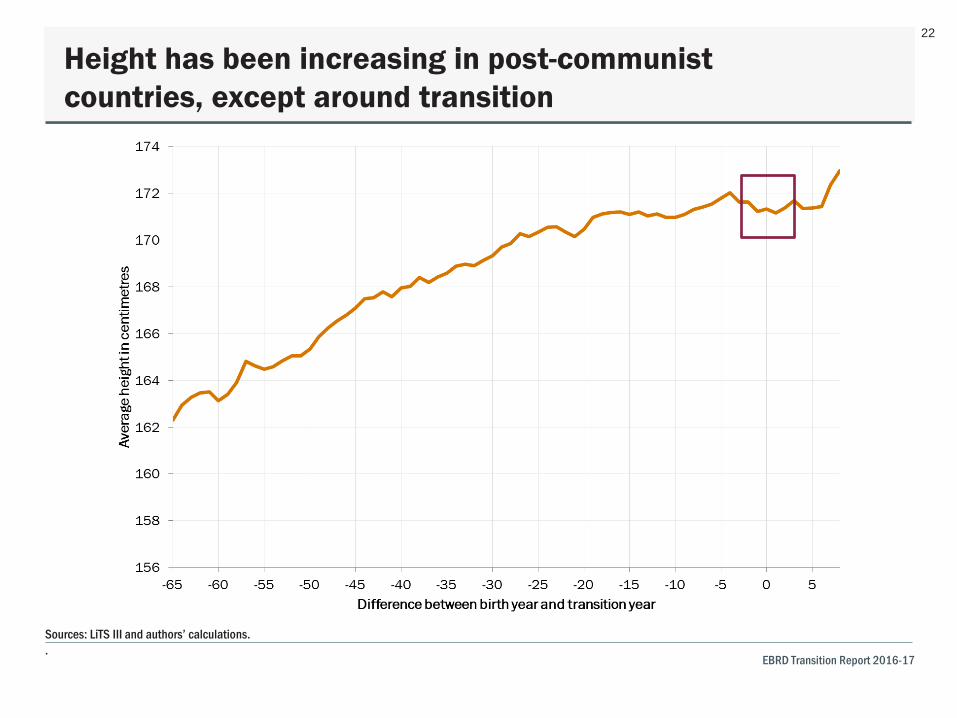
1cm SHORTER THAN PEOPLE BORN BEFORE OR AFTER THAT PERIOD
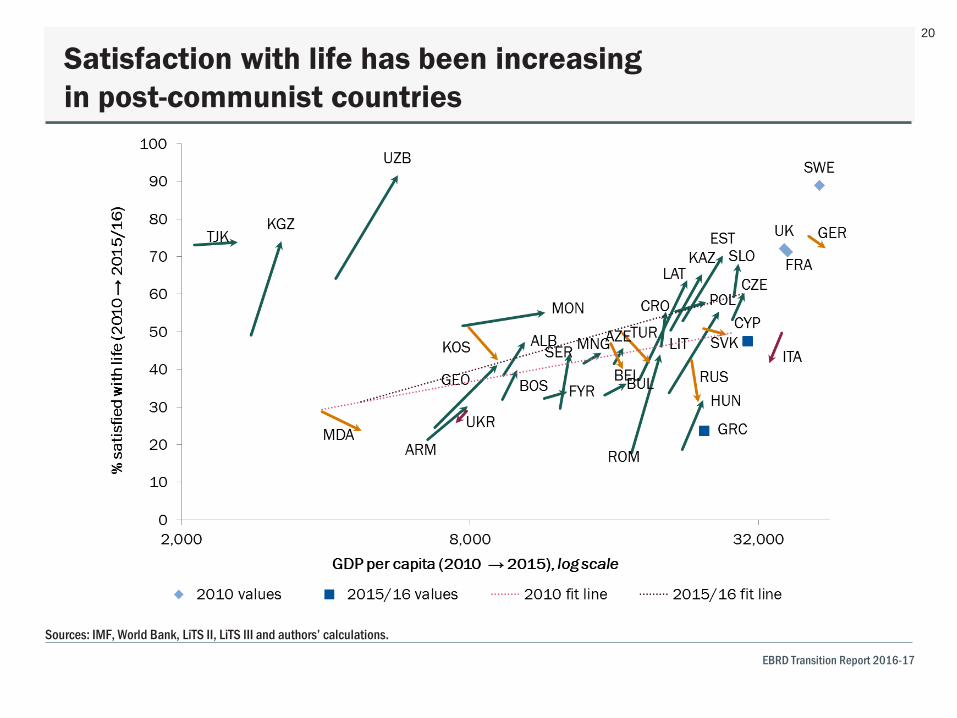
50% OF RESPONDENTS LIVING IN POST-COMMUNIST COUNTRIES REPORTED BEING SATISFIED WITH THEIR LIVES, SIMILAR TO COMPARATOR COUNTRIES
ON AVERAGE, PEOPLE BORN AROUND THE TIME OF TRANSITION ARE AROUND
© European Bank for Reconstruction and Development
TRANSITION REPORT 2016-17
TRANSITION FOR ALL: EQUAL OPPORTUNITIES IN AN UNEQUAL WORLD
EBRD Transition Report 2016-17
20
Satisfaction with life has been increasing in post-communist countries
Sources: IMF, World Bank, LiTS II, LiTS III and authors’ calculations.
© European Bank for Reconstruction and Development
TRANSITION REPORT 2016-17
TRANSITION FOR ALL: EQUAL OPPORTUNITIES IN AN UNEQUAL WORLD
EBRD Transition Report 2016-17
21
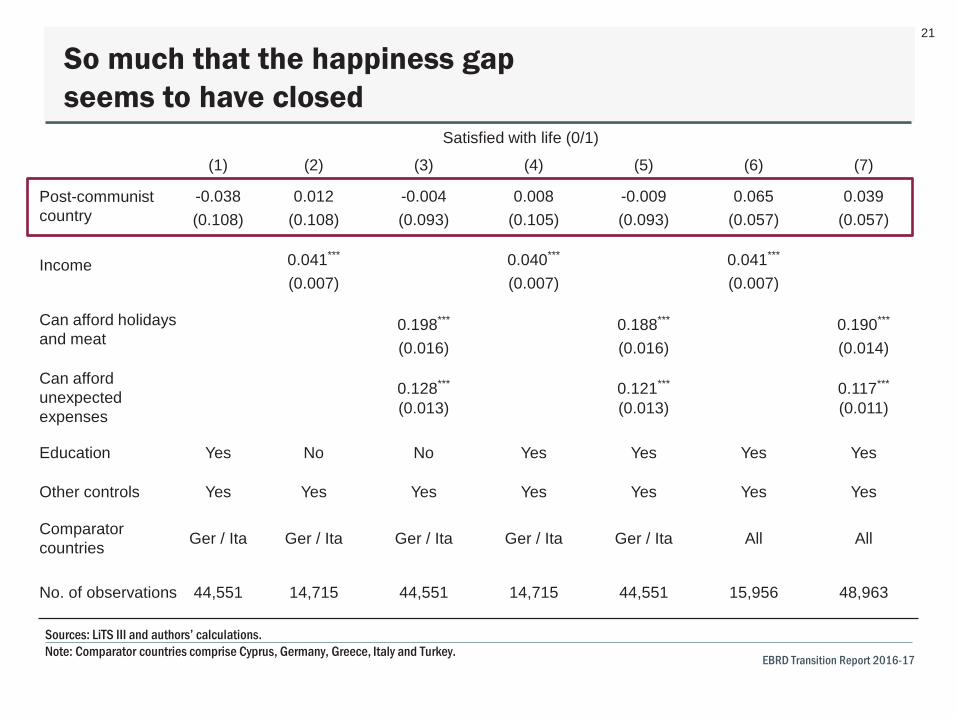
So much that the happiness gap seems to have closed
Sources: LiTS III and authors’ calculations. Note: Comparator countries comprise Cyprus, Germany, Greece, Italy and Turkey.
Satisfied with life (0/1)
(1) (2) (3) (4) (5) (6) (7)
Post-communist country
-0.038 0.012 -0.004 0.008 -0.009 0.065 0.039 (0.108) (0.108) (0.093) (0.105) (0.093) (0.057) (0.057)
Income 0.041*** 0.040*** 0.041*** (0.007) (0.007) (0.007)
Can afford holidays and meat
0.198*** 0.188*** 0.190*** (0.016) (0.016) (0.014)
Can afford unexpected expenses
0.128*** 0.121*** 0.117*** (0.013) (0.013) (0.011)
Education Yes No No Yes Yes Yes Yes
Other controls Yes Yes Yes Yes Yes Yes Yes
Comparator countries Ger / Ita Ger / Ita Ger / Ita Ger / Ita Ger / Ita All All
No. of observations 44,551 14,715 44,551 14,715 44,551 15,956 48,963
© European Bank for Reconstruction and Development
TRANSITION REPORT 2016-17
TRANSITION FOR ALL: EQUAL OPPORTUNITIES IN AN UNEQUAL WORLD
EBRD Transition Report 2016-17
22
Height has been increasing in post-communist countries, except around transition
Sources: LiTS III and authors’ calculations. .
© European Bank for Reconstruction and Development
TRANSITION REPORT 2016-17
TRANSITION FOR ALL: EQUAL OPPORTUNITIES IN AN UNEQUAL WORLD
EBRD Transition Report 2016-17
23
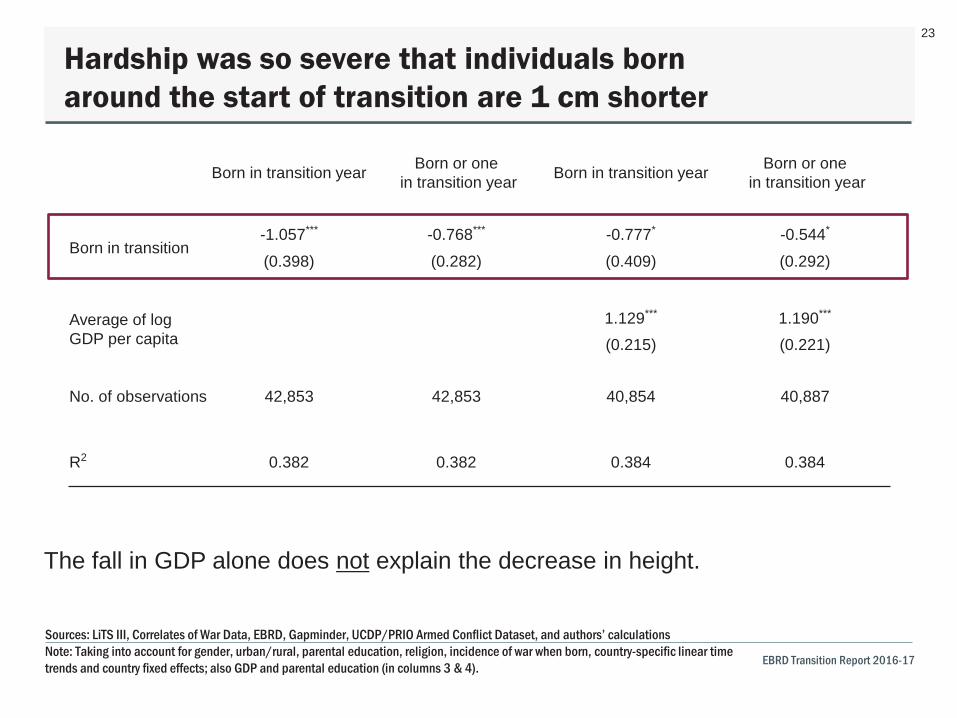
Hardship was so severe that individuals born around the start of transition are 1 cm shorter
Sources: LiTS III, Correlates of War Data, EBRD, Gapminder, UCDP/PRIO Armed Conflict Dataset, and authors’ calculations Note: Taking into account for gender, urban/rural, parental education, religion, incidence of war when born, country-specific linear time trends and country fixed effects; also GDP and parental education (in columns 3 & 4).
Born in transition year Born or one in transition year Born in transition year Born or one
in transition year
Born in transition -1.057*** -0.768*** -0.777* -0.544*
(0.398) (0.282) (0.409) (0.292)
Average of log GDP per capita
1.129*** 1.190***
(0.215) (0.221)
No. of observations 42,853 42,853 40,854 40,887
R2 0.382 0.382 0.384 0.384
The fall in GDP alone does not explain the decrease in height.
© European Bank for Reconstruction and Development
TRANSITION REPORT 2016-17
TRANSITION FOR ALL: EQUAL OPPORTUNITIES IN AN UNEQUAL WORLD
EBRD Transition Report 2016-17
24
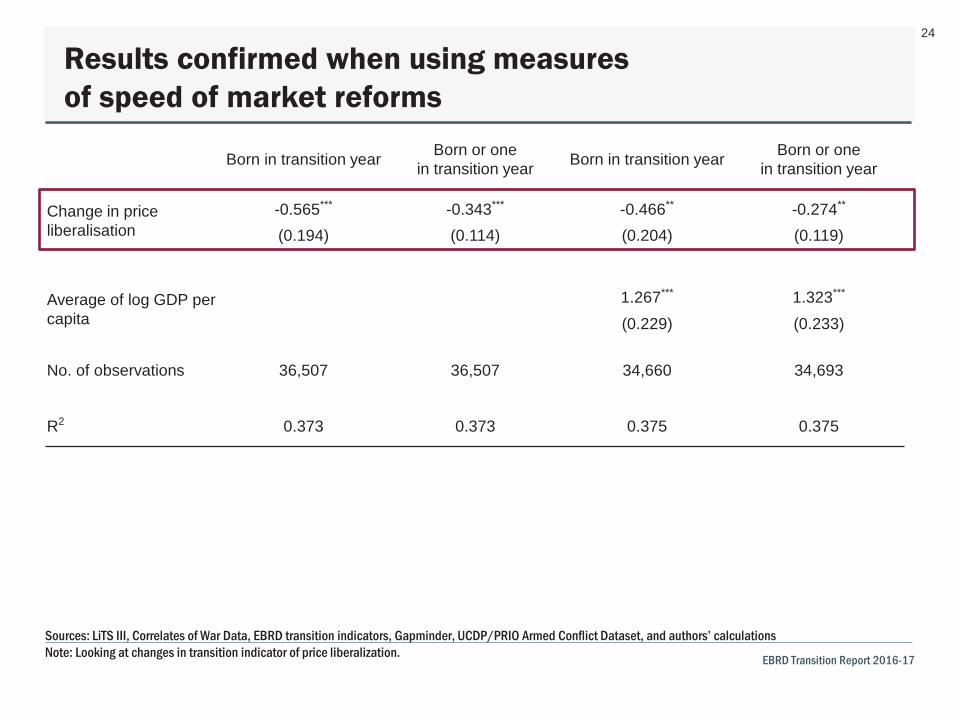
Results confirmed when using measures of speed of market reforms
Sources: LiTS III, Correlates of War Data, EBRD transition indicators, Gapminder, UCDP/PRIO Armed Conflict Dataset, and authors’ calculations Note: Looking at changes in transition indicator of price liberalization.
Born in transition year Born or one in transition year Born in transition year Born or one
in transition year
Change in price liberalisation
-0.565*** -0.343*** -0.466** -0.274**
(0.194) (0.114) (0.204) (0.119)
Average of log GDP per capita
1.267*** 1.323***
(0.229) (0.233)
No. of observations 36,507 36,507 34,660 34,693
R2 0.373 0.373 0.375 0.375
© European Bank for Reconstruction and Development
TRANSITION REPORT 2016-17
TRANSITION FOR ALL: EQUAL OPPORTUNITIES IN AN UNEQUAL WORLD
EBRD Transition Report 2016-17
25
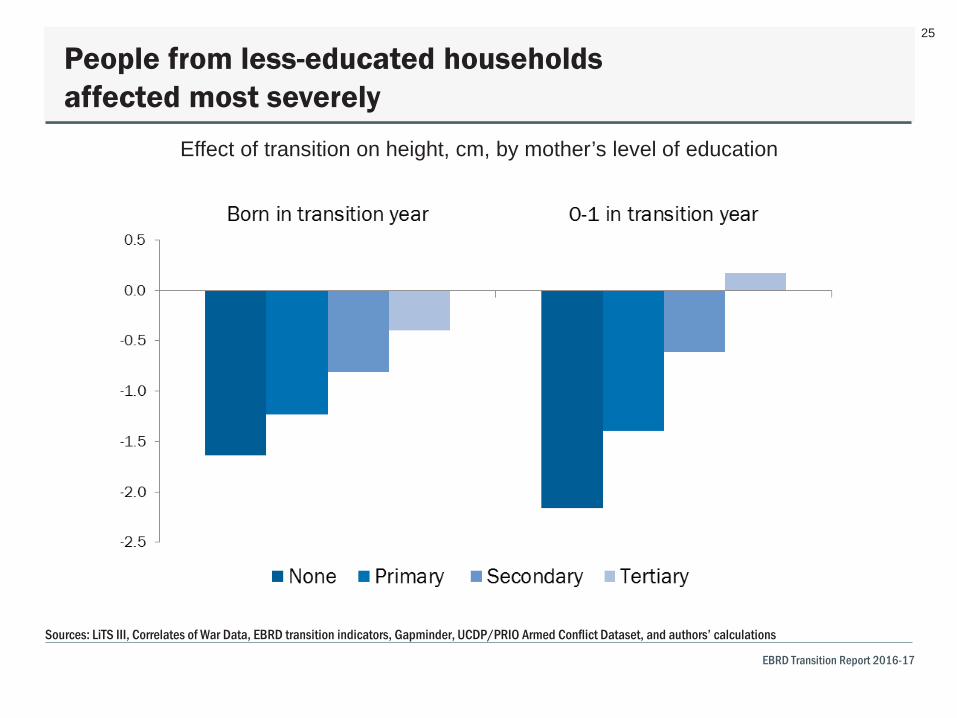
People from less-educated households affected most severely
Sources: LiTS III, Correlates of War Data, EBRD transition indicators, Gapminder, UCDP/PRIO Armed Conflict Dataset, and authors’ calculations
Effect of transition on height, cm, by mother’s level of education
© European Bank for Reconstruction and Development
TRANSITION REPORT 2016-17
TRANSITION FOR ALL: EQUAL OPPORTUNITIES IN AN UNEQUAL WORLD
EBRD Transition Report 2016-17
26
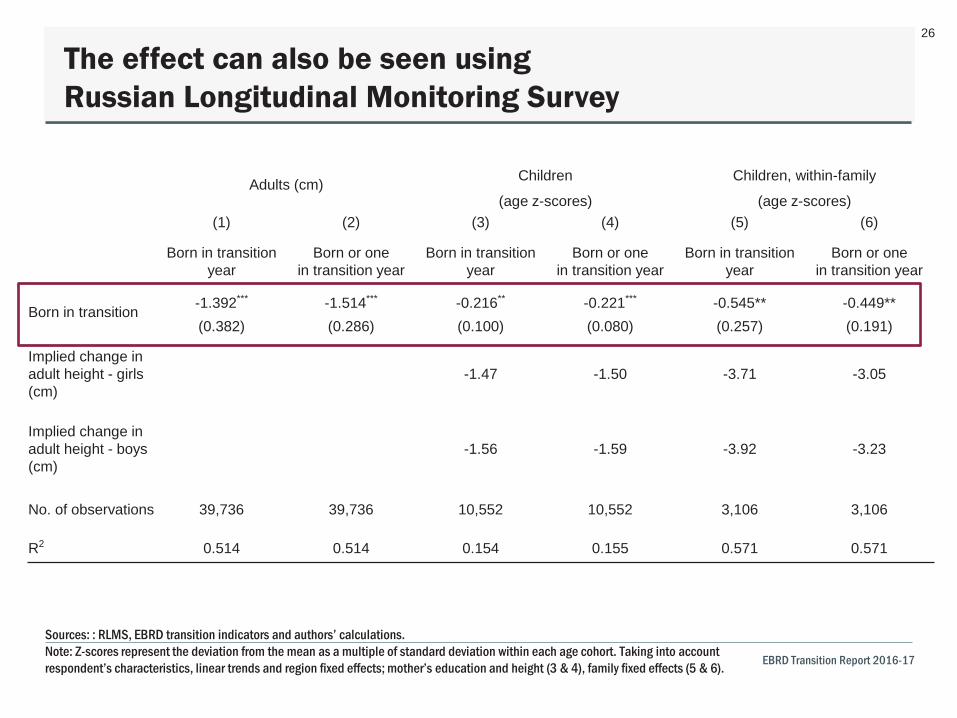
The effect can also be seen using Russian Longitudinal Monitoring Survey
Sources: : RLMS, EBRD transition indicators and authors’ calculations. Note: Z-scores represent the deviation from the mean as a multiple of standard deviation within each age cohort. Taking into account respondent’s characteristics, linear trends and region fixed effects; mother’s education and height (3 & 4), family fixed effects (5 & 6).
Adults (cm) Children Children, within-family
(age z-scores) (age z-scores) (1) (2) (3) (4) (5) (6)
Born in transition year
Born or one in transition year
Born in transition year
Born or one in transition year
Born in transition year
Born or one in transition year
Born in transition -1.392*** -1.514*** -0.216** -0.221*** -0.545** -0.449** (0.382) (0.286) (0.100) (0.080) (0.257) (0.191)
Implied change in adult height - girls (cm)
-1.47 -1.50 -3.71 -3.05
Implied change in adult height - boys (cm)
-1.56 -1.59 -3.92 -3.23
No. of observations 39,736 39,736 10,552 10,552 3,106 3,106
R2 0.514 0.514 0.154 0.155 0.571 0.571
© European Bank for Reconstruction and Development
TRANSITION REPORT 2016-17
TRANSITION FOR ALL: EQUAL OPPORTUNITIES IN AN UNEQUAL WORLD
EBRD Transition Report 2016-17
27
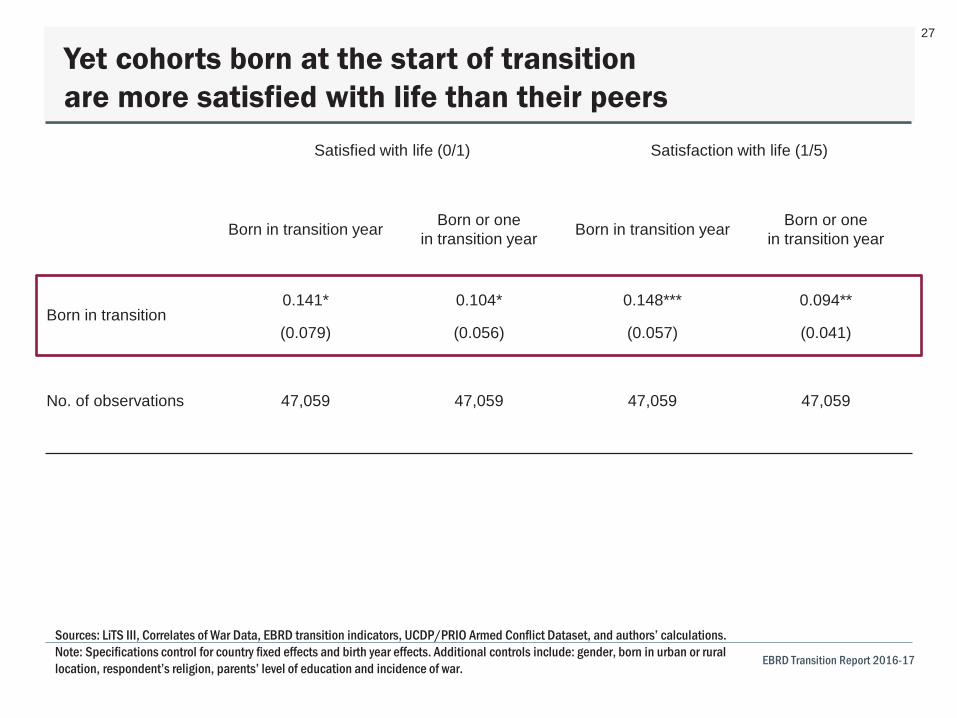
Yet cohorts born at the start of transition are more satisfied with life than their peers
Sources: LiTS III, Correlates of War Data, EBRD transition indicators, UCDP/PRIO Armed Conflict Dataset, and authors’ calculations. Note: Specifications control for country fixed effects and birth year effects. Additional controls include: gender, born in urban or rural location, respondent’s religion, parents’ level of education and incidence of war.
Satisfied with life (0/1) Satisfaction with life (1/5)
Born in transition year Born or one in transition year Born in transition year Born or one
in transition year
Born in transition 0.141* 0.104* 0.148*** 0.094**
(0.079) (0.056) (0.057) (0.041)
No. of observations 47,059 47,059 47,059 47,059
© European Bank for Reconstruction and Development
TRANSITION REPORT 2016-17
TRANSITION FOR ALL: EQUAL OPPORTUNITIES IN AN UNEQUAL WORLD
EBRD Transition Report 2016-17
28
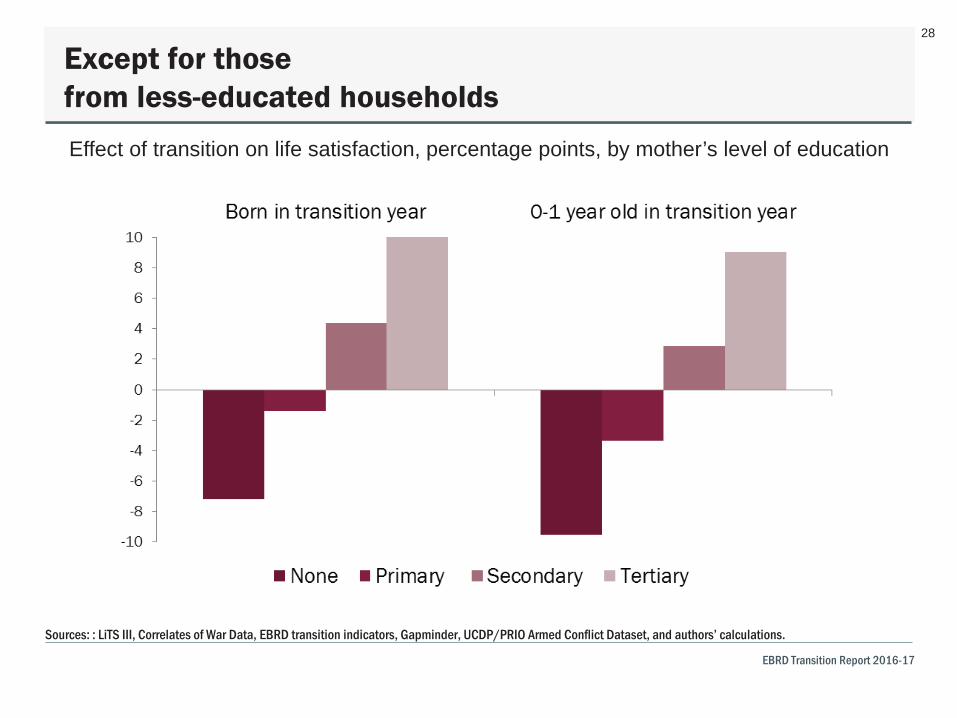
Except for those from less-educated households
Sources: : LiTS III, Correlates of War Data, EBRD transition indicators, Gapminder, UCDP/PRIO Armed Conflict Dataset, and authors’ calculations.
Effect of transition on life satisfaction, percentage points, by mother’s level of education
© European Bank for Reconstruction and Development
TRANSITION REPORT 2016-17
TRANSITION FOR ALL: EQUAL OPPORTUNITIES IN AN UNEQUAL WORLD
EBRD Transition Report 2016-17
29
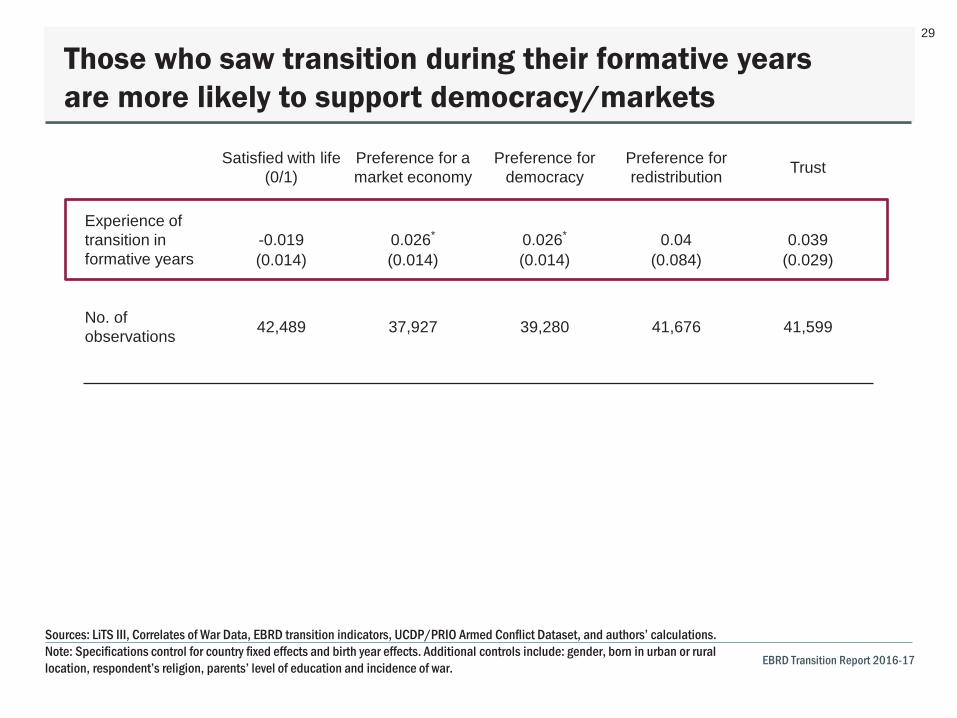
Those who saw transition during their formative years are more likely to support democracy/markets
Sources: LiTS III, Correlates of War Data, EBRD transition indicators, UCDP/PRIO Armed Conflict Dataset, and authors’ calculations. Note: Specifications control for country fixed effects and birth year effects. Additional controls include: gender, born in urban or rural location, respondent’s religion, parents’ level of education and incidence of war.
Satisfied with life (0/1)
Preference for a market economy
Preference for democracy
Preference for redistribution Trust
Experience of transition in formative years
-0.019 0.026* 0.026* 0.04 0.039 (0.014) (0.014) (0.014) (0.084) (0.029)
No. of observations 42,489 37,927 39,280 41,676 41,599
© European Bank for Reconstruction and Development
TRANSITION REPORT 2016-17
TRANSITION FOR ALL: EQUAL OPPORTUNITIES IN AN UNEQUAL WORLD 30
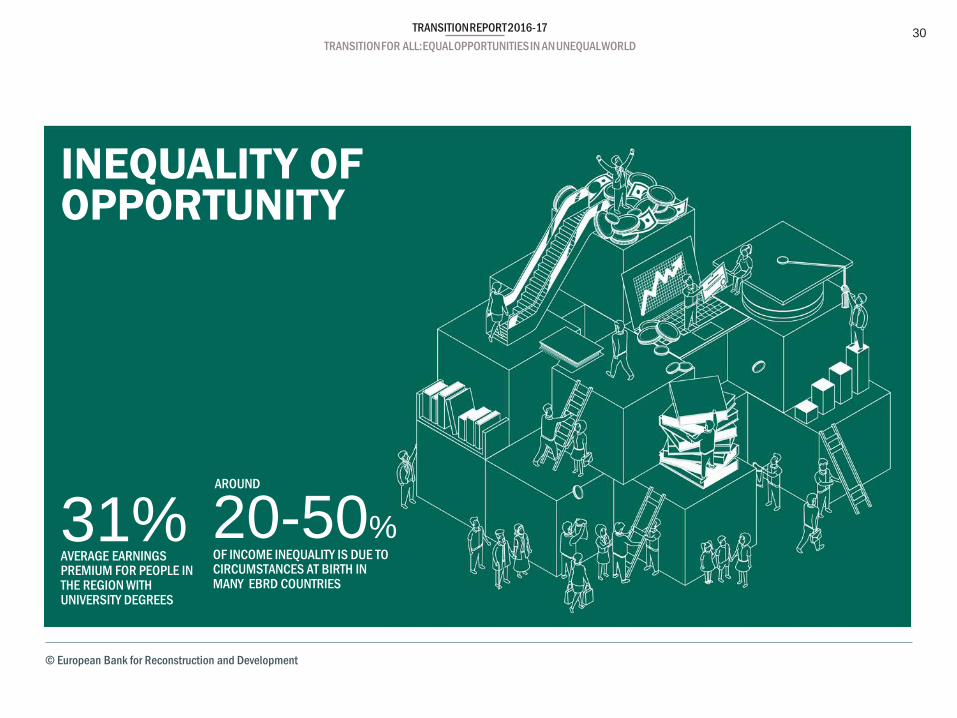
INEQUALITY OF OPPORTUNITY
31% AVERAGE EARNINGS PREMIUM FOR PEOPLE IN THE REGION WITH UNIVERSITY DEGREES
20-50% OF INCOME INEQUALITY IS DUE TO CIRCUMSTANCES AT BIRTH IN MANY EBRD COUNTRIES
AROUND
© European Bank for Reconstruction and Development
TRANSITION REPORT 2016-17
TRANSITION FOR ALL: EQUAL OPPORTUNITIES IN AN UNEQUAL WORLD
EBRD Transition Report 2016-17
31
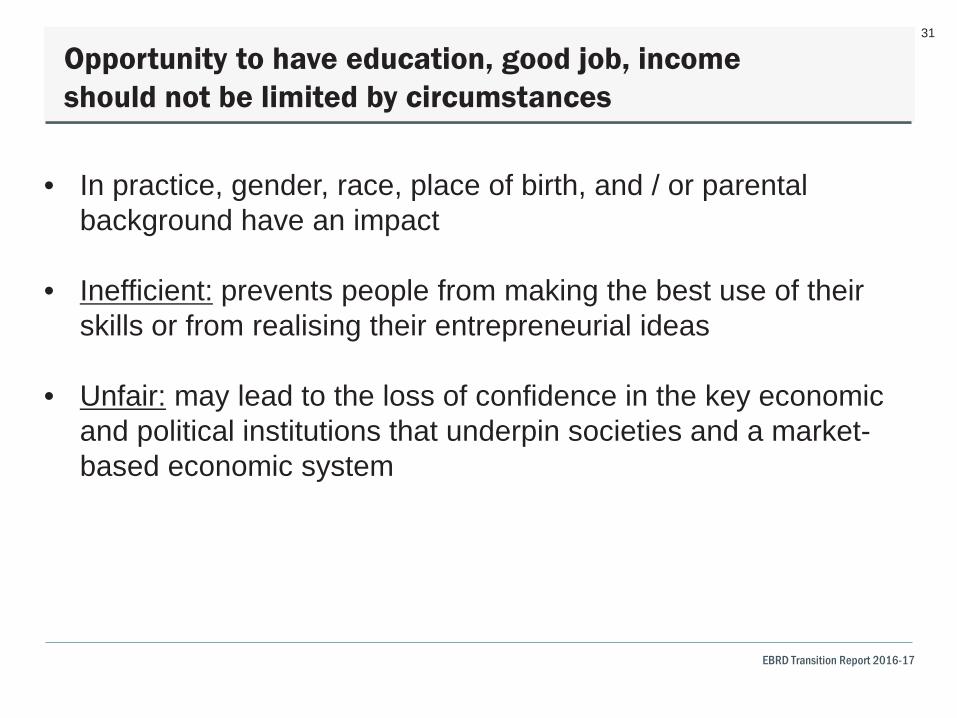
• In practice, gender, race, place of birth, and / or parental background have an impact
• Inefficient: prevents people from making the best use of their skills or from realising their entrepreneurial ideas
• Unfair: may lead to the loss of confidence in the key economic and political institutions that underpin societies and a market-based economic system
Opportunity to have education, good job, income should not be limited by circumstances
© European Bank for Reconstruction and Development
TRANSITION REPORT 2016-17
TRANSITION FOR ALL: EQUAL OPPORTUNITIES IN AN UNEQUAL WORLD
EBRD Transition Report 2016-17
32
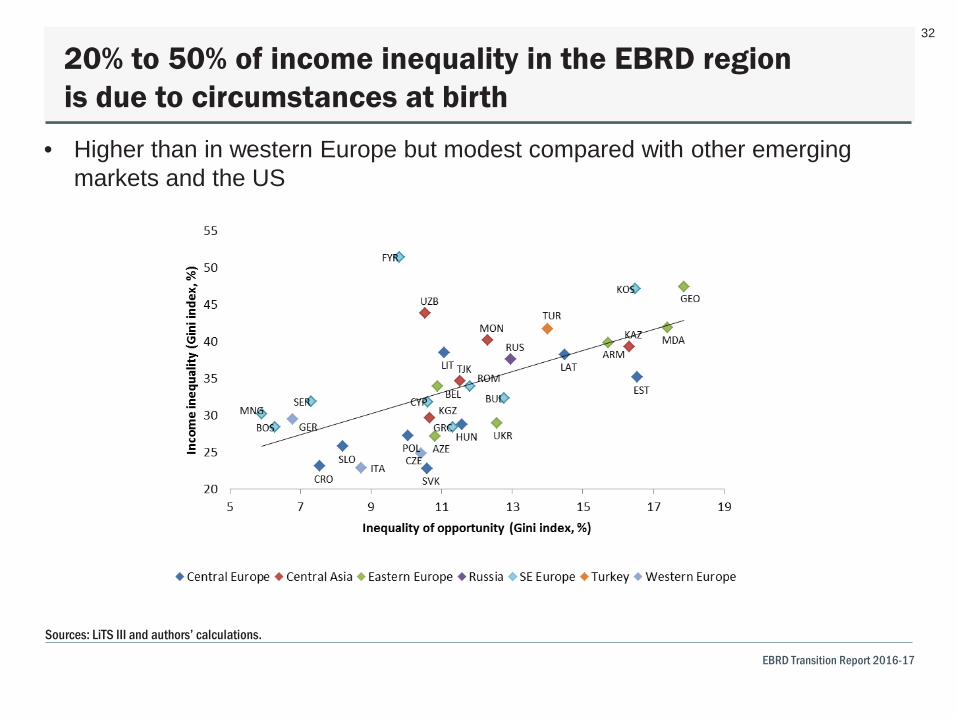
20% to 50% of income inequality in the EBRD region is due to circumstances at birth
• Higher than in western Europe but modest compared with other emerging markets and the US
Sources: LiTS III and authors’ calculations.
© European Bank for Reconstruction and Development
TRANSITION REPORT 2016-17
TRANSITION FOR ALL: EQUAL OPPORTUNITIES IN AN UNEQUAL WORLD
EBRD Transition Report 2016-17
33
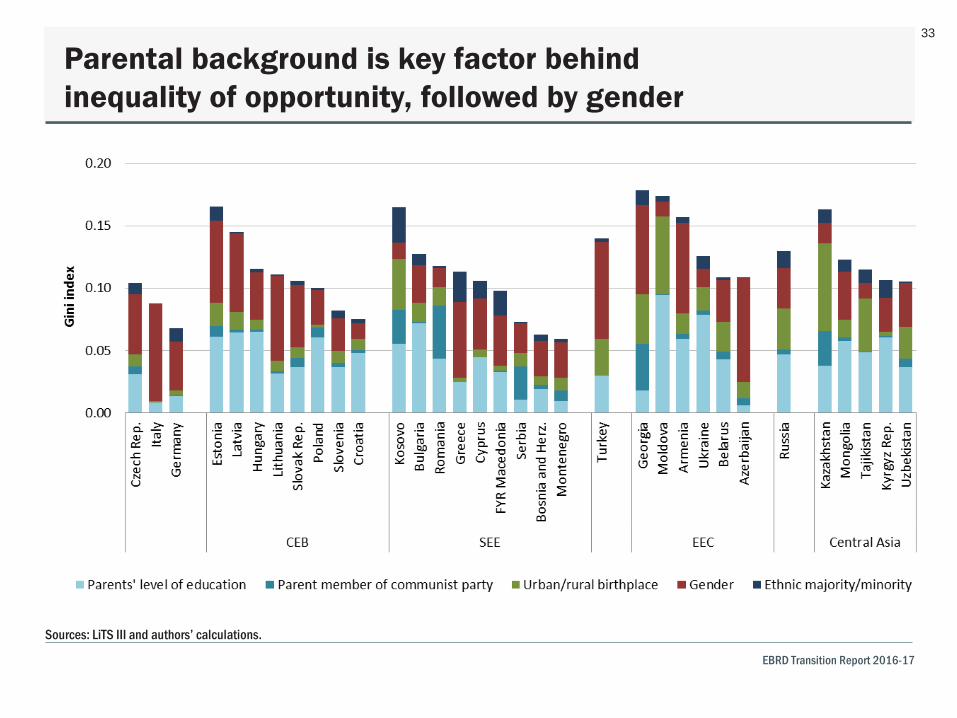
Parental background is key factor behind inequality of opportunity, followed by gender
Sources: LiTS III and authors’ calculations.
© European Bank for Reconstruction and Development
TRANSITION REPORT 2016-17
TRANSITION FOR ALL: EQUAL OPPORTUNITIES IN AN UNEQUAL WORLD
EBRD Transition Report 2016-17
34
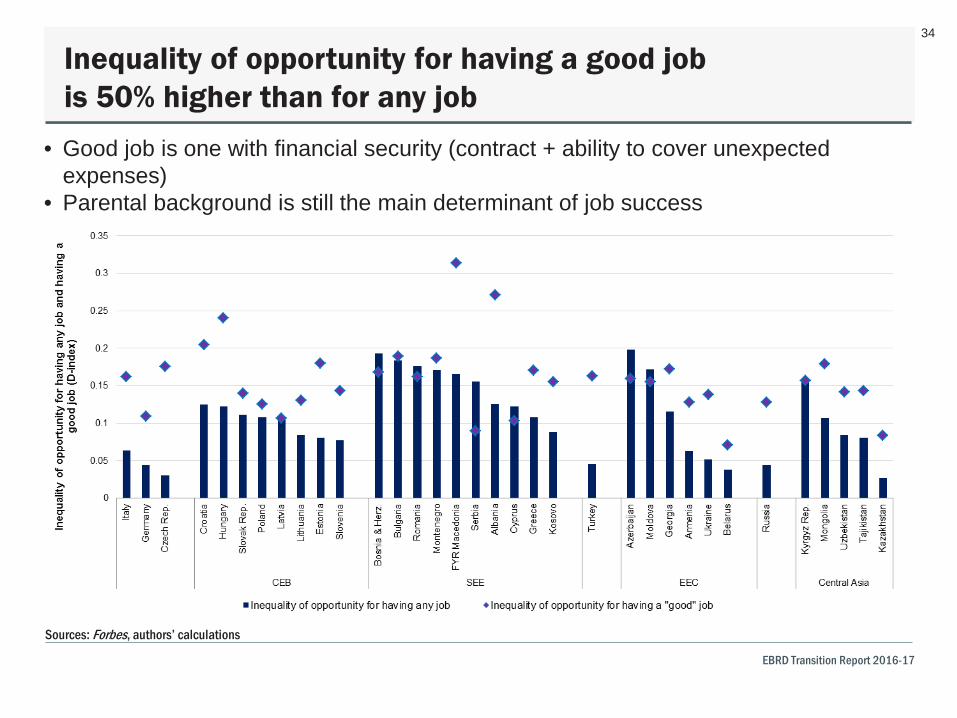
Inequality of opportunity for having a good job is 50% higher than for any job
• Good job is one with financial security (contract + ability to cover unexpected expenses)
• Parental background is still the main determinant of job success
Sources: Forbes, authors’ calculations
© European Bank for Reconstruction and Development
TRANSITION REPORT 2016-17
TRANSITION FOR ALL: EQUAL OPPORTUNITIES IN AN UNEQUAL WORLD
EBRD Transition Report 2016-17
35
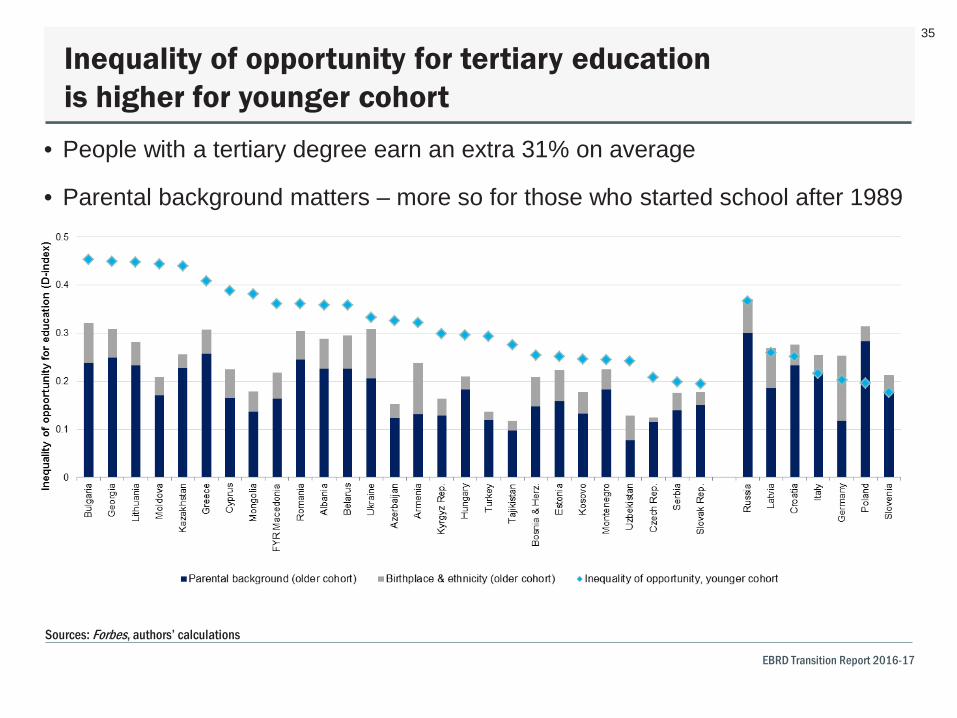
Inequality of opportunity for tertiary education is higher for younger cohort
• People with a tertiary degree earn an extra 31% on average
• Parental background matters – more so for those who started school after 1989
Sources: Forbes, authors’ calculations
© European Bank for Reconstruction and Development
TRANSITION REPORT 2016-17
TRANSITION FOR ALL: EQUAL OPPORTUNITIES IN AN UNEQUAL WORLD
EBRD Transition Report 2016-17
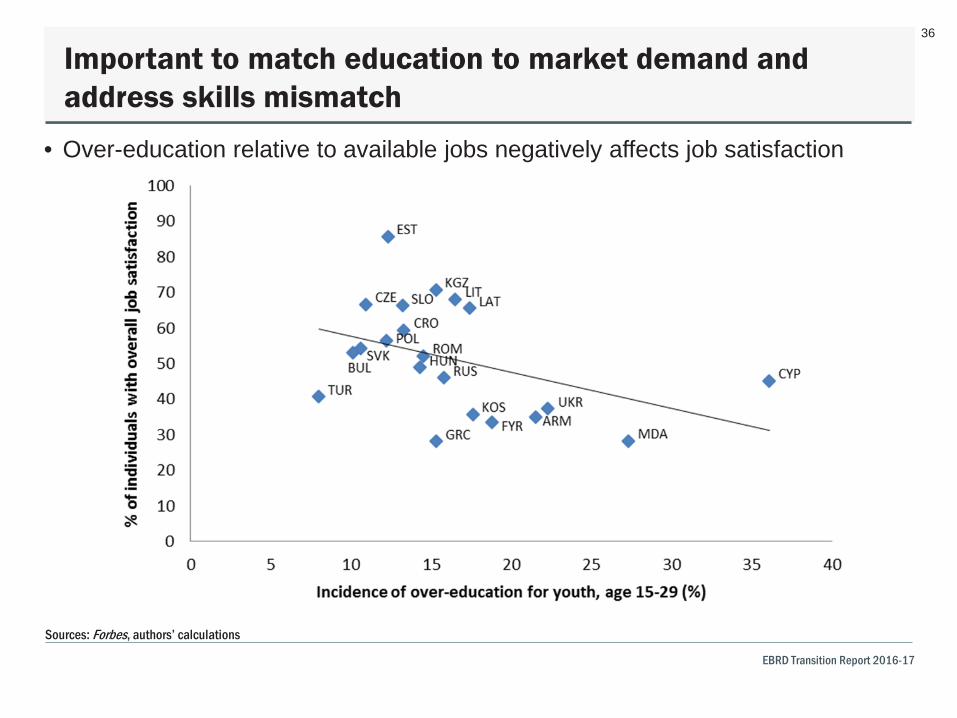
36
Important to match education to market demand and address skills mismatch
• Over-education relative to available jobs negatively affects job satisfaction
Sources: Forbes, authors’ calculations
© European Bank for Reconstruction and Development
TRANSITION REPORT 2016-17
TRANSITION FOR ALL: EQUAL OPPORTUNITIES IN AN UNEQUAL WORLD
EBRD Transition Report 2016-17
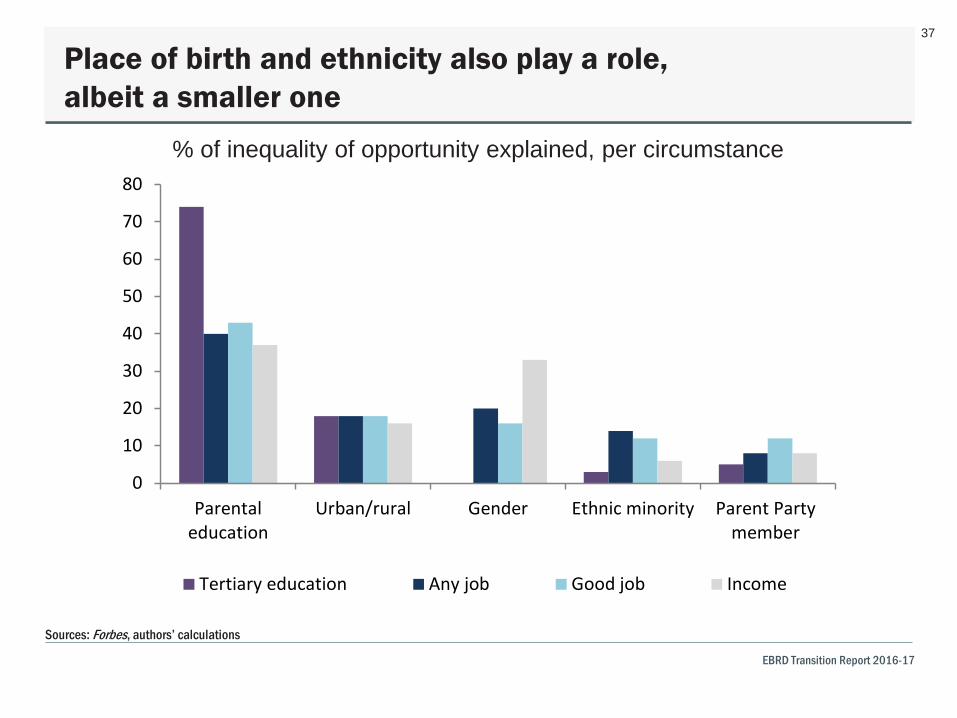
37
Place of birth and ethnicity also play a role, albeit a smaller one
% of inequality of opportunity explained, per circumstance
Sources: Forbes, authors’ calculations
0
10
20
30
40
50
60
70
80
Parentaleducation
Urban/rural Gender Ethnic minority Parent Partymember
Tertiary education Any job Good job Income
© European Bank for Reconstruction and Development
TRANSITION REPORT 2016-17
TRANSITION FOR ALL: EQUAL OPPORTUNITIES IN AN UNEQUAL WORLD
EBRD Transition Report 2016-17
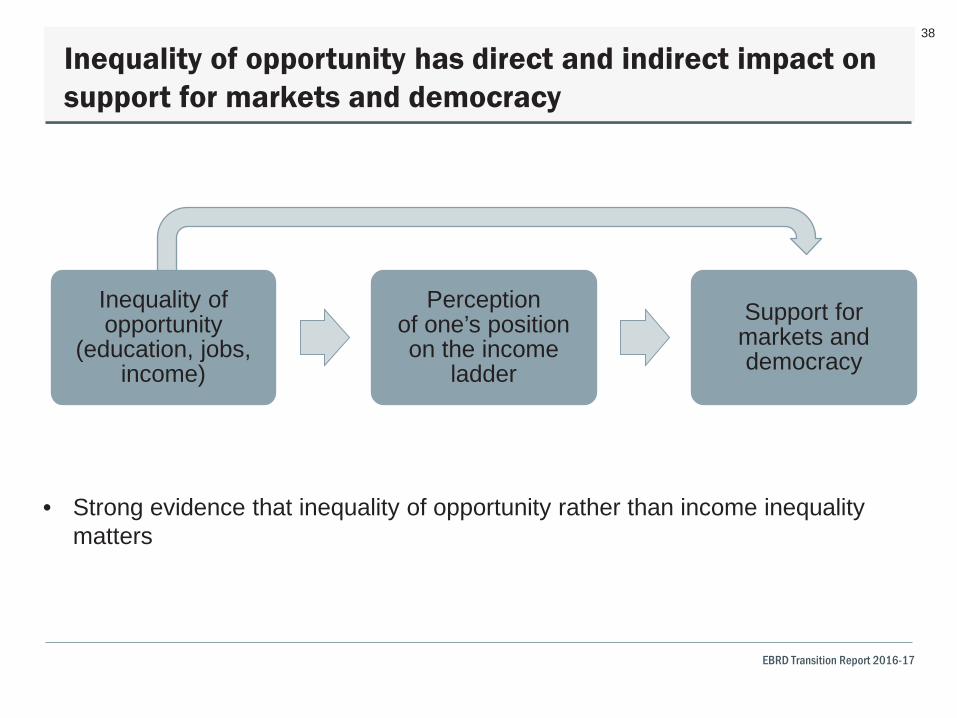
38
Inequality of opportunity has direct and indirect impact on support for markets and democracy
• Strong evidence that inequality of opportunity rather than income inequality matters
Inequality of opportunity
(education, jobs, income)
Perception of one’s position on the income
ladder
Support for markets and democracy
© European Bank for Reconstruction and Development
TRANSITION REPORT 2016-17
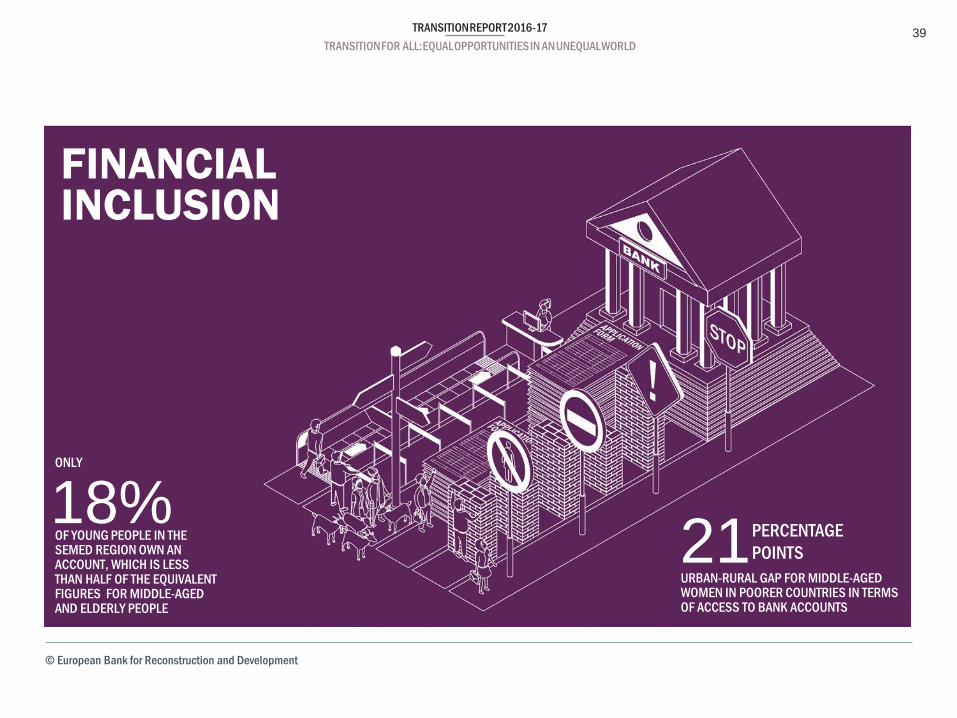
TRANSITION FOR ALL: EQUAL OPPORTUNITIES IN AN UNEQUAL WORLD 39
FINANCIAL INCLUSION
21 URBAN-RURAL GAP FOR MIDDLE-AGED WOMEN IN POORER COUNTRIES IN TERMS OF ACCESS TO BANK ACCOUNTS
18% OF YOUNG PEOPLE IN THE SEMED REGION OWN AN ACCOUNT, WHICH IS LESS THAN HALF OF THE EQUIVALENT FIGURES FOR MIDDLE-AGED AND ELDERLY PEOPLE
PERCENTAGE POINTS
ONLY
© European Bank for Reconstruction and Development
TRANSITION REPORT 2016-17
TRANSITION FOR ALL: EQUAL OPPORTUNITIES IN AN UNEQUAL WORLD
EBRD Transition Report 2016-17
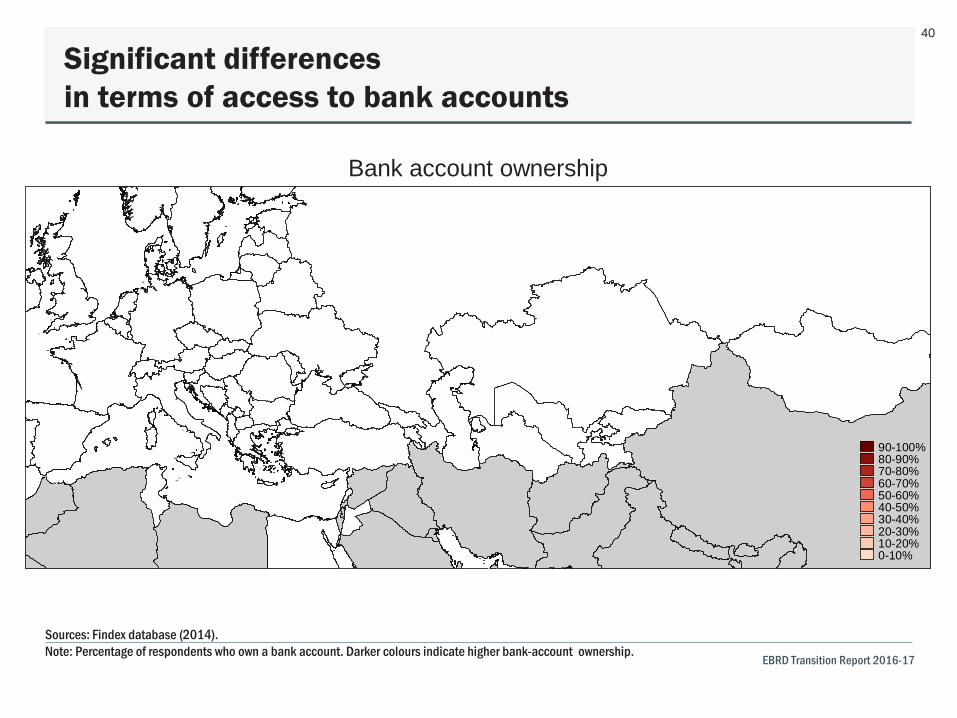
40
Significant differences in terms of access to bank accounts
Sources: Findex database (2014). Note: Percentage of respondents who own a bank account. Darker colours indicate higher bank-account ownership.
90-100%80-90%70-80%60-70%50-60%40-50%30-40%20-30%10-20%0-10%
Bank account ownership
© European Bank for Reconstruction and Development
TRANSITION REPORT 2016-17
TRANSITION FOR ALL: EQUAL OPPORTUNITIES IN AN UNEQUAL WORLD
EBRD Transition Report 2016-17
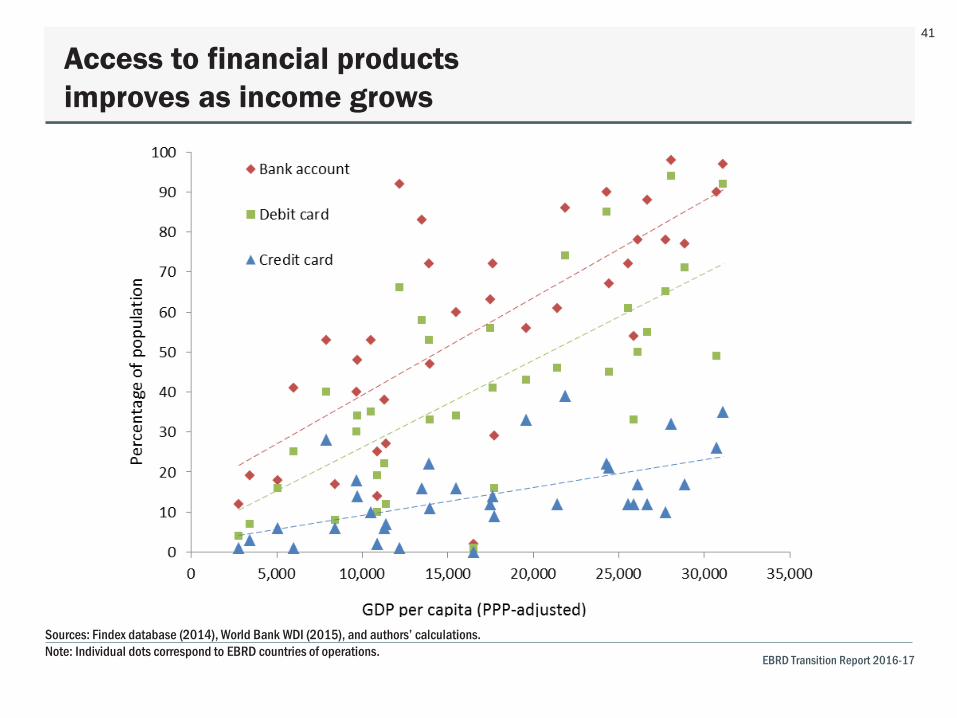
41
Access to financial products improves as income grows
Sources: Findex database (2014), World Bank WDI (2015), and authors’ calculations. Note: Individual dots correspond to EBRD countries of operations.
© European Bank for Reconstruction and Development
TRANSITION REPORT 2016-17
TRANSITION FOR ALL: EQUAL OPPORTUNITIES IN AN UNEQUAL WORLD
EBRD Transition Report 2016-17
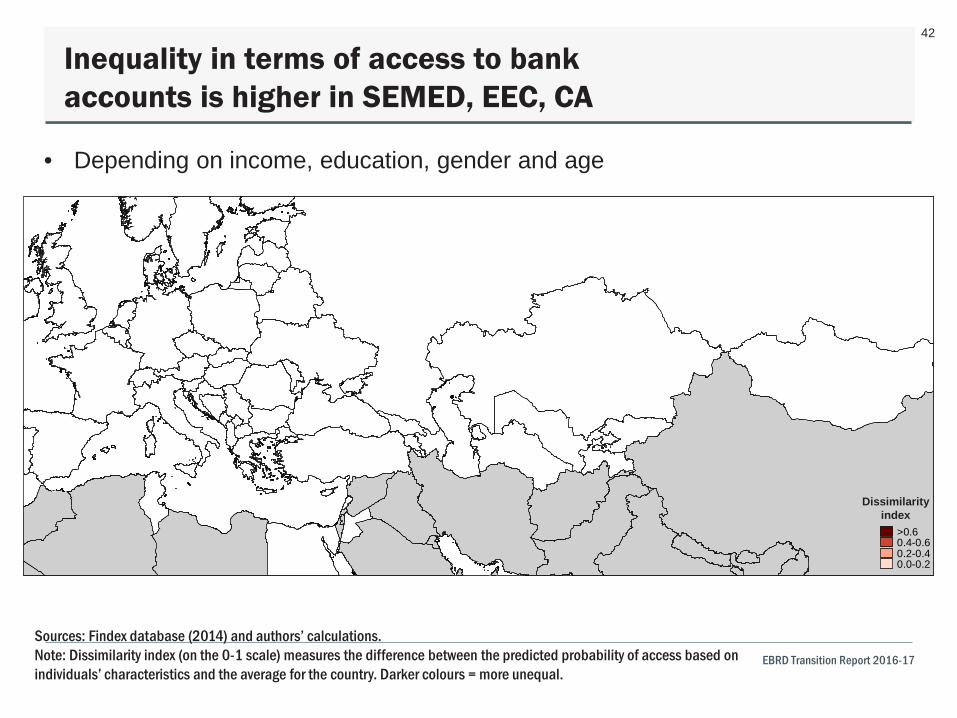
42
Inequality in terms of access to bank accounts is higher in SEMED, EEC, CA
Sources: Findex database (2014) and authors’ calculations. Note: Dissimilarity index (on the 0-1 scale) measures the difference between the predicted probability of access based on individuals’ characteristics and the average for the country. Darker colours = more unequal.
>0.60.4-0.60.2-0.40.0-0.2
• Depending on income, education, gender and age
Dissimilarity index
© European Bank for Reconstruction and Development
TRANSITION REPORT 2016-17
TRANSITION FOR ALL: EQUAL OPPORTUNITIES IN AN UNEQUAL WORLD
EBRD Transition Report 2016-17
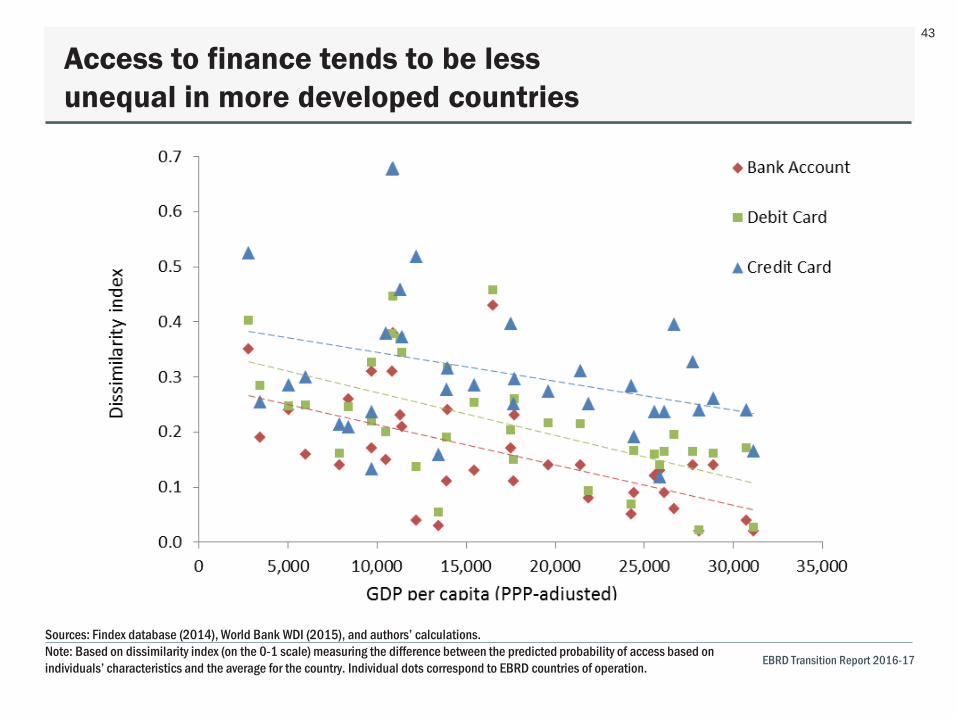
43
Access to finance tends to be less unequal in more developed countries
Sources: Findex database (2014), World Bank WDI (2015), and authors’ calculations. Note: Based on dissimilarity index (on the 0-1 scale) measuring the difference between the predicted probability of access based on individuals’ characteristics and the average for the country. Individual dots correspond to EBRD countries of operation.
© European Bank for Reconstruction and Development
TRANSITION REPORT 2016-17
TRANSITION FOR ALL: EQUAL OPPORTUNITIES IN AN UNEQUAL WORLD
EBRD Transition Report 2016-17
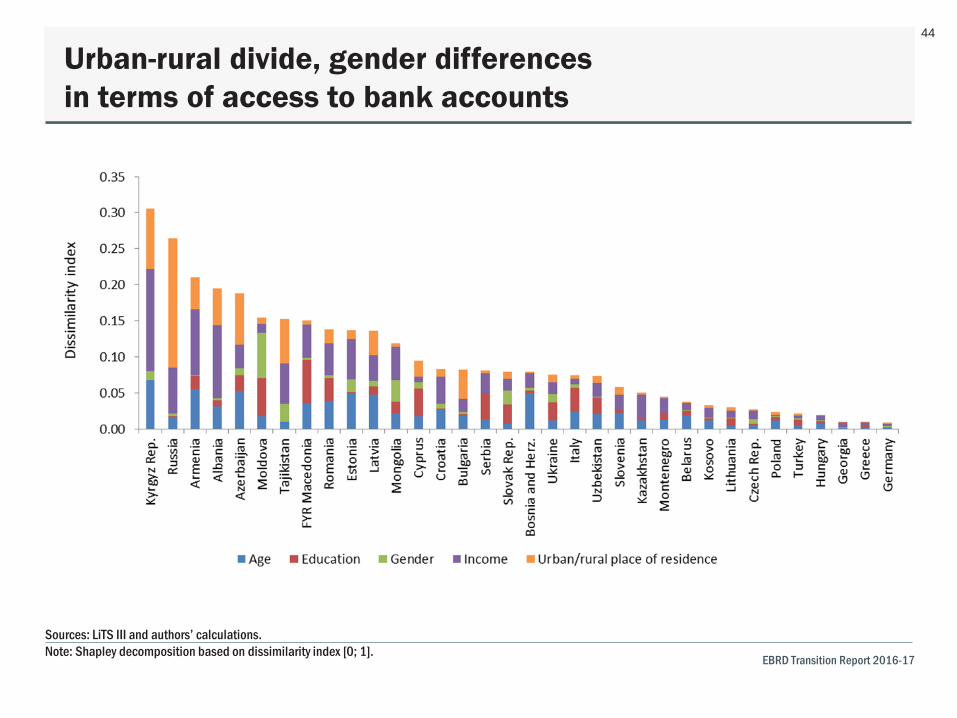
44
Urban-rural divide, gender differences in terms of access to bank accounts
Sources: LiTS III and authors’ calculations. Note: Shapley decomposition based on dissimilarity index [0; 1].
© European Bank for Reconstruction and Development
TRANSITION REPORT 2016-17
TRANSITION FOR ALL: EQUAL OPPORTUNITIES IN AN UNEQUAL WORLD
EBRD Transition Report 2016-17
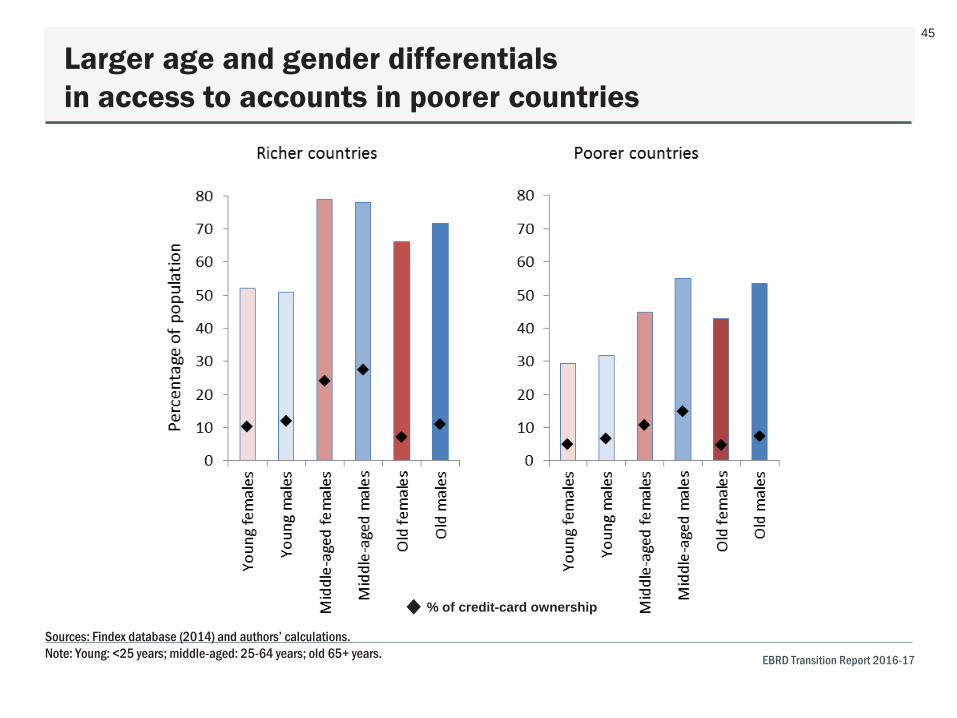
45
Larger age and gender differentials in access to accounts in poorer countries
Sources: Findex database (2014) and authors’ calculations. Note: Young: <25 years; middle-aged: 25-64 years; old 65+ years.
% of credit-card ownership
© European Bank for Reconstruction and Development
TRANSITION REPORT 2016-17
TRANSITION FOR ALL: EQUAL OPPORTUNITIES IN AN UNEQUAL WORLD
EBRD Transition Report 2016-17
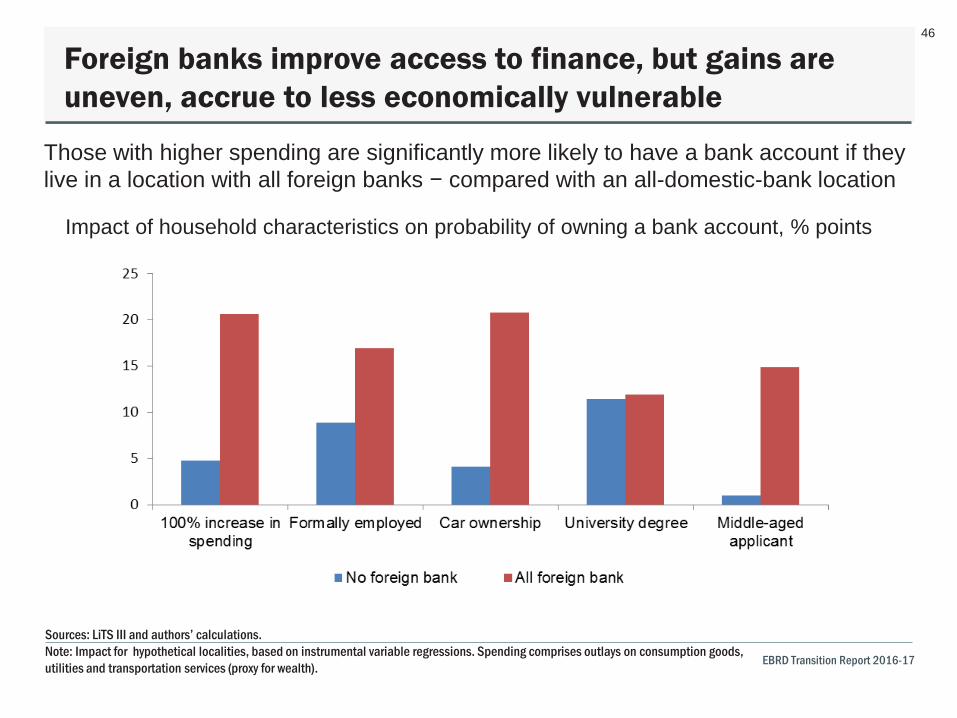
46
Foreign banks improve access to finance, but gains are uneven, accrue to less economically vulnerable
Sources: LiTS III and authors’ calculations. Note: Impact for hypothetical localities, based on instrumental variable regressions. Spending comprises outlays on consumption goods, utilities and transportation services (proxy for wealth).
Those with higher spending are significantly more likely to have a bank account if they live in a location with all foreign banks − compared with an all-domestic-bank location
Impact of household characteristics on probability of owning a bank account, % points
© European Bank for Reconstruction and Development
TRANSITION REPORT 2016-17
TRANSITION FOR ALL: EQUAL OPPORTUNITIES IN AN UNEQUAL WORLD 47
STRUCTURAL REFORM
42% OF COUNTRIES IN THE REGION THAT ARE COVERED BY THE NEW SME INDICATORS HAVE LARGE GAPS IN TERMS OF BUSINESS SKILLS AND STANDARDS
29of 36 COUNTRIES IN THE EBRD REGION ARE MEMBERS OF THE WTO, WITH KAZAKHSTAN THE LATEST TO JOIN IN NOVEMBER 2015
© European Bank for Reconstruction and Development
TRANSITION REPORT 2016-17
TRANSITION FOR ALL: EQUAL OPPORTUNITIES IN AN UNEQUAL WORLD
EBRD Transition Report 2016-17
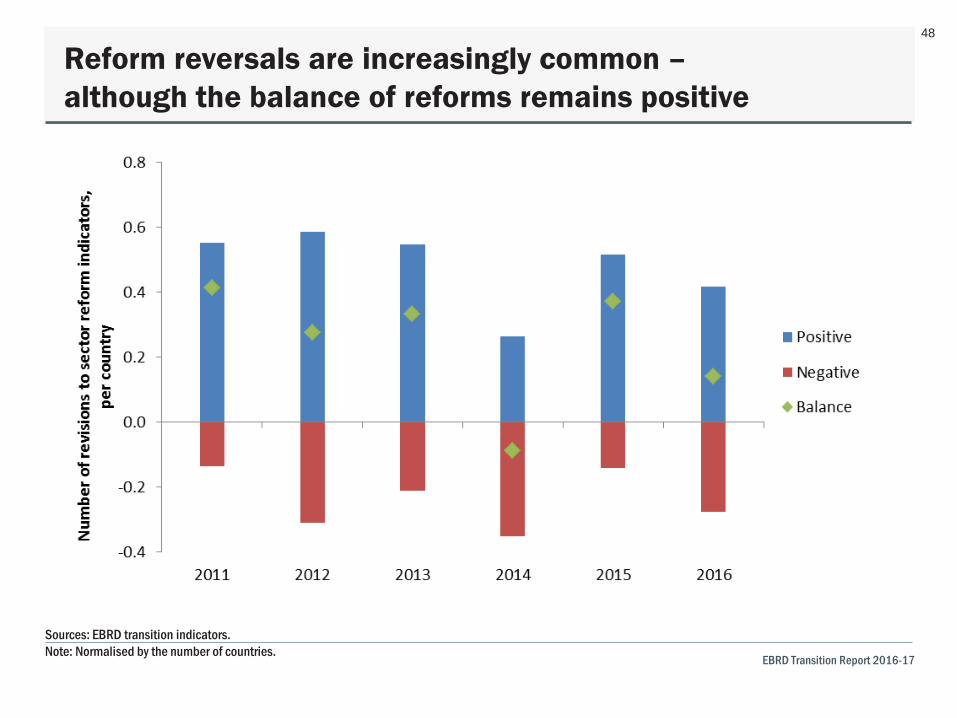
48
Reform reversals are increasingly common – although the balance of reforms remains positive
Sources: EBRD transition indicators. Note: Normalised by the number of countries.
© European Bank for Reconstruction and Development
TRANSITION REPORT 2016-17
TRANSITION FOR ALL: EQUAL OPPORTUNITIES IN AN UNEQUAL WORLD
EBRD Transition Report 2016-17
49
• Transition was a traumatic experience – so much so that people born during price liberalisation years are on average 1 cm shorter
• It took a long time – but the happiness gap has now closed
• And income convergence has been impressive – but not everyone benefited
• In fact, rise in inequality from (notionally) low levels meant that only 44% personally experienced income convergence
• Redistribution may help but a greater emphasis on improving equality of opportunity – through education, financial inclusion and better connectivity – is even more imperative
Transition for all?
© European Bank for Reconstruction and Development
TRANSITION REPORT 2016-17
TRANSITION FOR ALL: EQUAL OPPORTUNITIES IN AN UNEQUAL WORLD
Produced by the Office for the Chief Economist, EBRD © European Bank for Reconstruction and Development
TRANSITION REPORT 2016-17
tr-ebrd.com
EASILY ACCESSIBLE
INFORMATION ONLINE AND
IN PRINT
tr-ebrd.com
Video TR 2016-17


![The energy intensity of transition countries [EBRD - Working papers]](https://img.pdfslide.net/doc/110x75/613d78f4736caf36b75dbc26/the-energy-intensity-of-transition-countries-ebrd-working-papers.jpg)