Embed Size (px)
Citation preview
Chapter 11
Marker-Assisted Backcrossing Selectionfor High O/L Ratio in Cultivated PeanutPadmalatha Koilkonda, Chikara Kuwata, Masanobu Fukami, Kenta Shirasawa,Koh Aoki, Satoshi Tabata, Makoto Hasegawa, Hiroyuki Kiyoshima,Shigeru Suzuki, Shigemi Sasamoto, Atsushi Kurabayashi, Hisano Tsuruoka,Tsuyuko Wada, and Sachiko Isobe
Abstract
Peanut (Arachis hypogaea L.) is an important food legume and oilseed crop cultivated worldwide.The quality of peanut oil depends on the properties of the oil, one of which is the oleic/linoleic acidratio (O/L ratio). The two genes related to the O/L ratio, ahFAD2A and ahFAD2B, were previouslyidentified in peanut. In this chapter, marker-assisted backcrossing selection (MABS) for high O/Lratio in peanut is demonstrated with a breeding line showing a high O/L ratio (‘YI-0311’) and an eliteline with medium O/L ratio (‘Nakateyutaka’) as donor and backcross parents, respectively.
A total of 204 F2 plants were obtained from 34 F1 plants. Seven F2 lines exhibited a high O/L ratioand had homozygous ‘YI-0311’ genotypes on the two FAD2 loci. Four F3 seeds were generated fromeach of the three F2 plants, and a total of 108 BC1F1 seeds were developed from the 12 F3 plants.Twelve of the 108 BC1F1 plants were selected according to the genotypes of 42 genome-wide (GW)DNA markers. A total of 178 BC1F2 plants were developed from the 12 BC1F1 plants, and 16 ofthe 178 showed a homozygous ‘YI-0311’ genotype on the FAD2 loci. Of the 16 BC1F2 plants, eightwere selected based on the genotypes of the 19 GW markers, and then backcrossed. A total of 26BC2F1 plants were developed, and 10 BC2F1 plants were selected according to GW genotypes. Ofthe subsequently developed 205 BC2F2 plants, nine showed homozygous ‘YI-0311’ genotypes on theFAD2 loci. At present (January 2012), BC Cycle 3 is in process. In addition to low cost for selectionof high O/L ratio plants, the higher homozygous backcrossing ratio suggested efficiency of MABSfor high O/L ratio breeding in cultivated peanut.
Introduction
Peanut (Arachis hypogaea L.) is an importantfood legume and oilseed crop cultivated world-
wide in temperate and tropical zones. It cov-ers 23 million hectares, which produce about50 million metric tons, with an average yield1.6 tons/ha (FAOSTAT 2010). Cultivated peanuts
Translational Genomics for Crop Breeding, Volume II: Abiotic Stress, Yield and Quality.Edited by Rajeev K. Varshney and Roberto Tuberosa.C© 2013 John Wiley & Sons, Inc. Published 2013 by John Wiley & Sons, Inc.
177
178 TRANSLATIONAL GENOMICS FOR CROP BREEDING
are used for the extraction of edible oil fromseeds and kernels, in addition to several otheruses, such as food and fodder. Peanut breed-ing is more frequently performed in the pub-lic sector rather than by private companies. Oneof the largest breeding stations is in ICRISAT(International Crop Research Institute for theSemi-Arid Tropics), where the world’s largestpeanut collection, of approx. 15,000 accessions,is housed. Several national breeding programsare also active, mainly in Asia and African coun-tries. The most important objective in peanutbreeding is improvement of yield, followed byacquisition of biotic and abiotic stress tolerance.Because peanut shows relatively higher droughttolerance than other legume crops, it is oftencultivated in semidry areas. Thus, drought toler-ance is one of the most important targets for theimprovement of abiotic stress tolerance in peanutbreeding.
Meanwhile, improvement of quality charac-teristics in seeds, such as the modification ofchemical components and reduction of aller-genicity and aflatoxins, are also important targetsin breeding programs for industry use (Dwivediet al. 2007). Peanut seeds contain mostly oil,which makes up 45–51% of the weight of dryseeds (Lopez et al. 2000). Most of the oilextracted from peanut is composed of threemajor fatty acids, namely, a saturated fatty acid,a monounsaturated omega-9 fatty acid, and apolyunsaturated omega-6 fatty acid, known aspalmitic (C16:0), oleic (C18:1), and linoleic(C18:2), respectively. However, including thesethree major fatty acids, up to 12 fatty acids havebeen identified in peanuts (Dean et al. 2009).Oleic and linoleic acids account for 80% of thefatty acids in peanut oil (oleic acid: 36.67%,linoleic acid: 15–43%) and determine the qualityof the oil (Norden et al. 1987). Accordingly, thequality of peanut oil depends on the propertiesof the oil, one of which is the oleic/linoleic acidratio (O/L ratio).
There is little evidence that a high O/L ratioaffects other agro-morphological characteristicsof groundnut, such as yield, oil content, protein
content, seed size, and so forth (Moore et al.1989). Oleic acid is a monounsaturated fatty acidthat has the ability to reduce low-density lipopro-tein (LDL) levels in humans without reducingthe concentration of high-density lipoproteins(HDLs), while linoleic acid is a polyunsaturatedfatty acid that can decrease the levels of LDL andHDL, which is unhealthy (Yin and Cui 2006).Oleic acid is less prone to oxidation and therebypossesses an extended shelf life. High-oleateoil makes hydrogenation unnecessary, avoidingadditional costs and the generation of harmfultrans-fatty acids (Chu et al. 2007, Pham et al.2010). A high oleate diet has been shown toimprove the blood lipoprotein profile, suppresstumorigenesis, reduce atherosclerosis, and ame-liorate inflammatory and coronary heart diseases(Yu et al. 2008; Chu et al. 2009). In additionto their uses in food, high-oleic oils also haveindustrial applications. The industrial oleochem-icals business is investigating the use of high-oleic vegetable oils as feedstock for the produc-tion of numerous products including cosmeticsand machine lubricants (e.g., high-temperatureengine, transmission, hydraulic, gear, and greaseapplications) (Butzen and Schnebly 2007). Thus,increased oleic acid levels in peanut will not onlyimprove oil stability, but will also support thehealth of consumers in addition to providing ben-efits for industrial applications.
Peanut is an allotetraploid species (AABBgenome; 2n=4X=40). It has been assumedthat the species probably originated via asingle hybridization event between the twodiploid species, A. duranensis (AA genome)and A. ipaensis (BB genome) (Krapovickas andGregory 1994; Seijo et al. 2004 and 2007). Mod-ern cultivars are generally classified into fourbotanical types, that is, Spanish, Valencia, Vir-ginia, and Southeast runner, based on their mor-phological traits. Despite widespread morpho-logical variations, extremely lower genetic diver-sity has been observed in peanut germplasms,a factor that has slowed advances of moleculargenetics and MAS in peanuts (Halward et al.1991; Kochert et al. 1996). To date, more than
MARKER-ASSISTED BACKCROSSING SELECTION FOR HIGH O/L RATIO 179
6,000 DNA markers have been developed in theArachis spp. (Pandey et al. 2011), for example,random amplified polymorphic DNA (RAPD)(Garcia et al. 1996); amplified fragment lengthpolymorphisms (AFLP) (Giemens et al. 2002);inter simple sequence repeat polymorphisms(ISSR) (Raina et al. 2001); restriction frag-ment length polymorphisms (RFLP) (Halwardet al. 1993; Burow et al. 2001); simple sequencerepeats (SSRs) derived from genomic libraries(He et al. 2003; Moretzsohn et al. 2003; Fergusonet al. 2004; Moretzsohn et al. 2005; Naito et al.2008); and sequences of expressed sequence tags(ESTs) (Proite et al. 2007; Koilkonda et al. 2011),and bacterial artificial chromosome (BAC)-endsequences (Wang et al. 2012). Recently, a totalof 504 AhMITE1 transposon insertion polymor-phic markers (hereafter referred to as transposonmarkers) were also developed in peanut (Shira-sawa et al. 2012).
Many linkage maps have been constructedfrom diploid wild and cultivated species, inaddition to integrated maps based on cultivatedpeanut species (Halward et al. 1993; Moretzsohnet al. 2005; Leal-Bertioli et al. 2009; Moretzsohnet al. 2009; Varshney et al. 2009; Khedikar et al.2010; Hong et al. 2010; Gautami et al. 2011; Qinet al. 2011; Sujay et al. 2011; Wang et al. 2012).Although a number of studies have attemptedto develop DNA markers and genetic linkagemaps for peanut, the linkage groups in the lat-est maps have not yet converged with the num-ber of chromosome pairs (20), which suggeststhat the current DNA marker resources remaininsufficient in the molecular genetics of peanut.Recently, the International Peanut Genome Ini-tiative (IPGI) was created and began research onthe peanut genome project. It is expected thatthe activity of the peanut genome project willaccelerate advances in the molecular breedingand genetics of peanut.
In marker-assisted selection (MAS), markersshowing linkage with targeted traits were usedfor the selection of favorable individuals frombreeding populations. Such markers (hereafterreferred to as selection markers) can be devel-
oped through two approaches: (1) quantitativetrait loci (QTL) mapping, and (2) the candidategene approach. Several studies of QTL mappingin peanut are published, and the most frequenttarget in this field has been drought tolerance(Varshney et al. 2009; Khedikar et al. 2010; Gau-tami et al. 2011; Ravi et al. 2011). Accordingto the results of several studies, drought toler-ance is controlled by multiple QTLs, and nomajor QTL exists. Therefore, further studies arerequired before MAS can be applied for thedevelopment of selection markers for droughttolerance. Unlike drought tolerance, major QTLswere identified for biotic stress tolerance, in par-ticular, late leaf spot (Sujay et al. 2011) andtomato spotted wilt virus (Qin et al. 2011), whichshowed maximum phenotypic variance of 83.0%and 35.8%, respectively. The QTLs identifiedfor these two disease resistance traits could beapplied for MAS in peanut.
With respect to the use of a candidate geneapproach for the development of selection mark-ers, genes related to the O/L ratio have beenwell studied in peanut. In higher plants, oleicacid is synthesized from stearic acid and is con-verted to linoleic acid in a reaction catalyzed bytwo fatty acid desaturases encoded by the SADand FAD2 genes (Yin and Cui 2006; Clementeand Cahoon 2009). When the FAD2 genes fromthe commonly cultivated peanut and a high-oleate mutant that contains >80% oleate and 2%linoleate in seed oil were compared, the high-oleate phenotype was found to be caused by asingle nucleotide insertion (Lopez et al. 2000;Lopez et al. 2002; Yu et al. 2008). Moreover,the acyl carrier protein (ACP) is a central cofac-tor for de novo fatty acid synthesis, carrying thenascent acyl chains during the synthesis of acylgroups. Five different types of ACP genes werealso cloned from peanut (Li et al. 2010).
As the O/L ratio is a key determinant of oil andnutritional quality, the selection of mutated alle-les of FAD2, which is associated with oleic acidcontent in seeds (Martin and Rinne 1986; Garcesand Mancha 1991; Lee and Guerra 1994), is asimple strategy to generate high-oleic acid crops
180 TRANSLATIONAL GENOMICS FOR CROP BREEDING
efficiently. In peanut, ahFAD2A and ahFAD2Bhave been identified on the A and B genomes,respectively, and the mutant alleles are reportedto confer a high oleic/linoleic acid ratio (O/Lratio) (Lopez et al. 2000; Bruner et al. 2001;Lopez et al. 2002; Patel et al. 2004;Chu et al.2009; Barkley et al. 2010). In previous stud-ies, cleaved amplified polymorphic sequences(CAPS), allele specific polymerase chain reac-tion (AS-PCR), and real-time PCR genotyp-ing assays were developed for the FAD2A andFAD2B genes (Chu et al. 2007; Chu et al. 2009;Barkley et al. 2010; Chen et al. 2010; Chuet al. 2011). Accordingly, MAS for high O/Lratio appears to be already in practical use. Chuand colleagues (2011) reported gene pyramid-ing by MAS for nematode resistance and highO/L content.
MAS is classified into two categories: marker-assisted backcrossing selection (MABS) andmarker-assisted recurrent selection (MARS).Generally, the former is employed for theimprovement of traits controlled by major genes,while the latter is for pyramiding multiple QTLs.Because previous studies suggest that the O/Lratio is controlled by the two candidate FAD2genes, MABS is favorable for the improvementof the O/L ratio in peanut. In this chapter, MABSfor a high O/L ratio in peanut is demonstratedwith a breeding line showing a high O/L ratioand an elite line with medium O/L ratio asdonor and backcross parents, respectively. TheMABS program was started in 2007, and thenumber of DNA markers developed was consid-erably lower at that time compared to the present.Polymorphic DNA markers and a linkage mapwere developed in parallel with the MABSprogram.
Materials and Methods
Breeding Scheme
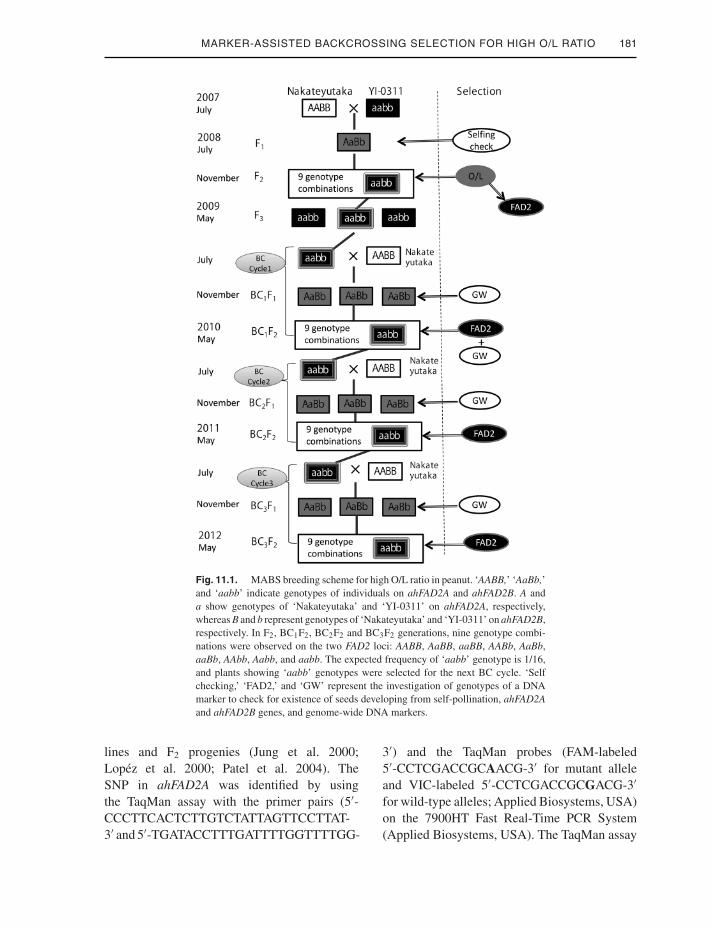
The breeding scheme of the MABS programis shown in Figure 11.1. The two parentallines, ‘Nakateyutaka’ and ‘YI-0311,’ were
crossed in 2007 at Chiba Prefectural Agricul-ture and Forestry Research Center. ‘Nakateyu-taka,’ which was used as a seed and backcrossparent, is one of the leading varieties in Japan,whose agronomic type is Virginia and shows anormal O/L ratio (O/L=1.16). It exhibits largeseed size (approx. 89g/100 seeds), light brownseed coat color, short length, and erect branches.‘YI-0311’ is a breeding line of the Chiba Pre-fectural Agriculture and Forestry Research Cen-ter with a high O/L ratio (O/L=48.2), and usedas a pollen and donor parent. It is Southeast-runner type, and shows small seed size (approx.50g/100seeds), light brown seed coat color, andlong and prostate branches. The F1 seeds weresown in the field in May 2008, and F2 seedswere harvested in October. The O/L ratios of theF2 seeds were analyzed, and F2 seeds showinga high O/L ratio were sown in the greenhouseduring the off-season for the production of F3
seeds. In parallel, the availability of the FAD2genes as selection markers for a high O/L ratiowas confirmed (details are described in the nextsections). The F3 seeds were sown in the fieldin 2009 and backcrossed with ‘Nakateyutaka’to start backcross (BC) Cycle 1. The harvestedBC1F1 seeds were grown in the greenhouse dur-ing the off-season, and genotypes were analyzedusing genome-wide (GW) DNA markers. TheBC1F2 seeds harvested from the selected BC1F1
plants based on their GW genotypes were sownin pots, and the FAD2 loci genotypes were inves-tigated. The BC1F2 plants showing ‘YI-0311’genotypes on the FAD2 loci were selected andtransplanted to the field for the next backcross-ing cycle (BC Cycle2). At present, BC Cycle 2is complete and BC Cycle 3 is in process.
Polymorphic Analysis of theFAD2 Genes
The previously reported single nucleotidepolymorphism (SNP) in ahFAD2A and thetransposon insertional polymorphism inahFAD2B were investigated, based on theexistence of polymorphisms in the parental
MARKER-ASSISTED BACKCROSSING SELECTION FOR HIGH O/L RATIO 181
Fig. 11.1. MABS breeding scheme for high O/L ratio in peanut. ‘AABB,’ ‘AaBb,’and ‘aabb’ indicate genotypes of individuals on ahFAD2A and ahFAD2B. A anda show genotypes of ‘Nakateyutaka’ and ‘YI-0311’ on ahFAD2A, respectively,whereas B and b represent genotypes of ‘Nakateyutaka’ and ‘YI-0311’ on ahFAD2B,respectively. In F2, BC1F2, BC2F2 and BC3F2 generations, nine genotype combi-nations were observed on the two FAD2 loci: AABB, AaBB, aaBB, AABb, AaBb,aaBb, AAbb, Aabb, and aabb. The expected frequency of ‘aabb’ genotype is 1/16,and plants showing ‘aabb’ genotypes were selected for the next BC cycle. ‘Selfchecking,’ ‘FAD2,’ and ‘GW’ represent the investigation of genotypes of a DNAmarker to check for existence of seeds developing from self-pollination, ahFAD2Aand ahFAD2B genes, and genome-wide DNA markers.
lines and F2 progenies (Jung et al. 2000;Lopez et al. 2000; Patel et al. 2004). TheSNP in ahFAD2A was identified by usingthe TaqMan assay with the primer pairs (5′-CCCTTCACTCTTGTCTATTAGTTCCTTAT-3′ and 5′-TGATACCTTTGATTTTGGTTTTGG-
3′) and the TaqMan probes (FAM-labeled5′-CCTCGACCGCAACG-3′ for mutant alleleand VIC-labeled 5′-CCTCGACCGCGACG-3′
for wild-type alleles; Applied Biosystems, USA)on the 7900HT Fast Real-Time PCR System(Applied Biosystems, USA). The TaqMan assay
182 TRANSLATIONAL GENOMICS FOR CROP BREEDING
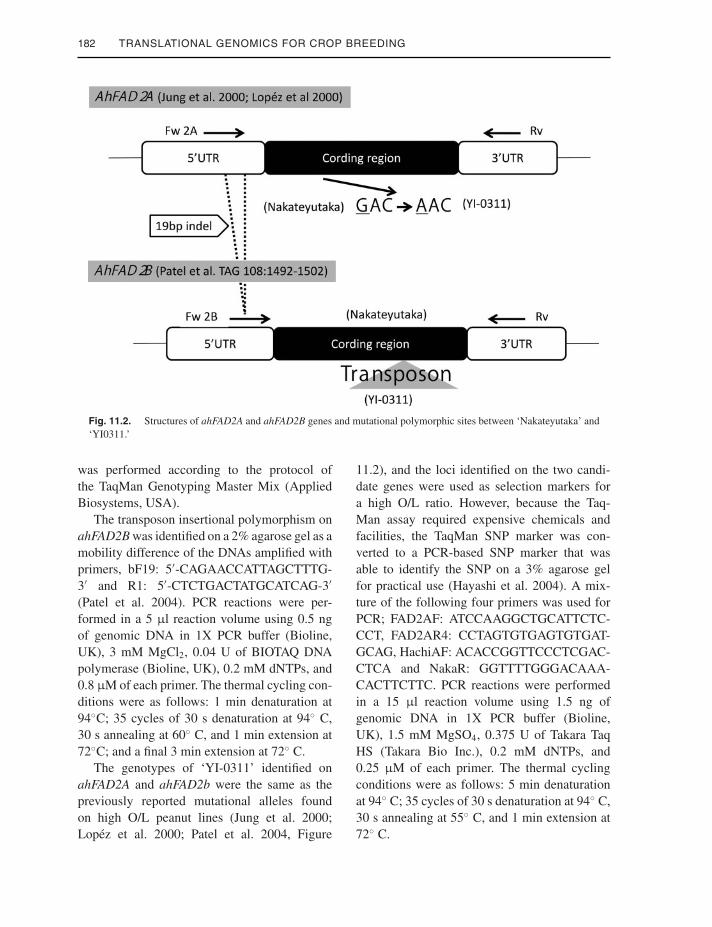
Fig. 11.2. Structures of ahFAD2A and ahFAD2B genes and mutational polymorphic sites between ‘Nakateyutaka’ and‘YI0311.’
was performed according to the protocol ofthe TaqMan Genotyping Master Mix (AppliedBiosystems, USA).
The transposon insertional polymorphism onahFAD2B was identified on a 2% agarose gel as amobility difference of the DNAs amplified withprimers, bF19: 5′-CAGAACCATTAGCTTTG-3′ and R1: 5′-CTCTGACTATGCATCAG-3′
(Patel et al. 2004). PCR reactions were per-formed in a 5 μl reaction volume using 0.5 ngof genomic DNA in 1X PCR buffer (Bioline,UK), 3 mM MgCl2, 0.04 U of BIOTAQ DNApolymerase (Bioline, UK), 0.2 mM dNTPs, and0.8 μM of each primer. The thermal cycling con-ditions were as follows: 1 min denaturation at94◦C; 35 cycles of 30 s denaturation at 94◦ C,30 s annealing at 60◦ C, and 1 min extension at72◦C; and a final 3 min extension at 72◦ C.
The genotypes of ‘YI-0311’ identified onahFAD2A and ahFAD2b were the same as thepreviously reported mutational alleles foundon high O/L peanut lines (Jung et al. 2000;Lopez et al. 2000; Patel et al. 2004, Figure
11.2), and the loci identified on the two candi-date genes were used as selection markers fora high O/L ratio. However, because the Taq-Man assay required expensive chemicals andfacilities, the TaqMan SNP marker was con-verted to a PCR-based SNP marker that wasable to identify the SNP on a 3% agarose gelfor practical use (Hayashi et al. 2004). A mix-ture of the following four primers was used forPCR; FAD2AF: ATCCAAGGCTGCATTCTC-CCT, FAD2AR4: CCTAGTGTGAGTGTGAT-GCAG, HachiAF: ACACCGGTTCCCTCGAC-CTCA and NakaR: GGTTTTGGGACAAA-CACTTCTTC. PCR reactions were performedin a 15 μl reaction volume using 1.5 ng ofgenomic DNA in 1X PCR buffer (Bioline,UK), 1.5 mM MgSO4, 0.375 U of Takara TaqHS (Takara Bio Inc.), 0.2 mM dNTPs, and0.25 μM of each primer. The thermal cyclingconditions were as follows: 5 min denaturationat 94◦ C; 35 cycles of 30 s denaturation at 94◦ C,30 s annealing at 55◦ C, and 1 min extension at72◦ C.
MARKER-ASSISTED BACKCROSSING SELECTION FOR HIGH O/L RATIO 183
Table 11.1. MABS based selection of high O/L ratio individuals in peanut
Homozygousbackcrossing ratioc of
the all individuals
Homozygousbackcrossing ratic of
the selected individuals
GenerationNumber of all
individuals
Number ofselected
individualsa
Number ofindividualsof FAD2/YIgenotypesb
Number ofused GWmarkers Average Range Average Range
F1 58 34 – 1 – – – –F2 204 3 7 – – – – –F3 12 – – – – – – –BC1F1 108 12 – 42 55.4 38.5–69.2 62.9 52.6–68.4BC1F2 178 8 16 19 62.9 33.3–93.3 70.2 53.3–80.0BC2F1 26 10 – 34 83.5 73.5–91.2 87.9 85.3–91.2BC2F2 205 9 9 – – – – –
aIndividuals were selected based on genotypes of FAD2 loci, GW markers and phenotypes.bNumber of individuals showing homozygous ‘YI-0311’ genotypes on ahFAD2A and ahFAD2B genes.cRatio of markers showing homozygous ‘Nakateyutaka’ genotypes to all the tested GW markers.
GW DNA Markers
The presence of selfing seeds in the F1 generationwas investigated using a simple sequence repeat(SSR) marker, PM204 (He et al. 2003). When thebreeding program was started in 2007, only a fewDNA markers showing polymorphisms between‘Nakateyutaka’ and ‘YI-0311’ had been devel-oped. Accordingly, we developed GW poly-morphic markers and a linkage map in paral-lel with the breeding program (Koilkonda et al.2011; Shirasawa et al. 2012). A total of 19-42polymorphic SSR and transposon markers wereused to assess GW genotypes in BC1F1, BC1F2
and BC2F1 progenies (Table 11.1). The GWDNA markers had not been mapped on a peanutlinkage map until 2011 and the positions of themarkers on the genome were therefore unknownwhen the genotypes were investigated.
Investigation of Fatty Acid Contentin Seeds
The selected 32 F1 parents and the two parentallines were sown in a peanut plant breedingfield of the Chiba Prefectural Agriculture andForestry Research Center in May 2008. The F2
and the parental seeds were harvested in Octo-ber and dried with shells for one month underopen air conditions. One quarter of each driedseed was cut off, and 25 mg of seed material
was homogenized using TissueLyzer (Qiagen,Hilden, Germany). The other parts of the seedswere sown in pots to obtain an F3 generation.The homogenate was used for determination offatty acid content. The quantification was per-formed using a GC-TOF-MS system consistingof a 6890N Network GC System (Agilent Tech-nologies, U.S.A.) equipped with a DB-17MScolumn (30 m, I.D 0.25 mm, film 0.25 μm) (J&WScientific, U.S.A.), coupled to Pegasus3 (Leco R©,St. Joseph, MI, U.S.A.). Acquisition and analy-sis of mass spectrometry data were performedusing ChromaTOFTM version 2.32 optimizedfor Pegasus (Leco R©). The concentrations of oleicacid, linoleic acid, palmitic acid, and stearic acidwere estimated from calibration curves obtainedusing the respective pure compound. The associ-ation between O/L ratio and genotypes on the twoFAD2 loci was detected with Genotype MatrixMapping software and the following parame-ters: Max Length of Locus Combination=2; MinNumber of Corresponding Samples=1; SearchRange=auto (Isobe et al. 2007).
Results and Discussion
Association between FAD2 Genesand O/L Ratio
Four fatty acid compounds were identified inseeds including palmitic, stearic, oleic, and
184 TRANSLATIONAL GENOMICS FOR CROP BREEDING
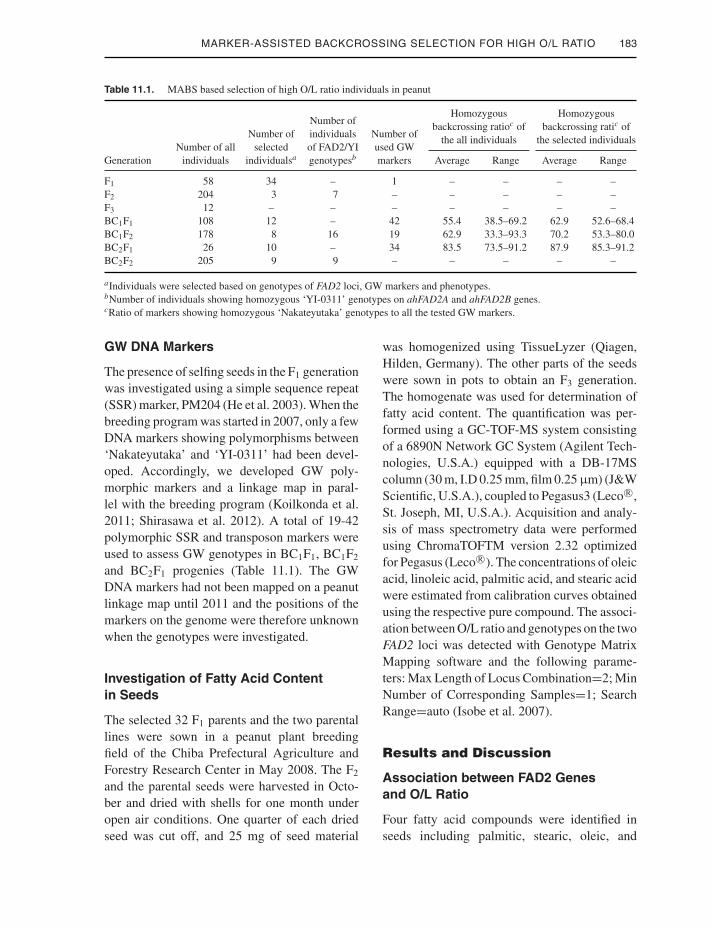
Fig. 11.3. Fatty acid content in the two parental linesand the 204 F2 seeds. Black, white, and gray diagonal linebars indicate fatty acid content of ‘YI-0311,’ ‘Nakateyutaka,’mean value of the total 204 F2 seeds, and mean value ofthe selected three F2 seeds for high O/L ration, respectively.Black lines indicate standard deviation.
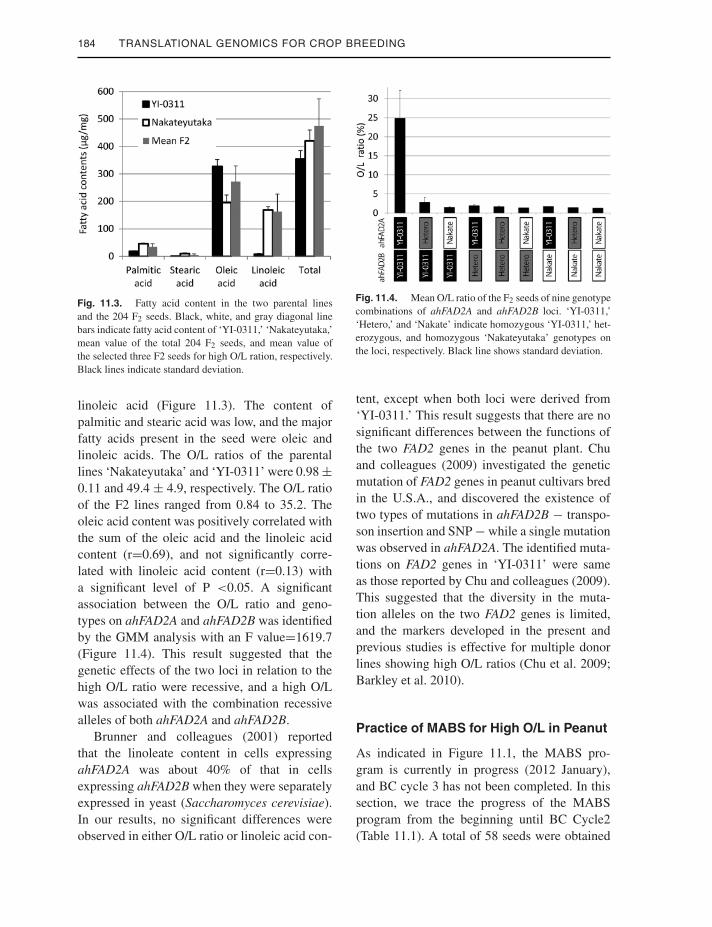
linoleic acid (Figure 11.3). The content ofpalmitic and stearic acid was low, and the majorfatty acids present in the seed were oleic andlinoleic acids. The O/L ratios of the parentallines ‘Nakateyutaka’ and ‘YI-0311’ were 0.98 ±0.11 and 49.4 ± 4.9, respectively. The O/L ratioof the F2 lines ranged from 0.84 to 35.2. Theoleic acid content was positively correlated withthe sum of the oleic acid and the linoleic acidcontent (r=0.69), and not significantly corre-lated with linoleic acid content (r=0.13) witha significant level of P <0.05. A significantassociation between the O/L ratio and geno-types on ahFAD2A and ahFAD2B was identifiedby the GMM analysis with an F value=1619.7(Figure 11.4). This result suggested that thegenetic effects of the two loci in relation to thehigh O/L ratio were recessive, and a high O/Lwas associated with the combination recessivealleles of both ahFAD2A and ahFAD2B.
Brunner and colleagues (2001) reportedthat the linoleate content in cells expressingahFAD2A was about 40% of that in cellsexpressing ahFAD2B when they were separatelyexpressed in yeast (Saccharomyces cerevisiae).In our results, no significant differences wereobserved in either O/L ratio or linoleic acid con-
Fig. 11.4. Mean O/L ratio of the F2 seeds of nine genotypecombinations of ahFAD2A and ahFAD2B loci. ‘YI-0311,’‘Hetero,’ and ‘Nakate’ indicate homozygous ‘YI-0311,’ het-erozygous, and homozygous ‘Nakateyutaka’ genotypes onthe loci, respectively. Black line shows standard deviation.
tent, except when both loci were derived from‘YI-0311.’ This result suggests that there are nosignificant differences between the functions ofthe two FAD2 genes in the peanut plant. Chuand colleagues (2009) investigated the geneticmutation of FAD2 genes in peanut cultivars bredin the U.S.A., and discovered the existence oftwo types of mutations in ahFAD2B − transpo-son insertion and SNP − while a single mutationwas observed in ahFAD2A. The identified muta-tions on FAD2 genes in ‘YI-0311’ were sameas those reported by Chu and colleagues (2009).This suggested that the diversity in the muta-tion alleles on the two FAD2 genes is limited,and the markers developed in the present andprevious studies is effective for multiple donorlines showing high O/L ratios (Chu et al. 2009;Barkley et al. 2010).
Practice of MABS for High O/L in Peanut
As indicated in Figure 11.1, the MABS pro-gram is currently in progress (2012 January),and BC cycle 3 has not been completed. In thissection, we trace the progress of the MABSprogram from the beginning until BC Cycle2(Table 11.1). A total of 58 seeds were obtained
MARKER-ASSISTED BACKCROSSING SELECTION FOR HIGH O/L RATIO 185
from crosses between ‘Nakateyutaka’ and ‘YI-0311.’ An SSR marker, PM204, which showedpolymorphisms between the parents, was usedfor genotyping of the seeds, and 34 of the 58seeds were confirmed as hybrid. Six F2 seedswere obtained from each of the 34 F1 plants, thus,204 F2 plants were obtained in total. Of the 204,seven F2 lines exhibited a high O/L (24.8 ± 6.8on average) ratio and had homozygous ‘YI-0311’genotypes on the two FAD2 loci (Figure 11.4).Three of the seven F2 plants were selected basedon plant vigor growing in the greenhouse dur-ing off-season. The F2 plants came into bloomin January 2009 and F3 seeds were obtainedin May 2009. Theoretically, F2 plants could beused as parents of BC1F1, however, we used F3
generation for backcrossing, largely because ofinsufficient temperature in the greenhouse forobtaining a high success ratio of backcross-ing. Therefore, four F3 seeds were generatedfrom each of the three F2 plants in the green-house during off-season and were sown in thefield, then crossed with ‘Nakateyutaka.’ A totalof 108 BC1F1 seeds were developed from the12 F3 plants, and genotypes were evaluatedusing 15 SSR and 27 transposon markers. Ofa total of 42 markers, 33 were codominant poly-morphic markers, while four and five markerswere dominant markers of ‘Nakateyutaka’ and‘YI-0311,’ respectively. The six markers iden-tified the homozygous genotype of ‘Nakateyu-taka,’ and the other 36 markers showed poly-morphisms within the BC1F1 plants. Twelve ofthe 108 BC1F1 plants were selected according tothe genotypes. The average ratio of the markersshowing homozygous ‘Nakateyutaka’ genotypes(hereafter referred to as homozygous backcross-ing ratio) was 55.4% in the all BC1F1 plants,while that in the selected 12 BC1F1 plants was62.9%.
A total of 178 BC1F2 plants were developedfrom the 12 BC1F1 plants, and 16 of the 178showed a homozygous ‘YI-0311’ genotype onthe FAD2 loci. In order to increase the homozy-gous backcrossing ratio, eight of the 16 BC1F2
plants were selected based on the genotypes
of the 19 GW markers. The 19 GW mark-ers were screened from the 42 markers usedin the selection of BC1F1 plants. The averagehomozygous backcrossing ratio was 62.9% inall BC1F2 plants, while it was 70.2% in theselected eight BC1F2 plants. ‘Nakateyutaka’ wasthen backcrossed to the eight BC1F2 plants, and26 BC2F1 plants were developed. Thirty-fourmarkers selected from the 42 markers tested inthe BC1F1 were used for GW genotype analysis,and 10 BC2F1 plants were selected. The averagehomozygous backcrossing ratio was 83.5% in allBC2F1 plants, while it was 87.9% in the selected10 BC2F1 plants. A total of 205 BC2F2 plantswere developed from the 10 BC2F1 plants, andnine of the 205 showed homozygous ‘YI-0311’genotypes on the FAD2 loci. All nine BC2F2
plants were designated for use in the next BCCycle3; the GW genotypes of BC2F2 plants weretherefore not analyzed.
Transition of GW Genotypesin the MABS
A linkage map, which had been developed basedon 186 F2 plants during the MABS process,was constructed in 2011. A total of 326 segre-gated loci were mapped onto 19 linkage groups(LGs) on 1332.9 cM. Homeologous group (HG)numbers of the LGs were identified basedon previously published maps (Moretzsohnet al. 2005; Fonceka et al. 2009; Leal-Bertioliet al. 2009; Moretzsohn et al. 2009; Varsh-ney et al. 2009). Three corresponding LGswere generated in HG 2 (HG2.1, HG2.2, andHG2.3), while single LGs were developed inHG6 (LG6.2) and HG7 (LG7.1). No correspond-ing LG was identified as HG10, and one LGthat showed no correspondence to previouslyreported maps was named LGX. The two FAD2loci were mapped onto LG9.1 and LG9.2.
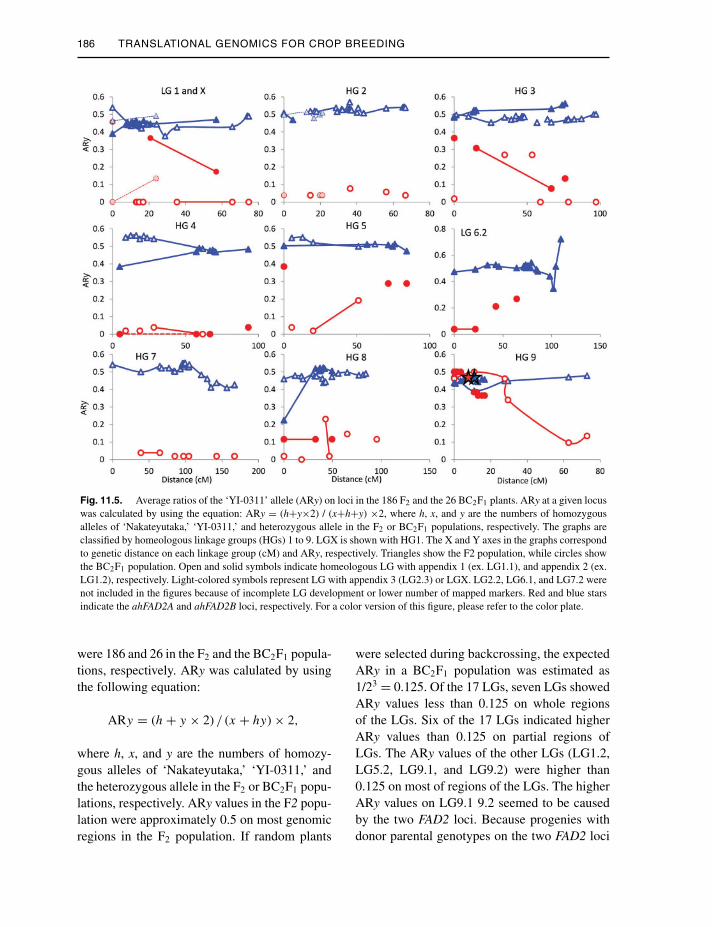
The average ratios of alleles derived fromthe donor parent ‘YI-0311’ (hereafter ARy) onmapped loci are shown in Figure 11.5 for 17LGs of the F2 and the BC2F1 populations. Thenumbers of genotyped plants in the populations
186 TRANSLATIONAL GENOMICS FOR CROP BREEDING
Fig. 11.5. Average ratios of the ‘YI-0311’ allele (ARy) on loci in the 186 F2 and the 26 BC2F1 plants. ARy at a given locuswas calculated by using the equation: ARy = (h+y×2) / (x+h+y) ×2, where h, x, and y are the numbers of homozygousalleles of ‘Nakateyutaka,’ ‘YI-0311,’ and heterozygous allele in the F2 or BC2F1 populations, respectively. The graphs areclassified by homeologous linkage groups (HGs) 1 to 9. LGX is shown with HG1. The X and Y axes in the graphs correspondto genetic distance on each linkage group (cM) and ARy, respectively. Triangles show the F2 population, while circles showthe BC2F1 population. Open and solid symbols indicate homeologous LG with appendix 1 (ex. LG1.1), and appendix 2 (ex.LG1.2), respectively. Light-colored symbols represent LG with appendix 3 (LG2.3) or LGX. LG2.2, LG6.1, and LG7.2 werenot included in the figures because of incomplete LG development or lower number of mapped markers. Red and blue starsindicate the ahFAD2A and ahFAD2B loci, respectively. For a color version of this figure, please refer to the color plate.
were 186 and 26 in the F2 and the BC2F1 popula-tions, respectively. ARy was calulated by usingthe following equation:
ARy = (h + y × 2) / (x + hy) × 2,
where h, x, and y are the numbers of homozy-gous alleles of ‘Nakateyutaka,’ ‘YI-0311,’ andthe heterozygous allele in the F2 or BC2F1 popu-lations, respectively. ARy values in the F2 popu-lation were approximately 0.5 on most genomicregions in the F2 population. If random plants
were selected during backcrossing, the expectedARy in a BC2F1 population was estimated as1/23 = 0.125. Of the 17 LGs, seven LGs showedARy values less than 0.125 on whole regionsof the LGs. Six of the 17 LGs indicated higherARy values than 0.125 on partial regions ofLGs. The ARy values of the other LGs (LG1.2,LG5.2, LG9.1, and LG9.2) were higher than0.125 on most of regions of the LGs. The higherARy values on LG9.1 9.2 seemed to be causedby the two FAD2 loci. Because progenies withdonor parental genotypes on the two FAD2 loci
MARKER-ASSISTED BACKCROSSING SELECTION FOR HIGH O/L RATIO 187
were selected, genome regions derived from thedonor parent were not excluded. The reason forthe higher ARy values on LG1.2 and 5.2 isnot clear.
Comparison with the Other Agarose GelBase Genotyping Techniquefor FAD2 Loci
In this study, we first used the TaqMan assayfor SNP identification on the FAD2A locus forgenotyping of F2 individuals, then the agarosegel base SNP identification assay (Hayashi et al.2004) was employed for MAS, since our breed-ing program preferred SNP genotyping with sim-ple and inexpensive equipment. As with ourstudy, Chen and colleagues (2010) also reportedan agarose gel base allele-specific PCR assayfor identification of SNPs on FAD2 loci, forsimplifying the techniques and decreasing thecost of SNP genotyping. In the study by Chenand colleagues (2010), five primer sequences(one forward primer and four reverse primers)were developed. One of the four reverse primerswas used for amplification of control DNA frag-ments, while the other three reverse primers weredesigned to amplify allele-specific amplicons.Wild and mutation-specific amplicons wereobtained from individual PCR, then the both wildand the mutation-specific amplicons were mixedand loaded in agarose gel for electrophoresis.
While Chen and colleagues (2011) proposeda two-step PCR for identifying mutation alle-les on the FAD2 loci, in our study a one-step PCR was employed for identification ofthe FAD2A mutation. PCR was performed witha mixture of four primers, that is, a controlforward primer (FAD2AF), a control reverseprimer (FAD2AR), a wild type-specific reverseprimer (NakaR), and a mutant-specific forwardprimer (HachiAF). A primer pair made up ofFAD2AF and FAD2AR was used for obtain-ing control amplicons (293bp), whereas primerpairs FAD2AF and NakaR, and HachiAF andFAD2AR were used for obtaining wild (127bp)and mutant-specific (209bp) amplicons, respec-
tively. In order to disturb the amplification ofthe FAD2B locus, terminal sequences of the con-trol primer pairs were used as FAD2A specificbases. In addition, the third bases from the ter-minals of each of the primers were designed asmismatch bases for obtaining a high specificityof PCR (Hayashi et al. 2004). It is well knownthat the result of a PCR often changes depend-ing on the enzymes used and the thermal cycler.Because the two-step PCR proposed by Chenand colleagues (2010) used more simple primercombinations than are used in the one-step PCR,it is expected that the two-step PCR will delivera more stable result under diverse lab conditions.Meanwhile, the advantage of the one-step PCRover the two-step PCR is the former’s lower costand less intensive labor.
Comparison with the Other BreedingProgram for High O/L with MAS
Chu and colleagues (2011) reported MAS forhigh O/L and nematode resistance in peanut.There are many parameters in our study that aresimilar to and others that contrast with the workcarried out by Chu and colleagues (2011). In thestudy of Chu and colleagues (2011), two lines,‘Georgia-02C’ and ‘Florida-07,’ were used asdonors of the high O/L alleles and crossed with‘Tifguard.’ ‘Tifguard’ was a donor of nematoderesistance traits and used as maternal and recur-rent parent. The mutation allele of ‘Georgia-02C’and ‘Florida-07’ in FAD2A locus was same as‘YI-0811,’ while that in the FAD2B locus wasdifferent from ‘YI-0811,’ that is, 441_442insAmutation. In the study of Chu and colleagues(2011), CAPS markers were first used for SNPidentification, then the HybProbe assay (Bernardet al. 1998) was employed for polymorphic anal-ysis of the 441_442insA mutation, in order toincrease through-put and accuracy of genotyp-ing. Both studies changed the genotyping assayto fit the breeding program, but the directions ofmodification were opposite. The two contrast-ing results indicate that there is no single correctanswer for a genotyping system that uses MAS,
188 TRANSLATIONAL GENOMICS FOR CROP BREEDING
and modification of the system depending on thesituation of the breeding program is important.
Another remarkable difference between thetwo studies appeared in the breeding scheme. Inthis study, backcrossing and selfing were alter-nately performed, while in the study performedby Chu and colleagues (2011), three backcrosseswere continuously done first, then two selfingswere performed. From the point of view of short-ening the breeding period, the scheme used byChu and colleagues (2011) was better than thatused in our study. The main reason for alternat-ing backcrossing and selfing in this study was thedifficulty of performing backcrossing with thelower temperatures prevalent during off-seasonin the greenhouse. In order to compensate for thedisadvantage, GW genotyping was performed todecrease ARv values across the genome. Theideal scheme of MABS for high O/L would beintegration of the schemes used in the two stud-ies: two backcrossings per year with genotypingof GW and FAD2 loci markers in each gener-ation, then selfing with the genotyping of GWmarkers.
Merits of MABS and Future Prospects
In this breeding program, we paid approximatelyUS$5 per sample for the chemicals used in thedetermination of fatty acid content, and two daysof labor were required for the determination.On the other hand, the cost of the chemicalsand the labor required for the investigation ofgenotypes on the two FAD2 loci were approxi-mately USD$1 per sample and one day, respec-tively. Although it was not used in the breedingprogram, a direct PCR approach for genotyp-ing would drive the cost of materials and therequired labor to less than US20¢ and half a day,respectively. These figures indicate the efficiencyof MAS for high O/L ratio breeding in peanut,from the standpoint of breeding costs.
With regard to backcrossing with MAS, theresults in Table 11.1 suggest a higher efficiencyof marker-assisted selection compared to ran-dom selection. However, we recognize that the
benefits of MABS were not fully tested in thisbreeding program for the following reasons. Onewas the lack of a sufficient number of GW poly-morphic markers and information on their posi-tion on a linkage map. Large differences in thegenomic backgrounds were observed across LGsin the BC2F1 generation. Although seven LGswere almost completely replaced by homozy-gous ‘Nakateyutaka’ genomes, four LGs stillkept the ‘YI-0311’ genomes. The utilization ofgraphical genotypes would enhance selectionpressure and improve the strategic selection ineach generation. The MABS was very effectivein many cereal crops such as barley for diseaseresistance, maize for earliness and yield, rice forbacterial blight, wheat for powdery mildew, andso forth (Jefferies et al. 2003; Bouchez et al.2002; Chen et al. 2001; Zhou et al. 2005). More-over, the yield of soybean was increased byusing MABs to introgress a yield QTL from awild accession into commercial genetic back-grounds (Concibido et al. 2003). Those specieshave now developed thousands of GW polymor-phic markers and are able to break precisely alinkage between target genes and unfavorablegenomic regions. As with those crops, recentadvances in molecular genetics in peanut, espe-cially the increasing number of developed mark-ers and constructed linkage maps, should enablea more strategic selection than was attainable inthe present study.
The other factor that limited the efficiencyof MABS was the amount of breeding materialused. Because selection can be done in the earlygrowth period or in seeds, larger numbers of indi-viduals can be used in MAS than in conventionalbreeding. The higher ratio of genomic regionsderived from the donor genome on the four LGsin the BC2F1 generation indicates the need foran increased number of progenies in order toobtain more recurrent parent specific homozy-gous genomic regions in the generation. Increas-ing the amount of breeding material used is apromising solution for that problem. However,limitations in facilities and the labor requiredfor backcrossing and plant management often
MARKER-ASSISTED BACKCROSSING SELECTION FOR HIGH O/L RATIO 189
restrict the up-scaling of breeding materials usedin MABS. In addition, backcrossing was not per-formed in off-season in this study because oflower temperatures in the greenhouse. If back-crossing were to be performed in off-season aswell, the breeding term would be shortened asdescribed by Chu and colleagues (2011). Untilnow, most of the studies on the molecular breed-ing of peanut have focused on the development ofselection markers and demonstration of their util-ity. However, it would be important to determinean ideal balance between the required amountsof plant material and the markers used underlimited facility and labor conditions. The suc-cess of MABS is not achieved only by introduc-ing molecular work in a breeding program. Theentire design of the breeding procedure includ-ing field and greenhouse management plays animportant role for obtaining maximum resultsfrom MAS.
References
Barkley, N.A., Chenault, K.D., Chamberlin, C., Wang,M.L., Pittman, R.N. (2010) Development of a real-timePCR genotyping assay to identify high oleic acid peanuts(Arachis hypogaea L.). Mol Breed 25:541–548.
Bernard, P.S., Lay, M.J., Wittwer, C.T. (1998) Integratedamplification and detection of the C677T point mutationin the methylenetetrahydrofolate reductase gene by flu-orescence resonance energy transfer and probe meltingcurves. Anal. Biochem. 255:101–110.
Bouchez, A., Hospital, F., Causse, M., Gallais, A., Char-cosset, A. (2002) Marker-assisted introgression of favor-able alleles at quantitative trait loci between maize elitelines. Genetics 162:1945–1959.
Bruner, A.C., Jung, S., Abbott, A.G., Powell, G.L.(2001) The naturally occurring high oleate oli charac-ter in some peanut varieties results from reduced oleoyl-PC desaturase activity from mutation of aspartate 150 toasparagine. Crop Sci 41:522–526.
Burow, M.D., Simpson, C.E., Starr, J.L., Paterson,A.H. (2001) Transmission genetics of chromatin froma synthetic amphidiploid to cultivated peanut (Arachishypogaea L.): Broadening the gene pool of a mono-phyletic polyploid species. Genetics 159:823–837.
Butzen, S., Schnebly, S. (2007) High oleic soybean. CropInsights17:1.
Chen, S., Xu, C.G., Lin, X.H., Zhang, Q. (2001) Improvingbacterial blight resistance of ‘6078,’ an elite restorer lineof hybrid rice, by molecular marker-assisted selection.Plant Breed 120:133–137.
Chen, Z., Wang, M.L., Barkley, N.A., Pittman, R.N.(2010) A simple allele-specific PCR assay for detectingFAD2 alleles in both A and B genomes of the cultivatedpeanut for high-oleate trait selection. Plant Mol Biol Rep28:542–548.
Chu, Y., Ramos, L., Holbrook, C.C., Ozias-Akins, P. (2007)Frequency of a loss-of-function mutation in oleoyl-pcdesaturase (ahFAD2A) in the mini-core of the U.S. PeanutGermplasm Collection. Crop Sci 47: 2372–2378.
Chu, Y., Holbrook, C., Ozias-Akins, P. (2009) Two allelesof ahFAD2B control the high oleic acid trait in cultivatedpeanut. Crop Sci 49:2029–2036.
Chu, Y., Wu, C.L., Holbrook, C.C., Tillman, B.L., Person.G., Ozias-Kins, P. (2011) Marker-assisted selection topyramid nematode resistance and the high oleic trait inpeanut. The Plant Genome 4:110–117.
Clemente, T.E., Cahoon, E.B. (2009) Soybean oil: geneticapproaches for modification of functionality and totalcontent. Plant Physiol 151:1030–1040.
Concibido, V.C., La Vallee, B., Mclaird, P., Pineda, N.,Meyer, J., Hummel, L., Yang, J., Wu, K., Delannay, X.(2003) Introgression of a quantitative trait locus for yieldfrom Glycine soja into commercial soybean cultivars.Theor Appl Genet 106:575–582.
Dean, L.L., Hendrix, K.W., Holbrook, C.C., Sanders, T.H.(2009) Content of some nutrients in the core of the coreof the Peanut Germplasm Collection. Peanut Sci 36: 104–120.
Dwivedi S.L., Bertioli, D.J., Crouch, J.H., Valls, J.F.,Updhyaya, H.D., Favero, A., Moretzsohn, M., Paterson,A.H. (2007) Peanut. In: Kore, C. (ed.) Genome mappingand molecular breeding in plants, Vol. 2, Oilseeds Berlinand Heidelberg: Springer-Verlag, pp. 115–151.
FAOSTAT (2006) FAO production yearbook 60. FAOSTAT,Rome, Italy.
Ferguson, M.E., Burow, M.D., Schulze, S.R., Bramel,P.J., Paterson, A.H., Kresovich, S., Mitchell, S.(2004) Microsatellite identification and characterizationin peanut (A. hypogaea L.). Theor Appl Genet 108:1064–1070.
Fonceka, D., Hodo-Abalo, T., Rivallan, R., Faye, I., Sall,M.N., Ndoye, O, Favero, A.P. Bertioli, D., GlaszmannJ.C., Courtois, B., Rami, J.F. (2009) Genetic mapping ofwild introgressions into cultivated peanut: A way towardenlarging the genetic basis of a recent allotetraploid. BMCPlant Biol 9:103.
Garces, R., Mancha, M. (1991) In vitro oleate desaturasein developing sunflower seeds. Phytochemistry 30:2127–2130.
Garcia, G.M., Stalker, H.T., Shroeder, E., Kochert, G.(1996) Identification of RAPD, SCAR, and RFLP mark-ers tightly linked to nematode resistance genes intro-gressed from Arachis cardenasii into Arachis hypogaea.Genome 39:836–845.
Gautami, B., Pandey, M.K., Vadez, V., Nigamm S.N.,Ratnakumar, P., Krishnamurthy, L., Radhakrishnan,T., Gowda, M.V.C., Natasu, M.L., Hoisington, D.A.,
190 TRANSLATIONAL GENOMICS FOR CROP BREEDING
Knapp, S.J., Varshney, R. (2011) Quantitative traitlocus analysis and construction of consensus geneticmap for drought tolerance traits based on three recom-binant inbred line populations in cultivated groundnut(Arachis hypogaea L.). Mol Breed doi: 10.1007/s11032-011-9660-0.
Gimenes, M.A., Lopes, C.R., Valls, J.F.M. (2002) Geneticrelationships among Arachis species based on AFLP.Genet Mol Biol 25:349–353.
Halward, T., Stalker, H.T., Kochert, G. (1993) Developmentof an RFLP linkage map in diploid peanut species. TheorAppl Genet 87:379–384.
Hayashi, K., Hashimono, N., Daigen, M., Ashikawa, I.(2004) Development of PCR-based SNP markers forrice blast resistance at the Piz locus. Theor Appl Genet108:1212–1220.
He, G., Meng, R., Newman, M., Gao, G., Pittman, R.N.,Prakash, C.S. (2003) Microsatellites as DNA markersin cultivated peanut (Arachis hypogaea L.). BMC PlantBiol 3: 3.
He, G., Meng, R.H., Newman, M., Gao, G.Q., Pittman,R.N., Prakash, C.S. (2003) Microsatellites as DNAmarkers in cultivated peanut (Arachis hypogaea L.). BMCPlant Biol 3:3.
Hong Y., Chen X., Liang X., Liu H., Zhou G., Li S., Wen S.,Holbrook CC, Guo B. (2010) A SSR-based compositegenetic linkage map for the cultivated peanut (Arachishypogaea L.) genome. BMC Plant Biol 10:17.
Isobe, S., Nakaya, A., Tabata, S. (2007) Genotype matrixmapping: searching for quantitative trait loci interac-tions in genetic variation in complex traits. DNA Res 14:217–225.
Jefferies, S.P., King, B.J., Barr, A.R., Warner, P., Logue,S.J., Langridge, P. (2003) Marker-assisted backcrossintrogression of the Yd2 gene conferring resistance tobarley yellow dwarf virus in barley. Plant Breed. 122:52–56.
Jung, S., Powell, G., Moore, K., Abbott, A. (2000) The higholeate trait in the cultivated peanut (Arachis hypogaeaL). II. Molecular basis and genetics of the trait. Mol GenGenet 263:806–811.
Khedikar, Y.P., Gowda, M.V., Sarvamangala, C., Patgar,K.V., Upadhyaya, H.D., Varshney, R.K. (2010) A QTLstudy on late leaf spot and rust revealed one major QTLfor molecular breeding for rust resistance in groundnut(Arachis hypogaea L.). Theor Appl Genet 121:971–984.
Kochert, G., Halward, T., Branch, W.D., Simpson, C.E.(1991) RFLP variability in peanut (Arachis hypogaeaL.) cultivars and wild species. Theor Appl Genet 81:565–570.
Koilkonda, P., Sato, S., Tabata, S., Shirasawa, K., Hirakawa,H., Sakai, H., Sasamoto, S., Watanabe, A., Wada, T.,Kishida, Y., Tsuruoka, H., Fujishiro, T., Yamada, M.,Kohara, M., Suzuki, S., Hasegawa, M., Kiyoshima, H.,Isobe, S. (2011) Large-scale development of expressedsequence tag-derived simple sequence repeat markers
and diversity analysis in Arachis spp. Mol Breed doi:10.1007/s11032-011-9604-8.
Krapovickas, A. Gregory, W.C. (1994) Taxonomıa delgenero Arachis (Leguminosae). Bonplandia 8:1–186.
Leal-Bertioli, S.C., Jose, A.C., Alves-Freitas, D.M., Moret-zsohn, M.C., Guimaraes, P.M., Nielen, S., Vidigal, B.S.,Pereira, R.W., Pike, J., Favero, A.P., Parniske, M.,Varshney, R.K., Bertioli, D.J. (2009) Identification ofcandidate genome regions controlling disease resistancein Arachis. BMC Plant Biol 9:112.
Lee, M.S., Guerra, D.J. (1994) Biochemical characterizationof temperature-induced changes in lipid metabolism in ahigh oleic acid mutant of Brassica rapa Arch. BiochemBiophys 315:203–211.
Li, M.J., Wang, X.J., Su, L., Bi, Y.P., Wan, S.B.(2010) Characterization of five putative acyl carrier pro-tein (ACP) isoforms from developing seeds of Arachishypogaea L. Plant Mol Biol Rep. doi: 10.1007/s11105-009-0160-x.
Lopez, Y., Nadaf, H.L., Smith, O.D., Connell, J.P., Reddy,A.S., Fritz, A.K. (2000) Isolation and characterizationof the �12- fatty acid desaturase in peanut (Arachishypogaea L.) and search for polymorphisms for the higholeate trait in spanish markettype lines Theor Appl Genet101:1131–1138.
Lopez, Y., Nadaf, H.L., Smith, O.D., Simpson, C.E.,Fritz, A.K. (2002) Expressed variants of �12-fatty aciddesaturase for the high oleate trait in Spanish market-typepeanut lines. Mol Breed 9:183–190.
Martin, B.A., Rinne, R.W. (1986) A comparison of oleicacid metabolism in the soybean (Glycine max [L.] Merr.)genotypes Williams and A5, a mutant with decreasedlinoleic acid in the seed. Plant Physiol 81:41–44.
Moore, K.M., Knauft, D.A. (1989) The inheritance of higholeic acid in peanut. J. of Heredity 80:252–253.
Moretzsohn, M.C., Barbosa, A.V., Alves-Freitas, D.M.,Teixeira, C., Leal-Bertioli, S.C., Guimaraes, P.M.,Pereira, R.W., Lopes, C.R., Cavallari, M.M., Valls, J.F.,Bertioli, D.J., Gimenes, M.A. (2009) A linkage map forthe B-genome of Arachis (Fabaceae) and its synteny tothe A-genome. BMC Plant Biol 9:40.
Moretzsohn, M.C., Hopkins, M.S., Mitchell, S.E., Kreso-vich, S., Valls, J.F., Ferreira, M.E. (2004) Geneticdiversity of peanut (Arachis hypogaea L.) and its wildrelatives based on the analysis of hypervariable regionsof the genome. BMC Plant Biol 4:11.
Moretzsohn, M.C., Leoi, L., Proite, K., Guimaraes, P.M.,Leal-Bertioli, S.C., Gimenes, M.A., Martins, W.S.,Valls, J.F., Grattapaglia, D., Bertioli, D.J. (2005)A microsatellite-based, gene-rich linkage map for theAA genome of Arachis (Fabaceae). Theor Appl Genet111:1060–1071.
Naito, Y., Suzuki, S., Iwata, Y., Kuboyama, T.(2008) Genetic diversity and relationship analysis ofpeanut germplasm using SSR markers. Breed Sci 58:293–300.
MARKER-ASSISTED BACKCROSSING SELECTION FOR HIGH O/L RATIO 191
Norden, A.J., Gorbet, D.W., Knauft, D.A., Young, C.T.(1987) Variability in oil quality among peanut genotypesin the Florida breeding program. Peanut Sci 14:7–11.
Pandey, M.K., Monyo, E., Ozias-Akins, P., Liang, X.,Guimaraes, P., Nigam, S.N., Upadhyaya, H.D., Janila,P., Zhang, X., Guo, B., Cook, D.R., Bertioli, D.J.,Michelmore, R., Varshney, R.K. (2011) Advances inArachis genomics for peanut improvement. BiotechnolAdv doi: 10.1016/j.biotechadv.2011.11.001.
Patel, M., Jung, S., Moore, K., Powell, G., Ainsworth,C., Abbott, A. (2004) High-oleate peanut mutants resultfrom a MITE insertion into the FAD2 gene. Theor ApplGenet 108:1492–1502.
Patel, M., Jung, S., Moore, K., Powell, G., Ainsworth,C., Abbott, A. (2004) High-oleate peanut mutants resultfrom a MITE insertion into the FAD2 gene. Theor ApplGenet 108:1492–1502.
Pham, A., Lee, J., Shannon, J.G., Bilyeu, K.D. (2010)Mutant alleles of FAD2-1A and FAD2-1B combine toproduce soybeans with the high oleic acid seed oil trait.BMC Plant Biol 10:195.
Proite, K., Leal-Bertioli, S.C., Bertioli, D.J., Moretzsohn,M.C., da Silva, F.R., Martins, N.F., Guimaraes, P.M.(2007) ESTs from a wild Arachis species for gene dis-covery and marker development. BMC Plant Biol 7:7.
Qin, H., Feng, S., Chen, C., Guo, Y., Knapp, S., Culbreath,A., He, G., Wang, M.L., Zhang, X., Holbrook, C.C.,Ozias-Akins, P., Guo, B. (2011) An integrated geneticlinkage map of cultivated peanut (Arachis hypogaea L.)constructed from two RIL populations. Theor Appl Genetdoi: 10.1007/s00122-011-1737-y.
Raina, S.N., Rani, V., Kojima, T., Ogihara, Y., Singh, K.P.,Devarumath, R.M. (2001) RAPD and ISSR fingerprintsas useful genetic markers for analysis of genetic diversity,varietal identification, and phylogenetic relationships inpeanut (Arachis hypogaea L.) cultivars and wild species.Genome 44:763–772.
Ravi, K., Vadez, V., Isobe, S., Mir, R.R., Guo, Y.,Nigam, S.N., Gowda, M.V., Radhakrishnan, T., Berti-oli, D.J., Knapp, S.J., Varshney, R.K. (2011) Identi-fication of several small main-effect QTLs and a largenumber of epistatic QTLs for drought tolerance relatedtraits in groundnut (Arachis hypogaea L.). Theor ApplGenet 122:1119–1132.
Seijo, G., Lavia, G.I., Fernandez, A., Krapovickas, A.,Ducasse, D.A., Bertioli, D.J., Moscone, E.A. (2007)Genomic relationships between the cultivated peanut
(Arachis hypogaea, Leguminosae) and its close relativesrevealed by double GISH. Am J Bot 94:1963–1971.
Seijo, J.G., Lavia, G.I., Fernandez, A., Krapovickas, A.,Ducassem D, Mosconem, E.A. (2004) Physical map-ping of the 5S and 18S–25S rRNA genes by FISH asevidence that Arachis duranensis and A. ipaensis are thewild diploid progenitors of A. hypogaea (Leguminosae).Am J Bot 2004, 91:1294–1303.
Shirasawa, K., Hirakawa, H., Tabata, S., Hasegawa, M.,Kiyoshima, H., Suzuki, S., Sasamoto, S., Watanabe, A.,Fujishiro, T., Isobe, S. (2012) Characterization of activeminiature inverted-repeat transposable elements in thepeanut genome. Theor Appl Genet doi: 10.1007/s00122-012-1798-6.
Sujay, V., Gowda, M.V.C., Pandey, M.K., Bhat, R.S.,Khedikar, Y.P., Nadaf, H.L., Gautami, B., Sarvaman-gala, C., Lingaraju, S., Radhakrishan, T., Knapp, S.J.,Varshney, R.K. (2011) Quantitative trait locus analy-sis and construction of consensus genetic map for foliardisease resistance based on two recombinant inbred linepopulations in cultivated groundnut (Arachis hypogaeaL.). Mol Breed doi: 10.1007/s11032-011-9661-z.
Varshney, R.K., Bertioli, D.J., Moretzsohn, M.C., Vadez,V., Krishnamurthy, L., Aruna, R., Nigam, S.N., Moss,B.J., Seetha, K., Ravi, K., He, G., Knapp, S.J., Hois-ington, D.A. (2009) The first SSR-based genetic link-age map for cultivated groundnut (Arachis hypogaea L.).Theor Appl Genet 118:729–739.
Wang, H., Penmetsa, R.V., Yuan, M., Gong, L., Zhao, Y.,Guo, B., Farmer, A.D., Rosen, B.D., Gao, J., Isobe,S., Bertioli, D.J., Varshney, R.K., Cook, D.R., He,G. (2012) Development and characterization of BAC-end sequence derived SSRs, and their incorporation intoa new higher density genetic map for cultivated peanut(Arachis hypogaea L.). BMC Plant Biol 12:10.
Yin, D., Cui, D. (2006) Identification and molecular phy-logenetic relationships of �12-fatty acid desaturase inArachis. Euphy 150:347–354.
Yu, S., Pan, L., Yang, Q., Min, P., Ren, X., Zhang, H.(2008) Comparison of the �12 fatty acid desaturase genebetween high-oleic and normal-oleic peanut genotypes.J Genet Genomics 35:679–685.
Zhou, R.H., Zhu, Z.D., Kong, X.Y., Huo, N.X.,Tian, Q.Z., Li, P., Jin, C.Y., Dong, Y.C., Jia, J.Z.(2005) Development of wheat near-isogenic lines forpowdery mildew resistance. Theor Appl Genet 110,640–648.