Embed Size (px)
Citation preview
TRANSNET NATIONAL PORTS AUTHORITY
TARIFF APPLICATION FOR FINANCIAL YEAR 2020/21
Transnet National Ports Authority Tariff Application for Financial Year 2020/21 __________________
Page 1 of 69
Table of Contents 1.Executive Summary……………………………………………………………………………………………………………………….. 8
2.Introduction………………………………………………………………………………………………………………………………… 10
3.Legal Basis and Regulatory Requirements……………………………………………………………………………………. 10
4.Tariff Methodology……………………………………………………………………………………………………………………… 11
4.1Methodology for the valuation of the Authority’s RAB ................................................................... 11
5.The Business of the Authority……………………………………………………………………………………………………… 12
5.1Introduction ..................................................................................................................................... 12
5.2Functions of the Authority ............................................................................................................... 12
5.3Tariffs in Perspective........................................................................................................................ 14
6.Port Infrastructure Development Plan and Capital Expenditure…………………………………………………… 17
6.1Port Investment planning ................................................................................................................ 17
6.2The Authority’s Capital Investment Programme ............................................................................. 17
6.3Key Focus Areas of Capital Investment Program in FY 2020/21 to FY 2022/23 .............................. 18
7.The Authority’s Total Revenue…………………………………………………………………………………………………….. 20
7.1Real Estate Revenue ........................................................................................................................ 20
7.2Private Sector Participation in the Port Sector (Concession Programmes) ..................................... 21
7.3Marine Business Revenue ................................................................................................................ 23
7.3.1The Authority’s Volumes ............................................................................................................... 23
7.4Cargo ............................................................................................................................................... 23
7.4.1Containers ..................................................................................................................................... 25
7.4.2Automotives ................................................................................................................................. 26
7.4.3Break Bulk ..................................................................................................................................... 27
7.4.4Coal ............................................................................................................................................... 27
7.4.5Iron Ore ......................................................................................................................................... 27
7.4.6Manganese Ore ............................................................................................................................ 28
7.4.7Liquid Bulk .................................................................................................................................... 28
7.5Marine Services ............................................................................................................................... 29
8.Tariff Application Approach…………………………………………………………………………………………………………. 31
8.1Revenue Requirement Formula ....................................................................................................... 31
8.1.1Regulatory Asset Base .................................................................................................................. 31
8.1.2Weighted Average Cost of Capital................................................................................................ 33
8.1.3Valuation of the RAB .................................................................................................................... 33
Transnet National Ports Authority Tariff Application for Financial Year 2020/21 __________________
Page 2 of 69
8.1.4Taxation ........................................................................................................................................ 34
8.1.5Operating Costs ............................................................................................................................ 35
8.1.6Revenue Claw-back ....................................................................................................................... 36
8.2Revenue Requirement...................................................................................................................... 37
8.3The Tariff Strategy ........................................................................................................................... 38
8.3.1Asset Cost Allocations ................................................................................................................... 38
8.3.2Tariff Book Proposal for FY 2020/21 ............................................................................................ 40
8.4An update on clauses in the Tariff Book .......................................................................................... 42
8.5Port Tariff Incentive Programme (PTIP) ........................................................................................... 42
9.Port Efficiency……………………………………………………………………………………………………………………………… 43
10.Weighted Efficiency Gains from Operations………………………………………………………………………………. 44
11.Conclusion…………………………………………………………………………………………………………………………………. 46
ANNEXURE A: The Authority’s Tariff Book………………………………………………………………………………………. 47
ANNEXURE B: Capital Expenditure………………………………………………………………………………………………….. 48
ANNEXURE C: Volumes…………………………………………………………………………………………………………………… 55
ANNEXURE D: Operating Expenditure (“Opex”)……………………………………………………………………………… 56
ANNEXURE E: FY 2020/21 Tariff Book Changes………………………………………………………………………………. 66
Transnet National Ports Authority Tariff Application for Financial Year 2020/21 __________________
Page 3 of 69
Tables
Table 1: Revenue Requirement FY 2020/21 to FY 2022/23 ....................................................................... 9
Table 2: Marine Revenue for FY 2020/21 to FY 2022/23 ........................................................................... 9
Table 3: The Authority’s Core Functions .................................................................................................. 13
Table 4: The Authority’s Services and Corresponding Revenue Streams................................................. 16
Table 5: Operation Phakisa Major Projects .............................................................................................. 19
Table 6: Strategic Capital Investment Objectives ..................................................................................... 19
Table 7: Real Estate Salient Features ....................................................................................................... 21
Table 8: FY 2020/21 Concession Programme ........................................................................................... 22
Table 9: Authority’s Volume Projection ................................................................................................... 25
Table 10: Working Capital ........................................................................................................................ 32
Table 11: Weighted Average Cost of Capital (WACC)............................................................................... 33
Table 12: Opening Regulatory Asset Base ................................................................................................ 33
Table 13: Regulatory Asset Base............................................................................................................... 34
Table 14: Equitable Tax calculation .......................................................................................................... 34
Table 15: Tax Calculation .......................................................................................................................... 35
Table 16: Operating Costs Including Group Costs .................................................................................... 35
Table 17: Re-computation of RR for FY 2018/19 ...................................................................................... 36
Table 18: Revenue Requirement from FY 2020/21 to FY 2022/23 .......................................................... 37
Table 19: Revenues related to volume growth (FY 2020/21) ................................................................... 37
Table 20: Marine Revenue for FY 2020/21 to FY 2022/23 ....................................................................... 38
Table 21: Differentiated Tariff Approach results ...................................................................................... 41
Table 22: WEGO Results for FY2018/19 ................................................................................................... 45
Table 23: The Authority’s Tariff Definitions ............................................................................................. 47
Table 24: The Authority's License Fees .................................................................................................... 48
Table 25: Strategic Capital Investment Objectives ................................................................................... 48
Table 26: Strategic Capital Investment Objectives ................................................................................... 49
Table 27: Operation Phakisa Major Projects ............................................................................................ 49
Table 28: Expansion Business vs. Maintenance of Current Business ....................................................... 50
Table 29: Ports Related Spending by Asset Type ..................................................................................... 51
Table 30: Capital expenditure and throughput per commodity .............................................................. 52
Table 31: Multi-Year Strategic Objectives ................................................................................................ 54
Table 32: Multi-Year Capex per Port Service ............................................................................................ 54
Table 33: Multi-Year Ports Related by Asset type .................................................................................... 54
Table 34: Multi-Year Port Related per Commodity .................................................................................. 54
Table 35: Cargo Dues Revenue from Volume Increase Before Tariff Increase ........................................ 55
Table 36: Operating Expenditure ............................................................................................................. 56
Table 37: Total Number of Employees ..................................................................................................... 56
Table 38: The Authority’s Sundry Operating Costs .................................................................................. 64
Table 39: Breakdown of Other 1 Cost ...................................................................................................... 64
Table 40: Group Overhead Costs ............................................................................................................. 65
Table 41: Proposed Tariff Book changes .................................................................................................. 66
Transnet National Ports Authority Tariff Application for Financial Year 2020/21 __________________
Page 4 of 69
Figures
Figure 1: Customer Centred World Class Logistics and Industrial Hubs ................................................... 12
Figure 2: Port Services .............................................................................................................................. 15
Figure 3: Historical Real Estate Performance ........................................................................................... 21
Figure 4: South Africa’s main trading partners in 2018 (Source: Department of Trade and Industry) .... 26
Figure 5: New built orders of containerships (2015-18) ................................................................... 29
Figure 6: Evolution of number of mega-ships deployed ..................................................................... 29
Figure 7: Port vessel calls .......................................................................................................................... 30
Figure 8: Ports Regulator’s Asset Allocations ........................................................................................... 39
Figure 9: Transition to the Regulator’s Tariff Strategy ............................................................................. 40
Figure 10: Transition to the Regulator’s Tariff Strategy ........................................................................... 42
Figure 11: Port Performance Model ......................................................................................................... 43
Transnet National Ports Authority Tariff Application for Financial Year 2020/21 __________________
Page 5 of 69
ABBREVIATIONS AND ACRONYMS
AFS Annual Financial Statements APDP Automotive Production Development Program BER BESA
Bureau of Economic Research Bond Exchange of South Africa
BRICS Brazil, Russia, India, China & South Africa CAGR Compounded Annual Growth Rate CAPEX Capital Expenditure CAPM Capital Asset Pricing Model CMEO Chief Marine Engineering Officer CPI Consumer Price Index CPT Cape Town CSI Corporate Social Investment CWIP Capital Work In Progress DBN Durban DBT Dry Bulk Terminal DCT Durban Container Terminal DDOP Durban Dig Out Port DIA (Old) Durban International Airport DMS Dimson, Marsh and Staunton DMTN Domestic Medium Term Note DORC Depreciated Optimised Replacement Cost DoT Department of Transport DRS Dredging Services EIMS Enterprise Information Management Services EL East London EPMO Enterprise Programme Management Office ETIMC Excessive Tariff Increase Margin Credit FEL Front End Loading FMCSA Ford Motor Company of Southern Africa FY GDP
Financial Year Gross Domestic Product
GMTN Global Medium Term Note GPPCS Global Port Pricing Comparator Study GRT Gross Registered Tonnage HC HCM
Historic Cost Human Capital Management
HOPS Haulier-Road Operations Performance Standards IAS International Accounting Standards IDZ IMF IPAP
Industrial Development Zone International Monetary Fund Industrial Policy and Action Plan
IPMS Integrated Port Management System JOC Joint Operations Centres JSE Johannesburg Stock Exchange KAM KPI
Key Account Manager Key Performance Indicators
LE LNG
Latest Estimate Liquefied Natural Gas
Transnet National Ports Authority Tariff Application for Financial Year 2020/21 __________________
Page 6 of 69
LTPF Long-term Transnet Planning Framework MDS Market Demand Strategy MIDP Motor Industry Development Plan MOPS Marine Operations Performance Standards MPT Multi-Purpose Terminal MRP Market Risk Premium MSOE Marine School of Excellence MTBSA Man Truck and Bus South Africa Mtpa Millions tonnes per annum NAAMSA National Association of Automobile Manufacturers of South Africa NBV Net Book Value NGQ Ngqura NIMS National Infrastructure Maintenance Strategy NPA National Ports Authority NPCC National Port Consultative Committee NPP National Ports Plan OD Operating Divisions OEMs Original Equipment Manufacturers OPEC Organisation of Petroleum Exporting Countries Opex Operating Expenses PCC PRSA / The Regulator PETROSA
Port Consultative Committee Port Regulator of South Africa Petroleum South Africa
PE Port Elizabeth PLP Project Life Cycle Process RAB RR
Regulatory Asset Base Revenue Requirement
RFR Risk Free Rate
RBCT Richards Bay Coal Terminal RCB Richards Bay ROD Record of Decision ROPS RORO
Rail Operations Performance Standards Roll on Roll off
SA South Africa SAMSA South African Maritime Safety Association SARB South African Reserve Bank SARS South African Revenue Services SBIDZ Saldanha Bay Industrial Development Zone SLD SOC
Saldanha Bay State Owned Company
SOE State Owned Enterprise SRAB Starting Regulatory Asset Base TCC Transnet Corporate Centre TEU Twenty-foot Equivalent Unit TOC Trended Original Cost TONS Tonnages TOPS Terminal Operator Performance Standards TP Transnet Property TPT Transnet Port Terminals TSHD Trailing Suction Hopper Dredger
Transnet National Ports Authority Tariff Application for Financial Year 2020/21 __________________
Page 7 of 69
UK United Kingdom USA United States of America VoA Methodology for the valuation of the Authority’s RAB VWSA Volkswagen South Africa WACC WEGO WTO
Weighted Average Cost of Capital Weighted Efficiency Gains from Operations World Trade Organisation
Transnet National Ports Authority Tariff Application for Financial Year 2020/21 __________________
Page 8 of 69
1. Executive Summary
In terms of Section 72 (1) (a) of the National Ports Act, 2005 (Act No. 12 of 2005) (”the Act”), the Transnet
National Ports Authority, a division of Transnet SOC Limited (“the Authority”) is required, with the
approval of the Ports Regulator of South Africa (“the Regulator”), to determine tariffs for services and
facilities offered by the Authority and to annually publish a Tariff Book containing those tariffs. The Port
Directives were approved on 13 July 2009 (gazetted on 06 August 2009) and amended on 29 January
2010 (“the Directives”). In terms of the Directives, when considering the proposed tariffs for the
Authority, the Regulator must ensure that such tariffs allow the Authority to:
a) recover its investment in owning, managing, controlling and administering ports and its
investment in port services and facilities;
b) recover its costs in maintaining, operating, managing, controlling and administering ports and
its costs in providing port services and facilities; and
c) earn a return commensurate with the risk of owning, managing, controlling and administering
ports and of providing port services and facilities.
The Authority shall on an annual basis on or before 1 August submit its application setting out its
proposed tariffs for all services and facilities offered by the Authority for the following financial year for
approval by the Regulator. The Directives also allows the Authority to submit to the Regulator a proposal
for the amendment of any tariff for any services and/or facilities offered by the Authority at any port
from time to time. The Directives prescribe a period of 4 months from the date of receipt of the
submission upon which the Regulator shall make a decision.
In determining the tariffs, the Authority applies the prescribed Tariff Methodology issued by the
Regulator on 30 March 2017 (“the Tariff Methodology”). The Tariff Methodology allows the Regulator
to administer the Authority’s tariff setting process and considers a multi-year approach, applicable from
2018/19 to 2020/21 tariff years. It further allows for an annual review and an annual adjustment of
tariffs within the three year period as opposed to fixing the tariffs for the full period. Whilst the
Authority remains mindful that the Tariff Methodology is only applicable up to FY 2020/21, the Tariff
Application for the indicative years of FY 2021/22 and FY 2022/23, has been prepared on the basis of
the 30 March 2017 Tariff Methodology as the new Methodology is not yet finalised.
The approach applicable to the tariff period FY 2020/21, per the Tariff Methodology, is based on the
Revenue Requirement (RR) formula as follows:
Revenue Requirement
= Regulatory Asset Base (RAB) x Weighted Average Cost of Capital (WACC)
+ Operating Costs + Depreciation + Taxation Expense ± Claw-back
± Excessive Tariff Increase Margin Credit (ETIMC)/
± Weighted Efficiency Gains from Operations (WEGO)
Transnet National Ports Authority Tariff Application for Financial Year 2020/21 __________________
Page 9 of 69
On 29 March 2018, the Regulator issued the “Methodology for the Valuation of the National Ports
Authority’s Regulatory Asset Base” (VoA). The methodology considers a hybrid approach where assets
with capitalisation dates pre-1990 are valued at Historical Cost (HC), whilst assets in existence post 1990
are valued at Trended Original Cost (TOC).
The Regulator required implementation of the VoA in the FY 2019/20 Tariff Application. However, the
Authority, cognizant of the significant financial risks associated with the implementation of the VoA,
determined the RAB, in accordance with the approved Tariff Methodology of March 2017 (original
method). Subsequently, in its Record of Decision (ROD) on the Tariff Application for FY 2019/20, the
Regulator decided to apply the TOC methodology to all assets, inclusive of assets pre-1990 and post-
1990, in its application of the financial capital maintenance principle. The Regulator, in its ROD, further
determined that it will “finalise the specific approach of RAB valuation within the next multi-year tariff
methodology (MYM3) which the Regulator will be conducting in 2019/20.” The determination of the RAB
in the tariff application for FY 2020/21 has therefore been prepared on the TOC Methodology, with each
asset depreciated according to its own useful life.
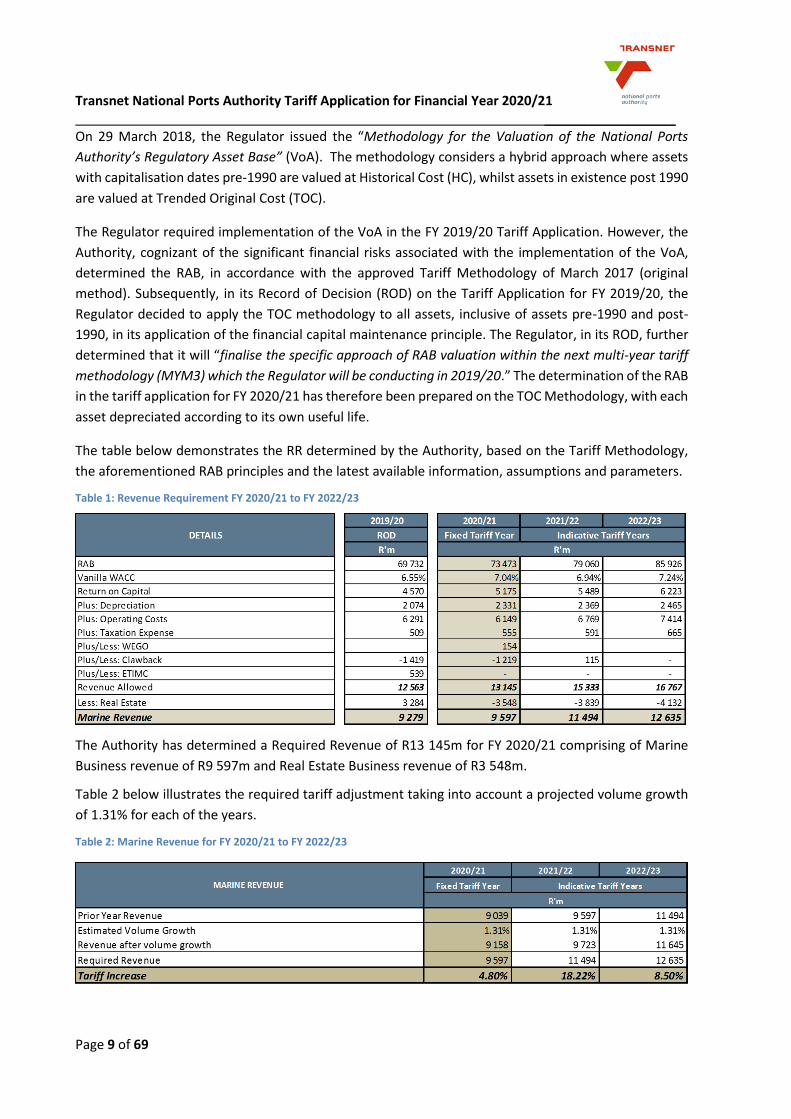
The table below demonstrates the RR determined by the Authority, based on the Tariff Methodology,
the aforementioned RAB principles and the latest available information, assumptions and parameters.
Table 1: Revenue Requirement FY 2020/21 to FY 2022/23
The Authority has determined a Required Revenue of R13 145m for FY 2020/21 comprising of Marine
Business revenue of R9 597m and Real Estate Business revenue of R3 548m.
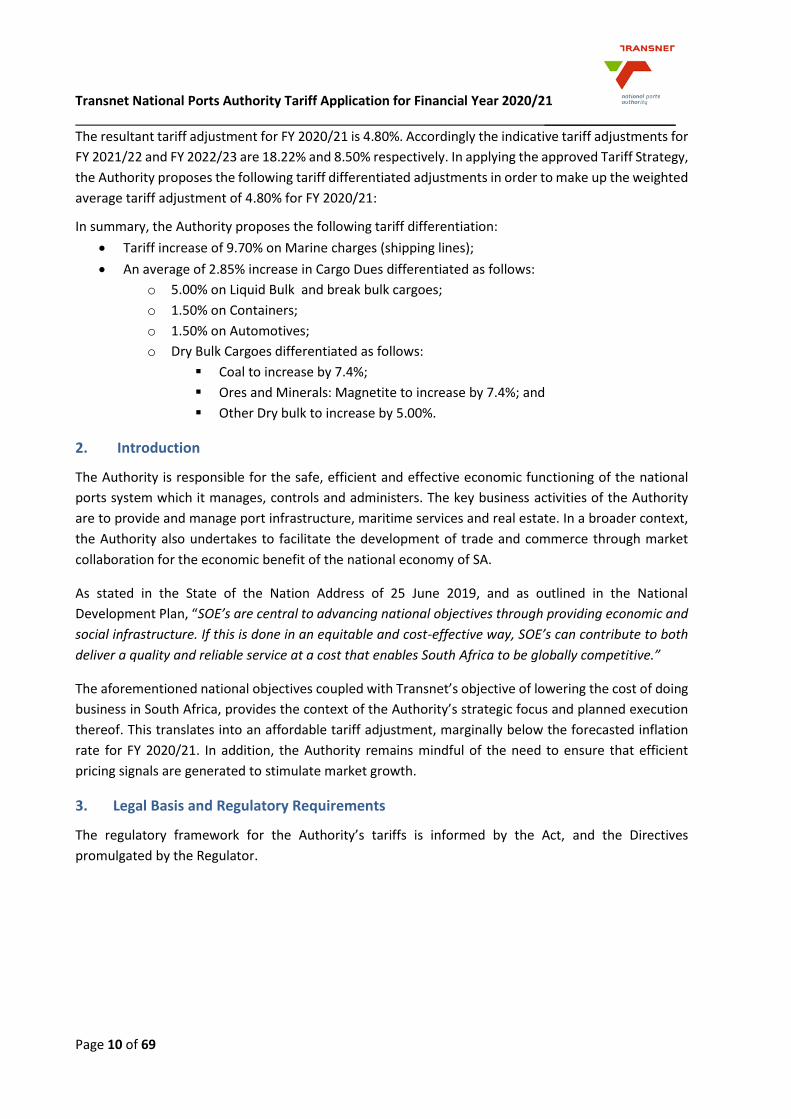
Table 2 below illustrates the required tariff adjustment taking into account a projected volume growth
of 1.31% for each of the years.
Table 2: Marine Revenue for FY 2020/21 to FY 2022/23
Transnet National Ports Authority Tariff Application for Financial Year 2020/21 __________________
Page 10 of 69
The resultant tariff adjustment for FY 2020/21 is 4.80%. Accordingly the indicative tariff adjustments for
FY 2021/22 and FY 2022/23 are 18.22% and 8.50% respectively. In applying the approved Tariff Strategy,
the Authority proposes the following tariff differentiated adjustments in order to make up the weighted
average tariff adjustment of 4.80% for FY 2020/21:
In summary, the Authority proposes the following tariff differentiation:
Tariff increase of 9.70% on Marine charges (shipping lines);
An average of 2.85% increase in Cargo Dues differentiated as follows:
o 5.00% on Liquid Bulk and break bulk cargoes;
o 1.50% on Containers;
o 1.50% on Automotives;
o Dry Bulk Cargoes differentiated as follows:
Coal to increase by 7.4%;
Ores and Minerals: Magnetite to increase by 7.4%; and
Other Dry bulk to increase by 5.00%.
2. Introduction
The Authority is responsible for the safe, efficient and effective economic functioning of the national
ports system which it manages, controls and administers. The key business activities of the Authority
are to provide and manage port infrastructure, maritime services and real estate. In a broader context,
the Authority also undertakes to facilitate the development of trade and commerce through market
collaboration for the economic benefit of the national economy of SA.
As stated in the State of the Nation Address of 25 June 2019, and as outlined in the National
Development Plan, “SOE’s are central to advancing national objectives through providing economic and
social infrastructure. If this is done in an equitable and cost-effective way, SOE’s can contribute to both
deliver a quality and reliable service at a cost that enables South Africa to be globally competitive.”
The aforementioned national objectives coupled with Transnet’s objective of lowering the cost of doing
business in South Africa, provides the context of the Authority’s strategic focus and planned execution
thereof. This translates into an affordable tariff adjustment, marginally below the forecasted inflation
rate for FY 2020/21. In addition, the Authority remains mindful of the need to ensure that efficient
pricing signals are generated to stimulate market growth.
3. Legal Basis and Regulatory Requirements
The regulatory framework for the Authority’s tariffs is informed by the Act, and the Directives
promulgated by the Regulator.
Transnet National Ports Authority Tariff Application for Financial Year 2020/21 __________________
Page 11 of 69
4. Tariff Methodology
The Tariff Methodology was issued on 30 March 2017 and is applicable for a period of 3 years, from FY
2018/19 to FY 2020/21.
The Tariff Methodology prescribes an approach that requires an annual review and an annual
adjustment of tariffs within the three year period as opposed to fixing the prices for the full period. This
means that a tariff determination is requested for year one of the three year tariff period, and indicative
tariff adjustments are provided for the subsequent two years.
This approach has simplified the revenue and tariff determination for the Authority and allows for
effective participation by industry stakeholders. In addition, the Tariff Methodology narrows the gap
between what is requested and subsequently granted as it is based on rules which are uniformly applied
by both the Authority and the Regulator.
The Tariff Methodology is premised on the RR approach with the formula set out below:
Revenue Requirement
= Regulatory Asset Base (RAB) x Weighted Average Cost of Capital (WACC)
+ Operating Costs + Depreciation + Taxation Expense ± Claw-back
± Excessive Tariff Increase Margin Credit (ETIMC)
± Weighted Efficiency Gains from Operations (WEGO)
4.1 Methodology for the valuation of the Authority’s RAB
On 29 March 2018, the Regulator issued the VoA methodology, which was intended to be used to
establish the Starting Regulatory Asset Base (SRAB). The VoA considers a hybrid approach where assets
with capitalisation dates pre-1990 are valued at HC, whilst assets in existence from and post 1990 are
valued at TOC.
The Regulator required implementation of the VoA in the FY 2019/20 Tariff Application. However, the
Authority, cognizant of the significant financial risks associated with its implementation, determined the
RAB in accordance with the approved Tariff Methodology of March 2017 (original method).
Subsequently, in its FY 2019/20 Tariff Application, the Regulator applied the TOC methodology to all
assets, irrespective of the capitalization dates.
In the ROD, the Regulator further determined that it will “finalise the specific approach of RAB valuation
within the next multi-year tariff methodology (MYM3) which the Regulator will be conducting in
2019/20.” The determination of the RAB in the tariff application for FY 2020/21 has therefore been
prepared on the TOC Methodology, with each asset class or category, depreciated according to its
associated useful life.
Transnet National Ports Authority Tariff Application for Financial Year 2020/21 __________________
Page 12 of 69
5. The Business of the Authority
5.1 Introduction
The Authority operates within the port industry, providing services to its target market comprising of
port users, which includes (but Is not limited to) terminal operators, shipping lines, ship agents, cargo
owners and the clearing and forwarding industry. The Authority owns and manages nine commercial
ports within South Africa namely, Port Nolloth, Saldanha Bay, Cape Town, Mossel Bay, Port Elizabeth,
Ngqura, East London, Durban and Richards Bay.
Port Nolloth is currently not a fully operational commercial port and renders maritime services of a basic
nature supporting fishing and supply vessels.
Port infrastructure and maritime services are provided in five market segments namely, containers, dry
bulk, liquid bulk, break-bulk and automotive. The major commodities handled at the ports are coal, iron
ore, manganese, containers, automotive, steel, fruit, ferrochrome and petroleum products. Growth of
these commodities is a function of global demand, logistics infrastructure capacity and supply chain
efficiencies which include port efficiencies.
Port users fall into three main categories, namely, terminal operators, shipping lines and cargo owners.
While numerous other parties utilise the port, they do so to a lesser extent than these principal port
users.
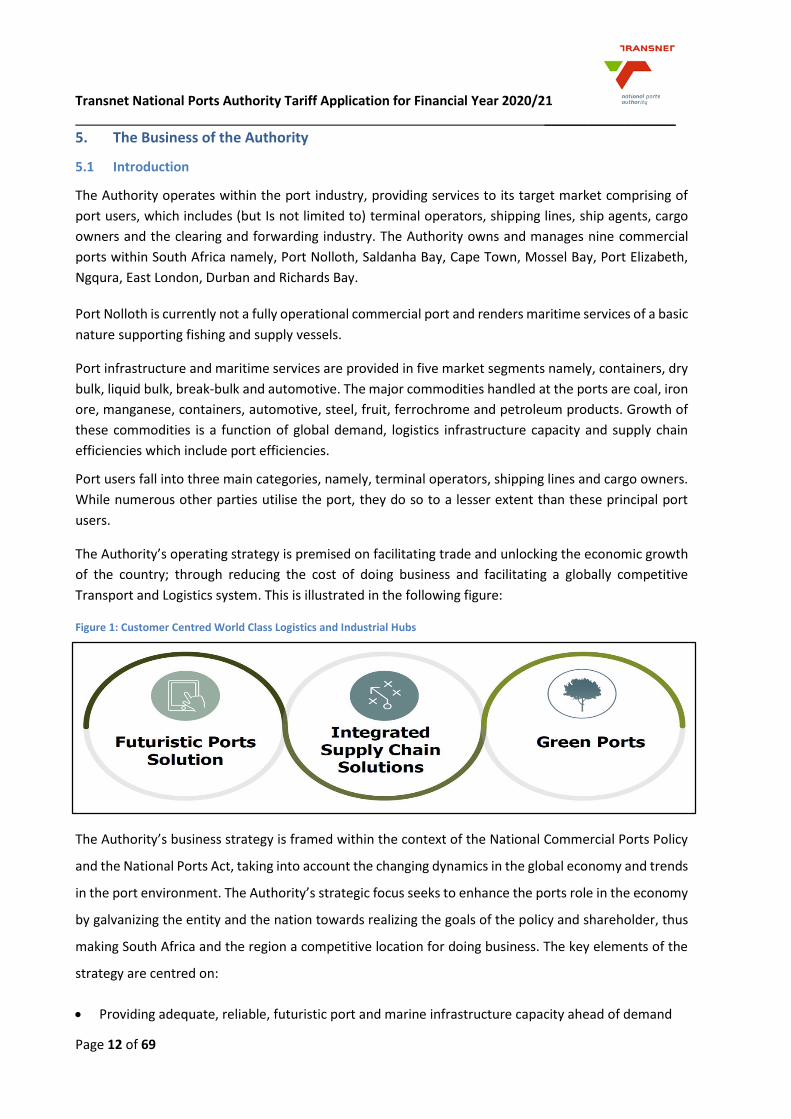
The Authority’s operating strategy is premised on facilitating trade and unlocking the economic growth
of the country; through reducing the cost of doing business and facilitating a globally competitive
Transport and Logistics system. This is illustrated in the following figure:
Figure 1: Customer Centred World Class Logistics and Industrial Hubs
The Authority’s business strategy is framed within the context of the National Commercial Ports Policy
and the National Ports Act, taking into account the changing dynamics in the global economy and trends
in the port environment. The Authority’s strategic focus seeks to enhance the ports role in the economy
by galvanizing the entity and the nation towards realizing the goals of the policy and shareholder, thus
making South Africa and the region a competitive location for doing business. The key elements of the
strategy are centred on:
Providing adequate, reliable, futuristic port and marine infrastructure capacity ahead of demand
Transnet National Ports Authority Tariff Application for Financial Year 2020/21 __________________
Page 13 of 69
Improving port efficiencies through benchmarked standards and effective oversight
Influencing the development of globally competitive integrated supply chain solutions
Advancing real estate property development and value added offerings
Innovative port pricing to support economic development and growth
The overarching aspiration of the Authority’s strategy, consistent with shareholder expectations, is to
transcend beyond landlordism and unlock economic growth by contributing to reducing the cost of
doing business and influencing the development of globally competitive ports, transport and logistic
systems for the country and the region. Successful implementation of the strategy will enhance inclusive
economic growth and social transformation.
5.2 Functions of the Authority
The National Commercial Ports Policy requires that the Authority be responsible for the management of
the national commercial port system as a landlord port authority. Being the Authority means that the
Authority:
Owns, develops and maintains port infrastructure;
Does not engage in landside port operations (except as operator of last resort);
Does not employ cargo handling labour;
Fulfils a port regulatory function including oversight and port landowner function; and
Owns all port land.
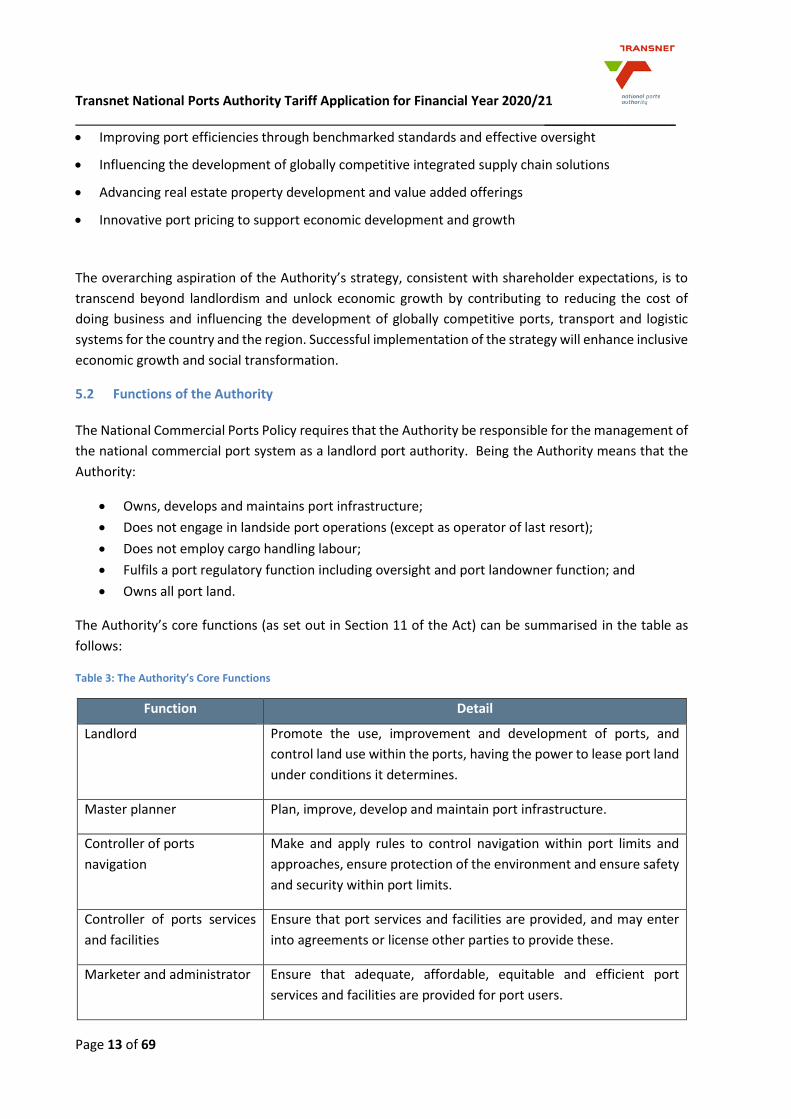
The Authority’s core functions (as set out in Section 11 of the Act) can be summarised in the table as
follows:
Table 3: The Authority’s Core Functions
Function Detail
Landlord Promote the use, improvement and development of ports, and
control land use within the ports, having the power to lease port land
under conditions it determines.
Master planner Plan, improve, develop and maintain port infrastructure.
Controller of ports
navigation
Make and apply rules to control navigation within port limits and
approaches, ensure protection of the environment and ensure safety
and security within port limits.
Controller of ports services
and facilities
Ensure that port services and facilities are provided, and may enter
into agreements or license other parties to provide these.
Marketer and administrator Ensure that adequate, affordable, equitable and efficient port
services and facilities are provided for port users.
Transnet National Ports Authority Tariff Application for Financial Year 2020/21 __________________
Page 14 of 69
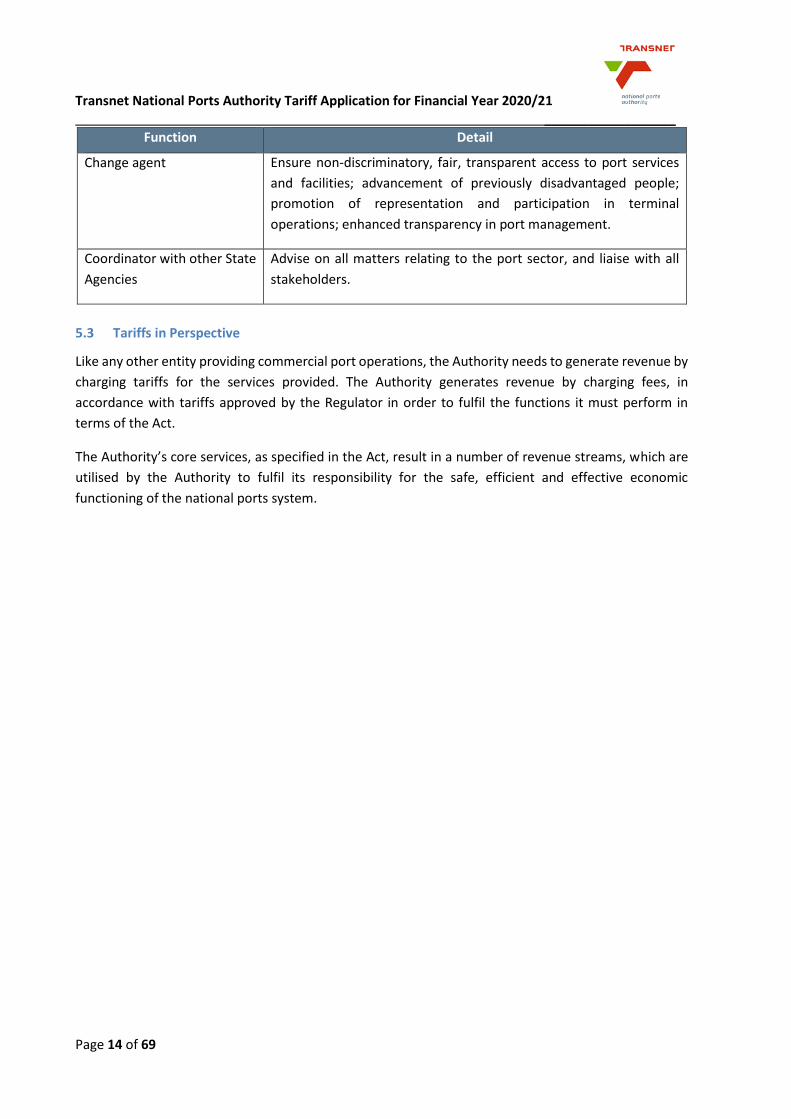
Function Detail
Change agent Ensure non-discriminatory, fair, transparent access to port services
and facilities; advancement of previously disadvantaged people;
promotion of representation and participation in terminal
operations; enhanced transparency in port management.
Coordinator with other State
Agencies
Advise on all matters relating to the port sector, and liaise with all
stakeholders.
5.3 Tariffs in Perspective
Like any other entity providing commercial port operations, the Authority needs to generate revenue by
charging tariffs for the services provided. The Authority generates revenue by charging fees, in
accordance with tariffs approved by the Regulator in order to fulfil the functions it must perform in
terms of the Act.
The Authority’s core services, as specified in the Act, result in a number of revenue streams, which are
utilised by the Authority to fulfil its responsibility for the safe, efficient and effective economic
functioning of the national ports system.
Transnet National Ports Authority Tariff Application for Financial Year 2020/21 __________________
Page 15 of 69
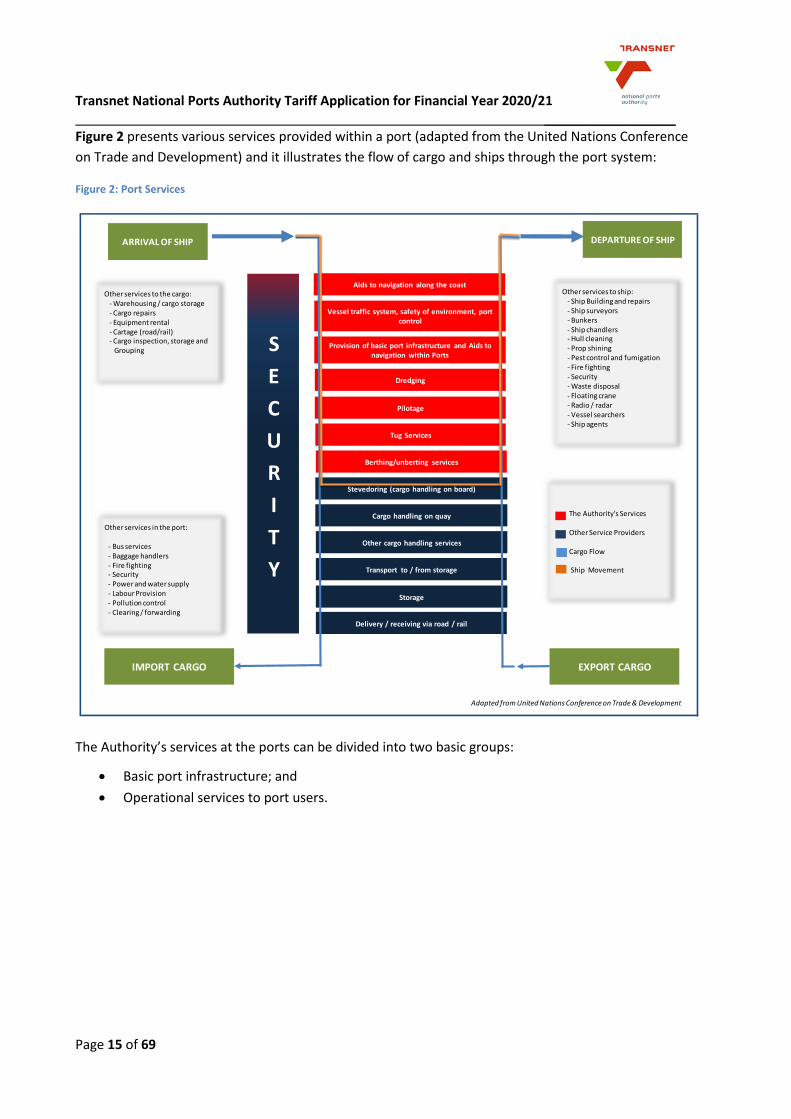
Figure 2 presents various services provided within a port (adapted from the United Nations Conference
on Trade and Development) and it illustrates the flow of cargo and ships through the port system:
Figure 2: Port Services
The Authority’s services at the ports can be divided into two basic groups:
Basic port infrastructure; and
Operational services to port users.
Other services to the cargo:- Warehousing / cargo storage- Cargo repairs- Equipment rental- Cartage (road/rail)- Cargo inspection, storage and
Grouping
Other services in the port:
- Bus services - Baggage handlers- Fire fighting- Security- Power and water supply- Labour Provision- Pollution control- Clearing / forwarding
Aids to navigation along the coast
Vessel traffic system, safety of environment, port control
Provision of basic port infrastructure and Aids to navigation within Ports
Dredging
Pilotage
Tug Services
Berthing/unberting services
Stevedoring (cargo handling on board)
Cargo handling on quay
Other cargo handling services
Transport to / from storage
Storage
Delivery / receiving via road / rail
IMPORT CARGO EXPORT CARGO
Other services to ship:- Ship Building and repairs- Ship surveyors- Bunkers- Ship chandlers- Hull cleaning- Prop shining- Pest control and fumigation- Fire fighting- Security- Waste disposal- Floating crane- Radio / radar- Vessel searchers- Ship agents
S
E
C
U
R
I
T
Y
Adapted from United Nations Conference on Trade & Development
The Authority's Services
Other Service Providers
Cargo Flow
Ship Movement
DEPARTURE OF SHIPARRIVAL OF SHIP
Transnet National Ports Authority Tariff Application for Financial Year 2020/21 __________________
Page 16 of 69
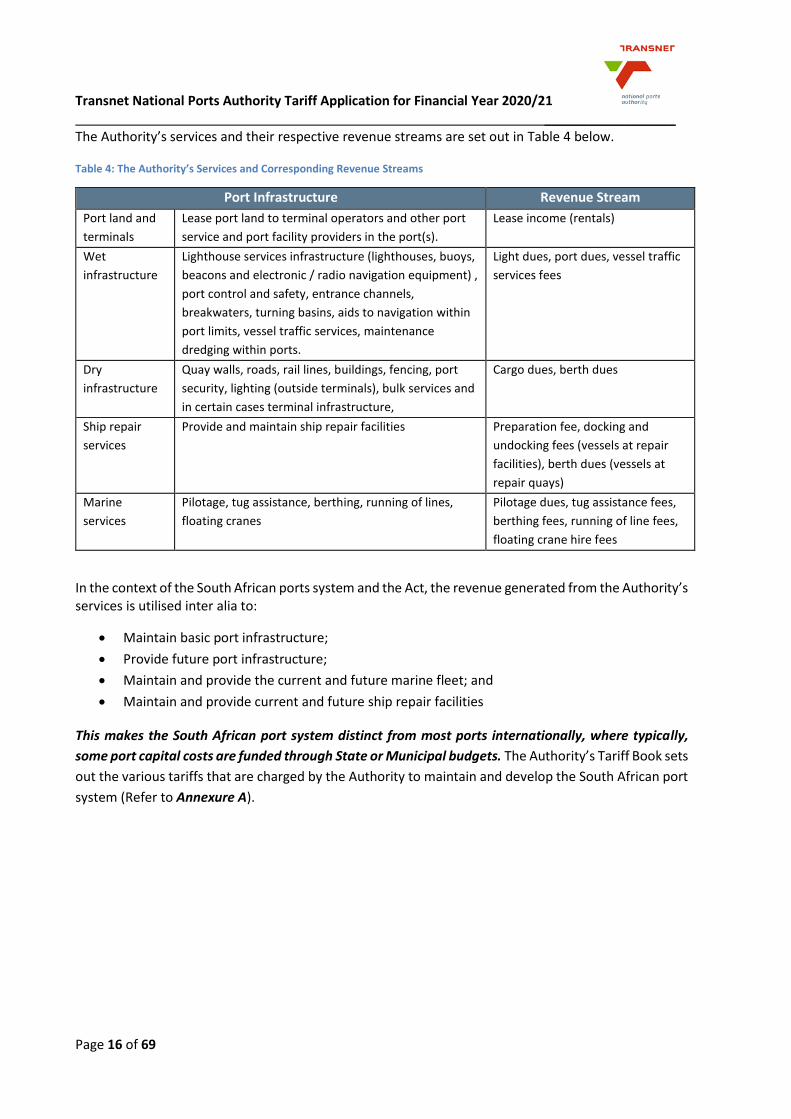
The Authority’s services and their respective revenue streams are set out in Table 4 below.
Table 4: The Authority’s Services and Corresponding Revenue Streams
In the context of the South African ports system and the Act, the revenue generated from the Authority’s services is utilised inter alia to:
Maintain basic port infrastructure;
Provide future port infrastructure;
Maintain and provide the current and future marine fleet; and
Maintain and provide current and future ship repair facilities
This makes the South African port system distinct from most ports internationally, where typically,
some port capital costs are funded through State or Municipal budgets. The Authority’s Tariff Book sets
out the various tariffs that are charged by the Authority to maintain and develop the South African port
system (Refer to Annexure A).
Port Infrastructure Revenue Stream
Port land and
terminals
Lease port land to terminal operators and other port
service and port facility providers in the port(s).
Lease income (rentals)
Wet
infrastructure
Lighthouse services infrastructure (lighthouses, buoys,
beacons and electronic / radio navigation equipment) ,
port control and safety, entrance channels,
breakwaters, turning basins, aids to navigation within
port limits, vessel traffic services, maintenance
dredging within ports.
Light dues, port dues, vessel traffic
services fees
Dry
infrastructure
Quay walls, roads, rail lines, buildings, fencing, port
security, lighting (outside terminals), bulk services and
in certain cases terminal infrastructure,
Cargo dues, berth dues
Ship repair
services
Provide and maintain ship repair facilities Preparation fee, docking and
undocking fees (vessels at repair
facilities), berth dues (vessels at
repair quays)
Marine
services
Pilotage, tug assistance, berthing, running of lines,
floating cranes
Pilotage dues, tug assistance fees,
berthing fees, running of line fees,
floating crane hire fees
Transnet National Ports Authority Tariff Application for Financial Year 2020/21 __________________
Page 17 of 69
6. Port Infrastructure Development Plan and Capital Expenditure
Section 11(1) of the Act sets out the main functions of the Authority, amongst others, the responsibilities
with respect to the provision of port infrastructure.
6.1 Port Investment planning
“Functions of the Authority”
Section 11(1) the main function of the Authority is to own, manage, control and administer ports
to ensure their efficient and economic functioning, and in doing so the Authority must:
(a) plan, provide, maintain and improve port infrastructure;
(b) prepare and periodically update a port development framework plan for each port,
which must reflect the Authority’s policy for port development and land use within such
port;
(c) control land use within ports, and has the power to lease land under such conditions as
the Authority may determine;
(d) provide or arrange for road and rail access within ports;
(e) arrange for such services such as water, light, power and sewerage and
telecommunications within ports;
(f) Maintain the sustainability of the ports and their surroundings;
6.2 The Authority’s Capital Investment Programme
The Authority’s investment spending is primarily influenced by its detailed strategic and planning
initiatives which aim at providing adequate port infrastructure ahead of demand, improve vessel and
cargo turnaround; and improve the productive use of assets to sustain the existing business.
In developing the Capex Plans, the following activities are considered by the Authority:
Long-term Port Development Framework Plans: The Authority in accordance with the National
Ports Act has to develop and periodically update port framework plans. The Authority publishes
its National Ports Plan (“NPP”) which contains individual port development plans for each of the
Authority’s 9 commercial ports. The NPP is updated every two (2) years and rebased every five
(5) years. The last rebased NPP was completed in FY 2014/15. The next rebased NPP will be
published as the NPP 2020. The draft NPP 2020 is currently available on the Authority’s website
for stakeholders review and comment; prior to finalisation.
Capacity studies: The Authority uses simulation tools to assess the capacity of current
infrastructure and to simulate future infrastructure capacity. The capacity studies are updated
annually and as required.
Transnet National Ports Authority Tariff Application for Financial Year 2020/21 __________________
Page 18 of 69
Volume Studies: The forecasted volumes used in the Authority’s development plans are based
on the latest available information for the short-term investment guidelines. The long-term
investment guidelines utilises the forecasted volumes from Transnet’s Freight Demand Model.
Prioritization: Projects are aligned to strategy and prioritized by compliance, sustainability and
to meet demand forecasted.
Port Consultative Committees: The Authority adopts a consultative approach to the drafting of
the Port Development Framework Plans and the execution of the resultant Capital Investment
Plan. Port Development Framework Plans projected for the short, medium and long term as
well as 7-year Capital Investment. Plans have been consulted with port users. This consultation
was conducted on a port-by-port basis during a process facilitated by the DoT, with SAMSA as
secretariat, during the first quarter of FY 2019/20. These plans are informed, inter alia, by the
aforementioned Transnet Freight Demand Model.
6.3 Key Focus Areas of Capital Investment Program in FY 2020/21 to FY 2022/23
The Capital Investment Program for FY 2020/21 to FY 2022/23 amounts to R3 872m, R4 921m and
R6 630m respectively. These amounts are included in the Authority’s RAB as capital expenditure in the
years in which they are incurred. The key projects listed below are continuing into this tariff focus period.
On aggregate the following projects contribute 75% of the planned capital expenditure over the next 3
years:
Port of Richards Bay: Provide additional rail facility for Duine area;
Port of Richards Bay: Bayvue rail yard expansion;
Port of Richards Bay: Replacement of helicopters
Port of Richards Bay: Dredging and construction of berth infrastructure for Floating Dry Dock;
Port of Richards Bay: Replace 1 tug
Port of Richards Bay: Provide additional Bulk Liquid berth 207
Port of Durban: DCT berth deepening 203 to 205;
Port of Durban: New Tug Jetty FEL 4;
Port of Durban: Replace Water Pipelines & Billing System;
Port of Durban: Acquisition of 6 tugs (4 replacement and 2 additional);
Port of Durban: Upgrade of Asbestos Kings rest yard;
Port of Durban: Island View sea walls;
Port of Durban: Fire-fighting infrastructure at berth 9 Island View;
Port of Durban: Island View berth 1 upgrade;
Port of Durban: Replacement of helicopter
Port of East London: Reconstruction of Quay 3;
Port of Ngqura: Tank farm equipment Berth B100, roads, port entrance and services;
Port of Ngqura: Manganese project;
Port of Cape Town: Two Replacement Tugs;
Port of Cape Town: Acquisition of new helicopter;
Port of Cape Town: Expansion of container terminal Phase 2B FEL3
Port of Saldanha Bay: Bulk electrical power supply related to Third tippler; and
Dredging Services: Second Grab hopper dredger.
Transnet National Ports Authority Tariff Application for Financial Year 2020/21 __________________
Page 19 of 69
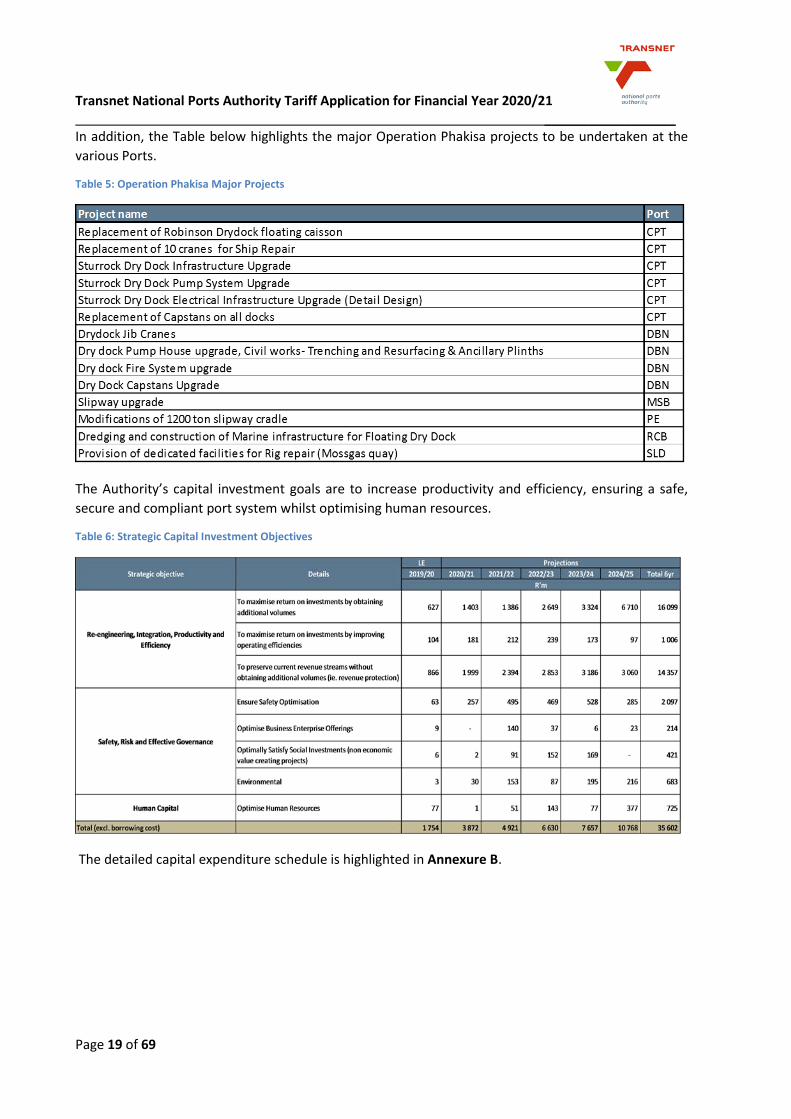
In addition, the Table below highlights the major Operation Phakisa projects to be undertaken at the
various Ports.
Table 5: Operation Phakisa Major Projects
The Authority’s capital investment goals are to increase productivity and efficiency, ensuring a safe,
secure and compliant port system whilst optimising human resources.
Table 6: Strategic Capital Investment Objectives
The detailed capital expenditure schedule is highlighted in Annexure B.
Transnet National Ports Authority Tariff Application for Financial Year 2020/21 __________________
Page 20 of 69
7. The Authority’s Total Revenue
7.1 Real Estate Revenue
The vision of the Authority’s Real Estate business is to ensure the property portfolio is managed adequately, efficiently, effectively and in accordance with organization policies and a mandate as outlined by the National Ports Act. It also aims to maximize value and support for the Authority’s core business. The Real Estate Strategy drives the management of the property portfolio. There are five key pillars of
the Real Estate Strategy:
(a) Revenue Growth;
(b) Portfolio Optimisation;
(c) Land use and strategic developments;
(d) Total Facilities Management; and
(e) Human Resources Capacity Building.
The Authority currently manages port land in excess of 46.0 million square meters of which 23.5 million
square meters is the Gross Lettable Area (GLA). Roads, rails, common areas, environmentally sensitive
areas and related land makes up for a total of 22.4 million square meters.
The Authority manages four categories of leases:
(a) Complimentary leases;
(b) Supplementary leases;
(c) Commercial leases; and
(d) Leases with other Government entities.
These leases ranges from short to long term leases which are inclusive of terminal operators, licensed
service providers and government entities executing legislative functions. The Lease Management
Manual (“LMM”) provides a guideline on the management and related principles of leases. The process
of lease management principally follows an open, transparent, competitive and fair process. All vacant
sites are advertised to the public for broader participation.
The Authority currently manages approximately 683 leases across the nine (9) commercial ports. The
Port of Durban, as the Authority’s biggest port, holds the bulk of the leases, with a total of 339 leases.
The average lease tenure ranges between 5-10 years, with expired leases generally, extended on a
month to month basis, pending the completion of the lease renewal process.
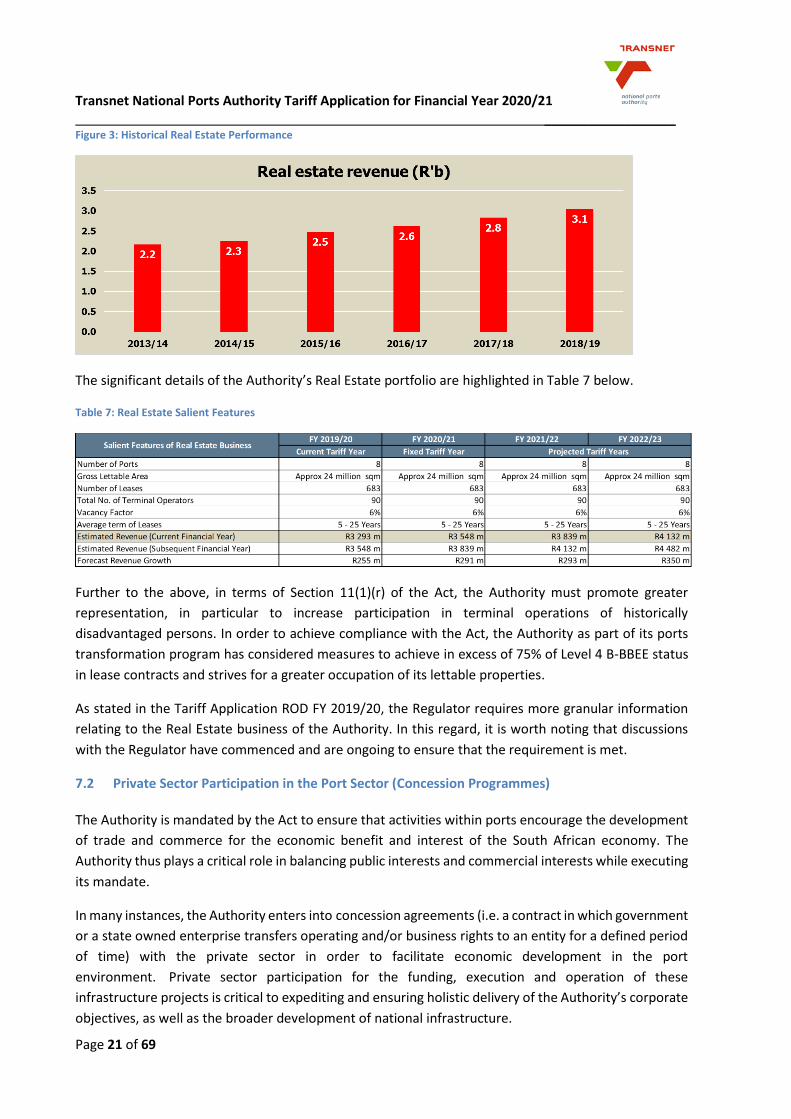
The Authority achieved a lettable land vacancy rate of approximately 6% in FY 2018/19, which compares favourably with the industry average of 10%.
The land rental budget for FY 2019/20 is R3 293m which represents a growth of approximately 7.97%
from the actual land rental of R3 050m obtained in FY 2018/19. The land rental revenue forecast for FY
2020/21 is R3 548m.
Transnet National Ports Authority Tariff Application for Financial Year 2020/21 __________________
Page 21 of 69
Figure 3: Historical Real Estate Performance
The significant details of the Authority’s Real Estate portfolio are highlighted in Table 7 below.
Table 7: Real Estate Salient Features
Further to the above, in terms of Section 11(1)(r) of the Act, the Authority must promote greater
representation, in particular to increase participation in terminal operations of historically
disadvantaged persons. In order to achieve compliance with the Act, the Authority as part of its ports
transformation program has considered measures to achieve in excess of 75% of Level 4 B-BBEE status
in lease contracts and strives for a greater occupation of its lettable properties.
As stated in the Tariff Application ROD FY 2019/20, the Regulator requires more granular information
relating to the Real Estate business of the Authority. In this regard, it is worth noting that discussions
with the Regulator have commenced and are ongoing to ensure that the requirement is met.
7.2 Private Sector Participation in the Port Sector (Concession Programmes)
The Authority is mandated by the Act to ensure that activities within ports encourage the development
of trade and commerce for the economic benefit and interest of the South African economy. The
Authority thus plays a critical role in balancing public interests and commercial interests while executing
its mandate.
In many instances, the Authority enters into concession agreements (i.e. a contract in which government
or a state owned enterprise transfers operating and/or business rights to an entity for a defined period
of time) with the private sector in order to facilitate economic development in the port
environment. Private sector participation for the funding, execution and operation of these
infrastructure projects is critical to expediting and ensuring holistic delivery of the Authority’s corporate
objectives, as well as the broader development of national infrastructure.
Transnet National Ports Authority Tariff Application for Financial Year 2020/21 __________________
Page 22 of 69
The concession agreements (Section 56 projects) entered into by the Authority aims to amongst others,
introduce new activities into the port system; enable renewal of old port facilities; facilitate supply
development programmes aligned to national economic objectives; and encourage participation in port
activities by businesses owned by Historically Disadvantaged Persons.
To entrench broad participation and liberalization of port capacity, the Authority requires bidders to
comply with a set criteria for black ownership.
To date seven Terminal Operator agreements have been concluded where black ownership was a
mandatory requirement.
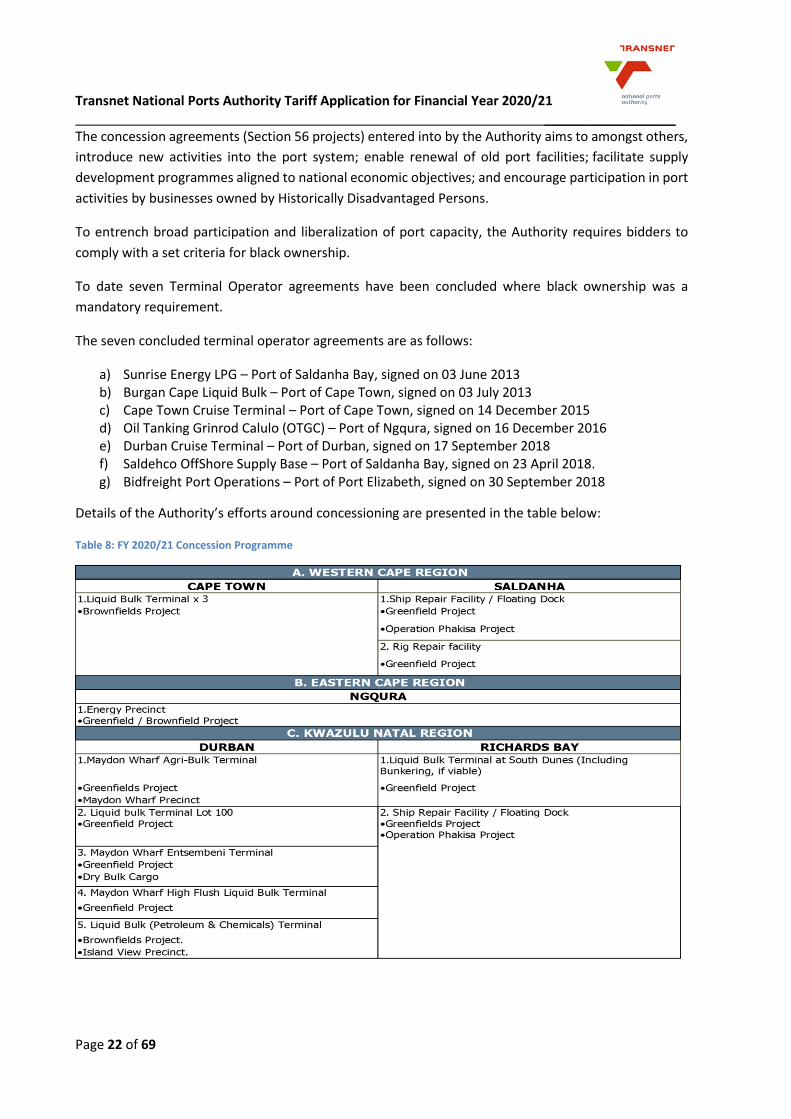
The seven concluded terminal operator agreements are as follows:
a) Sunrise Energy LPG – Port of Saldanha Bay, signed on 03 June 2013 b) Burgan Cape Liquid Bulk – Port of Cape Town, signed on 03 July 2013 c) Cape Town Cruise Terminal – Port of Cape Town, signed on 14 December 2015 d) Oil Tanking Grinrod Calulo (OTGC) – Port of Ngqura, signed on 16 December 2016 e) Durban Cruise Terminal – Port of Durban, signed on 17 September 2018 f) Saldehco OffShore Supply Base – Port of Saldanha Bay, signed on 23 April 2018. g) Bidfreight Port Operations – Port of Port Elizabeth, signed on 30 September 2018
Details of the Authority’s efforts around concessioning are presented in the table below:
Table 8: FY 2020/21 Concession Programme
Transnet National Ports Authority Tariff Application for Financial Year 2020/21 __________________
Page 23 of 69
7.3 Marine Business Revenue
The Authority generates revenue by providing services to port users, which include terminal operators,
shipping lines, ship agents, cargo owners and the clearing and forwarding industry. Port Infrastructure
and maritime services are made available for use in the five commodity market sectors namely;
containers, dry bulk, liquid bulk, break-bulk and automotive. The main source of revenue is tariffs, which
is determined and administered by the Regulator, and charged by the Authority for providing the
aforementioned services. In determining the tariffs, various economic factors, including the volume
growth of the Authority is considered. The anticipated volume growth serves as an indicator of economic
activity and trade.
7.3.1 The Authority’s Volumes
The volumes as presented in this part of the application, showcases the commodity cargoes that go
through the commercial ports as well as the movements of the marine vessel traffic entering the ports.
Projections for the Authority’s volume budget process, on an annual basis, usually commence in October
and continues to be refined until the Transnet Board approves the budgets in February of the following
year. These forecasts present the annual probable demand, on commodities which are handled through
the Authority’s infrastructure within the port system. This process normally depicts the current year’s
latest estimates, taking into account the previous year’s performance. Forecasts extend to the following
year’s volumes (budget period) with projected volumes for the next six years. This volume demand is
one of the critical elements as it guides the organisational planning to ensure the availing of capacity
ahead of demand whilst at the same time facilitating efficient and optimal utilisation of current capacity.
The cargo volumes budget compilation follows a bottom-up approach from the port level to the
Authority’s validated budget. The process starts with the Authority’s Key Account Managers (KAM’s)
communicating and liaising with customers on their operational and strategic plans (i.e. how this
translates into volume forecasts for the tariff period under review). The KAM’s also liaise across the port
system with Port Terminals and other operators, to achieve alignment within all cargo categories. This
process ends with a central consolidation of volumes and includes the budget evaluation process such
as historic, prevailing and anticipated market conditions, operational efficiencies, and infrastructure
capacity levels and anticipated improvements.
Transnet also enforces a formal interaction platform with key customers to validate customer volume
forecasts. All divisions of Transnet participate to ensure synchronisation across the entire commodity
value chain.
7.4 Cargo
Over the years, South African economic growth has been drifting away from major regional economies
and its peers, including Africa, illustrating some evidence of a weaker connection to the rest of the world.
This economic pattern has, over recent years, led to minimal market exposure of local exporting sectors.
Recovering from a technical recession, experienced in the first half of the year, South Africa’s real GDP
recorded an overall growth of just 0.8% in 2018. Despite escaping full recession, domestic economic
activities remain at low levels, after recording one of the highest quarterly declines during first quarter
of 2019 (Q1 2019) and it is expected to continue struggling for the rest of the first half of the year.
Transnet National Ports Authority Tariff Application for Financial Year 2020/21 __________________
Page 24 of 69
During 2018, major exporting sectors suffered the most as their respective economic productions
contracted, while the economic activities for the importing sectors recorded a slight improvement.
Agriculture and mining economic productions contracted by 4.8% and 1.7%, respectively. These two
sectors together with manufacturing have recorded the highest declines in the Q1 2019, which could be
due to policy uncertainties in the key sectors. South Africa’s weak integration with global and regional
value chains has restricted the country’s exporting sectors from benefiting on economic opportunities
driven by the recent global demand.
After shrinking by 3.2% during Q1 2019, South Africa’s economic forecast is likely to be further
downward revised to less than 1% for 2019. According to the National Development Plan (NDP), for
South Africa to gain and sustain a decent export growth rate, the country’s real GDP would need to grow
by an average of 5.4% per annum. However, this looks unlikely in the short to medium term as South
Africa’s economic outlook points at an average of 1.5% over the next three years. The current economic
outlook is expected to remain modest and insufficient to address the country’s main challenges.
Adding to domestic economic growth uncertainties, is the anticipated slow global economic activities
coupled with the escalation of US-China trade tensions, which is likely to have further adverse effects
on South Africa’s exporting sectors.
In the past financial year, a number of factors, including slow economic growth, had an adverse effect
on a number of commodity volumes passing through the ports. During FY 2018/19, these commodity
volumes experienced contractions compared to how they have performed in the previous financial year.
The most affected commodities were break bulk and liquid bulk. With the anticipated persistent slow
economic growth, coupled with some global uncertainties, it remains unlikely that the Authority will see
any significant recoveries in volumes over the next two financial years or so. Liquid Bulk volumes are
likely to remain at low growth levels, while other commodities are expected to improve.
All of these factors described above have an impact on various categories of cargo that traverse port
infrastructure. The Authority’s volumes are estimated as follows:
Transnet National Ports Authority Tariff Application for Financial Year 2020/21 __________________
Page 25 of 69
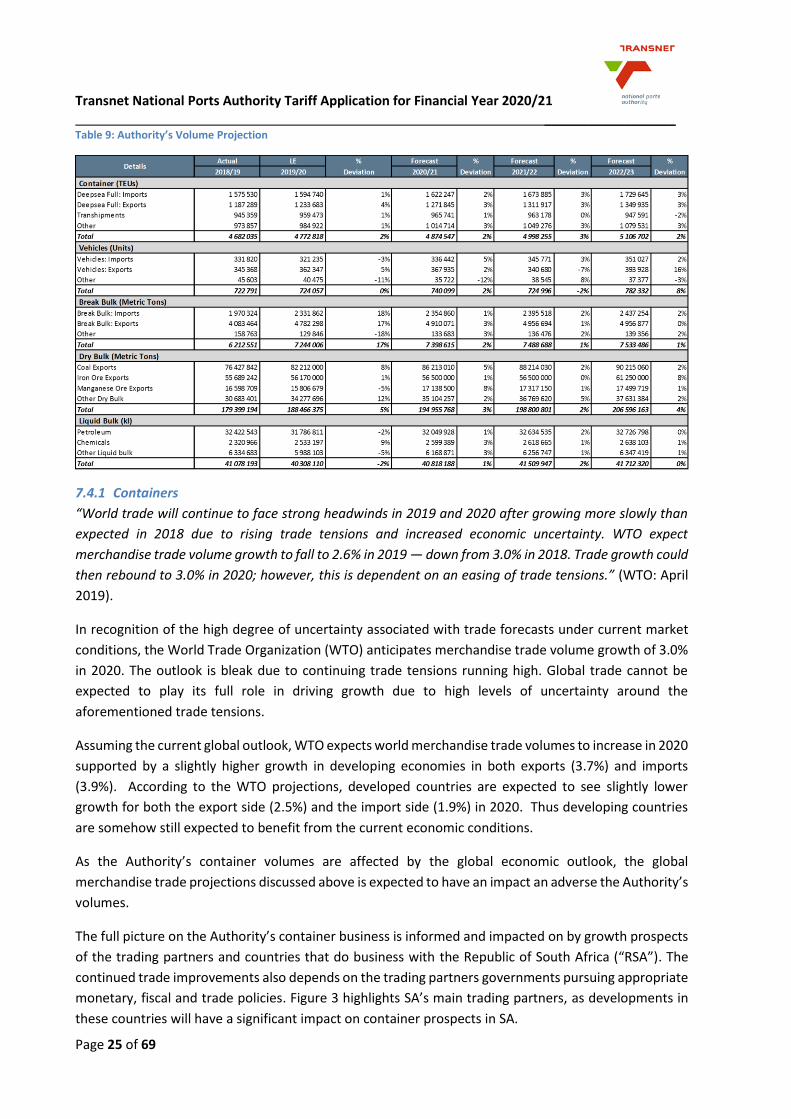
Table 9: Authority’s Volume Projection
7.4.1 Containers
“World trade will continue to face strong headwinds in 2019 and 2020 after growing more slowly than
expected in 2018 due to rising trade tensions and increased economic uncertainty. WTO expect
merchandise trade volume growth to fall to 2.6% in 2019 — down from 3.0% in 2018. Trade growth could
then rebound to 3.0% in 2020; however, this is dependent on an easing of trade tensions.” (WTO: April
2019).
In recognition of the high degree of uncertainty associated with trade forecasts under current market
conditions, the World Trade Organization (WTO) anticipates merchandise trade volume growth of 3.0%
in 2020. The outlook is bleak due to continuing trade tensions running high. Global trade cannot be
expected to play its full role in driving growth due to high levels of uncertainty around the
aforementioned trade tensions.
Assuming the current global outlook, WTO expects world merchandise trade volumes to increase in 2020
supported by a slightly higher growth in developing economies in both exports (3.7%) and imports
(3.9%). According to the WTO projections, developed countries are expected to see slightly lower
growth for both the export side (2.5%) and the import side (1.9%) in 2020. Thus developing countries
are somehow still expected to benefit from the current economic conditions.
As the Authority’s container volumes are affected by the global economic outlook, the global
merchandise trade projections discussed above is expected to have an impact an adverse the Authority’s
volumes.
The full picture on the Authority’s container business is informed and impacted on by growth prospects
of the trading partners and countries that do business with the Republic of South Africa (“RSA”). The
continued trade improvements also depends on the trading partners governments pursuing appropriate
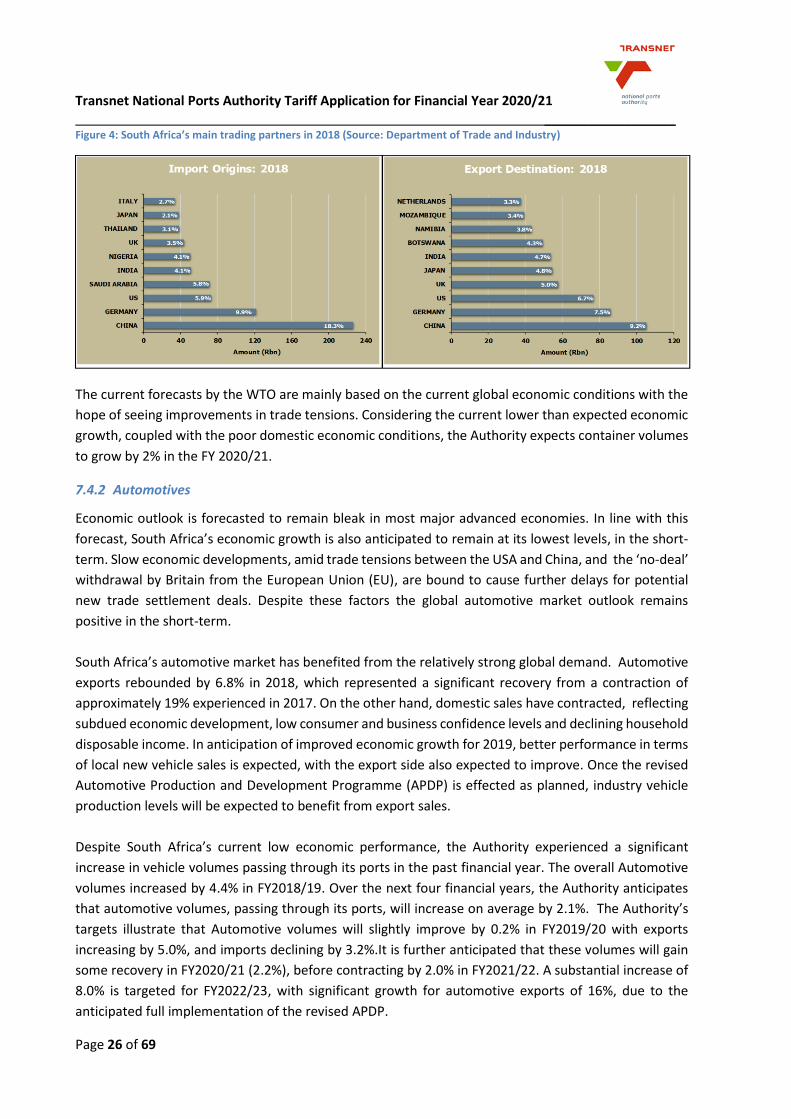
monetary, fiscal and trade policies. Figure 3 highlights SA’s main trading partners, as developments in
these countries will have a significant impact on container prospects in SA.
Transnet National Ports Authority Tariff Application for Financial Year 2020/21 __________________
Page 26 of 69
Figure 4: South Africa’s main trading partners in 2018 (Source: Department of Trade and Industry)
The current forecasts by the WTO are mainly based on the current global economic conditions with the
hope of seeing improvements in trade tensions. Considering the current lower than expected economic
growth, coupled with the poor domestic economic conditions, the Authority expects container volumes
to grow by 2% in the FY 2020/21.
7.4.2 Automotives
Economic outlook is forecasted to remain bleak in most major advanced economies. In line with this
forecast, South Africa’s economic growth is also anticipated to remain at its lowest levels, in the short-
term. Slow economic developments, amid trade tensions between the USA and China, and the ‘no-deal’
withdrawal by Britain from the European Union (EU), are bound to cause further delays for potential
new trade settlement deals. Despite these factors the global automotive market outlook remains
positive in the short-term.
South Africa’s automotive market has benefited from the relatively strong global demand. Automotive
exports rebounded by 6.8% in 2018, which represented a significant recovery from a contraction of
approximately 19% experienced in 2017. On the other hand, domestic sales have contracted, reflecting
subdued economic development, low consumer and business confidence levels and declining household
disposable income. In anticipation of improved economic growth for 2019, better performance in terms
of local new vehicle sales is expected, with the export side also expected to improve. Once the revised
Automotive Production and Development Programme (APDP) is effected as planned, industry vehicle
production levels will be expected to benefit from export sales.
Despite South Africa’s current low economic performance, the Authority experienced a significant
increase in vehicle volumes passing through its ports in the past financial year. The overall Automotive
volumes increased by 4.4% in FY2018/19. Over the next four financial years, the Authority anticipates
that automotive volumes, passing through its ports, will increase on average by 2.1%. The Authority’s
targets illustrate that Automotive volumes will slightly improve by 0.2% in FY2019/20 with exports
increasing by 5.0%, and imports declining by 3.2%.It is further anticipated that these volumes will gain
some recovery in FY2020/21 (2.2%), before contracting by 2.0% in FY2021/22. A substantial increase of
8.0% is targeted for FY2022/23, with significant growth for automotive exports of 16%, due to the
anticipated full implementation of the revised APDP.
Transnet National Ports Authority Tariff Application for Financial Year 2020/21 __________________
Page 27 of 69
7.4.3 Break Bulk
Projected cargo volumes of key commodities for the break-bulk sector from clients in the oil, gas, and
mining sectors is dependent on global economic performance. Despite current uncertainty in the sector,
trade demand is expected to improve as the trade war between China and the United States of America
recedes further (with the USA and China tentatively agreeing to a truce). Metals and Mineral prices have
increased marginally in the first quarter of 2019. Overall the prices reflected supply concerns, progress
in trade negotiations between the United States and China, and fiscal stimulus in China.The break bulk
sector is forecasted to improve marginally, from 2019 to 2020, due to the slightly rising project cargo
demand/traffic. Overall, the Authority expects volume growth for the breakbulk sector to increase
marginally by 2% in FY 2020/21, before slowing to a 1% increase in FY 2021/22.
7.4.4 Coal
Coal consumption faces long-term structural changes in several consuming regions for both economic
and policy reasons. China, the worlds’ largest coal consumer, is investing in cleaner energy sources,
reforming its electricity sector to reduce inefficient production, and reducing the energy intensity of its
economy, all at the expense of coal. Policies implemented by China, to address environmental issues
and overcapacity in the coal industry paints a bleak picture for coal exports and coal prices for FY
2020/21. However, higher demand for thermal power generation may continue to support increased
demand for seaborne coal imports into China. Contrary to the developments in China, domestic
production in India has played a major role in determining seaborne import demand and the momentum
is expected to grow in FY 2020/21.
It is worth noting that Indonesia is the biggest exporter of coal to India, followed by South Africa and
Australia. However, Indonesian coal exporters are expected to face challenges with the Indonesian coal
producers being obligated to provide around 25% of their production to the domestic market. According
to Fitch Solutions, South Africa has been cited by Indian mining and industrial companies as the
alternative supplier, as Indonesia's coal is of poor quality, and extraction costs in Australia are high. The
challenges facing Indonesia and Australia should translate into a positive outlook for the South African
coal exports to India. In essence, India is expected to drive the coal export growth in the upcoming years.
Against these developments, the Authority’s coal export volumes for FY 2020/21 is expected to grow by
approximately 5%.
7.4.5 Iron Ore
Iron ore and manganese trends closely follow the steel trends. Global iron ore prices are projected to
increase by 11.4% in 2019. Iron ore prices increased sharply by approximately 16.2 % during Q1 2019,
which is higher than the 13% increase observed during Q1 2018. The increase in price was mainly due
to production/supply disruptions in Brazil (iron ore production disrupted due to the Tailings Dam
disaster in which a mining dam collapsed and unleashed a tidal wave of waste and mud that engulfed
homes, businesses and residents in its path). In Australia, BHP and Rio Tinto’s production were impacted
by tropical cyclone Veronica, and iron ore shipments have been disrupted due to a fire at the latter’s
export terminal.
With the implementation of the new Chinese fiscal stimulus program, steel use in China could be
strengthened which may lead to greater demand for iron ore in China. Despite the possible increase in
Transnet National Ports Authority Tariff Application for Financial Year 2020/21 __________________
Page 28 of 69
the iron ore prices, some downside risks are envisaged, such as the renewed tightening of environmental
policies in China that may reduce/restrict steel production.
Whilst prices recovered in the beginning of 2019, they are expected to reflect a declining trend from
2020 onwards, which may once again force diversification among other mining producers. Iron ore
prices are forecast to drop from $75/tonne in 2019 to $48/tonne by 20281, underpinned by a waning
Chinese demand.
South African iron ore production contracted marginally by 0.1% over 2018 as prices decreased on a
yearly basis. However, South African iron ore production should possibly rebound slightly in 2019 to
reach 83.4mnt, up from 81mnt in 2018 as prices rise on a yearly basis. Iron ore prices in South Africa are
expected to average $75/tonne in 2019, up from $66/tonne in 2018, and then progressively drop in the
coming years, reaching $57/tonne by 2023, as Chinese demand wanes.
The Authority forecasts a 1% volume growth in iron ore volumes for FY 2020/21 and a possible static
trend for the FY 2021/22.
7.4.6 Manganese Ore
Chinese steel demand continues to decelerate as the combined effect of economic rebalancing and
trade tension is leading to slowing investment and sluggish manufacturing performance. The Chinese
government’s interventions cushioned the economic slowdown in 2018. In 2019, the Chinese
government is likely to heighten the level of interventions, which is expected to boost steel
demand. Thereafter, a minor contraction in Chinese steel demand is forecasted as the effects of the
interventions are expected to subside.
The Authority forecasts an 8% growth in manganese ore volumes for FY 2020/21.
7.4.7 Liquid Bulk
South Africa’s fuel demand has remained under pressure over the recent years due to a combination of
both international and domestic factors. These factors include high crude oil prices, low economic
growth and the weak Rand/Dollar exchange rate. However, domestic fuel demand slightly improved by
0.1% in 2018 after two years of consecutive decline. Despite this performance, it remains unlikely to see
any significant improvement for the country’s fuel demand in the short to medium term as the local
economic outlook remains at low levels. Furthermore, crude oil prices are forecast to remain at above
US$65/bbl coupled with some uncertainties amongst oil major producing countries and escalating trade
tensions between the USA and China. The domestic currency exchange rate is anticipated to remain at
weaker levels, averaging at R15/US$ for the remainder of 2019.
Volumes of liquid bulk passing through the Authority’s ports have mostly suffered over the years with
the recent contraction of 6.8% recorded in FY 2018/19. In the short-term, the country’s persistent low
fuel demand is expected to continue to have adverse effects on the volumes of liquid bulk imported
through the Authority’s port system, hence the moderate forecast for the next two years. Despite the
challenges, the Authority is projecting to grow liquid bulk volumes by 1.3% in FY2020/21. This will further
improve to 1.7% in FY2021/22 as petroleum is expected to gain some momentum.
1 Forecast by Fitch Solutions Mining Report
Transnet National Ports Authority Tariff Application for Financial Year 2020/21 __________________
Page 29 of 69
According to the Chemical Industries Education & Training Authority (CHIETA), the South African basic
chemicals sector and other chemicals sectors are expected to grow by approximately 0.6% and 1%
respectively in the years 2020 and 2021. The situation may change if the Industrial Policy and Action
Plan (IPAP) materializes, with one of its focus areas being to develop the chemical and related sectors.
The chemicals industry is, however, dependent on imports, which makes it vulnerable to global
economic changes such as competition from rapidly growing chemical producers like China and India,
and the exchange rate fluctuations. Given the current struggling domestic economy and demand, the
Authority expects chemicals volumes to increase by 3% in the FY2020/21. Government’s commitment
to prioritise sectors with potential growth such as chemicals, bodes well and is strategically aligned with
the Authority’s projections.
Other liquid bulk volumes are projected to rebound from negative growth by increasing to 3% in
FY2020/21. This increase is expected to be driven by imports in vegetable and animal oils, and sunflower
seed oil.
7.5 Marine Services
Marine volumes comprise of the number of vessels arriving at SA ports and their associated Gross
Registered Tonnage (GRT). The revenue in this category is influenced by the average vessel size and ship
turnaround time. When the average number of calls decrease as larger vessels call into the Authority’s
ports, a trend, which has emerged recently, revenue remains relatively static despite growing cargo
volumes. Lesser vessel calls with longer stays attract additional charges, however, this is not a substitute
for revenue earned from more frequent vessel calls with shorter stays.
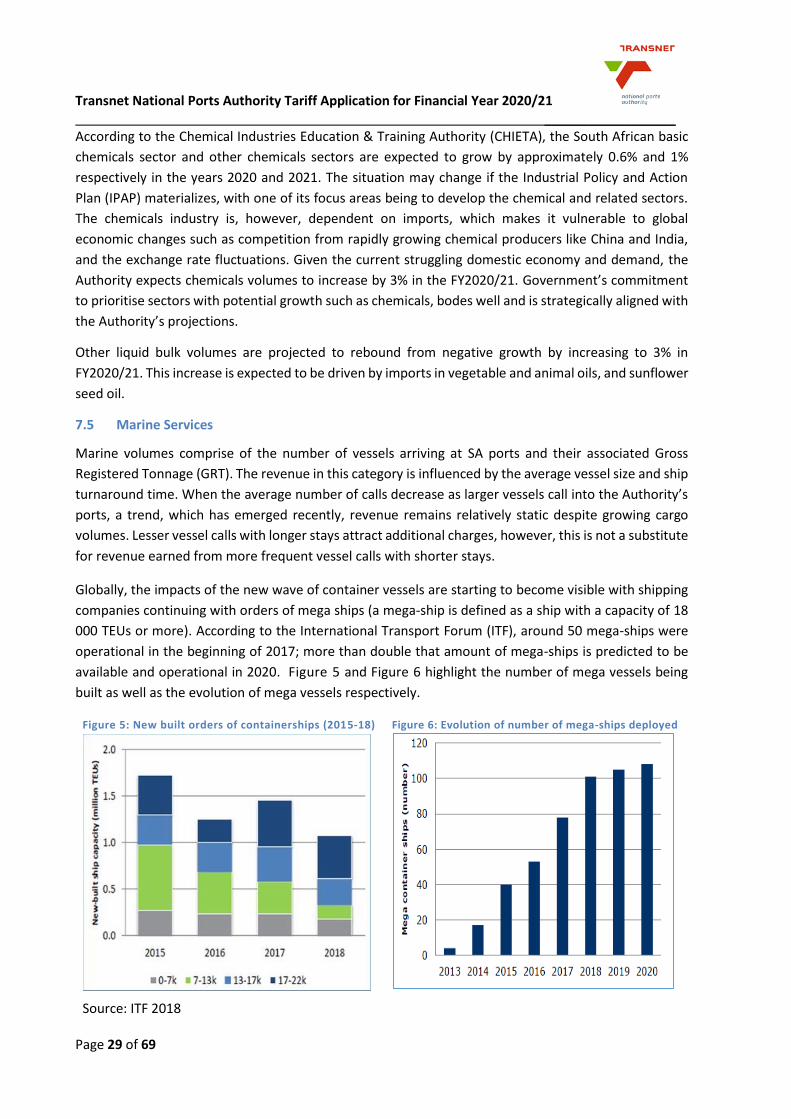
Globally, the impacts of the new wave of container vessels are starting to become visible with shipping
companies continuing with orders of mega ships (a mega-ship is defined as a ship with a capacity of 18
000 TEUs or more). According to the International Transport Forum (ITF), around 50 mega-ships were
operational in the beginning of 2017; more than double that amount of mega-ships is predicted to be
available and operational in 2020. Figure 5 and Figure 6 highlight the number of mega vessels being
built as well as the evolution of mega vessels respectively.
Figure 5: New built orders of containerships (2015-18) Figure 6: Evolution of number of mega-ships deployed
Source: ITF 2018
Transnet National Ports Authority Tariff Application for Financial Year 2020/21 __________________
Page 30 of 69
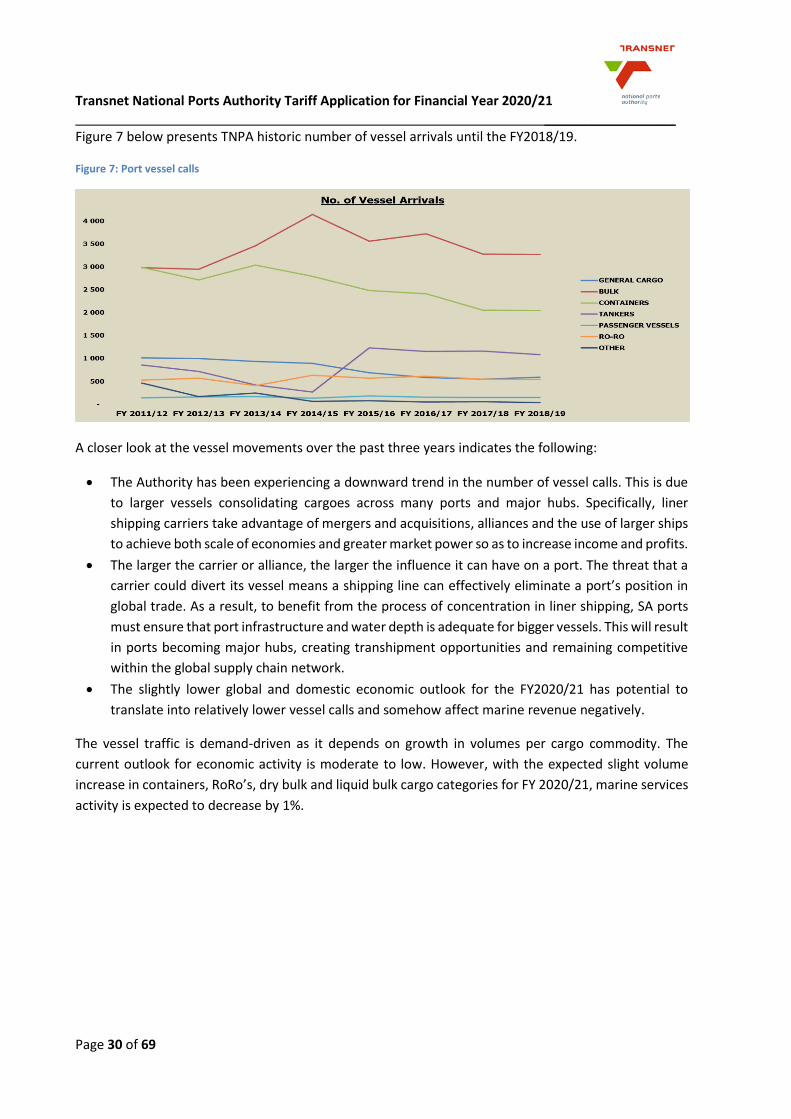
Figure 7 below presents TNPA historic number of vessel arrivals until the FY2018/19.
Figure 7: Port vessel calls
A closer look at the vessel movements over the past three years indicates the following:
The Authority has been experiencing a downward trend in the number of vessel calls. This is due
to larger vessels consolidating cargoes across many ports and major hubs. Specifically, liner
shipping carriers take advantage of mergers and acquisitions, alliances and the use of larger ships
to achieve both scale of economies and greater market power so as to increase income and profits.
The larger the carrier or alliance, the larger the influence it can have on a port. The threat that a
carrier could divert its vessel means a shipping line can effectively eliminate a port’s position in
global trade. As a result, to benefit from the process of concentration in liner shipping, SA ports
must ensure that port infrastructure and water depth is adequate for bigger vessels. This will result
in ports becoming major hubs, creating transhipment opportunities and remaining competitive
within the global supply chain network.
The slightly lower global and domestic economic outlook for the FY2020/21 has potential to
translate into relatively lower vessel calls and somehow affect marine revenue negatively.
The vessel traffic is demand-driven as it depends on growth in volumes per cargo commodity. The
current outlook for economic activity is moderate to low. However, with the expected slight volume
increase in containers, RoRo’s, dry bulk and liquid bulk cargo categories for FY 2020/21, marine services
activity is expected to decrease by 1%.
Transnet National Ports Authority Tariff Application for Financial Year 2020/21 __________________
Page 31 of 69
8. Tariff Application Approach
8.1 Revenue Requirement Formula
The RR approach is as per the “Port Tariff Methodology for Tariff Years 2018/19 - 2020/21”, dated March
2017, which forms the basis upon which the Regulator will determine the appropriate revenues for the
Authority. For the purpose of this application, the indicative tariff years of FY 2021/22 and FY 2022/23
has been been modelled on the basis of the 30 March 2017 Tariff Methodology as the new Methodology
is not yet finalised. The formula as prescribed is as follows:
Revenue Requirement
= Regulatory Asset Base (RAB) x Weighted Average Cost of Capital (WACC)
+ Operating Costs + Depreciation + Taxation Expense ±Claw-back
± Excessive Tariff Increase Margin Credit (ETIMC)
± Weighted Efficiency Gains from Operations (WEGO)
The application of this formula is demonstrated in the sections that follow.
8.1.1 Regulatory Asset Base
Methodology for the valuation of the Authority’s RAB
According to the ROD, the Regulator stated that it will “finalise the specific approach of RAB valuation
within the next multi-year tariff methodology (MYM3) which the Regulator will be conducting in
2019/20.” The determination of the RAB in the tariff application for FY 2020/21 has therefore been
prepared on the TOC Methodology, with each asset class or category, depreciated according to its
associated useful life.
Asset Base
The RAB represents the value of assets that the Authority is allowed to earn a return on and is based on
the approved Tariff Methodology.
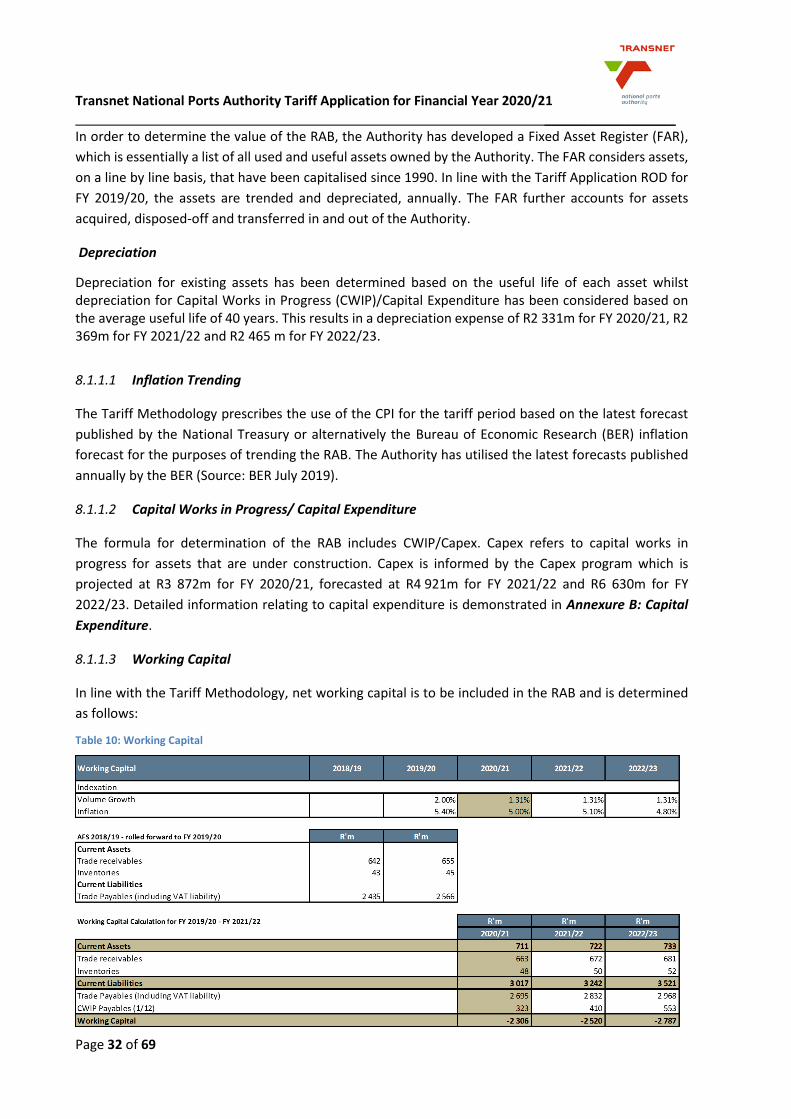
The formula for the determination of the value to be allowed in the RAB for the tariff period as per the
approved tariff methodology is as follows:
Transnet National Ports Authority Tariff Application for Financial Year 2020/21 __________________
Page 32 of 69
In order to determine the value of the RAB, the Authority has developed a Fixed Asset Register (FAR),
which is essentially a list of all used and useful assets owned by the Authority. The FAR considers assets,
on a line by line basis, that have been capitalised since 1990. In line with the Tariff Application ROD for
FY 2019/20, the assets are trended and depreciated, annually. The FAR further accounts for assets
acquired, disposed-off and transferred in and out of the Authority.
Depreciation
Depreciation for existing assets has been determined based on the useful life of each asset whilst depreciation for Capital Works in Progress (CWIP)/Capital Expenditure has been considered based on the average useful life of 40 years. This results in a depreciation expense of R2 331m for FY 2020/21, R2 369m for FY 2021/22 and R2 465 m for FY 2022/23.
8.1.1.1 Inflation Trending
The Tariff Methodology prescribes the use of the CPI for the tariff period based on the latest forecast
published by the National Treasury or alternatively the Bureau of Economic Research (BER) inflation
forecast for the purposes of trending the RAB. The Authority has utilised the latest forecasts published
annually by the BER (Source: BER July 2019).
8.1.1.2 Capital Works in Progress/ Capital Expenditure
The formula for determination of the RAB includes CWIP/Capex. Capex refers to capital works in
progress for assets that are under construction. Capex is informed by the Capex program which is
projected at R3 872m for FY 2020/21, forecasted at R4 921m for FY 2021/22 and R6 630m for FY
2022/23. Detailed information relating to capital expenditure is demonstrated in Annexure B: Capital
Expenditure.
8.1.1.3 Working Capital
In line with the Tariff Methodology, net working capital is to be included in the RAB and is determined
as follows:
Table 10: Working Capital
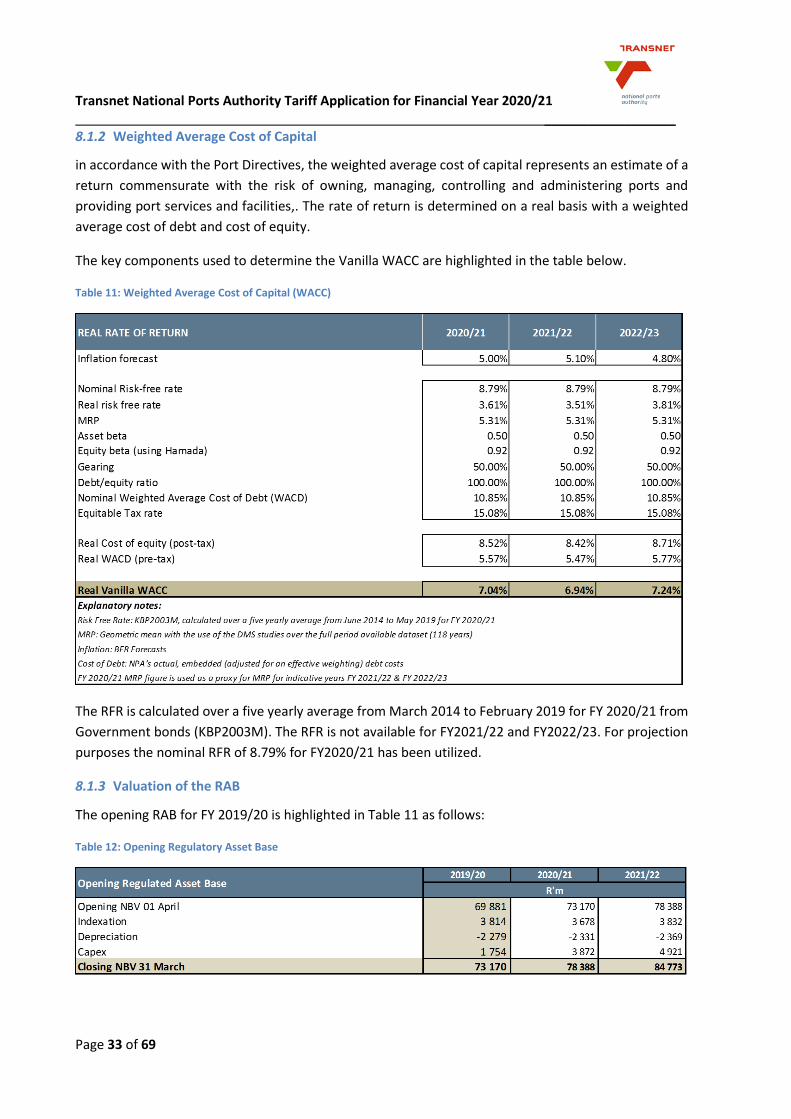
Transnet National Ports Authority Tariff Application for Financial Year 2020/21 __________________
Page 33 of 69
8.1.2 Weighted Average Cost of Capital
in accordance with the Port Directives, the weighted average cost of capital represents an estimate of a
return commensurate with the risk of owning, managing, controlling and administering ports and
providing port services and facilities,. The rate of return is determined on a real basis with a weighted
average cost of debt and cost of equity.
The key components used to determine the Vanilla WACC are highlighted in the table below.
Table 11: Weighted Average Cost of Capital (WACC)
The RFR is calculated over a five yearly average from March 2014 to February 2019 for FY 2020/21 from
Government bonds (KBP2003M). The RFR is not available for FY2021/22 and FY2022/23. For projection
purposes the nominal RFR of 8.79% for FY2020/21 has been utilized.
8.1.3 Valuation of the RAB
The opening RAB for FY 2019/20 is highlighted in Table 11 as follows:
Table 12: Opening Regulatory Asset Base
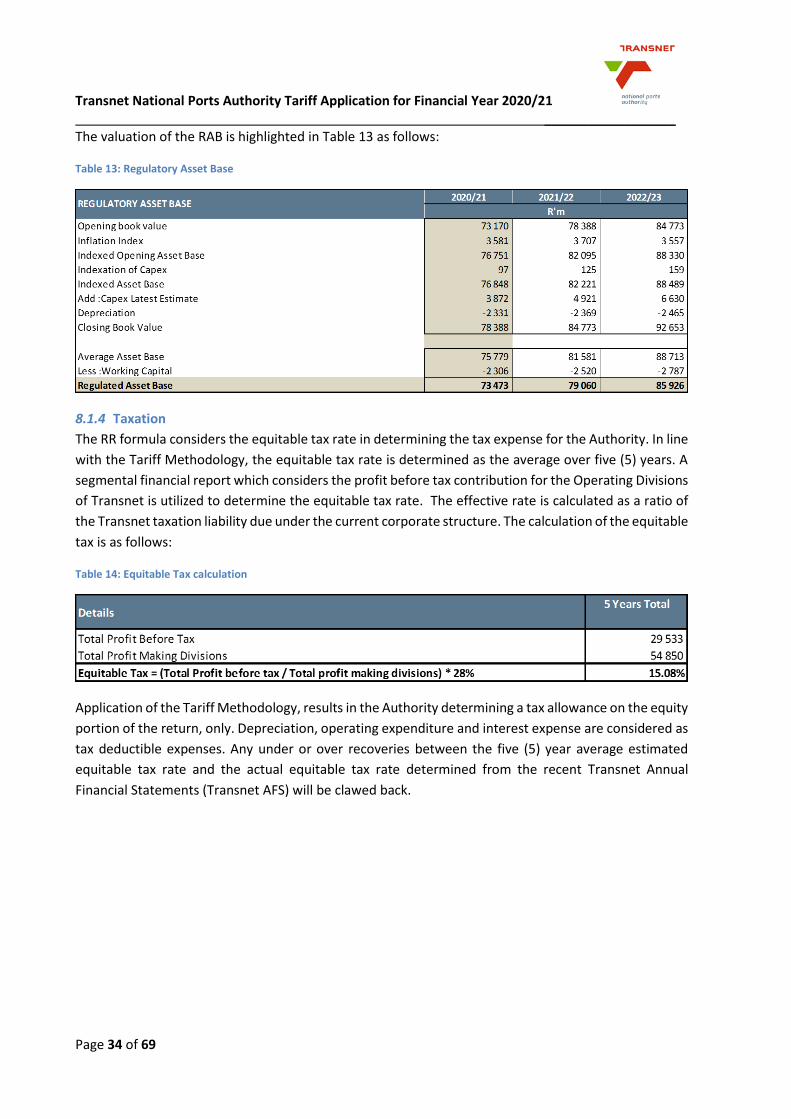
Transnet National Ports Authority Tariff Application for Financial Year 2020/21 __________________
Page 34 of 69
The valuation of the RAB is highlighted in Table 13 as follows:
Table 13: Regulatory Asset Base
8.1.4 Taxation
The RR formula considers the equitable tax rate in determining the tax expense for the Authority. In line
with the Tariff Methodology, the equitable tax rate is determined as the average over five (5) years. A
segmental financial report which considers the profit before tax contribution for the Operating Divisions
of Transnet is utilized to determine the equitable tax rate. The effective rate is calculated as a ratio of
the Transnet taxation liability due under the current corporate structure. The calculation of the equitable
tax is as follows:
Table 14: Equitable Tax calculation
Application of the Tariff Methodology, results in the Authority determining a tax allowance on the equity
portion of the return, only. Depreciation, operating expenditure and interest expense are considered as
tax deductible expenses. Any under or over recoveries between the five (5) year average estimated
equitable tax rate and the actual equitable tax rate determined from the recent Transnet Annual
Financial Statements (Transnet AFS) will be clawed back.
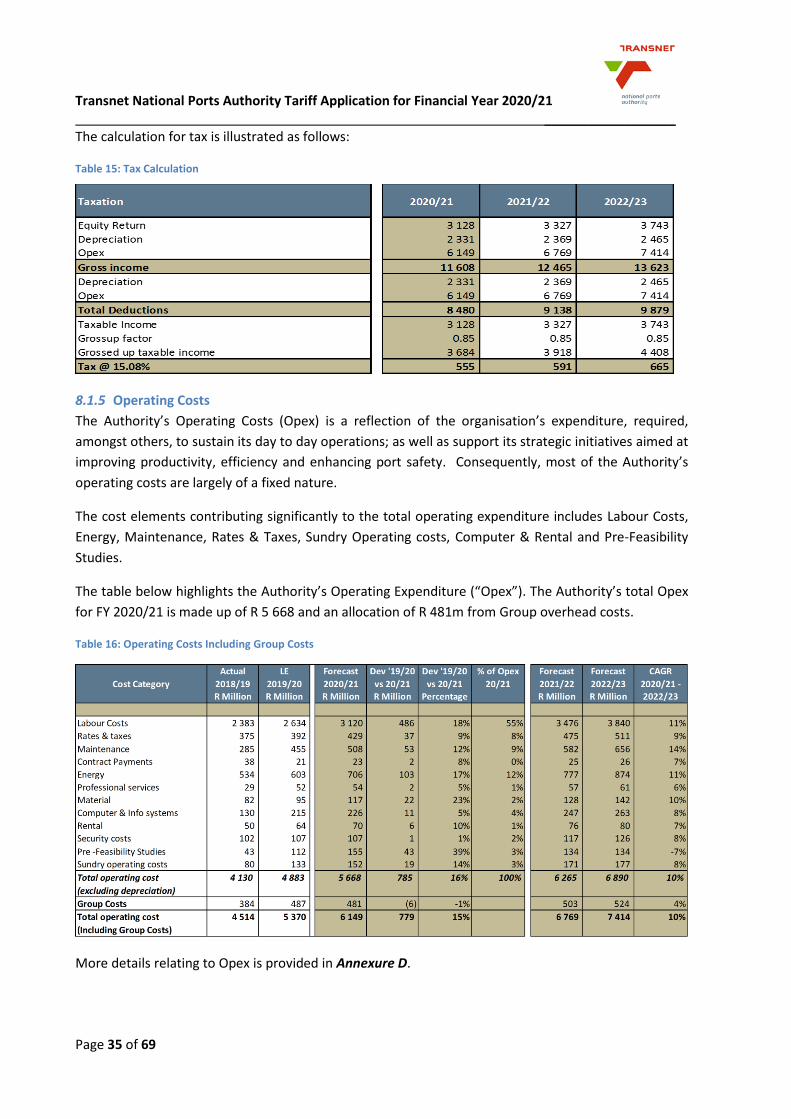
Transnet National Ports Authority Tariff Application for Financial Year 2020/21 __________________
Page 35 of 69
The calculation for tax is illustrated as follows:
Table 15: Tax Calculation
8.1.5 Operating Costs
The Authority’s Operating Costs (Opex) is a reflection of the organisation’s expenditure, required,
amongst others, to sustain its day to day operations; as well as support its strategic initiatives aimed at
improving productivity, efficiency and enhancing port safety. Consequently, most of the Authority’s
operating costs are largely of a fixed nature.
The cost elements contributing significantly to the total operating expenditure includes Labour Costs,
Energy, Maintenance, Rates & Taxes, Sundry Operating costs, Computer & Rental and Pre-Feasibility
Studies.
The table below highlights the Authority’s Operating Expenditure (“Opex”). The Authority’s total Opex
for FY 2020/21 is made up of R 5 668 and an allocation of R 481m from Group overhead costs.
Table 16: Operating Costs Including Group Costs
More details relating to Opex is provided in Annexure D.
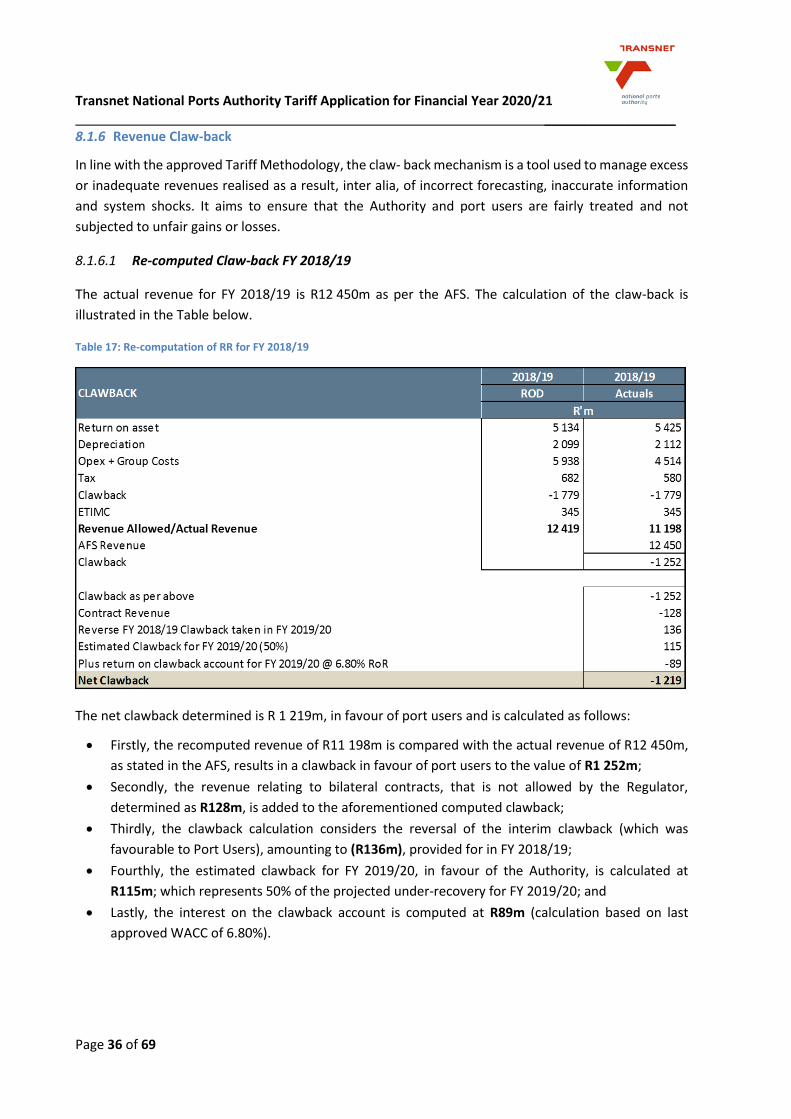
Transnet National Ports Authority Tariff Application for Financial Year 2020/21 __________________
Page 36 of 69
8.1.6 Revenue Claw-back
In line with the approved Tariff Methodology, the claw- back mechanism is a tool used to manage excess
or inadequate revenues realised as a result, inter alia, of incorrect forecasting, inaccurate information
and system shocks. It aims to ensure that the Authority and port users are fairly treated and not
subjected to unfair gains or losses.
8.1.6.1 Re-computed Claw-back FY 2018/19
The actual revenue for FY 2018/19 is R12 450m as per the AFS. The calculation of the claw-back is
illustrated in the Table below.
Table 17: Re-computation of RR for FY 2018/19
The net clawback determined is R 1 219m, in favour of port users and is calculated as follows:
Firstly, the recomputed revenue of R11 198m is compared with the actual revenue of R12 450m,
as stated in the AFS, results in a clawback in favour of port users to the value of R1 252m;
Secondly, the revenue relating to bilateral contracts, that is not allowed by the Regulator,
determined as R128m, is added to the aforementioned computed clawback;
Thirdly, the clawback calculation considers the reversal of the interim clawback (which was
favourable to Port Users), amounting to (R136m), provided for in FY 2018/19;
Fourthly, the estimated clawback for FY 2019/20, in favour of the Authority, is calculated at
R115m; which represents 50% of the projected under-recovery for FY 2019/20; and
Lastly, the interest on the clawback account is computed at R89m (calculation based on last
approved WACC of 6.80%).
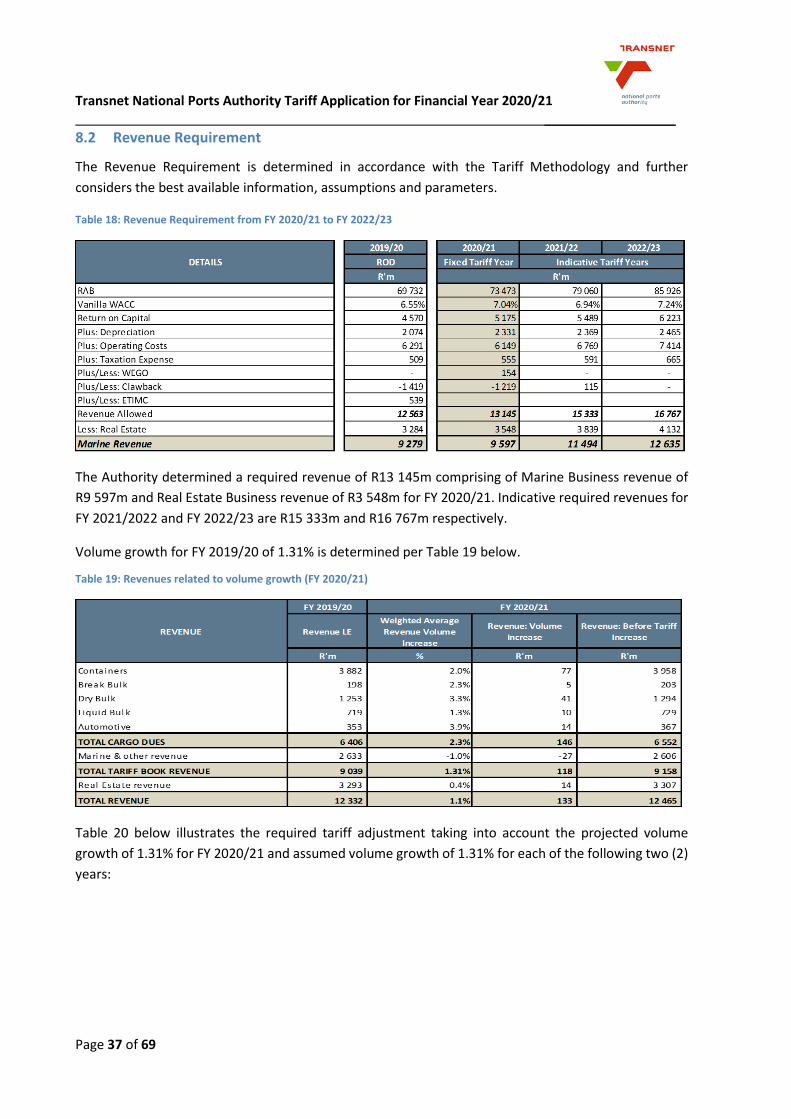
Transnet National Ports Authority Tariff Application for Financial Year 2020/21 __________________
Page 37 of 69
8.2 Revenue Requirement
The Revenue Requirement is determined in accordance with the Tariff Methodology and further
considers the best available information, assumptions and parameters.
Table 18: Revenue Requirement from FY 2020/21 to FY 2022/23
The Authority determined a required revenue of R13 145m comprising of Marine Business revenue of
R9 597m and Real Estate Business revenue of R3 548m for FY 2020/21. Indicative required revenues for
FY 2021/2022 and FY 2022/23 are R15 333m and R16 767m respectively.
Volume growth for FY 2019/20 of 1.31% is determined per Table 19 below.
Table 19: Revenues related to volume growth (FY 2020/21)
Table 20 below illustrates the required tariff adjustment taking into account the projected volume
growth of 1.31% for FY 2020/21 and assumed volume growth of 1.31% for each of the following two (2)
years:
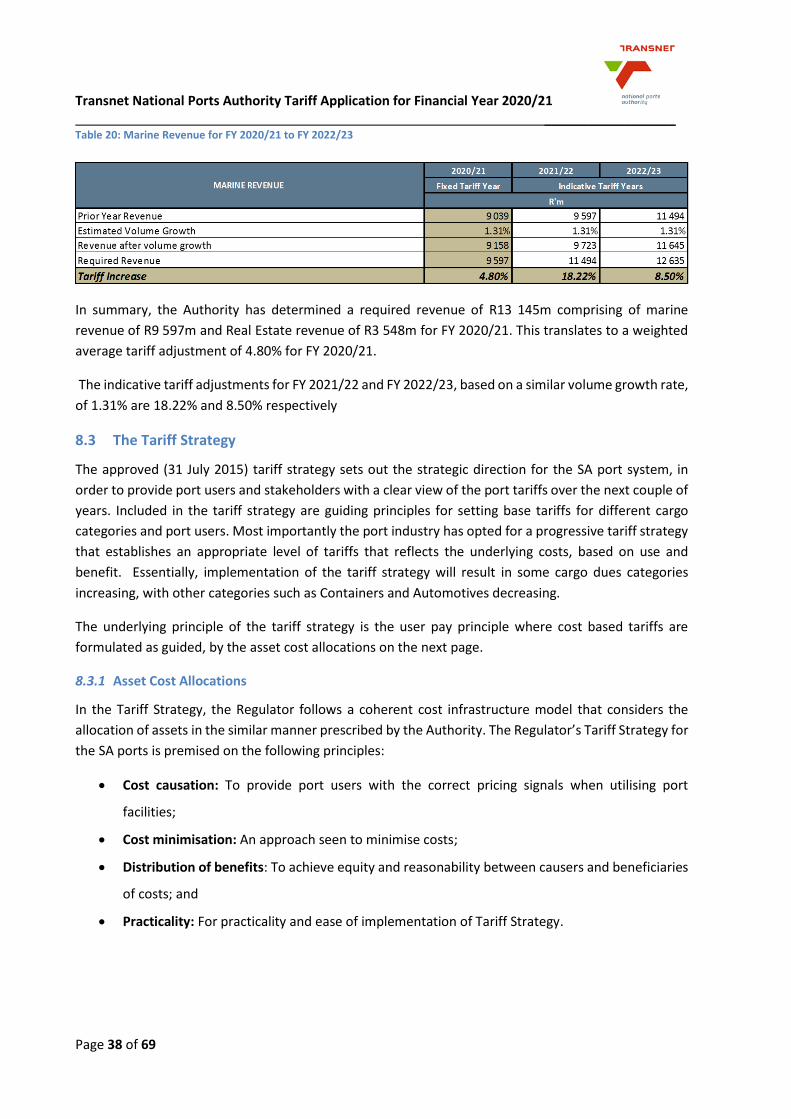
Transnet National Ports Authority Tariff Application for Financial Year 2020/21 __________________
Page 38 of 69
Table 20: Marine Revenue for FY 2020/21 to FY 2022/23
In summary, the Authority has determined a required revenue of R13 145m comprising of marine
revenue of R9 597m and Real Estate revenue of R3 548m for FY 2020/21. This translates to a weighted
average tariff adjustment of 4.80% for FY 2020/21.
The indicative tariff adjustments for FY 2021/22 and FY 2022/23, based on a similar volume growth rate,
of 1.31% are 18.22% and 8.50% respectively
8.3 The Tariff Strategy
The approved (31 July 2015) tariff strategy sets out the strategic direction for the SA port system, in
order to provide port users and stakeholders with a clear view of the port tariffs over the next couple of
years. Included in the tariff strategy are guiding principles for setting base tariffs for different cargo
categories and port users. Most importantly the port industry has opted for a progressive tariff strategy
that establishes an appropriate level of tariffs that reflects the underlying costs, based on use and
benefit. Essentially, implementation of the tariff strategy will result in some cargo dues categories
increasing, with other categories such as Containers and Automotives decreasing.
The underlying principle of the tariff strategy is the user pay principle where cost based tariffs are
formulated as guided, by the asset cost allocations on the next page.
8.3.1 Asset Cost Allocations
In the Tariff Strategy, the Regulator follows a coherent cost infrastructure model that considers the
allocation of assets in the similar manner prescribed by the Authority. The Regulator’s Tariff Strategy for
the SA ports is premised on the following principles:
Cost causation: To provide port users with the correct pricing signals when utilising port
facilities;
Cost minimisation: An approach seen to minimise costs;
Distribution of benefits: To achieve equity and reasonability between causers and beneficiaries
of costs; and
Practicality: For practicality and ease of implementation of Tariff Strategy.
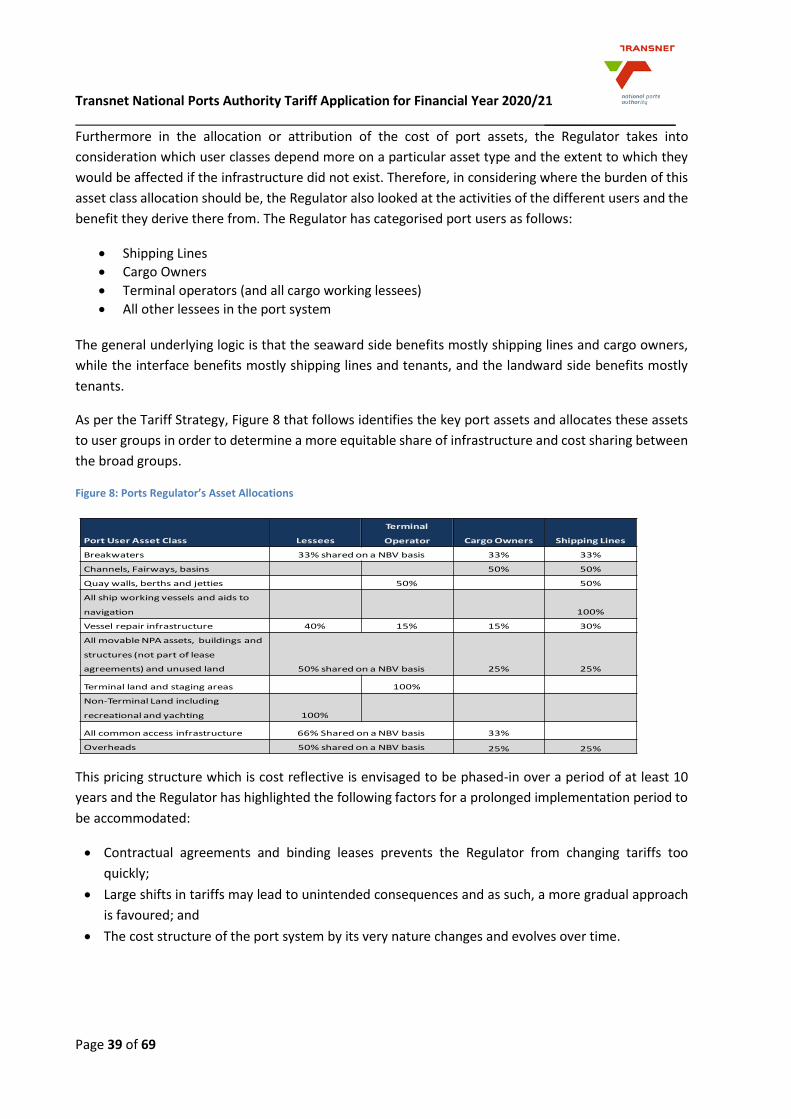
Transnet National Ports Authority Tariff Application for Financial Year 2020/21 __________________
Page 39 of 69
Furthermore in the allocation or attribution of the cost of port assets, the Regulator takes into
consideration which user classes depend more on a particular asset type and the extent to which they
would be affected if the infrastructure did not exist. Therefore, in considering where the burden of this
asset class allocation should be, the Regulator also looked at the activities of the different users and the
benefit they derive there from. The Regulator has categorised port users as follows:
Shipping Lines
Cargo Owners
Terminal operators (and all cargo working lessees)
All other lessees in the port system
The general underlying logic is that the seaward side benefits mostly shipping lines and cargo owners,
while the interface benefits mostly shipping lines and tenants, and the landward side benefits mostly
tenants.
As per the Tariff Strategy, Figure 8 that follows identifies the key port assets and allocates these assets
to user groups in order to determine a more equitable share of infrastructure and cost sharing between
the broad groups.
Figure 8: Ports Regulator’s Asset Allocations
This pricing structure which is cost reflective is envisaged to be phased-in over a period of at least 10
years and the Regulator has highlighted the following factors for a prolonged implementation period to
be accommodated:
Contractual agreements and binding leases prevents the Regulator from changing tariffs too
quickly;
Large shifts in tariffs may lead to unintended consequences and as such, a more gradual approach
is favoured; and
The cost structure of the port system by its very nature changes and evolves over time.
Port User Asset Class Lessees
Terminal
Operator Cargo Owners Shipping Lines
Breakwaters 33% shared on a NBV basis 33% 33%
Channels, Fairways, basins 50% 50%
Quay walls, berths and jetties 50% 50%
All ship working vessels and aids to
navigation 100%
Vessel repair infrastructure 40% 15% 15% 30%
All movable NPA assets, buildings and
structures (not part of lease
agreements) and unused land 50% shared on a NBV basis 25% 25%
Terminal land and staging areas 100%
Non-Terminal Land including
recreational and yachting 100%
All common access infrastructure 66% Shared on a NBV basis 33%
Overheads 50% shared on a NBV basis 25% 25%
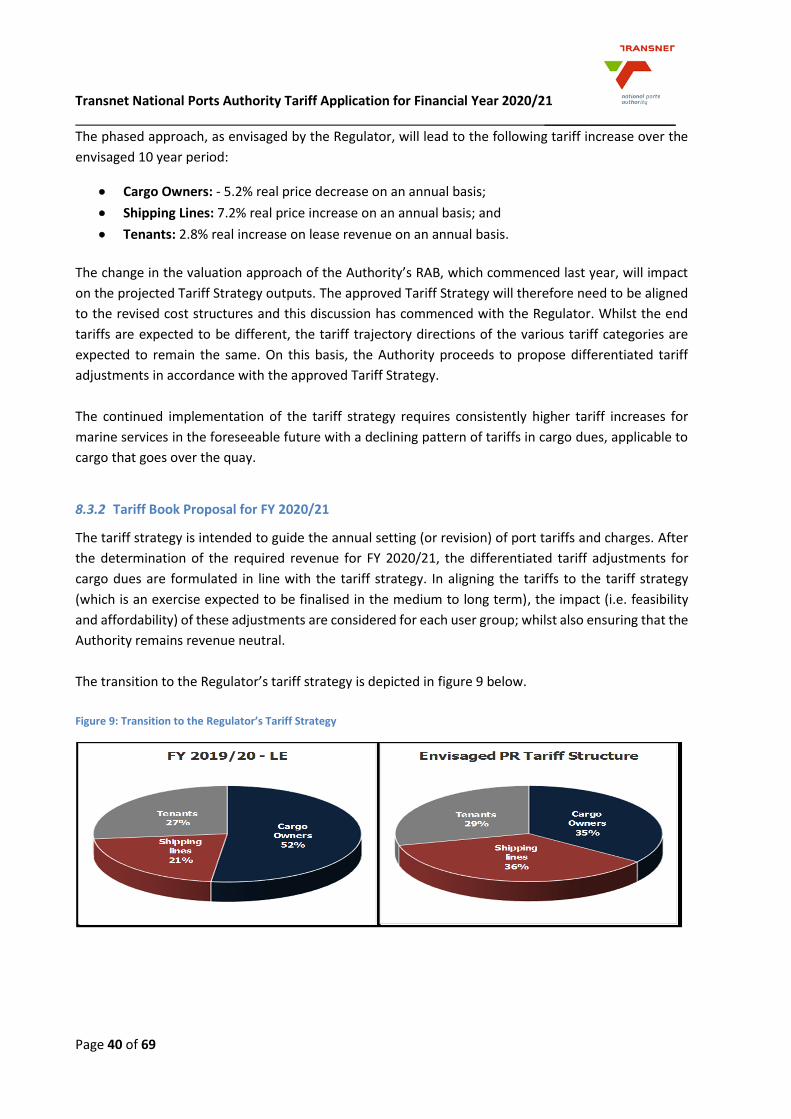
Transnet National Ports Authority Tariff Application for Financial Year 2020/21 __________________
Page 40 of 69
The phased approach, as envisaged by the Regulator, will lead to the following tariff increase over the
envisaged 10 year period:
Cargo Owners: - 5.2% real price decrease on an annual basis;
Shipping Lines: 7.2% real price increase on an annual basis; and
Tenants: 2.8% real increase on lease revenue on an annual basis.
The change in the valuation approach of the Authority’s RAB, which commenced last year, will impact
on the projected Tariff Strategy outputs. The approved Tariff Strategy will therefore need to be aligned
to the revised cost structures and this discussion has commenced with the Regulator. Whilst the end
tariffs are expected to be different, the tariff trajectory directions of the various tariff categories are
expected to remain the same. On this basis, the Authority proceeds to propose differentiated tariff
adjustments in accordance with the approved Tariff Strategy.
The continued implementation of the tariff strategy requires consistently higher tariff increases for
marine services in the foreseeable future with a declining pattern of tariffs in cargo dues, applicable to
cargo that goes over the quay.
8.3.2 Tariff Book Proposal for FY 2020/21
The tariff strategy is intended to guide the annual setting (or revision) of port tariffs and charges. After
the determination of the required revenue for FY 2020/21, the differentiated tariff adjustments for
cargo dues are formulated in line with the tariff strategy. In aligning the tariffs to the tariff strategy
(which is an exercise expected to be finalised in the medium to long term), the impact (i.e. feasibility
and affordability) of these adjustments are considered for each user group; whilst also ensuring that the
Authority remains revenue neutral.
The transition to the Regulator’s tariff strategy is depicted in figure 9 below.
Figure 9: Transition to the Regulator’s Tariff Strategy
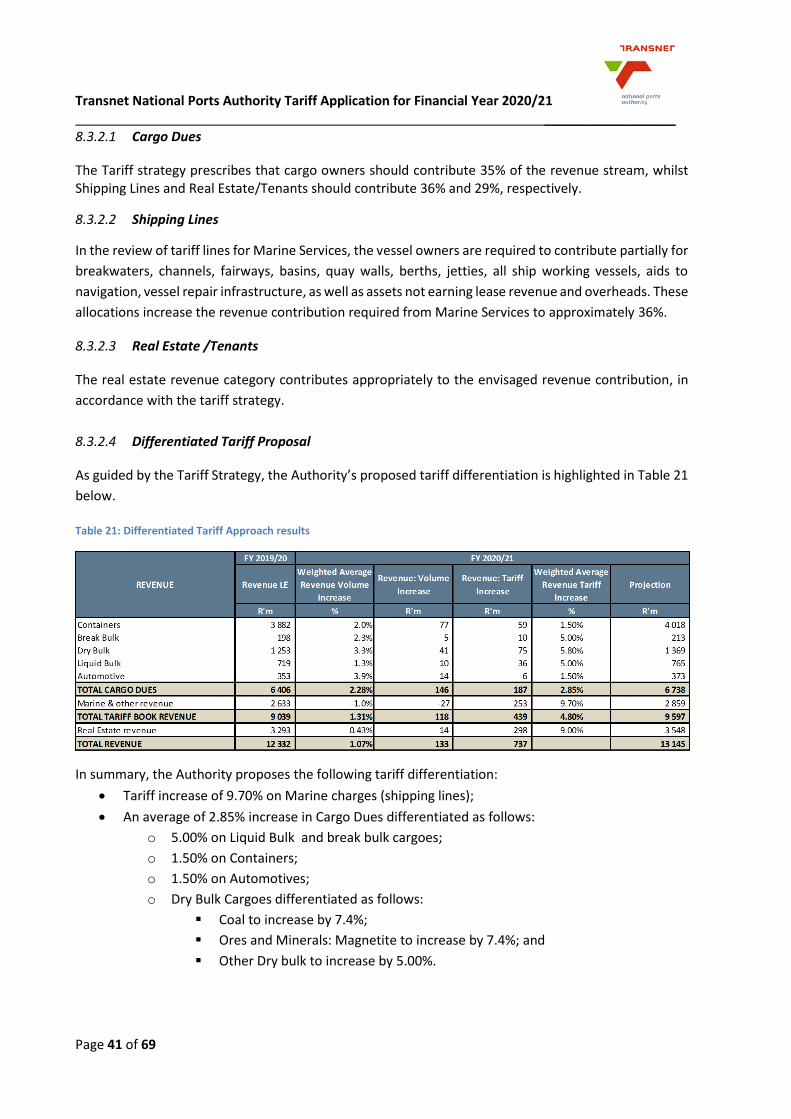
Transnet National Ports Authority Tariff Application for Financial Year 2020/21 __________________
Page 41 of 69
8.3.2.1 Cargo Dues
The Tariff strategy prescribes that cargo owners should contribute 35% of the revenue stream, whilst Shipping Lines and Real Estate/Tenants should contribute 36% and 29%, respectively.
8.3.2.2 Shipping Lines
In the review of tariff lines for Marine Services, the vessel owners are required to contribute partially for
breakwaters, channels, fairways, basins, quay walls, berths, jetties, all ship working vessels, aids to
navigation, vessel repair infrastructure, as well as assets not earning lease revenue and overheads. These
allocations increase the revenue contribution required from Marine Services to approximately 36%.
8.3.2.3 Real Estate /Tenants
The real estate revenue category contributes appropriately to the envisaged revenue contribution, in
accordance with the tariff strategy.
8.3.2.4 Differentiated Tariff Proposal
As guided by the Tariff Strategy, the Authority’s proposed tariff differentiation is highlighted in Table 21
below.
Table 21: Differentiated Tariff Approach results
In summary, the Authority proposes the following tariff differentiation:
Tariff increase of 9.70% on Marine charges (shipping lines);
An average of 2.85% increase in Cargo Dues differentiated as follows:
o 5.00% on Liquid Bulk and break bulk cargoes;
o 1.50% on Containers;
o 1.50% on Automotives;
o Dry Bulk Cargoes differentiated as follows:
Coal to increase by 7.4%;
Ores and Minerals: Magnetite to increase by 7.4%; and
Other Dry bulk to increase by 5.00%.
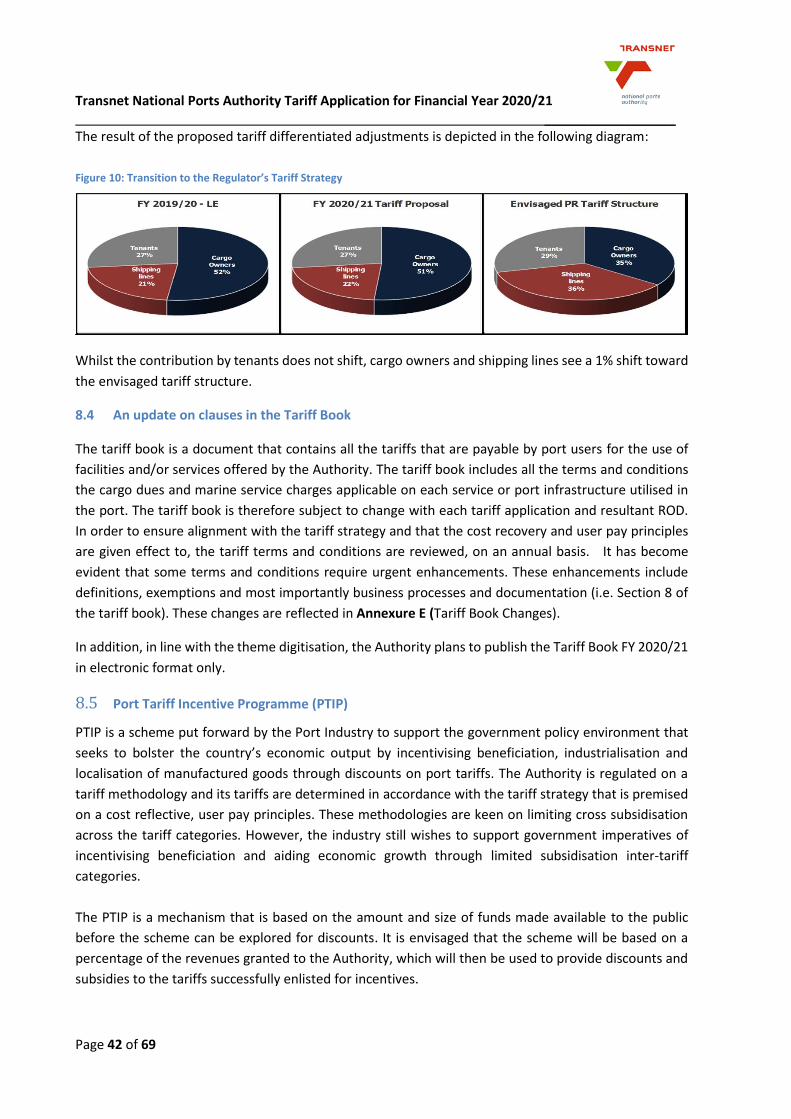
Transnet National Ports Authority Tariff Application for Financial Year 2020/21 __________________
Page 42 of 69
The result of the proposed tariff differentiated adjustments is depicted in the following diagram:
Figure 10: Transition to the Regulator’s Tariff Strategy
Whilst the contribution by tenants does not shift, cargo owners and shipping lines see a 1% shift toward
the envisaged tariff structure.
8.4 An update on clauses in the Tariff Book
The tariff book is a document that contains all the tariffs that are payable by port users for the use of
facilities and/or services offered by the Authority. The tariff book includes all the terms and conditions
the cargo dues and marine service charges applicable on each service or port infrastructure utilised in
the port. The tariff book is therefore subject to change with each tariff application and resultant ROD.
In order to ensure alignment with the tariff strategy and that the cost recovery and user pay principles
are given effect to, the tariff terms and conditions are reviewed, on an annual basis. It has become
evident that some terms and conditions require urgent enhancements. These enhancements include
definitions, exemptions and most importantly business processes and documentation (i.e. Section 8 of
the tariff book). These changes are reflected in Annexure E (Tariff Book Changes).
In addition, in line with the theme digitisation, the Authority plans to publish the Tariff Book FY 2020/21
in electronic format only.
8.5 Port Tariff Incentive Programme (PTIP)
PTIP is a scheme put forward by the Port Industry to support the government policy environment that
seeks to bolster the country’s economic output by incentivising beneficiation, industrialisation and
localisation of manufactured goods through discounts on port tariffs. The Authority is regulated on a
tariff methodology and its tariffs are determined in accordance with the tariff strategy that is premised
on a cost reflective, user pay principles. These methodologies are keen on limiting cross subsidisation
across the tariff categories. However, the industry still wishes to support government imperatives of
incentivising beneficiation and aiding economic growth through limited subsidisation inter-tariff
categories.
The PTIP is a mechanism that is based on the amount and size of funds made available to the public
before the scheme can be explored for discounts. It is envisaged that the scheme will be based on a
percentage of the revenues granted to the Authority, which will then be used to provide discounts and
subsidies to the tariffs successfully enlisted for incentives.
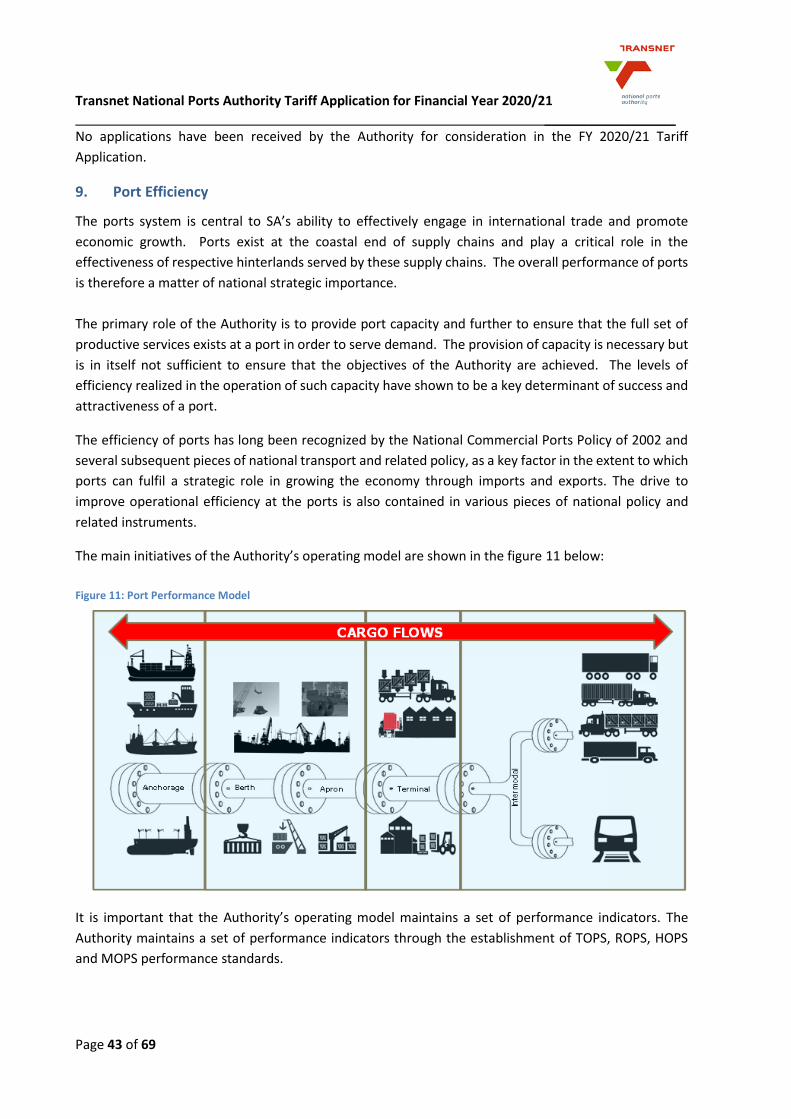
Transnet National Ports Authority Tariff Application for Financial Year 2020/21 __________________
Page 43 of 69
No applications have been received by the Authority for consideration in the FY 2020/21 Tariff
Application.
9. Port Efficiency
The ports system is central to SA’s ability to effectively engage in international trade and promote
economic growth. Ports exist at the coastal end of supply chains and play a critical role in the
effectiveness of respective hinterlands served by these supply chains. The overall performance of ports
is therefore a matter of national strategic importance.
The primary role of the Authority is to provide port capacity and further to ensure that the full set of
productive services exists at a port in order to serve demand. The provision of capacity is necessary but
is in itself not sufficient to ensure that the objectives of the Authority are achieved. The levels of
efficiency realized in the operation of such capacity have shown to be a key determinant of success and
attractiveness of a port.
The efficiency of ports has long been recognized by the National Commercial Ports Policy of 2002 and
several subsequent pieces of national transport and related policy, as a key factor in the extent to which
ports can fulfil a strategic role in growing the economy through imports and exports. The drive to
improve operational efficiency at the ports is also contained in various pieces of national policy and
related instruments.
The main initiatives of the Authority’s operating model are shown in the figure 11 below:
Figure 11: Port Performance Model
It is important that the Authority’s operating model maintains a set of performance indicators. The
Authority maintains a set of performance indicators through the establishment of TOPS, ROPS, HOPS
and MOPS performance standards.
Transnet National Ports Authority Tariff Application for Financial Year 2020/21 __________________
Page 44 of 69
In order for the Authority to continue executing that mandate the following initiatives will continue to
be rolled out in 2020/21.
9.1.1.1 Enforcement of Ports’ Oversight
With the Terminal Operator Performance Standards (TOPS) system well embedded across the port
system, the focus will shift to enforcing compliance to all the provisions of the Terminal Operator Licence
(TOL), as well as the Act. It has therefore become necessary, as the next step in the growth of TOPS, to
include an enforcement process and a standard operating procedure for the ports, as envisaged in terms
of clause 20 of the TOL.
The enforcement process will serve as a guideline, to be used by the Port Oversight Committees (“POC”)
and the National Oversight Committee (“NOC”) for all aspects of Terminal Operator Oversight, including
but not limited to TOPS, assessment and enforcement of remedial actions as a results of poor
performance and audit findings.
9.1.1.2 Capacity Study
In accordance with the Act, the Authority is required to ensure that Ports are being utilized to full
capacity by port users. Capacity studies were therefore conducted between 2014 and 2015 by an
independent body and, after due engagement, accepted by all stakeholders. It has, however, been
recommended that Terminal capacity studies be reviewed and updated to reflect the continuous
operational handling changes. It is worth noting that these changes have a direct impact on the TOPS
targets, giving rise to the need for reliable, validated Terminal capacities to inform the setting of
performance standards such as TOPS, ROPS, MOPS and HOPS.
9.1.1.3 HOPS
The Authority will be reviewing the HOPS framework for the Ports of Durban, Cape Town and Richards
Bay. The Authority will also engage all ports stakeholders to develop and agree on a HOPS framework to
ensure that the correct Key Performance Indicators (KPIs) and targets are identified. Identified KPIs and
targets will drive the Authority’s processes to ensure that landside operations are efficient and address
stakeholder requirements.
10. Weighted Efficiency Gains from Operations
The Regulator introduced an efficiency incentive in the form of the Weighted Efficiency Gains from
Operations (WEGO) aimed at regulating port performance and tariff determination, allowing up to 5%
additional return on equity to the Authority for an increase of 10% year-on-year performance
improvements. Similarly, a 10% reduction in performance can result in a 5% reduction of return on
equity. The previous best performance will be the baseline for the next year’s measurement.
Performance of the port system during 2017/18 is regarded as the initial base for measurement.
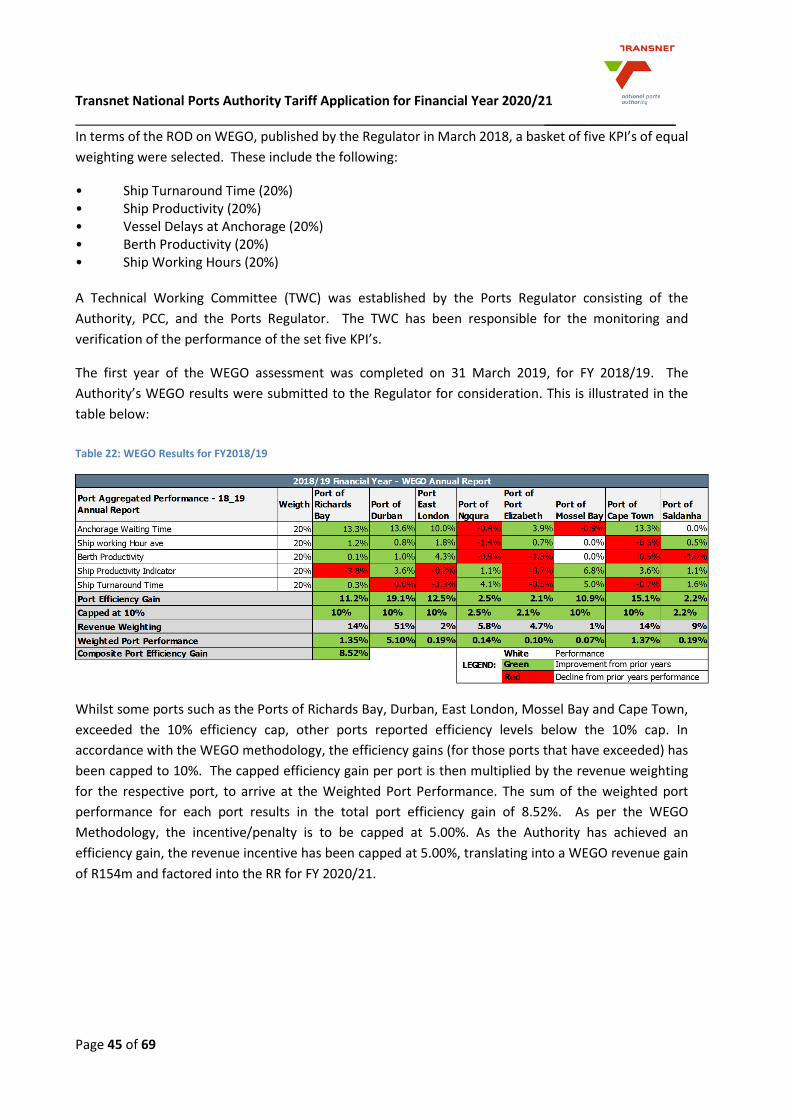
Transnet National Ports Authority Tariff Application for Financial Year 2020/21 __________________
Page 45 of 69
In terms of the ROD on WEGO, published by the Regulator in March 2018, a basket of five KPI’s of equal
weighting were selected. These include the following:
• Ship Turnaround Time (20%) • Ship Productivity (20%) • Vessel Delays at Anchorage (20%) • Berth Productivity (20%) • Ship Working Hours (20%) A Technical Working Committee (TWC) was established by the Ports Regulator consisting of the
Authority, PCC, and the Ports Regulator. The TWC has been responsible for the monitoring and
verification of the performance of the set five KPI’s.
The first year of the WEGO assessment was completed on 31 March 2019, for FY 2018/19. The
Authority’s WEGO results were submitted to the Regulator for consideration. This is illustrated in the
table below:
Table 22: WEGO Results for FY2018/19
Whilst some ports such as the Ports of Richards Bay, Durban, East London, Mossel Bay and Cape Town,
exceeded the 10% efficiency cap, other ports reported efficiency levels below the 10% cap. In
accordance with the WEGO methodology, the efficiency gains (for those ports that have exceeded) has
been capped to 10%. The capped efficiency gain per port is then multiplied by the revenue weighting
for the respective port, to arrive at the Weighted Port Performance. The sum of the weighted port
performance for each port results in the total port efficiency gain of 8.52%. As per the WEGO
Methodology, the incentive/penalty is to be capped at 5.00%. As the Authority has achieved an
efficiency gain, the revenue incentive has been capped at 5.00%, translating into a WEGO revenue gain
of R154m and factored into the RR for FY 2020/21.
Transnet National Ports Authority Tariff Application for Financial Year 2020/21 __________________
Page 46 of 69
11. Conclusion
As stated in the State of the Nation Address Debate of 25 June 2019, and as outlined in the National
Development Plan, “SOE’s are central to advancing national objectives through providing economic and
social infrastructure. If this is done in an equitable and cost-effective way, SOE’s can contribute to both
deliver a quality and reliable service at a cost that enables South Africa to be globally competitive.”
The aforementioned national objectives coupled with Transnet’s objective of lowering the cost of doing
business in South Africa, provides the context of the Authority’s strategic focus and planned execution
thereof. This translates into an affordable tariff adjustment, marginally below the forecasted inflation
rate.
In accordance with the approved Tariff Methodology, the Authority has determined a required revenue
of R13 145m for FY 2020/21 comprising of Marine Business revenue of R9 597m and Real Estate Business
revenue of R3 548m. This translates into tariff adjustment of 4.80% for FY 2020/21.
In order to ensure alignment with the principles of the Tariff Strategy, the Authority further proposes
that the weighted average tariff increase for FY 2020/21 is differentiated as follows:
Tariff increase of 9.70% on Marine charges (shipping lines);
An average of 2.85% increase in Cargo Dues differentiated as follows:
o 5.00% on Liquid Bulk and break bulk cargoes;
o 1.50% on Containers;
o 1.50% on Automotives;
o Dry Bulk Cargoes differentiated as follows:
Coal to increase by 7.4%;
Ores and Minerals: Magnetite to increase by 7.4%; and
Other Dry bulk to increase by 5.00%.
An The indicative required revenues and resultant tariff adjustments for FY 2021/22 and FY 2022/23 are
R15 339m (18.14%) and R16 774m (8.50%) respectively.
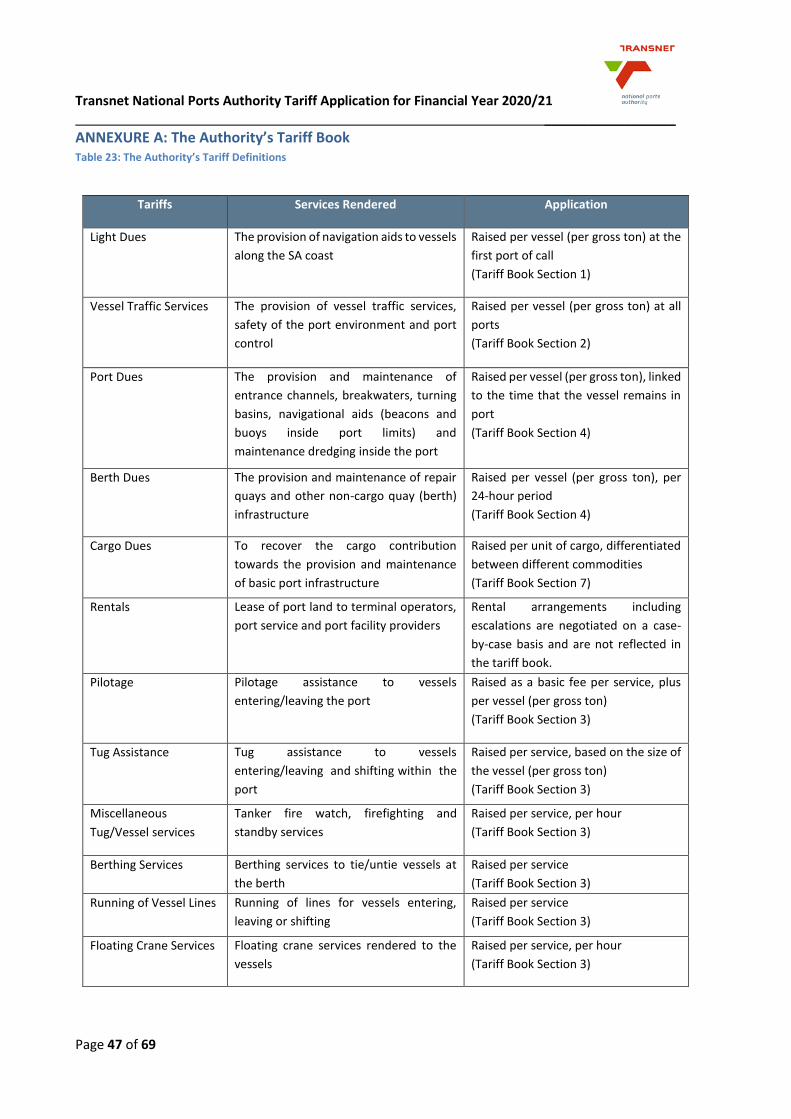
Transnet National Ports Authority Tariff Application for Financial Year 2020/21 __________________
Page 47 of 69
ANNEXURE A: The Authority’s Tariff Book Table 23: The Authority’s Tariff Definitions
Tariffs Services Rendered Application
Light Dues The provision of navigation aids to vessels
along the SA coast
Raised per vessel (per gross ton) at the
first port of call
(Tariff Book Section 1)
Vessel Traffic Services The provision of vessel traffic services,
safety of the port environment and port
control
Raised per vessel (per gross ton) at all
ports
(Tariff Book Section 2)
Port Dues The provision and maintenance of
entrance channels, breakwaters, turning
basins, navigational aids (beacons and
buoys inside port limits) and
maintenance dredging inside the port
Raised per vessel (per gross ton), linked
to the time that the vessel remains in
port
(Tariff Book Section 4)
Berth Dues The provision and maintenance of repair
quays and other non-cargo quay (berth)
infrastructure
Raised per vessel (per gross ton), per
24-hour period
(Tariff Book Section 4)
Cargo Dues To recover the cargo contribution
towards the provision and maintenance
of basic port infrastructure
Raised per unit of cargo, differentiated
between different commodities
(Tariff Book Section 7)
Rentals Lease of port land to terminal operators,
port service and port facility providers
Rental arrangements including
escalations are negotiated on a case-
by-case basis and are not reflected in
the tariff book.
Pilotage Pilotage assistance to vessels
entering/leaving the port
Raised as a basic fee per service, plus
per vessel (per gross ton)
(Tariff Book Section 3)
Tug Assistance Tug assistance to vessels
entering/leaving and shifting within the
port
Raised per service, based on the size of
the vessel (per gross ton)
(Tariff Book Section 3)
Miscellaneous
Tug/Vessel services
Tanker fire watch, firefighting and
standby services
Raised per service, per hour
(Tariff Book Section 3)
Berthing Services Berthing services to tie/untie vessels at
the berth
Raised per service
(Tariff Book Section 3)
Running of Vessel Lines Running of lines for vessels entering,
leaving or shifting
Raised per service
(Tariff Book Section 3)
Floating Crane Services Floating crane services rendered to the
vessels
Raised per service, per hour
(Tariff Book Section 3)
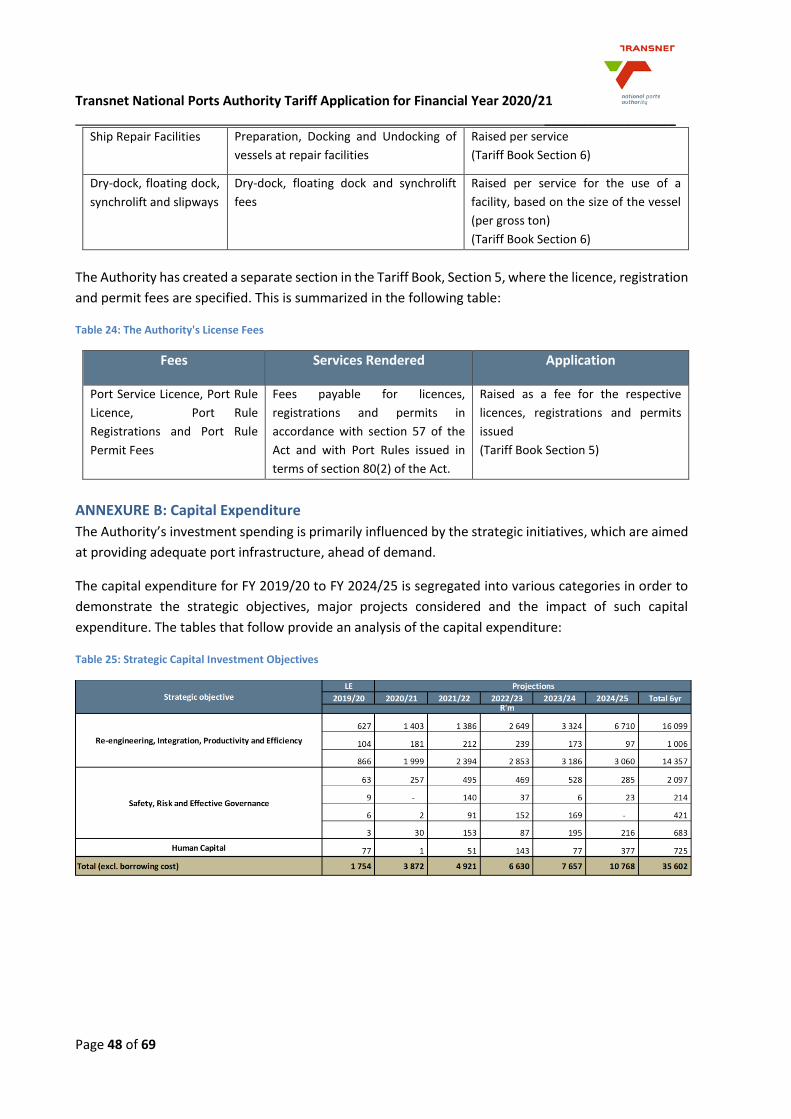
Transnet National Ports Authority Tariff Application for Financial Year 2020/21 __________________
Page 48 of 69
The Authority has created a separate section in the Tariff Book, Section 5, where the licence, registration
and permit fees are specified. This is summarized in the following table:
Table 24: The Authority's License Fees
Fees Services Rendered Application
Port Service Licence, Port Rule
Licence, Port Rule
Registrations and Port Rule
Permit Fees
Fees payable for licences,
registrations and permits in
accordance with section 57 of the
Act and with Port Rules issued in
terms of section 80(2) of the Act.
Raised as a fee for the respective
licences, registrations and permits
issued
(Tariff Book Section 5)
ANNEXURE B: Capital Expenditure
The Authority’s investment spending is primarily influenced by the strategic initiatives, which are aimed
at providing adequate port infrastructure, ahead of demand.
The capital expenditure for FY 2019/20 to FY 2024/25 is segregated into various categories in order to
demonstrate the strategic objectives, major projects considered and the impact of such capital
expenditure. The tables that follow provide an analysis of the capital expenditure:
Table 25: Strategic Capital Investment Objectives
Ship Repair Facilities Preparation, Docking and Undocking of
vessels at repair facilities
Raised per service
(Tariff Book Section 6)
Dry-dock, floating dock,
synchrolift and slipways
Dry-dock, floating dock and synchrolift
fees
Raised per service for the use of a
facility, based on the size of the vessel
(per gross ton)
(Tariff Book Section 6)
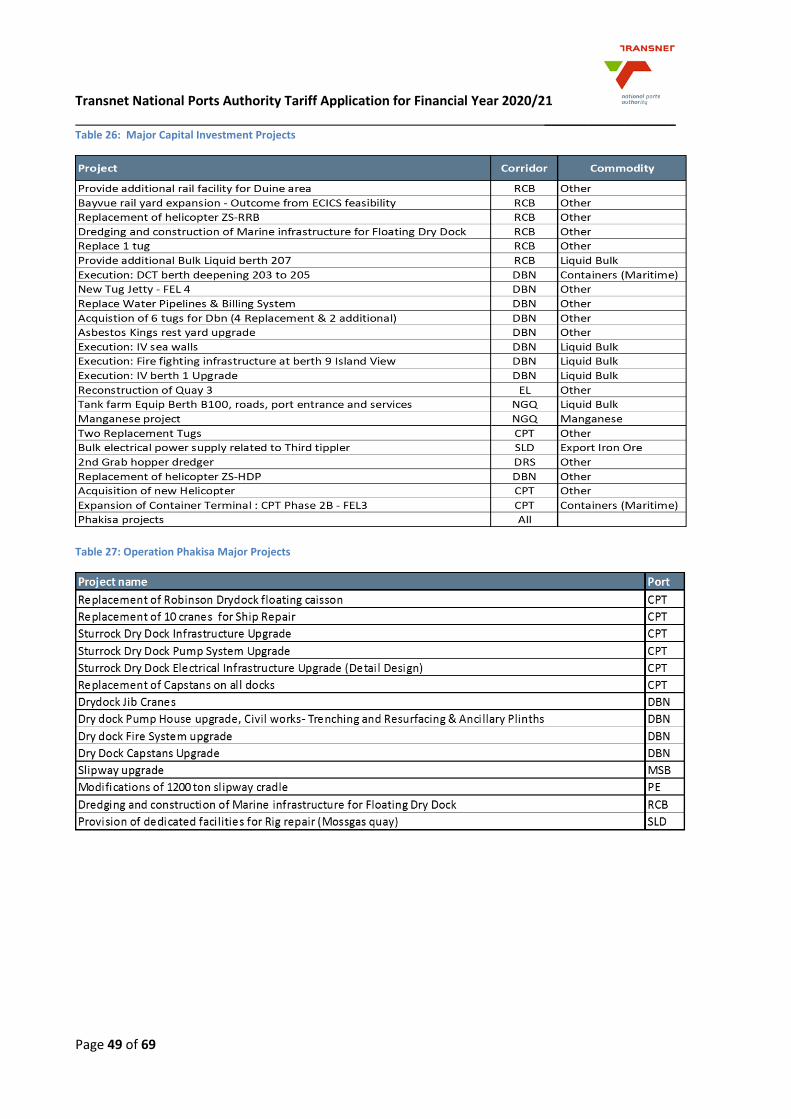
Transnet National Ports Authority Tariff Application for Financial Year 2020/21 __________________
Page 49 of 69
Table 26: Major Capital Investment Projects
Table 27: Operation Phakisa Major Projects
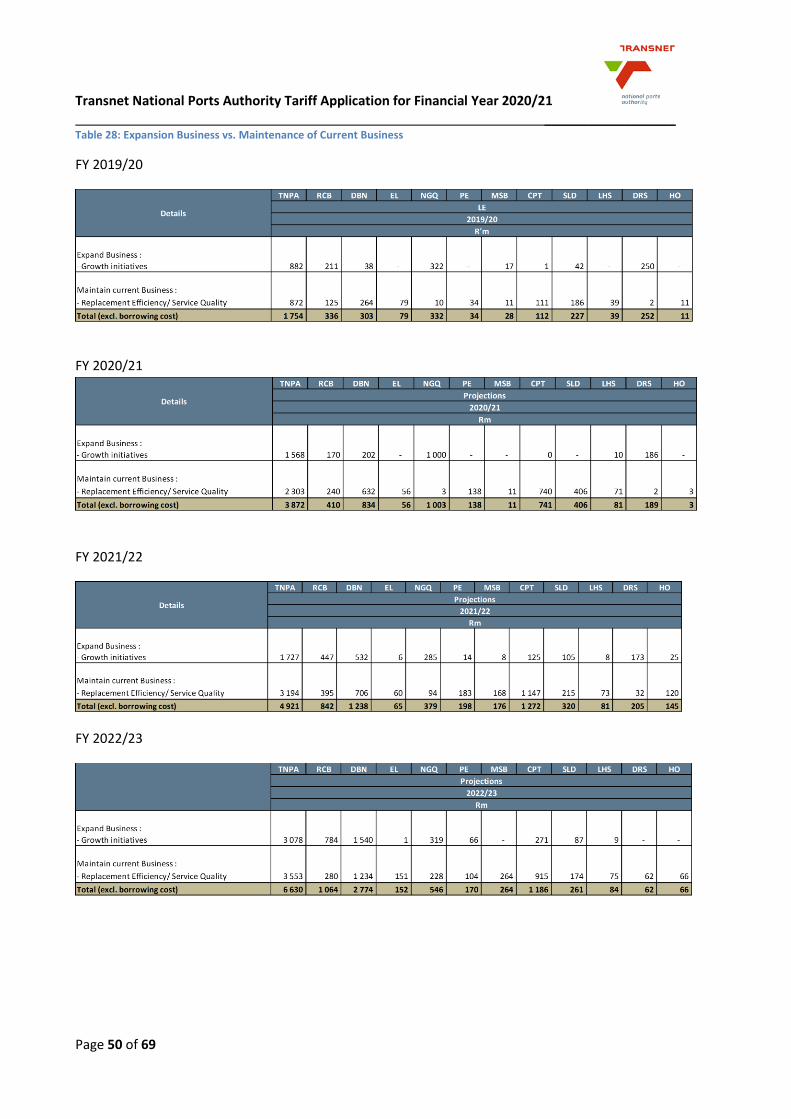
Transnet National Ports Authority Tariff Application for Financial Year 2020/21 __________________
Page 50 of 69
Table 28: Expansion Business vs. Maintenance of Current Business
FY 2019/20
FY 2020/21
FY 2021/22
FY 2022/23
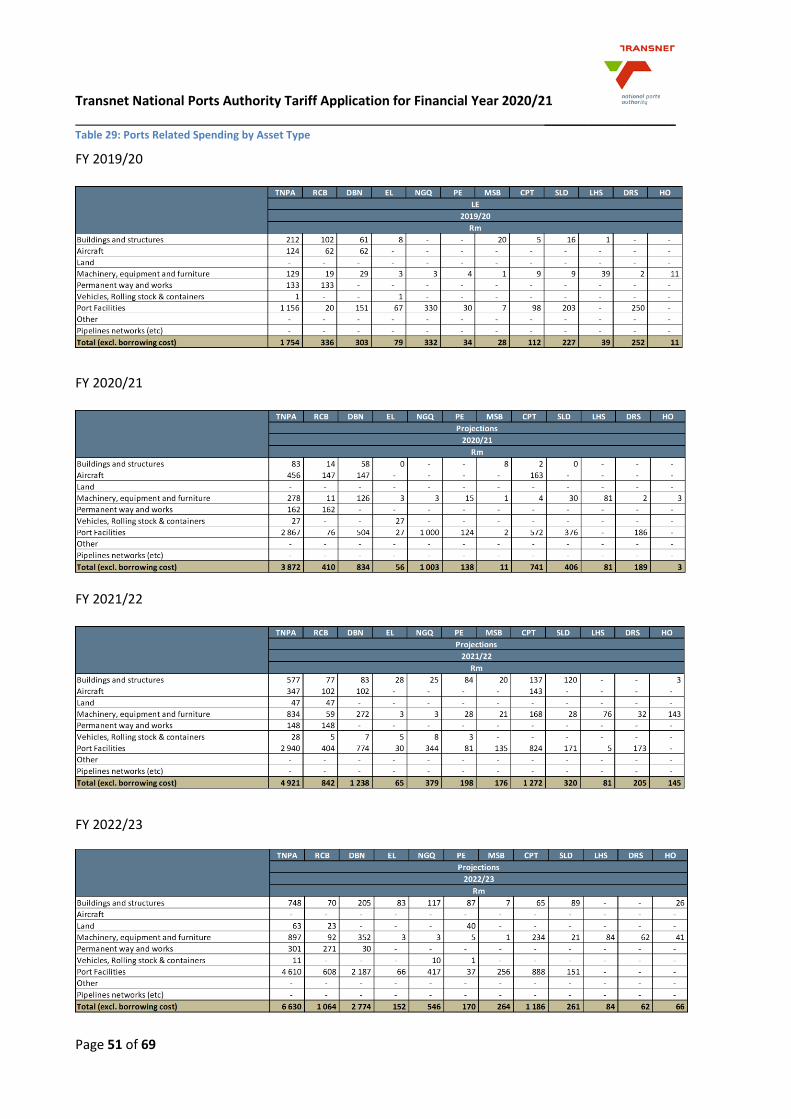
Transnet National Ports Authority Tariff Application for Financial Year 2020/21 __________________
Page 51 of 69
Table 29: Ports Related Spending by Asset Type
FY 2019/20
FY 2020/21
FY 2021/22
FY 2022/23
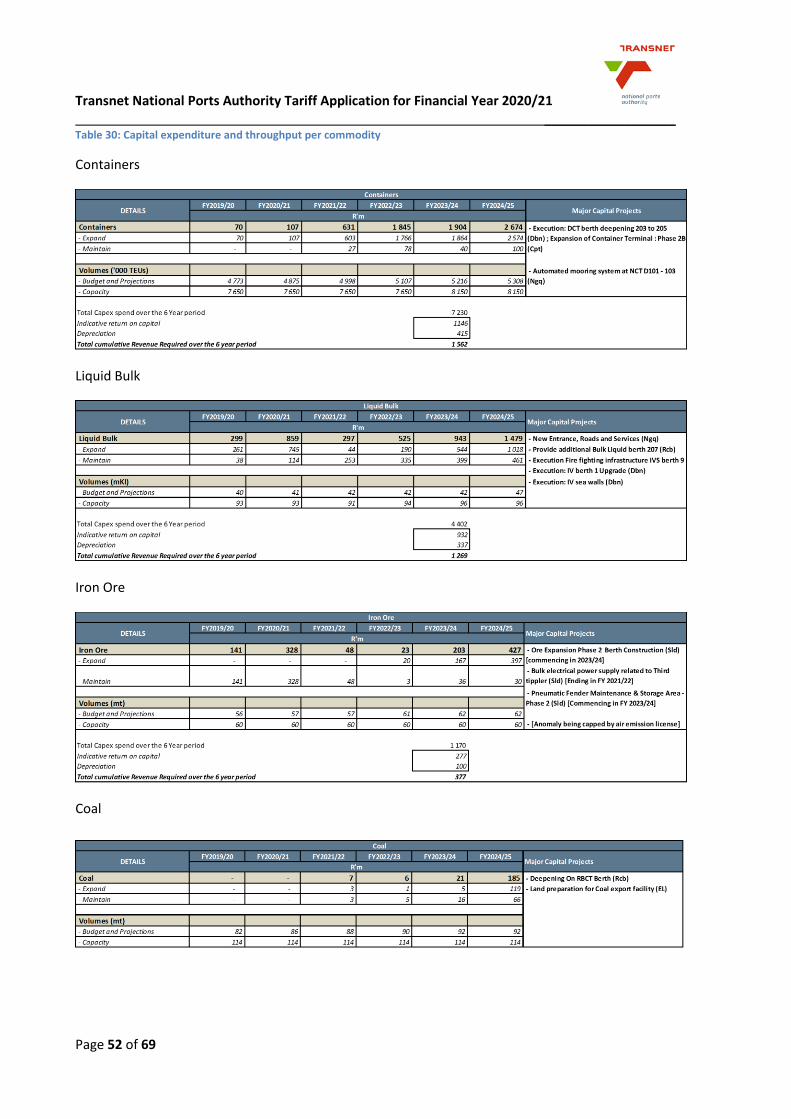
Transnet National Ports Authority Tariff Application for Financial Year 2020/21 __________________
Page 52 of 69
Table 30: Capital expenditure and throughput per commodity
Containers
Liquid Bulk
Iron Ore
Coal
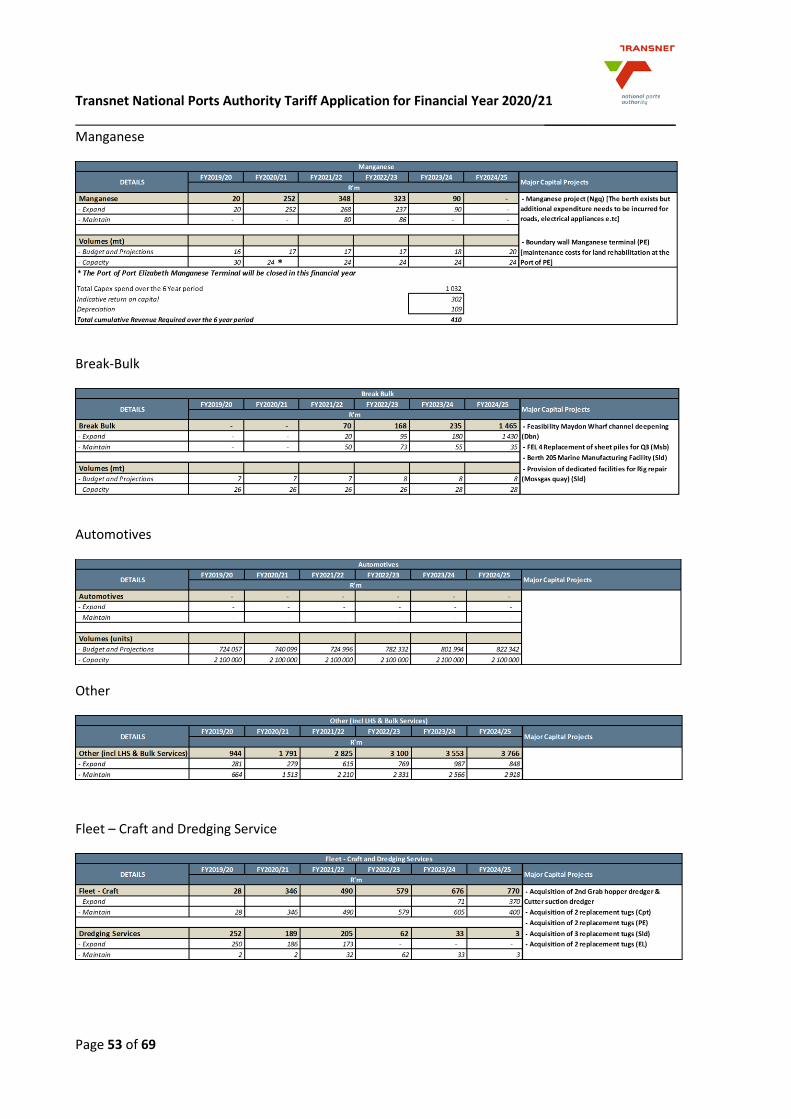
Transnet National Ports Authority Tariff Application for Financial Year 2020/21 __________________
Page 53 of 69
Manganese
Break-Bulk
Automotives
Other
Fleet – Craft and Dredging Service
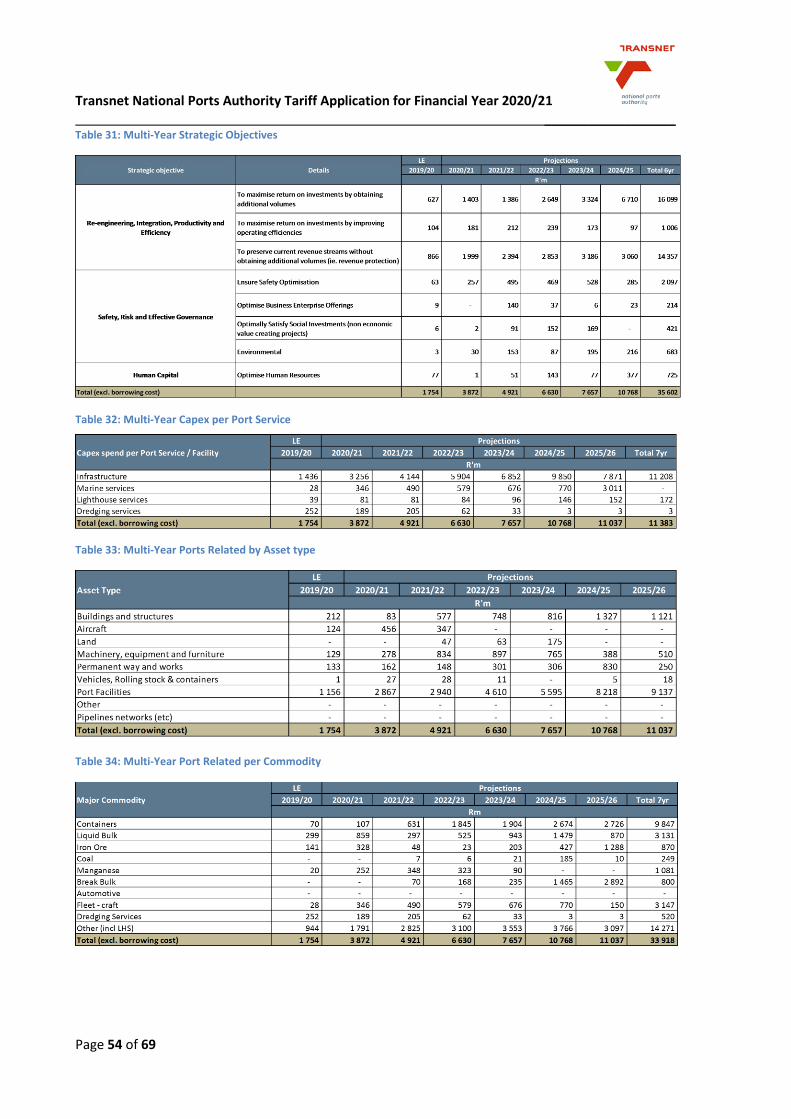
Transnet National Ports Authority Tariff Application for Financial Year 2020/21 __________________
Page 54 of 69
Table 31: Multi-Year Strategic Objectives
Table 32: Multi-Year Capex per Port Service
Table 33: Multi-Year Ports Related by Asset type
Table 34: Multi-Year Port Related per Commodity
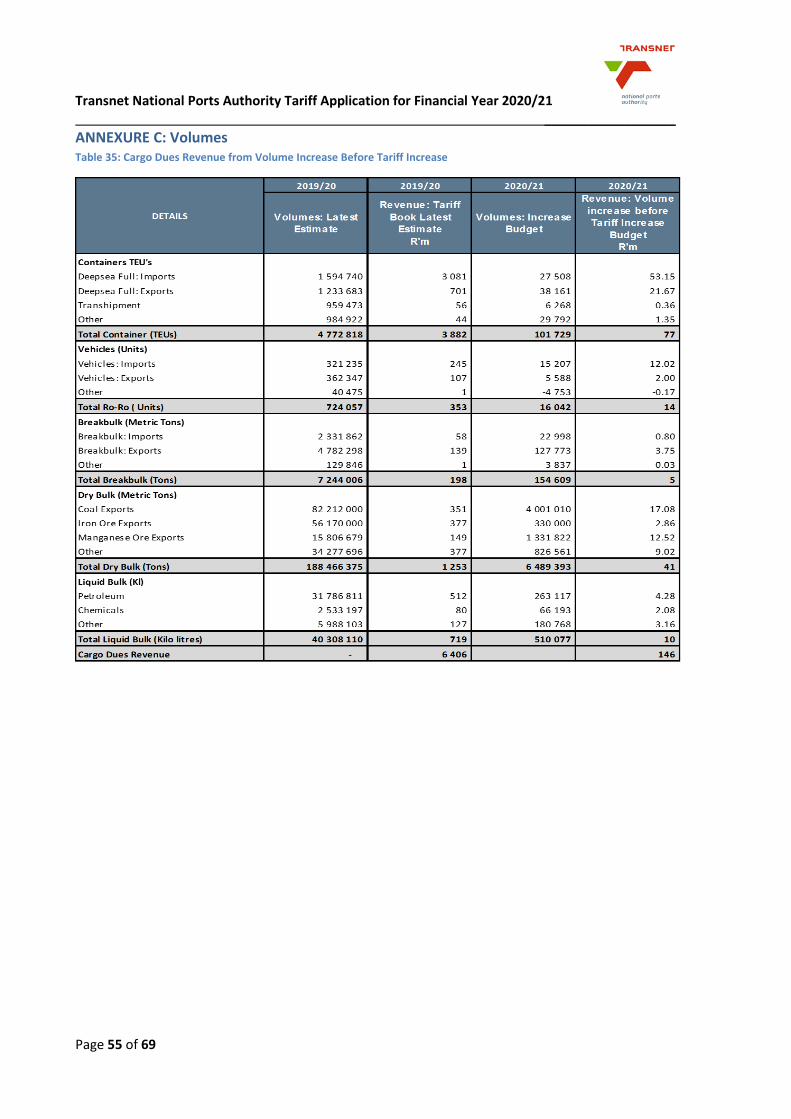
Transnet National Ports Authority Tariff Application for Financial Year 2020/21 __________________
Page 55 of 69
ANNEXURE C: Volumes Table 35: Cargo Dues Revenue from Volume Increase Before Tariff Increase
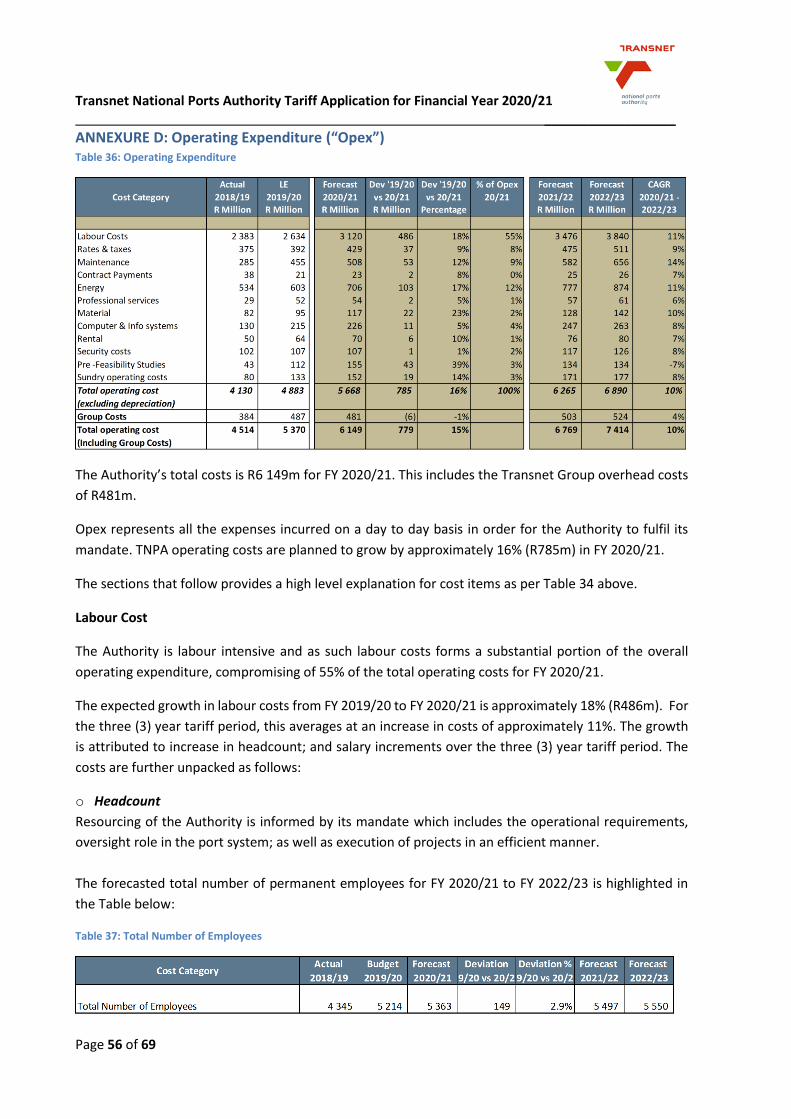
Transnet National Ports Authority Tariff Application for Financial Year 2020/21 __________________
Page 56 of 69
ANNEXURE D: Operating Expenditure (“Opex”) Table 36: Operating Expenditure
The Authority’s total costs is R6 149m for FY 2020/21. This includes the Transnet Group overhead costs
of R481m.
Opex represents all the expenses incurred on a day to day basis in order for the Authority to fulfil its
mandate. TNPA operating costs are planned to grow by approximately 16% (R785m) in FY 2020/21.
The sections that follow provides a high level explanation for cost items as per Table 34 above.
Labour Cost
The Authority is labour intensive and as such labour costs forms a substantial portion of the overall
operating expenditure, compromising of 55% of the total operating costs for FY 2020/21.
The expected growth in labour costs from FY 2019/20 to FY 2020/21 is approximately 18% (R486m). For
the three (3) year tariff period, this averages at an increase in costs of approximately 11%. The growth
is attributed to increase in headcount; and salary increments over the three (3) year tariff period. The
costs are further unpacked as follows:
o Headcount
Resourcing of the Authority is informed by its mandate which includes the operational requirements,
oversight role in the port system; as well as execution of projects in an efficient manner.
The forecasted total number of permanent employees for FY 2020/21 to FY 2022/23 is highlighted in
the Table below:
Table 37: Total Number of Employees
Transnet National Ports Authority Tariff Application for Financial Year 2020/21 __________________
Page 57 of 69
Not much progress has been made in FY2018/19 in terms of recruiting the required personnel (4 999
planned FY 2018/19 vs 4 345 actual FY 2018/19) and hence the planned increase in headcount from FY
2019/20 to FY 2020/21.
The focus of the Authority remains on filling the critical vacancies for key operational personnel required.
The operational personnel makes up for approximately 70% of the vacancies; whilst support personnel
makes up the remaining 30%.
The key reasons for increase in headcount is due to the critical vacancies as follows:
Employment of port engineering personnel in order to create adequate port infrastructure ahead
of demand and maintaining existing and new assets;
Additional Aviation personnel required due to helicopter services being extended to the Port of
Cape Town;
Meeting minimum manning levels of marine at 100% service and matching manning levels with
number of tugs required per shift linked to meet the MOPS requirements;
Security personnel required to ensure CCTV monitoring/ maintenance and the overall safety within
the ports;
Additional support services staff to assist with the administration within the ports system;
Marine seafarer and MEO personnel;
Trainees required for marine pipeline in scarce marine grades, i.e. Chief Marine Engineering officers
and Tug Masters;
Manning of the port operational centres to ensure systematic views of port performance;
Increase Fire Services personnel to ensure correct manning levels i.t.o. operating of new fire trucks;
Enterprise Risk Management (ERM) personnel to ensure oversight and compliance with risk
management requirements;
Environmental practitioners required to ensure that Ports are compliant with all environmental and
safety regulations:
Trainers required for marine engineering schools in the Port. Training in the Port of Ngqura is
scheduled to commence in January 2020 with 25 learners and will increase by 25 learners each year
to reach a full capacity of 100 learners;
New business and Section 56 personnel required in order to continuously attract new business
which is crucial for the sustainability of the Port system.
o Remuneration
Remuneration is made up of annual salary adjustments. It is also worth noting that the increase in
headcount further leads to an increase in remuneration.
o Training
Adequate training and development of human capital is a core focus area for the Authority. This ensures
continuous growth, upskilling and advancement of the Authority and therefore remains a priority. The
Authority continues with various training initiatives including cadet training, pilot training, tug master
training and chief marine engineer officer training.
Transnet National Ports Authority Tariff Application for Financial Year 2020/21 __________________
Page 58 of 69
The Authority has extended the Operation Phakisa programme by establishing Marine Engineering
training schools. The schools are intended to create opportunities for the communities to participate in
the port sector with the aim to address poverty, unemployment and inequality.
The Authority has entered into a SLA with the Petroleum, Oil and Gas Corporation of South Africa SOC
Ltd (“PetroSA”), who provides training to 12 learners recruited by the Authority. Furthermore, the
Authority has entered into a partnership with the Umfolozi Further Education and Training (FET) College
to train 20 x Artisans (Electricians and Plumbers). This training commenced in FY 2019/20.
Additional training is planned for leadership across all the ports. The Authority will further continue with
its normal training initiatives relating to cadet training; helicopter pilot training, aircraft maintenance
and aircraft avionics training.
Rates and Taxes
Rates and taxes relate to municipal rates and are based on the methodology employed by the
municipalities in accordance with the Municipal Rates and Taxes Act. Normally the increase in this cost
category is above inflation rate. The increase in the current financial year is set at 9% and is mainly
attributed to the Ports property values.
Rates and taxes are expected to increase by approximately 9% per annum, over the 3 year period.
Maintenance
The maintenance cost covers the upkeep of aged infrastructure as well as routine maintenance for
newer infrastructure assets, newer marine craft and increased maintenance focused on the ship repair
business. It is necessary to ensure that Aids to Navigation infrastructure and other assets are maintained
to ensure general safety of navigation and protection of the marine environment.
The Authority did not manage to spend the maintenance budget for 2018/19. The main reasons for the
underspending was due to the following:
The CCTV maintenance contract not being renewed;
Scheduled layup activities for the dredgers were delayed extensively, due to sourcing challenges of
specific mechanical components during the repair process;
Helicopter repairs did not take place as planned due to deferring of the Maintenance Periodic
Inspection (MPI) repairs;
Unplanned work and breakdowns resulted in the re-focusing of infrastructure resources that
resulted in the re-deployment of staff, that was responsible for the planned work;
Various issues with Rehabilitation Maintenance & Emergency Services (RME) were experienced
resulting in non-delivery on planned maintenance;
Transnet National Ports Authority Tariff Application for Financial Year 2020/21 __________________
Page 59 of 69
The increase on maintenance costs from FY 2019/20 to FY 2020/21 is approximately 12%. The average
growth in maintenance over the three year tariff period is approximately 14% and is mainly attributed
to the following:
Ports handle larger container vessels than they were designed to accommodate, necessitating a
higher frequency of maintenance dredging;
Ports are handling bigger, deeper ships with a very small under keel clearance. This has led to
scouring of the seabed which then requires additional dredging.
Ongoing maintenance of ageing infrastructure and marine dredging fleet, including:
o Rail infrastructure;
o Rehabilitation of Seawalls;
o Sinkholes;
o Road maintenance;
o Navigational Aids;
o Ship Repair infrastructure;
o Quay wall repairs;
o Hazmat drain flush;
o Storm water jetting;
o Building Repairs;
o CFI Mechanical Valves, hydrant repairs and general Statutory inspections;
o Break water cranes;
o Repairs to cranes, pumps and valves at dry-dock;
o Maintenance of marine craft, ensuring compliance to SAMSA requirements and craft being
operational at all times;
o Increase in the Maintenance of electrical network (High masts and substations);
o Floating Craft Repairs- Enseleni & Red Bishop;
o Access Control, Closed Circuit Television (CCTV) Repairs and Maintenance;
o Generators , High mast lights, Diving Equipment, Forklift & Tractors;
o Refurbishment of Mess & ablution facilities at Ship Repair Facilities;
o Condition Assessment of SDD Sliding Caisson;
o Electrical Maintenance of the high mast poles;
o Fleet Repairs & Maintenance;
o Track Maintenance;
o Repairs on Port Infrastructure (Existing IDA with RME); Roads, Buildings, Underground Services;
and;
o Vessel Tracking System (VTS) Maintenance ( Oynetec).
Contract Payments
The increase on contract payments from FY 2019/20 to FY 2020/21 is approximately 8%; with the
average increase over the three year tariff application period of approximately 7%.
Contract payments relate mainly to the helicopter pilot services in the Port of Durban and Richards Bay.
The amount budgeted for this cost has been reduced significantly between FY 2018/19 and FY 2019/20
Transnet National Ports Authority Tariff Application for Financial Year 2020/21 __________________
Page 60 of 69
due to the end of the external operational and maintenance helicopter contracts. The Authority
introduced a new maintenance strategy that makes use of an external supplier to procure and deliver
strategic helicopter spares sourced from abroad; whilst repairs and maintenance is completed internally.
The costs budgeted for in FY 2020/21 relates to Maintenance Periodic Inspection (MPI) repairs of the
old and new helicopter fleet. Wave monitoring services and Integrated Ports Office Support Services
(IPOSS) upgrade payments are also included.
Energy
Energy costs are mainly attributable to the fuel and electricity consumption of the Authority. The
increase in costs from FY 2019/20 to FY 2020/21 is approximately 17% (R103m). Three average increase
in energy costs over the 3 year tariff application period amounting to 11% and is mainly due to the
following:
Increase in electricity costs estimated at 8% over the 3 year period; and
Larger bollard pull capacity of the new craft for improved efficiencies, which results in higher fuel
consumption.
Professional Services
Professional fees relate to Operational Audits & Transnet Certification, and Real Estate projects relating
to Land use audit projects, Anticipated Section 56 consultants and Investment Property Valuation Fees.
Professional fees increased from FY 2019/20 to FY 2020/21 by 5%, with the average increase in
professional fees over the 3 year tariff application period amounting to 6%.
Key pre-feasibility studies have been planned as follows:
Development of Liquid Natural Gas (LNG) Import Facilities at the ports of Richards Bay as part of
the country’s medium to long term energy supply strategy:
Port of Cape Town Desalination Plant Studies;
Structural inspections of buildings (asset condition);
ISO 14001 & OHSAS 18001 Certification;
NDT Tests;
Professional fees consulting on bridge inspection;
Ergonomic studies;
Occupational Hygiene Survey for the new Admin building;
Biodiversity Survey;
TIMS Certification / BCM System;
Land use plans;
External structural engineers for the buildings & evaluations;
Infrastructure assessment sewerage, water, storm water and rail network; and
Island view land development, consultants will be assisting with Conditional assessment of the
facilities, transactional advisory on the land use as well as commodity mix.
Transnet National Ports Authority Tariff Application for Financial Year 2020/21 __________________
Page 61 of 69
Material
Material costs relate to material used in the maintenance of marine fleet and civil maintenance and are
therefore directly influenced by maintenance activity. The material costs increased from FY 2019/20 to
FY 2020/21 by 23%, with the average increase in material costs over the 3 year tariff application period
amounting to 10%. It must be borne in mind that the explanations provided above under Maintenance
have a direct bearing on material as well.
Computer and Information Systems
Computer and information systems include network costs, software licences, information system
support, development cost, computer consumables and on-going maintenance thereof. The increase in
Computer and Information Systems from FY2019/20 to FY2020/21 is 5%. The average increase over the
three year period is approximately 8%.
A significant portion of the cost increase is due to the implementation of the Smart People’s Port
programme. This is an all-encompassing, integrated digital platform created to enhance efficiencies and
improve port operations control. It encompasses functions such as Smart People’s Ports capacity
planning, Smart People’s Ports logistics location and scheduling control, Smart Ports traffic management
and Smart Ports container management.
The Smart People’s Port programme is aimed at availing many key enablers to enhance Port operations
in that it serves the following:
All port function activities are aggregated into a single repository creating a single source of
information
It provides operations insight, digitized infrastructure and operations automation as it enables real
time communication to all port operations and this assists in securing a stable network coverage
for all land and sea activities
Tracking of all assets required to ensure full visibility to better manage port operations and incident
management activities
Mapping of all port processes to create visualisation of all activities from the control centre
The human resources in the ports are able to achieve a far richer visibility of the port operations
continuously and this assists in management decisions and creating a safer environment
Improving turnaround times of vessels, trains and trucks.
Rental
Rental costs relates to the hiring of internal land and buildings, leasing of vehicles, equipment, computers and furniture. The increase in rental costs from FY2019/20 to FY 2020/21 is 10%. The average increase over the three year period is approximately 7%.
Security
Security costs relate to the use of private security firms at the ports and the expected increase from
FY 2019/20 to FY 2020/21 is 8%; with the 3 year average growth of 8%.
Transnet National Ports Authority Tariff Application for Financial Year 2020/21 __________________
Page 62 of 69
Pre-Feasibility Studies and Research & Development
Pre-feasibility studies are undertaken to determine future capital investments in a pre-feasibility phase
to discover the best alternative for construction, preliminary design work and costing to assess overall
viability of the project.
The increase in pre-feasibility costs from FY 2019/20 to FY 2020/21 is 39% (R43m), with an average
decrease of 7% over the three year tariff period.
The Authority will be embarking on pre-feasibility projects including:
Maydon Wharf channel deepening;
Schoemans bridge modification;
Bayhead road roads upgrades;
IV berth 4 upgrade;
Berth Deepening M/Wharf 5-11 & 15;
Upgrade Island view Roads;
Access Road to South Breakwater;
Replacement Millenium Tower Cowl;
Maydon Wharf truck stage FEL 4;
Provision of additional office space at OTB & Tween Deck;
Reconstruct Bluff Berths;
Durban Hangar refurbishment;
Air Quality Monitoring System;
Air-conditioning Plant at TNPA Buildings;
Pre Electrical Shore Supply to Vessels;
Upgrade Maydon Wharf Roads;
Reconstruct Bluff Berths;
Increase Electricity Power Supply Capacity;
Port of Ngqura Precinct Plans;
Sand Bypass Studies;
Studies on Charl Malan Quay Refurbishment;
Port of Port Elizabeth: Investigation on alternative uses of Tanker Berth;
Continuation of PE Waterfront study;
Richards Bay Expansion Program (RBEP);
Bayvue Railyard Configuration FEL 2;
South Dunes Liquid Bulk Services;
Reconfiguration of the Oil Jetty; and
Land Acquisition Due Diligence.
Transnet National Ports Authority Tariff Application for Financial Year 2020/21 __________________
Page 63 of 69
The Authority will be embarking on research and development projects including the following:
Best Practices Marine Operations;
Upgrade Of MSOE Main Campus 'Simulator Rooms;
Collaboration Decision Making;
Investigating of Environmental Aspect for DBN;
Best practice security models;
System & Network Testing;
ISO accreditation and 'Safety risk and quality training;
Document Tracking System;
Climate Change (wind & waves);
International Performance Benchmarking;
Allowable Quay Wall Loading;
Wind mitigation studies; and
Strategic Environmental Assessments.
Sundry Operating Costs
The detailed costs relating to sundry expenses are highlighted in Table 36 below. Sundry Costs include
expenses relating to insurance, stationery and printing, transport, promotions and advertising, and
other miscellaneous operating expenditure.
The main cost drivers relating to sundry expenses are as follows:
Legal Costs:
Health and Sanitation
Insurance
Other (i.e. mainly consulting)
Further to the above, the request for proposals for the Section 56 projects and public hearings thereof
will lead to increased environmental management; legal costs; printing/stationary; promotions and
advertising; and feasibility studies.
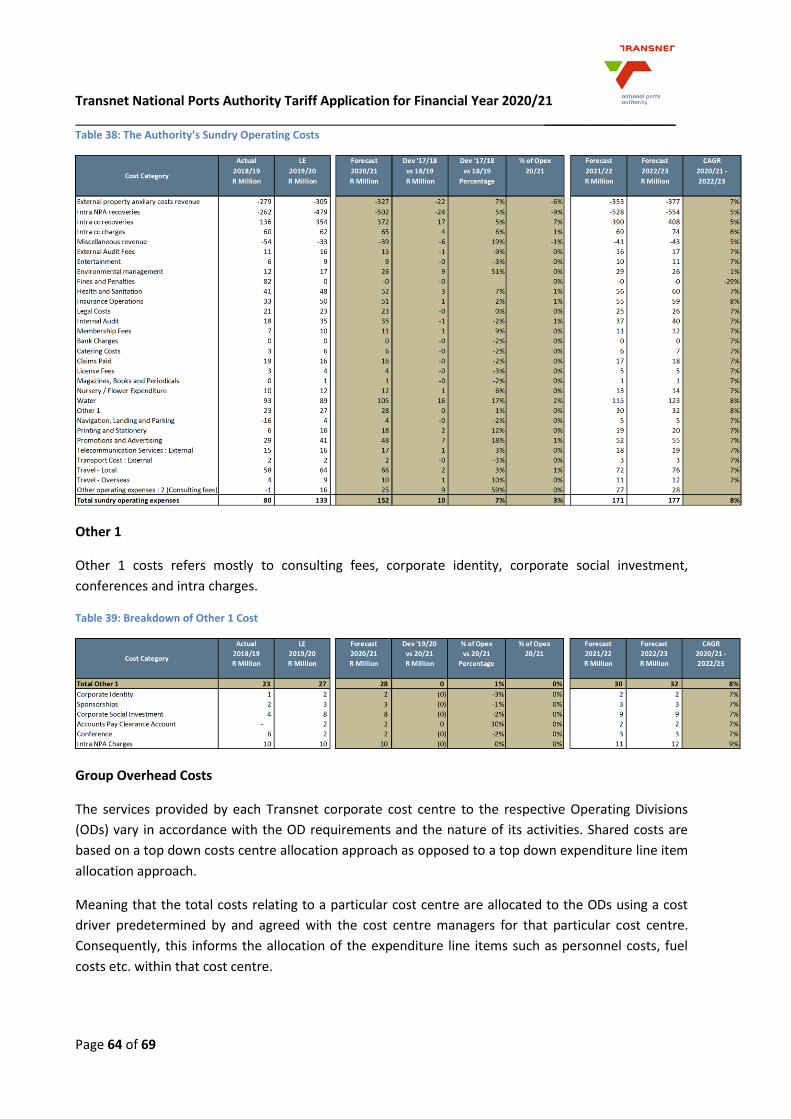
Transnet National Ports Authority Tariff Application for Financial Year 2020/21 __________________
Page 64 of 69
Table 38: The Authority’s Sundry Operating Costs
Other 1
Other 1 costs refers mostly to consulting fees, corporate identity, corporate social investment,
conferences and intra charges.
Table 39: Breakdown of Other 1 Cost
Group Overhead Costs
The services provided by each Transnet corporate cost centre to the respective Operating Divisions
(ODs) vary in accordance with the OD requirements and the nature of its activities. Shared costs are
based on a top down costs centre allocation approach as opposed to a top down expenditure line item
allocation approach.
Meaning that the total costs relating to a particular cost centre are allocated to the ODs using a cost
driver predetermined by and agreed with the cost centre managers for that particular cost centre.
Consequently, this informs the allocation of the expenditure line items such as personnel costs, fuel
costs etc. within that cost centre.
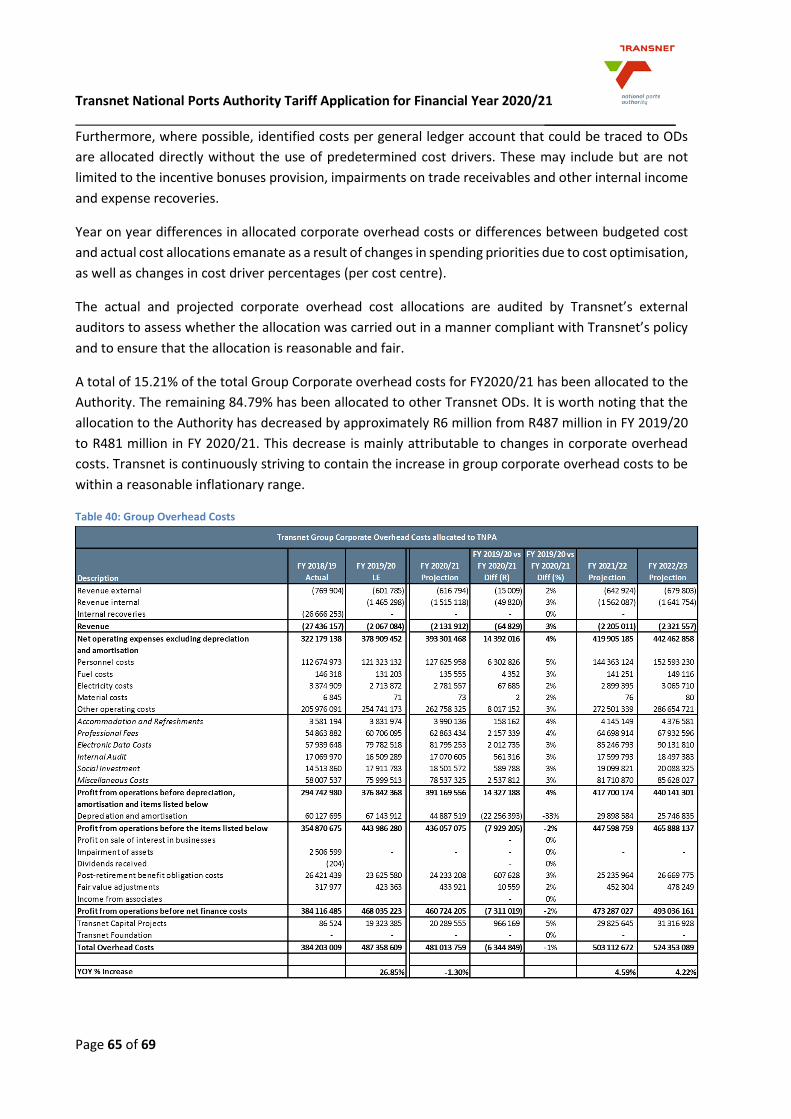
Transnet National Ports Authority Tariff Application for Financial Year 2020/21 __________________
Page 65 of 69
Furthermore, where possible, identified costs per general ledger account that could be traced to ODs
are allocated directly without the use of predetermined cost drivers. These may include but are not
limited to the incentive bonuses provision, impairments on trade receivables and other internal income
and expense recoveries.
Year on year differences in allocated corporate overhead costs or differences between budgeted cost
and actual cost allocations emanate as a result of changes in spending priorities due to cost optimisation,
as well as changes in cost driver percentages (per cost centre).
The actual and projected corporate overhead cost allocations are audited by Transnet’s external
auditors to assess whether the allocation was carried out in a manner compliant with Transnet’s policy
and to ensure that the allocation is reasonable and fair.
A total of 15.21% of the total Group Corporate overhead costs for FY2020/21 has been allocated to the
Authority. The remaining 84.79% has been allocated to other Transnet ODs. It is worth noting that the
allocation to the Authority has decreased by approximately R6 million from R487 million in FY 2019/20
to R481 million in FY 2020/21. This decrease is mainly attributable to changes in corporate overhead
costs. Transnet is continuously striving to contain the increase in group corporate overhead costs to be
within a reasonable inflationary range.
Table 40: Group Overhead Costs
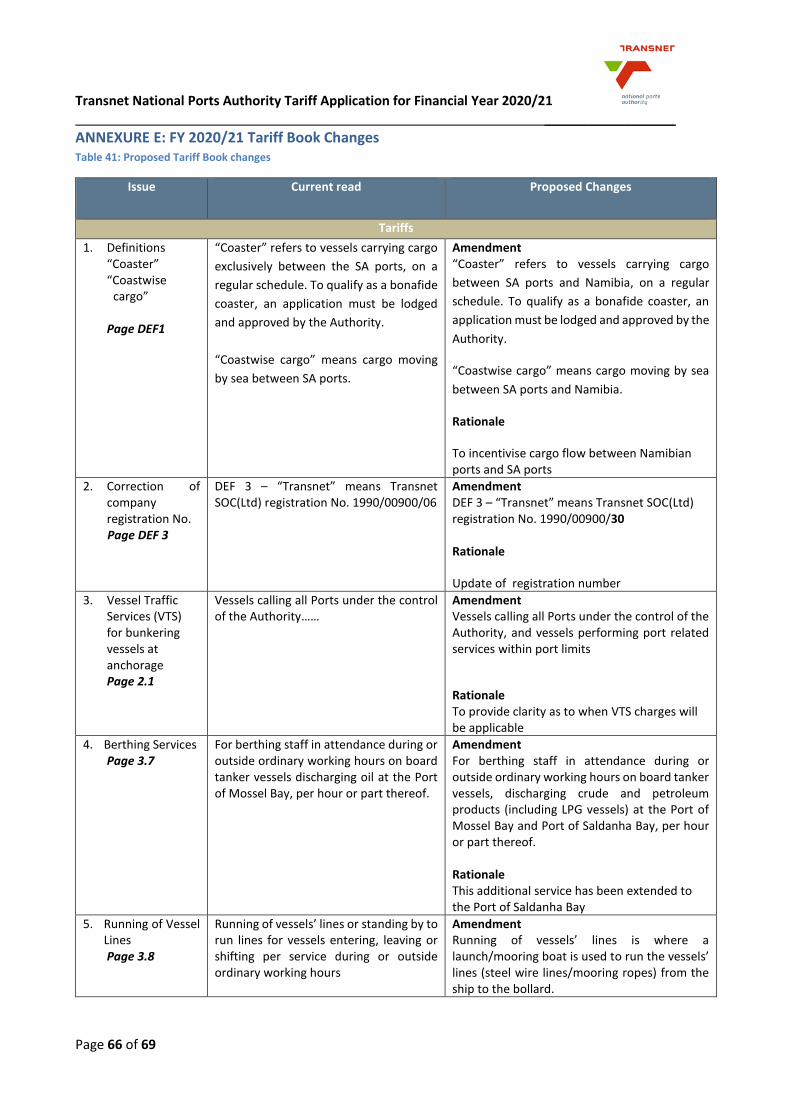
Transnet National Ports Authority Tariff Application for Financial Year 2020/21 __________________
Page 66 of 69
ANNEXURE E: FY 2020/21 Tariff Book Changes Table 41: Proposed Tariff Book changes
Issue Current read Proposed Changes
Tariffs
1. Definitions “Coaster” “Coastwise
cargo” Page DEF1
“Coaster” refers to vessels carrying cargo
exclusively between the SA ports, on a
regular schedule. To qualify as a bonafide
coaster, an application must be lodged
and approved by the Authority.
“Coastwise cargo” means cargo moving
by sea between SA ports.
Amendment “Coaster” refers to vessels carrying cargo
between SA ports and Namibia, on a regular
schedule. To qualify as a bonafide coaster, an
application must be lodged and approved by the
Authority.
“Coastwise cargo” means cargo moving by sea
between SA ports and Namibia.
Rationale
To incentivise cargo flow between Namibian ports and SA ports
2. Correction of company registration No.
Page DEF 3
DEF 3 – “Transnet” means Transnet SOC(Ltd) registration No. 1990/00900/06
Amendment DEF 3 – “Transnet” means Transnet SOC(Ltd) registration No. 1990/00900/30 Rationale
Update of registration number
3. Vessel Traffic Services (VTS) for bunkering vessels at anchorage Page 2.1
Vessels calling all Ports under the control of the Authority……
Amendment Vessels calling all Ports under the control of the Authority, and vessels performing port related services within port limits
Rationale To provide clarity as to when VTS charges will be applicable
4. Berthing Services Page 3.7
For berthing staff in attendance during or outside ordinary working hours on board tanker vessels discharging oil at the Port of Mossel Bay, per hour or part thereof.
Amendment For berthing staff in attendance during or outside ordinary working hours on board tanker vessels, discharging crude and petroleum products (including LPG vessels) at the Port of Mossel Bay and Port of Saldanha Bay, per hour or part thereof. Rationale This additional service has been extended to the Port of Saldanha Bay
5. Running of Vessel Lines Page 3.8
Running of vessels’ lines or standing by to run lines for vessels entering, leaving or shifting per service during or outside ordinary working hours
Amendment Running of vessels’ lines is where a launch/mooring boat is used to run the vessels’ lines (steel wire lines/mooring ropes) from the ship to the bollard.
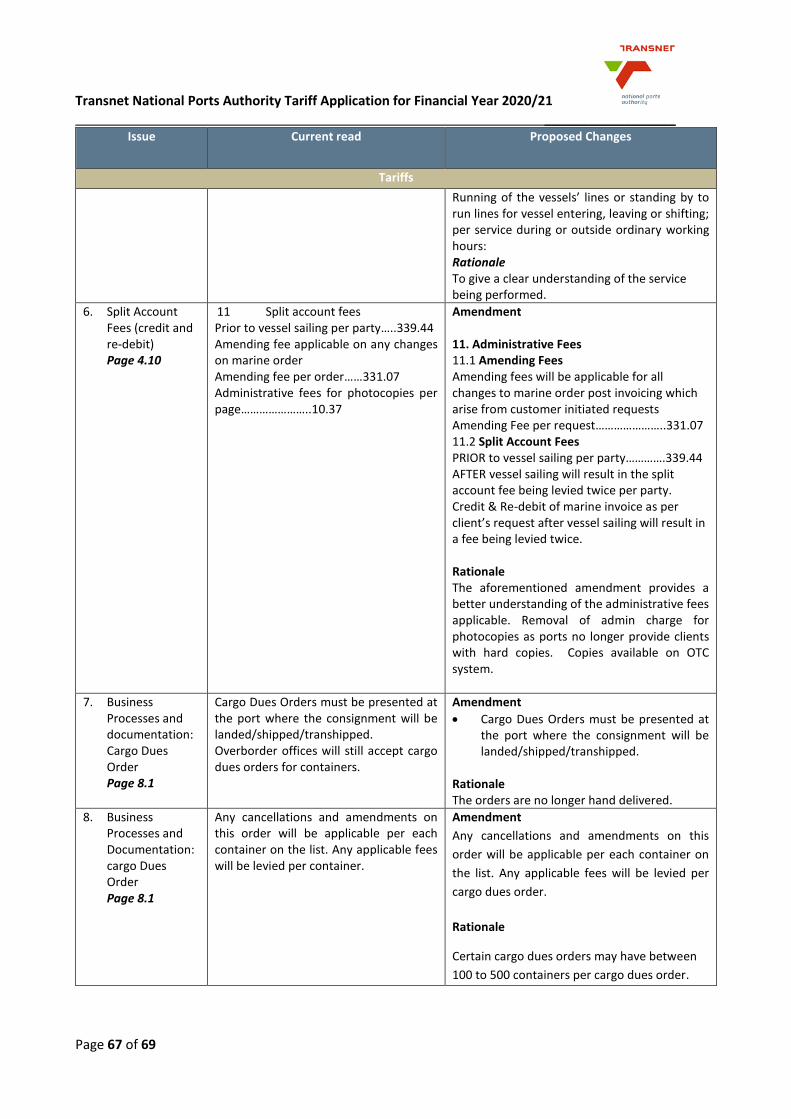
Transnet National Ports Authority Tariff Application for Financial Year 2020/21 __________________
Page 67 of 69
Issue Current read Proposed Changes
Tariffs
Running of the vessels’ lines or standing by to run lines for vessel entering, leaving or shifting; per service during or outside ordinary working hours: Rationale To give a clear understanding of the service being performed.
6. Split Account Fees (credit and re-debit) Page 4.10
11 Split account fees Prior to vessel sailing per party…..339.44 Amending fee applicable on any changes on marine order Amending fee per order……331.07 Administrative fees for photocopies per page…………………..10.37
Amendment 11. Administrative Fees 11.1 Amending Fees Amending fees will be applicable for all changes to marine order post invoicing which arise from customer initiated requests Amending Fee per request…………………..331.07 11.2 Split Account Fees PRIOR to vessel sailing per party………….339.44 AFTER vessel sailing will result in the split account fee being levied twice per party. Credit & Re-debit of marine invoice as per client’s request after vessel sailing will result in a fee being levied twice. Rationale The aforementioned amendment provides a better understanding of the administrative fees applicable. Removal of admin charge for photocopies as ports no longer provide clients with hard copies. Copies available on OTC system.
7. Business Processes and documentation: Cargo Dues Order Page 8.1
Cargo Dues Orders must be presented at the port where the consignment will be landed/shipped/transhipped. Overborder offices will still accept cargo dues orders for containers.
Amendment
Cargo Dues Orders must be presented at the port where the consignment will be landed/shipped/transhipped.
Rationale The orders are no longer hand delivered.
8. Business Processes and Documentation: cargo Dues Order Page 8.1
Any cancellations and amendments on this order will be applicable per each container on the list. Any applicable fees will be levied per container.
Amendment
Any cancellations and amendments on this
order will be applicable per each container on
the list. Any applicable fees will be levied per
cargo dues order.
Rationale
Certain cargo dues orders may have between
100 to 500 containers per cargo dues order.
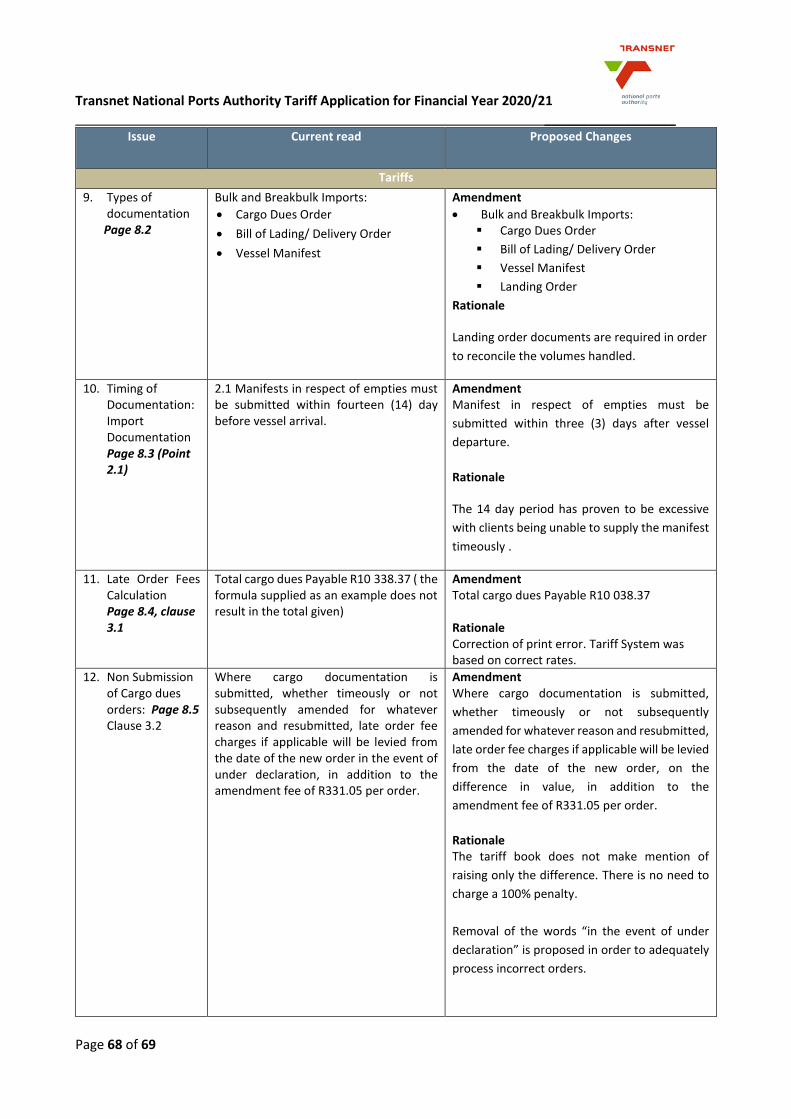
Transnet National Ports Authority Tariff Application for Financial Year 2020/21 __________________
Page 68 of 69
Issue Current read Proposed Changes
Tariffs
9. Types of documentation
Page 8.2
Bulk and Breakbulk Imports:
Cargo Dues Order
Bill of Lading/ Delivery Order
Vessel Manifest
Amendment
Bulk and Breakbulk Imports: Cargo Dues Order
Bill of Lading/ Delivery Order
Vessel Manifest
Landing Order
Rationale
Landing order documents are required in order
to reconcile the volumes handled.
10. Timing of Documentation: Import Documentation Page 8.3 (Point 2.1)
2.1 Manifests in respect of empties must be submitted within fourteen (14) day before vessel arrival.
Amendment Manifest in respect of empties must be
submitted within three (3) days after vessel
departure.
Rationale
The 14 day period has proven to be excessive
with clients being unable to supply the manifest
timeously .
11. Late Order Fees Calculation Page 8.4, clause 3.1
Total cargo dues Payable R10 338.37 ( the formula supplied as an example does not result in the total given)
Amendment Total cargo dues Payable R10 038.37 Rationale Correction of print error. Tariff System was based on correct rates.
12. Non Submission of Cargo dues orders: Page 8.5 Clause 3.2
Where cargo documentation is submitted, whether timeously or not subsequently amended for whatever reason and resubmitted, late order fee charges if applicable will be levied from the date of the new order in the event of under declaration, in addition to the amendment fee of R331.05 per order.
Amendment Where cargo documentation is submitted,
whether timeously or not subsequently
amended for whatever reason and resubmitted,
late order fee charges if applicable will be levied
from the date of the new order, on the
difference in value, in addition to the
amendment fee of R331.05 per order.
Rationale The tariff book does not make mention of
raising only the difference. There is no need to
charge a 100% penalty.
Removal of the words “in the event of under
declaration” is proposed in order to adequately
process incorrect orders.
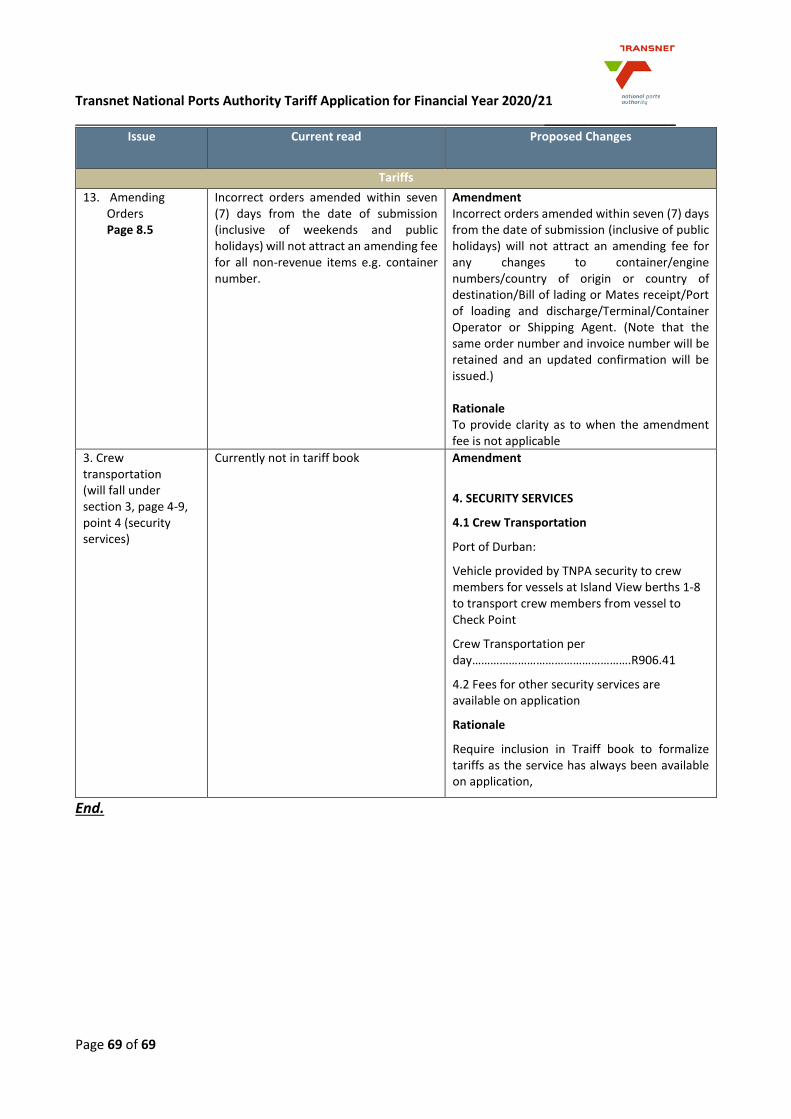
Transnet National Ports Authority Tariff Application for Financial Year 2020/21 __________________
Page 69 of 69
Issue Current read Proposed Changes
Tariffs
13. Amending Orders Page 8.5
Incorrect orders amended within seven (7) days from the date of submission (inclusive of weekends and public holidays) will not attract an amending fee for all non-revenue items e.g. container number.
Amendment Incorrect orders amended within seven (7) days from the date of submission (inclusive of public holidays) will not attract an amending fee for any changes to container/engine numbers/country of origin or country of destination/Bill of lading or Mates receipt/Port of loading and discharge/Terminal/Container Operator or Shipping Agent. (Note that the same order number and invoice number will be retained and an updated confirmation will be issued.) Rationale To provide clarity as to when the amendment fee is not applicable
3. Crew transportation (will fall under section 3, page 4-9, point 4 (security services)
Currently not in tariff book
Amendment
4. SECURITY SERVICES
4.1 Crew Transportation
Port of Durban:
Vehicle provided by TNPA security to crew members for vessels at Island View berths 1-8 to transport crew members from vessel to Check Point
Crew Transportation per day…………………………………………….R906.41
4.2 Fees for other security services are available on application
Rationale
Require inclusion in Traiff book to formalize tariffs as the service has always been available on application,
End.