Embed Size (px)
Citation preview
Confidential
Transportation Consulting
April 8 2013
© 2010- 2013 Chainalytics
Confidential 2
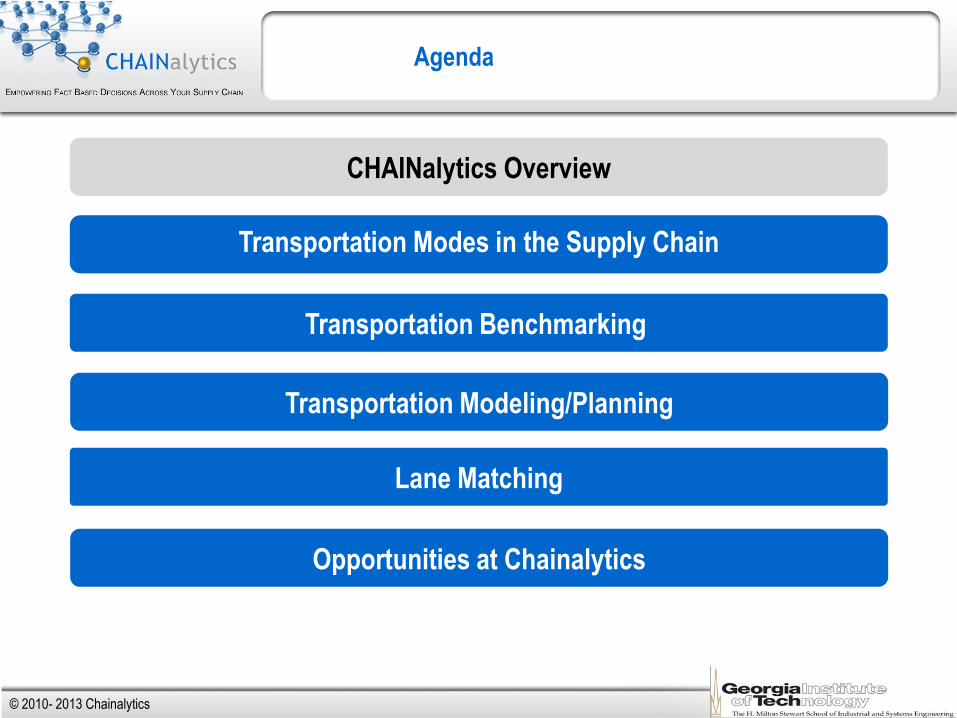
Agenda
CHAINalytics Overview
Transportation Benchmarking
Transportation Modes in the Supply Chain
Lane Matching
Transportation Modeling/Planning
Opportunities at Chainalytics
© 2010- 2013 Chainalytics
Confidential 3
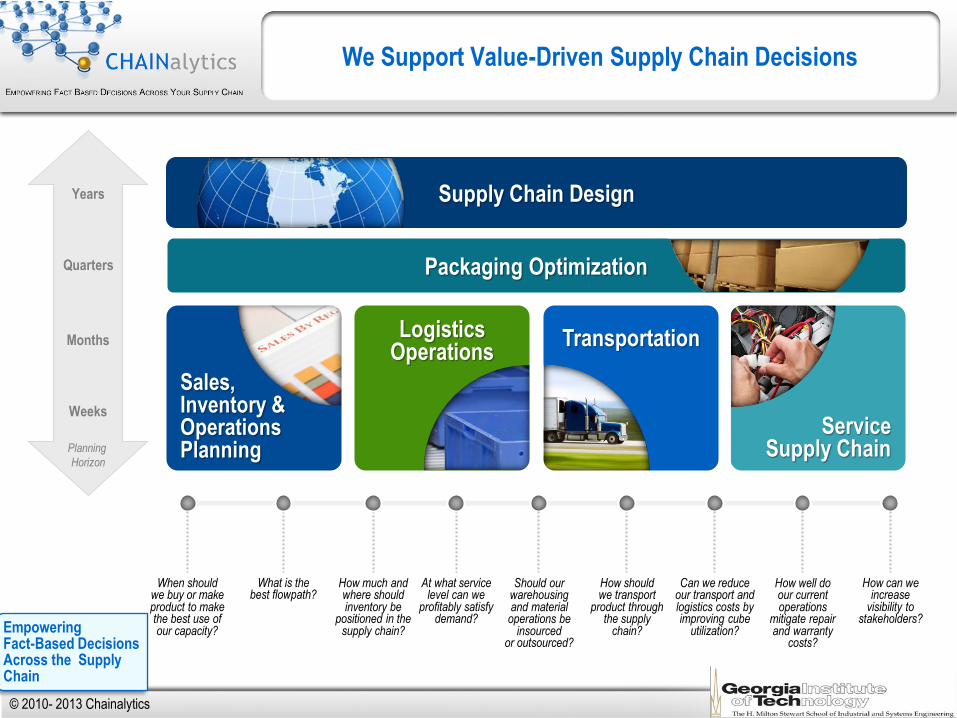
Years
Quarters
Months
Weeks
Planning
Horizon
We Support Value-Driven Supply Chain Decisions
Supply Chain Design
Packaging Optimization
Sales, Inventory & Operations Planning
Transportation Logistics Operations
Service Supply Chain
At what service level can we
profitably satisfy demand?
How should we transport
product through the supply
chain?
How much and where should inventory be
positioned in the supply chain?
Can we reduce our transport and logistics costs by improving cube
utilization?
Should our warehousing and material operations be
insourced or outsourced?
When should we buy or make product to make the best use of our capacity?
What is the best flowpath?
How well do our current operations
mitigate repair and warranty
costs?
How can we increase
visibility to stakeholders?
Empowering Fact-Based Decisions Across the Supply Chain
© 2010- 2013 Chainalytics
Confidential 4
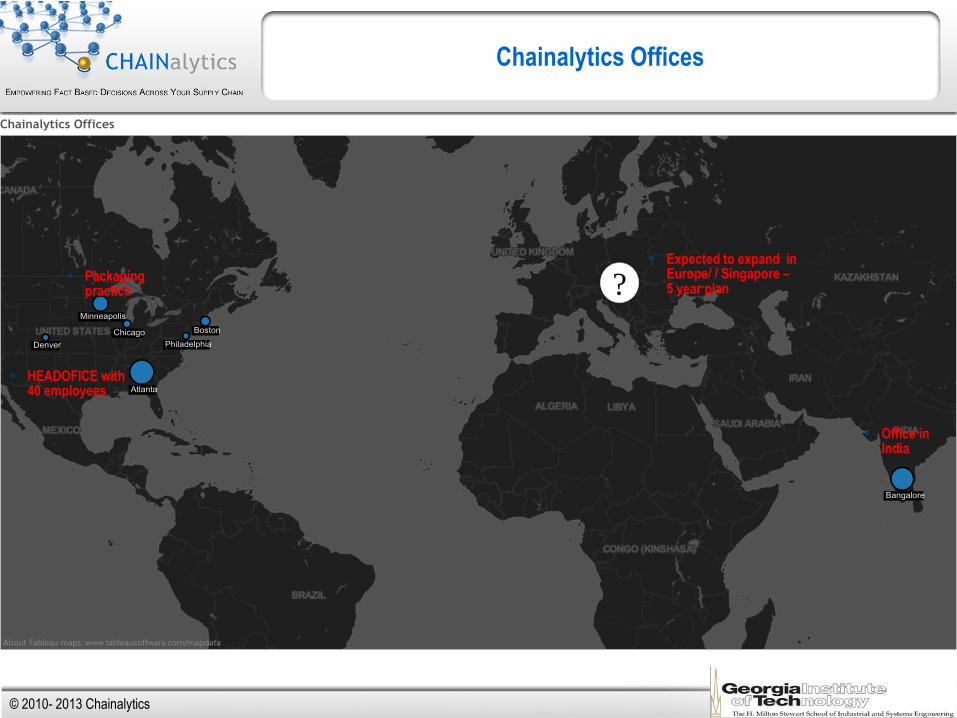
Chainalytics Offices
?
HEADOFICE with 40 employees
Packaging practice
Expected to expand in Europe/ / Singapore – 5 year plan
Office in India
© 2010- 2013 Chainalytics
Confidential 5
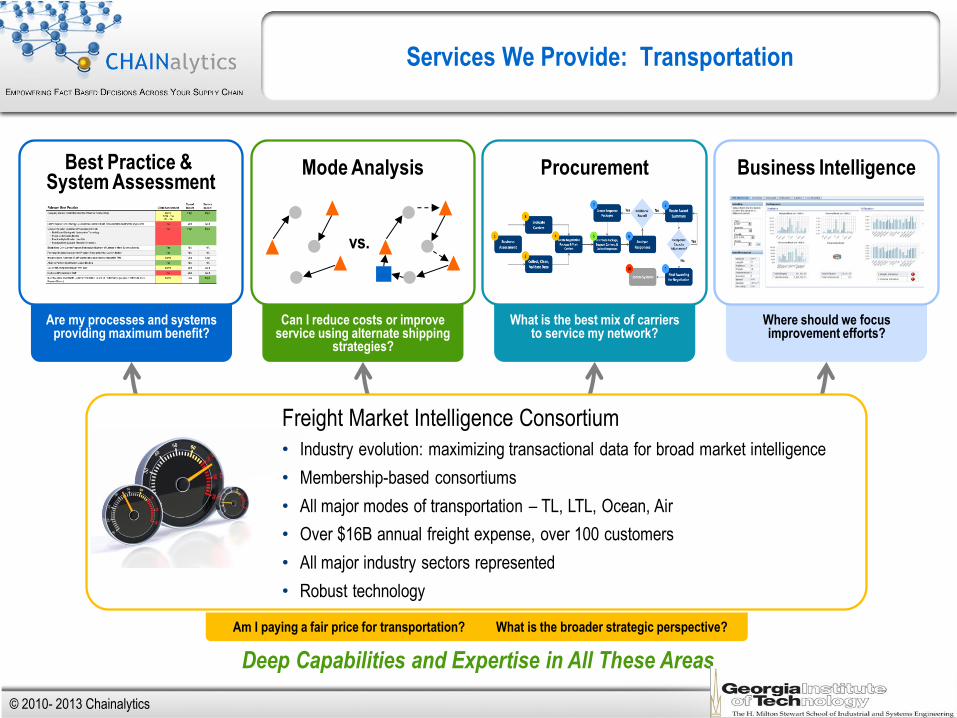
Where should we focus improvement efforts?
What is the best mix of carriers to service my network?
Can I reduce costs or improve service using alternate shipping
strategies?
Are my processes and systems providing maximum benefit?
Services We Provide: Transportation
Procurement Mode Analysis
vs.
Best Practice & System Assessment
Business Intelligence
Deep Capabilities and Expertise in All These Areas
Am I paying a fair price for transportation? What is the broader strategic perspective?
Freight Market Intelligence Consortium
• Industry evolution: maximizing transactional data for broad market intelligence
• Membership-based consortiums
• All major modes of transportation – TL, LTL, Ocean, Air
• Over $16B annual freight expense, over 100 customers
• All major industry sectors represented
• Robust technology
© 2010- 2013 Chainalytics
Confidential 6
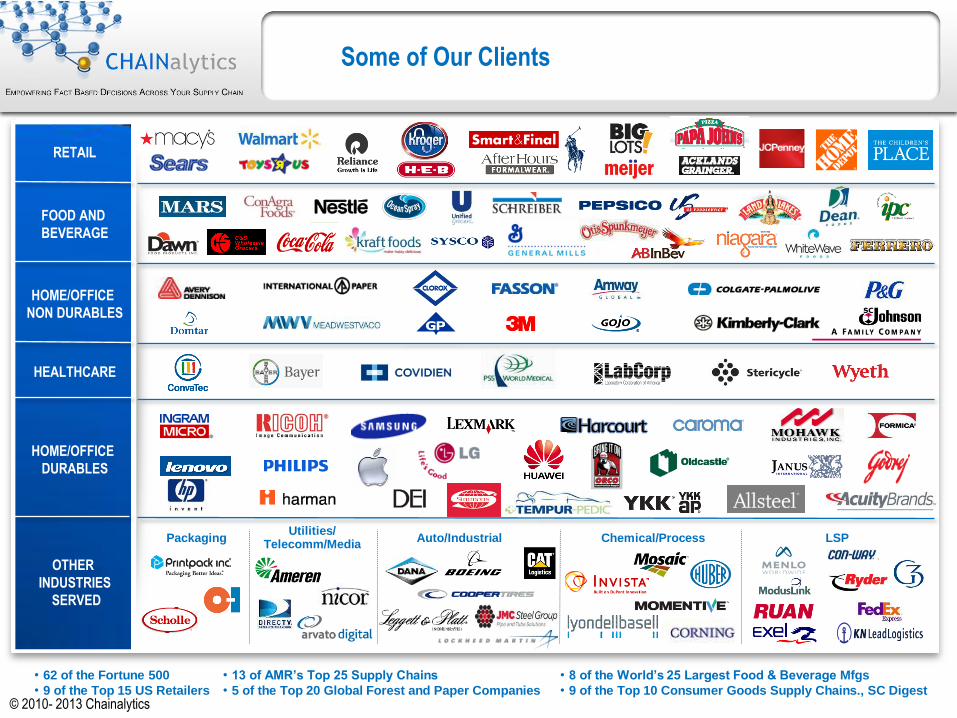
Some of Our Clients
FOOD AND
BEVERAGE
RETAIL
HOME/OFFICE
DURABLES
HEALTHCARE
HOME/OFFICE
NON DURABLES
LSP Chemical/Process Auto/Industrial Packaging Utilities/
Telecomm/Media
OTHER
INDUSTRIES
SERVED
• 62 of the Fortune 500
• 9 of the Top 15 US Retailers
• 13 of AMR’s Top 25 Supply Chains
• 5 of the Top 20 Global Forest and Paper Companies
• 8 of the World’s 25 Largest Food & Beverage Mfgs
• 9 of the Top 10 Consumer Goods Supply Chains., SC Digest
© 2010- 2013 Chainalytics
Confidential 7
Agenda
CHAINalytics Overview
Transportation Benchmarking
Transportation Modes in the Supply Chain
Lane Matching
Transportation Modeling/Planning
Opportunities at Chainalytics
© 2010- 2013 Chainalytics
Confidential 8
What is Transportation all about ?
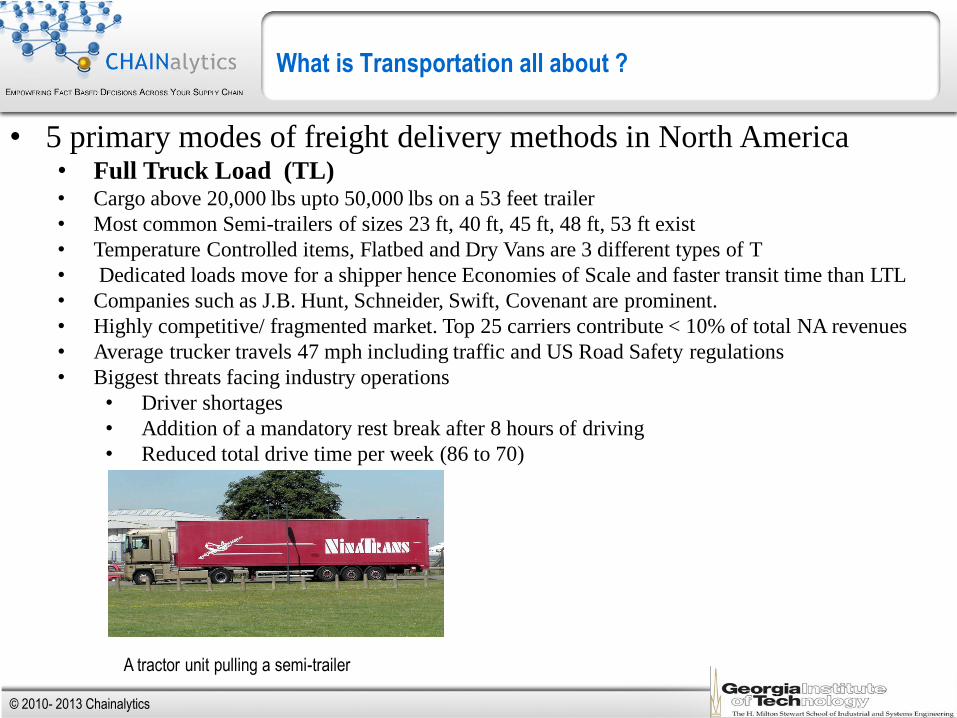
A tractor unit pulling a semi-trailer
• 5 primary modes of freight delivery methods in North America • Full Truck Load (TL) • Cargo above 20,000 lbs upto 50,000 lbs on a 53 feet trailer
• Most common Semi-trailers of sizes 23 ft, 40 ft, 45 ft, 48 ft, 53 ft exist
• Temperature Controlled items, Flatbed and Dry Vans are 3 different types of T
• Dedicated loads move for a shipper hence Economies of Scale and faster transit time than LTL
• Companies such as J.B. Hunt, Schneider, Swift, Covenant are prominent.
• Highly competitive/ fragmented market. Top 25 carriers contribute < 10% of total NA revenues
• Average trucker travels 47 mph including traffic and US Road Safety regulations
• Biggest threats facing industry operations
• Driver shortages
• Addition of a mandatory rest break after 8 hours of driving
• Reduced total drive time per week (86 to 70)
© 2010- 2013 Chainalytics
Confidential 9
Less- Than-Truckload
Less- Than-Truckload (LTL) -
Generally moves freight >150 Lbs & < 20,000 lbs
The LTL market is much smaller than TL ($27B vs. ~$320B)
LTL is a much more concentrated market than TL
Top 25 LTL carriers = 88% of total LTL Revenues (top 6 = 50%)
Top 25 TL carriers ≤ 10% of total TL Revenues
While TL is mainly driven by distance, LTL is influenced by many factors that interact with each other, such as:
Freight Class
Weight
Distance
Pricing is based off of different tariffs with a negotiated discount that can apply to all, or portions, of a network
Freight All Kinds (FAK) classification(Class 50 – 500) dominates and can obscure cost drivers
For the most part, lower the freight class (aka NMFC class) lower the freight charge.
Low density and High value shipments have highest freight class.
2000 lbs of ping pong balls vs. 2000 lbs of plasma TV vs. 2000 lbs of standard shrink wrapped 4 x 4 pallet
GUESS ????
© 2010- 2013 Chainalytics
Confidential 10
Other Modes
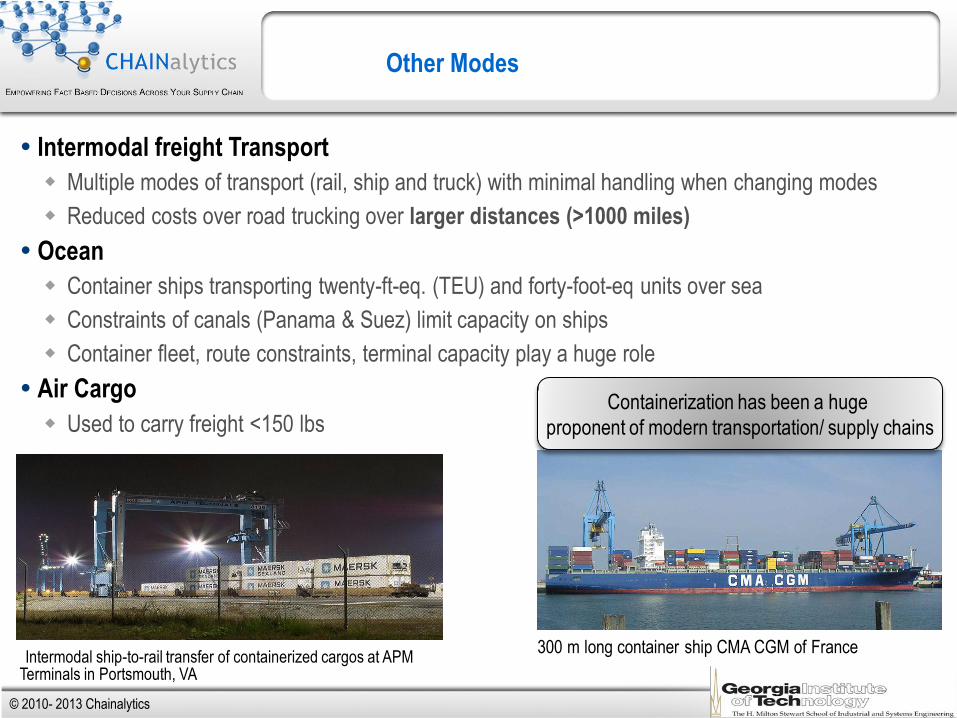
Intermodal freight Transport
Multiple modes of transport (rail, ship and truck) with minimal handling when changing modes
Reduced costs over road trucking over larger distances (>1000 miles)
Ocean
Container ships transporting twenty-ft-eq. (TEU) and forty-foot-eq units over sea
Constraints of canals (Panama & Suez) limit capacity on ships
Container fleet, route constraints, terminal capacity play a huge role
Air Cargo
Used to carry freight <150 lbs
Intermodal ship-to-rail transfer of containerized cargos at APM Terminals in Portsmouth, VA
300 m long container ship CMA CGM of France
Containerization has been a huge
proponent of modern transportation/ supply chains
© 2010- 2013 Chainalytics
Confidential 11
Dedicate/ Private Fleet
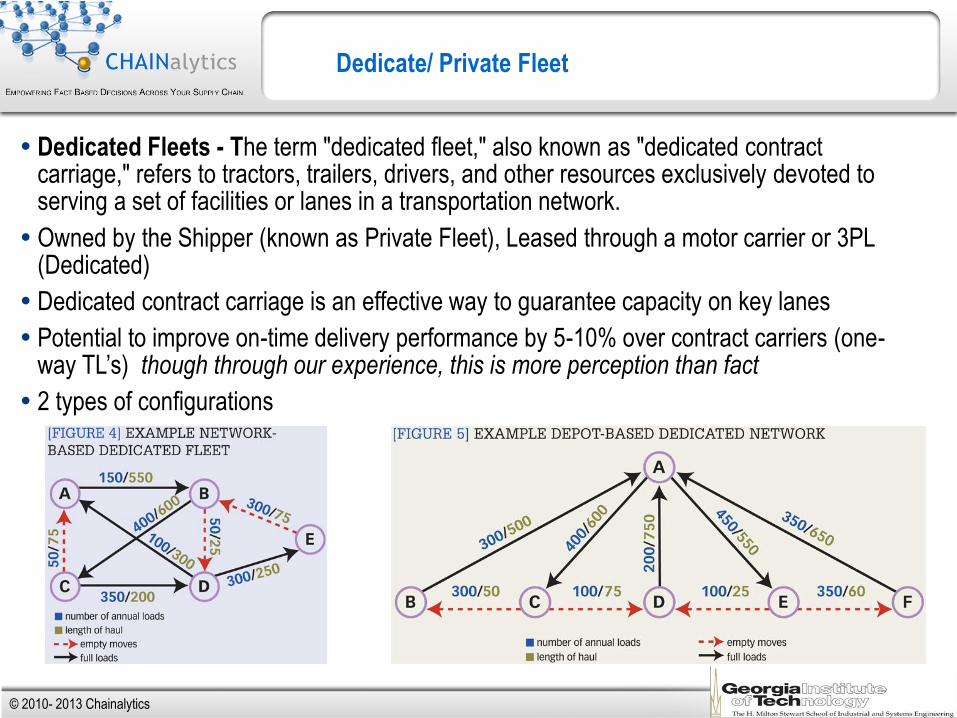
Dedicated Fleets - The term "dedicated fleet," also known as "dedicated contract carriage," refers to tractors, trailers, drivers, and other resources exclusively devoted to serving a set of facilities or lanes in a transportation network.
Owned by the Shipper (known as Private Fleet), Leased through a motor carrier or 3PL (Dedicated)
Dedicated contract carriage is an effective way to guarantee capacity on key lanes
Potential to improve on-time delivery performance by 5-10% over contract carriers (one-way TL’s) though through our experience, this is more perception than fact
2 types of configurations
© 2010- 2013 Chainalytics
Confidential 12
Agenda
CHAINalytics Overview
Transportation Benchmarking
Transportation Modes in the Supply Chain
Lane Matching
Transportation Modeling/Planning
Opportunities at Chainalytics
© 2010- 2013 Chainalytics
Confidential 13
Truckload Benchmarking
Chainalytics Created the Freight Market Intelligence Consortium
A collaborative membership based group for confidentially sharing transportation rate information for the
purpose of benchmarking against the market (each other)
FMIC Goals
Build a representative model of the market – 10 % of actual freight spend by over 100 member companies
Isolate and Quantify impact of individual freight characteristics - Origin, destination, distance, loading
conditions, service requirements, regional imbalances…
Use of econometric modeling to predict the cost per load for TL freight, given characteristics of the freight
Data driven validation of FACT vs. Myth. Provide a valuable score-card for review within an organization
Identify need and plan procurement – Change the carriers and choose the best bid on lanes
High accuracy of rates provides input to Supply Chain Network design exercises
© 2010- 2013 Chainalytics
Confidential 14
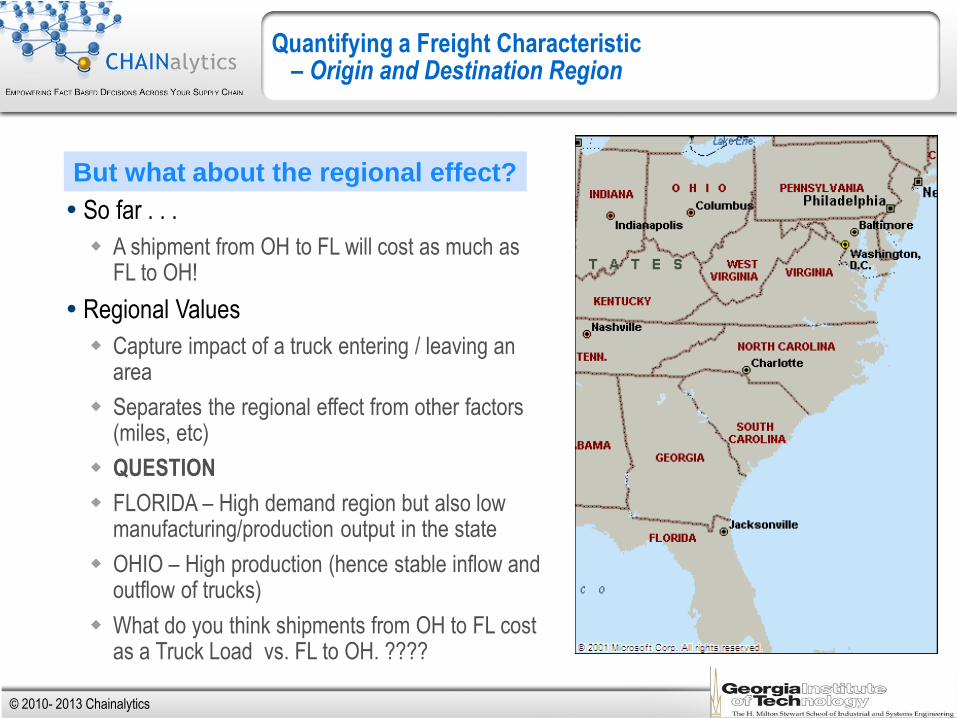
Quantifying a Freight Characteristic – Origin and Destination Region
So far . . .
A shipment from OH to FL will cost as much as FL to OH!
Regional Values
Capture impact of a truck entering / leaving an area
Separates the regional effect from other factors (miles, etc)
QUESTION
FLORIDA – High demand region but also low manufacturing/production output in the state
OHIO – High production (hence stable inflow and outflow of trucks)
What do you think shipments from OH to FL cost as a Truck Load vs. FL to OH. ????
But what about the regional effect?
© 2010- 2013 Chainalytics
Confidential 15
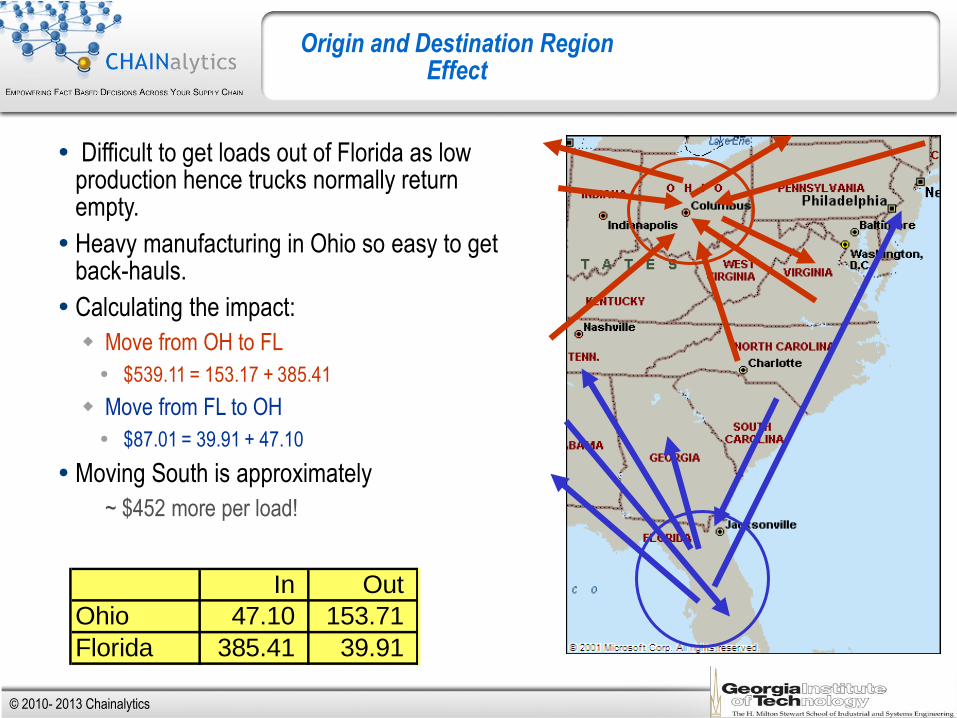
Origin and Destination Region Effect
Difficult to get loads out of Florida as low production hence trucks normally return empty.
Heavy manufacturing in Ohio so easy to get back-hauls.
Calculating the impact:
Move from OH to FL
$539.11 = 153.17 + 385.41
Move from FL to OH
$87.01 = 39.91 + 47.10
Moving South is approximately
~ $452 more per load!
In Out
Ohio 47.10 153.71
Florida 385.41 39.91
© 2010- 2013 Chainalytics
Confidential 16
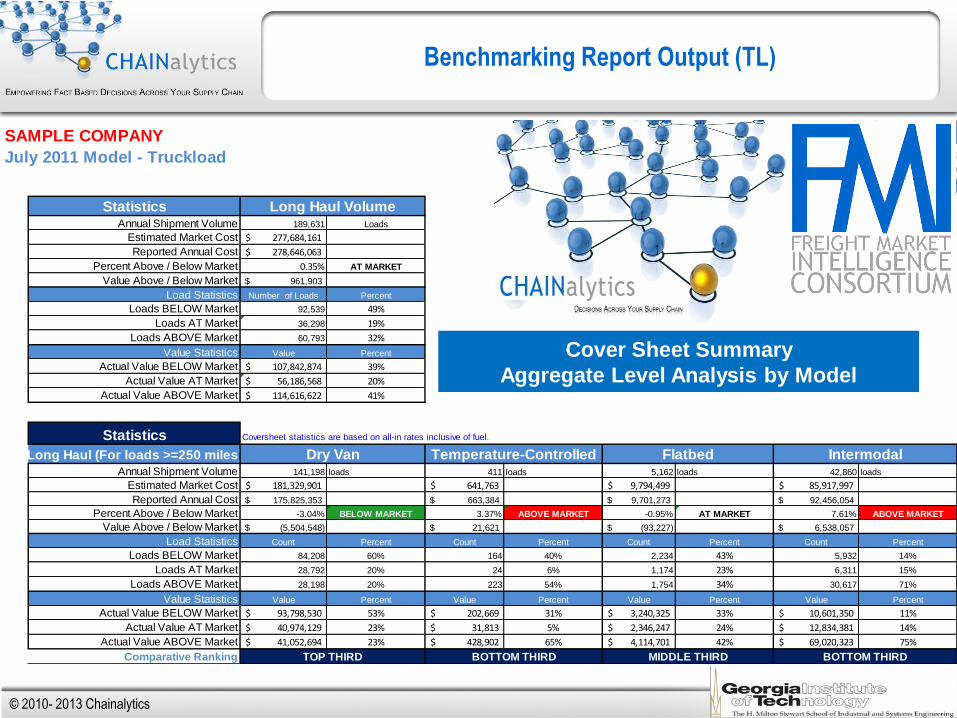
SAMPLE COMPANY
July 2011 Model - Truckload
Model-Based Benchmarking Consortium
StatisticsAnnual Shipment Volume 189,631 Loads
Estimated Market Cost 277,684,161$
Reported Annual Cost 278,646,063$
Percent Above / Below Market 0.35% AT MARKET
Value Above / Below Market 961,903$
Load Statistics Number of Loads Percent
Loads BELOW Market 92,539 49%
Loads AT Market 36,298 19%
Loads ABOVE Market 60,793 32%
Value Statistics Value Percent
Actual Value BELOW Market 107,842,874$ 39%
Actual Value AT Market 56,186,568$ 20%
Actual Value ABOVE Market 114,616,622$ 41%
Statistics Coversheet statistics are based on all-in rates inclusive of fuel.
Long Haul (For loads >=250 miles)
Annual Shipment Volume 141,198 loads 411 loads 5,162 loads 42,860 loads
Estimated Market Cost 181,329,901$ 641,763$ 9,794,499$ 85,917,997$
Reported Annual Cost 175,825,353$ 663,384$ 9,701,273$ 92,456,054$
Percent Above / Below Market -3.04% BELOW MARKET 3.37% ABOVE MARKET -0.95% AT MARKET 7.61% ABOVE MARKET
Value Above / Below Market (5,504,548)$ 21,621$ (93,227)$ 6,538,057$
Load Statistics Count Percent Count Percent Count Percent Count Percent
Loads BELOW Market 84,208 60% 164 40% 2,234 43% 5,932 14%
Loads AT Market 28,792 20% 24 6% 1,174 23% 6,311 15%
Loads ABOVE Market 28,198 20% 223 54% 1,754 34% 30,617 71%
Value Statistics Value Percent Value Percent Value Percent Value Percent
Actual Value BELOW Market 93,798,530$ 53% 202,669$ 31% 3,240,325$ 33% 10,601,350$ 11%
Actual Value AT Market 40,974,129$ 23% 31,813$ 5% 2,346,247$ 24% 12,834,381$ 14%
Actual Value ABOVE Market 41,052,694$ 23% 428,902$ 65% 4,114,701$ 42% 69,020,323$ 75%
Comparative Ranking
Long Haul Volume
Dry Van Temperature-Controlled Flatbed Intermodal
TOP THIRD BOTTOM THIRD MIDDLE THIRD BOTTOM THIRD
Benchmarking Report Output (TL)
Cover Sheet Summary
Aggregate Level Analysis by Model
© 2010- 2013 Chainalytics
Confidential 17
BUOrigin
City
Origin
State
Origin
ZIP
Origin
Country
Destination
City
Dest
State
Dest
ZIP
Dest
Country
Distance
(miles)
Annual
Volume
Annual
Corridor
Volume
Avg.
Stopoffs
Route
TypeMode
Temp.
Control
Type
Equipment
Size
Service
Level
Movement
Type
Contract
Type
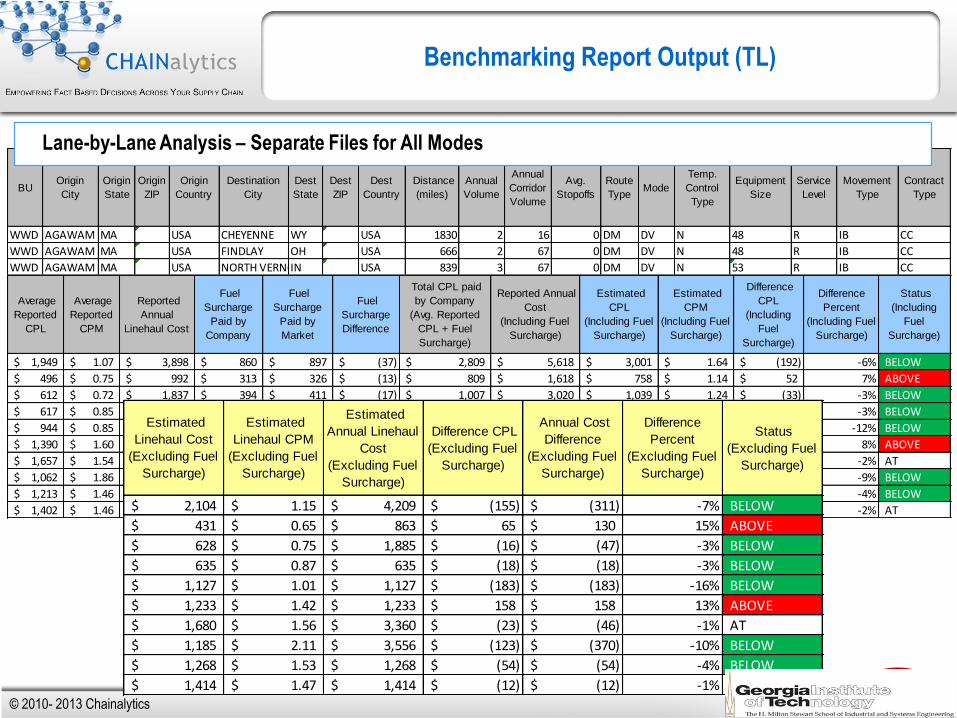
WWD AGAWAM MA 01001 USA CHEYENNE WY 82007 USA 1830 2 16 0 DM DV N 48 R IB CC
WWD AGAWAM MA 01001 USA FINDLAY OH 45840 USA 666 2 67 0 DM DV N 48 R IB CC
WWD AGAWAM MA 01001 USA NORTH VERNONIN 47265 USA 839 3 67 0 DM DV N 53 R IB CC
WWD AGAWAM MA 01001 USA STATESVILLE NC 28625 USA 726 1 29 0 DM DV N 53 R IB CC
WWD AGAWAM MA 01001 USA VALDOSTA GA 31601 USA 1111 1 14 0 DM DV N 53 R IB CC
WWD AIRPORT TX 75261 USA CHEYENNE WY 82007 USA 869 1 1729 0 DM DV N 53 R IB CC
WWD ALEXANDRIAIN 46001 USA CHEYENNE WY 82007 USA 1076 2 149 0 DM DV N 53 R IB CC
WWD ALEXANDRIAIN 46001 USA MINERSVILLE PA 17954 USA 563 3 1059 0 DM DV N 53 R IB CC
WWD ALEXANDRIAIN 46001 USA MOUNT VERNONTX 75457 USA 831 1 470 1 MS DV N 53 R IB CC
WWD ALEXANDRIAIN 46001 USA MOUNT VERNONTX 75457 USA 960 1 470 1 MS DV N 53 R IB CC
Lane-by-Lane Analysis – Separate Files for All Modes
Benchmarking Report Output (TL)
Average
Reported
CPL
Average
Reported
CPM
Reported
Annual
Linehaul Cost
Fuel
Surcharge
Paid by
Company
Fuel
Surcharge
Paid by
Market
Fuel
Surcharge
Difference
Total CPL paid
by Company
(Avg. Reported
CPL + Fuel
Surcharge)
Reported Annual
Cost
(Including Fuel
Surcharge)
Estimated
CPL
(Including Fuel
Surcharge)
Estimated
CPM
(Including Fuel
Surcharge)
Difference
CPL
(Including
Fuel
Surcharge)
Difference
Percent
(Including Fuel
Surcharge)
Status
(Including
Fuel
Surcharge)
1,949$ 1.07$ 3,898$ 860$ 897$ (37)$ 2,809$ 5,618$ 3,001$ 1.64$ (192)$ -6% BELOW
496$ 0.75$ 992$ 313$ 326$ (13)$ 809$ 1,618$ 758$ 1.14$ 52$ 7% ABOVE
612$ 0.72$ 1,837$ 394$ 411$ (17)$ 1,007$ 3,020$ 1,039$ 1.24$ (33)$ -3% BELOW
617$ 0.85$ 617$ 341$ 356$ (15)$ 958$ 958$ 991$ 1.36$ (32)$ -3% BELOW
944$ 0.85$ 944$ 522$ 544$ (22)$ 1,467$ 1,467$ 1,672$ 1.50$ (205)$ -12% BELOW
1,390$ 1.60$ 1,390$ 408$ 426$ (17)$ 1,799$ 1,799$ 1,658$ 1.91$ 140$ 8% ABOVE
1,657$ 1.54$ 3,314$ 506$ 527$ (22)$ 2,163$ 4,326$ 2,207$ 2.05$ (44)$ -2% AT
1,062$ 1.86$ 3,187$ 265$ 276$ (11)$ 1,327$ 3,980$ 1,461$ 2.60$ (135)$ -9% BELOW
1,213$ 1.46$ 1,213$ 391$ 407$ (17)$ 1,604$ 1,604$ 1,675$ 2.02$ (71)$ -4% BELOW
1,402$ 1.46$ 1,402$ 451$ 470$ (19)$ 1,853$ 1,853$ 1,884$ 1.96$ (31)$ -2% AT
Estimated
Linehaul Cost
(Excluding Fuel
Surcharge)
Estimated
Linehaul CPM
(Excluding Fuel
Surcharge)
Estimated
Annual Linehaul
Cost
(Excluding Fuel
Surcharge)
Difference CPL
(Excluding Fuel
Surcharge)
Annual Cost
Difference
(Excluding Fuel
Surcharge)
Difference
Percent
(Excluding Fuel
Surcharge)
Status
(Excluding Fuel
Surcharge)
2,104$ 1.15$ 4,209$ (155)$ (311)$ -7% BELOW
431$ 0.65$ 863$ 65$ 130$ 15% ABOVE
628$ 0.75$ 1,885$ (16)$ (47)$ -3% BELOW
635$ 0.87$ 635$ (18)$ (18)$ -3% BELOW
1,127$ 1.01$ 1,127$ (183)$ (183)$ -16% BELOW
1,233$ 1.42$ 1,233$ 158$ 158$ 13% ABOVE
1,680$ 1.56$ 3,360$ (23)$ (46)$ -1% AT
1,185$ 2.11$ 3,556$ (123)$ (370)$ -10% BELOW
1,268$ 1.53$ 1,268$ (54)$ (54)$ -4% BELOW
1,414$ 1.47$ 1,414$ (12)$ (12)$ -1% AT
© 2010- 2013 Chainalytics
Confidential 18
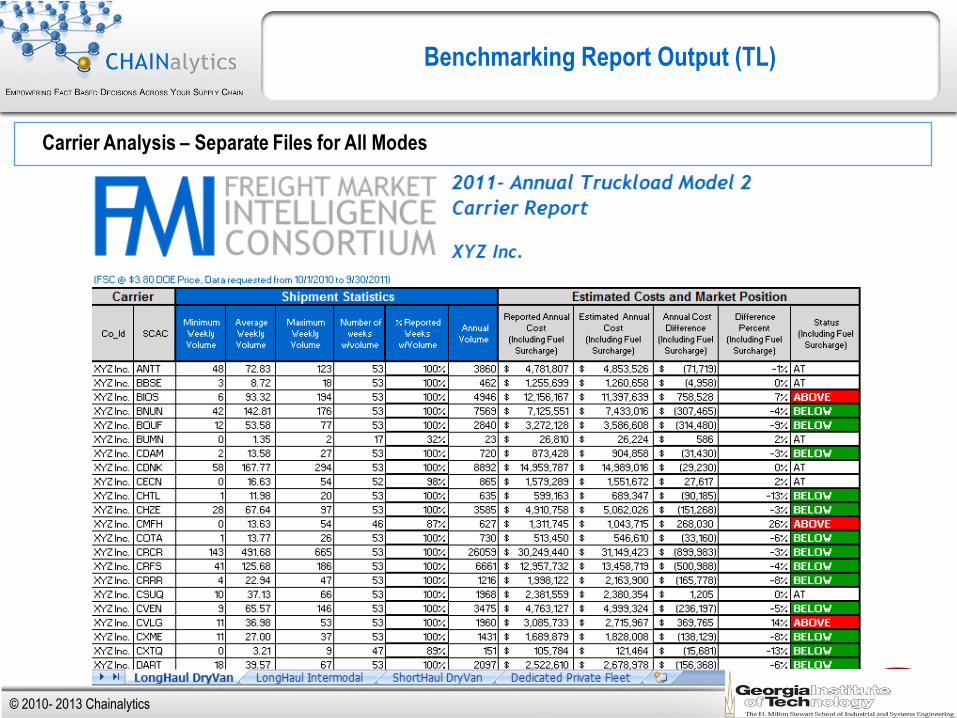
Benchmarking Report Output (TL)
Carrier Analysis – Separate Files for All Modes
© 2010- 2013 Chainalytics
Confidential 19
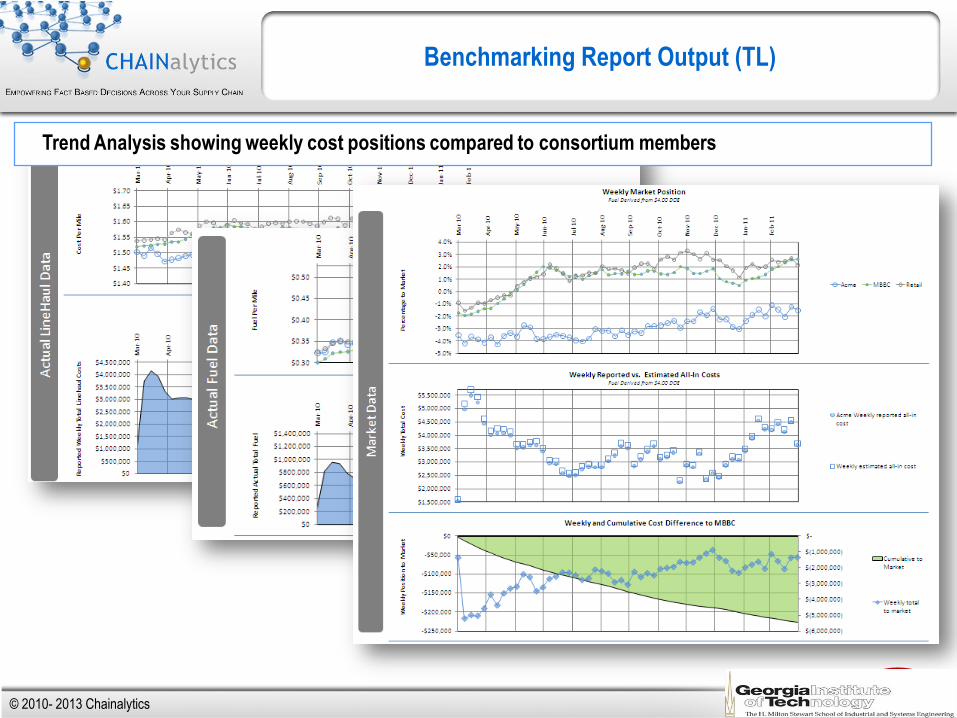
Benchmarking Report Output (TL)
Trend Analysis showing weekly cost positions compared to consortium members
© 2010- 2013 Chainalytics
Confidential 20
Agenda
CHAINalytics Overview
Transportation Benchmarking
Transportation Modes in the Supply Chain
Transportation Modeling/Planning
Lane Matching
Opportunities at Chainalytics
© 2010- 2013 Chainalytics
Confidential 21
Transportation Mode Analysis
Private/Dedicated
costs
Domicile
vs.
Point to point rates
vs.
Consol/Deconsol
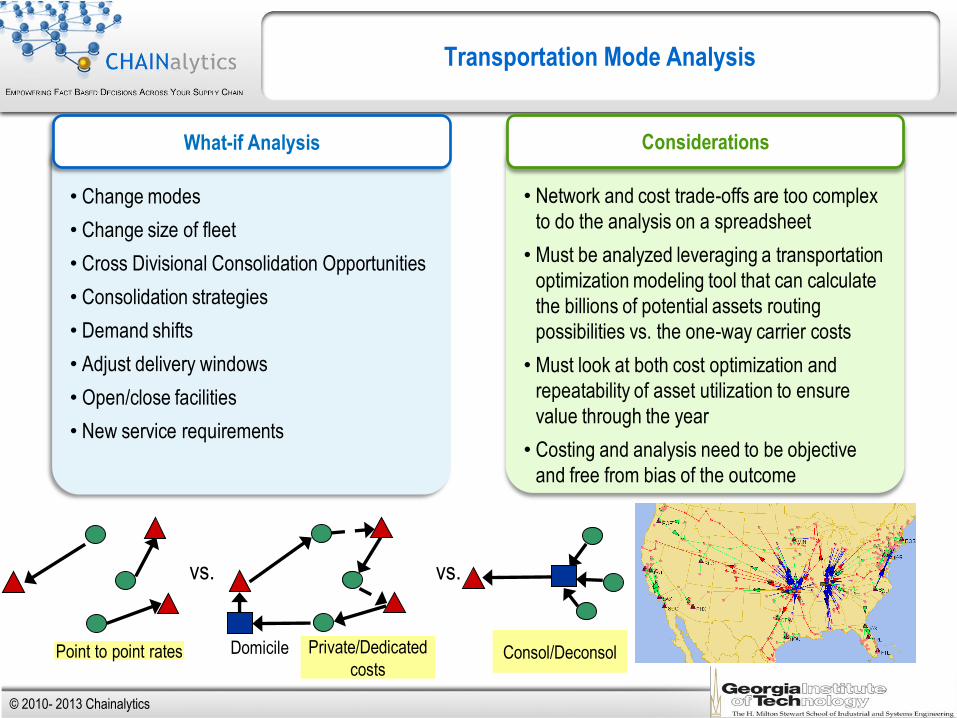
• Change modes
• Change size of fleet
• Cross Divisional Consolidation Opportunities
• Consolidation strategies
• Demand shifts
• Adjust delivery windows
• Open/close facilities
• New service requirements
What-if Analysis
• Network and cost trade-offs are too complex
to do the analysis on a spreadsheet
• Must be analyzed leveraging a transportation
optimization modeling tool that can calculate
the billions of potential assets routing
possibilities vs. the one-way carrier costs
• Must look at both cost optimization and
repeatability of asset utilization to ensure
value through the year
• Costing and analysis need to be objective
and free from bias of the outcome
Considerations
© 2010- 2013 Chainalytics
Confidential
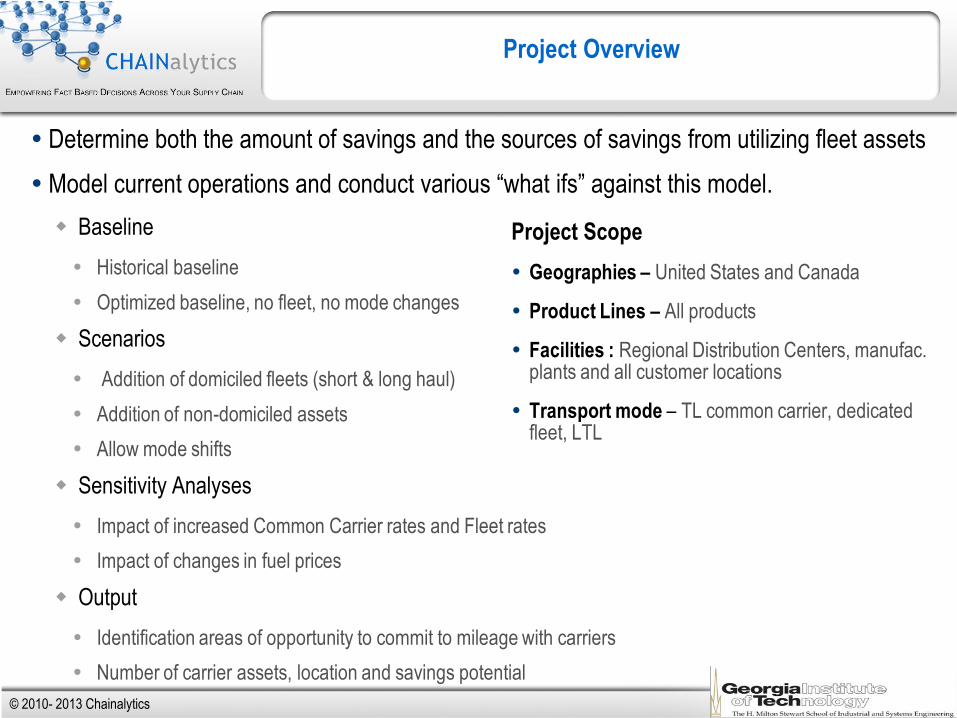
Determine both the amount of savings and the sources of savings from utilizing fleet assets
Model current operations and conduct various “what ifs” against this model.
Baseline
Historical baseline
Optimized baseline, no fleet, no mode changes
Scenarios
Addition of domiciled fleets (short & long haul)
Addition of non-domiciled assets
Allow mode shifts
Sensitivity Analyses
Impact of increased Common Carrier rates and Fleet rates
Impact of changes in fuel prices
Output
Identification areas of opportunity to commit to mileage with carriers
Number of carrier assets, location and savings potential
Project Overview
Project Scope
Geographies – United States and Canada
Product Lines – All products
Facilities : Regional Distribution Centers, manufac. plants and all customer locations
Transport mode – TL common carrier, dedicated fleet, LTL
© 2010- 2013 Chainalytics
Confidential 23
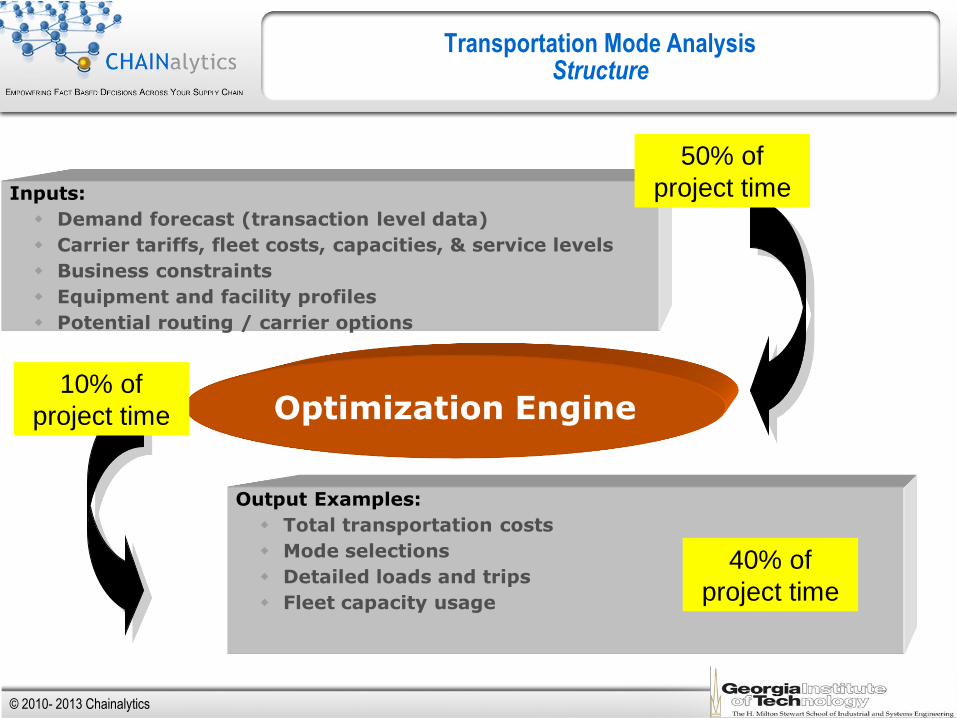
Transportation Mode Analysis Structure
Inputs:
Demand forecast (transaction level data)
Carrier tariffs, fleet costs, capacities, & service levels
Business constraints
Equipment and facility profiles
Potential routing / carrier options
Output Examples:
Total transportation costs
Mode selections
Detailed loads and trips
Fleet capacity usage
Optimization Engine
50% of
project time
10% of
project time
40% of
project time
© 2010- 2013 Chainalytics
Confidential
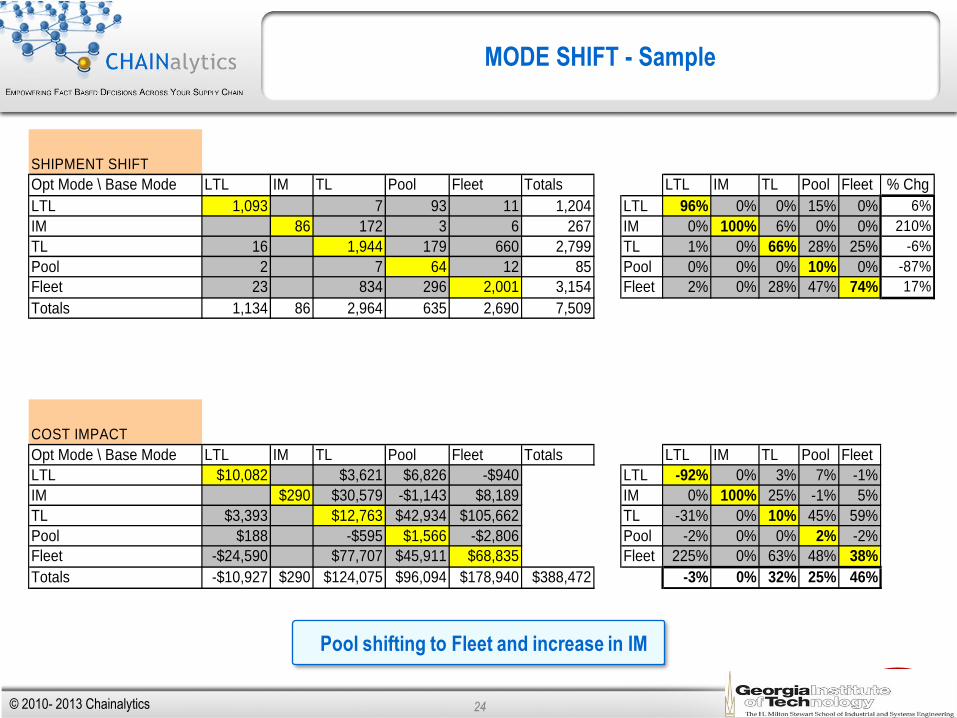
MODE SHIFT - Sample
SHIPMENT SHIFT
Opt Mode \ Base Mode LTL IM TL Pool Fleet Totals LTL IM TL Pool Fleet % Chg
LTL 1,093 7 93 11 1,204 LTL 96% 0% 0% 15% 0% 6%
IM 86 172 3 6 267 IM 0% 100% 6% 0% 0% 210%
TL 16 1,944 179 660 2,799 TL 1% 0% 66% 28% 25% -6%
Pool 2 7 64 12 85 Pool 0% 0% 0% 10% 0% -87%
Fleet 23 834 296 2,001 3,154 Fleet 2% 0% 28% 47% 74% 17%
Totals 1,134 86 2,964 635 2,690 7,509
COST IMPACT
Opt Mode \ Base Mode LTL IM TL Pool Fleet Totals LTL IM TL Pool Fleet
LTL $10,082 $3,621 $6,826 -$940 LTL -92% 0% 3% 7% -1%
IM $290 $30,579 -$1,143 $8,189 IM 0% 100% 25% -1% 5%
TL $3,393 $12,763 $42,934 $105,662 TL -31% 0% 10% 45% 59%
Pool $188 -$595 $1,566 -$2,806 Pool -2% 0% 0% 2% -2%
Fleet -$24,590 $77,707 $45,911 $68,835 Fleet 225% 0% 63% 48% 38%
Totals -$10,927 $290 $124,075 $96,094 $178,940 $388,472 -3% 0% 32% 25% 46%
24
Pool shifting to Fleet and increase in IM
© 2010- 2013 Chainalytics
Confidential 25
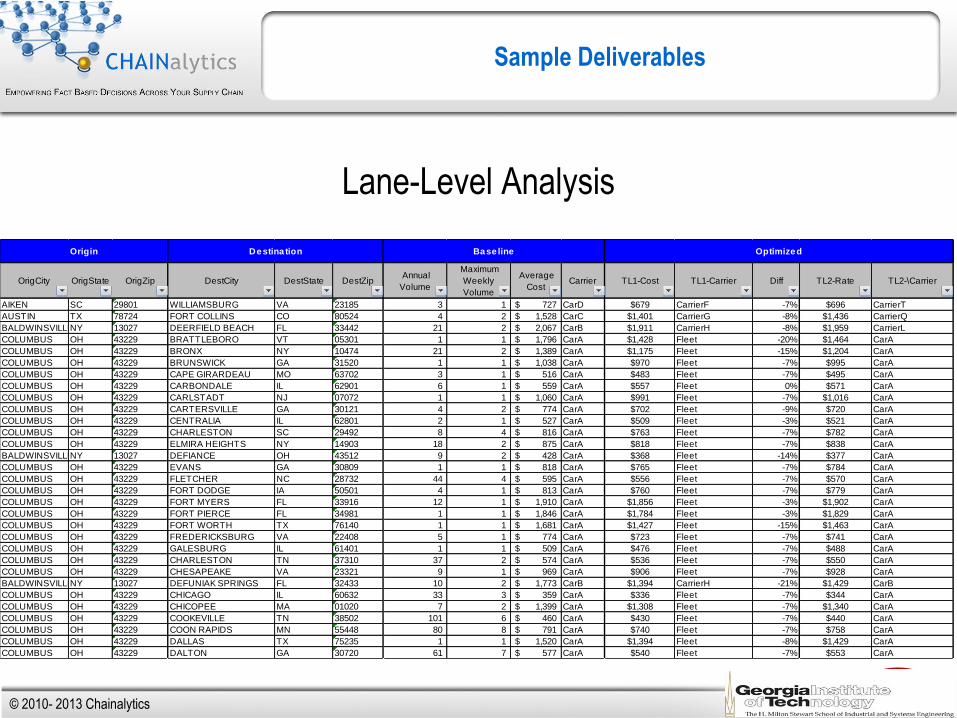
Sample Deliverables
Lane-Level Analysis
OrigCity OrigState OrigZip DestCity DestState DestZip Annual
Volume
Maximum
Weekly
Volume
Average
Cost Carrier TL1-Cost TL1-Carrier Diff TL2-Rate TL2-\Carrier
AIKEN SC 29801 WILLIAMSBURG VA 23185 3 1 727$ CarD $679 CarrierF -7% $696 CarrierT
AUSTIN TX 78724 FORT COLLINS CO 80524 4 2 1,528$ CarC $1,401 CarrierG -8% $1,436 CarrierQ
BALDWINSVILLENY 13027 DEERFIELD BEACH FL 33442 21 2 2,067$ CarB $1,911 CarrierH -8% $1,959 CarrierL
COLUMBUS OH 43229 BRATTLEBORO VT 05301 1 1 1,796$ CarA $1,428 Fleet -20% $1,464 CarA
COLUMBUS OH 43229 BRONX NY 10474 21 2 1,389$ CarA $1,175 Fleet -15% $1,204 CarA
COLUMBUS OH 43229 BRUNSWICK GA 31520 1 1 1,038$ CarA $970 Fleet -7% $995 CarA
COLUMBUS OH 43229 CAPE GIRARDEAU MO 63702 3 1 516$ CarA $483 Fleet -7% $495 CarA
COLUMBUS OH 43229 CARBONDALE IL 62901 6 1 559$ CarA $557 Fleet 0% $571 CarA
COLUMBUS OH 43229 CARLSTADT NJ 07072 1 1 1,060$ CarA $991 Fleet -7% $1,016 CarA
COLUMBUS OH 43229 CARTERSVILLE GA 30121 4 2 774$ CarA $702 Fleet -9% $720 CarA
COLUMBUS OH 43229 CENTRALIA IL 62801 2 1 527$ CarA $509 Fleet -3% $521 CarA
COLUMBUS OH 43229 CHARLESTON SC 29492 8 4 816$ CarA $763 Fleet -7% $782 CarA
COLUMBUS OH 43229 ELMIRA HEIGHTS NY 14903 18 2 875$ CarA $818 Fleet -7% $838 CarA
BALDWINSVILLENY 13027 DEFIANCE OH 43512 9 2 428$ CarA $368 Fleet -14% $377 CarA
COLUMBUS OH 43229 EVANS GA 30809 1 1 818$ CarA $765 Fleet -7% $784 CarA
COLUMBUS OH 43229 FLETCHER NC 28732 44 4 595$ CarA $556 Fleet -7% $570 CarA
COLUMBUS OH 43229 FORT DODGE IA 50501 4 1 813$ CarA $760 Fleet -7% $779 CarA
COLUMBUS OH 43229 FORT MYERS FL 33916 12 1 1,910$ CarA $1,856 Fleet -3% $1,902 CarA
COLUMBUS OH 43229 FORT PIERCE FL 34981 1 1 1,846$ CarA $1,784 Fleet -3% $1,829 CarA
COLUMBUS OH 43229 FORT WORTH TX 76140 1 1 1,681$ CarA $1,427 Fleet -15% $1,463 CarA
COLUMBUS OH 43229 FREDERICKSBURG VA 22408 5 1 774$ CarA $723 Fleet -7% $741 CarA
COLUMBUS OH 43229 GALESBURG IL 61401 1 1 509$ CarA $476 Fleet -7% $488 CarA
COLUMBUS OH 43229 CHARLESTON TN 37310 37 2 574$ CarA $536 Fleet -7% $550 CarA
COLUMBUS OH 43229 CHESAPEAKE VA 23321 9 1 969$ CarA $906 Fleet -7% $928 CarA
BALDWINSVILLENY 13027 DEFUNIAK SPRINGS FL 32433 10 2 1,773$ CarB $1,394 CarrierH -21% $1,429 CarB
COLUMBUS OH 43229 CHICAGO IL 60632 33 3 359$ CarA $336 Fleet -7% $344 CarA
COLUMBUS OH 43229 CHICOPEE MA 01020 7 2 1,399$ CarA $1,308 Fleet -7% $1,340 CarA
COLUMBUS OH 43229 COOKEVILLE TN 38502 101 6 460$ CarA $430 Fleet -7% $440 CarA
COLUMBUS OH 43229 COON RAPIDS MN 55448 80 8 791$ CarA $740 Fleet -7% $758 CarA
COLUMBUS OH 43229 DALLAS TX 75235 1 1 1,520$ CarA $1,394 Fleet -8% $1,429 CarA
COLUMBUS OH 43229 DALTON GA 30720 61 7 577$ CarA $540 Fleet -7% $553 CarA
Origin Destina tion Base line Optimized
© 2010- 2013 Chainalytics
Confidential 26
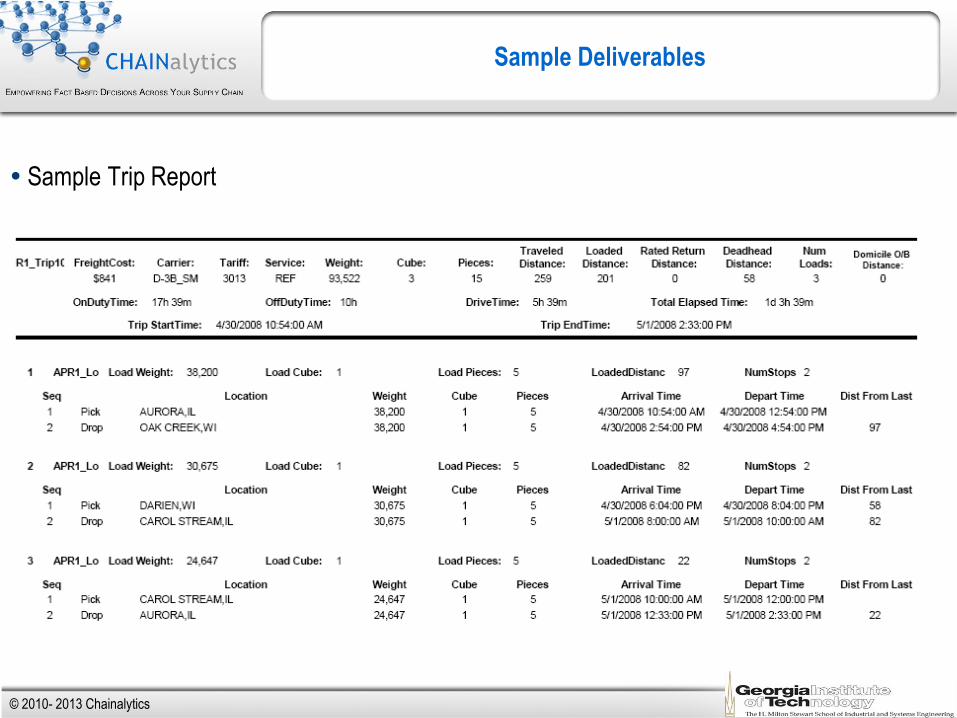
Sample Deliverables
Sample Trip Report
© 2010- 2013 Chainalytics
Confidential
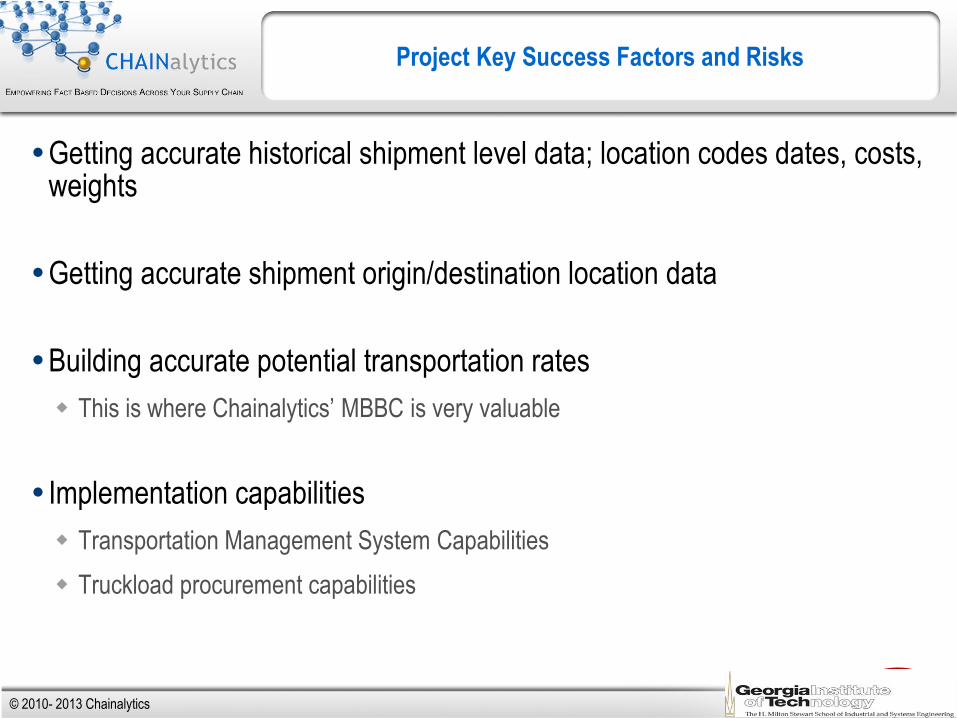
Getting accurate historical shipment level data; location codes dates, costs, weights
Getting accurate shipment origin/destination location data
Building accurate potential transportation rates
This is where Chainalytics’ MBBC is very valuable
Implementation capabilities
Transportation Management System Capabilities
Truckload procurement capabilities
Project Key Success Factors and Risks
© 2010- 2013 Chainalytics
Confidential 28
Agenda
CHAINalytics Overview
Transportation Benchmarking
Transportation Modes in the Supply Chain
Lane Matching
Transportation Modeling/Planning
Opportunities at Chainalytics
© 2010- 2013 Chainalytics
Confidential 29
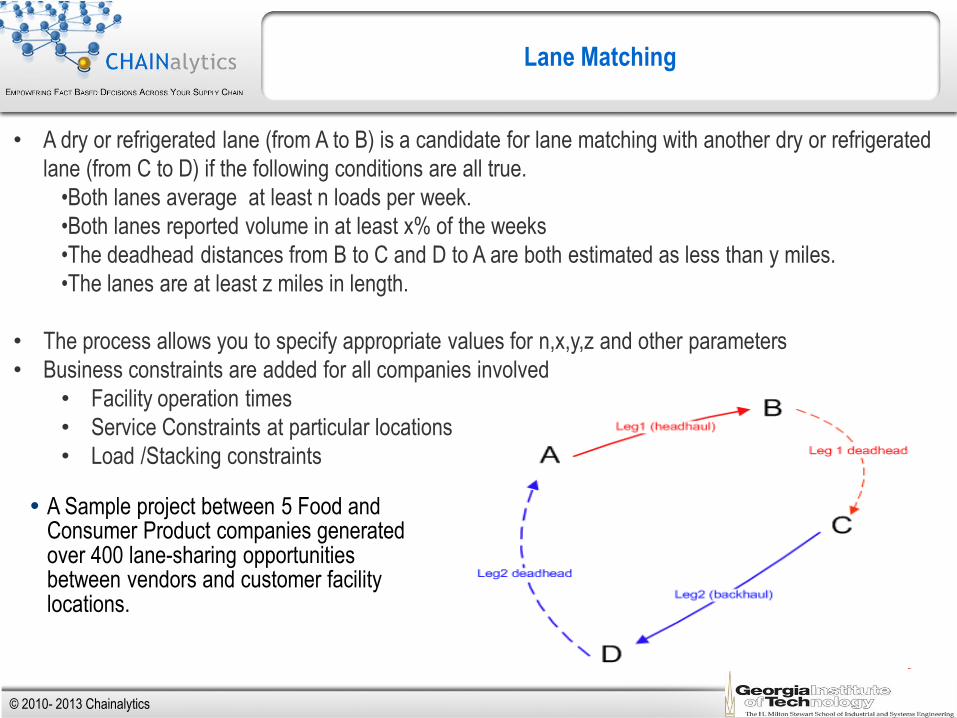
Lane Matching
• A dry or refrigerated lane (from A to B) is a candidate for lane matching with another dry or refrigerated
lane (from C to D) if the following conditions are all true.
•Both lanes average at least n loads per week.
•Both lanes reported volume in at least x% of the weeks
•The deadhead distances from B to C and D to A are both estimated as less than y miles.
•The lanes are at least z miles in length.
• The process allows you to specify appropriate values for n,x,y,z and other parameters
• Business constraints are added for all companies involved
• Facility operation times
• Service Constraints at particular locations
• Load /Stacking constraints
A Sample project between 5 Food and Consumer Product companies generated over 400 lane-sharing opportunities between vendors and customer facility locations.
© 2010- 2013 Chainalytics
Confidential 30
Agenda
CHAINalytics Overview
Transportation Benchmarking
Transportation Modes in the Supply Chain
Lane Matching
Transportation Modeling/Planning
Opportunities at Chainalytics
© 2010- 2013 Chainalytics
Confidential 31
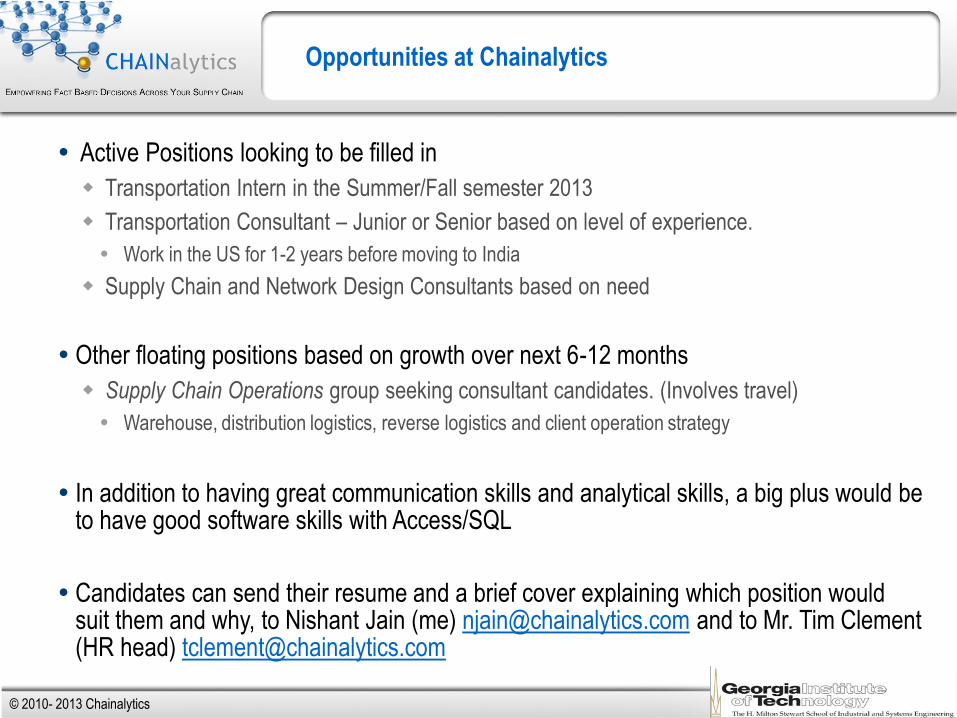
Opportunities at Chainalytics
Active Positions looking to be filled in
Transportation Intern in the Summer/Fall semester 2013
Transportation Consultant – Junior or Senior based on level of experience.
Work in the US for 1-2 years before moving to India
Supply Chain and Network Design Consultants based on need
Other floating positions based on growth over next 6-12 months
Supply Chain Operations group seeking consultant candidates. (Involves travel)
Warehouse, distribution logistics, reverse logistics and client operation strategy
In addition to having great communication skills and analytical skills, a big plus would be to have good software skills with Access/SQL
Candidates can send their resume and a brief cover explaining which position would suit them and why, to Nishant Jain (me) [email protected] and to Mr. Tim Clement (HR head) [email protected]
© 2010- 2013 Chainalytics
Confidential 32
Thank You
© 2010- 2013 Chainalytics