Embed Size (px)
Citation preview

Treasury Presentation to TBAC
Office of Debt Management
Fiscal Year 2016 Q1 Report
Table of Contents
2
I. Executive Summary p. 4
II. FiscalA. Quarterly Tax Receipts p. 6B. Monthly Receipt Levels p. 7C. Eleven Largest Outlays p. 8D. Treasury Net Nonmarketable Borrowing p. 9E. Cumulative Budget Deficits p. 10F. Deficit and Borrowing Estimates p. 11G. Budget Surplus/Deficit p. 12
III. FinancingA. Sources of Financing p. 15B. OMB’s Projections of Net Borrowing from the Public p. 17C. Interest Rate Assumptions p. 18D. Net Marketable Borrowing on “Auto Pilot” Versus Deficit Forecasts p. 19
IV. Portfolio MetricsA. Weighted Average Maturity of Marketable Debt Outstanding with Projections p. 24B. Projected Gross Borrowing p. 25C. Maturity Profile p. 26
V. DemandA. Summary Statistics p. 31B. Bid-to-Cover Ratios p. 32C. Investor Class Awards at Auction p. 37D. Primary Dealer Awards at Auction p. 41E. Direct Bidder Awards at Auction p. 42F. Foreign Awards at Auction p. 43

Section I:Executive Summary
3
Sources of Financing in Fiscal Year 2016 • Demand for Treasury bills remains strong and is expected to continue to grow through the end of FY 2016. As noted in the November
Quarterly Refunding Statement, Treasury believes that it is prudent to increase the level of Treasury bills outstanding over the coming quarters.
• To accommodate this increase in bill issuance, Treasury may need to gradually reduce issuance sizes of nominal coupons and TIPS.• If the Federal Reserve continues to reinvest its SOMA portfolio throughout FY 2016 and coupon sizes remain at current levels, OMB is
forecasting that Treasury will be overfunded by $118 billion (Page 20).
Projected Net Marketable Borrowing• Between FY 2016 and 2018, Treasury’s borrowing from the public could rise notably if the Federal Reserve allows the Treasury securities
held in the SOMA portfolio to mature.• There are $675 billion of Treasury securities in the SOMA portfolio that will mature between FY 2016 and 2018.
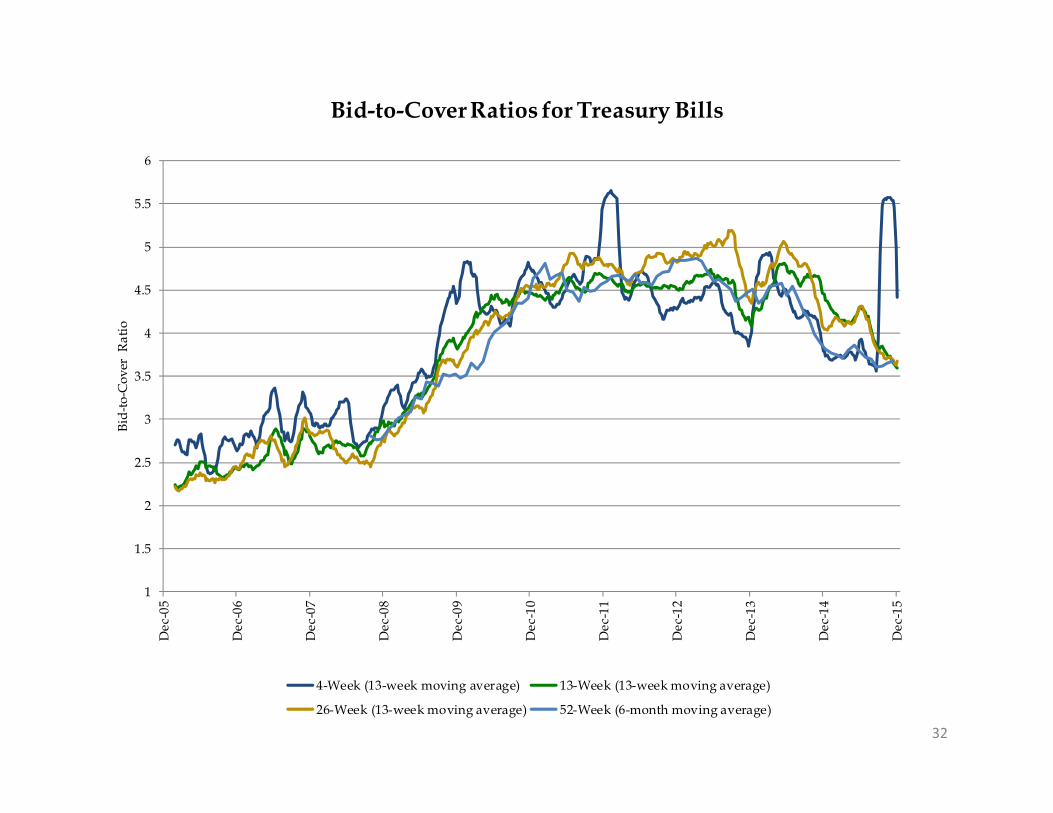
Bid-to-Cover Ratios (BTC)• 1-Month bill auctions from late September through October 2015 were characterized by temporarily elevated BTC ratios, due to debt
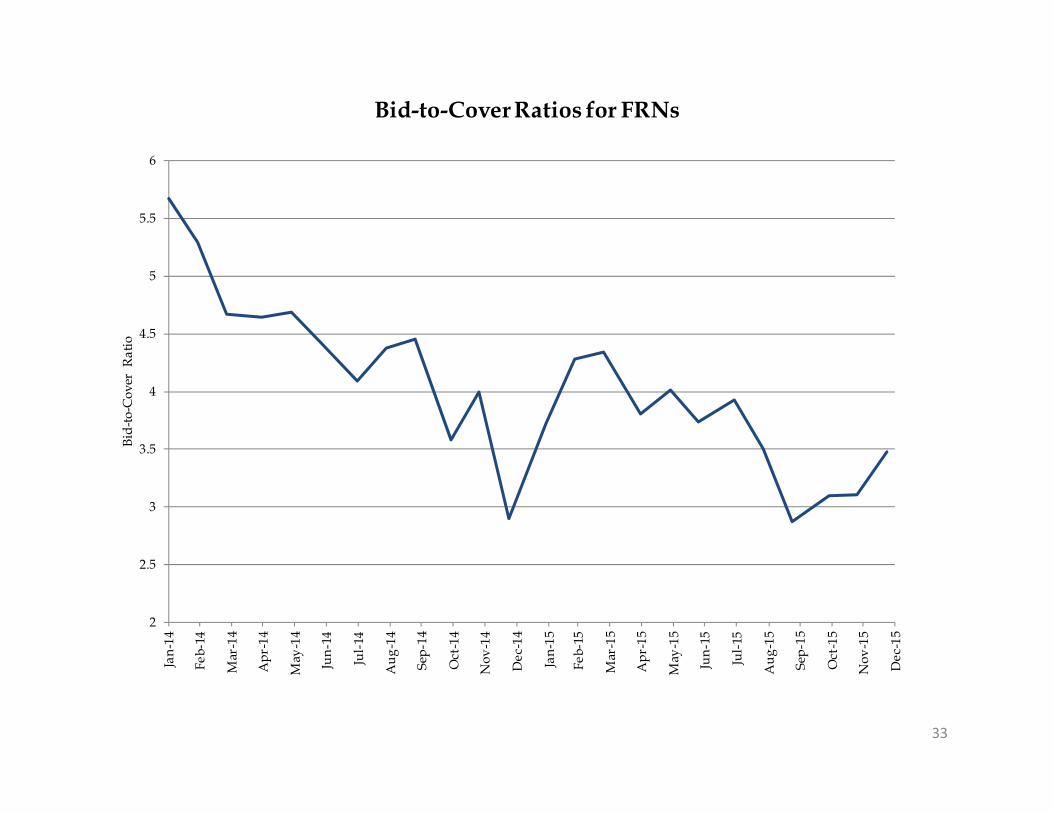
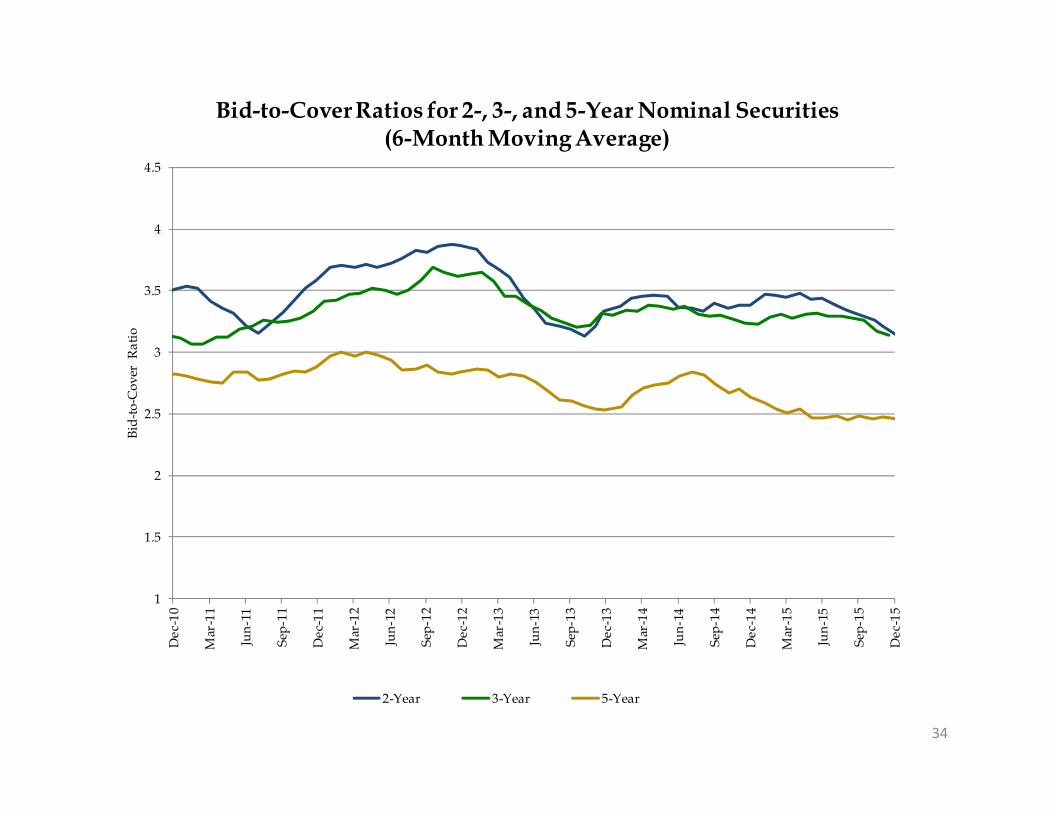
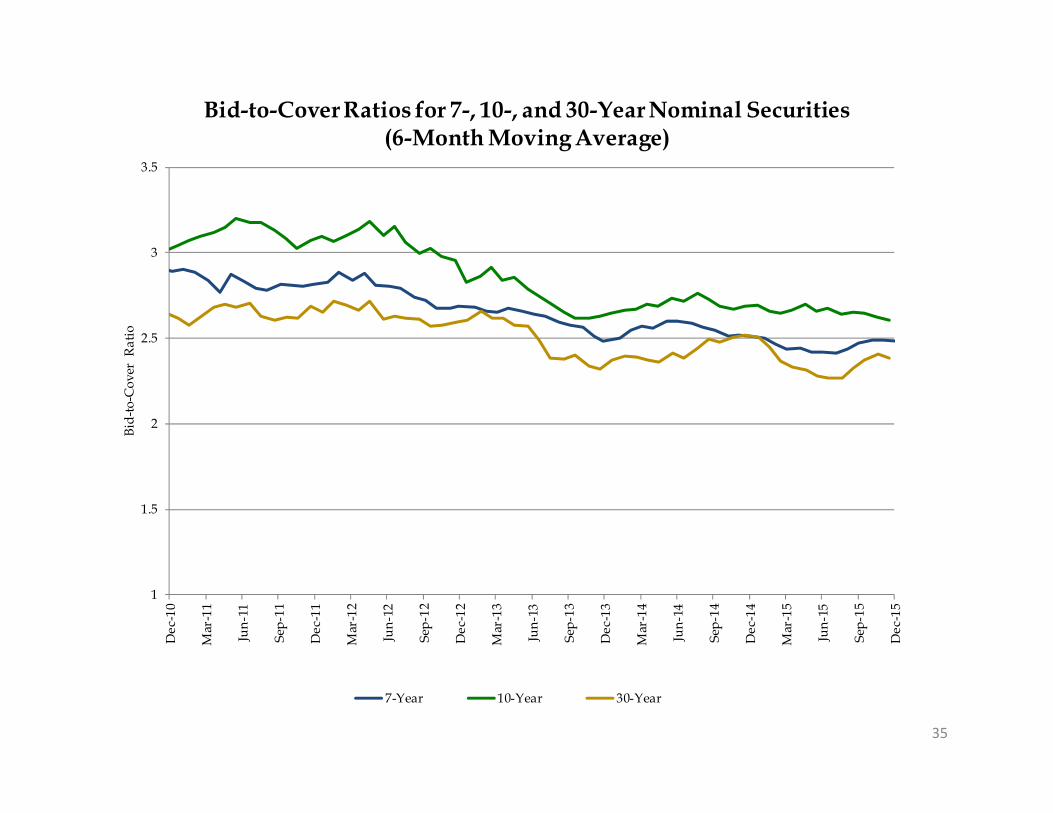
limit-related constraints on bill auction sizes, however, these ratios have since retraced to more normal levels. • BTC ratios for FRNs have risen in recent months, and have been little changed across the nominal curve.
Investor Class Allotments• Since the beginning of October, investment fund awards rose in bills and long coupons (7-, 10-, and 30-Year), and fell slightly for short
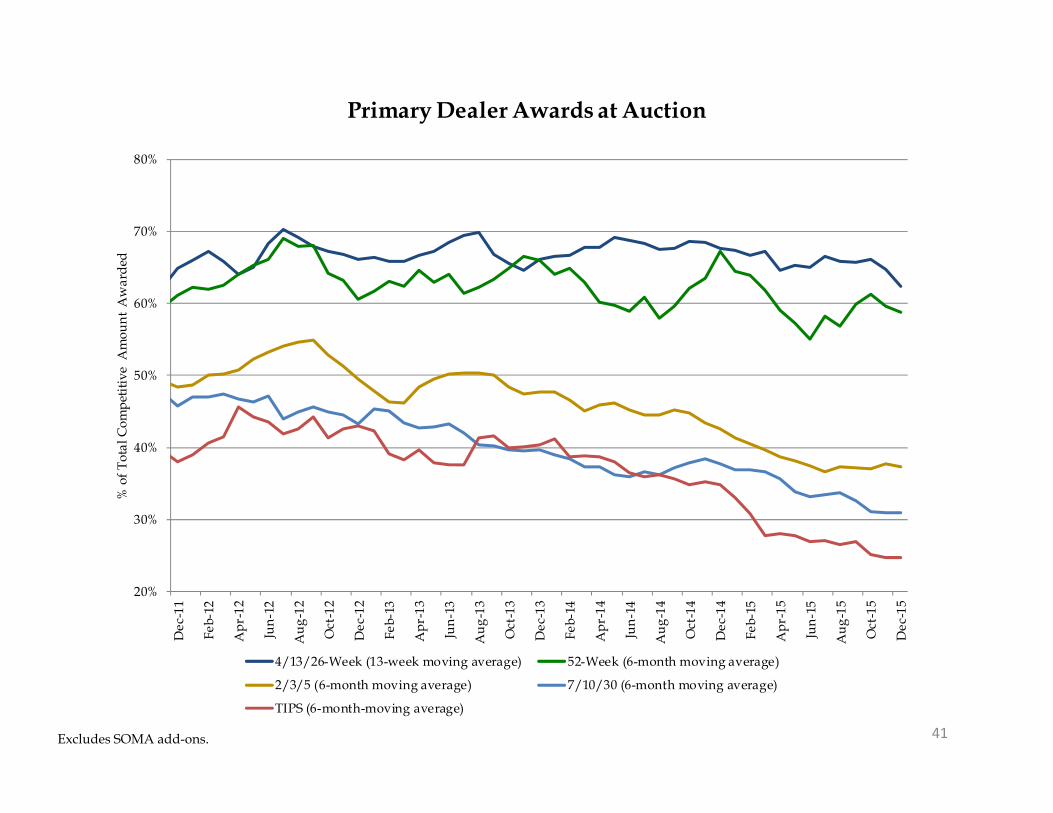
coupons (2-, 3-, and 5-Year). • Primary dealer awards fell slightly in bills, and were broadly unchanged across other tenors. • Other dealers and brokers awards rose noticeably in bills.
Highlights of Treasury’s February 2016 Quarterly Refunding Presentationsto the Treasury Borrowing Advisory Committee (TBAC)
4

Section II:Fiscal
5
6Source: United States Department of the Treasury
(50%)
(40%)
(30%)
(20%)
(10%)
0%
10%
20%
30%
40%
50%
60%
Dec
-05
Apr
-06
Aug
-06
Dec
-06
Apr
-07
Aug
-07
Dec
-07
Apr
-08
Aug
-08
Dec
-08
Apr
-09
Aug
-09
Dec
-09
Apr
-10
Aug
-10
Dec
-10
Apr
-11
Aug
-11
Dec
-11
Apr
-12
Aug
-12
Dec
-12
Apr
-13
Aug
-13
Dec
-13
Apr
-14
Aug
-14
Dec
-14
Apr
-15
Aug
-15
Dec
-15
Yea
r-ov
er-Y
ear
% C
hang
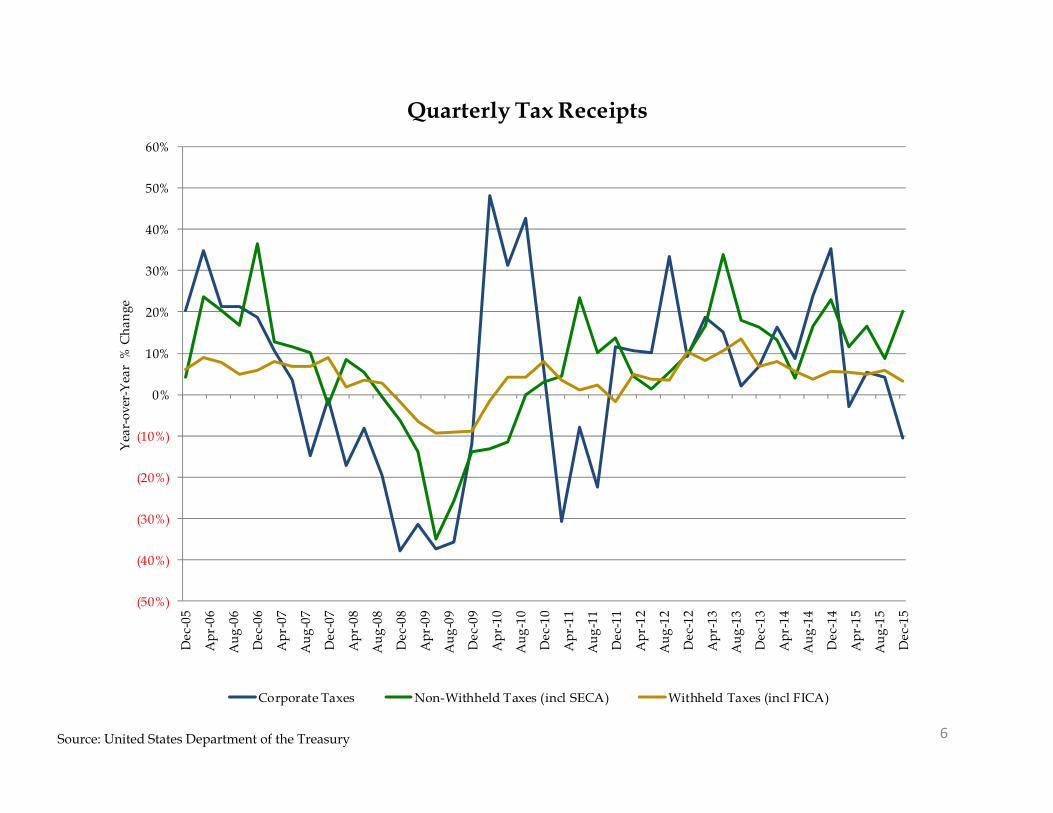
eQuarterly Tax Receipts
Corporate Taxes Non-Withheld Taxes (incl SECA) Withheld Taxes (incl FICA)
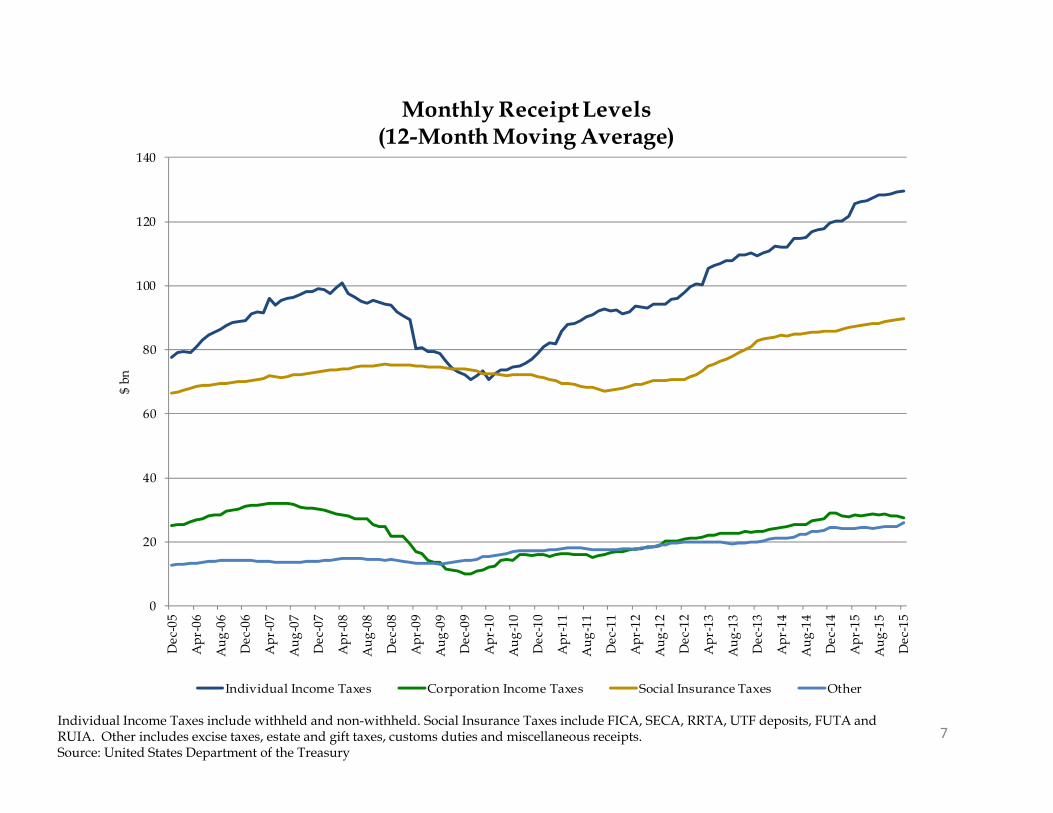
7Individual Income Taxes include withheld and non-withheld. Social Insurance Taxes include FICA, SECA, RRTA, UTF deposits, FUTA and RUIA. Other includes excise taxes, estate and gift taxes, customs duties and miscellaneous receipts. Source: United States Department of the Treasury
0
20
40
60
80
100
120
140D
ec-0
5
Apr
-06
Aug
-06
Dec
-06
Apr
-07
Aug
-07
Dec
-07
Apr
-08
Aug
-08
Dec
-08
Apr
-09
Aug
-09
Dec
-09
Apr
-10
Aug
-10
Dec
-10
Apr
-11
Aug
-11
Dec
-11
Apr
-12
Aug
-12
Dec
-12
Apr
-13
Aug
-13
Dec
-13
Apr
-14
Aug
-14
Dec
-14
Apr
-15
Aug
-15
Dec
-15
$ bn
Monthly Receipt Levels(12-Month Moving Average)
Individual Income Taxes Corporation Income Taxes Social Insurance Taxes Other
8Source: United States Department of the Treasury
0
50
100
150
200
250
300
HH
S
SSA
Def
ense
Trea
sury
Agr
icul
ture
Labo
r
VA
Tran
spor
tatio
n
OP
M
Educ
atio
n
Oth
er D
efen
se C
ivil
$ bn
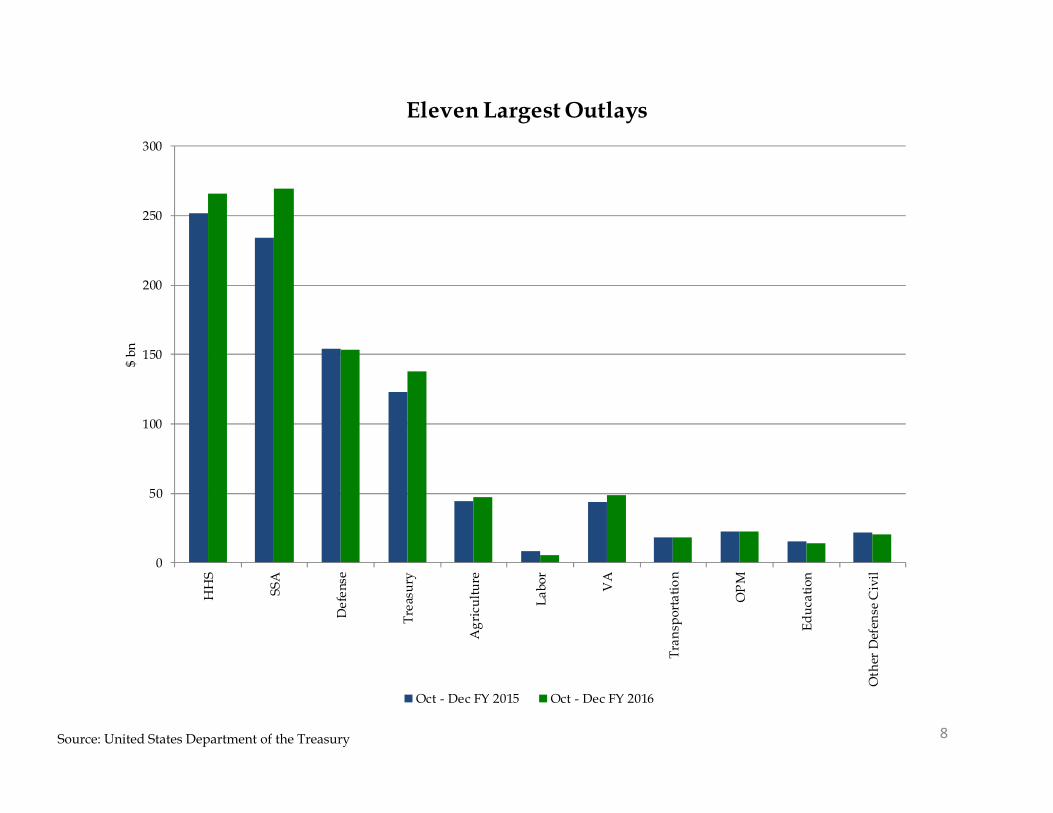
Eleven Largest Outlays
Oct - Dec FY 2015 Oct - Dec FY 2016
9Source: United States Department of the Treasury
(40)
(30)
(20)
(10)
0
10
20
30
Q1-
06Q
2-06
Q3-
06Q
4-06
Q1-
07Q
2-07
Q3-
07Q
4-07
Q1-
08Q
2-08
Q3-
08Q
4-08
Q1-
09Q
2-09
Q3-
09Q
4-09
Q1-
10Q
2-10
Q3-
10Q
4-10
Q1-
11Q
2-11
Q3-
11Q
4-11
Q1-
12Q
2-12
Q3-
12Q
4-12
Q1-
13Q
2-13
Q3-
13Q
4-13
Q1-
14Q
2-14
Q3-
14Q
4-14
Q1-
15Q
2-15
Q3-
15Q
4-15
Q1-
16
$ bn
Fiscal Quarter
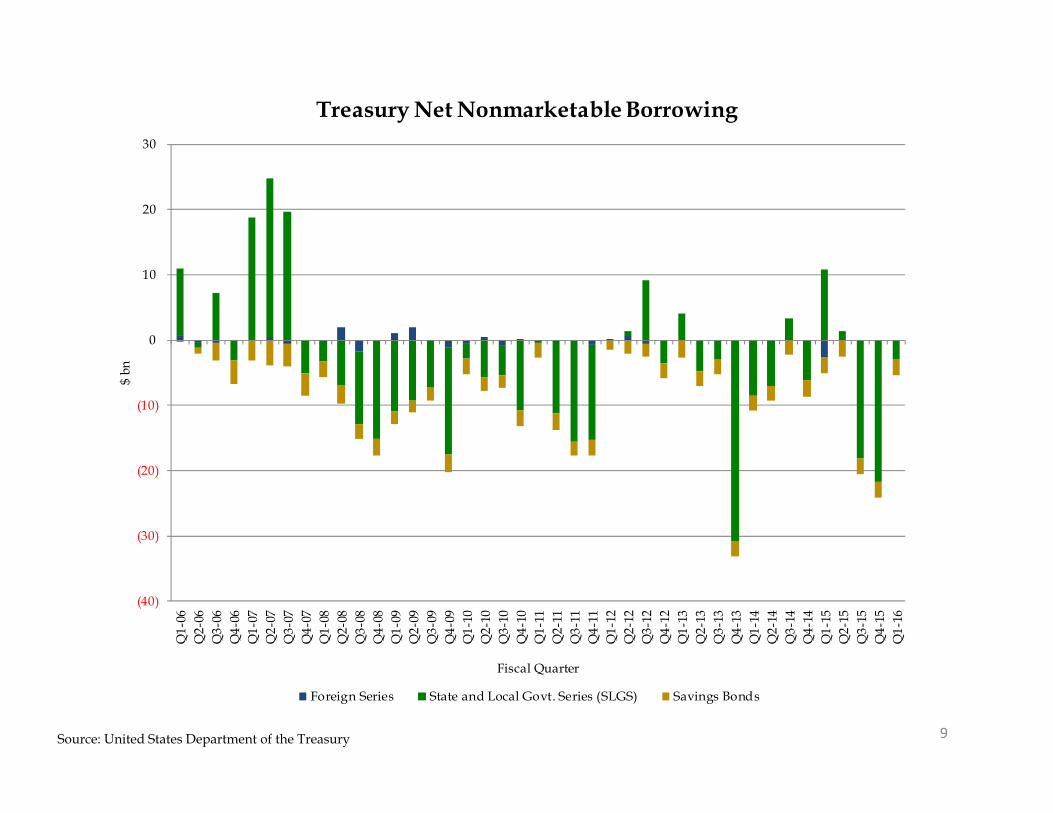
Treasury Net Nonmarketable Borrowing
Foreign Series State and Local Govt. Series (SLGS) Savings Bonds
10Source: United States Department of the Treasury
0
100
200
300
400
500
600
700
Oct
ober
Nov
embe
r
Dec
embe
r
Janu
ary
Febr
uary
Mar
ch
Apr
il
May
June
July
Aug
ust
Sept
embe
r
$ bn
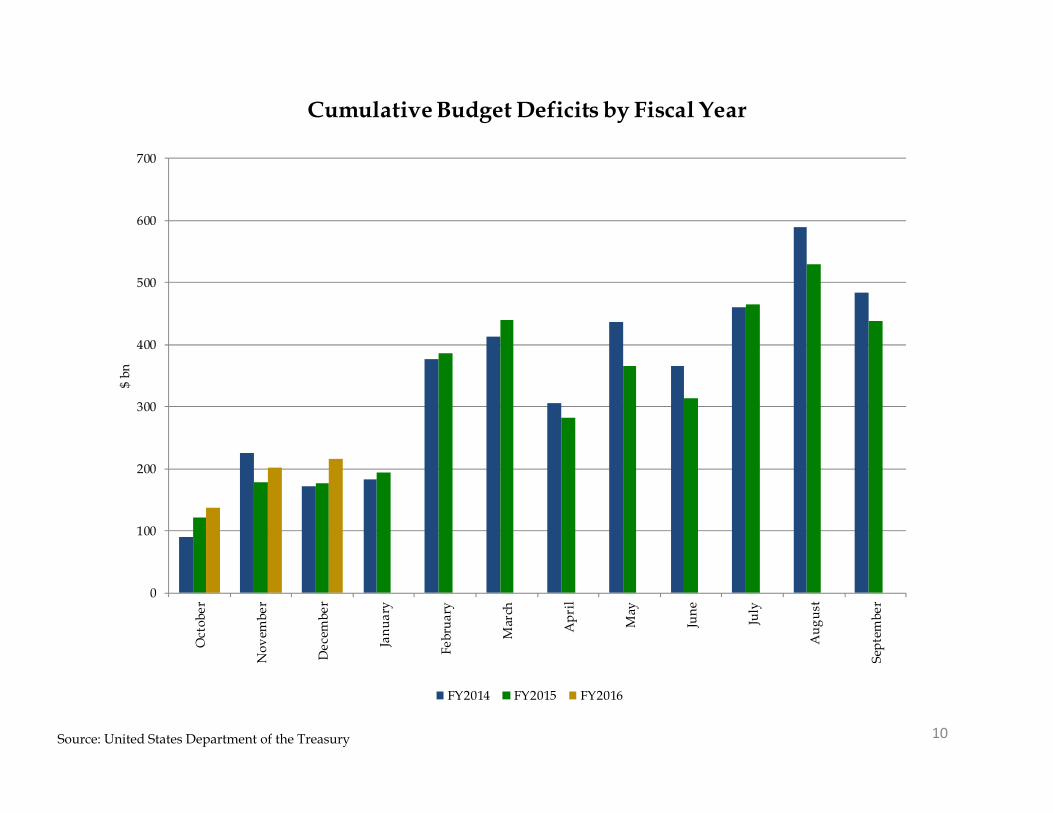
Cumulative Budget Deficits by Fiscal Year
FY2014 FY2015 FY2016
11
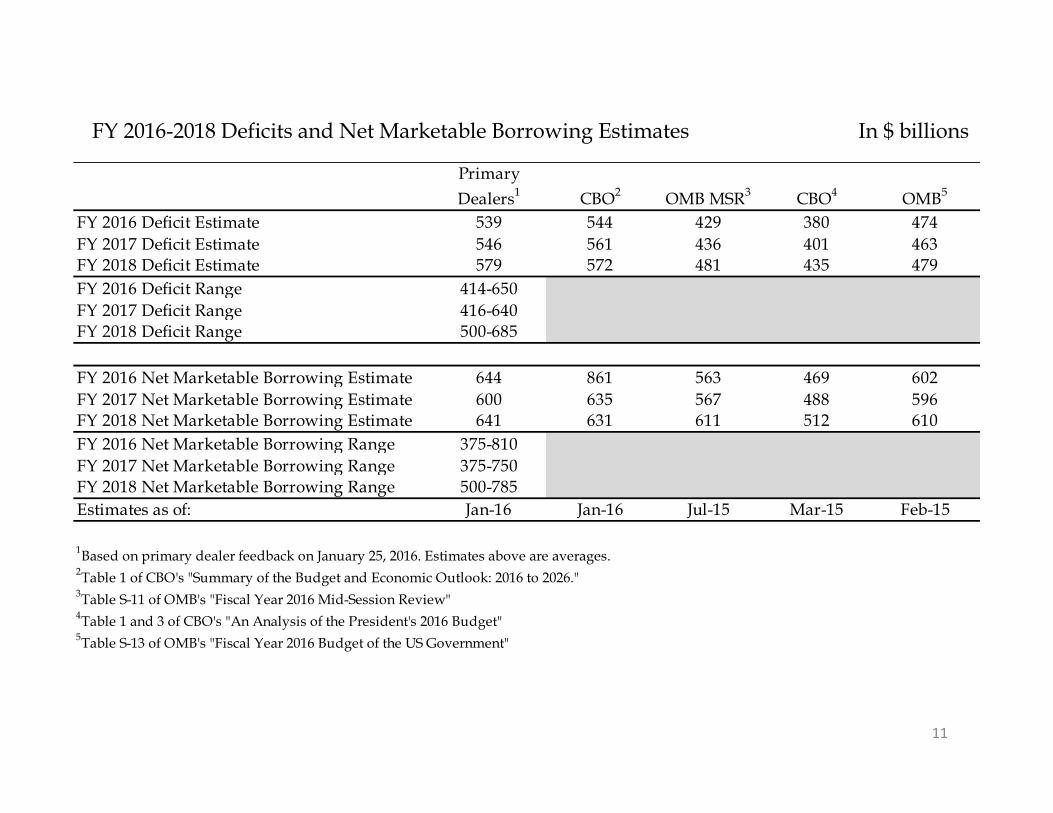
FY 2016-2018 Deficits and Net Marketable Borrowing Estimates In $ billions
Primary Dealers1 CBO2 OMB MSR3 CBO4 OMB5
FY 2016 Deficit Estimate 539 544 429 380 474FY 2017 Deficit Estimate 546 561 436 401 463FY 2018 Deficit Estimate 579 572 481 435 479FY 2016 Deficit Range 414-650FY 2017 Deficit Range 416-640FY 2018 Deficit Range 500-685
FY 2016 Net Marketable Borrowing Estimate 644 861 563 469 602FY 2017 Net Marketable Borrowing Estimate 600 635 567 488 596FY 2018 Net Marketable Borrowing Estimate 641 631 611 512 610FY 2016 Net Marketable Borrowing Range 375-810FY 2017 Net Marketable Borrowing Range 375-750FY 2018 Net Marketable Borrowing Range 500-785Estimates as of: Jan-16 Jan-16 Jul-15 Mar-15 Feb-15
1Based on primary dealer feedback on January 25, 2016. Estimates above are averages. 2Table 1 of CBO's "Summary of the Budget and Economic Outlook: 2016 to 2026."3Table S-11 of OMB's "Fiscal Year 2016 Mid-Session Review"4Table 1 and 3 of CBO's "An Analysis of the President's 2016 Budget"5Table S-13 of OMB's "Fiscal Year 2016 Budget of the US Government"
(12%)
(10%)
(8%)
(6%)
(4%)
(2%)
0%
(1,600)
(1,400)
(1,200)
(1,000)
(800)
(600)
(400)
(200)
0
2006
2007
2008
2009
2010
2011
2012
2013
2014
2015
2016
2017
2018
2019
2020
2021
2022
2023
2024
2025
$ bn
Fiscal Year
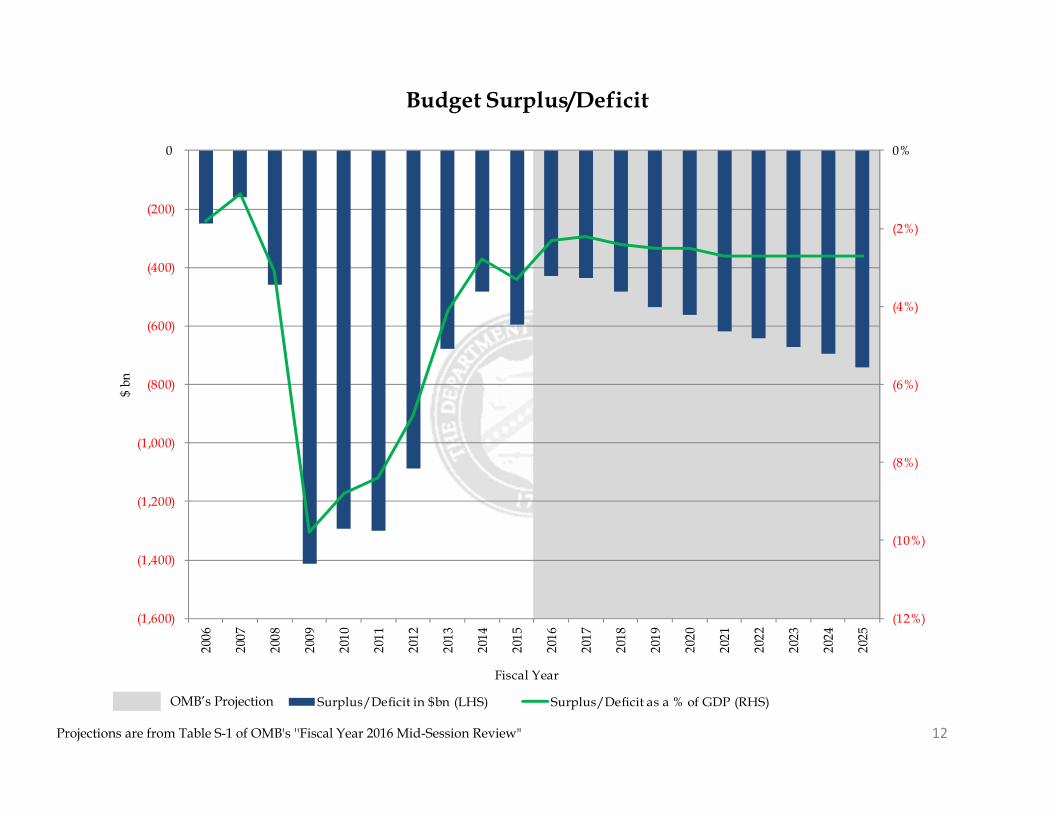
Budget Surplus/Deficit
Surplus/Deficit in $bn (LHS) Surplus/Deficit as a % of GDP (RHS)
Projections are from Table S-1 of OMB's ''Fiscal Year 2016 Mid-Session Review" 12
OMB’s Projection

Section III:Financing
13
14
Assumptions for Financing Section (pages 15 to 22)
• Portfolio and SOMA holdings as of 12/31/2015.• SOMA reinvestments until Q1 CY2017, and SOMA redemptions until and including February 2022.
These assumptions are based on Chair Yellen’s December 2015 press conference and the median expectations from the December FRB-NY survey of primary dealers.
• Assumes announced issuance sizes and patterns constant for Nominal Coupons, TIPS, and FRNs as of 12/31/2015, while using an average of ~$1.5 trillion of Bills outstanding.
• The principal on the TIPS securities was accreted to each projection date based on market ZCIS levels as of 12/31/2015.
• No attempt was made to match future financing needs.
15
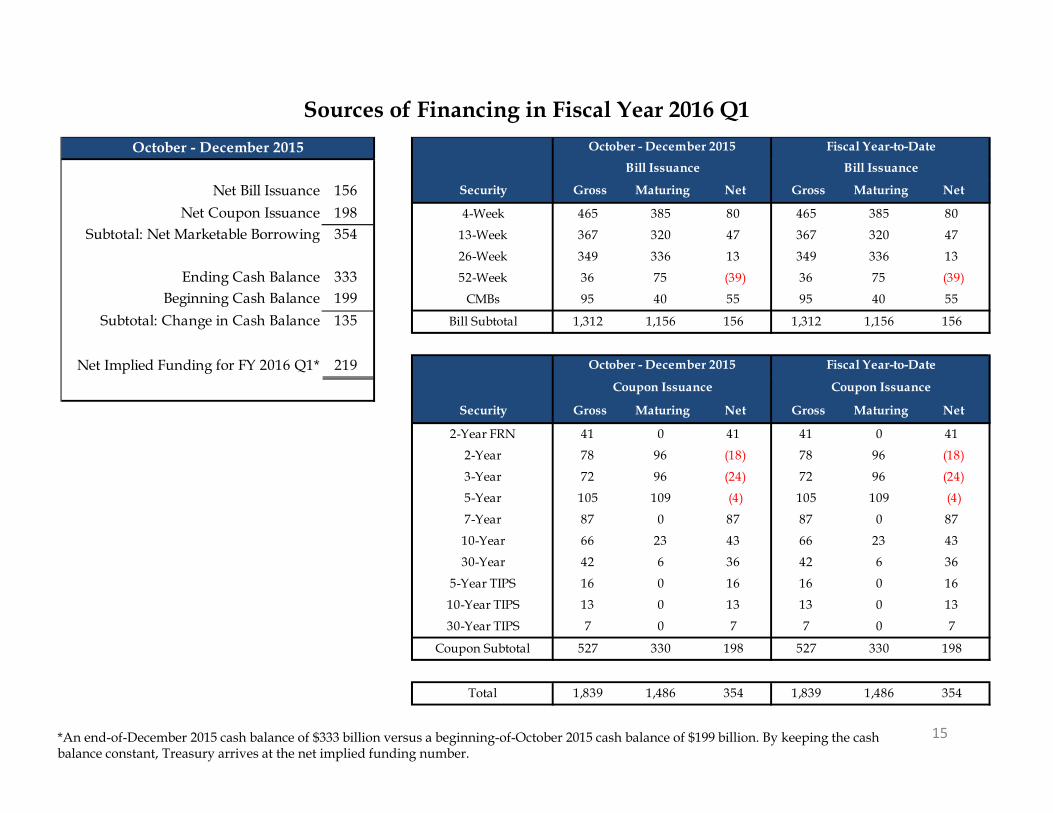
Sources of Financing in Fiscal Year 2016 Q1
*An end-of-December 2015 cash balance of $333 billion versus a beginning-of-October 2015 cash balance of $199 billion. By keeping the cash balance constant, Treasury arrives at the net implied funding number.
Net Bill Issuance 156 Security Gross Maturing Net Gross Maturing Net
Net Coupon Issuance 198 4-Week 465 385 80 465 385 80Subtotal: Net Marketable Borrowing 354 13-Week 367 320 47 367 320 47
26-Week 349 336 13 349 336 13Ending Cash Balance 333 52-Week 36 75 (39) 36 75 (39)
Beginning Cash Balance 199 CMBs 95 40 55 95 40 55
Subtotal: Change in Cash Balance 135 Bill Subtotal 1,312 1,156 156 1,312 1,156 156
Net Implied Funding for FY 2016 Q1* 219
Security Gross Maturing Net Gross Maturing Net
2-Year FRN 41 0 41 41 0 41
2-Year 78 96 (18) 78 96 (18)
3-Year 72 96 (24) 72 96 (24)
5-Year 105 109 (4) 105 109 (4)
7-Year 87 0 87 87 0 87
10-Year 66 23 43 66 23 43
30-Year 42 6 36 42 6 36
5-Year TIPS 16 0 16 16 0 16
10-Year TIPS 13 0 13 13 0 13
30-Year TIPS 7 0 7 7 0 7
Coupon Subtotal 527 330 198 527 330 198
Total 1,839 1,486 354 1,839 1,486 354
Coupon Issuance Coupon Issuance
October - December 2015 October - December 2015 Fiscal Year-to-DateBill Issuance Bill Issuance
October - December 2015 Fiscal Year-to-Date
16
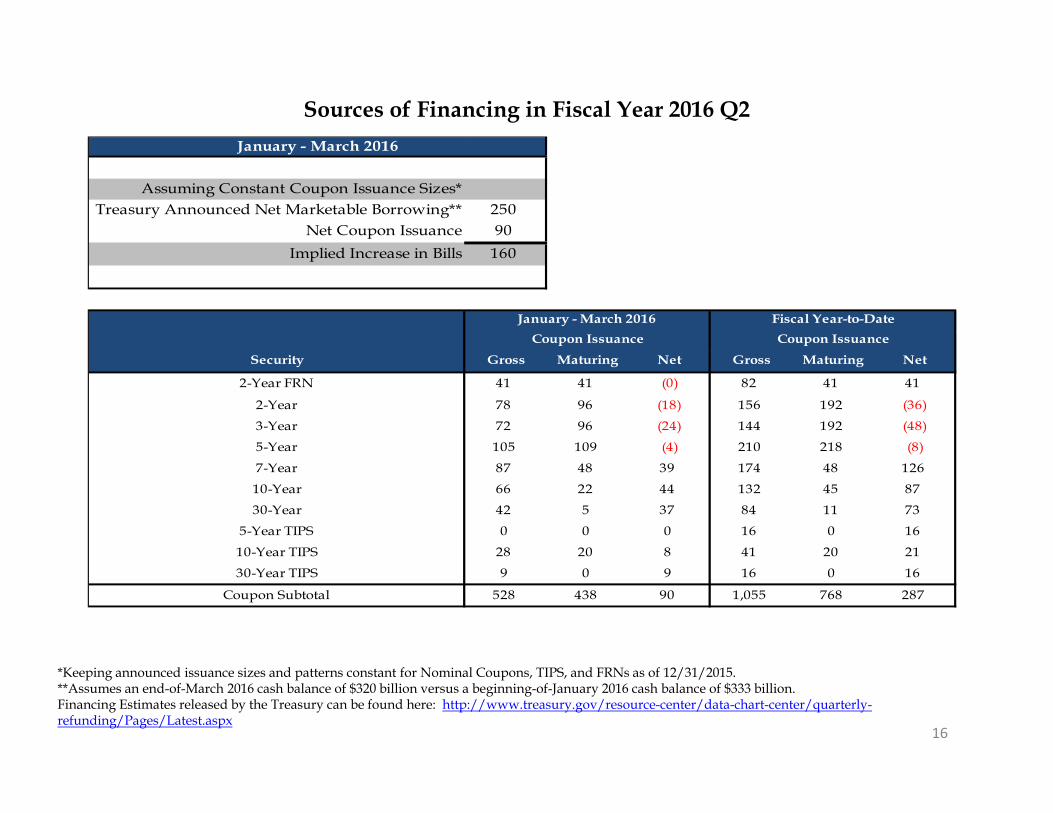
Sources of Financing in Fiscal Year 2016 Q2
*Keeping announced issuance sizes and patterns constant for Nominal Coupons, TIPS, and FRNs as of 12/31/2015.**Assumes an end-of-March 2016 cash balance of $320 billion versus a beginning-of-January 2016 cash balance of $333 billion.Financing Estimates released by the Treasury can be found here: http://www.treasury.gov/resource-center/data-chart-center/quarterly-refunding/Pages/Latest.aspx
Assuming Constant Coupon Issuance Sizes*Treasury Announced Net Marketable Borrowing** 250
Net Coupon Issuance 90Implied Increase in Bills 160
Security Gross Maturing Net Gross Maturing Net
2-Year FRN 41 41 (0) 82 41 41
2-Year 78 96 (18) 156 192 (36)
3-Year 72 96 (24) 144 192 (48)
5-Year 105 109 (4) 210 218 (8)
7-Year 87 48 39 174 48 126
10-Year 66 22 44 132 45 87
30-Year 42 5 37 84 11 73
5-Year TIPS 0 0 0 16 0 16
10-Year TIPS 28 20 8 41 20 21
30-Year TIPS 9 0 9 16 0 16
Coupon Subtotal 528 438 90 1,055 768 287
January - March 2016
January - March 2016 Fiscal Year-to-DateCoupon Issuance Coupon Issuance
564 568 610 659 683 729 751 781 801 848
55%
60%
65%
70%
75%
80%
(400)
(200)
0
200
400
600
800
1,000
2016
2017
2018
2019
2020
2021
2022
2023
2024
2025
$bn
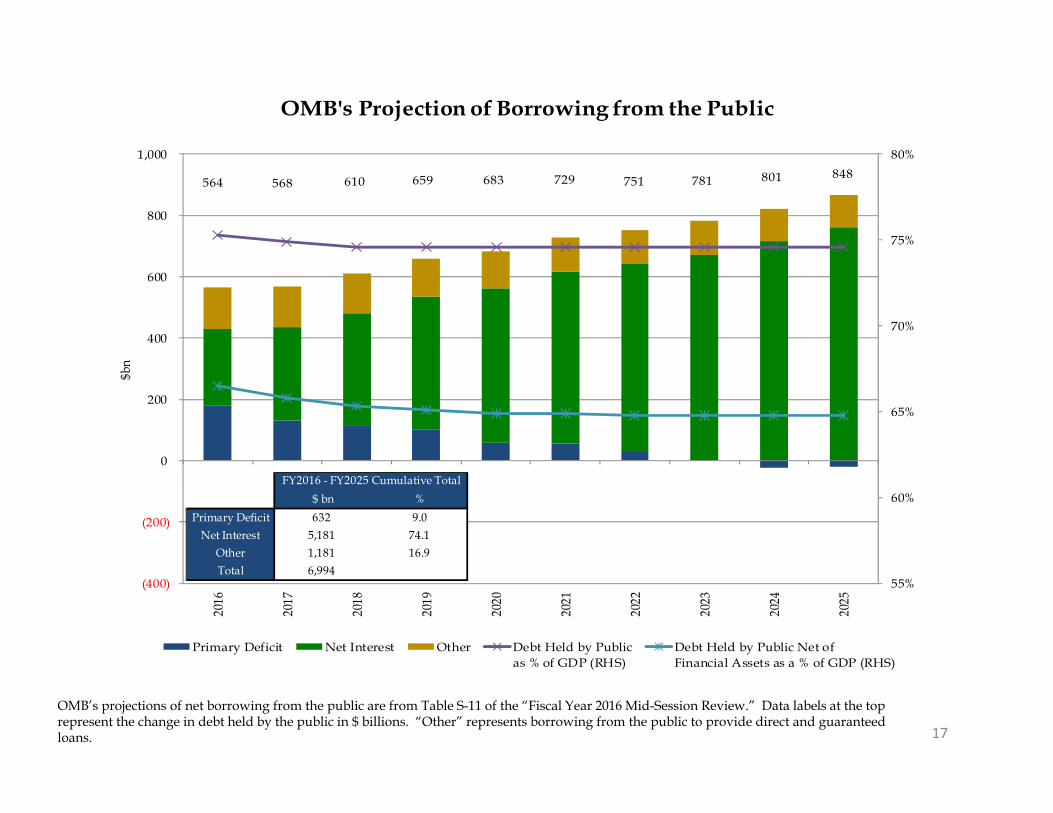
OMB's Projection of Borrowing from the Public
Primary Deficit Net Interest Other Debt Held by Publicas % of GDP (RHS)
Debt Held by Public Net ofFinancial Assets as a % of GDP (RHS)
17
OMB’s projections of net borrowing from the public are from Table S-11 of the “Fiscal Year 2016 Mid-Session Review.” Data labels at the top represent the change in debt held by the public in $ billions. “Other” represents borrowing from the public to provide direct and guaranteed loans.
$ bn %Primary Deficit 632 9.0
Net Interest 5,181 74.1Other 1,181 16.9Total 6,994
FY2016 - FY2025 Cumulative Total
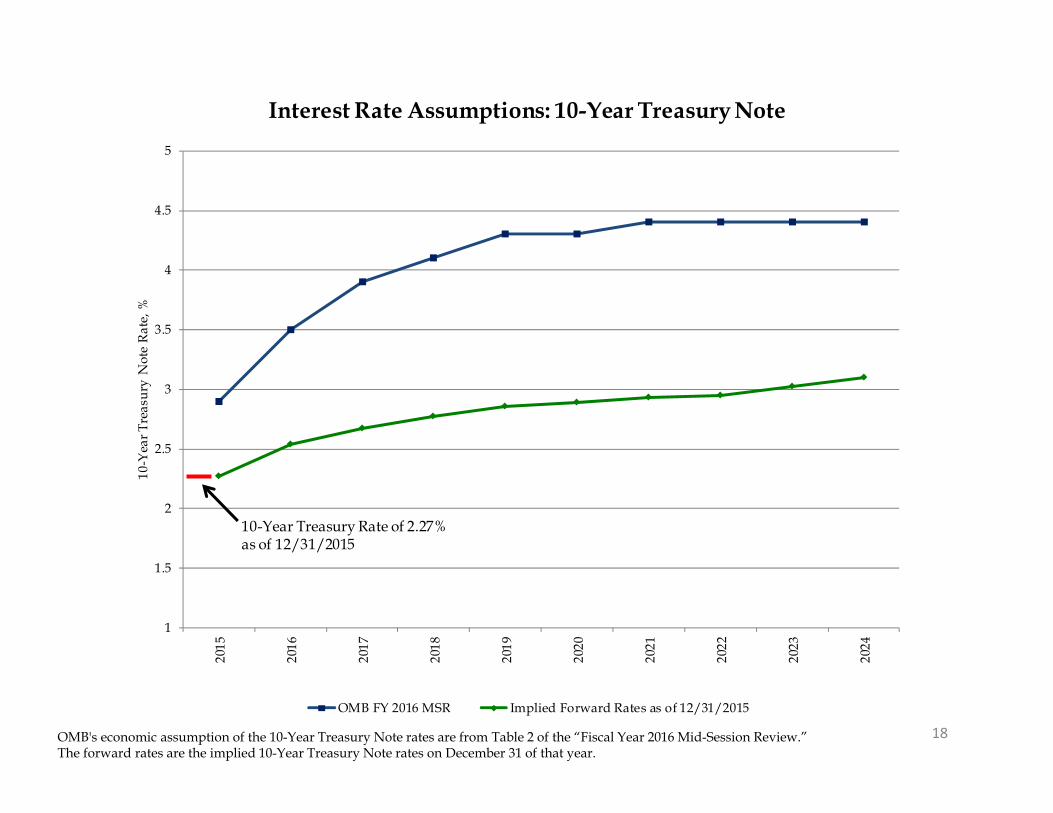
18OMB's economic assumption of the 10-Year Treasury Note rates are from Table 2 of the “Fiscal Year 2016 Mid-Session Review.”The forward rates are the implied 10-Year Treasury Note rates on December 31 of that year.
1
1.5
2
2.5
3
3.5
4
4.5
5
2015
2016
2017
2018
2019
2020
2021
2022
2023
2024
10-Y
ear T
reas
ury
Not
e R
ate,
%
Interest Rate Assumptions: 10-Year Treasury Note
OMB FY 2016 MSR Implied Forward Rates as of 12/31/2015
10-Year Treasury Rate of 2.27% as of 12/31/2015
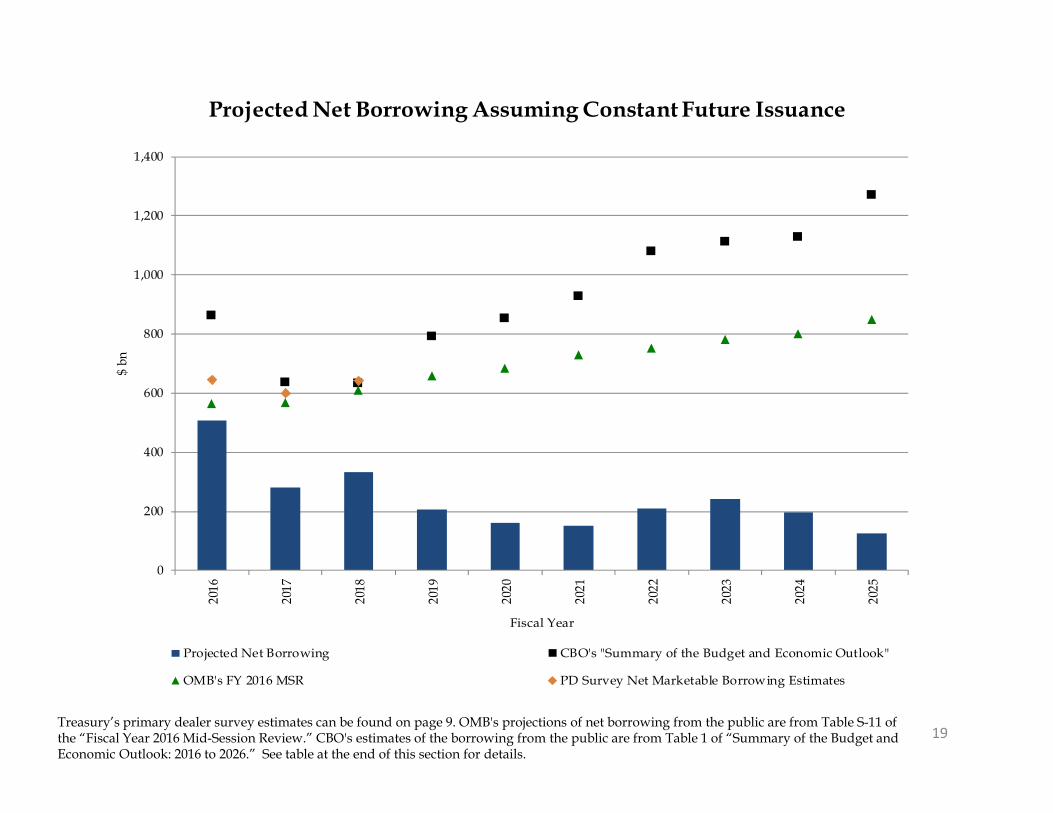
19Treasury’s primary dealer survey estimates can be found on page 9. OMB's projections of net borrowing from the public are from Table S-11 of the “Fiscal Year 2016 Mid-Session Review.” CBO's estimates of the borrowing from the public are from Table 1 of “Summary of the Budget and Economic Outlook: 2016 to 2026.” See table at the end of this section for details.
0
200
400
600
800
1,000
1,200
1,400
2016
2017
2018
2019
2020
2021
2022
2023
2024
2025
$ bn
Fiscal Year
Projected Net Borrowing Assuming Constant Future Issuance
Projected Net Borrowing CBO's "Summary of the Budget and Economic Outlook"
OMB's FY 2016 MSR PD Survey Net Marketable Borrowing Estimates
20
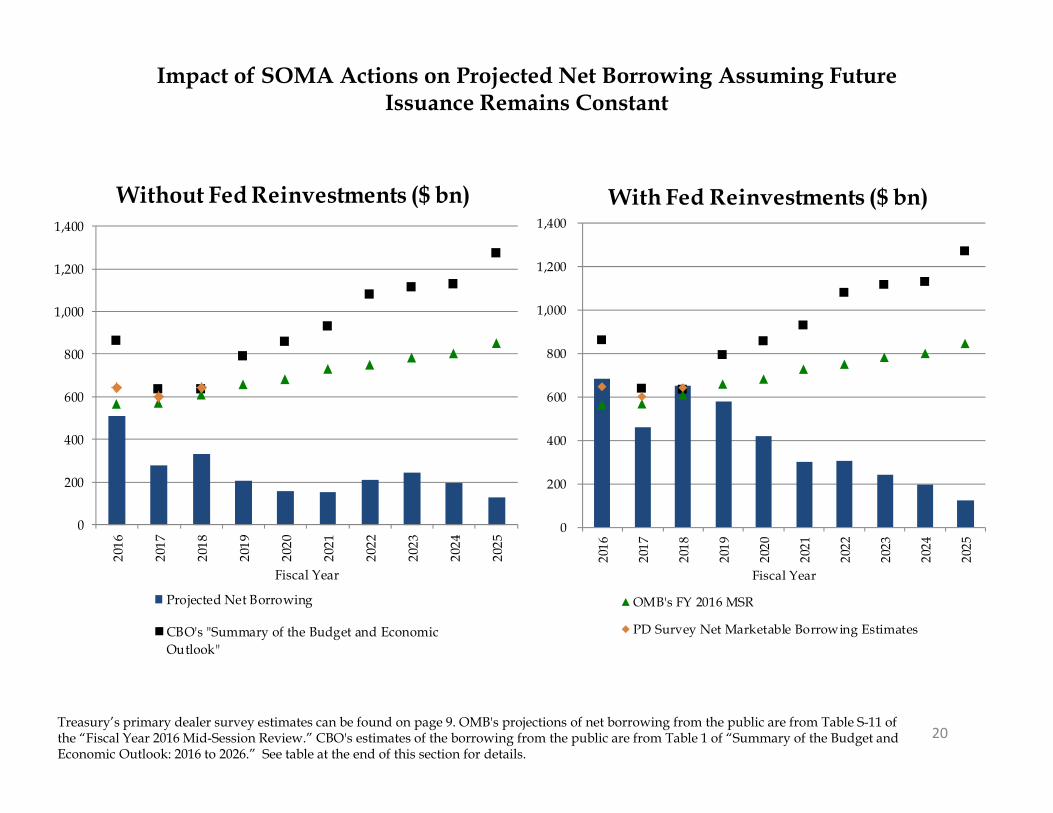
Impact of SOMA Actions on Projected Net Borrowing Assuming Future Issuance Remains Constant
Treasury’s primary dealer survey estimates can be found on page 9. OMB's projections of net borrowing from the public are from Table S-11 of the “Fiscal Year 2016 Mid-Session Review.” CBO's estimates of the borrowing from the public are from Table 1 of “Summary of the Budget and Economic Outlook: 2016 to 2026.” See table at the end of this section for details.
0
200
400
600
800
1,000
1,200
1,400
2016
2017
2018
2019
2020
2021
2022
2023
2024
2025
Fiscal Year
Without Fed Reinvestments ($ bn)
Projected Net Borrowing
CBO's "Summary of the Budget and EconomicOutlook"
0
200
400
600
800
1,000
1,200
1,400
2016
2017
2018
2019
2020
2021
2022
2023
2024
2025
Fiscal Year
With Fed Reinvestments ($ bn)
OMB's FY 2016 MSR
PD Survey Net Marketable Borrowing Estimates
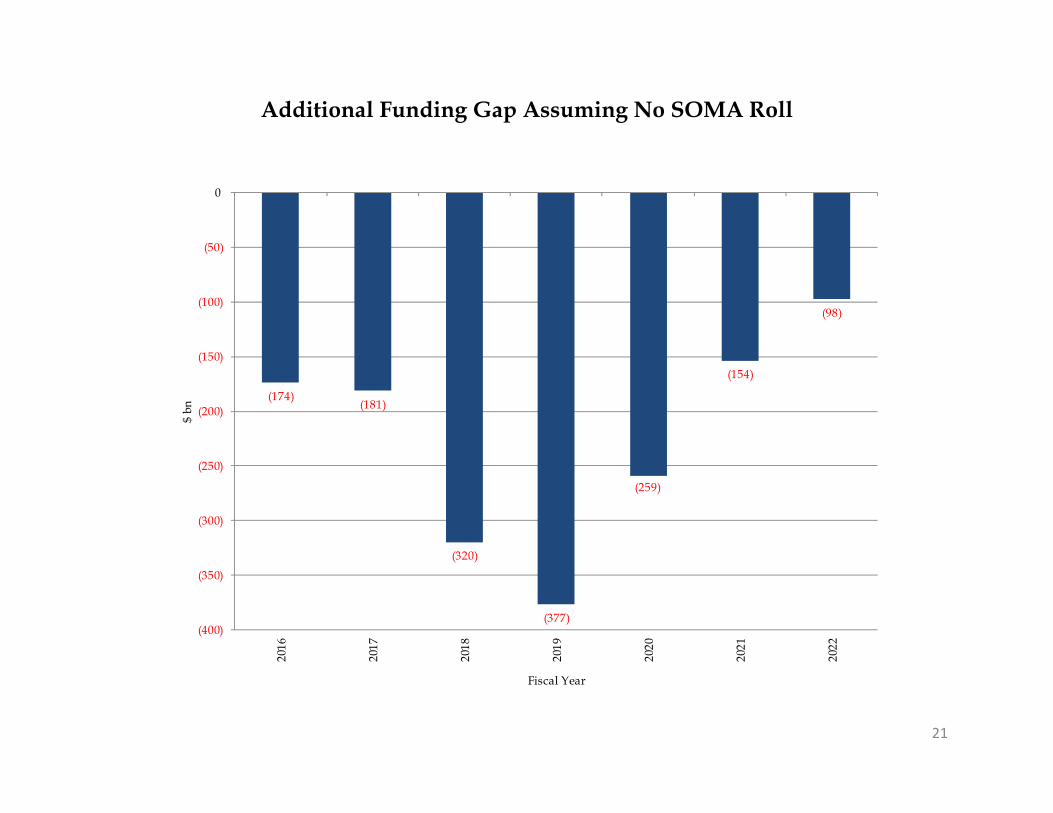
Additional Funding Gap Assuming No SOMA Roll
21
(174)(181)
(320)
(377)
(259)
(154)
(98)
(400)
(350)
(300)
(250)
(200)
(150)
(100)
(50)
0
2016
2017
2018
2019
2020
2021
2022
$ bn
Fiscal Year
22
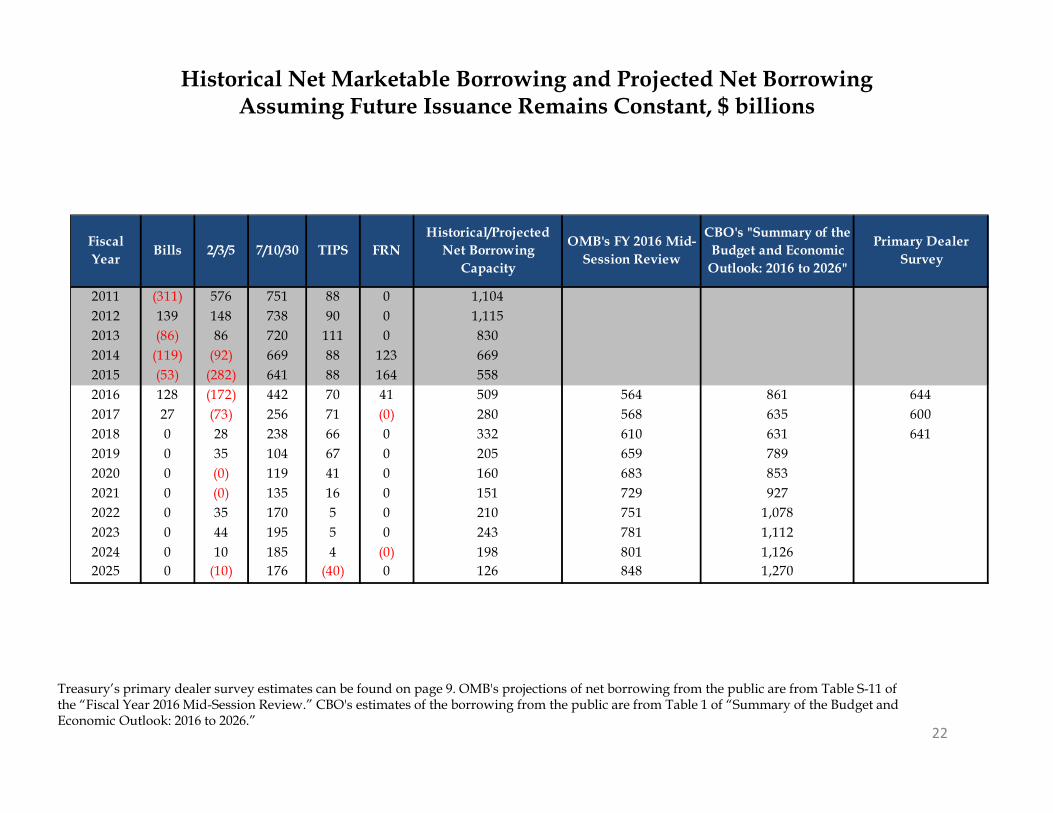
Historical Net Marketable Borrowing and Projected Net Borrowing Assuming Future Issuance Remains Constant, $ billions
Treasury’s primary dealer survey estimates can be found on page 9. OMB's projections of net borrowing from the public are from Table S-11 of the “Fiscal Year 2016 Mid-Session Review.” CBO's estimates of the borrowing from the public are from Table 1 of “Summary of the Budget and Economic Outlook: 2016 to 2026.”
Fiscal Year Bills 2/3/5 7/10/30 TIPS FRN
Historical/Projected Net Borrowing
Capacity
OMB's FY 2016 Mid-Session Review
CBO's "Summary of the Budget and Economic
Outlook: 2016 to 2026"
Primary Dealer Survey
2011 (311) 576 751 88 0 1,104 2012 139 148 738 90 0 1,115 2013 (86) 86 720 111 0 830 2014 (119) (92) 669 88 123 669 2015 (53) (282) 641 88 164 558 2016 128 (172) 442 70 41 509 564 861 644 2017 27 (73) 256 71 (0) 280 568 635 600 2018 0 28 238 66 0 332 610 631 641 2019 0 35 104 67 0 205 659 789 2020 0 (0) 119 41 0 160 683 853 2021 0 (0) 135 16 0 151 729 927 2022 0 35 170 5 0 210 751 1,078 2023 0 44 195 5 0 243 781 1,112 2024 0 10 185 4 (0) 198 801 1,126 2025 0 (10) 176 (40) 0 126 848 1,270

Section IV:Portfolio Metrics
23
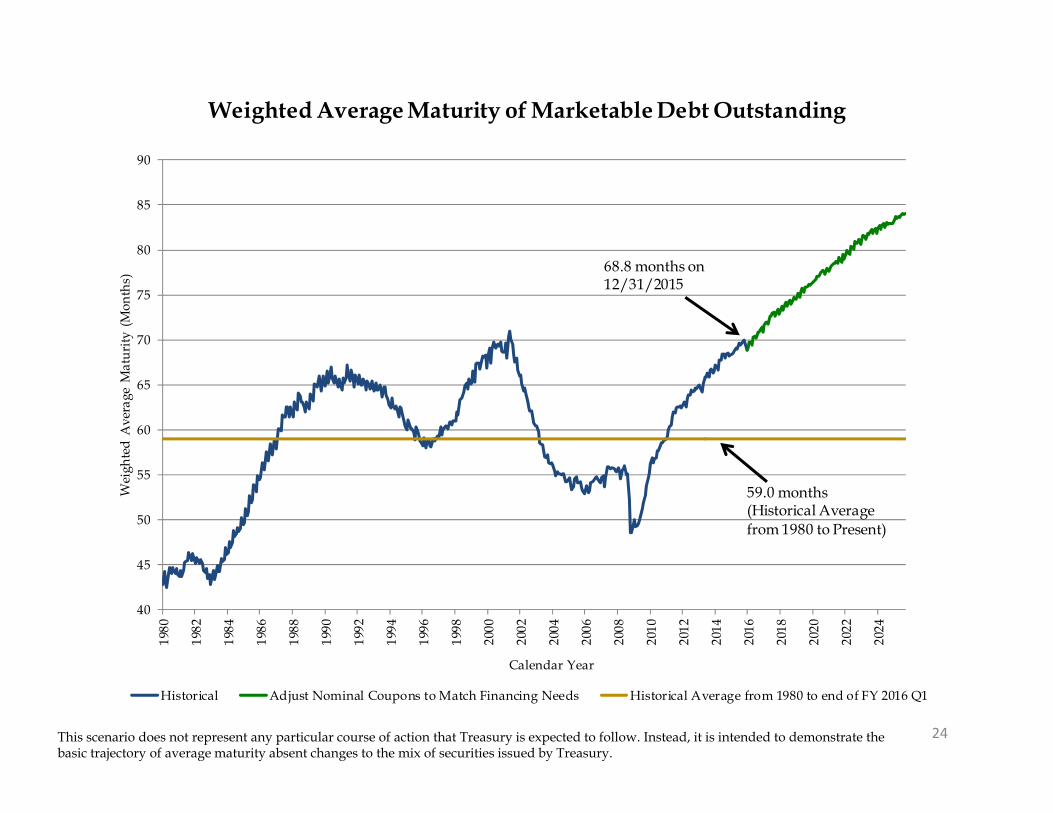
24This scenario does not represent any particular course of action that Treasury is expected to follow. Instead, it is intended to demonstrate the basic trajectory of average maturity absent changes to the mix of securities issued by Treasury.
40
45
50
55
60
65
70
75
80
85
9019
80
1982
1984
1986
1988
1990
1992
1994
1996
1998
2000
2002
2004
2006
2008
2010
2012
2014
2016
2018
2020
2022
2024
Wei
ghte
d A
vera
ge M
atur
ity (
Mon
ths)
Calendar Year
Weighted Average Maturity of Marketable Debt Outstanding
Historical Adjust Nominal Coupons to Match Financing Needs Historical Average from 1980 to end of FY 2016 Q1
68.8 months on12/31/2015
59.0 months(Historical Averagefrom 1980 to Present)
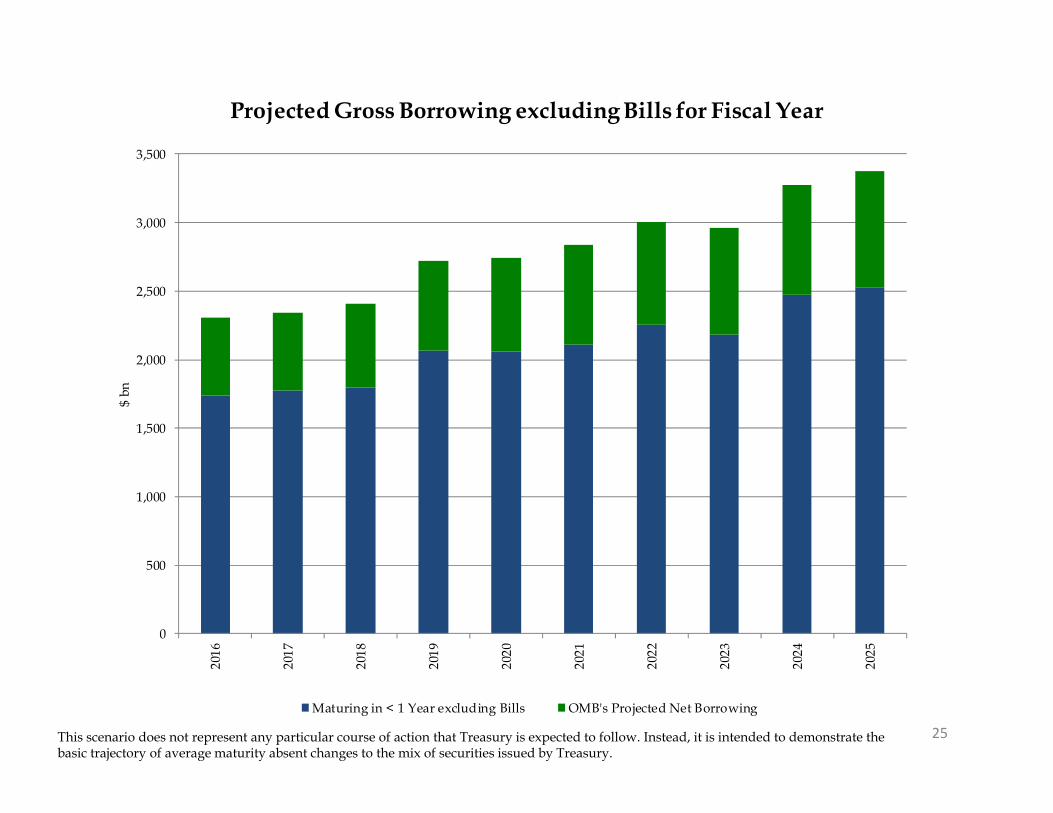
25This scenario does not represent any particular course of action that Treasury is expected to follow. Instead, it is intended to demonstrate the basic trajectory of average maturity absent changes to the mix of securities issued by Treasury.
0
500
1,000
1,500
2,000
2,500
3,000
3,500
2016
2017
2018
2019
2020
2021
2022
2023
2024
2025
$ bn
Projected Gross Borrowing excluding Bills for Fiscal Year
Maturing in < 1 Year excluding Bills OMB's Projected Net Borrowing
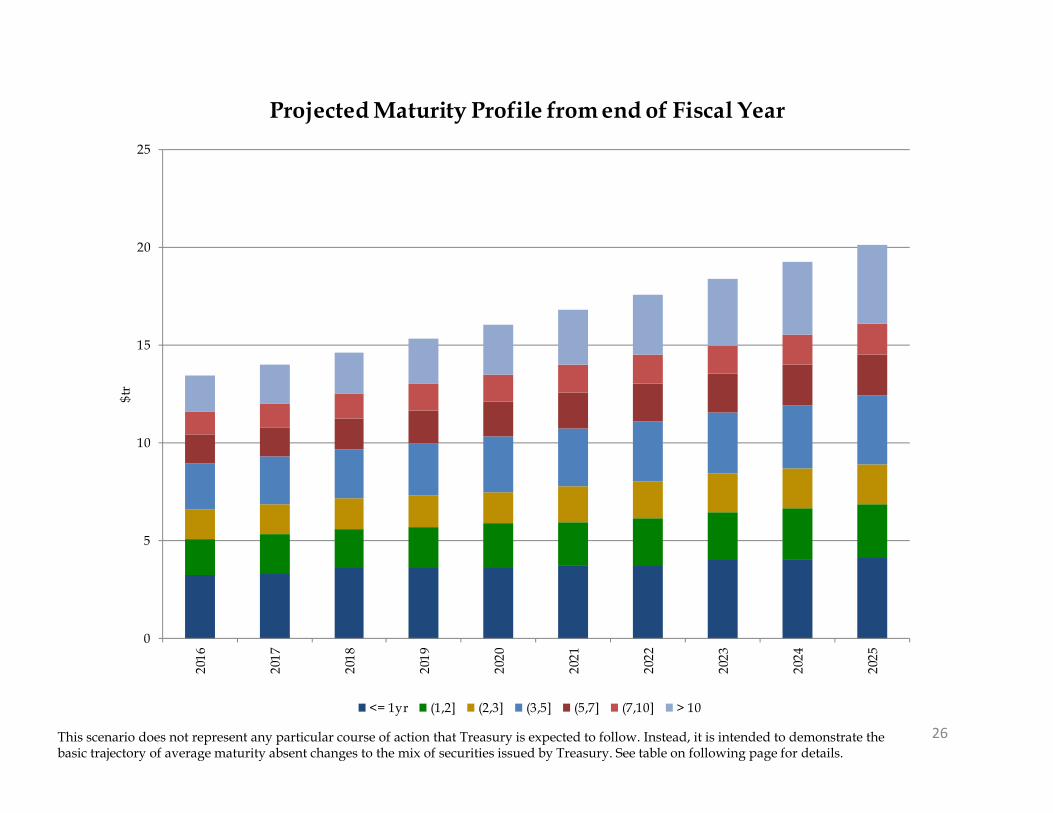
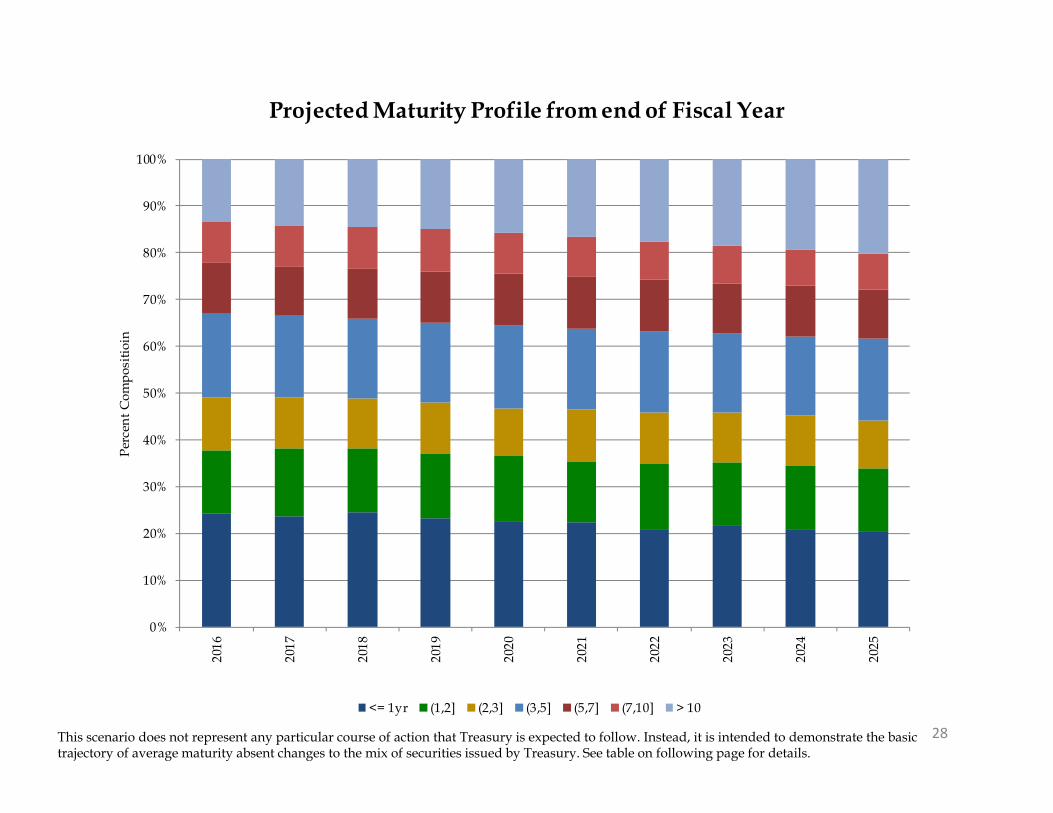
26This scenario does not represent any particular course of action that Treasury is expected to follow. Instead, it is intended to demonstrate the basic trajectory of average maturity absent changes to the mix of securities issued by Treasury. See table on following page for details.
0
5
10
15
20
25
2016
2017
2018
2019
2020
2021
2022
2023
2024
2025
$tr
Projected Maturity Profile from end of Fiscal Year
<= 1yr (1,2] (2,3] (3,5] (5,7] (7,10] > 10
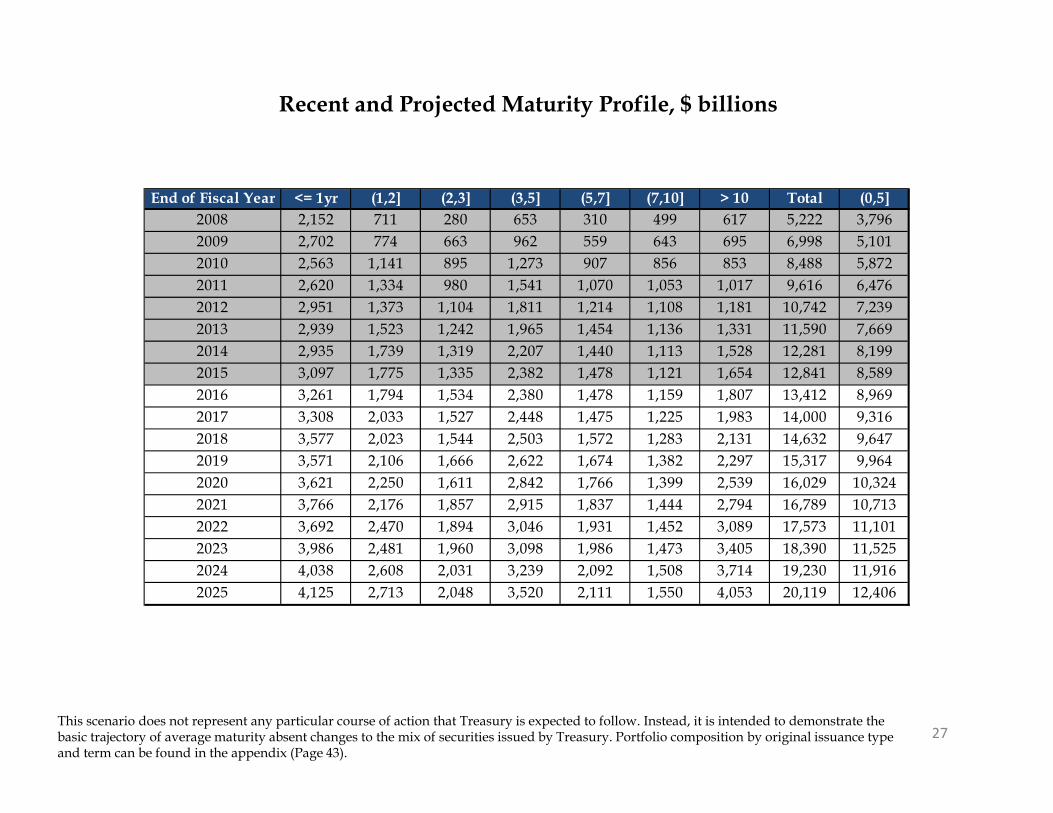
27This scenario does not represent any particular course of action that Treasury is expected to follow. Instead, it is intended to demonstrate the basic trajectory of average maturity absent changes to the mix of securities issued by Treasury. Portfolio composition by original issuance type and term can be found in the appendix (Page 43).
Recent and Projected Maturity Profile, $ billions
End of Fiscal Year <= 1yr (1,2] (2,3] (3,5] (5,7] (7,10] > 10 Total (0,5]2008 2,152 711 280 653 310 499 617 5,222 3,7962009 2,702 774 663 962 559 643 695 6,998 5,1012010 2,563 1,141 895 1,273 907 856 853 8,488 5,8722011 2,620 1,334 980 1,541 1,070 1,053 1,017 9,616 6,4762012 2,951 1,373 1,104 1,811 1,214 1,108 1,181 10,742 7,2392013 2,939 1,523 1,242 1,965 1,454 1,136 1,331 11,590 7,6692014 2,935 1,739 1,319 2,207 1,440 1,113 1,528 12,281 8,1992015 3,097 1,775 1,335 2,382 1,478 1,121 1,654 12,841 8,5892016 3,261 1,794 1,534 2,380 1,478 1,159 1,807 13,412 8,9692017 3,308 2,033 1,527 2,448 1,475 1,225 1,983 14,000 9,3162018 3,577 2,023 1,544 2,503 1,572 1,283 2,131 14,632 9,6472019 3,571 2,106 1,666 2,622 1,674 1,382 2,297 15,317 9,9642020 3,621 2,250 1,611 2,842 1,766 1,399 2,539 16,029 10,3242021 3,766 2,176 1,857 2,915 1,837 1,444 2,794 16,789 10,7132022 3,692 2,470 1,894 3,046 1,931 1,452 3,089 17,573 11,1012023 3,986 2,481 1,960 3,098 1,986 1,473 3,405 18,390 11,5252024 4,038 2,608 2,031 3,239 2,092 1,508 3,714 19,230 11,9162025 4,125 2,713 2,048 3,520 2,111 1,550 4,053 20,119 12,406
28This scenario does not represent any particular course of action that Treasury is expected to follow. Instead, it is intended to demonstrate the basic trajectory of average maturity absent changes to the mix of securities issued by Treasury. See table on following page for details.
0%
10%
20%
30%
40%
50%
60%
70%
80%
90%
100%
2016
2017
2018
2019
2020
2021
2022
2023
2024
2025
Perc
ent C
ompo
sitio
inProjected Maturity Profile from end of Fiscal Year
<= 1yr (1,2] (2,3] (3,5] (5,7] (7,10] > 10
29
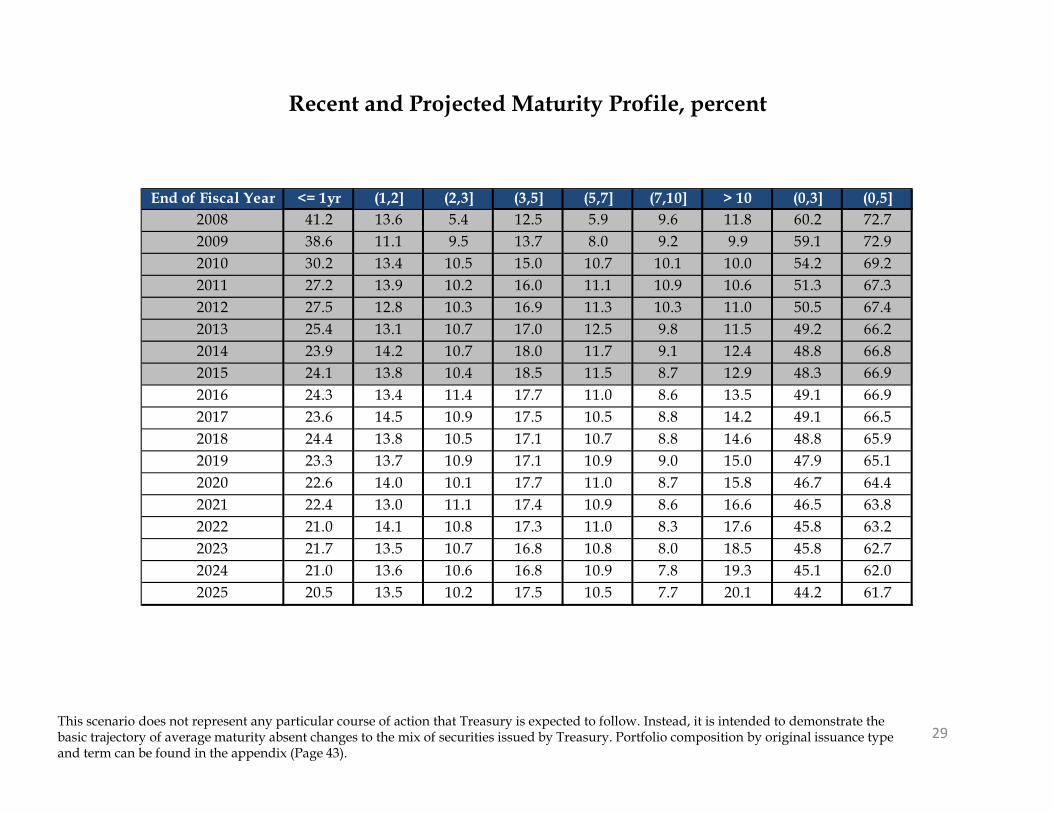
Recent and Projected Maturity Profile, percent
This scenario does not represent any particular course of action that Treasury is expected to follow. Instead, it is intended to demonstrate the basic trajectory of average maturity absent changes to the mix of securities issued by Treasury. Portfolio composition by original issuance type and term can be found in the appendix (Page 43).
End of Fiscal Year <= 1yr (1,2] (2,3] (3,5] (5,7] (7,10] > 10 (0,3] (0,5]2008 41.2 13.6 5.4 12.5 5.9 9.6 11.8 60.2 72.72009 38.6 11.1 9.5 13.7 8.0 9.2 9.9 59.1 72.92010 30.2 13.4 10.5 15.0 10.7 10.1 10.0 54.2 69.22011 27.2 13.9 10.2 16.0 11.1 10.9 10.6 51.3 67.32012 27.5 12.8 10.3 16.9 11.3 10.3 11.0 50.5 67.42013 25.4 13.1 10.7 17.0 12.5 9.8 11.5 49.2 66.22014 23.9 14.2 10.7 18.0 11.7 9.1 12.4 48.8 66.82015 24.1 13.8 10.4 18.5 11.5 8.7 12.9 48.3 66.92016 24.3 13.4 11.4 17.7 11.0 8.6 13.5 49.1 66.92017 23.6 14.5 10.9 17.5 10.5 8.8 14.2 49.1 66.52018 24.4 13.8 10.5 17.1 10.7 8.8 14.6 48.8 65.92019 23.3 13.7 10.9 17.1 10.9 9.0 15.0 47.9 65.12020 22.6 14.0 10.1 17.7 11.0 8.7 15.8 46.7 64.42021 22.4 13.0 11.1 17.4 10.9 8.6 16.6 46.5 63.82022 21.0 14.1 10.8 17.3 11.0 8.3 17.6 45.8 63.22023 21.7 13.5 10.7 16.8 10.8 8.0 18.5 45.8 62.72024 21.0 13.6 10.6 16.8 10.9 7.8 19.3 45.1 62.02025 20.5 13.5 10.2 17.5 10.5 7.7 20.1 44.2 61.7

Section V:Demand
30
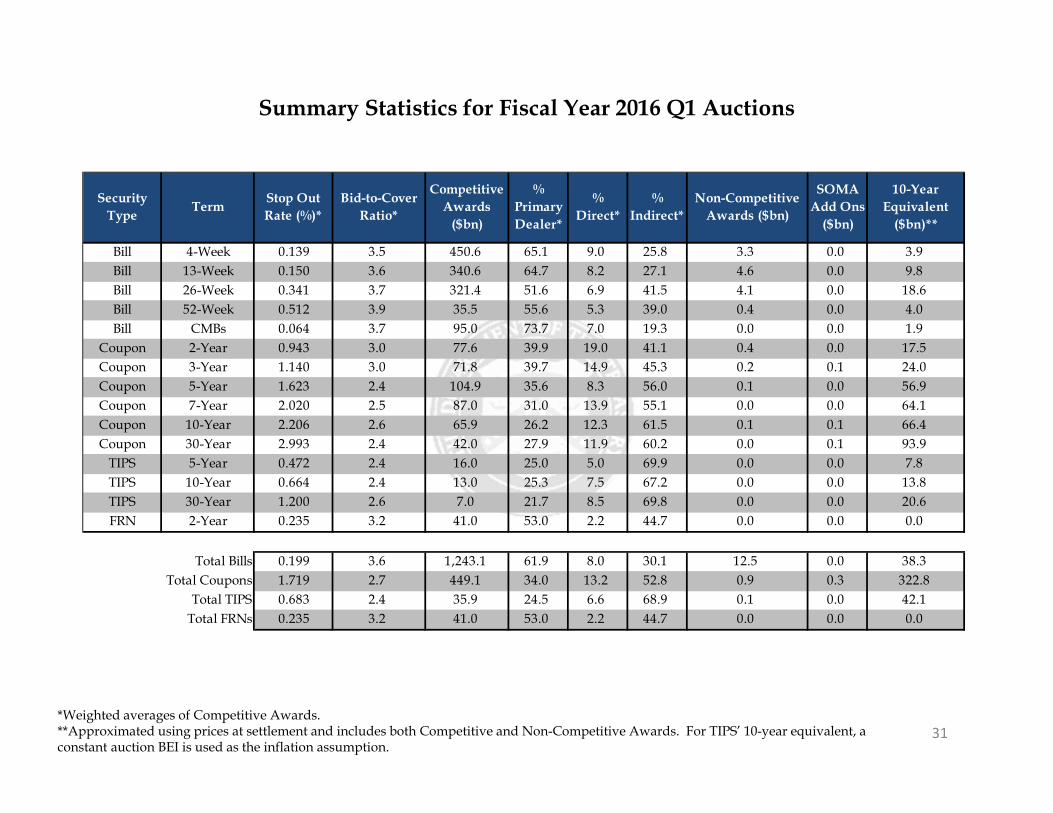
31*Weighted averages of Competitive Awards.**Approximated using prices at settlement and includes both Competitive and Non-Competitive Awards. For TIPS’ 10-year equivalent, a constant auction BEI is used as the inflation assumption.
Summary Statistics for Fiscal Year 2016 Q1 Auctions
Security Type Term Stop Out
Rate (%)*Bid-to-Cover
Ratio*
Competitive Awards
($bn)
% Primary Dealer*
% Direct*
% Indirect*
Non-Competitive Awards ($bn)
SOMA Add Ons
($bn)
10-Year Equivalent
($bn)**
Bill 4-Week 0.139 3.5 450.6 65.1 9.0 25.8 3.3 0.0 3.9Bill 13-Week 0.150 3.6 340.6 64.7 8.2 27.1 4.6 0.0 9.8Bill 26-Week 0.341 3.7 321.4 51.6 6.9 41.5 4.1 0.0 18.6Bill 52-Week 0.512 3.9 35.5 55.6 5.3 39.0 0.4 0.0 4.0Bill CMBs 0.064 3.7 95.0 73.7 7.0 19.3 0.0 0.0 1.9
Coupon 2-Year 0.943 3.0 77.6 39.9 19.0 41.1 0.4 0.0 17.5Coupon 3-Year 1.140 3.0 71.8 39.7 14.9 45.3 0.2 0.1 24.0Coupon 5-Year 1.623 2.4 104.9 35.6 8.3 56.0 0.1 0.0 56.9Coupon 7-Year 2.020 2.5 87.0 31.0 13.9 55.1 0.0 0.0 64.1Coupon 10-Year 2.206 2.6 65.9 26.2 12.3 61.5 0.1 0.1 66.4Coupon 30-Year 2.993 2.4 42.0 27.9 11.9 60.2 0.0 0.1 93.9
TIPS 5-Year 0.472 2.4 16.0 25.0 5.0 69.9 0.0 0.0 7.8TIPS 10-Year 0.664 2.4 13.0 25.3 7.5 67.2 0.0 0.0 13.8TIPS 30-Year 1.200 2.6 7.0 21.7 8.5 69.8 0.0 0.0 20.6FRN 2-Year 0.235 3.2 41.0 53.0 2.2 44.7 0.0 0.0 0.0
Total Bills 0.199 3.6 1,243.1 61.9 8.0 30.1 12.5 0.0 38.3Total Coupons 1.719 2.7 449.1 34.0 13.2 52.8 0.9 0.3 322.8
Total TIPS 0.683 2.4 35.9 24.5 6.6 68.9 0.1 0.0 42.1Total FRNs 0.235 3.2 41.0 53.0 2.2 44.7 0.0 0.0 0.0
1
1.5
2
2.5
3
3.5
4
4.5
5
5.5
6D
ec-0
5
Dec
-06
Dec
-07
Dec
-08
Dec
-09
Dec
-10
Dec
-11
Dec
-12
Dec
-13
Dec
-14
Dec
-15
Bid-
to-C
over
Rat
ioBid-to-Cover Ratios for Treasury Bills
4-Week (13-week moving average) 13-Week (13-week moving average)
26-Week (13-week moving average) 52-Week (6-month moving average)
32
2
2.5
3
3.5
4
4.5
5
5.5
6Ja
n-14
Feb-
14
Mar
-14
Apr
-14
May
-14
Jun-
14
Jul-
14
Aug
-14
Sep-
14
Oct
-14
Nov
-14
Dec
-14
Jan-
15
Feb-
15
Mar
-15
Apr
-15
May
-15
Jun-
15
Jul-
15
Aug
-15
Sep-
15
Oct
-15
Nov
-15
Dec
-15
Bid-
to-C
over
Rat
ioBid-to-Cover Ratios for FRNs
33
34
1
1.5
2
2.5
3
3.5
4
4.5D
ec-1
0
Mar
-11
Jun-
11
Sep-
11
Dec
-11
Mar
-12
Jun-
12
Sep-
12
Dec
-12
Mar
-13
Jun-
13
Sep-
13
Dec
-13
Mar
-14
Jun-
14
Sep-
14
Dec
-14
Mar
-15
Jun-
15
Sep-
15
Dec
-15
Bid-
to-C
over
Rat
ioBid-to-Cover Ratios for 2-, 3-, and 5-Year Nominal Securities
(6-Month Moving Average)
2-Year 3-Year 5-Year
35
1
1.5
2
2.5
3
3.5D
ec-1
0
Mar
-11
Jun-
11
Sep-
11
Dec
-11
Mar
-12
Jun-
12
Sep-
12
Dec
-12
Mar
-13
Jun-
13
Sep-
13
Dec
-13
Mar
-14
Jun-
14
Sep-
14
Dec
-14
Mar
-15
Jun-
15
Sep-
15
Dec
-15
Bid-
to-C
over
Rat
ioBid-to-Cover Ratios for 7-, 10-, and 30-Year Nominal Securities
(6-Month Moving Average)
7-Year 10-Year 30-Year
1
1.5
2
2.5
3
3.5D
ec-0
1
Dec
-02
Dec
-03
Dec
-04
Dec
-05
Dec
-06
Dec
-07
Dec
-08
Dec
-09
Dec
-10
Dec
-11
Dec
-12
Dec
-13
Dec
-14
Dec
-15
Bid-
to-C
over
Rat
ioBid-to-Cover Ratios for TIPS
5-Year 10-Year (6-month moving average) 20-Year 30-Year
36
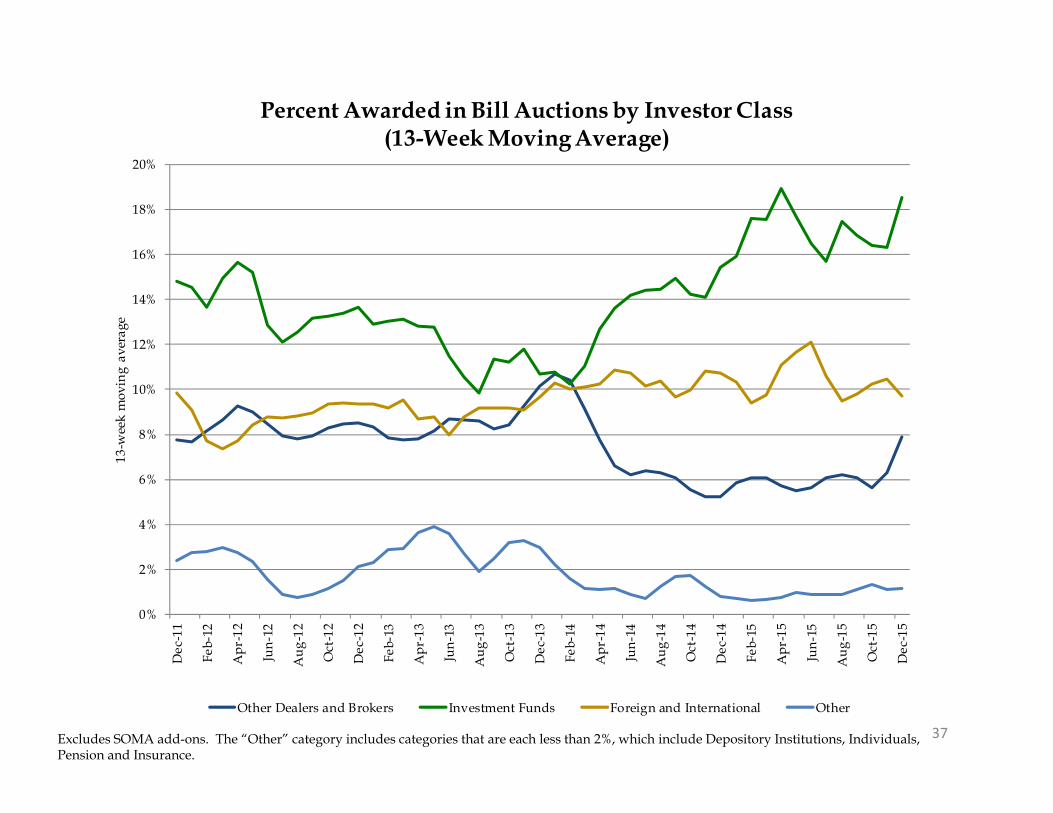
37Excludes SOMA add-ons. The “Other” category includes categories that are each less than 2%, which include Depository Institutions, Individuals, Pension and Insurance.
0%
2%
4%
6%
8%
10%
12%
14%
16%
18%
20%D
ec-1
1
Feb-
12
Apr
-12
Jun-
12
Aug
-12
Oct
-12
Dec
-12
Feb-
13
Apr
-13
Jun-
13
Aug
-13
Oct
-13
Dec
-13
Feb-
14
Apr
-14
Jun-
14
Aug
-14
Oct
-14
Dec
-14
Feb-
15
Apr
-15
Jun-
15
Aug
-15
Oct
-15
Dec
-15
13-w
eek
mov
ing
aver
age
Percent Awarded in Bill Auctions by Investor Class (13-Week Moving Average)
Other Dealers and Brokers Investment Funds Foreign and International Other
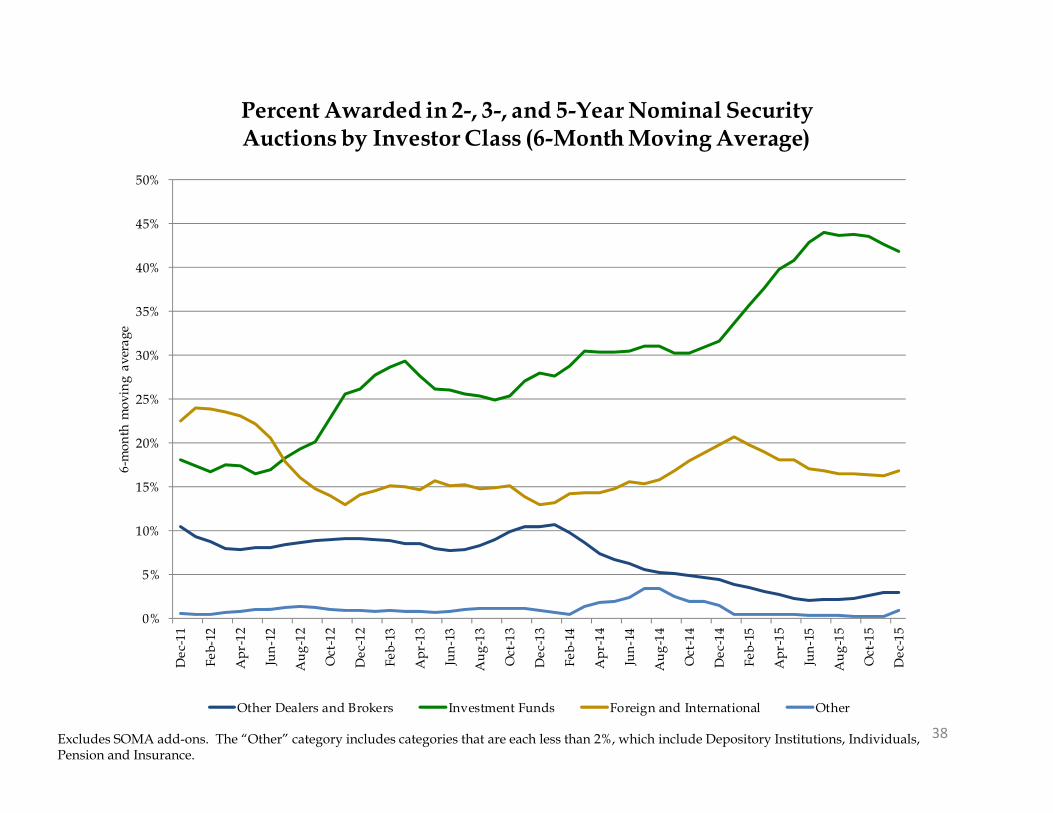
38Excludes SOMA add-ons. The “Other” category includes categories that are each less than 2%, which include Depository Institutions, Individuals, Pension and Insurance.
0%
5%
10%
15%
20%
25%
30%
35%
40%
45%
50%D
ec-1
1
Feb-
12
Apr
-12
Jun-
12
Aug
-12
Oct
-12
Dec
-12
Feb-
13
Apr
-13
Jun-
13
Aug
-13
Oct
-13
Dec
-13
Feb-
14
Apr
-14
Jun-
14
Aug
-14
Oct
-14
Dec
-14
Feb-
15
Apr
-15
Jun-
15
Aug
-15
Oct
-15
Dec
-15
6-m
onth
mov
ing
aver
age
Percent Awarded in 2-, 3-, and 5-Year Nominal Security Auctions by Investor Class (6-Month Moving Average)
Other Dealers and Brokers Investment Funds Foreign and International Other
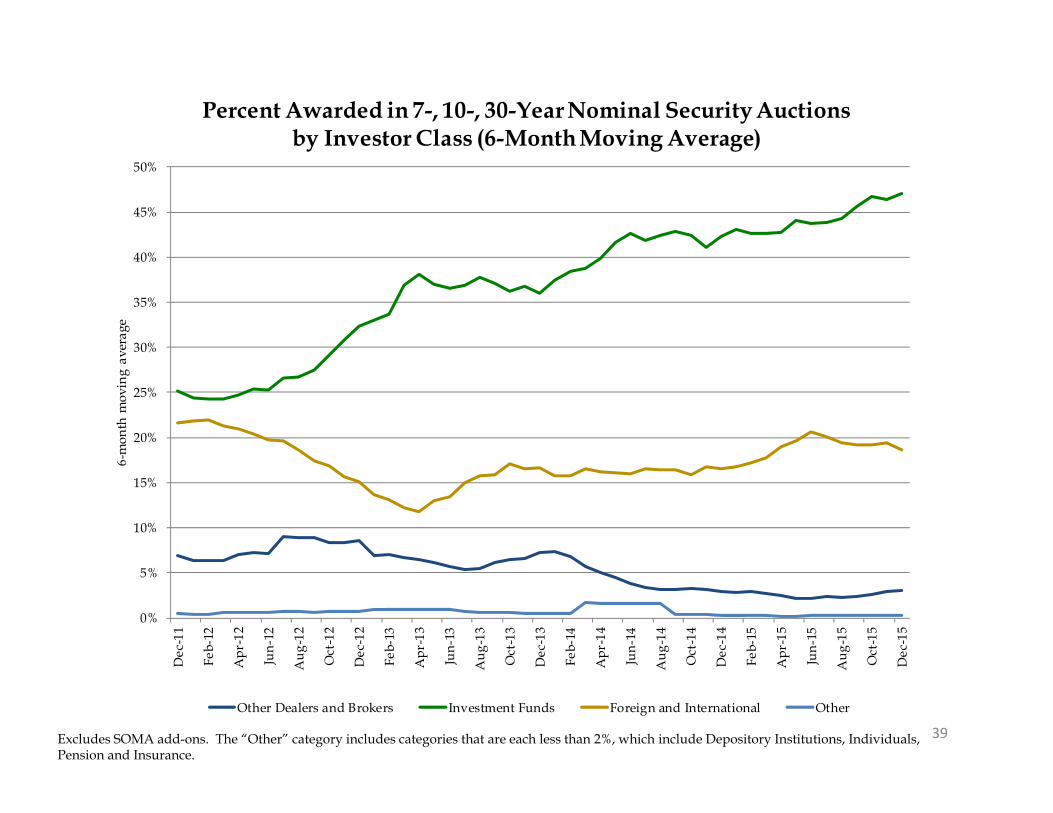
39Excludes SOMA add-ons. The “Other” category includes categories that are each less than 2%, which include Depository Institutions, Individuals, Pension and Insurance.
0%
5%
10%
15%
20%
25%
30%
35%
40%
45%
50%D
ec-1
1
Feb-
12
Apr
-12
Jun-
12
Aug
-12
Oct
-12
Dec
-12
Feb-
13
Apr
-13
Jun-
13
Aug
-13
Oct
-13
Dec
-13
Feb-
14
Apr
-14
Jun-
14
Aug
-14
Oct
-14
Dec
-14
Feb-
15
Apr
-15
Jun-
15
Aug
-15
Oct
-15
Dec
-15
6-m
onth
mov
ing
aver
age
Percent Awarded in 7-, 10-, 30-Year Nominal Security Auctions by Investor Class (6-Month Moving Average)
Other Dealers and Brokers Investment Funds Foreign and International Other
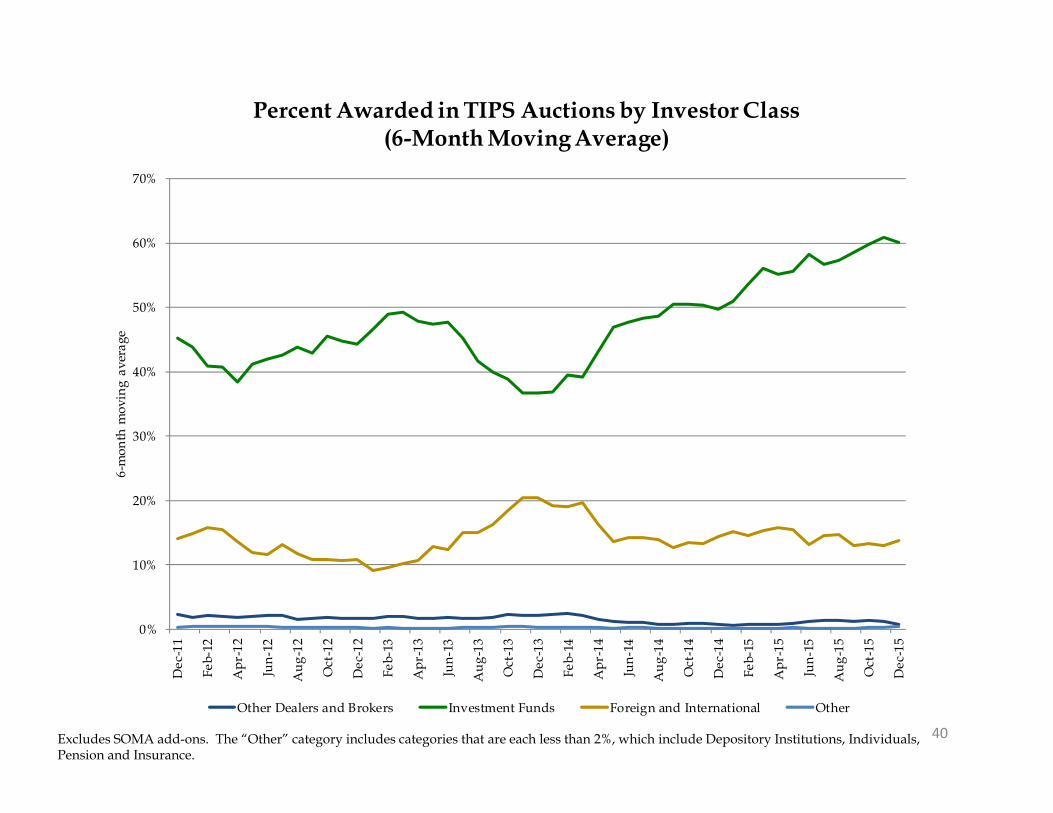
40Excludes SOMA add-ons. The “Other” category includes categories that are each less than 2%, which include Depository Institutions, Individuals, Pension and Insurance.
0%
10%
20%
30%
40%
50%
60%
70%D
ec-1
1
Feb-
12
Apr
-12
Jun-
12
Aug
-12
Oct
-12
Dec
-12
Feb-
13
Apr
-13
Jun-
13
Aug
-13
Oct
-13
Dec
-13
Feb-
14
Apr
-14
Jun-
14
Aug
-14
Oct
-14
Dec
-14
Feb-
15
Apr
-15
Jun-
15
Aug
-15
Oct
-15
Dec
-15
6-m
onth
mov
ing
aver
age
Percent Awarded in TIPS Auctions by Investor Class(6-Month Moving Average)
Other Dealers and Brokers Investment Funds Foreign and International Other
41Excludes SOMA add-ons.
20%
30%
40%
50%
60%
70%
80%D
ec-1
1
Feb-
12
Apr
-12
Jun-
12
Aug
-12
Oct
-12
Dec
-12
Feb-
13
Apr
-13
Jun-
13
Aug
-13
Oct
-13
Dec
-13
Feb-
14
Apr
-14
Jun-
14
Aug
-14
Oct
-14
Dec
-14
Feb-
15
Apr
-15
Jun-
15
Aug
-15
Oct
-15
Dec
-15
% o
f Tot
al C
ompe
titiv
e A
mou
nt A
war
ded
Primary Dealer Awards at Auction
4/13/26-Week (13-week moving average) 52-Week (6-month moving average)
2/3/5 (6-month moving average) 7/10/30 (6-month moving average)
TIPS (6-month-moving average)
42Excludes SOMA add-ons.
0%
5%
10%
15%
20%
25%
30%
Dec
-11
Feb-
12
Apr
-12
Jun-
12
Aug
-12
Oct
-12
Dec
-12
Feb-
13
Apr
-13
Jun-
13
Aug
-13
Oct
-13
Dec
-13
Feb-
14
Apr
-14
Jun-
14
Aug
-14
Oct
-14
Dec
-14
Feb-
15
Apr
-15
Jun-
15
Aug
-15
Oct
-15
Dec
-15
% o
f Tot
al C
ompe
titiv
e A
mou
nt A
war
ded
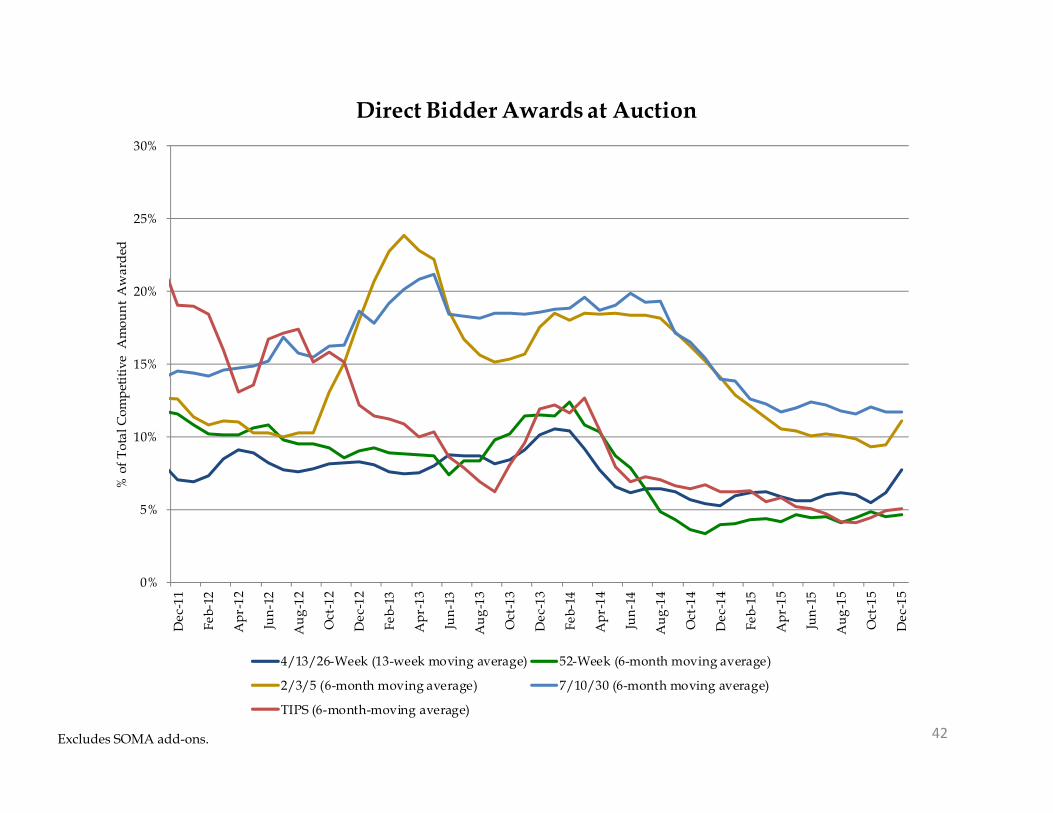
Direct Bidder Awards at Auction
4/13/26-Week (13-week moving average) 52-Week (6-month moving average)
2/3/5 (6-month moving average) 7/10/30 (6-month moving average)
TIPS (6-month-moving average)
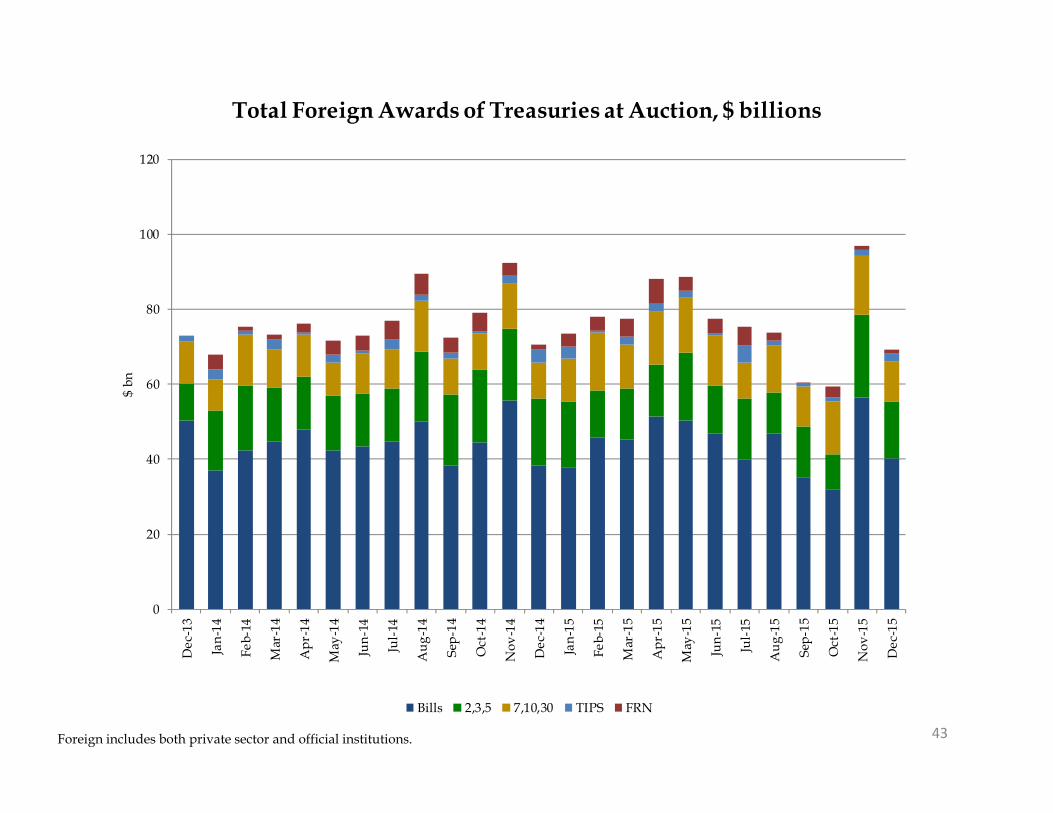
43Foreign includes both private sector and official institutions.
0
20
40
60
80
100
120
Dec
-13
Jan-
14
Feb-
14
Mar
-14
Apr
-14
May
-14
Jun-
14
Jul-
14
Aug
-14
Sep-
14
Oct
-14
Nov
-14
Dec
-14
Jan-
15
Feb-
15
Mar
-15
Apr
-15
May
-15
Jun-
15
Jul-
15
Aug
-15
Sep-
15
Oct
-15
Nov
-15
Dec
-15
$ bn
Total Foreign Awards of Treasuries at Auction, $ billions
Bills 2,3,5 7,10,30 TIPS FRN

Appendix
44
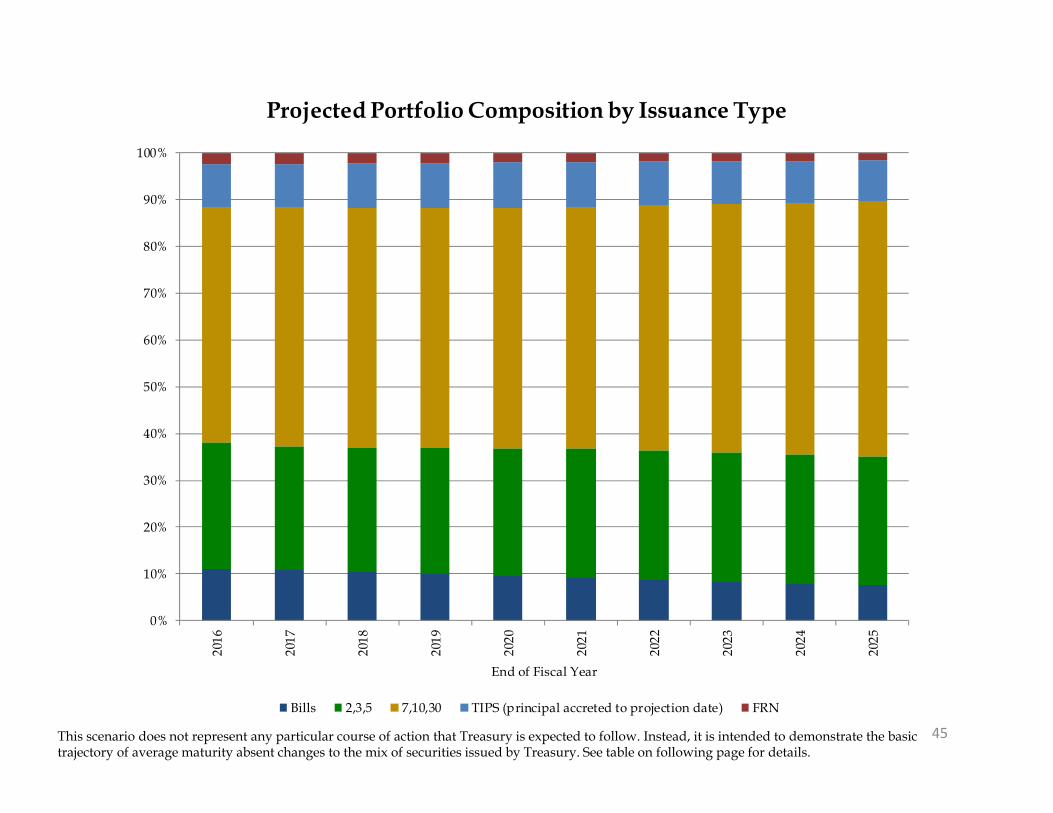
45This scenario does not represent any particular course of action that Treasury is expected to follow. Instead, it is intended to demonstrate the basic trajectory of average maturity absent changes to the mix of securities issued by Treasury. See table on following page for details.
0%
10%
20%
30%
40%
50%
60%
70%
80%
90%
100%
2016
2017
2018
2019
2020
2021
2022
2023
2024
2025
End of Fiscal Year
Projected Portfolio Composition by Issuance Type
Bills 2,3,5 7,10,30 TIPS (principal accreted to projection date) FRN
46
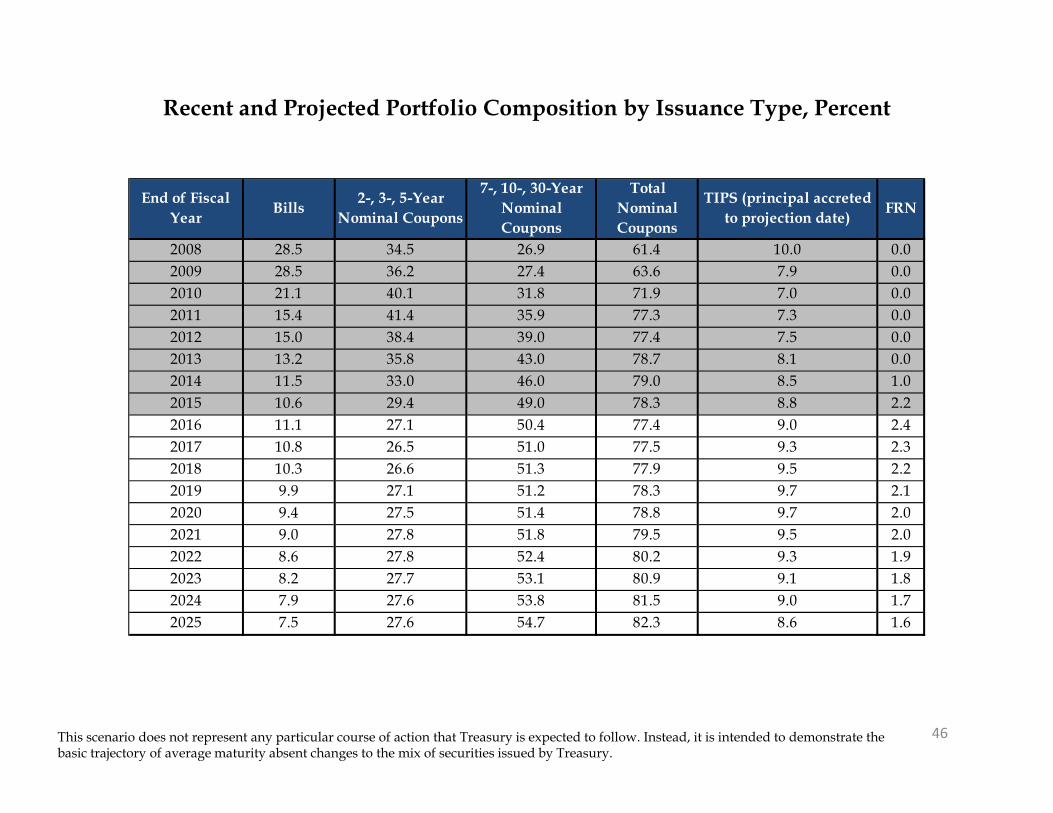
Recent and Projected Portfolio Composition by Issuance Type, Percent
This scenario does not represent any particular course of action that Treasury is expected to follow. Instead, it is intended to demonstrate the basic trajectory of average maturity absent changes to the mix of securities issued by Treasury.
End of Fiscal Year Bills 2-, 3-, 5-Year
Nominal Coupons
7-, 10-, 30-Year Nominal Coupons
Total Nominal Coupons
TIPS (principal accreted to projection date) FRN
2008 28.5 34.5 26.9 61.4 10.0 0.02009 28.5 36.2 27.4 63.6 7.9 0.02010 21.1 40.1 31.8 71.9 7.0 0.02011 15.4 41.4 35.9 77.3 7.3 0.02012 15.0 38.4 39.0 77.4 7.5 0.02013 13.2 35.8 43.0 78.7 8.1 0.02014 11.5 33.0 46.0 79.0 8.5 1.02015 10.6 29.4 49.0 78.3 8.8 2.22016 11.1 27.1 50.4 77.4 9.0 2.42017 10.8 26.5 51.0 77.5 9.3 2.32018 10.3 26.6 51.3 77.9 9.5 2.22019 9.9 27.1 51.2 78.3 9.7 2.12020 9.4 27.5 51.4 78.8 9.7 2.02021 9.0 27.8 51.8 79.5 9.5 2.02022 8.6 27.8 52.4 80.2 9.3 1.92023 8.2 27.7 53.1 80.9 9.1 1.82024 7.9 27.6 53.8 81.5 9.0 1.72025 7.5 27.6 54.7 82.3 8.6 1.6
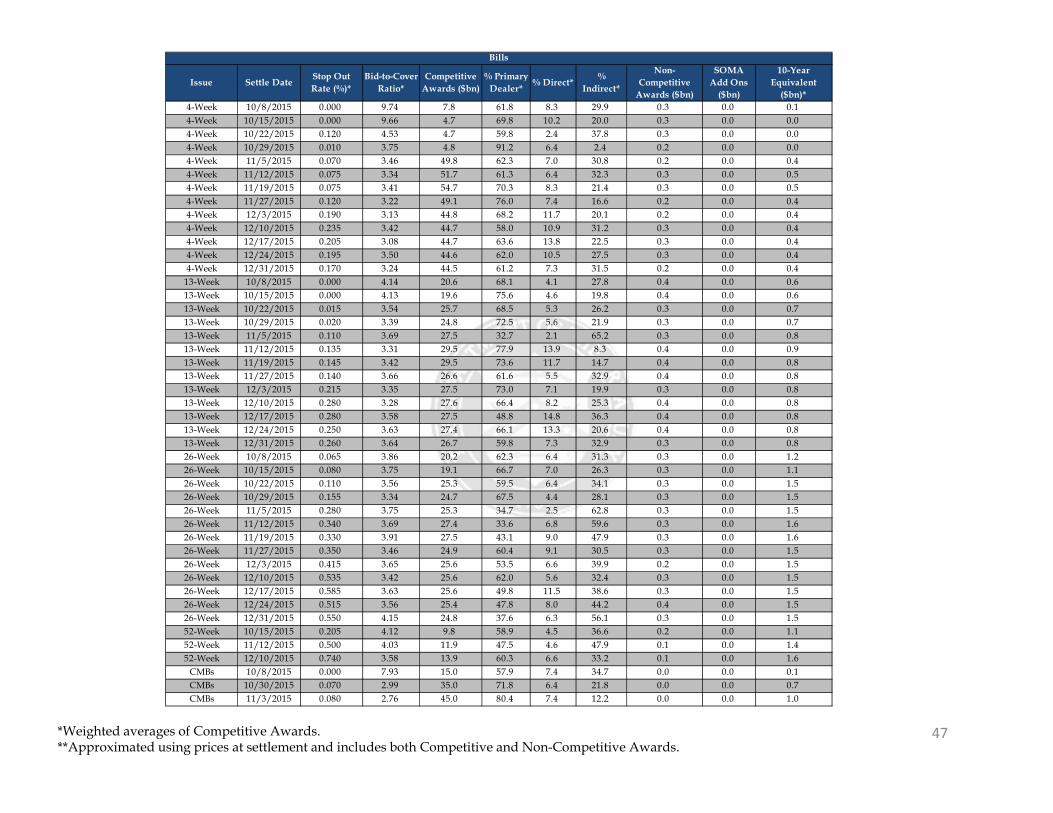
47*Weighted averages of Competitive Awards.**Approximated using prices at settlement and includes both Competitive and Non-Competitive Awards.
Issue Settle Date Stop Out Rate (%)*
Bid-to-Cover Ratio*
Competitive Awards ($bn)
% Primary Dealer* % Direct* %
Indirect*
Non-Competitive
Awards ($bn)
SOMA Add Ons
($bn)
10-Year Equivalent
($bn)*4-Week 10/8/2015 0.000 9.74 7.8 61.8 8.3 29.9 0.3 0.0 0.14-Week 10/15/2015 0.000 9.66 4.7 69.8 10.2 20.0 0.3 0.0 0.04-Week 10/22/2015 0.120 4.53 4.7 59.8 2.4 37.8 0.3 0.0 0.04-Week 10/29/2015 0.010 3.75 4.8 91.2 6.4 2.4 0.2 0.0 0.04-Week 11/5/2015 0.070 3.46 49.8 62.3 7.0 30.8 0.2 0.0 0.44-Week 11/12/2015 0.075 3.34 51.7 61.3 6.4 32.3 0.3 0.0 0.54-Week 11/19/2015 0.075 3.41 54.7 70.3 8.3 21.4 0.3 0.0 0.54-Week 11/27/2015 0.120 3.22 49.1 76.0 7.4 16.6 0.2 0.0 0.44-Week 12/3/2015 0.190 3.13 44.8 68.2 11.7 20.1 0.2 0.0 0.44-Week 12/10/2015 0.235 3.42 44.7 58.0 10.9 31.2 0.3 0.0 0.44-Week 12/17/2015 0.205 3.08 44.7 63.6 13.8 22.5 0.3 0.0 0.44-Week 12/24/2015 0.195 3.50 44.6 62.0 10.5 27.5 0.3 0.0 0.44-Week 12/31/2015 0.170 3.24 44.5 61.2 7.3 31.5 0.2 0.0 0.4
13-Week 10/8/2015 0.000 4.14 20.6 68.1 4.1 27.8 0.4 0.0 0.613-Week 10/15/2015 0.000 4.13 19.6 75.6 4.6 19.8 0.4 0.0 0.613-Week 10/22/2015 0.015 3.54 25.7 68.5 5.3 26.2 0.3 0.0 0.713-Week 10/29/2015 0.020 3.39 24.8 72.5 5.6 21.9 0.3 0.0 0.713-Week 11/5/2015 0.110 3.69 27.5 32.7 2.1 65.2 0.3 0.0 0.813-Week 11/12/2015 0.135 3.31 29.5 77.9 13.9 8.3 0.4 0.0 0.913-Week 11/19/2015 0.145 3.42 29.5 73.6 11.7 14.7 0.4 0.0 0.813-Week 11/27/2015 0.140 3.66 26.6 61.6 5.5 32.9 0.4 0.0 0.813-Week 12/3/2015 0.215 3.35 27.5 73.0 7.1 19.9 0.3 0.0 0.813-Week 12/10/2015 0.280 3.28 27.6 66.4 8.2 25.3 0.4 0.0 0.813-Week 12/17/2015 0.280 3.58 27.5 48.8 14.8 36.3 0.4 0.0 0.813-Week 12/24/2015 0.250 3.63 27.4 66.1 13.3 20.6 0.4 0.0 0.813-Week 12/31/2015 0.260 3.64 26.7 59.8 7.3 32.9 0.3 0.0 0.826-Week 10/8/2015 0.065 3.86 20.2 62.3 6.4 31.3 0.3 0.0 1.226-Week 10/15/2015 0.080 3.75 19.1 66.7 7.0 26.3 0.3 0.0 1.126-Week 10/22/2015 0.110 3.56 25.3 59.5 6.4 34.1 0.3 0.0 1.526-Week 10/29/2015 0.155 3.34 24.7 67.5 4.4 28.1 0.3 0.0 1.526-Week 11/5/2015 0.280 3.75 25.3 34.7 2.5 62.8 0.3 0.0 1.526-Week 11/12/2015 0.340 3.69 27.4 33.6 6.8 59.6 0.3 0.0 1.626-Week 11/19/2015 0.330 3.91 27.5 43.1 9.0 47.9 0.3 0.0 1.626-Week 11/27/2015 0.350 3.46 24.9 60.4 9.1 30.5 0.3 0.0 1.526-Week 12/3/2015 0.415 3.65 25.6 53.5 6.6 39.9 0.2 0.0 1.526-Week 12/10/2015 0.535 3.42 25.6 62.0 5.6 32.4 0.3 0.0 1.526-Week 12/17/2015 0.585 3.63 25.6 49.8 11.5 38.6 0.3 0.0 1.526-Week 12/24/2015 0.515 3.56 25.4 47.8 8.0 44.2 0.4 0.0 1.526-Week 12/31/2015 0.550 4.15 24.8 37.6 6.3 56.1 0.3 0.0 1.552-Week 10/15/2015 0.205 4.12 9.8 58.9 4.5 36.6 0.2 0.0 1.152-Week 11/12/2015 0.500 4.03 11.9 47.5 4.6 47.9 0.1 0.0 1.452-Week 12/10/2015 0.740 3.58 13.9 60.3 6.6 33.2 0.1 0.0 1.6
CMBs 10/8/2015 0.000 7.93 15.0 57.9 7.4 34.7 0.0 0.0 0.1CMBs 10/30/2015 0.070 2.99 35.0 71.8 6.4 21.8 0.0 0.0 0.7CMBs 11/3/2015 0.080 2.76 45.0 80.4 7.4 12.2 0.0 0.0 1.0
Bills
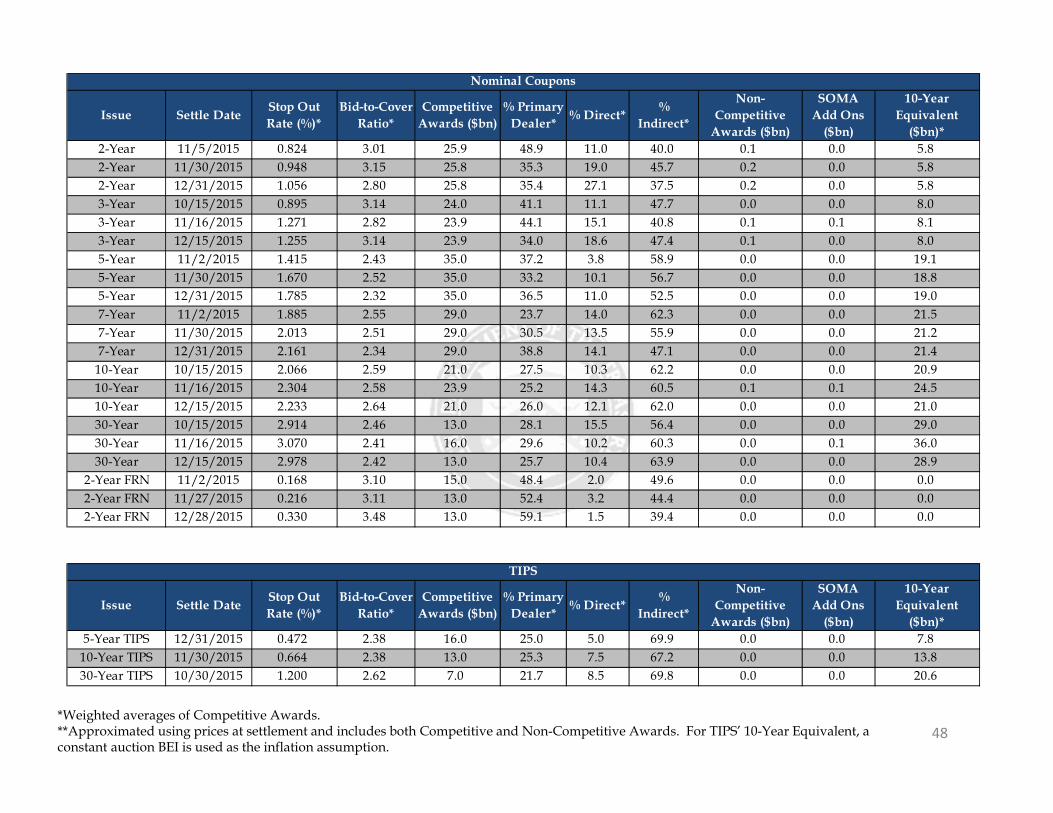
48*Weighted averages of Competitive Awards.**Approximated using prices at settlement and includes both Competitive and Non-Competitive Awards. For TIPS’ 10-Year Equivalent, a constant auction BEI is used as the inflation assumption.
Issue Settle Date Stop Out Rate (%)*
Bid-to-Cover Ratio*
Competitive Awards ($bn)
% Primary Dealer* % Direct* %
Indirect*
Non-Competitive
Awards ($bn)
SOMA Add Ons
($bn)
10-Year Equivalent
($bn)*2-Year 11/5/2015 0.824 3.01 25.9 48.9 11.0 40.0 0.1 0.0 5.82-Year 11/30/2015 0.948 3.15 25.8 35.3 19.0 45.7 0.2 0.0 5.82-Year 12/31/2015 1.056 2.80 25.8 35.4 27.1 37.5 0.2 0.0 5.83-Year 10/15/2015 0.895 3.14 24.0 41.1 11.1 47.7 0.0 0.0 8.03-Year 11/16/2015 1.271 2.82 23.9 44.1 15.1 40.8 0.1 0.1 8.13-Year 12/15/2015 1.255 3.14 23.9 34.0 18.6 47.4 0.1 0.0 8.05-Year 11/2/2015 1.415 2.43 35.0 37.2 3.8 58.9 0.0 0.0 19.15-Year 11/30/2015 1.670 2.52 35.0 33.2 10.1 56.7 0.0 0.0 18.85-Year 12/31/2015 1.785 2.32 35.0 36.5 11.0 52.5 0.0 0.0 19.07-Year 11/2/2015 1.885 2.55 29.0 23.7 14.0 62.3 0.0 0.0 21.57-Year 11/30/2015 2.013 2.51 29.0 30.5 13.5 55.9 0.0 0.0 21.27-Year 12/31/2015 2.161 2.34 29.0 38.8 14.1 47.1 0.0 0.0 21.4
10-Year 10/15/2015 2.066 2.59 21.0 27.5 10.3 62.2 0.0 0.0 20.910-Year 11/16/2015 2.304 2.58 23.9 25.2 14.3 60.5 0.1 0.1 24.510-Year 12/15/2015 2.233 2.64 21.0 26.0 12.1 62.0 0.0 0.0 21.030-Year 10/15/2015 2.914 2.46 13.0 28.1 15.5 56.4 0.0 0.0 29.030-Year 11/16/2015 3.070 2.41 16.0 29.6 10.2 60.3 0.0 0.1 36.030-Year 12/15/2015 2.978 2.42 13.0 25.7 10.4 63.9 0.0 0.0 28.9
2-Year FRN 11/2/2015 0.168 3.10 15.0 48.4 2.0 49.6 0.0 0.0 0.02-Year FRN 11/27/2015 0.216 3.11 13.0 52.4 3.2 44.4 0.0 0.0 0.02-Year FRN 12/28/2015 0.330 3.48 13.0 59.1 1.5 39.4 0.0 0.0 0.0
Issue Settle Date Stop Out Rate (%)*
Bid-to-Cover Ratio*
Competitive Awards ($bn)
% Primary Dealer* % Direct* %
Indirect*
Non-Competitive
Awards ($bn)
SOMA Add Ons
($bn)
10-Year Equivalent
($bn)*5-Year TIPS 12/31/2015 0.472 2.38 16.0 25.0 5.0 69.9 0.0 0.0 7.8
10-Year TIPS 11/30/2015 0.664 2.38 13.0 25.3 7.5 67.2 0.0 0.0 13.830-Year TIPS 10/30/2015 1.200 2.62 7.0 21.7 8.5 69.8 0.0 0.0 20.6
Nominal Coupons
TIPS
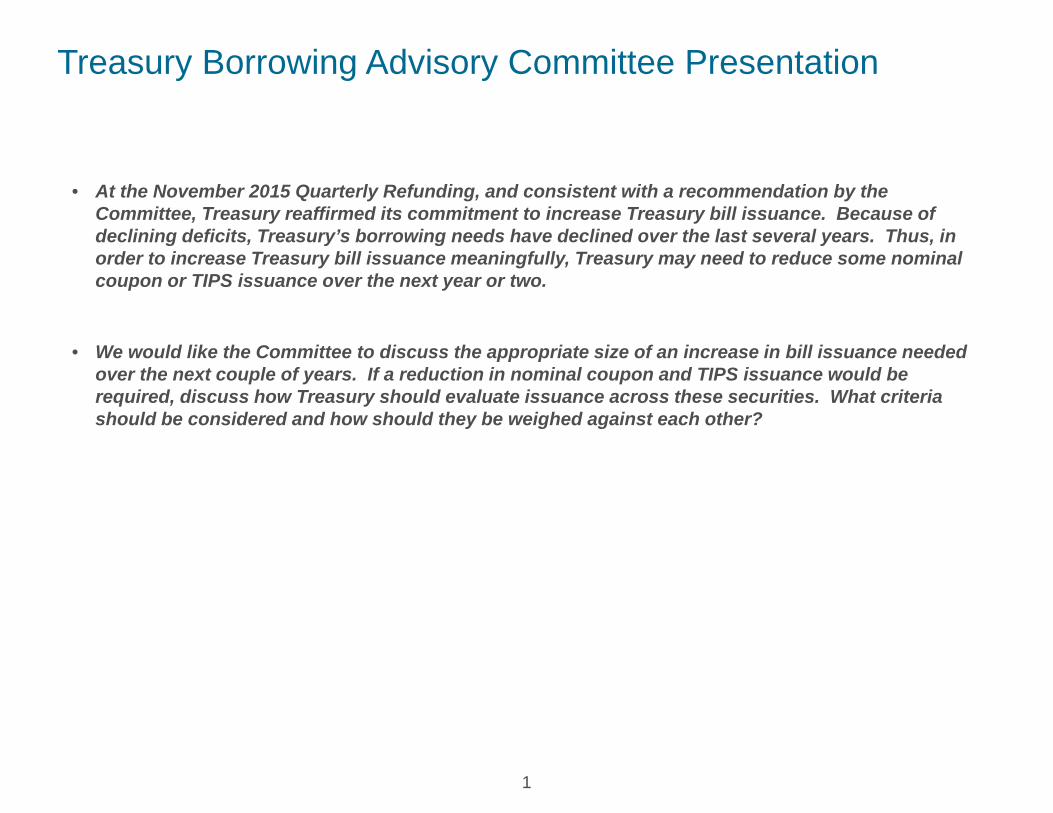
Treasury Borrowing Advisory Committee Presentation
• At the November 2015 Quarterly Refunding, and consistent with a recommendation by the Committee, Treasury reaffirmed its commitment to increase Treasury bill issuance. Because of declining deficits, Treasury’s borrowing needs have declined over the last several years. Thus, in order to increase Treasury bill issuance meaningfully, Treasury may need to reduce some nominal coupon or TIPS issuance over the next year or two.
• We would like the Committee to discuss the appropriate size of an increase in bill issuance needed over the next couple of years. If a reduction in nominal coupon and TIPS issuance would be required, discuss how Treasury should evaluate issuance across these securities. What criteria should be considered and how should they be weighed against each other?
1
AgendaBills supply and demand dynamics
• What are the drivers of demand for HQLA?
• What are the supply dynamics for Tbills/HQLA?
• How substitutable are various short end products?• How substitutable are various short-end products?
Given these demand dynamics, how much should TBill supply be increased?
• Are there any particular tenors of T-Bills that should be the focus of increases?
• Should Treasury consider adding an additional T-bill tenor (e.g, 2 month)?Should Treasury consider adding an additional T bill tenor (e.g, 2 month)?
Treasury financing needs• What is the deficit/net borrowing needs outlook through the end of FY2017?
• With the existing auction sizes, is Treasury over financed or underfinanced? By how much?
• What is the likelihood that the Federal Reserve will begin to reduce the SOMA portfolio by end of FY2017?
• What are the estimates for the magnitude of the reductions through FY2017?
• To what extent should Treasury reduce coupon or TIPS issuance in order to increase bill issuance this year?
Framework for determining how to reduce coupon and TIPS issuance?• What sort of framework(s)/factors should Treasury consider for evaluating where to reduce issuance?
• How should Treasury implement any such reductions in coupons and/or TIPS?• How should Treasury implement any such reductions in coupons and/or TIPS?
• If Treasury should reduce TIPS issuance, how should Treasury communicate the fact that it remains committed to the TIPS program?
2
Bills supply and demand dynamics
3
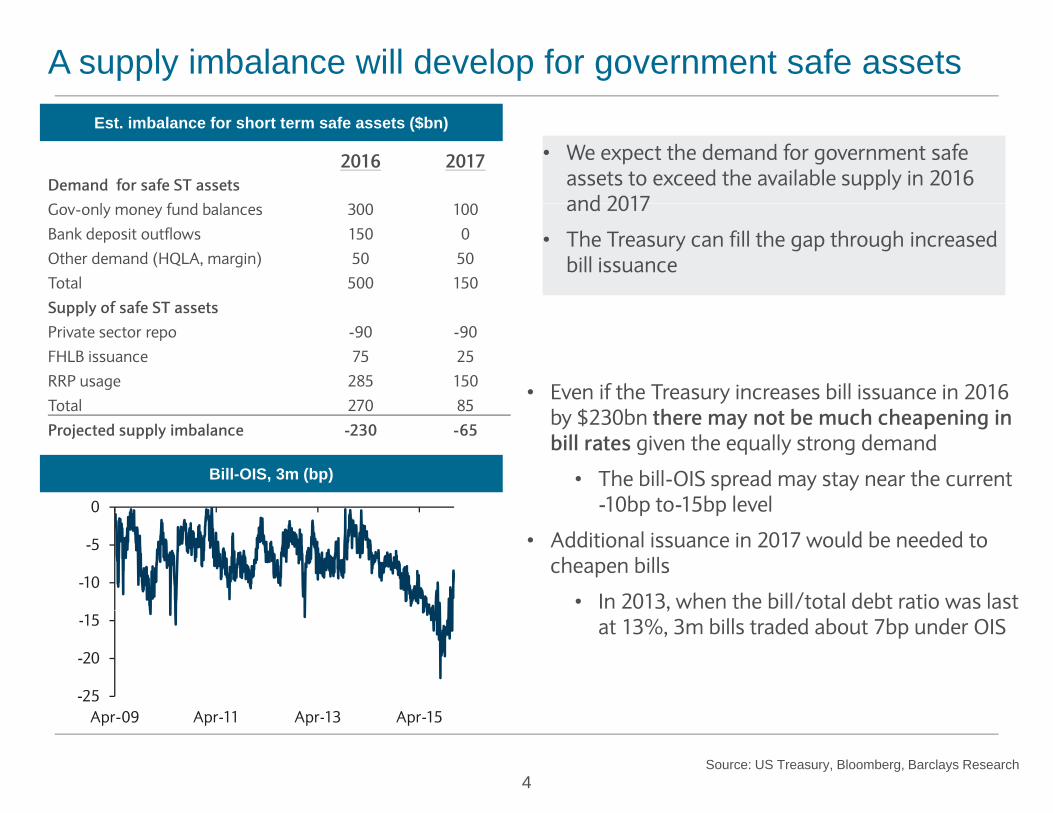
A supply imbalance will develop for government safe assetsEst. imbalance for short term safe assets ($bn)
• We expect the demand for government safe assets to exceed the available supply in 2016 and 2017
2016 2017Demand for safe ST assetsG l f d b l 300 100 and 2017
• The Treasury can fill the gap through increased bill issuance
Gov-only money fund balances 300 100
Bank deposit outflows 150 0
Other demand (HQLA, margin) 50 50
Total 500 150
Supply of safe ST assetsSupply of safe ST assetsPrivate sector repo -90 -90
FHLB issuance 75 25
RRP usage 285 150
Total 270 85• Even if the Treasury increases bill issuance in 2016
Total 270 85
Projected supply imbalance -230 -65by $230bn there may not be much cheapening in bill rates given the equally strong demand
• The bill-OIS spread may stay near the current -10bp to-15bp level
Bill-OIS, 3m (bp)
0 10bp to 15bp level
• Additional issuance in 2017 would be needed to cheapen bills
• In 2013, when the bill/total debt ratio was last -10
-5
0
,at 13%, 3m bills traded about 7bp under OIS
-25
-20
-15
A 09 A 11 A 13 A 15
4Source: US Treasury, Bloomberg, Barclays Research
Apr-09 Apr-11 Apr-13 Apr-15
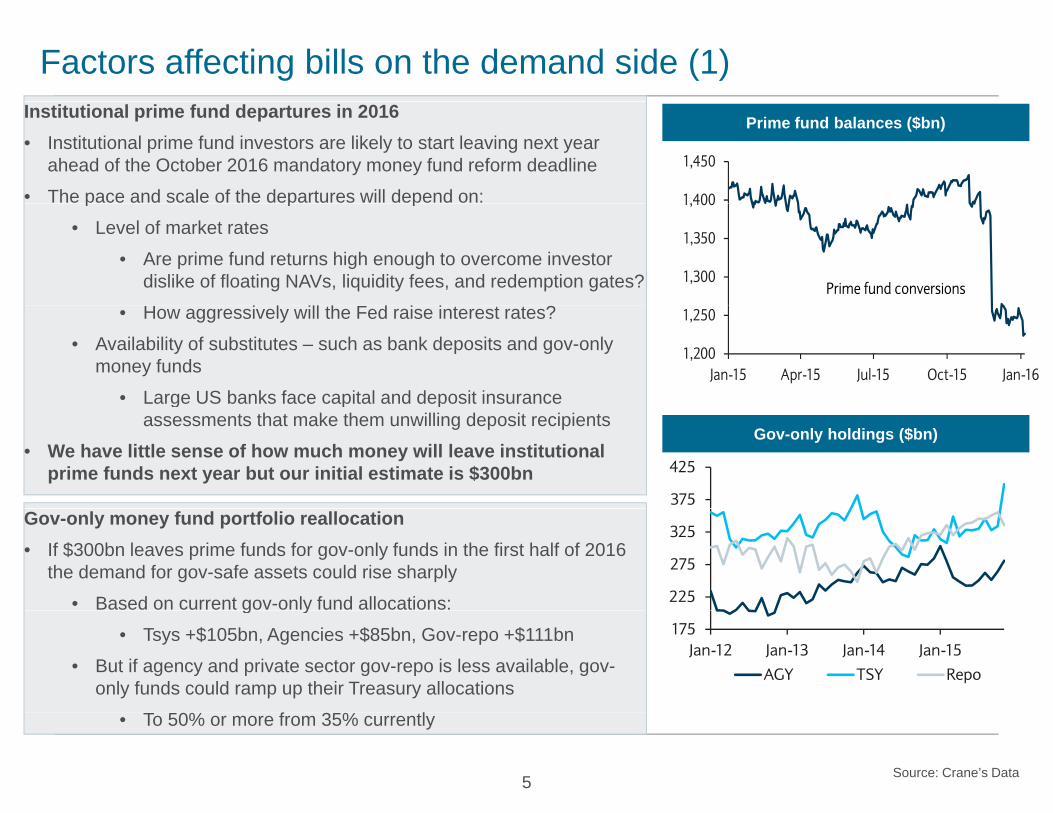
Factors affecting bills on the demand side (1)Institutional prime fund departures in 2016• Institutional prime fund investors are likely to start leaving next year
ahead of the October 2016 mandatory money fund reform deadline
• The pace and scale of the departures will depend on:
Prime fund balances ($bn)
1,400
1,450
p p p
• Level of market rates
• Are prime fund returns high enough to overcome investor dislike of floating NAVs, liquidity fees, and redemption gates? 1,300
1,350
1,400
Prime fund conversions
• How aggressively will the Fed raise interest rates?
• Availability of substitutes – such as bank deposits and gov-only money funds
• Large US banks face capital and deposit insurance
1,200
1,250
Jan-15 Apr-15 Jul-15 Oct-15 Jan-16g p p
assessments that make them unwilling deposit recipients
• We have little sense of how much money will leave institutional prime funds next year but our initial estimate is $300bn
Gov-only holdings ($bn)
375
425
Gov-only money fund portfolio reallocation• If $300bn leaves prime funds for gov-only funds in the first half of 2016
the demand for gov-safe assets could rise sharply
• Based on current gov-only fund allocations: 225
275
325
g y
• Tsys +$105bn, Agencies +$85bn, Gov-repo +$111bn
• But if agency and private sector gov-repo is less available, gov-only funds could ramp up their Treasury allocations
175Jan-12 Jan-13 Jan-14 Jan-15
AGY TSY Repo
5 Source: Crane’s Data
• To 50% or more from 35% currently
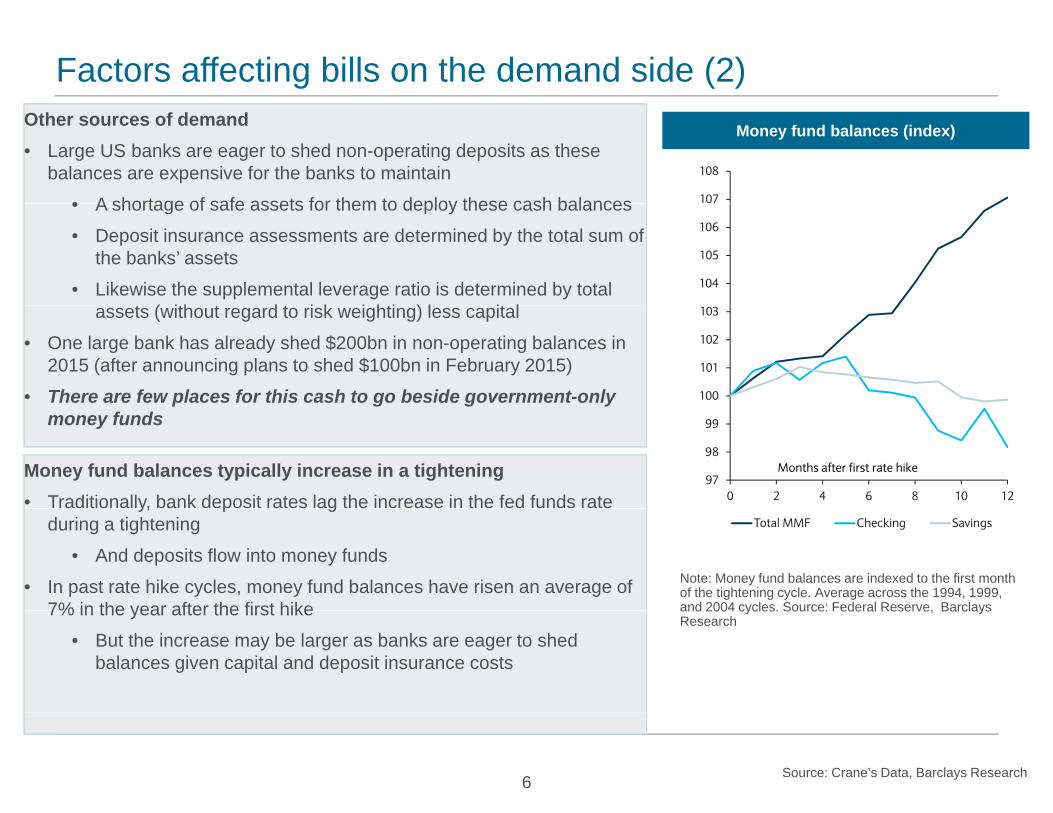
Factors affecting bills on the demand side (2)Other sources of demand• Large US banks are eager to shed non-operating deposits as these
balances are expensive for the banks to maintain
• A shortage of safe assets for them to deploy these cash balances
Money fund balances (index)
107
108
• A shortage of safe assets for them to deploy these cash balances
• Deposit insurance assessments are determined by the total sum of the banks’ assets
• Likewise the supplemental leverage ratio is determined by total t ( ith t d t i k i hti ) l it l
104
105
106
assets (without regard to risk weighting) less capital
• One large bank has already shed $200bn in non-operating balances in 2015 (after announcing plans to shed $100bn in February 2015)
• There are few places for this cash to go beside government-only 100
101
102
103
money funds
97
98
99
0 2 4 6 8 10 12
Months after first rate hikeMoney fund balances typically increase in a tightening• Traditionally, bank deposit rates lag the increase in the fed funds rate
Total MMF Checking Savings
y, p gduring a tightening
• And deposits flow into money funds
• In past rate hike cycles, money fund balances have risen an average of 7% in the year after the first hike
Note: Money fund balances are indexed to the first month of the tightening cycle. Average across the 1994, 1999, and 2004 cycles. Source: Federal Reserve, Barclays7% in the year after the first hike
• But the increase may be larger as banks are eager to shed balances given capital and deposit insurance costs
and 2004 cycles. Source: Federal Reserve, Barclays Research
6 Source: Crane’s Data, Barclays Research
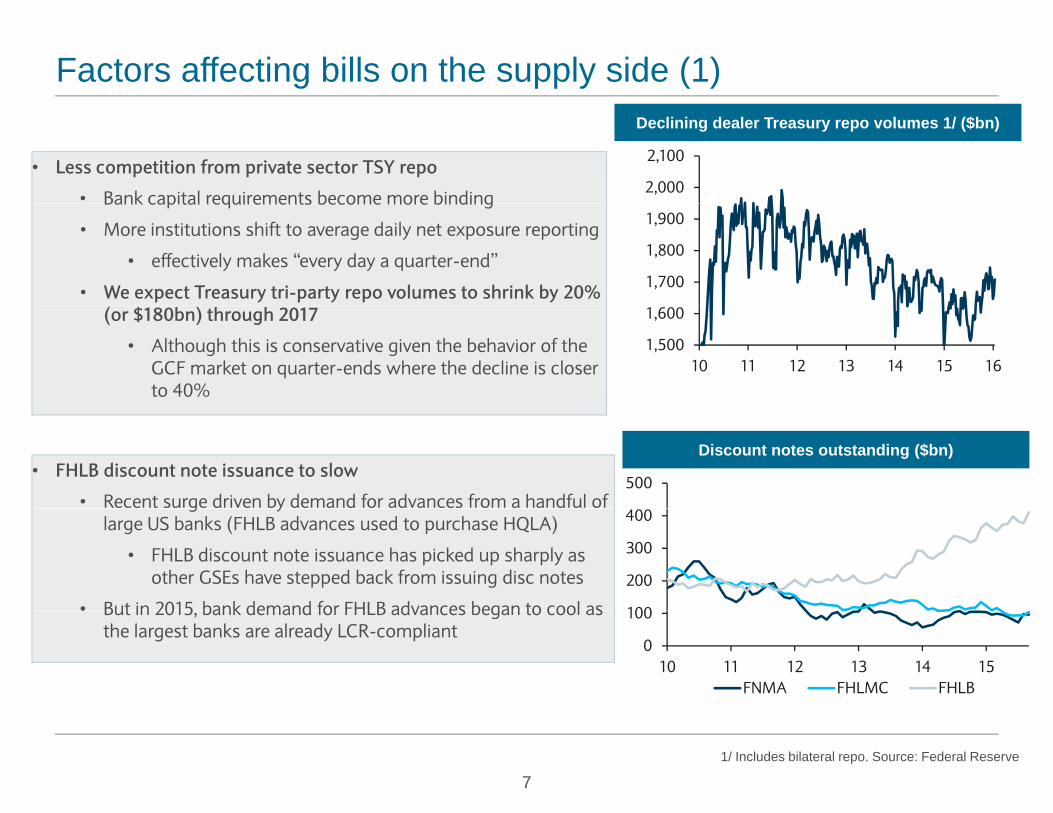
Factors affecting bills on the supply side (1)
• Less competition from private sector TSY repo
• Bank capital requirements become more binding
Declining dealer Treasury repo volumes 1/ ($bn)
2,000
2,100
Bank capital requirements become more binding
• More institutions shift to average daily net exposure reporting
• effectively makes “every day a quarter-end”
• We expect Treasury tri-party repo volumes to shrink by 20% 1,700
1,800
1,900
(or $180bn) through 2017
• Although this is conservative given the behavior of the GCF market on quarter-ends where the decline is closer to 40%
1,500
1,600
10 11 12 13 14 15 16
• FHLB discount note issuance to slow
• Recent surge driven by demand for advances from a handful of 500
Discount notes outstanding ($bn)
g ylarge US banks (FHLB advances used to purchase HQLA)
• FHLB discount note issuance has picked up sharply as other GSEs have stepped back from issuing disc notes
• But in 2015 bank demand for FHLB advances began to cool as 100
200
300
400
• But in 2015, bank demand for FHLB advances began to cool as the largest banks are already LCR-compliant
0
100
10 11 12 13 14 15FNMA FHLMC FHLB
71/ Includes bilateral repo. Source: Federal Reserve
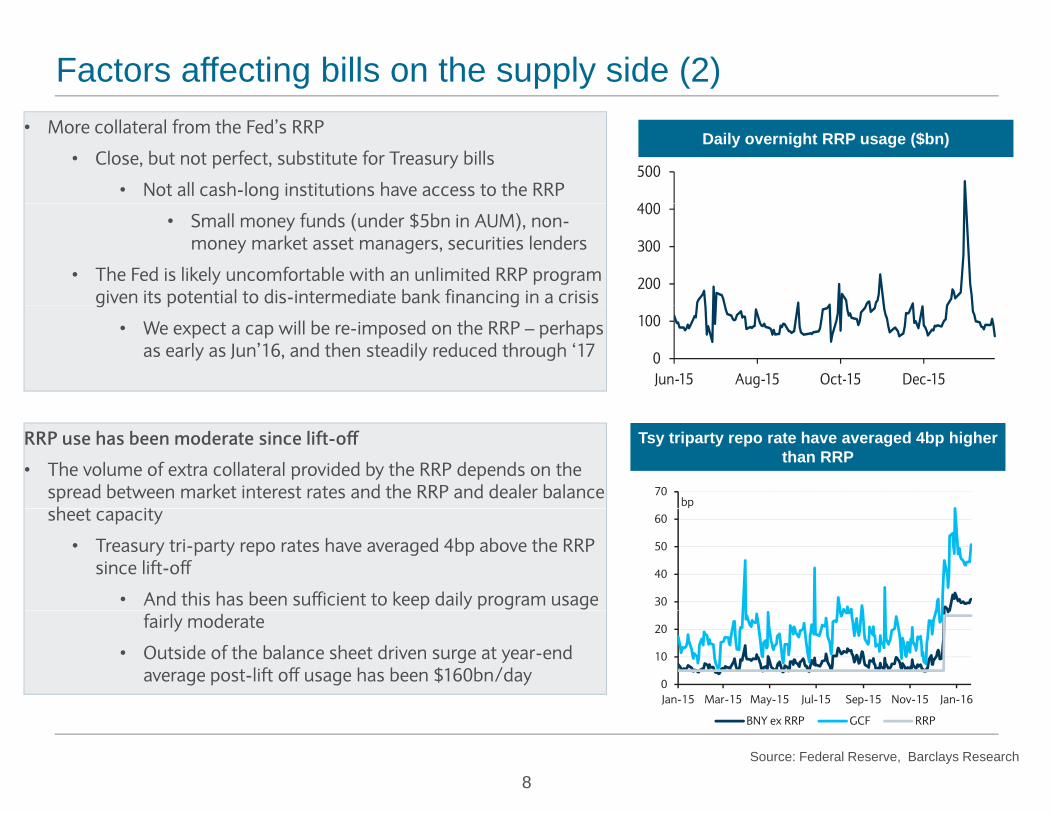
Factors affecting bills on the supply side (2)• More collateral from the Fed’s RRP
• Close, but not perfect, substitute for Treasury bills
• Not all cash-long institutions have access to the RRP
Daily overnight RRP usage ($bn)
400
500
• Small money funds (under $5bn in AUM), non-money market asset managers, securities lenders
• The Fed is likely uncomfortable with an unlimited RRP program given its potential to dis-intermediate bank financing in a crisis
200
300
400
g p g
• We expect a cap will be re-imposed on the RRP – perhaps as early as Jun’16, and then steadily reduced through ‘17 0
100
Jun-15 Aug-15 Oct-15 Dec-15
RRP use has been moderate since lift-off
• The volume of extra collateral provided by the RRP depends on the spread between market interest rates and the RRP and dealer balance h t it
Tsy triparty repo rate have averaged 4bp higher than RRP
70bp
sheet capacity
• Treasury tri-party repo rates have averaged 4bp above the RRP since lift-off
• And this has been sufficient to keep daily program usage 30
40
50
60
fairly moderate
• Outside of the balance sheet driven surge at year-end average post-lift off usage has been $160bn/day 0
10
20
Jan-15 Mar-15 May-15 Jul-15 Sep-15 Nov-15 Jan-16
8Source: Federal Reserve, Barclays Research
BNY ex RRP GCF RRP
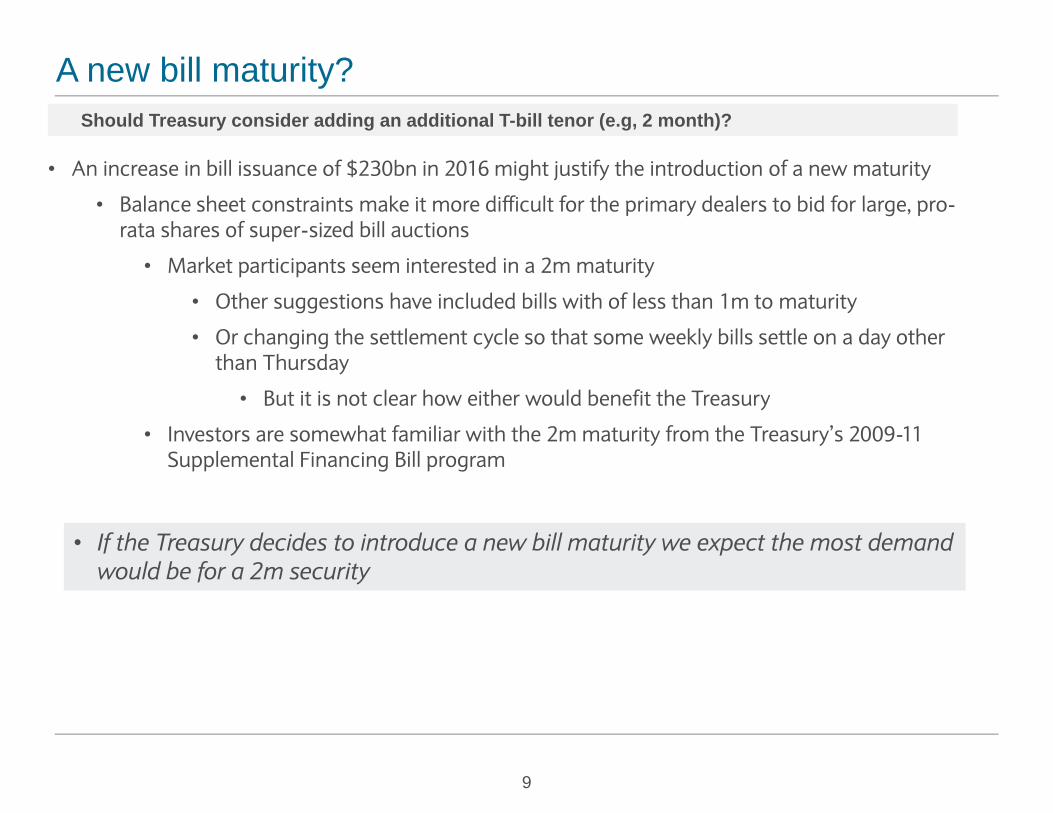
A new bill maturity?
• An increase in bill issuance of $230bn in 2016 might justify the introduction of a new maturity
• Balance sheet constraints make it more difficult for the primary dealers to bid for large pro
Should Treasury consider adding an additional T-bill tenor (e.g, 2 month)?
• Balance sheet constraints make it more difficult for the primary dealers to bid for large, pro-rata shares of super-sized bill auctions
• Market participants seem interested in a 2m maturity
• Other suggestions have included bills with of less than 1m to maturityOther suggestions have included bills with of less than 1m to maturity
• Or changing the settlement cycle so that some weekly bills settle on a day other than Thursday
• But it is not clear how either would benefit the Treasuryy
• Investors are somewhat familiar with the 2m maturity from the Treasury’s 2009-11 Supplemental Financing Bill program
• If the Treasury decides to introduce a new bill maturity we expect the most demand would be for a 2m security
9
Treasury financing needs and issuance outlook
10
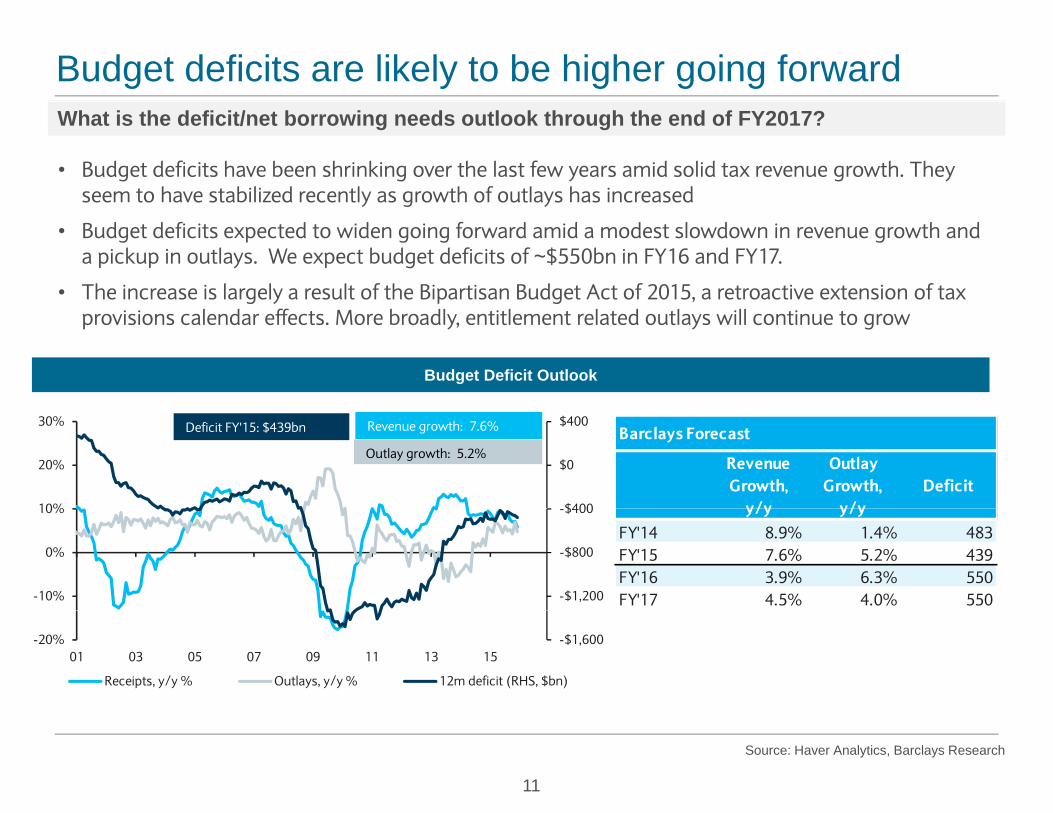
Budget deficits are likely to be higher going forwardWhat is the deficit/net borrowing needs outlook through the end of FY2017?
• Budget deficits have been shrinking over the last few years amid solid tax revenue growth. They seem to have stabilized recently as growth of outlays has increasedy g y
• Budget deficits expected to widen going forward amid a modest slowdown in revenue growth and a pickup in outlays. We expect budget deficits of ~$550bn in FY16 and FY17.
• The increase is largely a result of the Bipartisan Budget Act of 2015, a retroactive extension of tax
Budget Deficit Outlook
provisions calendar effects. More broadly, entitlement related outlays will continue to grow
$400
$0
$400
10%
20%
30% Deficit FY'15: $439bn Revenue growth: 7.6%
Outlay growth: 5.2%Barclays Forecast
Revenue Growth,
y/y
Outlay Growth,
y/yDeficit
-$1,200
-$800
-$400
-10%
0%
10% y/y y/yFY'14 8.9% 1.4% 483FY'15 7.6% 5.2% 439FY'16 3.9% 6.3% 550FY'17 4.5% 4.0% 550
-$1,600-20%01 03 05 07 09 11 13 15
Receipts, y/y % Outlays, y/y % 12m deficit (RHS, $bn)
11
Source: Haver Analytics, Barclays Research
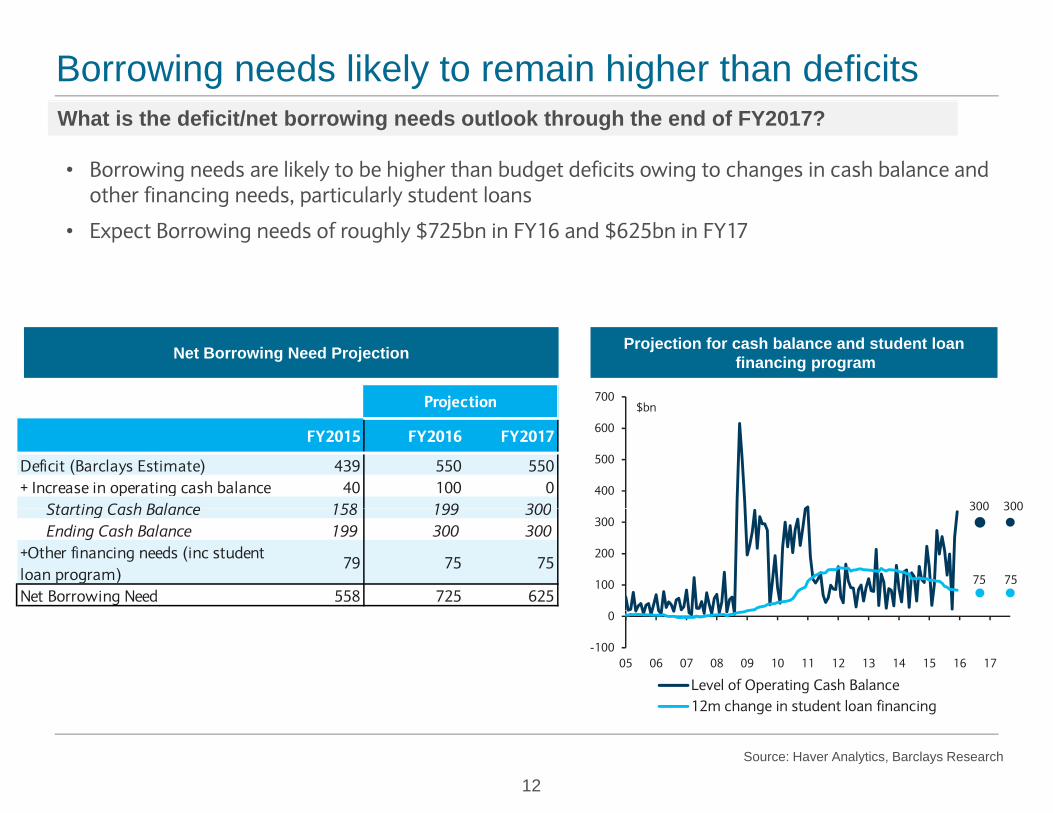
Borrowing needs likely to remain higher than deficitsWhat is the deficit/net borrowing needs outlook through the end of FY2017?
• Borrowing needs are likely to be higher than budget deficits owing to changes in cash balance and other financing needs, particularly student loansg , p y
• Expect Borrowing needs of roughly $725bn in FY16 and $625bn in FY17
Net Borrowing Need Projection Projection for cash balance and student loan financing program
700$bnProjection
300 300400
500
600
$bn
FY2015 FY2016 FY2017
Deficit (Barclays Estimate) 439 550 550+ Increase in operating cash balance 40 100 0
Starting Cash Balance 158 199 300
Projection
300 300
75 75100
200
300Starting Cash Balance 158 199 300Ending Cash Balance 199 300 300
+Other financing needs (inc student loan program)
79 75 75
Net Borrowing Need 558 725 625
-100
0
05 06 07 08 09 10 11 12 13 14 15 16 17
Level of Operating Cash Balance12m change in student loan financing
12
Source: Haver Analytics, Barclays Research
g g
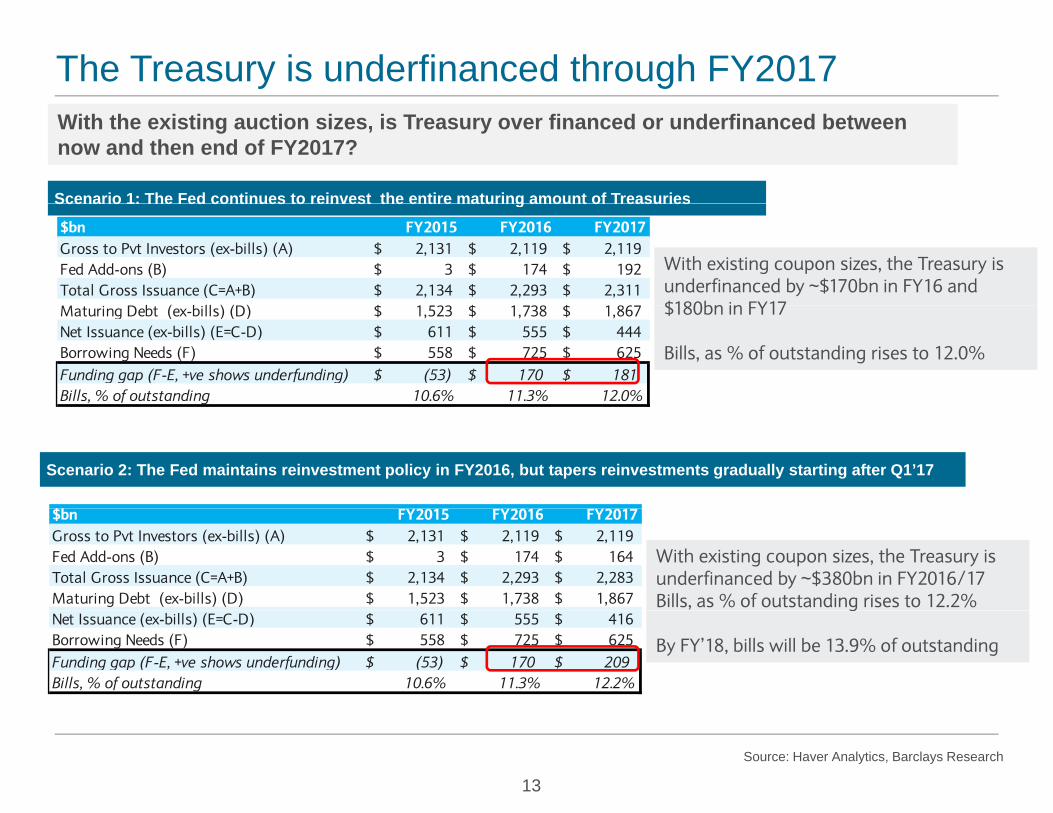
The Treasury is underfinanced through FY2017With the existing auction sizes, is Treasury over financed or underfinanced between now and then end of FY2017?
Scenario 1: The Fed continues to reinvest the entire maturing amount of Treasuries
$bn FY2015 FY2016 FY2017Gross to Pvt Investors (ex-bills) (A) $ 2,131 $ 2,119 $ 2,119 Fed Add-ons (B) $ 3 $ 174 $ 192 Total Gross Issuance (C=A+B) $ 2,134 $ 2,293 $ 2,311
b ( b ll ) ( ) $ $ $
Scenario 1: The Fed continues to reinvest the entire maturing amount of Treasuries
With existing coupon sizes, the Treasury is underfinanced by ~$170bn in FY16 and $180bn in FY17Maturing Debt (ex-bills) (D) $ 1,523 $ 1,738 $ 1,867
Net Issuance (ex-bills) (E=C-D) $ 611 $ 555 $ 444 Borrowing Needs (F) $ 558 $ 725 $ 625 Funding gap (F-E, +ve shows underfunding) $ (53) $ 170 $ 181 Bills, % of outstanding 10.6% 11.3% 12.0%
$180bn in FY17
Bills, as % of outstanding rises to 12.0%
$b 201 2016 201
Scenario 2: The Fed maintains reinvestment policy in FY2016, but tapers reinvestments gradually starting after Q1’17
$bn FY2015 FY2016 FY2017Gross to Pvt Investors (ex-bills) (A) $ 2,131 $ 2,119 $ 2,119 Fed Add-ons (B) $ 3 $ 174 $ 164 Total Gross Issuance (C=A+B) $ 2,134 $ 2,293 $ 2,283 Maturing Debt (ex-bills) (D) $ 1,523 $ 1,738 $ 1,867
With existing coupon sizes, the Treasury is underfinanced by ~$380bn in FY2016/17 Bills, as % of outstanding rises to 12.2%
Net Issuance (ex-bills) (E=C-D) $ 611 $ 555 $ 416 Borrowing Needs (F) $ 558 $ 725 $ 625 Funding gap (F-E, +ve shows underfunding) $ (53) $ 170 $ 209 Bills, % of outstanding 10.6% 11.3% 12.2%
g
By FY’18, bills will be 13.9% of outstanding
13
Source: Haver Analytics, Barclays Research
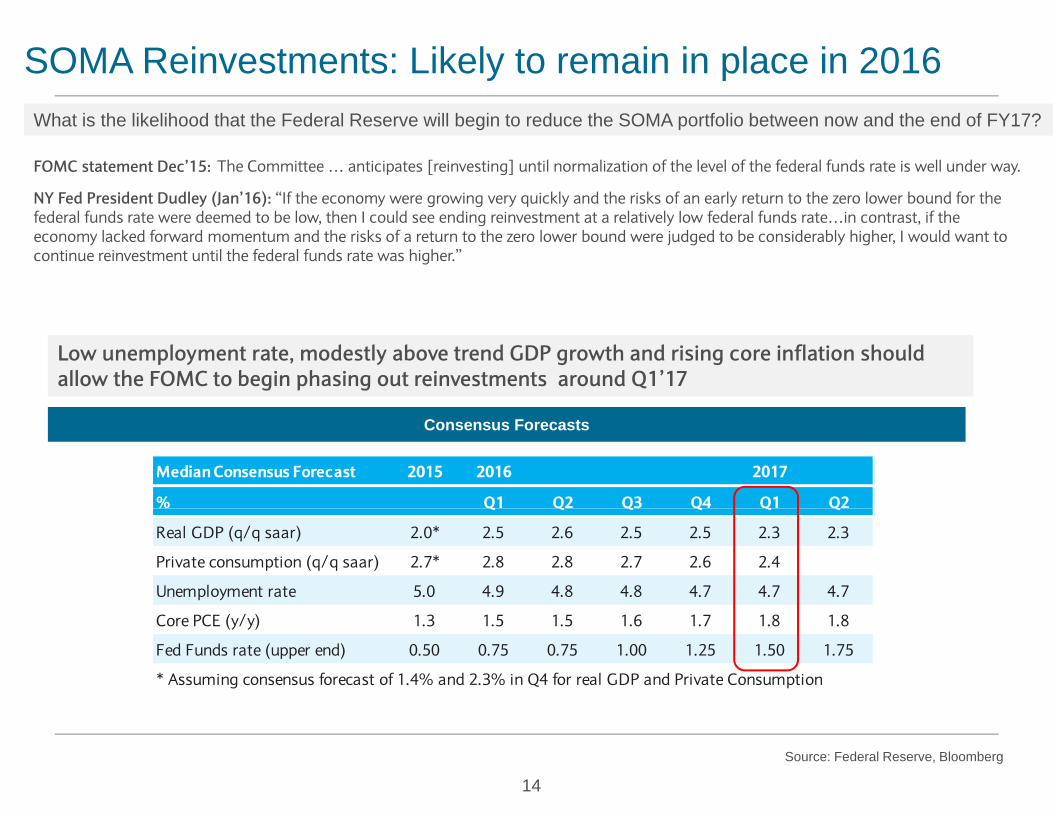
SOMA Reinvestments: Likely to remain in place in 2016What is the likelihood that the Federal Reserve will begin to reduce the SOMA portfolio between now and the end of FY17?
NY Fed President Dudley (Jan’16): “If the economy were growing very quickly and the risks of an early return to the zero lower bound for the
The Committee … anticipates [reinvesting] until normalization of the level of the federal funds rate is well under way. FOMC statement Dec’15:
NY Fed President Dudley (Jan 16): If the economy were growing very quickly and the risks of an early return to the zero lower bound for the federal funds rate were deemed to be low, then I could see ending reinvestment at a relatively low federal funds rate…in contrast, if the economy lacked forward momentum and the risks of a return to the zero lower bound were judged to be considerably higher, I would want to continue reinvestment until the federal funds rate was higher.”
Low unemployment rate, modestly above trend GDP growth and rising core inflation should allow the FOMC to begin phasing out reinvestments around Q1’17
Median Consensus Forecast 2015 2016 2017
% Q1 Q2 Q3 Q4 Q1 Q2
Consensus Forecasts
Q Q Q Q Q Q
Real GDP (q/q saar) 2.0* 2.5 2.6 2.5 2.5 2.3 2.3
Private consumption (q/q saar) 2.7* 2.8 2.8 2.7 2.6 2.4
Unemployment rate 5.0 4.9 4.8 4.8 4.7 4.7 4.7
Core PCE (y/y) 1.3 1.5 1.5 1.6 1.7 1.8 1.8
Fed Funds rate (upper end) 0.50 0.75 0.75 1.00 1.25 1.50 1.75
* Assuming consensus forecast of 1.4% and 2.3% in Q4 for real GDP and Private Consumption
14
Source: Federal Reserve, Bloomberg
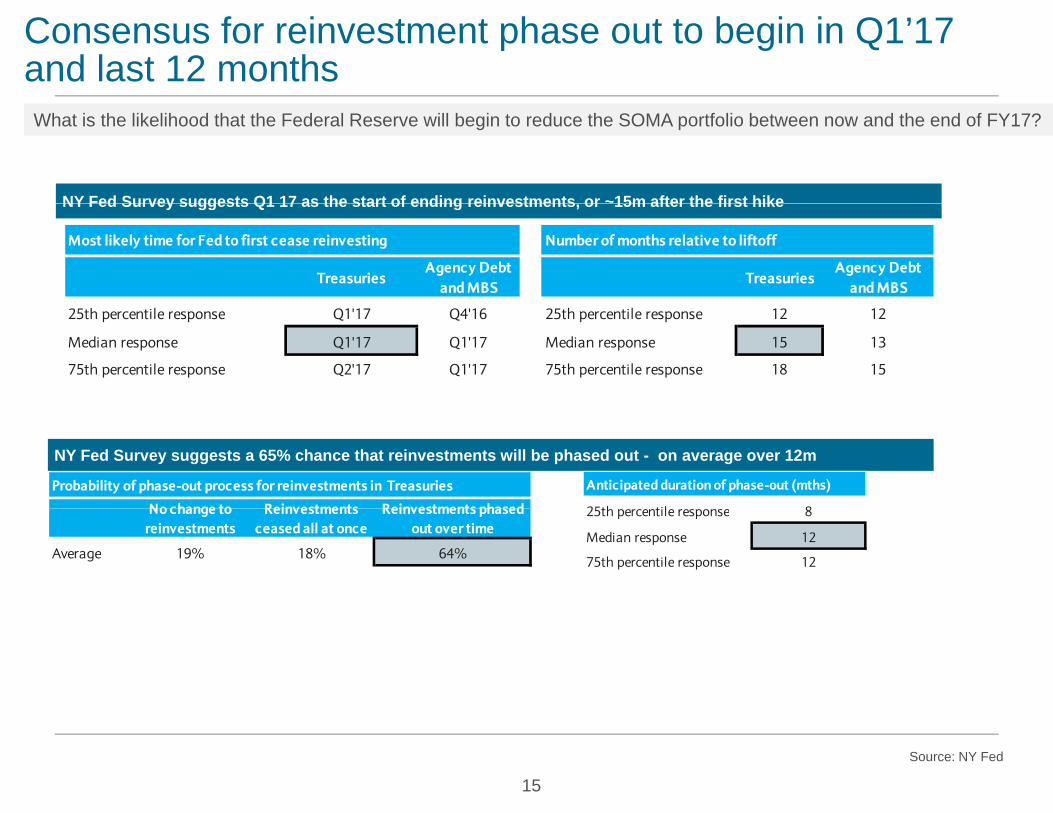
Consensus for reinvestment phase out to begin in Q1’17 and last 12 monthsWhat is the likelihood that the Federal Reserve will begin to reduce the SOMA portfolio between now and the end of FY17?
NY Fed Survey suggests Q1 17 as the start of ending reinvestments or ~15m after the first hikeNY Fed Survey suggests Q1 17 as the start of ending reinvestments, or 15m after the first hike
Most likely time for Fed to first cease reinvesting Number of months relative to liftoff
TreasuriesAgency Debt
and MBSTreasuries
Agency Debt and MBS
25th percentile response Q1'17 Q4'16 25th percentile response 12 12
Median response Q1'17 Q1'17 Median response 15 13
75th percentile response Q2'17 Q1'17 75th percentile response 18 15
Probability of phase-out process for reinvestments in Treasuries
No change to Reinvestments Reinvestments phased
NY Fed Survey suggests a 65% chance that reinvestments will be phased out - on average over 12m
Anticipated duration of phase-out (mths)
25th til 8No change to reinvestments
Reinvestments ceased all at once
Reinvestments phased out over time
Average 19% 18% 64%
25th percentile response 8
Median response 12
75th percentile response 12
15
Source: NY Fed
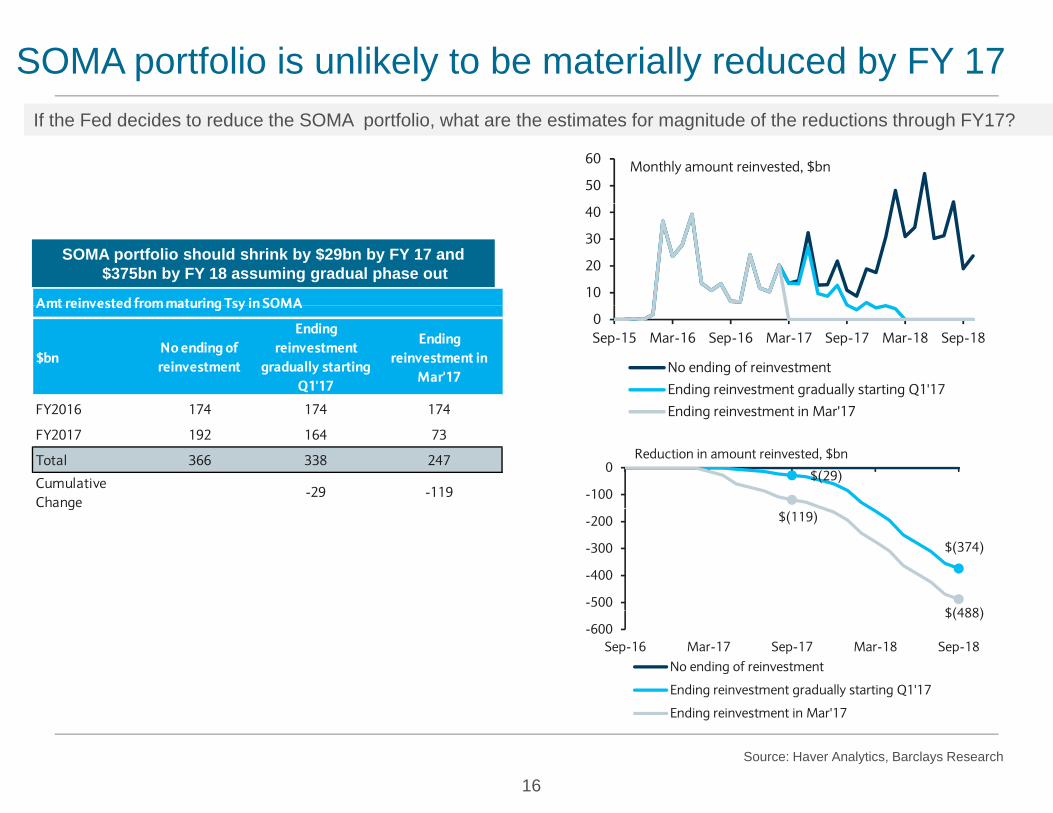
SOMA portfolio is unlikely to be materially reduced by FY 17If the Fed decides to reduce the SOMA portfolio, what are the estimates for magnitude of the reductions through FY17?
50
60 Monthly amount reinvested, $bn
SOMA portfolio should shrink by $29bn by FY 17 and $375bn by FY 18 assuming gradual phase out
10
20
30
40
Amt reinvested from maturing Tsy in SOMA0Sep-15 Mar-16 Sep-16 Mar-17 Sep-17 Mar-18 Sep-18
No ending of reinvestment
Ending reinvestment gradually starting Q1'17
E di i t t i M '17
Amt reinvested from maturing Tsy in SOMA
$bnNo ending of reinvestment
Ending reinvestment
gradually starting Q1'17
Ending reinvestment in
Mar'17
FY2016 174 174 174 Ending reinvestment in Mar'17
$(29)-100
0Reduction in amount reinvested, $bn
FY2016 174 174 174
FY2017 192 164 73
Total 366 338 247
Cumulative Change
-29 -119
$(374)
$(119)
$(488)-500
-400
-300
-200g
$(488)-600
Sep-16 Mar-17 Sep-17 Mar-18 Sep-18No ending of reinvestment
Ending reinvestment gradually starting Q1'17
Ending reinvestment in Mar'17
16
Source: Haver Analytics, Barclays Research
Ending reinvestment in Mar 17
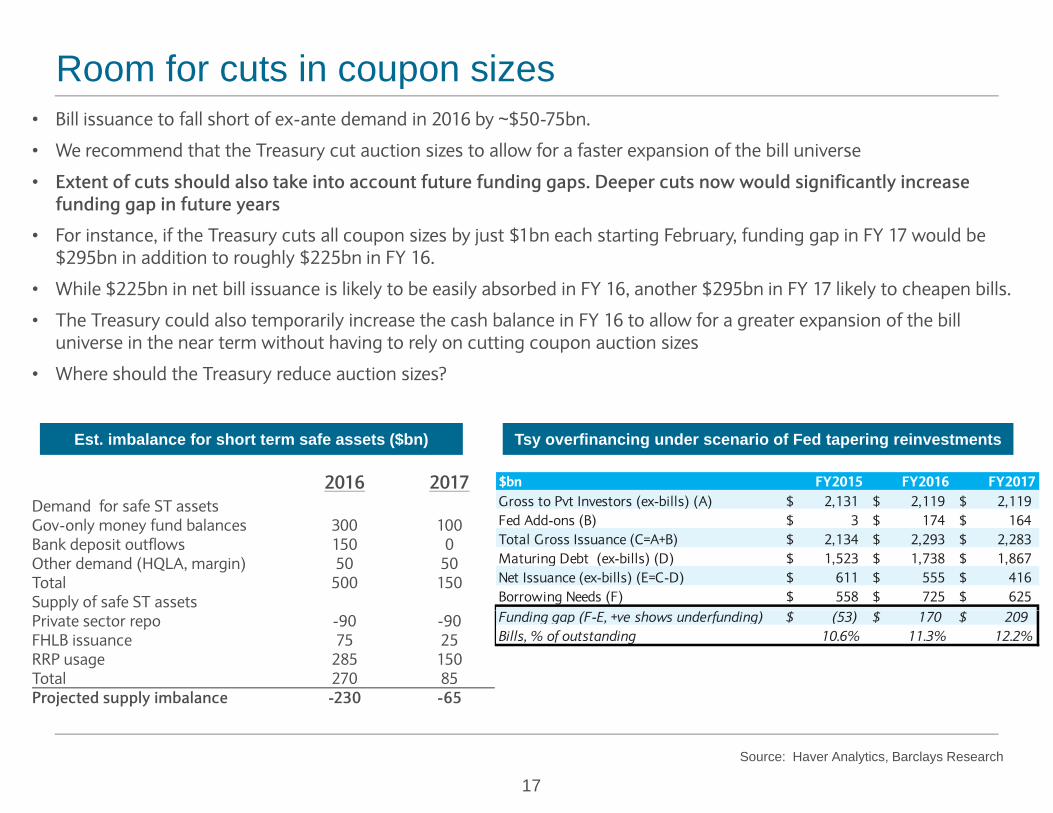
Room for cuts in coupon sizes• Bill issuance to fall short of ex-ante demand in 2016 by ~$50-75bn.
• We recommend that the Treasury cut auction sizes to allow for a faster expansion of the bill universe
• Extent of cuts should also take into account future funding gaps. Deeper cuts now would significantly increase funding gap in future yearsfunding gap in future years
• For instance, if the Treasury cuts all coupon sizes by just $1bn each starting February, funding gap in FY 17 would be $295bn in addition to roughly $225bn in FY 16.
• While $225bn in net bill issuance is likely to be easily absorbed in FY 16, another $295bn in FY 17 likely to cheapen bills.
• The Treasury could also temporarily increase the cash balance in FY 16 to allow for a greater expansion of the bill universe in the near term without having to rely on cutting coupon auction sizes
• Where should the Treasury reduce auction sizes?
2016 2017Demand for safe ST assets
Est. imbalance for short term safe assets ($bn) Tsy overfinancing under scenario of Fed tapering reinvestments
$bn FY2015 FY2016 FY2017Gross to Pvt Investors (ex-bills) (A) $ 2,131 $ 2,119 $ 2,119 Demand for safe ST assets
Gov-only money fund balances 300 100Bank deposit outflows 150 0Other demand (HQLA, margin) 50 50Total 500 150Supply of safe ST assets
( ) ( )Fed Add-ons (B) $ 3 $ 174 $ 164 Total Gross Issuance (C=A+B) $ 2,134 $ 2,293 $ 2,283 Maturing Debt (ex-bills) (D) $ 1,523 $ 1,738 $ 1,867 Net Issuance (ex-bills) (E=C-D) $ 611 $ 555 $ 416 Borrowing Needs (F) $ 558 $ 725 $ 625 pp y
Private sector repo -90 -90FHLB issuance 75 25RRP usage 285 150Total 270 85Projected supply imbalance -230 -65
Funding gap (F-E, +ve shows underfunding) $ (53) $ 170 $ 209 Bills, % of outstanding 10.6% 11.3% 12.2%
17
Source: Haver Analytics, Barclays Research
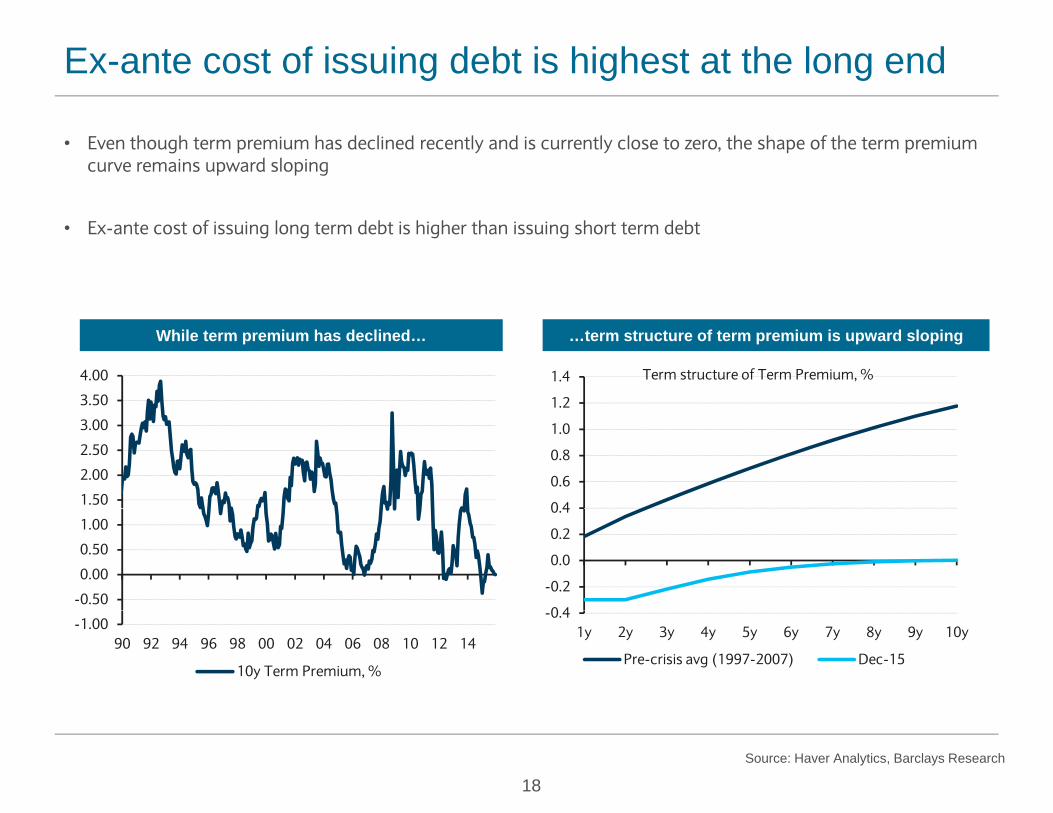
Ex-ante cost of issuing debt is highest at the long end
• Even though term premium has declined recently and is currently close to zero, the shape of the term premium curve remains upward sloping
• Ex-ante cost of issuing long term debt is higher than issuing short term debt
While term premium has declined…
1.2
1.4 Term structure of Term Premium, %
…term structure of term premium is upward sloping
3.50
4.00
0 4
0.6
0.8
1.0
1.2
1.50
2.00
2.50
3.00
0 4
-0.2
0.0
0.2
0.4
-0.50
0.00
0.50
1.00
-0.41y 2y 3y 4y 5y 6y 7y 8y 9y 10y
Pre-crisis avg (1997-2007) Dec-15
-1.0090 92 94 96 98 00 02 04 06 08 10 12 14
10y Term Premium, %
18Source: Haver Analytics, Barclays Research
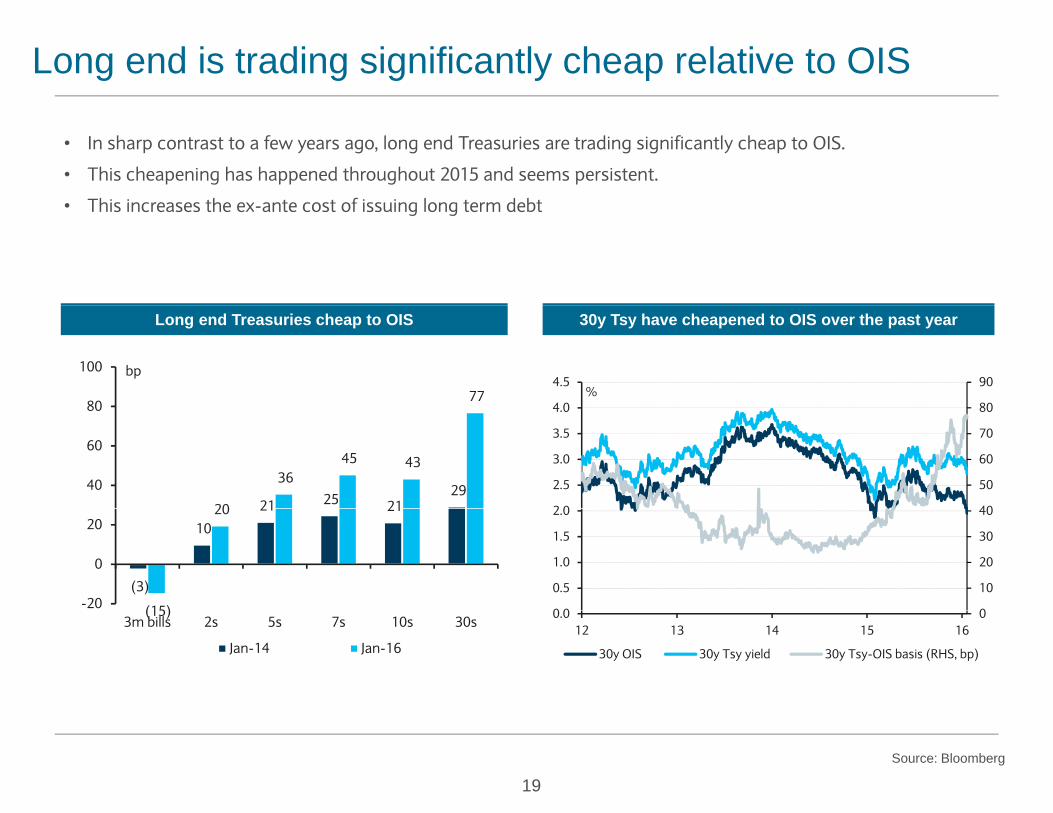
Long end is trading significantly cheap relative to OIS
• In sharp contrast to a few years ago, long end Treasuries are trading significantly cheap to OIS.
• This cheapening has happened throughout 2015 and seems persistent.
• This increases the ex ante cost of issuing long term debt• This increases the ex-ante cost of issuing long term debt
Long end Treasuries cheap to OIS
77 80
100 bp
30y Tsy have cheapened to OIS over the past year
80
90
4 0
4.5%
21 25 2129
20
36 45 43
40
60
80
40
50
60
70
80
2 0
2.5
3.0
3.5
4.0
(3)
10
21 21
(15)
20
-20
0
20
0
10
20
30
40
0 0
0.5
1.0
1.5
2.0
(15)3m bills 2s 5s 7s 10s 30s
Jan-14 Jan-16
00.012 13 14 15 16
30y OIS 30y Tsy yield 30y Tsy-OIS basis (RHS, bp)
19Source: Bloomberg
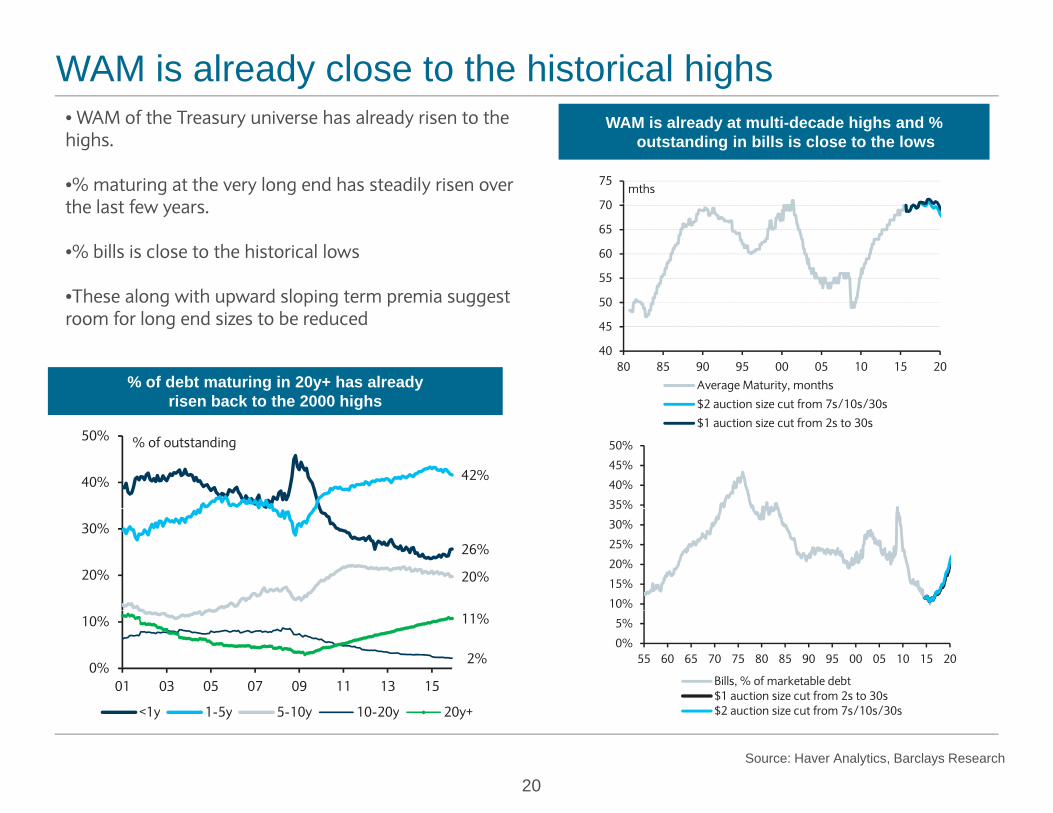
WAM is already close to the historical highsWAM is already at multi-decade highs and %
outstanding in bills is close to the lows• WAM of the Treasury universe has already risen to the highs.
•% maturing at the very long end has steadily risen over th l t f 70
75mths
the last few years.
•% bills is close to the historical lows
•These along with upward sloping term premia suggest 50
55
60
65
70
% of debt maturing in 20y+ has already risen back to the 2000 highs
g p p g p ggroom for long end sizes to be reduced
40
45
50
80 85 90 95 00 05 10 15 20Average Maturity, months
$2 auction size cut from 7s/10s/30sg
42%40%
50% % of outstanding
$2 auction size cut from 7s/10s/30s
$1 auction size cut from 2s to 30s
35%
40%
45%
50%
26%
20%20%
30%
10%
15%
20%
25%
30%
35%
2%
11%
0%
10%
01 03 05 07 09 11 13 15
<1y 1 5y 5 10y 10 20y 20y+
0%
5%
55 60 65 70 75 80 85 90 95 00 05 10 15 20
Bills, % of marketable debt$1 auction size cut from 2s to 30s$2 auction size cut from 7s/10s/30s
20Source: Haver Analytics, Barclays Research
<1y 1-5y 5-10y 10-20y 20y+ $2 auction size cut from 7s/10s/30s
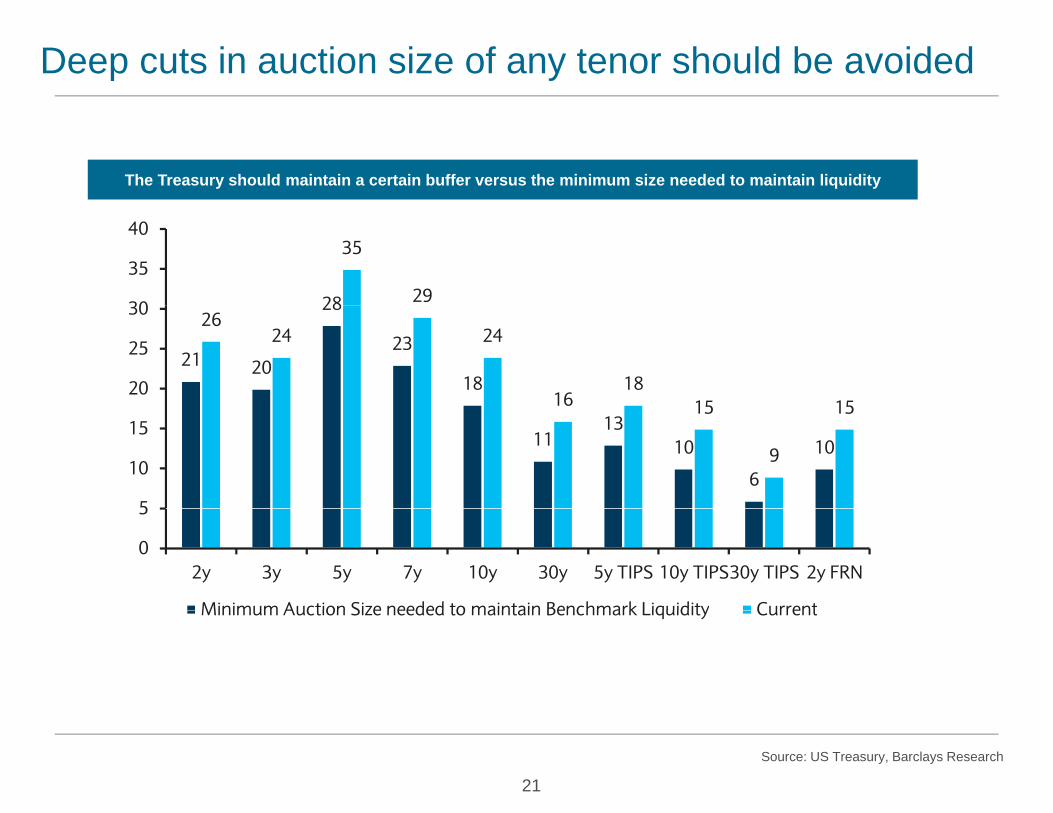
Deep cuts in auction size of any tenor should be avoided
The Treasury should maintain a certain buffer versus the minimum size needed to maintain liquidity
28
35
2930
35
40
21 20
28
23
18
2624 24
1618
15 1520
25
30
1113
10
6
10
15
9
15
5
10
15
0
5
2y 3y 5y 7y 10y 30y 5y TIPS 10y TIPS30y TIPS 2y FRN
Minimum Auction Size needed to maintain Benchmark Liquidity CurrentMinimum Auction Size needed to maintain Benchmark Liquidity Current
21
Source: US Treasury, Barclays Research
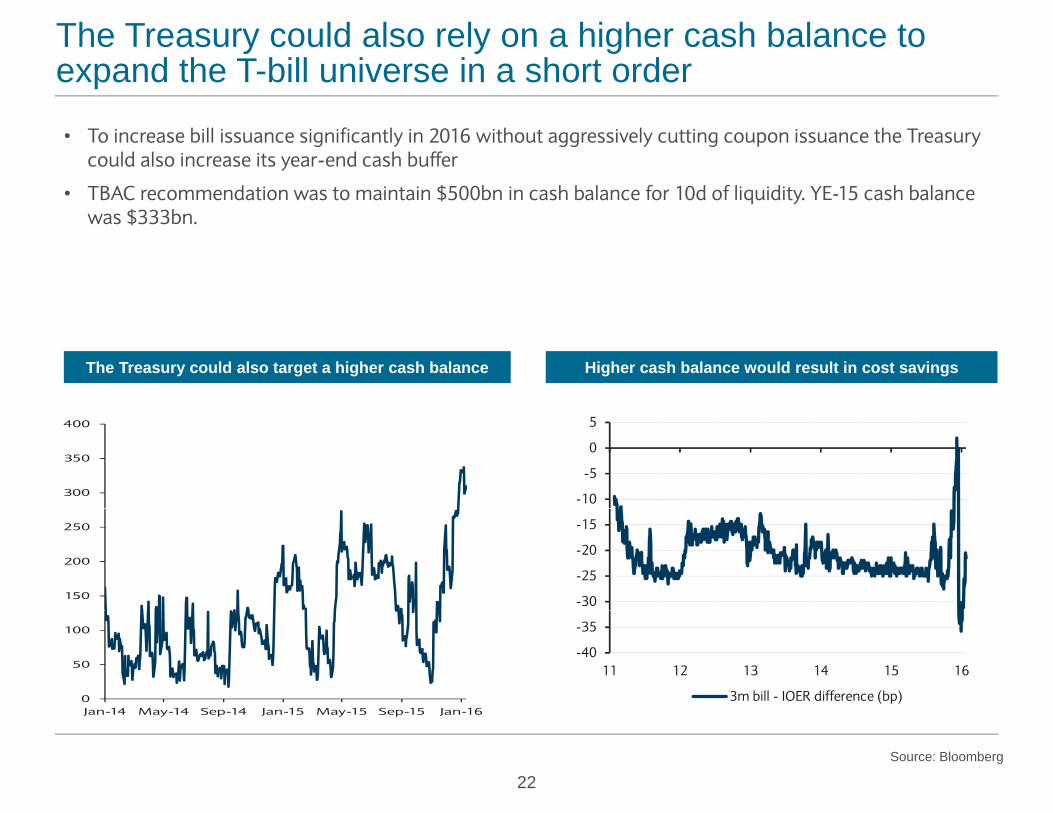
The Treasury could also rely on a higher cash balance to expand the T-bill universe in a short order
• To increase bill issuance significantly in 2016 without aggressively cutting coupon issuance the Treasury could also increase its year-end cash buffer
• TBAC recommendation was to maintain $500bn in cash balance for 10d of liquidity. YE-15 cash balance q ywas $333bn.
The Treasury could also target a higher cash balance Higher cash balance would result in cost savings
300
350
400
-10
-5
0
5
150
200
250
-30
-25
-20
-15
0
50
100
Jan-14 May-14 Sep-14 Jan-15 May-15 Sep-15 Jan-16
-40
-35
11 12 13 14 15 16
3m bill - IOER difference (bp)
22
Jan-14 May-14 Sep-14 Jan-15 May-15 Sep-15 Jan-16
Source: Bloomberg
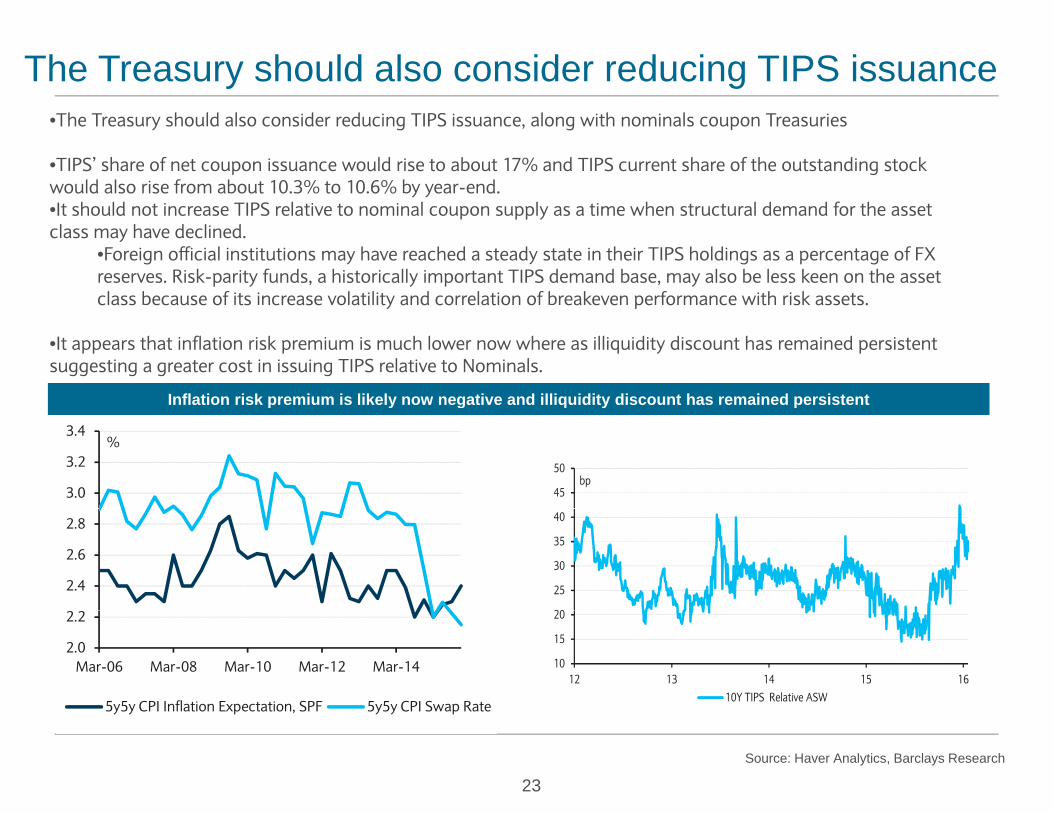
The Treasury should also consider reducing TIPS issuance•The Treasury should also consider reducing TIPS issuance, along with nominals coupon Treasuries
•TIPS’ share of net coupon issuance would rise to about 17% and TIPS current share of the outstanding stock would also rise from about 10.3% to 10.6% by year-end. It h ld t i TIPS l ti t i l l ti h t t l d d f th t•It should not increase TIPS relative to nominal coupon supply as a time when structural demand for the asset
class may have declined. •Foreign official institutions may have reached a steady state in their TIPS holdings as a percentage of FX reserves. Risk-parity funds, a historically important TIPS demand base, may also be less keen on the asset class because of its increase volatility and correlation of breakeven performance with risk assets.
Inflation risk premium is likely now negative and illiquidity discount has remained persistent
c ass ecause o ts c ease vo at ty a d co e at o o ea eve pe o a ce w t s assets.
•It appears that inflation risk premium is much lower now where as illiquidity discount has remained persistent suggesting a greater cost in issuing TIPS relative to Nominals.
p y g q y p
3.0
3.2
3.4%
45
50bp
2.4
2.6
2.8
20
25
30
35
40
2.0
2.2
Mar-06 Mar-08 Mar-10 Mar-12 Mar-14
5y5y CPI Inflation Expectation, SPF 5y5y CPI Swap Rate
10
15
20
12 13 14 15 1610Y TIPS Relative ASW
23Source: Haver Analytics, Barclays Research
y y p , y y p
Implementation / Communication strategy• Overall, the Treasury should consider making modest cuts to coupon auction sizes.
• Long end of the nominal curve and TIPS appear to be the best candidates for making modest cuts
• Were the Treasury to pursue much deeper cuts, they should be spread across all tenors to maintain a buffer to minimum size needed for liquidityminimum size needed for liquidity
• The Treasury should gradually reduce auction sizes maintaining its policy of being regular and predictable.
• Specifically with respect to TIPS, the Treasury should emphasise commitment to the program.
• It should stress that reduction in TIPS auction sizes is in line with the overall policy of reducing coupon sizes toIt should stress that reduction in TIPS auction sizes is in line with the overall policy of reducing coupon sizes to make way for T-bills.
• Highlight that from the peak, reduction in nominal coupon sizes is still larger than that for TIPS
• Note that TIPS auction sizes may very well be raised again if coupon auction sizes are raised.
• The Treasury should increase the frequency of new issue 5y TIPS auctions
• The Treasury should issue the same, or slightly lower, annual amount but across two cusips, each reopened once, where one would mature in April and the other in Octoberwhere one would mature in April and the other in October.
• This would add another maturity seasonal point to the curve; this would help the inflation derivatives market . The Treasury should point to this as an example of greater commitment to the inflation market.
Th T ld b i h h l i i hi h ill d h d• The Treasury would save borrowing costs through a lower auction concession which will reduce the need to cut sizes.
• Most April issues trade cheap because of their large size. The large size of the April series also exacerbates the pressure on them when they roll out of 1-30y TIPS indices
24
pressure on them when they roll out of 1 30y TIPS indices
TBAC Charge # 2
• The extent of publicly available data on transactions in U.S. Treasury markets is substantially less than what is available for other major asset classes. For example, cash Treasury securities do not have any public transaction or order book reporting.
• Observers have cited several potential benefits associated with greater transparency in the Treasury market including 1) improved market efficiency, 2) reduced transaction costs, 3) enhanced fairness, 4) improved risk management practices and 5) greater participation by new entrants, who may otherwise be reluctant to engage in a market where they have less information than their counterparties.
• Others have suggested that the current level of transparency in the Treasury market is sufficient and note that additional trade reporting requirements could adversely affect the willingness of some intermediaries to engage in “block” trading of Treasury securities which could impair market liquidity
• We would like the Committee to comment the appropriate level and form of data that should be made available to the public, including that related to market prices, trading volumes, market participant inventories, and trends in market risk and liquidity.
1
Trace in Corp Bond Mkt
2
• The Trade Reporting and Compliance Engine (TRACE), introduced in 2002, captures real-time transaction data for all eligible public and private (144A) corporate bonds, including investment grade, high-yield and convertible debt, agency debt, and asset and mortgage-backed securities.
• Per FINRA, TRACE procedures and practices increase transparency by fully disseminating transaction information related to trades—namely time, price and volume. Brokers and firms are required to report to TRACE within 15 minutes of effecting a transaction (for corporate bonds)
• Per FINRA, bond liquidity may become clearer by consulting a bond's trading history—if a bond has not traded in days or weeks, it may be illiquid.
• Helps in discovery of the costs associated with buying or selling a bond before actually trading a bond
Trace Stats & History
3
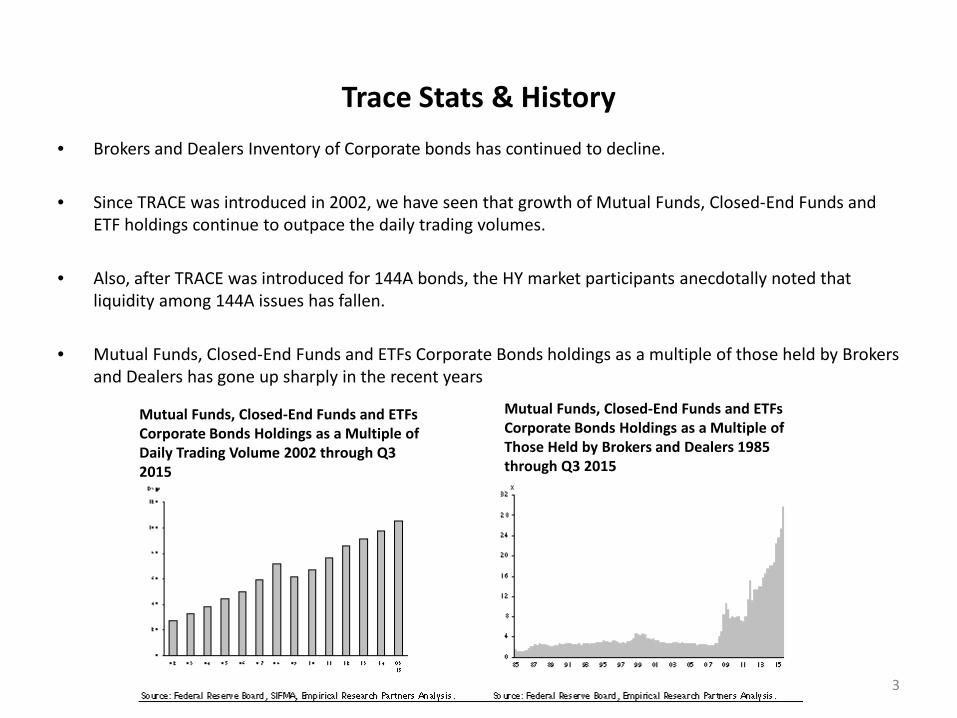
Mutual Funds, Closed-End Funds and ETFs Corporate Bonds Holdings as a Multiple of Daily Trading Volume 2002 through Q3 2015
Mutual Funds, Closed-End Funds and ETFs Corporate Bonds Holdings as a Multiple of Those Held by Brokers and Dealers 1985 through Q3 2015
• Brokers and Dealers Inventory of Corporate bonds has continued to decline.
• Since TRACE was introduced in 2002, we have seen that growth of Mutual Funds, Closed-End Funds and ETF holdings continue to outpace the daily trading volumes.
• Also, after TRACE was introduced for 144A bonds, the HY market participants anecdotally noted that liquidity among 144A issues has fallen.
• Mutual Funds, Closed-End Funds and ETFs Corporate Bonds holdings as a multiple of those held by Brokers and Dealers has gone up sharply in the recent years
Equity Market
Equity Market • All-to-all platform through centralized
exchanges: e.g. NYSE, NASDAQ
• Price transparency: continuous pre-trade information, publicly available best quotation etc.
• Comprehensive execution information: immediate availability of prices and sizes of completed trades
• Smooth risk transfer: less transaction cost, better inventory risk sharing
Treasury Market • Fragmented platforms: dealer & vendor
dependent
• Price discovery: more difficult due to lack of centralized platform
• Opaque execution information: details of executed trades unavailable to all market participants
• Risk transfer: higher transaction cost, increasing inventory carry cost
4
Treasury Market
• Past developments increasing price transparency were actually through direct access platforms.
• Tradeweb, led by a consortium of dealers, provided the first true visibility into off-the-run pricing where levels were executable.
• Bloomberg, though older, was late to offer direct access so the transparency was lacking.
• This was because unlike other markets, risk transfer in Treasuries has been and remains principal-based, with dealers expected to be the conduit between end users.
5
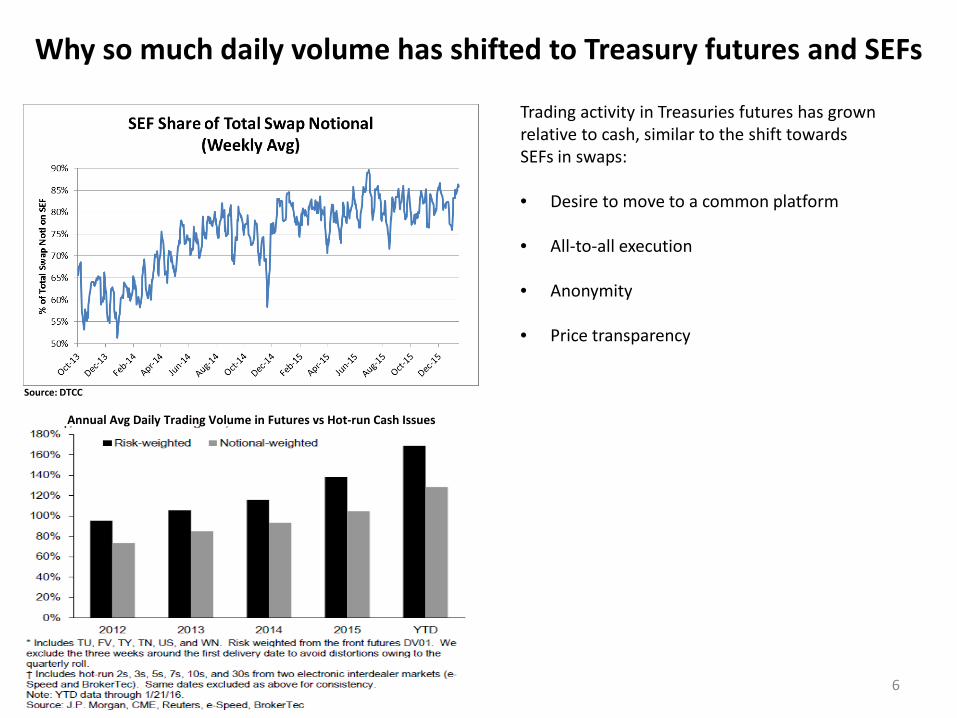
Why so much daily volume has shifted to Treasury futures and SEFs
Trading activity in Treasuries futures has grown relative to cash, similar to the shift towards SEFs in swaps: • Desire to move to a common platform
• All-to-all execution
• Anonymity • Price transparency
6
Annual Avg Daily Trading Volume in Futures vs Hot-run Cash Issues
Source: DTCC
What could Trace or SDR in Treasuries look like
7
Similarities to Trace / SDR: • Block size -> all blocks above “X” amount would be reported as “X+”
• “X” could equal 240mm similar to SDR
• Timing -> All reportable transactions would need to be recorded within 15 minutes Differences to Trace / SDR: • Limit on what transactions need to be reported -> minimum threshold for transaction size
• Volumes in treasury market are significantly larger than other markets • Unless you had an all-to-all platform, operationally reporting all transactions would be tedious and too time
consuming • Transactional data on small odd-lot amount may not add to increased transparency and liquidity in the market
• Consider grouping trades by maturity bucket
• By giving trace data on specific off-the-run issues you could diminish liquidity and widen bid/ask -> opposite of goal
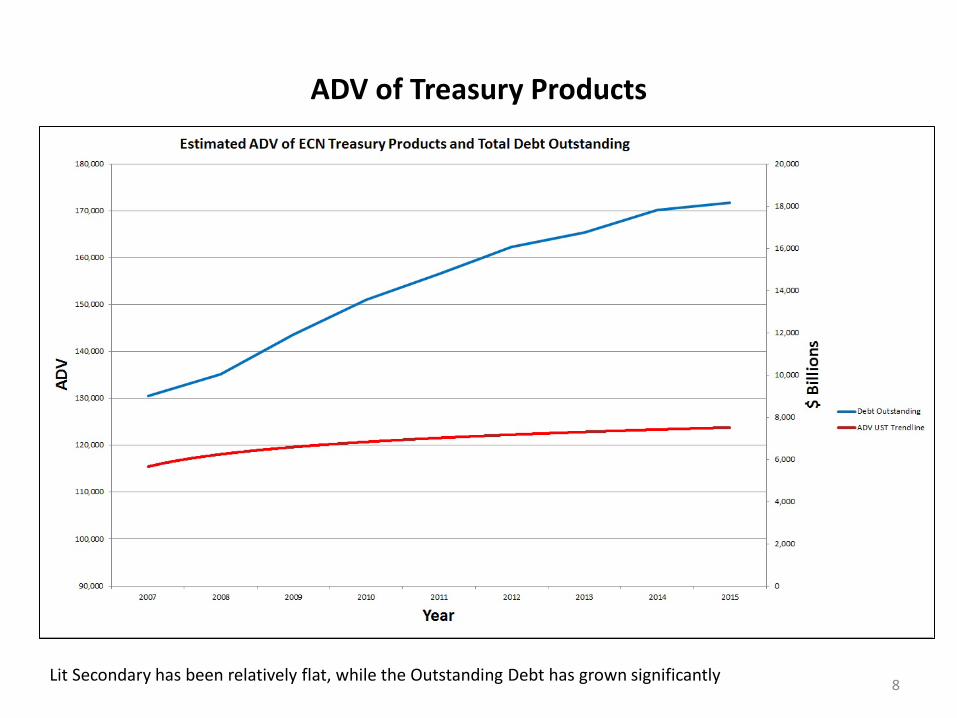
ADV of Treasury Products
8 Lit Secondary has been relatively flat, while the Outstanding Debt has grown significantly
Is Public UST Information Sufficient? Lit vs Dark
The market for active UST's is bifurcated between Lit and Dark venues • Lit Venues (Interdealer ECN's): Broker Tec (BTEC), eSpeed (ESPD), Dealer Web
• BTEC (70+% market share for 2015) sells their market data that includes full depth of book, all order levels for a fee of $20,000 per month. Information is delivered via API.
• ESPD also sells full order depth for substantially less, and maintains ~25% market share (2015 Stats). • Dealer Web market share is small.
• Dark Venues (Dealer to Client) - no market data is made available
• Tradeweb has not allowed NON banks in as market makers. • Bloomberg (BBERG) only recently has allowed NON Banks. Citadel is active, and Virtu is working to on
board. Through BPipe on BBERG, and for ~$10,000 per month, post traded volumes can be seen via an api.
9
Is Public UST Information Sufficient?
• Based upon market participant assumptions, the D to C Dark space is as large as the interdealer space, yet
Price, Time, and Volume are basically dark. • All pre or post trade data could easily be made available without attribution from D to D and all D to C
venues. • Only issue to be resolved would be whether a real time display or an agreed upon delay is
implemented analogous to TRACE for Corporate. • Given that in active USTs, we’re only speaking about 2's 3's 5's 7's 10's and 30's, the data capture and
publication should be very easy.
10
Is Public UST Information Sufficient? (Cont’d)
• In Off the Runs ("OTR's") - which includes hundreds of cusips - trade capture and reporting would be much
more difficult • Given the illiquid nature of OTR's, a TRACE-like 15 minute delay in reporting Price, Time & Volume
would have limited market impact.
• An advisable change to public reporting of Active UST data would be a minimum volume threshold in the D to C space.
• For all ECN data, as close to real time reporting could be expected for any volume amounts traded. In the D to C space, however, amounts less than $X Million in ALL active issues could require a reporting timeline of no more than 5 minutes. In Off the Runs, regardless of amounts traded, a reporting window of no more than 15 minutes could be required.
11
Additional UST Information that should be made available
• A consolidated and aggregated UST ACTIVE TAPE, could easily be made available for public consumption, yet it would only capture approximately 50% of the total UST market trades.
• This data could easily be aggregated from the existing ECN's, and the reporting delay is all that is really left to be determined.
• A related question: do the following also get called in for reporting and the appropriate delays in reporting?
• Dealer to Client Direct • Electronic RFQ • Single Bank Portal • Telephone Market • Chat Room Trades
• For actives, a sub 5 minute delay would be recommended. Off the Runs, a 15 minute delay would be
recommended, regardless of execution venue. Again, Price, Time, and Volume inputs would be required.
12
Secondary Market Transparency
• Although equally as large, the D to C component of ACTIVE USTs - especially Block Transactions, and the drilling down “at transaction level data" - could be viewed as disruptive to the current “working environment" in the Direct Dealer to Client space.
• Large buy side firms are trying to manage large risk positions and hope to minimize market impact.
• In the traditional, principal risk transfer model - deployed in USTs by the dealers - anything more
than PTV, post trade with a notional +/- $XMillion traded with no longer than 5 minute and 15 minute reporting requirements will have limited negative impact. In addition, it will hopefully bring new players to the market place.
13
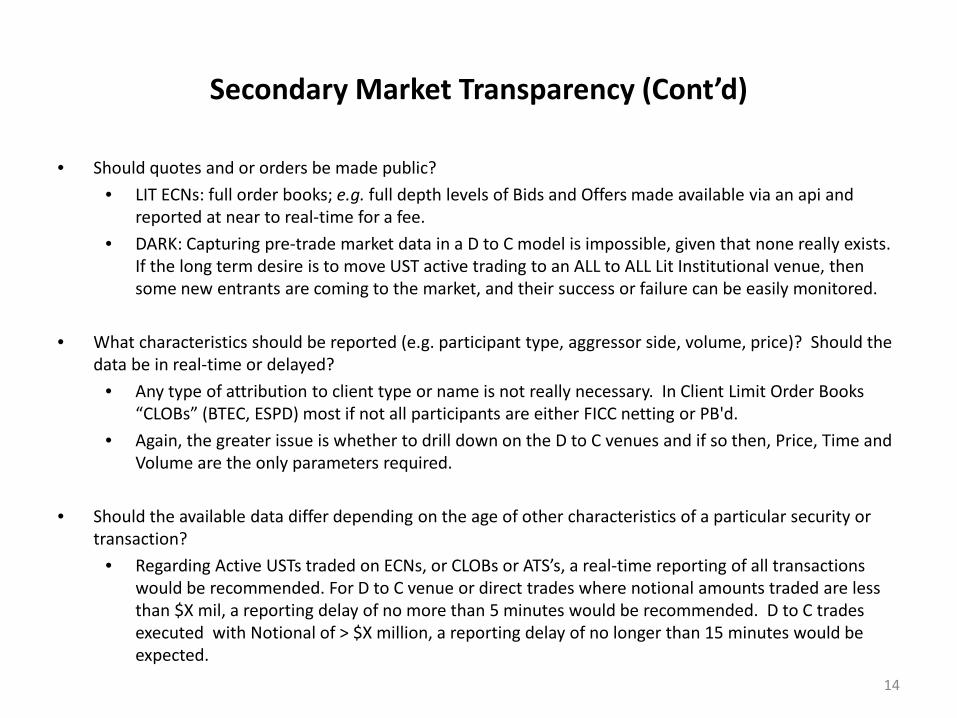
Secondary Market Transparency (Cont’d)
• Should quotes and or orders be made public? • LIT ECNs: full order books; e.g. full depth levels of Bids and Offers made available via an api and
reported at near to real-time for a fee. • DARK: Capturing pre-trade market data in a D to C model is impossible, given that none really exists.
If the long term desire is to move UST active trading to an ALL to ALL Lit Institutional venue, then some new entrants are coming to the market, and their success or failure can be easily monitored.
• What characteristics should be reported (e.g. participant type, aggressor side, volume, price)? Should the
data be in real-time or delayed? • Any type of attribution to client type or name is not really necessary. In Client Limit Order Books
“CLOBs” (BTEC, ESPD) most if not all participants are either FICC netting or PB'd. • Again, the greater issue is whether to drill down on the D to C venues and if so then, Price, Time and
Volume are the only parameters required. • Should the available data differ depending on the age of other characteristics of a particular security or
transaction? • Regarding Active USTs traded on ECNs, or CLOBs or ATS’s, a real-time reporting of all transactions
would be recommended. For D to C venue or direct trades where notional amounts traded are less than $X mil, a reporting delay of no more than 5 minutes would be recommended. D to C trades executed with Notional of > $X million, a reporting delay of no longer than 15 minutes would be expected.
14
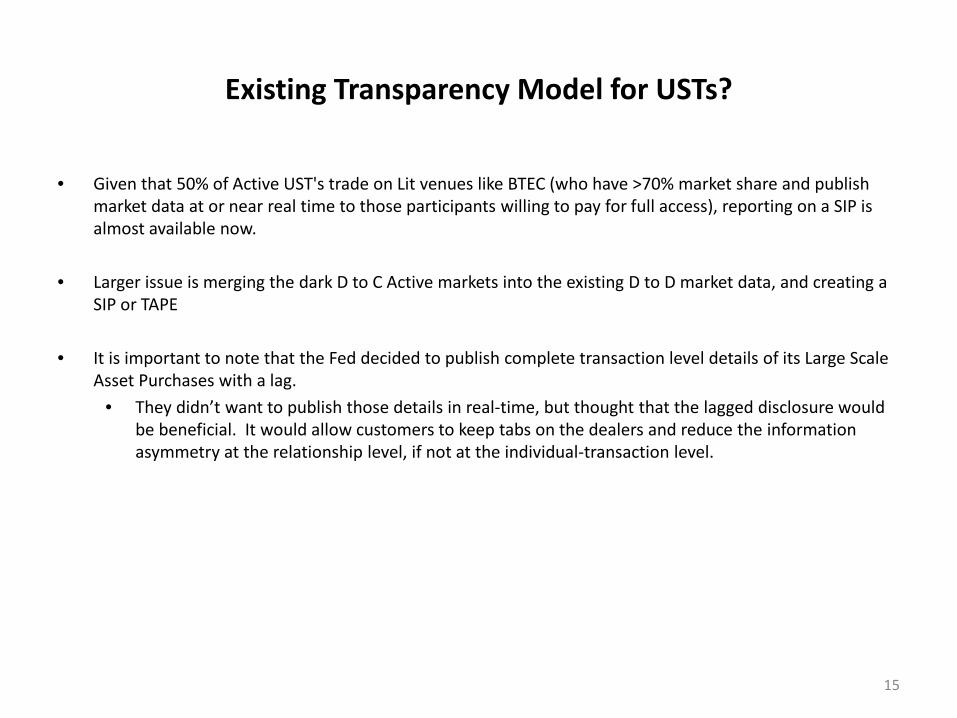
Existing Transparency Model for USTs?
• Given that 50% of Active UST's trade on Lit venues like BTEC (who have >70% market share and publish market data at or near real time to those participants willing to pay for full access), reporting on a SIP is almost available now.
• Larger issue is merging the dark D to C Active markets into the existing D to D market data, and creating a SIP or TAPE
• It is important to note that the Fed decided to publish complete transaction level details of its Large Scale Asset Purchases with a lag.
• They didn’t want to publish those details in real-time, but thought that the lagged disclosure would be beneficial. It would allow customers to keep tabs on the dealers and reduce the information asymmetry at the relationship level, if not at the individual-transaction level.
15
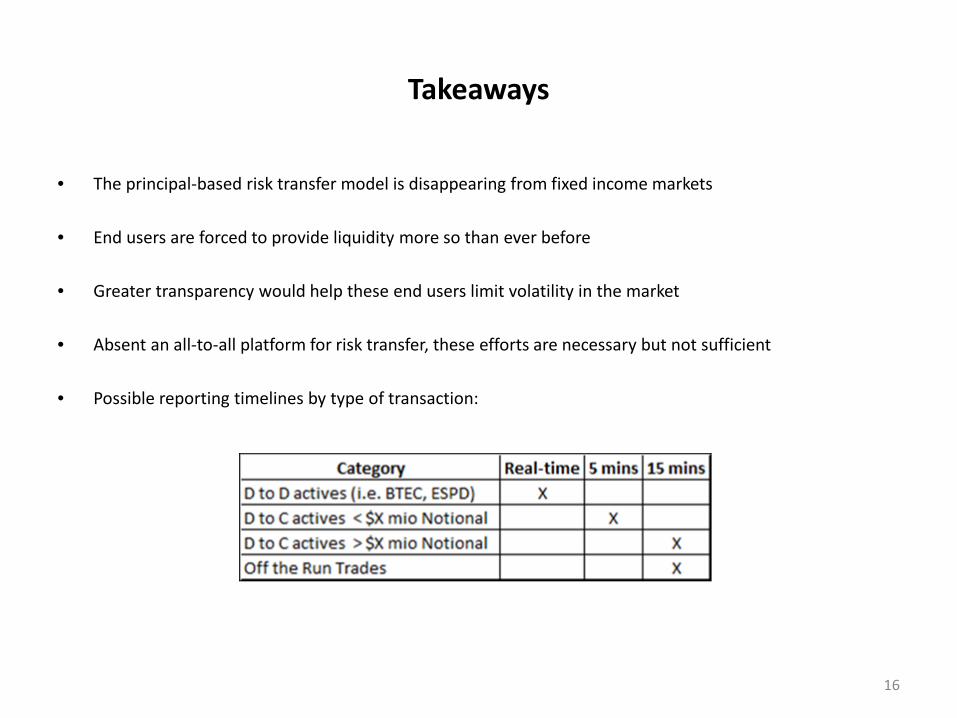
Takeaways
• The principal-based risk transfer model is disappearing from fixed income markets
• End users are forced to provide liquidity more so than ever before
• Greater transparency would help these end users limit volatility in the market
• Absent an all-to-all platform for risk transfer, these efforts are necessary but not sufficient
• Possible reporting timelines by type of transaction:
16