Embed Size (px)
Citation preview
HAL Id: hal-00601261https://hal.archives-ouvertes.fr/hal-00601261
Submitted on 20 Jun 2011
HAL is a multi-disciplinary open accessarchive for the deposit and dissemination of sci-entific research documents, whether they are pub-lished or not. The documents may come fromteaching and research institutions in France orabroad, or from public or private research centers.
L’archive ouverte pluridisciplinaire HAL, estdestinée au dépôt et à la diffusion de documentsscientifiques de niveau recherche, publiés ou non,émanant des établissements d’enseignement et derecherche français ou étrangers, des laboratoirespublics ou privés.
Trend Analysis in Polls, Topics, Opinions and AnswersGary Benattar, Philippe Trébuchet
To cite this version:Gary Benattar, Philippe Trébuchet. Trend Analysis in Polls, Topics, Opinions and Answers. 2011.<hal-00601261>
Trend Analysis in Polls, Topics, Opinions and
Answers
Gary Benattar∗ and Philippe Trebuchet
[email protected], [email protected]
Department of Computer Science
University of Paris 6 - Jussieu, Paris, France
June 20, 2011
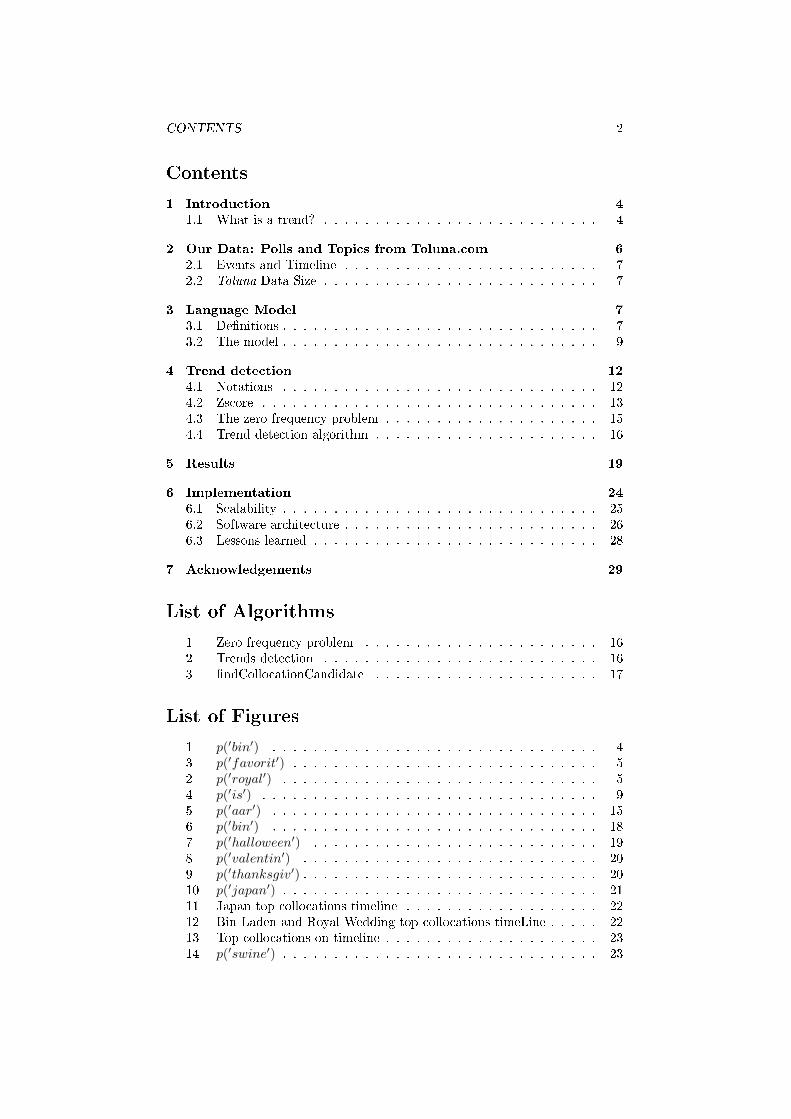
Abstract
The goal of this work was to extract polls and opinions trends froma very large corpus. We developed a system that performs single wordstrend detection and also detects collocation candidates as well as collo-cation trends. We conducted experiments on a real-life repository, madeavailable to us by Toluna.com, and counts around 23 millions documents.Our contributions were twofold: (1) we characterized the problem andchose the appropriate measures (eg z-score) to identify trends, (2) wedesigned a fully scalable system, leveraging Hadoop 1, Zookeeper 2 andHbase 3. This system includes a visual interface that displays a timelinehighlighting trends in a 2-year window, as well as statistical reports bysingle words and n-grams.
∗M.Sc. project in software engineering under the supervision of Dr. Philippe Trebuchet.Laboratory of Computer Science, Paris 6 (LIP6) APR (Algorithms, Programs and Resolu-tions) team
1http://hadoop.apache.org/2http://zookeeper.apache.org/3http://hbase.apache.org/
1
CONTENTS 2
Contents
1 Introduction 4
1.1 What is a trend? . . . . . . . . . . . . . . . . . . . . . . . . . . . 4
2 Our Data: Polls and Topics from Toluna.com 6
2.1 Events and Timeline . . . . . . . . . . . . . . . . . . . . . . . . . 72.2 Toluna Data Size . . . . . . . . . . . . . . . . . . . . . . . . . . . 7
3 Language Model 7
3.1 De�nitions . . . . . . . . . . . . . . . . . . . . . . . . . . . . . . . 73.2 The model . . . . . . . . . . . . . . . . . . . . . . . . . . . . . . . 9
4 Trend detection 12
4.1 Notations . . . . . . . . . . . . . . . . . . . . . . . . . . . . . . . 124.2 Zscore . . . . . . . . . . . . . . . . . . . . . . . . . . . . . . . . . 134.3 The zero frequency problem . . . . . . . . . . . . . . . . . . . . . 154.4 Trend detection algorithm . . . . . . . . . . . . . . . . . . . . . . 16
5 Results 19
6 Implementation 24
6.1 Scalability . . . . . . . . . . . . . . . . . . . . . . . . . . . . . . . 256.2 Software architecture . . . . . . . . . . . . . . . . . . . . . . . . . 266.3 Lessons learned . . . . . . . . . . . . . . . . . . . . . . . . . . . . 28
7 Acknowledgements 29
List of Algorithms
1 Zero frequency problem . . . . . . . . . . . . . . . . . . . . . . . 162 Trends detection . . . . . . . . . . . . . . . . . . . . . . . . . . . 163 �ndCollocationCandidate . . . . . . . . . . . . . . . . . . . . . . 17
List of Figures
1 p(′bin′) . . . . . . . . . . . . . . . . . . . . . . . . . . . . . . . . 43 p(′favorit′) . . . . . . . . . . . . . . . . . . . . . . . . . . . . . . 52 p(′royal′) . . . . . . . . . . . . . . . . . . . . . . . . . . . . . . . 54 p(′is′) . . . . . . . . . . . . . . . . . . . . . . . . . . . . . . . . . 95 p(′aar′) . . . . . . . . . . . . . . . . . . . . . . . . . . . . . . . . 156 p(′bin′) . . . . . . . . . . . . . . . . . . . . . . . . . . . . . . . . 187 p(′halloween′) . . . . . . . . . . . . . . . . . . . . . . . . . . . . 198 p(′valentin′) . . . . . . . . . . . . . . . . . . . . . . . . . . . . . 209 p(′thanksgiv′) . . . . . . . . . . . . . . . . . . . . . . . . . . . . . 2010 p(′japan′) . . . . . . . . . . . . . . . . . . . . . . . . . . . . . . . 2111 Japan top collocations timeline . . . . . . . . . . . . . . . . . . . 2212 Bin Laden and Royal Wedding top collocations timeLine . . . . . 2213 Top collocations on timeline . . . . . . . . . . . . . . . . . . . . . 2314 p(′swine′) . . . . . . . . . . . . . . . . . . . . . . . . . . . . . . . 23
LIST OF TABLES 3
15 p(′swayze′) . . . . . . . . . . . . . . . . . . . . . . . . . . . . . . 2416 p(′lebron′) . . . . . . . . . . . . . . . . . . . . . . . . . . . . . . . 2417 Overall system architecture . . . . . . . . . . . . . . . . . . . . . 28
List of Tables
1 Bracketing content . . . . . . . . . . . . . . . . . . . . . . . . . . 142 Final z-score threshold . . . . . . . . . . . . . . . . . . . . . . . . 153 The zero frequency problem where w = 'aar' . . . . . . . . . . . 154 Zero frequency threshold . . . . . . . . . . . . . . . . . . . . . . . 165 Interesting Trends . . . . . . . . . . . . . . . . . . . . . . . . . . 216 Japan earthquake . . . . . . . . . . . . . . . . . . . . . . . . . . 217 HBase table architecture . . . . . . . . . . . . . . . . . . . . . . . 26
1 INTRODUCTION 4
1 Introduction
1.1 What is a trend?
This work focuses on analyzing trends on a popular market research Web site,toluna.com. Toluna, is the world's largest online market research panel and on-line survey software provider to the global market research industry. Providingonline market research sample and online research panel building expertise toover 1,500 of the world's leading market research agencies.
Toluna.com is a Web community site focusing on polls and opinions of people.Our mission is to allow anyone to know what the world thinks on any issue andfoster a community of insight through the use of Web2.0 technology. Each pollcreated has value in itself; it is a snapshot of the world's opinions and as a resulthas tremendous value for community members interested in a particular topic.
According to Merriam-Webster, a trend can be de�ned as �the general move-ment over time of a statistically detectable change�. In our speci�c case, we wantto observe variations of occurrences of words or topics so as to identify interest-ing events. Trends are easily observed on the graphical representations of timeseries distribution as they appear as peaks.
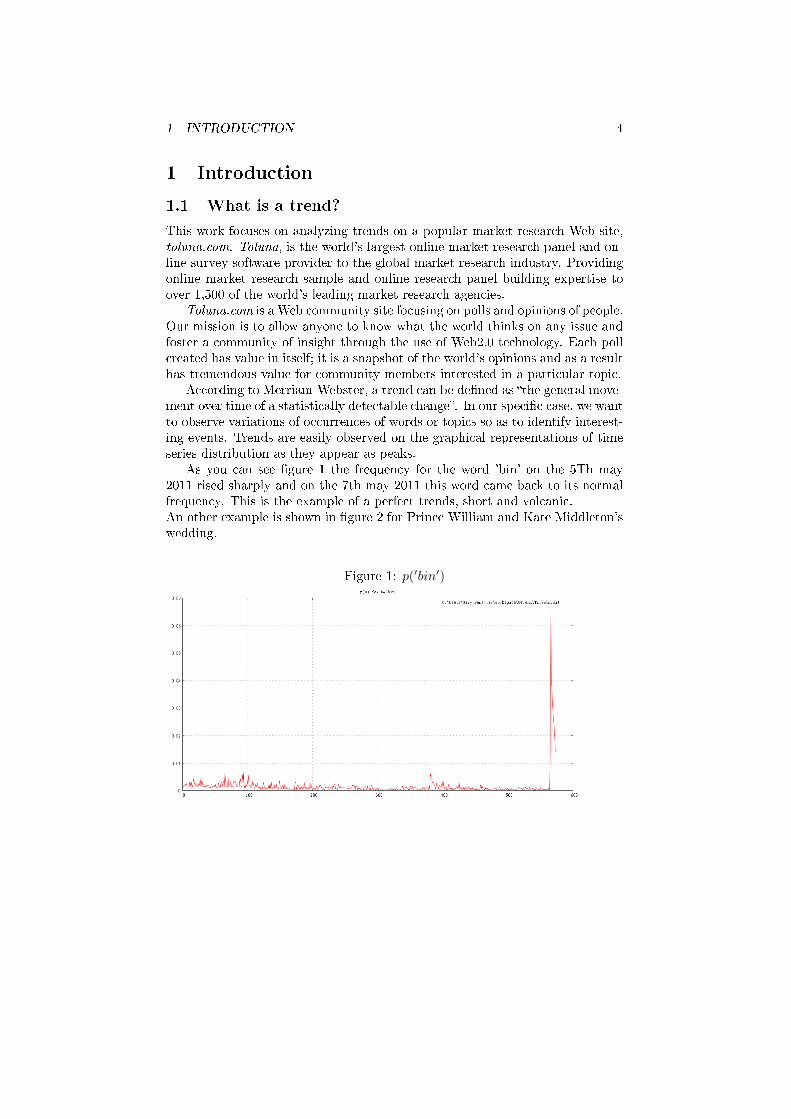
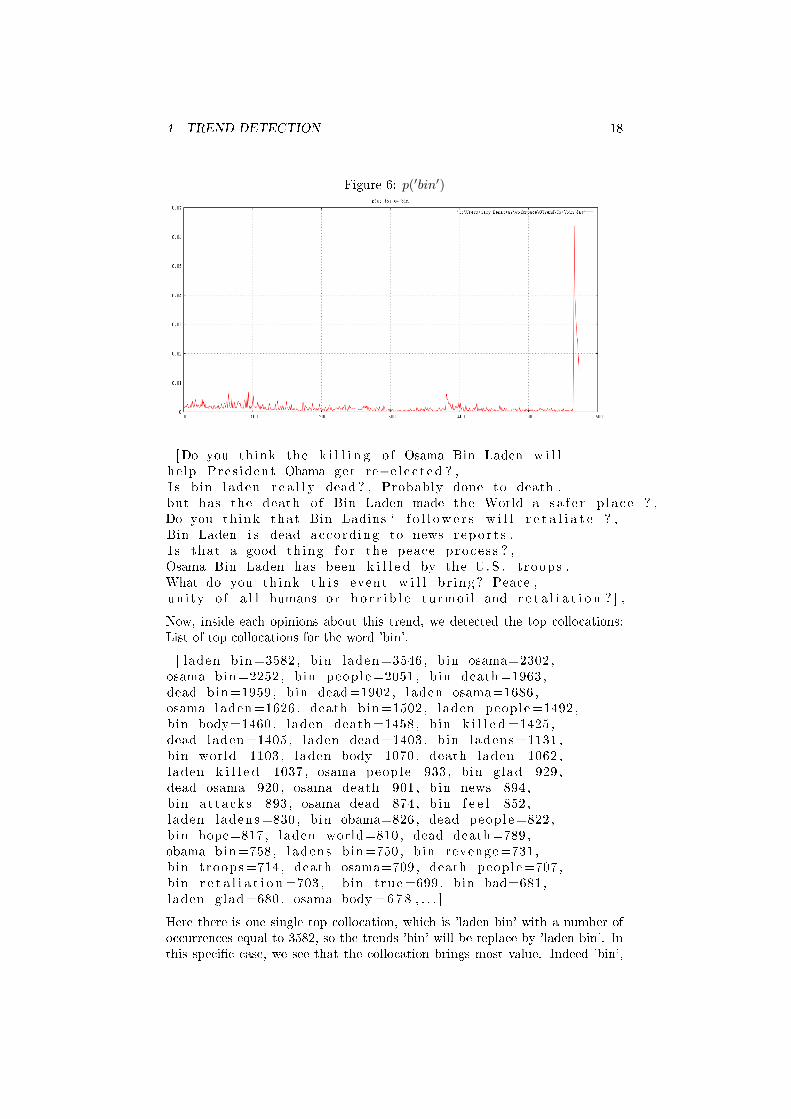
As you can see �gure 1 the frequency for the word 'bin' on the 5Th may2011 rised sharply and on the 7th may 2011 this word came back to its normalfrequency. This is the example of a perfect trends, short and volcanic.An other example is shown in �gure 2 for Prince William and Kate Middleton'swedding.
Figure 1: p(′bin′)
1 INTRODUCTION 5
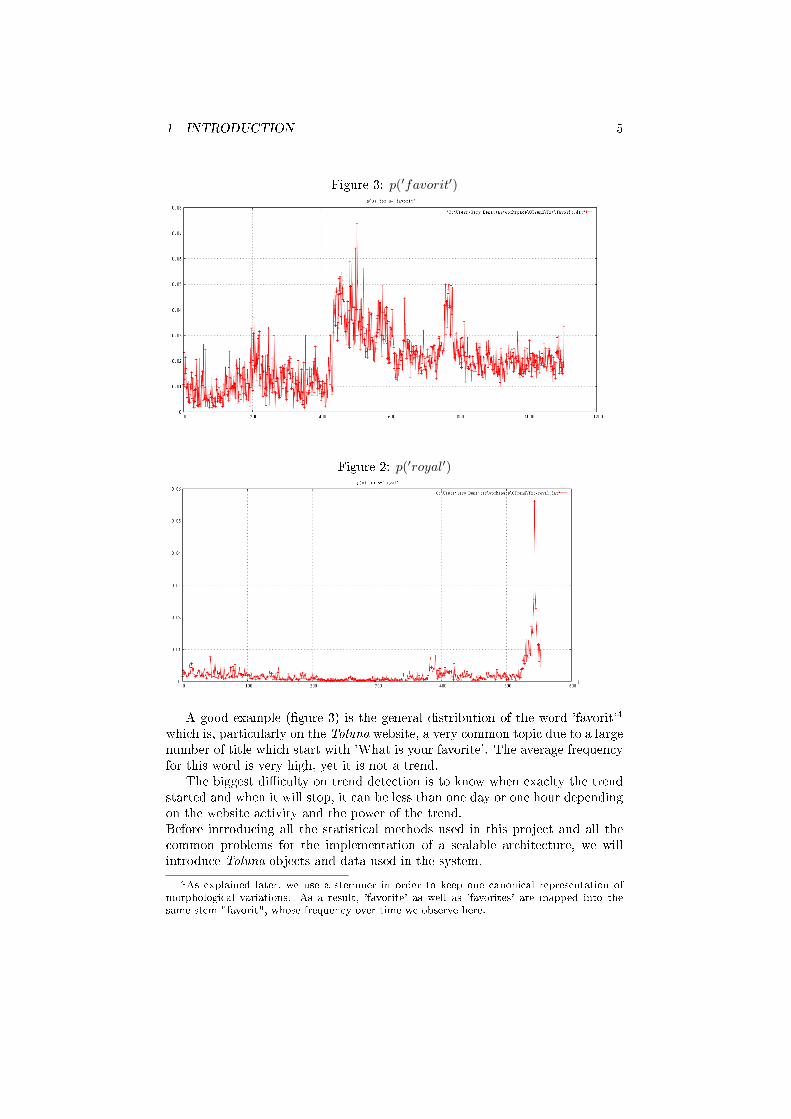
Figure 3: p(′favorit′)
Figure 2: p(′royal′)
A good example (�gure 3) is the general distribution of the word 'favorit'4
which is, particularly on the Toluna website, a very common topic due to a largenumber of title which start with 'What is your favorite'. The average frequencyfor this word is very high, yet it is not a trend.
The biggest di�culty on trend detection is to know when exaclty the trendstarted and when it will stop, it can be less than one day or one hour dependingon the website activity and the power of the trend.Before introducing all the statistical methods used in this project and all thecommon problems for the implementation of a scalable architecture, we willintroduce Toluna objects and data used in the system.
4As explained later, we use a stemmer in order to keep one canonical representation ofmorphological variations. As a result, 'favorite' as well as 'favorites' are mapped into thesame stem "favorit", whose frequency over time we observe here.
2 OUR DATA: POLLS AND TOPICS FROM TOLUNA.COM 6
2 Our Data: Polls and Topics from Toluna.com
The data we used for our work is based on toluna.com site activity from 2008to May 2011. Toluna.com has two basic types of objects:
• Topics: A Topic in toluna.com is a kind of forum centered around a mainquestion or topic asked by one user to the rest of the community. Forexample: would you actually date someone you met on the internet? is atopic currently running on toluna.com that has collected several hundredsresponses/opinions. For example: �No way there are to many sickos out
there! Besides I am married so I am not looking to date!�See here: toluna.com/opinions/896033/would-actually-date-someone-internet.htm.
• Polls: A poll in toluna.com is a simple question which can be answeredin one or few clicks. For example: Whats your favorite season? Summer,
Fall, Winter, Spring, I love them all, I don't have a favorite season.
See here: toluna.com/polls/1531080/Whats-your-favorite-season.htm
A topic internal structure can be de�ned as follow:
{Ti t l e , Opinion ∗ ,Date , . . . , . . . , . . . }−> { 'Do you l i k e su sh i ? ' , { 'Yes I l ove i t ' , 'No I hatef i s h , ' su sh i ? what ' s t h i s ? ' } , ' 2 0 0 8 − 0 1 − 0 1 ' , . . . , . . . , . . . }
A Topic can also contains other elements like videos or images, but they will benot used in this project.
An opinion internal structure can be de�ned as follow:
{TEXT, Opinion ∗ , Date}−> { 'Yes I l ove su sh i with wasabi ' , ' Rea l ly you l i k ewasabi ? ' , 2008−02−02}
All the elements in the topic schema is all the elements used for the analysis. Infact most of the trend detection will be done on the topic title and not on theopinions. The opinions will be used to detect collocations for a speci�c topic inorder to specify an elected trend.
A poll internal structure can be de�ned as follow:
{Question , Answer ∗ , Date}−> { 'Do you l i k e su sh i ? ' , { 'Yes ' , 'No ' , ' Never try ' } ,2009−12−12}
A poll can be described as a short survey with only one question and multipleanswers which can be 'single choice' answers ('Yes','No') or 'multiple choice'answers ('Love sushi','and also grilled chicken'). In this project poll questionwill be used for single word trend detection.
3 LANGUAGE MODEL 7
2.1 Events and Timeline
In our project we will consider the following events:
• Topic creation: In this case we will simply consider the topic title as anew document added at the speci�c creation time of the topic. Words inthe topic will be analyzed and their frequencies will be updated.
• Opinion on a topic: In this case we will in fact ignore the text of theopinion but simply repeat the topic title.
• Poll creation: We will add the text of the poll and the answers, we willanalyze it and update the frequencies of the words.
• Vote on a poll: Similar to what we do for opinions, we will simply considerthe text of the poll one more time for each vote.
The sum of the events for a given interval is all the activity on the Toluna.comwebsite. Everytime someone is doing something on the website will produce anevent and will be added to the trend analysis.
2.2 Toluna Data Size
In this project we used the Toluna.com database from the beginning of 2008 upto May 2011. The data is anonymized and contains the following data:
• 1,133,635 Polls
• 16,694,422 Opinions
• 668,295 Topics
• 4,524,688 Answers
In the next section we describe how the data is modelized in this project.
3 Language Model
3.1 De�nitions
In our language model we will use single words and bigrams as our basic units.A bigram is a pair of words that appear at least once on the same sentencewithin a distance of 5 other words.
For example, in the sentence above the following bigrams can be extracted:
' language−model ' ' language−use ' ' s i n g l e−word '' s i n g l e−bigram ' 'word−bigram ' ' bas ic−bigram ' ' bas ic−unit '' bigram−pair ' ' bigram−word ' ' pa ir−word ' 'word−appear 'e t c . . .
3 LANGUAGE MODEL 8
Note that in our de�nition, the words in a bigram do not have to be adjacentbut can be separated by other words and they can appear in any order. We use5 as the maximum bigram distance, as �Most of the lexical relations involvinga word w can be retrieved by examining the neighborhood of w, wherever itoccurs whitin a span of �ve�[8] (-5 and +5 around w) . This will allow us todiscover collocations, where a collocation is de�ned as a recurrent combinationsof words that co-occur more often than expected by chance and that correspondto aribtrary word usage[8].
• Collocations
In this work, collocations are used in order to specify a trend. Trendanalysis is done on topics and polls. Once we detect a trend td we extract,count and sort all the collocations in the opinions and the answers whichbelongs to a topic or a poll containing td. Finally td will be equal to thetop collocation (For more details see 4.4 Trend detection algorithm).
We decided to show collocations only for trends, because the collocationalways provides additional information because it occurs many times inthe corpus. For example, in the collocation 'Mark Zuckerberg' it couldbe argued that 'Zuckerberg' is good enough and that 'Mark' is addingtoo litle information. However, we chose to use the collocation anywaysbecause in the more general case it can help disambiguate.
• Stop words
A stop word is a common word which give us no information about thecurrent topic or the current trend but that are mostly grammatical wordssuch as articles, prepositions, etc. The most common stop words in Englishare: 'the', 'a', 'an', 'do','you','I','about',...
Generally a list of stop words is used in text analysis which is not re-lated to the actual context of the analysis and are language dependent. Inprocessing of natural language data, stop words will be �ltered out. Thesentence above after �ltering out the stop words will look like: 'Gener-
ally list stop words text analysis related actual context analysis language
dependent'.
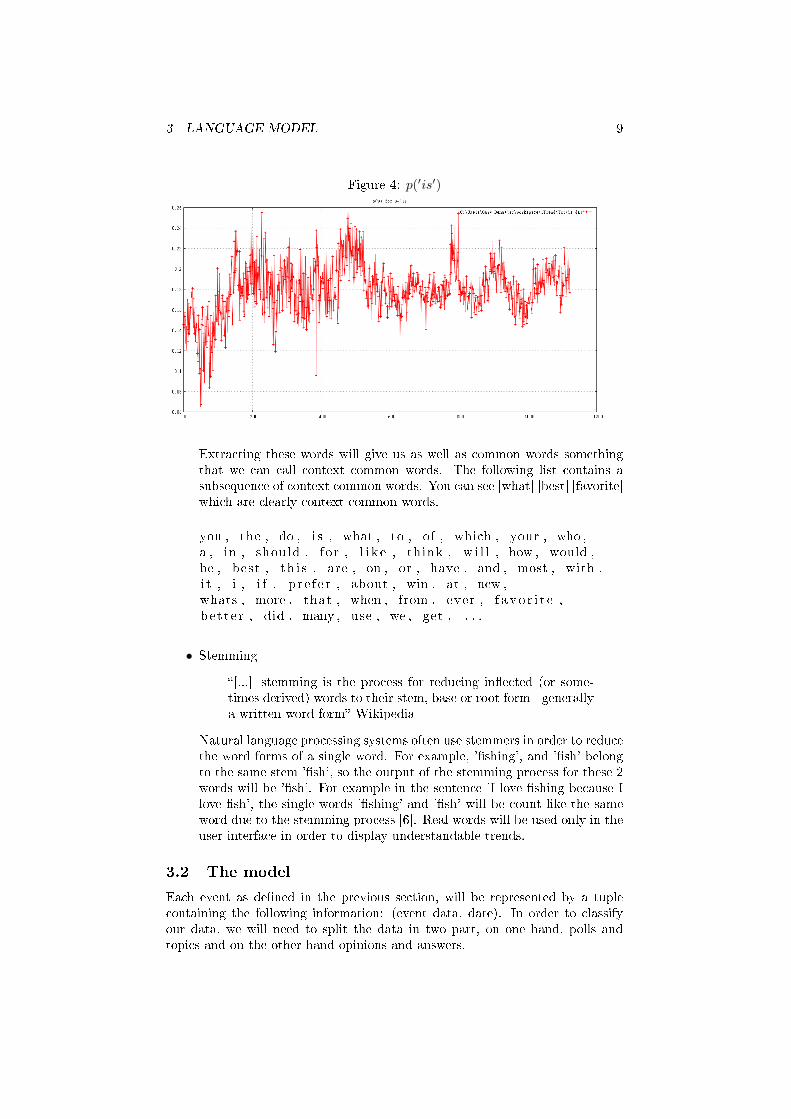
For example in the snowball5 project or lucene 6 it is necessary to populateor create the stop word list for each additional language. In this work, wepropose to not use a �xed stop words list but rather to use statistics to beable to ignore words that appear too frequently or with a frequency too�at. For example recurring topics on Toluna should not be considered astrends. (�gures 4).
5http://snowball.tartarus.org/6http://lucene.apache.org/
3 LANGUAGE MODEL 9
Figure 4: p(′is′)
Extracting these words will give us as well as common words somethingthat we can call context common words. The following list contains asubsequence of context common words. You can see [what] [best] [favorite]which are clearly context common words.
you , the , do , i s , what , to , of , which , your , who ,a , in , should , for , l i k e , think , w i l l , how , would ,be , best , th i s , are , on , or , have , and , most , with ,i t , i , i f , p r e f e r , about , win , at , new ,whats , more , that , when , from , ever , f a v o r i t e ,bet te r , did , many , use , we , get , . . .
• Stemming
�[...] stemming is the process for reducing in�ected (or some-times derived) words to their stem, base or root form - generallya written word form� Wikipedia
Natural language processing systems often use stemmers in order to reducethe word forms of a single word. For example, '�shing', and '�sh' belongto the same stem '�sh', so the output of the stemming process for these 2words will be '�sh'. For example in the sentence 'I love �shing because Ilove �sh', the single words '�shing' and '�sh' will be count like the sameword due to the stemming process [6]. Real words will be used only in theuser interface in order to display understandable trends.
3.2 The model
Each event as de�ned in the previous section, will be represented by a tuplecontaining the following information: (event data, date). In order to classifyour data, we will need to split the data in two part, on one hand, polls andtopics and on the other hand opinions and answers.
3 LANGUAGE MODEL 10
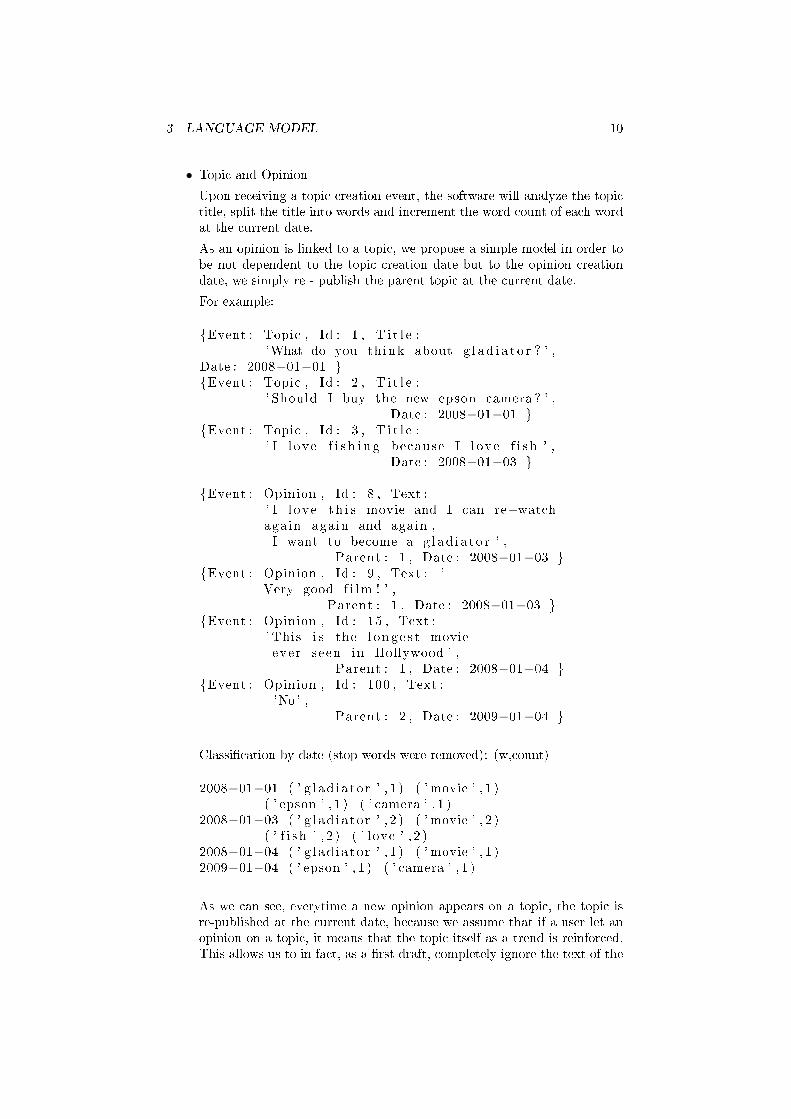
• Topic and Opinion
Upon receiving a topic creation event, the software will analyze the topictitle, split the title into words and increment the word count of each wordat the current date.
As an opinion is linked to a topic, we propose a simple model in order tobe not dependent to the topic creation date but to the opinion creationdate, we simply re - publish the parent topic at the current date.
For example:
{Event : Topic , Id : 1 , T i t l e :'What do you think about g l a d i a t o r ? ' ,
Date : 2008−01−01 }{Event : Topic , Id : 2 , T i t l e :
' Should I buy the new epson camera ? ' ,Date : 2008−01−01 }
{Event : Topic , Id : 3 , T i t l e :' I l ove f i s h i n g because I l ove f i s h ' ,
Date : 2008−01−03 }
{Event : Opinion , Id : 8 , Text :' I l ove t h i s movie and I can re−watchagain again and again ,I want to become a g l ad i a to r ' ,
Parent : 1 , Date : 2008−01−03 }{Event : Opinion , Id : 9 , Text : '
Very good f i lm ! ' ,Parent : 1 , Date : 2008−01−03 }
{Event : Opinion , Id : 15 , Text :' This i s the l ong e s t movieever seen in Hollywood ' ,
Parent : 1 , Date : 2008−01−04 }{Event : Opinion , Id : 100 , Text :
'No ' ,Parent : 2 , Date : 2009−01−04 }
Classi�cation by date (stop words were removed): (w,count)
2008−01−01 ( ' g l ad i a to r ' , 1 ) ( ' movie ' , 1 )( ' epson ' , 1 ) ( ' camera ' , 1 )
2008−01−03 ( ' g l ad i a to r ' , 2 ) ( ' movie ' , 2 )( ' f i s h ' , 2 ) ( ' love ' , 2 )
2008−01−04 ( ' g l ad i a to r ' , 1 ) ( ' movie ' , 1 )2009−01−04 ( ' epson ' , 1 ) ( ' camera ' , 1 )
As we can see, everytime a new opinion appears on a topic, the topic isre-published at the current date, because we assume that if a user let anopinion on a topic, it means that the topic itself as a trend is reinforced.This allows us to in fact, as a �rst draft, completely ignore the text of the
3 LANGUAGE MODEL 11
opinion and simply strengthen the topic. The text of the opinion will beused in a second stage as shown below.
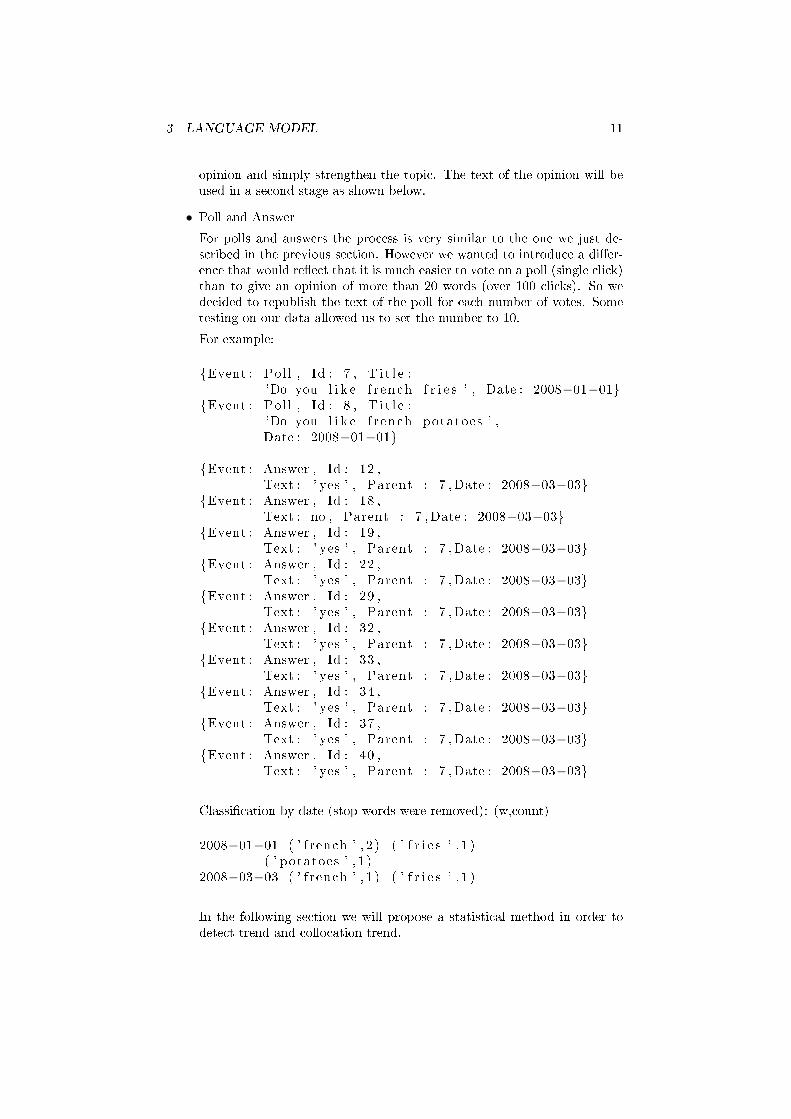
• Poll and Answer
For polls and answers the process is very similar to the one we just de-scribed in the previous section. However we wanted to introduce a di�er-ence that would re�ect that it is much easier to vote on a poll (single click)than to give an opinion of more than 20 words (over 100 clicks). So wedecided to republish the text of the poll for each number of votes. Sometesting on our data allowed us to set the number to 10.
For example:
{Event : Pol l , Id : 7 , T i t l e :'Do you l i k e f r ench f r i e s ' , Date : 2008−01−01}
{Event : Pol l , Id : 8 , T i t l e :'Do you l i k e f r ench potatoes ' ,Date : 2008−01−01}
{Event : Answer , Id : 12 ,Text : ' yes ' , Parent : 7 ,Date : 2008−03−03}
{Event : Answer , Id : 18 ,Text : no , Parent : 7 ,Date : 2008−03−03}
{Event : Answer , Id : 19 ,Text : ' yes ' , Parent : 7 ,Date : 2008−03−03}
{Event : Answer , Id : 22 ,Text : ' yes ' , Parent : 7 ,Date : 2008−03−03}
{Event : Answer , Id : 29 ,Text : ' yes ' , Parent : 7 ,Date : 2008−03−03}
{Event : Answer , Id : 32 ,Text : ' yes ' , Parent : 7 ,Date : 2008−03−03}
{Event : Answer , Id : 33 ,Text : ' yes ' , Parent : 7 ,Date : 2008−03−03}
{Event : Answer , Id : 34 ,Text : ' yes ' , Parent : 7 ,Date : 2008−03−03}
{Event : Answer , Id : 37 ,Text : ' yes ' , Parent : 7 ,Date : 2008−03−03}
{Event : Answer , Id : 40 ,Text : ' yes ' , Parent : 7 ,Date : 2008−03−03}
Classi�cation by date (stop words were removed): (w,count)
2008−01−01 ( ' f rench ' , 2 ) ( ' f r i e s ' , 1 )( ' potatoes ' , 1 )
2008−03−03 ( ' f rench ' , 1 ) ( ' f r i e s ' , 1 )
In the following section we will propose a statistical method in order todetect trend and collocation trend.
4 TREND DETECTION 12
4 Trend detection
4.1 Notations
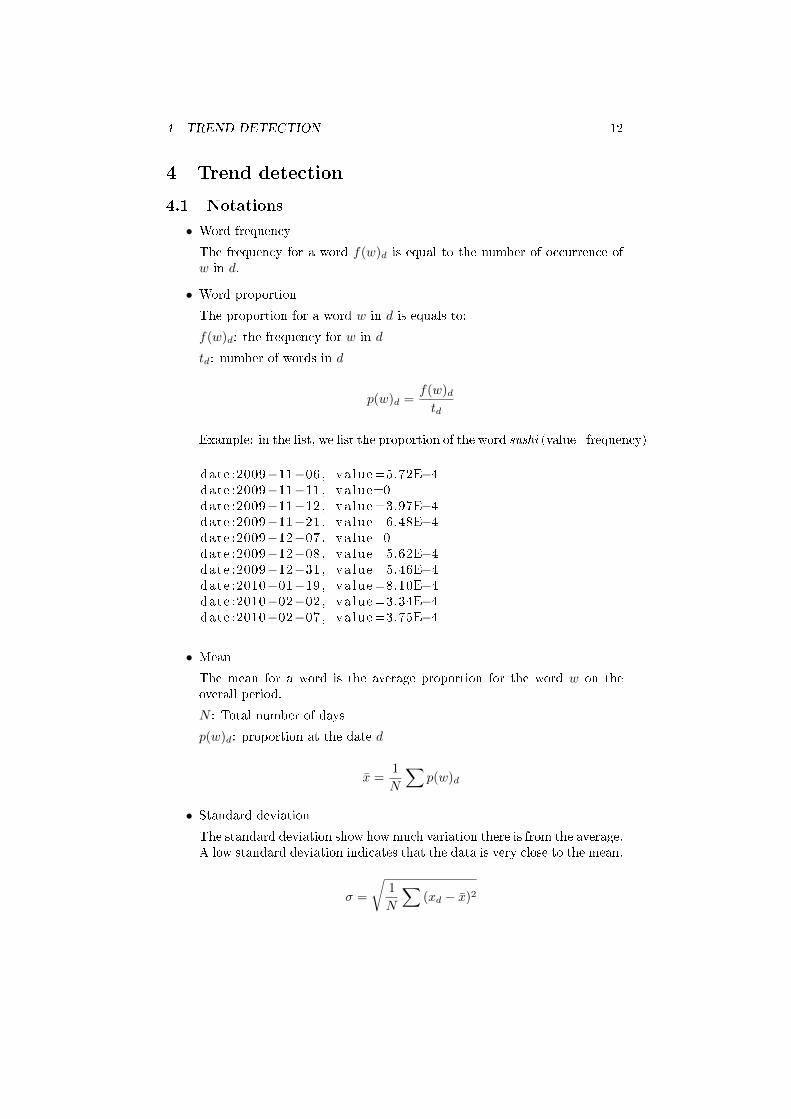
• Word frequency
The frequency for a word f(w)d is equal to the number of occurrence ofw in d.
• Word proportion
The proportion for a word w in d is equals to:
f(w)d: the frequency for w in d
td: number of words in d
p(w)d =f(w)dtd
Example: in the list, we list the proportion of the word sushi (value=frequency)
date :2009−11−06 , va lue =5.72E−4date :2009−11−11 , va lue=0date :2009−11−12 , va lue =3.97E−4date :2009−11−21 , va lue =6.48E−4date :2009−12−07 , va lue=0date :2009−12−08 , va lue =5.62E−4date :2009−12−31 , va lue =5.46E−4date :2010−01−19 , va lue =8.10E−4date :2010−02−02 , va lue =3.34E−4date :2010−02−07 , va lue =3.75E−4
• Mean
The mean for a word is the average proportion for the word w on theoverall period.
N : Total number of days
p(w)d: proportion at the date d
x̄ =1
N
∑p(w)d
• Standard deviation
The standard deviation show how much variation there is from the average.A low standard deviation indicates that the data is very close to the mean.
σ =
√1
N
∑(xd − x̄)2
4 TREND DETECTION 13
4.2 Zscore
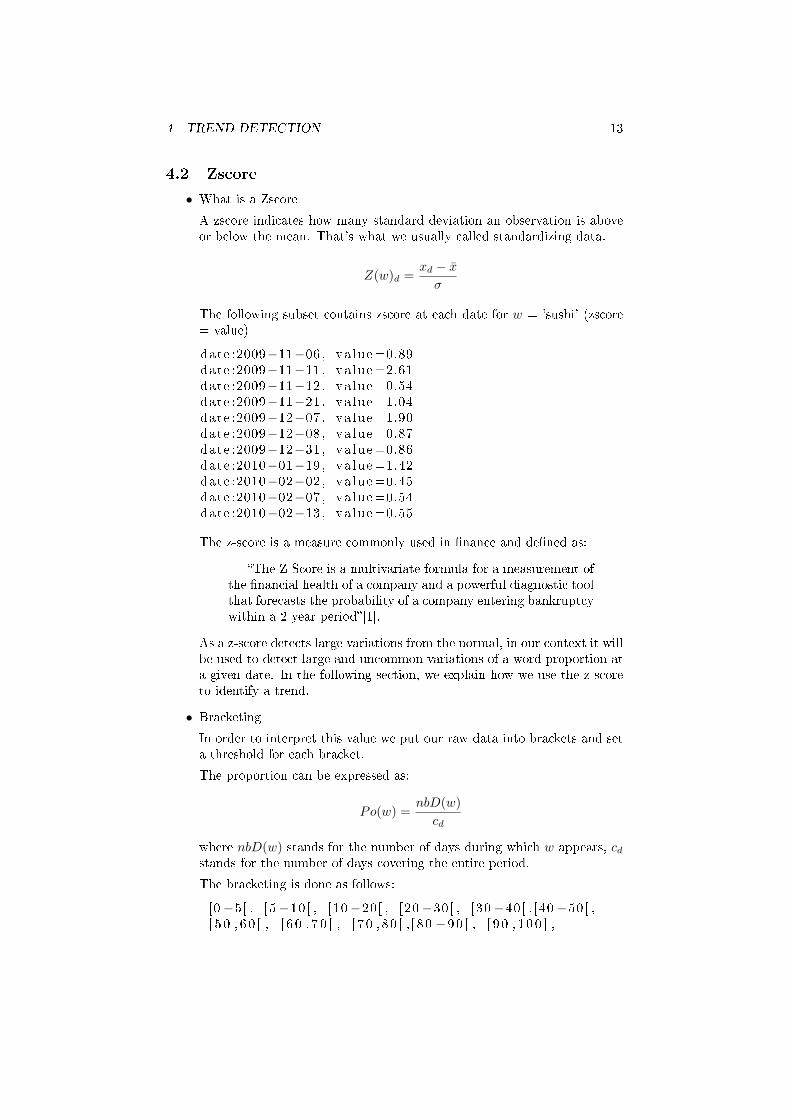
• What is a Zscore
A zscore indicates how many standard deviation an observation is aboveor below the mean. That's what we usually called standardizing data.
Z(w)d =xd − x̄σ
The following subset contains zscore at each date for w = 'sushi' (zscore= value)
date :2009−11−06 , va lue =0.89date :2009−11−11 , va lue =2.61date :2009−11−12 , va lue =0.54date :2009−11−21 , va lue =1.04date :2009−12−07 , va lue =1.90date :2009−12−08 , va lue =0.87date :2009−12−31 , va lue =0.86date :2010−01−19 , va lue =1.42date :2010−02−02 , va lue =0.45date :2010−02−07 , va lue =0.54date :2010−02−13 , va lue =0.55
The z-score is a measure commonly used in �nance and de�ned as:
�The Z-Score is a multivariate formula for a measurement ofthe �nancial health of a company and a powerful diagnostic toolthat forecasts the probability of a company entering bankruptcywithin a 2 year period�[1].
As a z-score detects large variations from the normal, in our context it willbe used to detect large and uncommon variations of a word proportion ata given date. In the following section, we explain how we use the z-scoreto identify a trend.
• Bracketing
In order to interpret this value we put our raw data into brackets and seta threshold for each bracket.
The proportion can be expressed as:
Po(w) =nbD(w)
cd
where nbD(w) stands for the number of days during which w appears, cdstands for the number of days covering the entire period.
The bracketing is done as follows:
[0−5[ , [5−10[ , [10−20[ , [20−30[ , [30−40[ , [40−50[ ,[ 5 0 , 6 0 [ , [ 6 0 , 7 0 [ , [ 7 0 , 80 [ , [ 8 0 −90 [ , [ 9 0 , 1 0 0 ] ,
4 TREND DETECTION 14
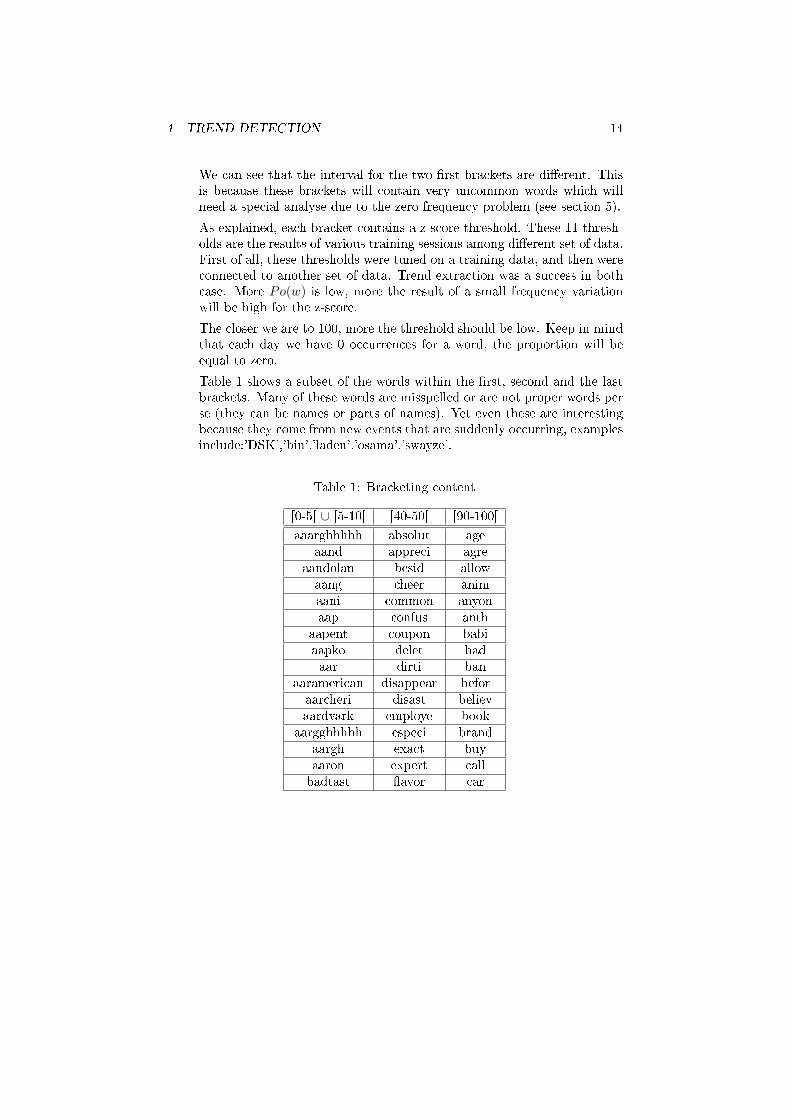
We can see that the interval for the two �rst brackets are di�erent. Thisis because these brackets will contain very uncommon words which willneed a special analyse due to the zero frequency problem (see section 5).
As explained, each bracket contains a z-score threshold. These 11 thresh-olds are the results of various training sessions among di�erent set of data.First of all, these thresholds were tuned on a training data, and then wereconnected to another set of data. Trend extraction was a success in bothcase. More Po(w) is low, more the result of a small frequency variationwill be high for the z-score.
The closer we are to 100, more the threshold should be low. Keep in mindthat each day we have 0 occurrences for a word, the proportion will beequal to zero.
Table 1 shows a subset of the words within the �rst, second and the lastbrackets. Many of these words are misspelled or are not proper words perse (they can be names or parts of names). Yet even these are interestingbecause they come from new events that are suddenly occurring, examplesinclude:'DSK','bin','laden','osama','swayze'.
Table 1: Bracketing content
[0-5[ ∪ [5-10[ [40-50[ [90-100[
aaarghhhhh absolut ageaand appreci agre
aandolan besid allowaang cheer animaani common anyonaap confus anth
aapent coupon babiaapko delet badaar dirti ban
aaramerican disappear beforaarcheri disast believaardvark employe book
aargghhhhh especi brandaargh exact buyaaron expert callbadtast �avor car
4 TREND DETECTION 15
Table 2: Final z-score threshold
[0-5[ [5-10[ [10-20[ [20-30[ [30-40[
20 25 15 12 10
[40-50[ [50-60[ [60-70[ [70-80[ [80-90[ [90-100]
10 9 8 6 5 5
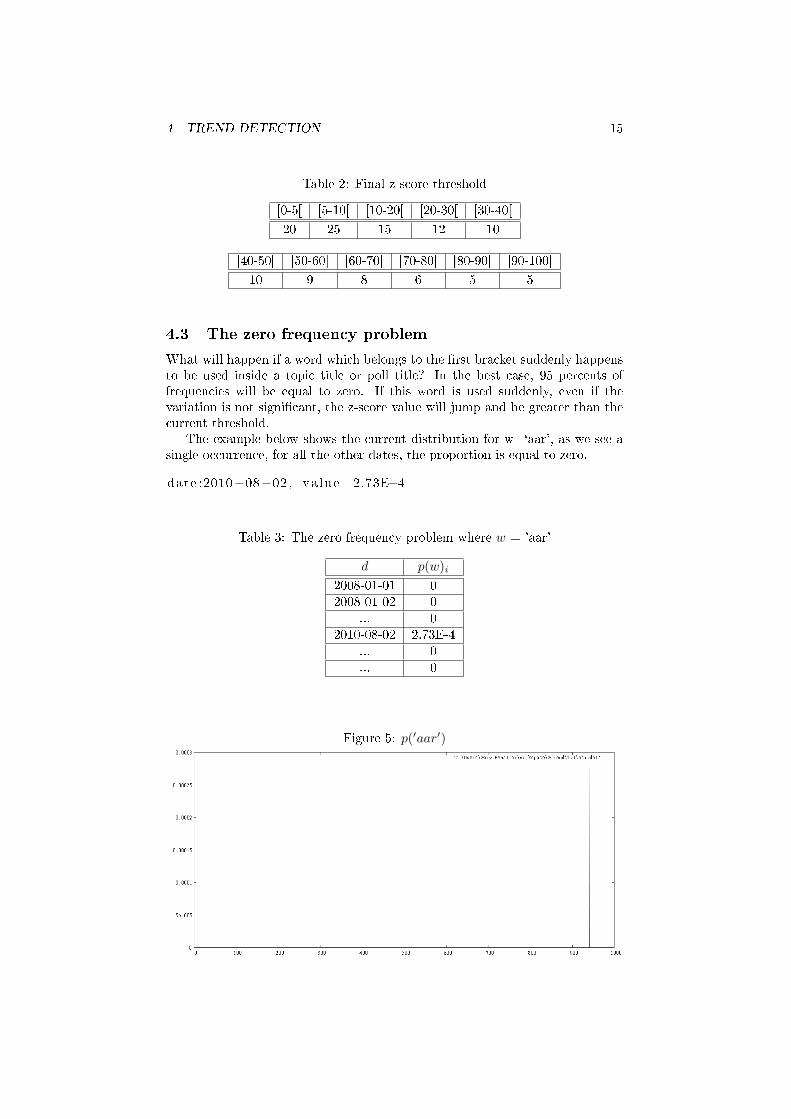
4.3 The zero frequency problem
What will happen if a word which belongs to the �rst bracket suddenly happensto be used inside a topic title or poll title? In the best case, 95 percents offrequencies will be equal to zero. If this word is used suddenly, even if thevariation is not signi�cant, the z-score value will jump and be greater than thecurrent threshold.
The example below shows the current distribution for w=`aar', as we see asingle occurrence, for all the other dates, the proportion is equal to zero.
date :2010−08−02 , va lue =2.73E−4
Table 3: The zero frequency problem where w = 'aar'
d p(w)i
2008-01-01 02008-01-02 0
... 02010-08-02 2.73E-4
... 0
... 0
Figure 5: p(′aar′)
4 TREND DETECTION 16
Algorithm 1 Zero frequency problem
l← w ∈ [0− 5[∪[5− 10[for e ∈ l doaverageList← mean(p(e))
end for
return mean(averageList)
Table 4: Zero frequency threshold
Value
8.91E-4
You can see that on 2010-08-02 this word can be elected as a trend.The common way to solve this problem is to eliminate zero values and to
consider that this word appeared like others (Laplace estimator).We propose here to tackle this issue in a di�erent manner: we take all
the words within these brackets and calculate the average proportion for eachword, and �nally calculate the average of the list of averages for all words (SeeAlgorithm 1).
We �nally verify whether a word within these brackets has a large frequencyvariation as compared to the value calculated on the training data (see Table 4).
4.4 Trend detection algorithm
The z-score is calculated for each single word in the titles of topics and pollsand compared to a given threshold. The key steps of the algorithm are outlinedbelow.
Algorithm 2 Trends detection
d, nbD(w), c(d), Po(w), Z(w)d, f(w)d, td, p(w)d;zeroFreq ← 8.91E − 4if Po(w) ∈ [0− 5[ thenif p(w) ≥ zeroFreq ∗ 10 then
if Z(w)d ≥ threshold(Po(w)) thenw is a trendreturn findCollocationCandidate(w, 5)
end if
end if
else
if Z(w)d ≥ threshold(Po(w)) thenw is a trendreturn findCollocationCandidate(w, 5)
end if
end if
As per this algorithm, once w is identi�ed as a trend, we try to �nd the best
4 TREND DETECTION 17
collocation that involves it.
Algorithm 3 �ndCollocationCandidate
w,window, candidatesList;for event ∈ topic(w) ∨ poll(w) dofor i = 0→ event.text.size dofor j = i+ 1→ min(event.text.size, window) docol← event.text[i] ∪ event.text[j]if col ∈ candidatesList thencandidatesList(col) + +
else
candidatesList← colend if
end for
end for
end for
if candidatesList 6= ∅ thenreturn max(candidatesList)
end if
return w
For illustration, let us consider the following example with the word 'bin' on2011-05-02, which is the day of Bin Laden's death. For w=`bin' we obtain:
date :2011−04−27 , va lue=0date :2011−04−30 , va lue =3.424E−4date :2011−05−01 , va lue =0.01date :2011−05−02 , va lue =0.06date :2011−05−03 , va lue =0.04date :2011−05−04 , va lue =0.03date :2011−05−05 , va lue =0.03date :2011−05−06 , va lue =0.03date :2011−05−07 , va lue =0.02date :2011−05−08 , va lue =0.02date :2011−05−09 , va lue =0.01
Po(w) = 47.84
¯x(w) = 6.63E − 4
σ(w)d = 0.0021
Z(w)d = 30.25
As we can see w belongs to [40-50 [ and the threshold for this bracket is equalto 10, Z(w)2011−05−02 is more than 3 times the threshold. On the 2011-05-02,the word 'bin' has been detected as a volcanic trend.
Now let's try to investigate inside opinions. First of all, the list below con-tains some topics created on 2011-05-02 containinig 'bin':
4 TREND DETECTION 18
Figure 6: p(′bin′)
[Do you think the k i l l i n g o f Osama Bin Laden w i l lhe lp Pres ident Obama get re−e l e c t e d ? ,I s bin laden r e a l l y dead ? , Probably done to death ,but has the death o f Bin Laden made the World a s a f e r p lace ? ,Do you think that Bin Ladins ` f o l l ow e r s w i l l r e t a l i a t e ? ,Bin Laden i s dead accord ing to news r epo r t s .I s that a good th ing f o r the peace proce s s ? ,Osama Bin Laden has been k i l l e d by the U. S . t roops .What do you think t h i s event w i l l br ing ? Peace ,unity o f a l l humans or h o r r i b l e turmoi l and r e t a l i a t i o n ? ] ,
Now, inside each opinions about this trend, we detected the top collocations:List of top collocations for the word 'bin'.
[ laden bin=3582 , bin laden=3546 , bin osama=2302 ,osama bin=2252 , bin people =2051 , bin death=1963 ,dead bin=1959 , bin dead=1902 , laden osama=1686 ,osama laden=1626 , death bin=1502 , laden people =1492 ,bin body=1460 , laden death=1458 , bin k i l l e d =1425 ,dead laden=1405 , laden dead=1403 , bin ladens =1131 ,bin world=1103 , laden body=1070 , death laden=1062 ,laden k i l l e d =1037 , osama people =933 , bin glad=929 ,dead osama=920 , osama death=901 , bin news=894 ,bin a t tacks =893 , osama dead=874 , bin f e e l =852 ,laden ladens =830 , bin obama=826 , dead people =822 ,bin hope=817 , laden world=810 , dead death=789 ,obama bin=758 , ladens bin=750 , bin revenge=731 ,bin t roops =714 , death osama=709 , death people =707 ,bin r e t a l i a t i o n =703 , bin t rue =699 , bin bad=681 ,laden glad=680 , osama body =67 8 , . . . ]
Here there is one single top collocation, which is 'laden bin' with a number ofoccurrences equal to 3582, so the trends 'bin' will be replace by 'laden bin'. Inthis speci�c case, we see that the collocation brings most value. Indeed 'bin',
5 RESULTS 19
which is the volcanic single trend is not understandable without context. Collo-cation is the magic recipe to transform a 'statistical trend' into an 'interpretable'trend.
The bigram 'bin laden' was detected as a collocation trend on 1, 2, 3, 4, 5May 2011.
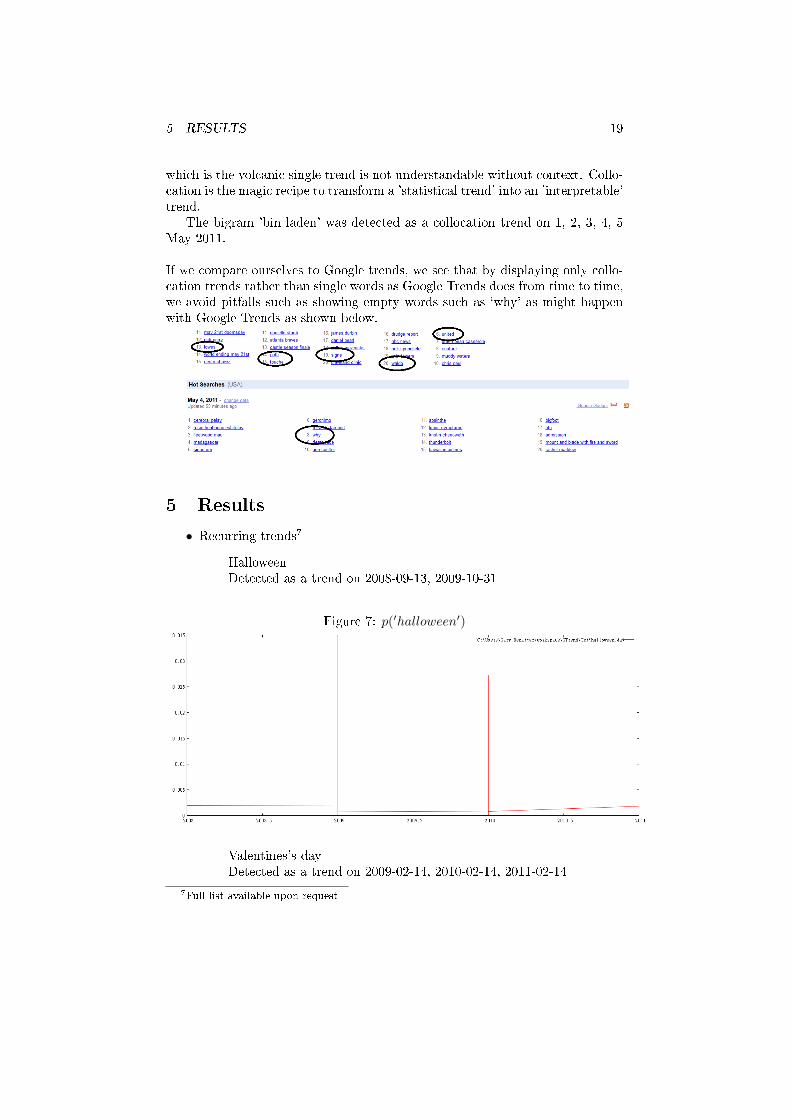
If we compare ourselves to Google trends, we see that by displaying only collo-cation trends rather than single words as Google Trends does from time to time,we avoid pitfalls such as showing empty words such as `why' as might happenwith Google Trends as shown below.
5 Results
• Recurring trends7
� HalloweenDetected as a trend on 2008-09-13, 2009-10-31
Figure 7: p(′halloween′)
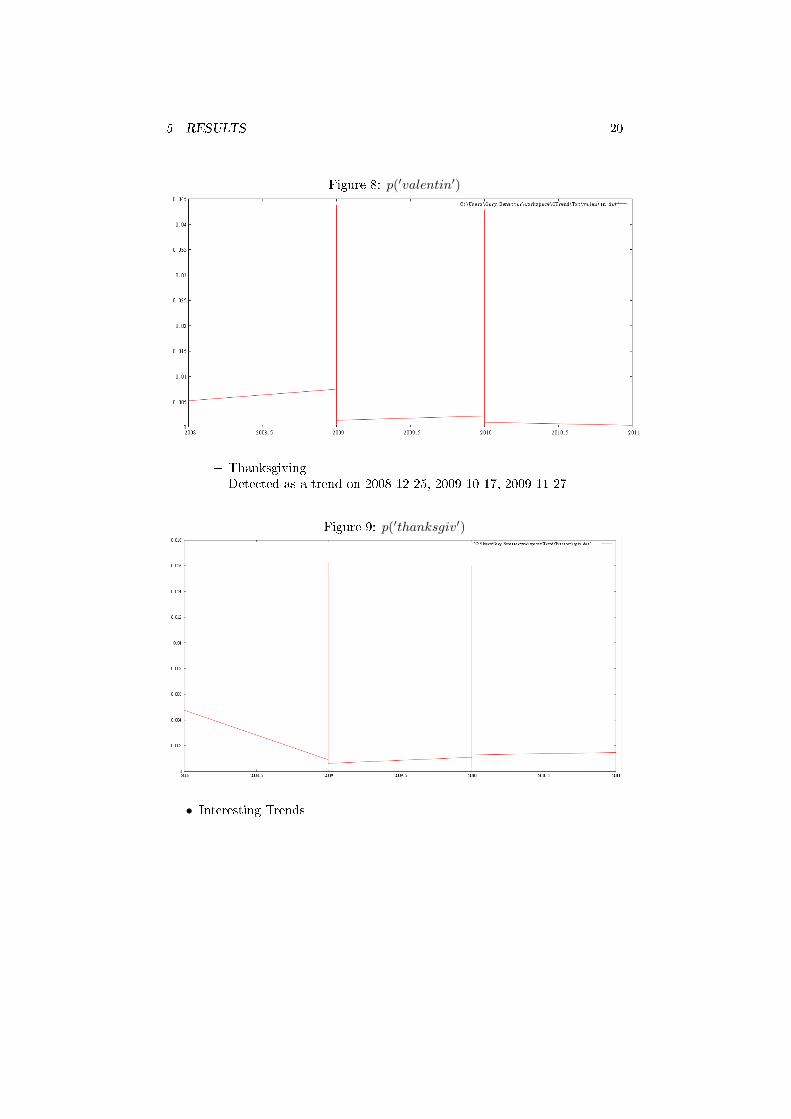
� Valentines's dayDetected as a trend on 2009-02-14, 2010-02-14, 2011-02-14
7Full list available upon request
5 RESULTS 20
Figure 8: p(′valentin′)
� ThanksgivingDetected as a trend on 2008-12-25, 2009-10-17, 2009-11-27
Figure 9: p(′thanksgiv′)
• Interesting Trends
5 RESULTS 21
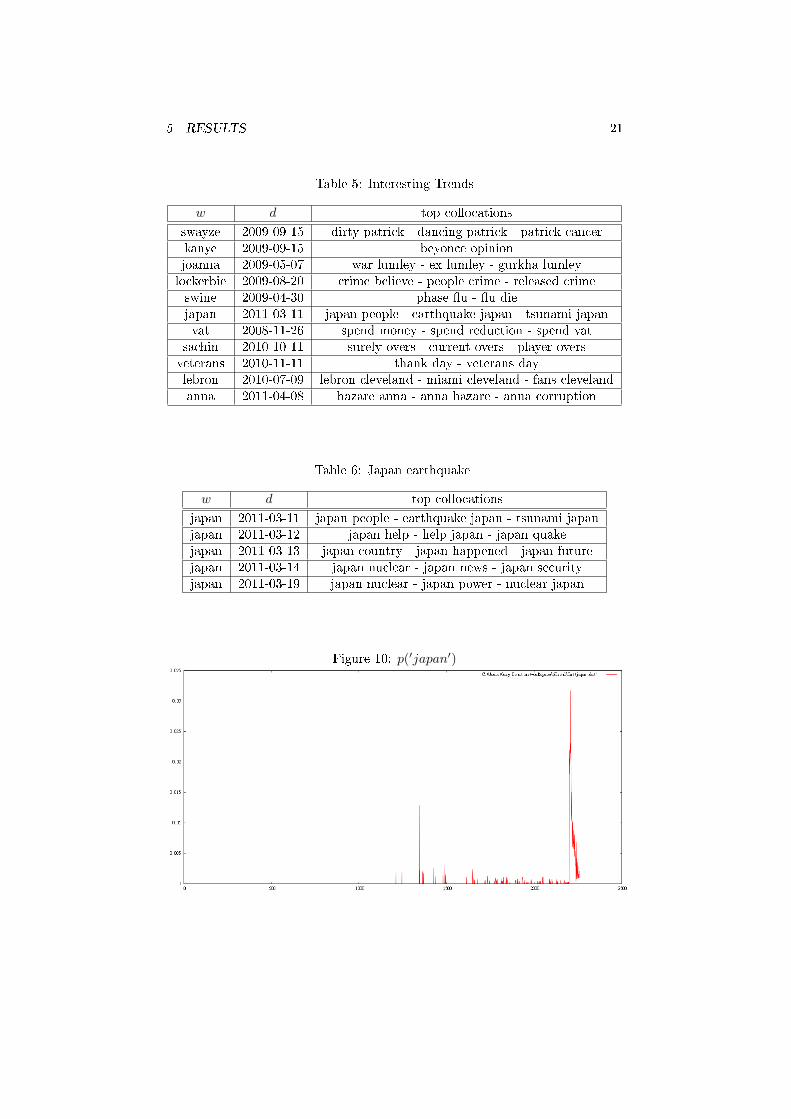
Table 5: Interesting Trends
w d top collocations
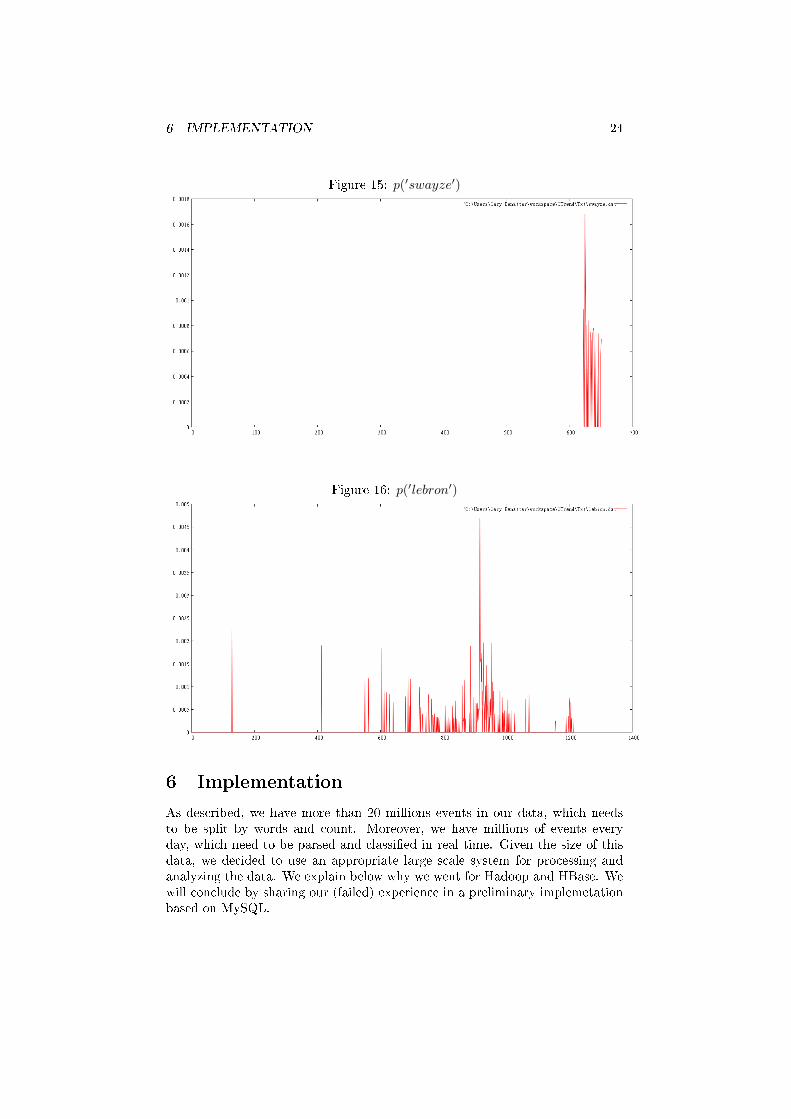
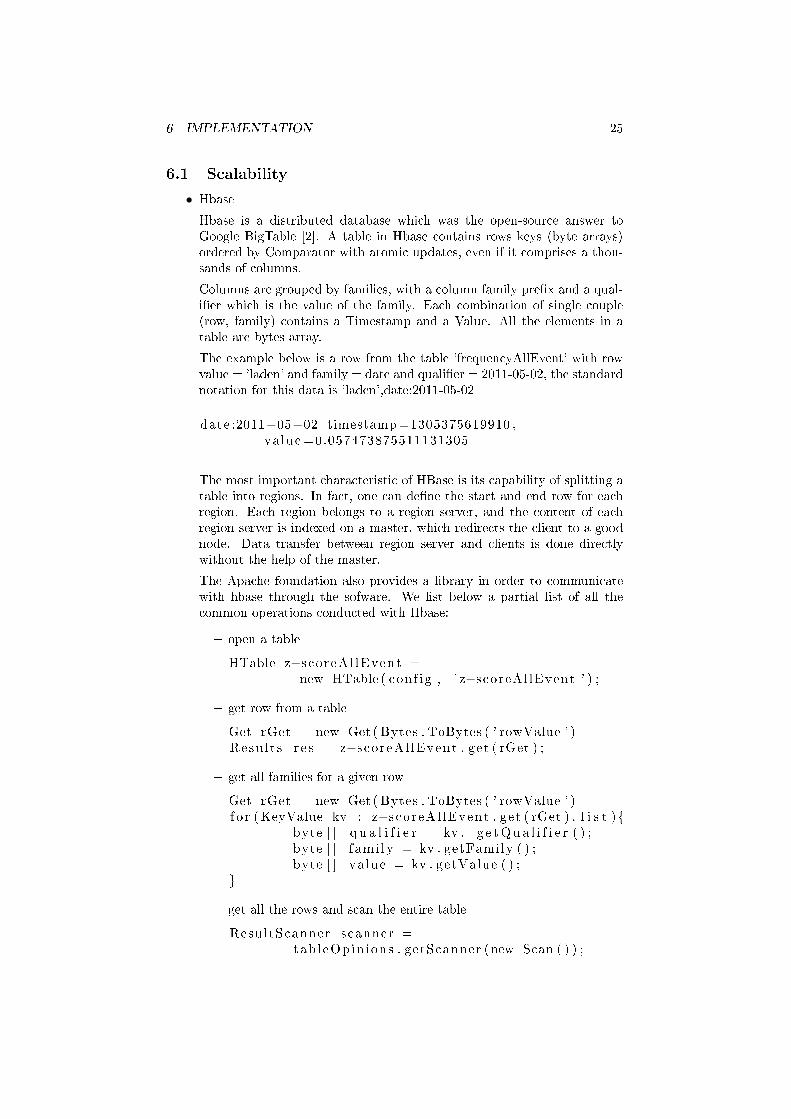
swayze 2009-09-15 dirty patrick - dancing patrick - patrick cancerkanye 2009-09-15 beyonce opinionjoanna 2009-05-07 war lumley - ex lumley - gurkha lumleylockerbie 2009-08-20 crime believe - people crime - released crimeswine 2009-04-30 phase �u - �u diejapan 2011-03-11 japan people - earthquake japan - tsunami japanvat 2008-11-26 spend money - spend reduction - spend vat
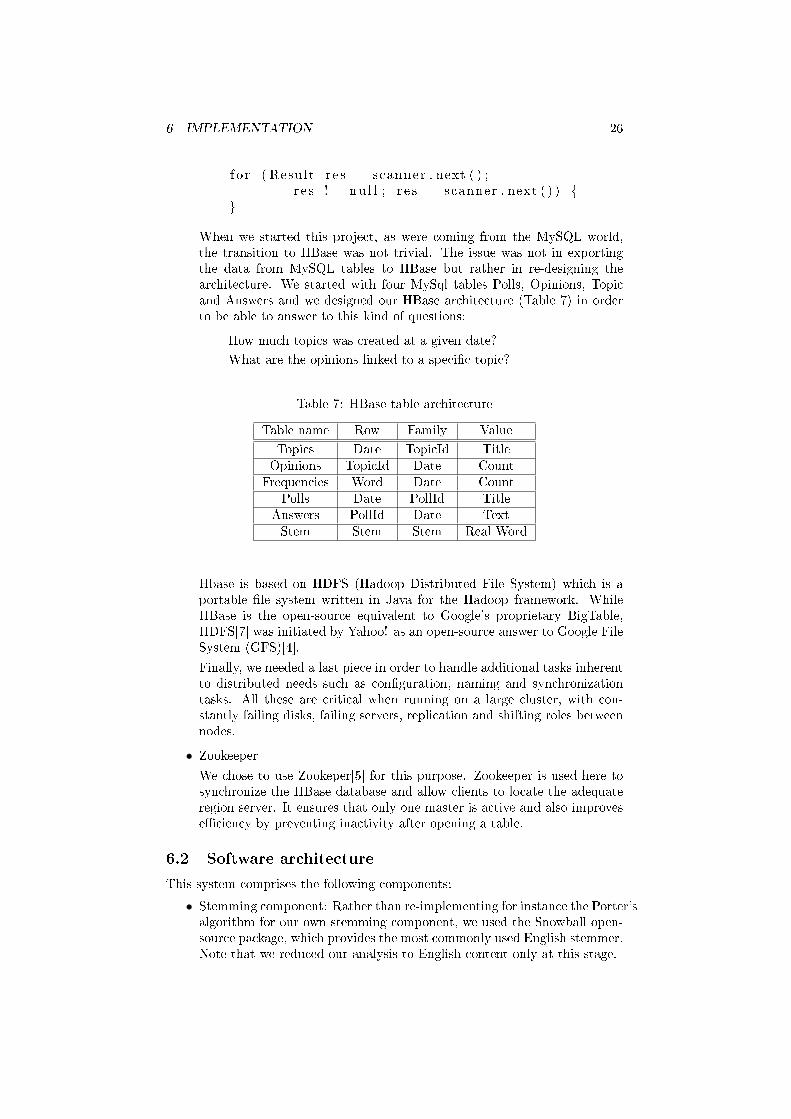
sachin 2010-10-11 surely overs - current overs - player oversveterans 2010-11-11 thank day - veterans daylebron 2010-07-09 lebron cleveland - miami cleveland - fans clevelandanna 2011-04-08 hazare anna - anna hazare - anna corruption
Table 6: Japan earthquake
w d top collocations
japan 2011-03-11 japan people - earthquake japan - tsunami japanjapan 2011-03-12 japan help - help japan - japan quakejapan 2011-03-13 japan country - japan happened - japan futurejapan 2011-03-14 japan nuclear - japan news - japan securityjapan 2011-03-19 japan nuclear - japan power - nuclear japan
Figure 10: p(′japan′)
5 RESULTS 22
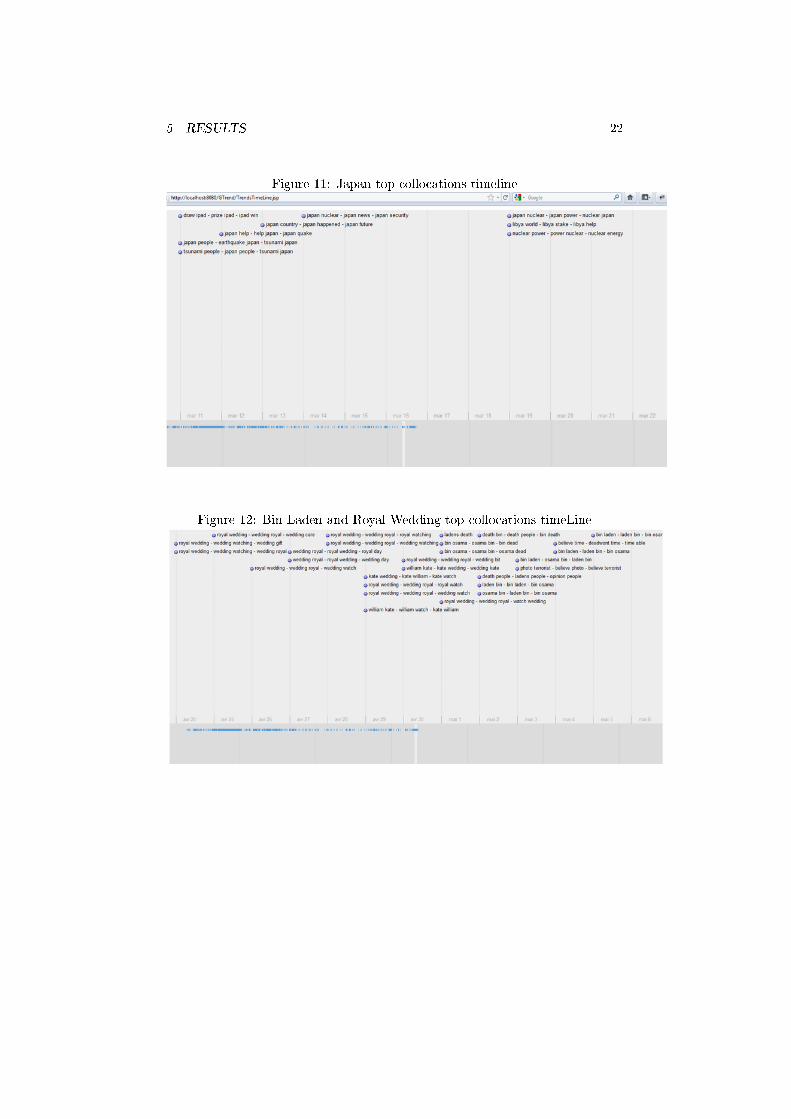
Figure 11: Japan top collocations timeline
Figure 12: Bin Laden and Royal Wedding top collocations timeLine
5 RESULTS 23
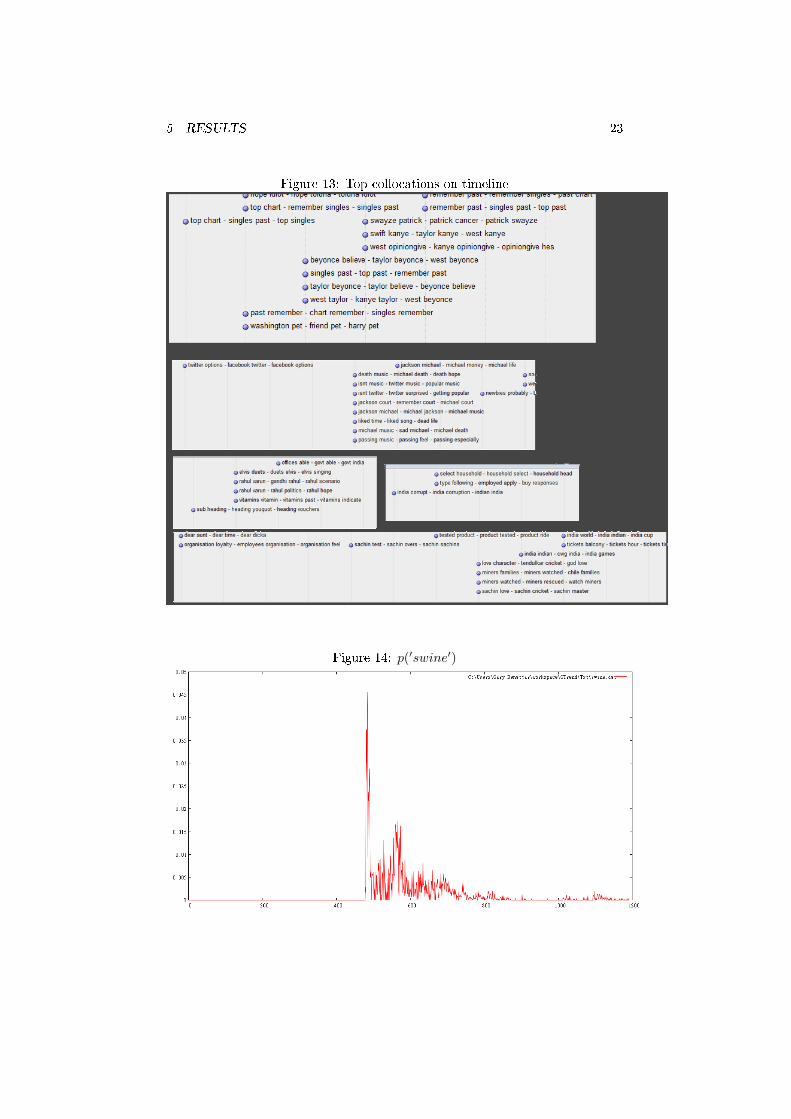
Figure 13: Top collocations on timeline
Figure 14: p(′swine′)
6 IMPLEMENTATION 24
Figure 15: p(′swayze′)
Figure 16: p(′lebron′)
6 Implementation
As described, we have more than 20 millions events in our data, which needsto be split by words and count. Moreover, we have millions of events everyday, which need to be parsed and classi�ed in real time. Given the size of thisdata, we decided to use an appropriate large scale system for processing andanalyzing the data. We explain below why we went for Hadoop and HBase. Wewill conclude by sharing our (failed) experience in a preliminary implemetationbased on MySQL.
6 IMPLEMENTATION 25
6.1 Scalability
• Hbase
Hbase is a distributed database which was the open-source answer toGoogle BigTable [2]. A table in Hbase contains rows keys (byte arrays)ordered by Comparator with atomic updates, even if it comprises a thou-sands of columns.
Columns are grouped by families, with a column family pre�x and a qual-i�er which is the value of the family. Each combination of single couple(row, family) contains a Timestamp and a Value. All the elements in atable are bytes array.
The example below is a row from the table 'frequencyAllEvent' with rowvalue = 'laden' and family = date and quali�er = 2011-05-02, the standardnotation for this data is 'laden',date:2011-05-02
date :2011−05−02 timestamp=1305375619910 ,va lue =0.057473875511131305
The most important characteristic of HBase is its capability of splitting atable into regions. In fact, one can de�ne the start and end row for eachregion. Each region belongs to a region server, and the content of eachregion server is indexed on a master, which redirects the client to a goodnode. Data transfer between region server and clients is done directlywithout the help of the master.
The Apache foundation also provides a library in order to communicatewith hbase through the sofware. We list below a partial list of all thecommon operations conducted with Hbase:
� open a table
HTable z−scoreAl lEvent =new HTable ( con f i g , ' z−scoreAl lEvent ' ) ;
� get row from a table
Get rGet = new Get ( Bytes . ToBytes ( ' rowValue ' )Resu l t s r e s = z−scoreAl lEvent . get ( rGet ) ;
� get all families for a given row
Get rGet = new Get ( Bytes . ToBytes ( ' rowValue ' )f o r (KeyValue kv : z−scoreAl lEvent . get ( rGet ) . l i s t ){
byte [ ] q u a l i f i e r = kv . g e tQua l i f i e r ( ) ;byte [ ] f ami ly = kv . getFamily ( ) ;byte [ ] va lue = kv . getValue ( ) ;
}
� get all the rows and scan the entire table
ResultScanner scanner =tab leOpin ions . getScanner (new Scan ( ) ) ;
6 IMPLEMENTATION 26
f o r ( Result r e s = scanner . next ( ) ;r e s != nu l l ; r e s = scanner . next ( ) ) {
}
When we started this project, as were coming from the MySQL world,the transition to HBase was not trivial. The issue was not in exportingthe data from MySQL tables to HBase but rather in re-designing thearchitecture. We started with four MySql tables Polls, Opinions, Topicand Answers and we designed our HBase architecture (Table 7) in orderto be able to answer to this kind of questions:
� How much topics was created at a given date?
� What are the opinions linked to a speci�c topic?
Table 7: HBase table architecture
Table name Row Family Value
Topics Date TopicId TitleOpinions TopicId Date Count
Frequencies Word Date CountPolls Date PollId Title
Answers PollId Date TextStem Stem Stem Real Word
Hbase is based on HDFS (Hadoop Distributed File System) which is aportable �le system written in Java for the Hadoop framework. WhileHBase is the open-source equivalent to Google's proprietary BigTable,HDFS[7] was initiated by Yahoo! as an open-source answer to Google FileSystem (GFS)[4].
Finally, we needed a last piece in order to handle additional tasks inherentto distributed needs such as con�guration, naming and synchronizationtasks. All these are critical when running on a large cluster, with con-stantly failing disks, failing servers, replication and shifting roles betweennodes.
• Zookeeper
We chose to use Zookeper[5] for this purpose. Zookeeper is used here tosynchronize the HBase database and allow clients to locate the adequateregion server. It ensures that only one master is active and also improvese�ciency by preventing inactivity after opening a table.
6.2 Software architecture
This system comprises the following components:
• Stemming component: Rather than re-implementing for instance the Porter'salgorithm for our own stemming component, we used the Snowball open-source package, which provides the most commonly used English stemmer.Note that we reduced our analysis to English content only at this stage.
6 IMPLEMENTATION 27
• Training component: We implemented this component to support all thestatistical training methods, and address issues like the zero-frequencyproblem thresholds. This component accesses the data-set o�ine and isnever used in production mode.
• Base component: We implemented in this component the objects used inour system.
• Trend Detection component: This component is one of the critical part ofthe system, it reads data from the database, and extract trends. It inter-acts with the Stemming, Utils (described later) and Base Components.
• Utils component: This component contains all the utilities used during theanalysis stage as well as the formatting utilities needed for displaying theresults in the user interface. Examples include export to CVS,XML,TXT,export into log �le, ArrayList, HashTable (increment element, sort, ...),String util methods (cleaning a String, date to String format, ...), commondatabase operations (set a connection, queries, ...), math utils (mean,standard deviation, number of day between two dates, ...). It interactswith the Trend Detection, Web (described later) Components.
• Test component: This component should also never be used in productionmode, it contains some basics test.
• Web component: This component contains web servlets and it is linkedto WebContent which contains all the JSP �les.
6 IMPLEMENTATION 28
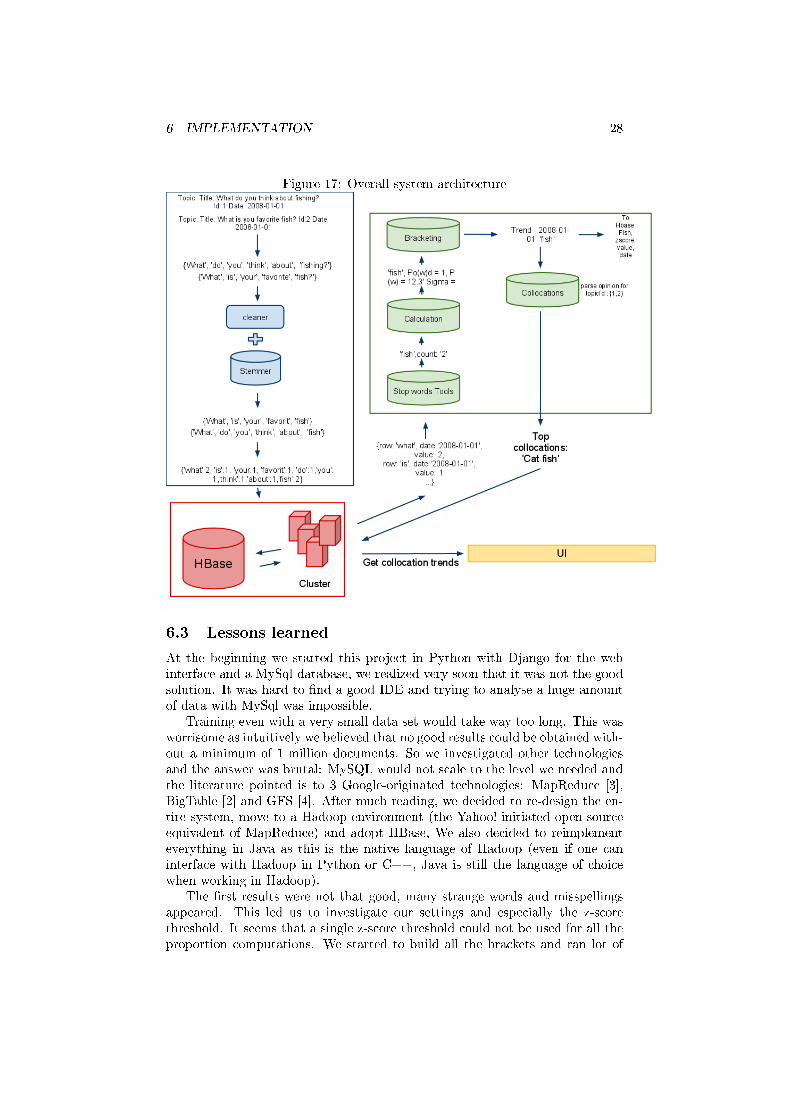
Figure 17: Overall system architecture
6.3 Lessons learned
At the beginning we started this project in Python with Django for the webinterface and a MySql database, we realized very soon that it was not the goodsolution. It was hard to �nd a good IDE and trying to analyse a huge amountof data with MySql was impossible.
Training even with a very small data set would take way too long. This wasworrisome as intuitively we believed that no good results could be obtained with-out a minimum of 1 million documents. So we investigated other technologiesand the answer was brutal: MySQL would not scale to the level we needed andthe literature pointed is to 3 Google-originated technologies: MapReduce [3],BigTable [2] and GFS [4]. After much reading, we decided to re-design the en-tire system, move to a Hadoop environment (the Yahoo!-initiated open-sourceequivalent of MapReduce) and adopt HBase, We also decided to reimplementeverything in Java as this is the native language of Hadoop (even if one caninterface with Hadoop in Python or C++, Java is still the language of choicewhen working in Hadoop).
The �rst results were not that good, many strange words and misspellingsappeared. This led us to investigate our settings and especially the z-scorethreshold. It seems that a single z-score threshold could not be used for all theproportion computations. We started to build all the brackets and ran lot of
7 ACKNOWLEDGEMENTS 29
training, it was better but for the �rst bracket (greater than zero and less than�ve percent) we had 90% of bad words, most of us was miss-spelling words.We were confronted to the zero-frequency. After more investigation, We foundan article where the authors solved the zero frequency problem with a Laplaceestimator.
Inspired by this article, We decided to search for a dedicated threshold forthese problematic words, and we experimented with the mean of the mean.Results were satisfactory. In order to validate everything we asked Toluna'sdatabase team to provide us a clean and up to date database. we connected thenew database to the software. Results were also satisfactory.
At this stage, the system extracted decent trends, yet they were not easy tointerpret for users not familar with the dataset. As we followed the news, weknew that Bin Laden was dead so when we extracted the word 'bin', we didthe connection, but our goal were to understand without any background thedisplayed trends and for us 'bin' was really not a good trend for the user.
We had the chance to talk to ToLuna SVP, Frank Smadja, an ex-computationallinguistics researcher, who happens to be one of the pioneers of collocation ex-traction and analysis. After a short brainstorm, we realized that collocationswere the key to this interpretatibility problem. At this moment we took thedecision to �nd single words trends in polls and topics only and to specifytrends found with collocations inside opinions and answers, and 'bin' became'bin laden', 'royal' became 'royal wedding', 'patrick' became 'patrick swayze'.
The last step was to design a user interface. Fortunately HBase providedalready some very convenient utilities, We just had to add some export toolsand devise some charts and timeline plug-ins.
Data visualization is always a key components in any data-mining e�ortespecially when the output needs to be displayed to the user. As an exampleGoogle trends while being very sophisticated with its rich dashboard, might bea bit too complex for casual users. Yahoo! Clues that was just launched in theUS targets more naive users (as Yahoo! typical users are) and in our opinionwith its simplicity and attractive facets might attract less sophisticated users ifit reaches them.
Finally, we have not included any evaluation in this report. However we doplan to conduct thorough comparisons between our approach, Yahoo! clues andGoogle trends in order to validate our contributions.
7 Acknowledgements
I am thankful to the Department of Computer Science at Paris 6 University forproviding me with a rich environment and giving me the opportunity to graduatein one of the best institutions in the world. Many thanks to my advisor, PhilippeTrebuchet for his advice on my research and this work, Philippe has been aninspiration for me both professionally and personally and it was a real pleasureto work with him. I would like to also thank Frank Smadja for his insights ontext analysis and collocations, and Yoelle Maarek for having the patience toproofread this report and make dozens of useful comments. Many thanks to mybrother Jeremy for sharing my passion with trends and for challenging me withcommon sense questions.
REFERENCES 30
References
[1] Edward I. Altman. Financial ratios, discriminant analysis and the predictionof corporate bankruptcy. Journal of Finance, September 1968.
[2] Fay Chang, Je�rey Dean, Sanjay Ghemawat, Wilson C. Hsieh, Deborah A.Wallach, Mike Burrows, Tushar Chandra, Andrew Fikes, and Robert E.Gruber. Bigtable: a distributed storage system for structured data. pages15�15, 2006.
[3] Je�rey Dean and Sanjay Ghemawat. Mapreduce: simpli�ed data processingon large clusters. Commun. ACM, 51:107�113, January 2008.
[4] Sanjay Ghemawat, Howard Gobio�, and Shun-Tak Leung. The google �lesystem. pages 29�43, 2003.
[5] M.; Junqueira F.P.; Reed B. Hunt, P.; Konar. Zookeeper: Wait-free coordi-nation for internet-scale systems.
[6] M.F.Porter. An algorithm for su�x stripping. 1980.
[7] Sanjay Radia. Yahoo! hdfs under the hood.
[8] Frank Smadja. Retrieving collocations from text: Xtract. Comput. Linguist.,19:143�177, March 1993.