Embed Size (px)
Citation preview
TREND ANALYSIS REPORT
George E Mason ACCRUAL REPORT
Printed at 8/ 4/2008 10:19:13AMPage 1
FINANCIAL CONDITION
Current AssetsIntermediate AssetsLong Term AssetsTOTAL ASSETS
(change +/-)Current LiabilitiesIntermediate LiabilitiesLong Term LiabilitiesTOTAL LIABILITIES
(change +/-)NET WORTH
(change +/-)% NET WORTH
12/31/2007 - CREDITBS 12/31/2007
379,873435,670
1,031,348181,270
34,54437,30270,654
142,5004,000
888,848177,27086.2%
215,80512/31/2006 - CREDITBS 12/31/2006
298,983436,670850,078
24,02940,57473,897
138,500
711,578
83.7%
114,425
EARNINGS TRENDACCRUAL REPORT
Total Business IncomeTotal Business ExpenseNet Business Inc (prtx)+Net NonFarm Inc-Living Expense-Schedule A Interest-Income TaxesNet from Operations+Extraordinary Items+Depreciation+InterestCAPACITY AVAIL forDebt Srvc & New InvestmntScheduled Debt Service Required
12/31/07-EARNINGS 2007 F
526,276346,006180,270
040,000
012,000
128,270378
12,0349,200
149,882
12/31/06-EARNINGS 2006 F
313,208277,76035,44815,00030,000
05,000
15,448340
11,2609,500
36,548
FCS Operating (int only) Other Operating (int only)
00
00
Operating Loss Carryover Other Intermediate FCS Long Term Other Long Term Loans
FCS Intermediate 13,20000
9,00000
22,200
16,00000
6,50000
22,500 Non-Farm LoansTotal Debt Srvc Req
Trend Excess CashTrend Excess AccrualEarned Net Worth ChgUnreconciled Net Worth Chg
FCS ST Loan BalanceFCS LT Loan BalanceData Source & Type
$15,332$127,682
140,3040
67,50074,000
Tax Return - ACC &
$9,348$14,04826,708
050,00077,000
Tax Return - ACC &
Trend Analysis - ACCRUAL REPORT
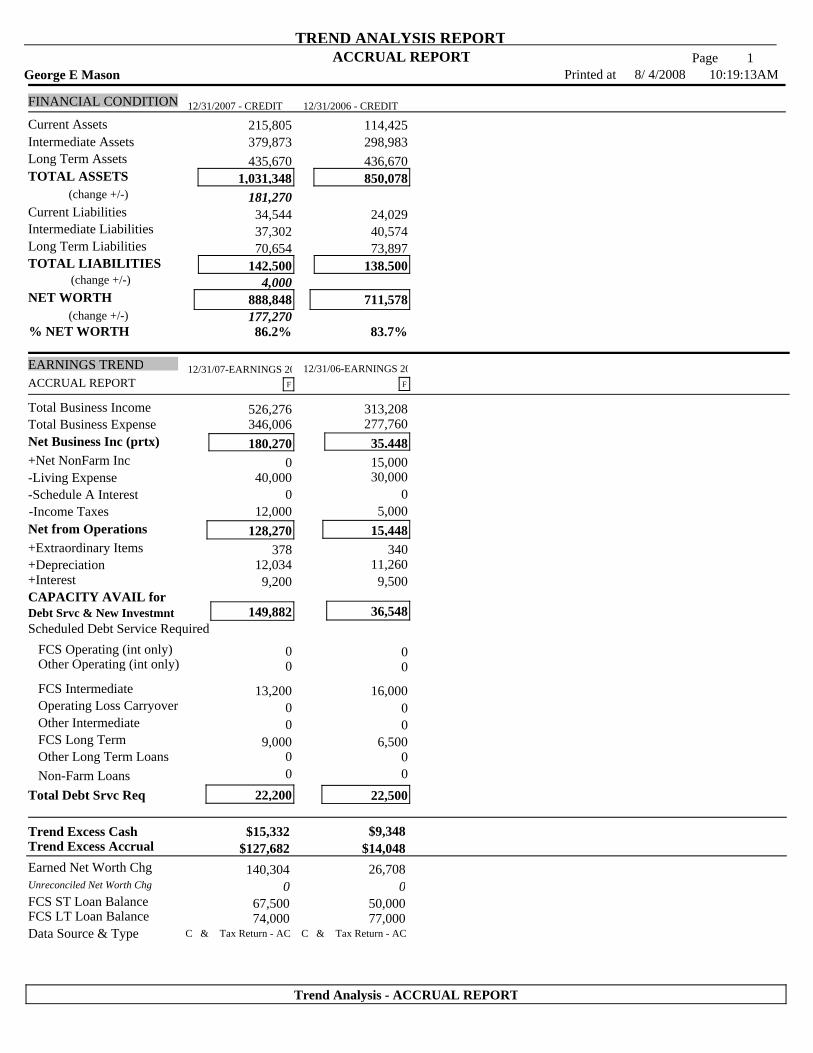
Trend Analysis with Ratio AnalysisACCRUAL REPORT
George E Mason 10:19:21 AM8/ 4/2008Printed at2Page
RATIOS AND EVALUATION FACTORS12/31/07-EARNINGS 2007
181,2616.25 : 11.78 : 1
16.03%13.82%86.18%
6.55%9.56
16.25 : 1673.44%127,682128,154
180,27015.89%18.68%
0.280.630.020.020.340.565.02
21.99
378378
8,8028,802
68
215,80510.28 : 1
12/31/06-EARNINGS 2006
90,3964.76 : 11.20 : 1
19.46%16.29%83.71%6.86%
9.69
3.81 : 1160.92%
14,04814,008
35,4481.80%2.10%
0.050.850.040.030.110.373.66
26.10
340340
15,32315,323
0
114,4259.95 : 1
LIQUIDITY: Working CapitalCurrent RatioQuick Ratio
LEVERAGE: Leverage Ratio (tot debt/NW)Debt to Asset RatioEquity to Asset RatioBlend Effective Interest RateBlend Capital Debt Term (yr)REPAYMENT CAPACITY: Interest Coverage RatioTerm Debt/Lease Covg RatioCap Repl/Term Debt Margin10 Yr Blend Accrual ExcessPROFITABILITY: Net Business Income% Return on Asset% Return on EquityFINANCIAL EFFICIENCY:
Oper Profit Margin RatioOper Expense RatioDepreciation Expns RatioInterest Expense RatioNet Inc from Oper RatioAsset TurnoverInventory TurnoverDays Accts ReceivableGENERAL: Capital SalesSales for TrendCapital PurchasesPurchases for Trend% Sales Growth
Trading Asset RatioTrading Asset
Trend Analysis with Ratio Analysis
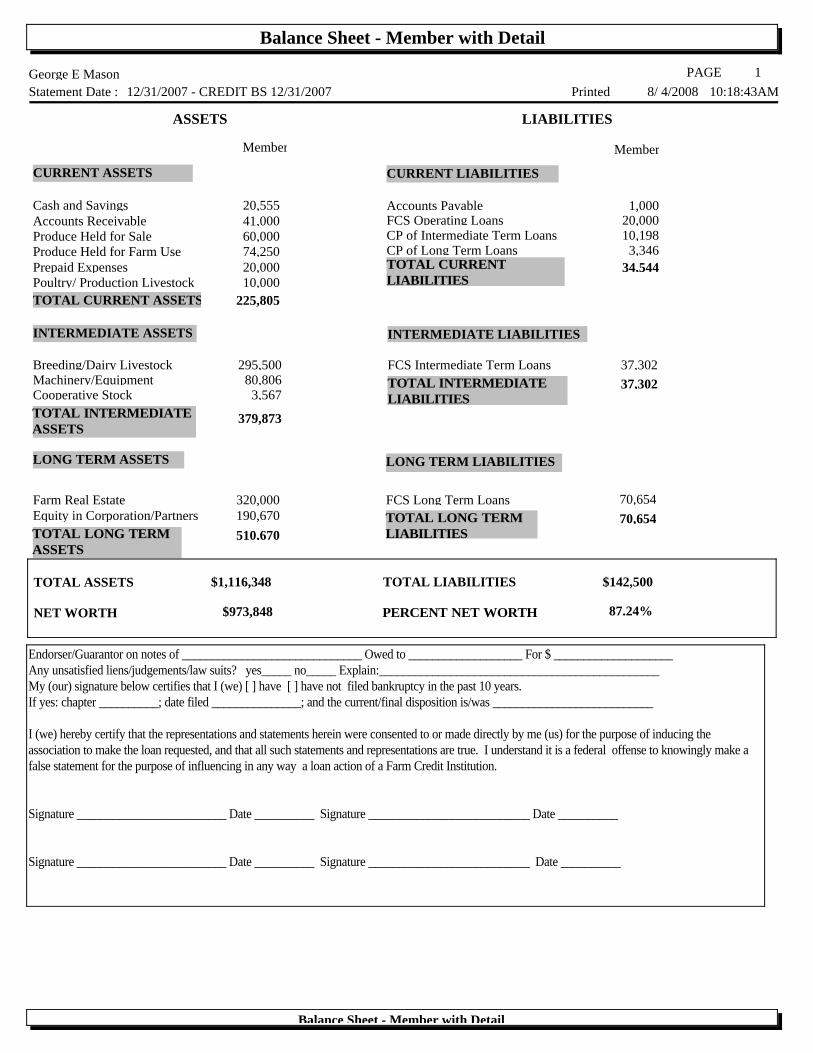
George E Mason 12/31/2007 - CREDIT BS 12/31/2007
1PAGEPrinted 10:18:43AM8/ 4/2008
Balance Sheet - Member with Detail
Statement Date :
CURRENT ASSETS
Cash and Savings 20,555Accounts Receivable 41,000Produce Held for Sale 60,000Produce Held for Farm Use 74,250Prepaid Expenses 20,000Poultry/ Production Livestock 10,000TOTAL CURRENT ASSETS 225,805
CURRENT LIABILITIES
Accounts Payable 1,000FCS Operating Loans 20,000CP of Intermediate Term Loans 10,198CP of Long Term Loans 3,346TOTAL CURRENTLIABILITIES
34,544
ASSETS LIABILITIES
Member Member
INTERMEDIATE ASSETS
295,500Breeding/Dairy Livestock 80,806Machinery/Equipment
3,567Cooperative Stock TOTAL INTERMEDIATEASSETS
379,873
INTERMEDIATE LIABILITIES
FCS Intermediate Term Loans 37,302TOTAL INTERMEDIATELIABILITIES
37,302
LONG TERM ASSETS
Farm Real Estate 320,000Equity in Corporation/Partners 190,670TOTAL LONG TERMASSETS
510,670
LONG TERM LIABILITIES
FCS Long Term Loans 70,654TOTAL LONG TERMLIABILITIES
70,654
$1,116,348 $142,500TOTAL ASSETS TOTAL LIABILITIES
NET WORTH $973,848 PERCENT NET WORTH 87.24%
Endorser/Guarantor on notes of ______________________________ Owed to ___________________ For $ ____________________Any unsatisfied liens/judgements/law suits? yes_____ no_____ Explain:_______________________________________________My (our) signature below certifies that I (we) [ ] have [ ] have not filed bankruptcy in the past 10 years.If yes: chapter __________; date filed _______________; and the current/final disposition is/was ___________________________
I (we) hereby certify that the representations and statements herein were consented to or made directly by me (us) for the purpose of inducing theassociation to make the loan requested, and that all such statements and representations are true. I understand it is a federal offense to knowingly make afalse statement for the purpose of influencing in any way a loan action of a Farm Credit Institution.
Signature _________________________ Date __________ Signature ___________________________ Date __________
Signature _________________________ Date __________ Signature ___________________________ Date __________
Balance Sheet - Member with Detail
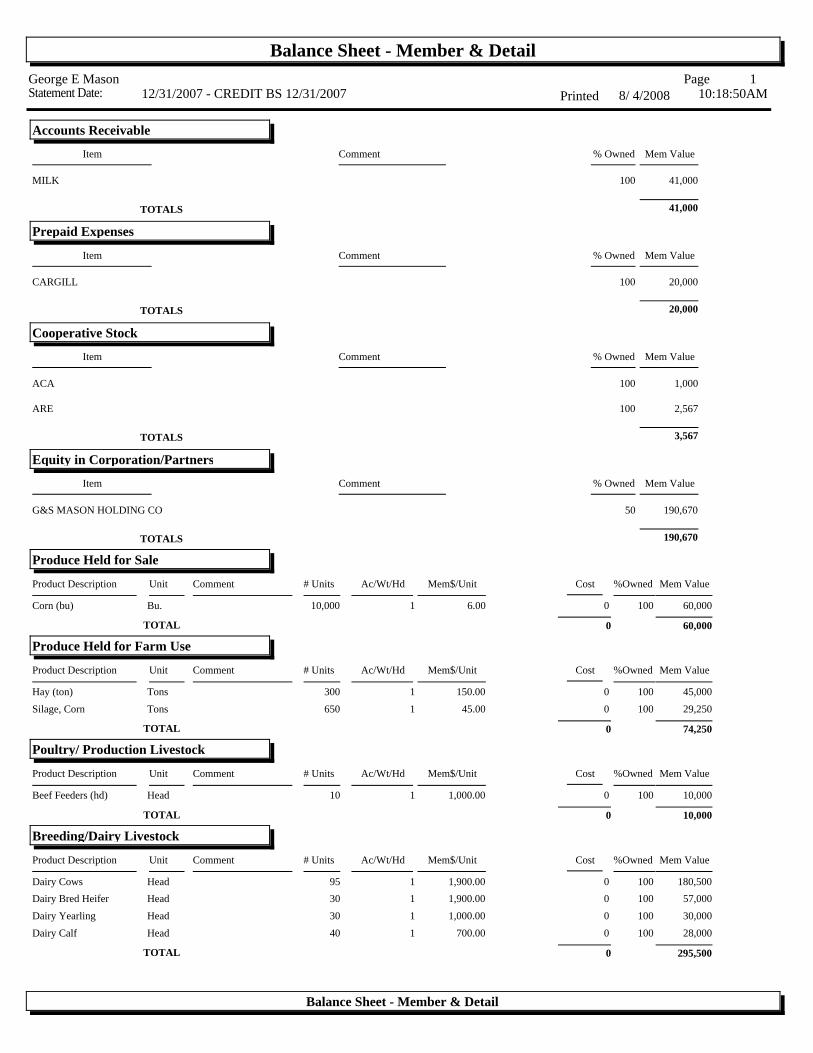
Balance Sheet - Member & DetailGeorge E Mason
12/31/2007 - CREDIT BS 12/31/2007 1
8/ 4/2008 10:18:50AMPrintedPage
Statement Date:
Mem ValueItem Comment % Owned
Accounts Receivable
41,000100MILK
41,000TOTALS
Mem ValueItem Comment % Owned
Prepaid Expenses
20,000100CARGILL
20,000TOTALS
Mem ValueItem Comment % Owned
Cooperative Stock
1,000100ACA
2,567100ARE
3,567TOTALS
Mem ValueItem Comment % Owned
Equity in Corporation/Partners
190,67050G&S MASON HOLDING CO
190,670TOTALS
Produce Held for Sale
Mem ValueMem$/UnitCommentProduct Description # Units Ac/Wt/HdUnit Cost %Owned
Corn (bu) Bu. 10,000 1 6.00 0 100 60,000
0 60,000TOTAL
Produce Held for Farm Use
Mem ValueMem$/UnitCommentProduct Description # Units Ac/Wt/HdUnit Cost %Owned
Hay (ton) Tons 300 1 150.00 0 100 45,000Silage, Corn Tons 650 1 45.00 0 100 29,250
0 74,250TOTAL
Poultry/ Production Livestock
Mem ValueMem$/UnitCommentProduct Description # Units Ac/Wt/HdUnit Cost %Owned
Beef Feeders (hd) Head 10 1 1,000.00 0 100 10,000
0 10,000TOTAL
Breeding/Dairy Livestock
Mem ValueMem$/UnitCommentProduct Description # Units Ac/Wt/HdUnit Cost %Owned
Dairy Cows Head 95 1 1,900.00 0 100 180,500Dairy Bred Heifer Head 30 1 1,900.00 0 100 57,000Dairy Yearling Head 30 1 1,000.00 0 100 30,000Dairy Calf Head 40 1 700.00 0 100 28,000
0 295,500TOTAL
Balance Sheet - Member & Detail
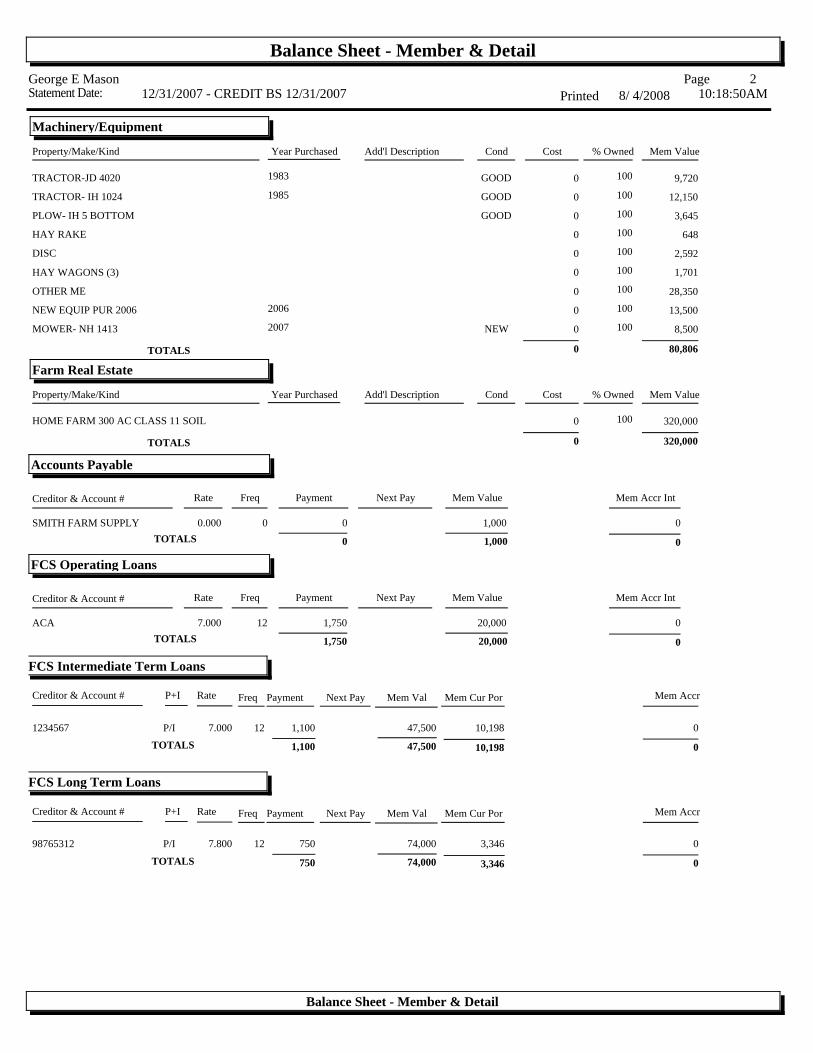
Balance Sheet - Member & DetailGeorge E Mason
12/31/2007 - CREDIT BS 12/31/2007 2
8/ 4/2008 10:18:50AMPrintedPage
Statement Date:
Machinery/Equipment
Mem ValueProperty/Make/Kind Add'l Description Cond Cost % OwnedYear Purchased
TRACTOR-JD 4020 GOOD 0 100 9,7201983
TRACTOR- IH 1024 GOOD 0 100 12,1501985
PLOW- IH 5 BOTTOM GOOD 0 100 3,645
HAY RAKE 0 100 648
DISC 0 100 2,592
HAY WAGONS (3) 0 100 1,701
OTHER ME 0 100 28,350
NEW EQUIP PUR 2006 0 100 13,5002006
MOWER- NH 1413 NEW 0 100 8,5002007
0 80,806TOTALS
Farm Real Estate
Mem ValueProperty/Make/Kind Add'l Description Cond Cost % OwnedYear Purchased
HOME FARM 300 AC CLASS 11 SOIL 0 100 320,000
0 320,000TOTALS
Accounts Payable
Mem Value Mem Accr IntCreditor & Account # Rate Freq Payment Next Pay
SMITH FARM SUPPLY 0.000 0 0 1,000 0
1,0000 0TOTALS
FCS Operating Loans
Mem Value Mem Accr IntCreditor & Account # Rate Freq Payment Next Pay
ACA 7.000 12 1,750 20,000 0
20,0001,750 0TOTALS
FCS Intermediate Term Loans
Mem Val Mem Cur Por Mem AccrInt
Creditor & Account # P+I Rate Freq Payment Next Pay
1234567 P/I 7.000 12 1,100 47,500 10,198 0
1,100 47,500 10,198 0TOTALS
FCS Long Term Loans
Mem Val Mem Cur Por Mem AccrInt
Creditor & Account # P+I Rate Freq Payment Next Pay
98765312 P/I 7.800 12 750 74,000 3,346 0
750 74,000 3,346 0TOTALS
Balance Sheet - Member & Detail
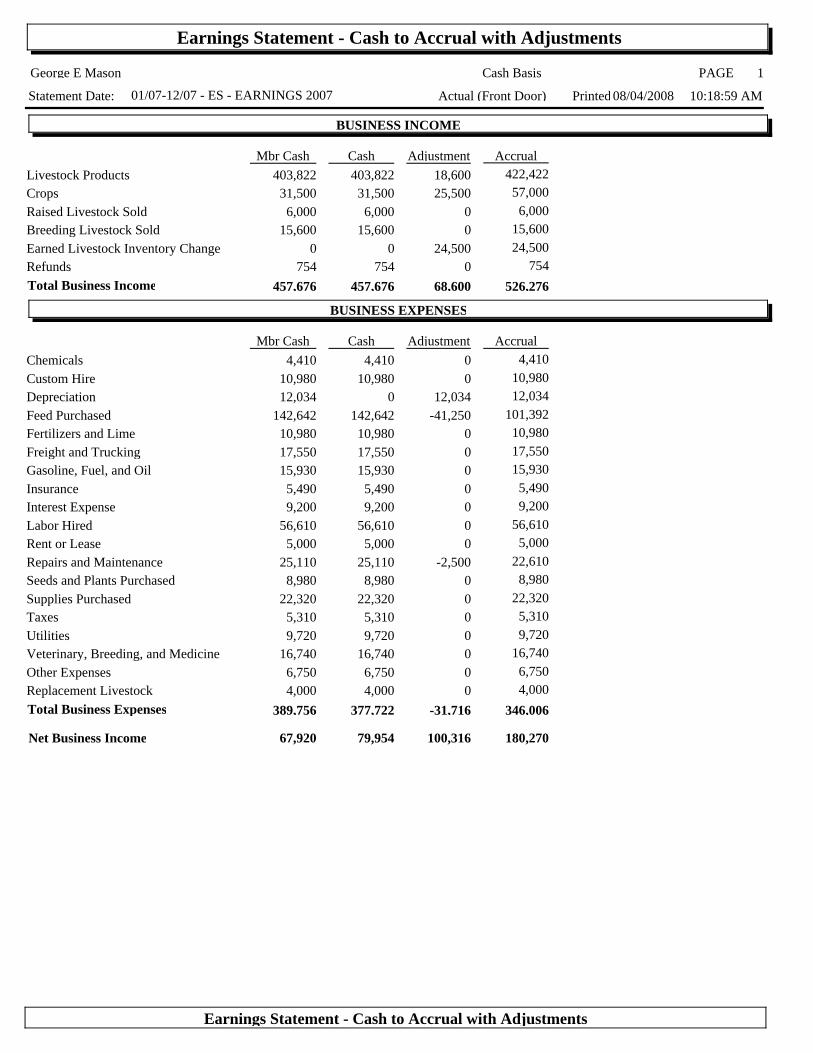
Earnings Statement - Cash to Accrual with Adjustments
Statement Date: 01/07-12/07 - ES - EARNINGS 2007
George E Mason
Actual (Front Door)
Cash Basis
10:18:59 AM08/04/2008Printed:
1PAGE
BUSINESS INCOME
Mbr Cash Cash Adjustment AccrualLivestock Products 403,822 403,822 18,600 422,422Crops 31,500 31,500 25,500 57,000Raised Livestock Sold 6,000 6,000 0 6,000Breeding Livestock Sold 15,600 15,600 0 15,600Earned Livestock Inventory Change 0 0 24,500 24,500Refunds 754 754 0 754
457,676 457,676 68,600 526,276Total Business Income
BUSINESS EXPENSES
Mbr Cash Cash Adjustment AccrualChemicals 4,410 4,410 0 4,410Custom Hire 10,980 10,980 0 10,980Depreciation 12,034 0 12,034 12,034Feed Purchased 142,642 142,642 -41,250 101,392Fertilizers and Lime 10,980 10,980 0 10,980Freight and Trucking 17,550 17,550 0 17,550Gasoline, Fuel, and Oil 15,930 15,930 0 15,930Insurance 5,490 5,490 0 5,490Interest Expense 9,200 9,200 0 9,200Labor Hired 56,610 56,610 0 56,610Rent or Lease 5,000 5,000 0 5,000Repairs and Maintenance 25,110 25,110 -2,500 22,610Seeds and Plants Purchased 8,980 8,980 0 8,980Supplies Purchased 22,320 22,320 0 22,320Taxes 5,310 5,310 0 5,310Utilities 9,720 9,720 0 9,720Veterinary, Breeding, and Medicine 16,740 16,740 0 16,740Other Expenses 6,750 6,750 0 6,750Replacement Livestock 4,000 4,000 0 4,000
389,756 377,722 -31,716 346,006Total Business Expenses
67,920Net Business Income 79,954 100,316 180,270
Earnings Statement - Cash to Accrual with Adjustments