Embed Size (px)
Citation preview
Trend Analysis Report Lake Land College 2013
Office of Institutional Research M. Lynn Breer, PhD

Trend Analysis Report 2012 Page ii
Trend Analysis Report 2012 Page iii
Table of Contents
INTRODUCTION .................................................................................................. 1
SECTION A: DISTRICT DEMOGRAPHICS ................................................................ 3
Figure 1: Population Change ................................................................................................................................. 3 Figure 2: Median Income ...................................................................................................................................... 4 Figure 3: Educational Attainment ......................................................................................................................... 5 Figure 4: Unemployment Rates ............................................................................................................................. 5 Figure 5: Employment by County .......................................................................................................................... 6
SECTION B: ENROLLMENT ................................................................................... 8
Figure 6: Number of District High School Graduates and Enrollees after Graduation .......................................... 8 Figure 7: Percent of District High School Graduates Enrolled in Following Fall and Year after Graduation ......... 8 Figure 8: Lake Land College Enrollment within One Year of High School Graduation FY 2012: Shown by School District of Origin .................................................................................................................................................... 9 Figure 9: Annual Headcount Compared to Annual Average Headcount of All Illinois Community Colleges ....... 10 Figure 10: Annual Headcount ............................................................................................................................. 10 Figure 11: Annual Student FTE: 10
th Day and End of Term Comparison ............................................................. 11
Figure 12: Total Annual Credit Hours .................................................................................................................. 11 Figure 13: Annual End of Term Headcount without DOC .................................................................................... 12 Figure 14: Annual End of Term Total Credit Hour without DOC .......................................................................... 12 Figure 15: Annual End of Term Headcount with DOC ......................................................................................... 13 Figure 16: Annual End of Term Total Credit Hours with DOC .............................................................................. 13 Figure 17: Fiscal Year 2012 Enrollment: Head Count of all Illinois students by Semester and Zip Codes ............ 14 Figure 18: Fiscal Year 2012 Enrollment: Illinois Department of Corrections Facility Head Count ....................... 15 Figure 19: Annual Headcount by Student Category ............................................................................................ 16 Figure 20: Annual Credit Hours by Student Category............................................. Error! Bookmark not defined. Figure 21: Annual Headcount by Degree Type .................................................................................................... 17 Figure 22: Annual Credit Hours by Degree Type ................................................................................................. 17 Figure 23: Annual Headcount by Type of Course ................................................................................................ 18 Figure 24: Annual Total Credit Hours by Type of Course ..................................................................................... 18 Figure 25: Annual Headcount for the Kluthe Center ........................................................................................... 19 Figure 26: Annual Credit Hours for the Kluthe Center ......................................................................................... 19 Figure 27: Annual Headcount for Extension Centers ........................................................................................... 19 Figure 28: Annual Credit Hours for Extension Centers ........................................................................................ 19 Figure 29: Fall Enrollment by Student Program of Study (Major) ....................................................................... 20
SECTION C: STUDENT DEMOGRAPHICS AND INFORMATION ............................. 21
Figure 30: Annual Percentage of Students by Gender and Student Load ........................................................... 21 Figure 31: Average Age of Students .................................................................................................................... 21 Figure 32: Percent of Minority Students Compared to Percent of Minority Residents in the District ................. 22 Figure 33: Percent of Students Enrolled in Eligible Programs and Receiving Any Type of Financial Aid ............. 23 Figure 34: Annual Number of Students Receiving Financial Aid by Type ............................................................ 23 Figure 35: Average Total Amount of Financial Aid Received per Student ........................................................... 24 Figure 36: Comparison of Average ACT Composite Scores ................................................................................. 24 Figure 37: Three Year Retention and Graduation Rates of First Time Full Time Degree Seeking Students ......... 25 Figure 38: Retention for First Time Full Time Degree Seeking Student Cohorts .................................................. 25 Figure 39: Average GPA of Lake Land College Transfer Students Compared to All Other Community College Transfer and Native Students.............................................................................................................................. 26
Trend Analysis Report 2012 Page iv
Figure 40: LLC Compared to National Average: 2007-2009, 2012 Would Enroll Again, 2010 Would Recommend College ................................................................................................................................................................ 27 Figure 41: LLC Compared to National Average: Satisfied with College Experience ............................................. 27 Figure 42: LLC Compared to National Average: 2007-2009, 2012 College Experience Better than Expected, 2010 Academic Quality of College ...................................................................................................................... 27 Figure 43: Percentage of First Time Degree Seeking Students Testing into Developmental Courses ................. 28 Figure 44: Students Successfully Complete First College Level Course after Final Developmental Course ......... 29
SECTION D: TUITION, FEES, AND OTHER FINANCIAL DATA ................................ 30
Figure 45: Tuition and Fees ................................................................................................................................. 30 Figure 46: Comparison of Tuition with all Illinois Community Colleges .............................................................. 31 Figure 47: Annual Tuition and Fees for Full Time Students by College ................................................................ 32 Figure 48: Percentage of General Fund by Source .............................................................................................. 33 Figure 49: Dollar Amount of General Fund by Source ......................................................................................... 34 Figure 50: History of EAV Rates by Tax Levy Year ............................................................................................... 35 Figure 51: Additions to the Reserve Fund ........................................................................................................... 35

Trend Analysis Report 2012 Page v
Trend Analysis Report 2013 Page 1
Introduction The Trend Analysis Report provides an overview of multiyear data encompassing Lake Land College and the district it serves. The data provided in this report provide facts to inform and support decision making for the College. All annual data in this report (i.e., fiscal year or annual) consists of data from summer, fall, and spring terms in that order. For example, 2006 annual data and/or 2006 fiscal year data includes data from summer 2005, fall 2005, and spring 2006. Since the Illinois Community College Board (ICCB) uses summer, fall, and spring terms in that order to represent their fiscal year, using the same definition of annual or fiscal year data allows the College to compare these numbers to the same numbers for all community colleges in Illinois that are produced by ICCB. The report provides data related to areas integral to the future and success of Lake Land College. These areas are presented in the following four sections:
1. Section A: District Demographics, 2. Section B: Enrollment, 3. Section C: Student Demographics and Information, and 4. Section D: Tuition, Fees and Other Financial Data.
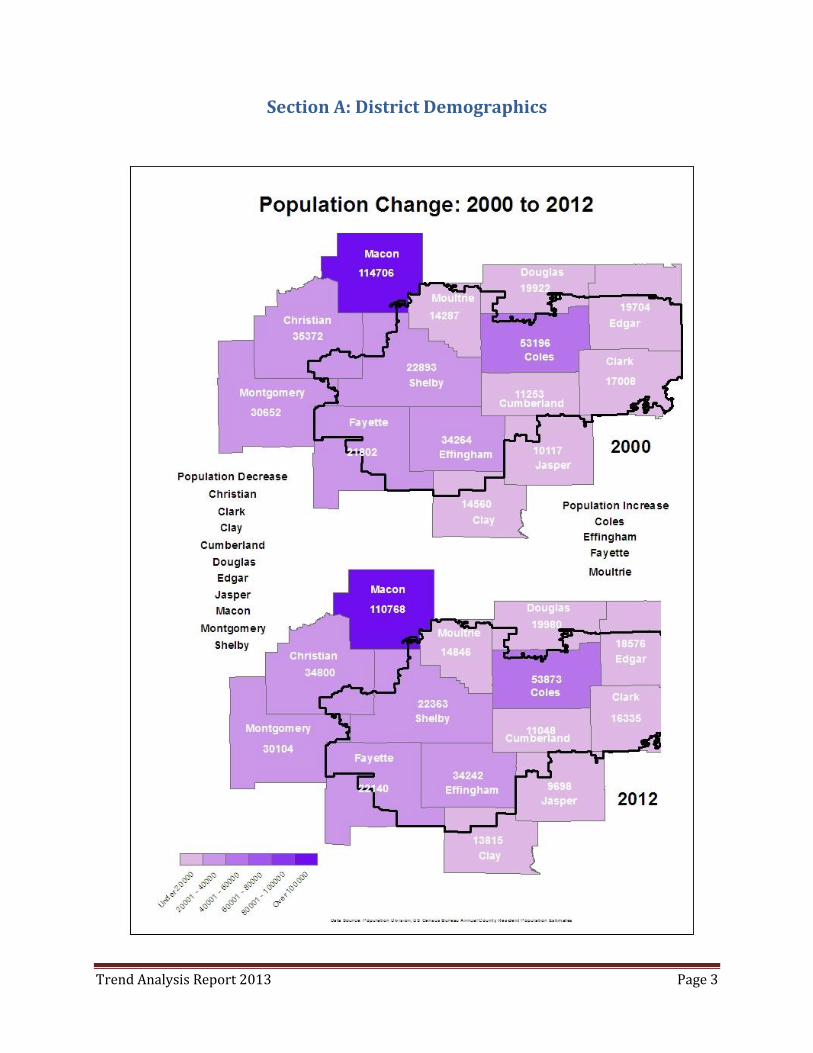
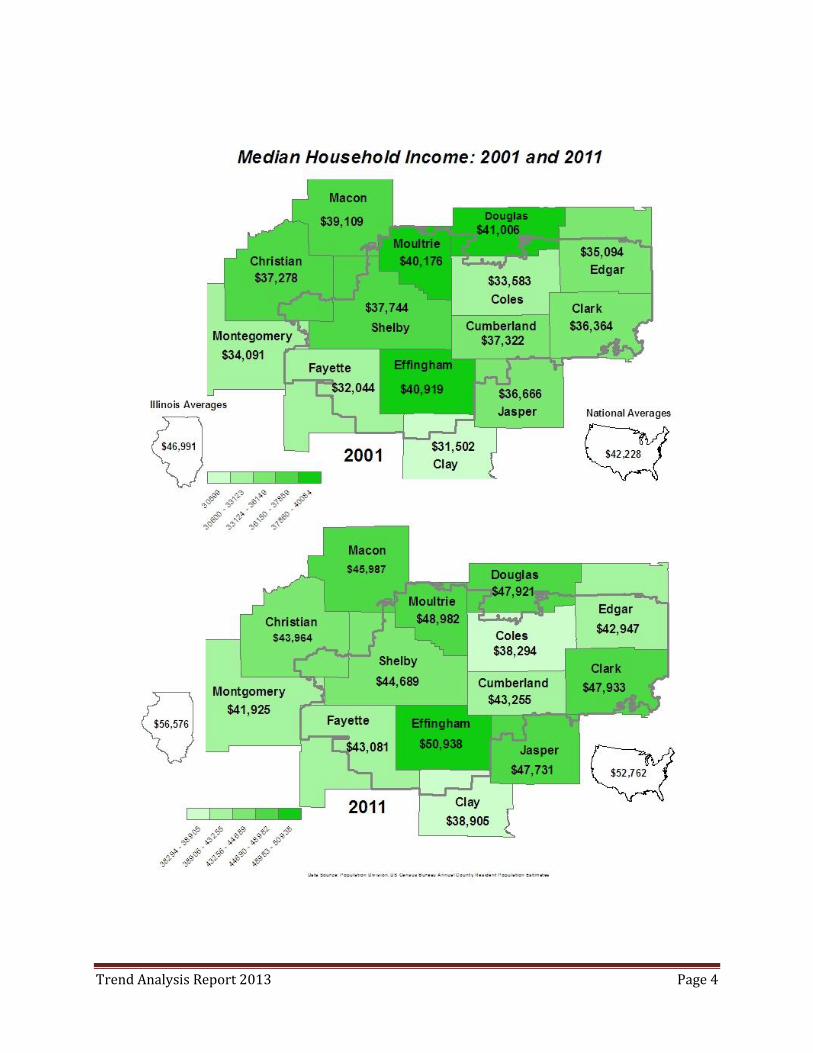
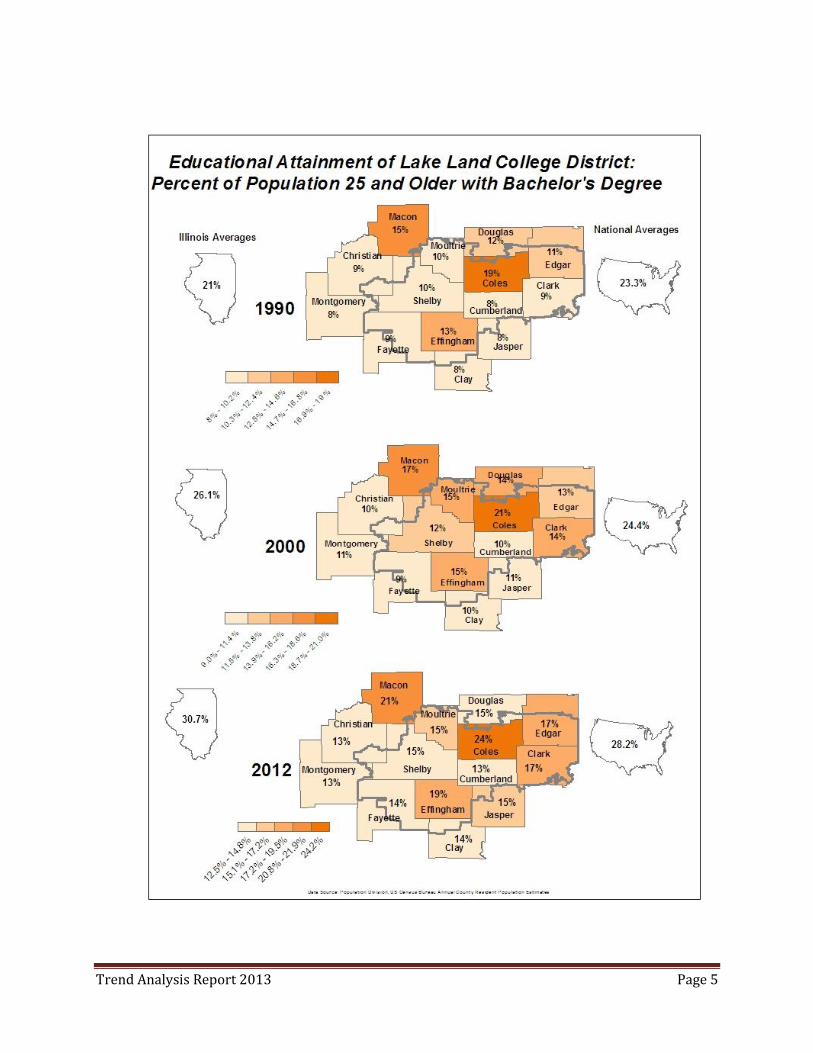
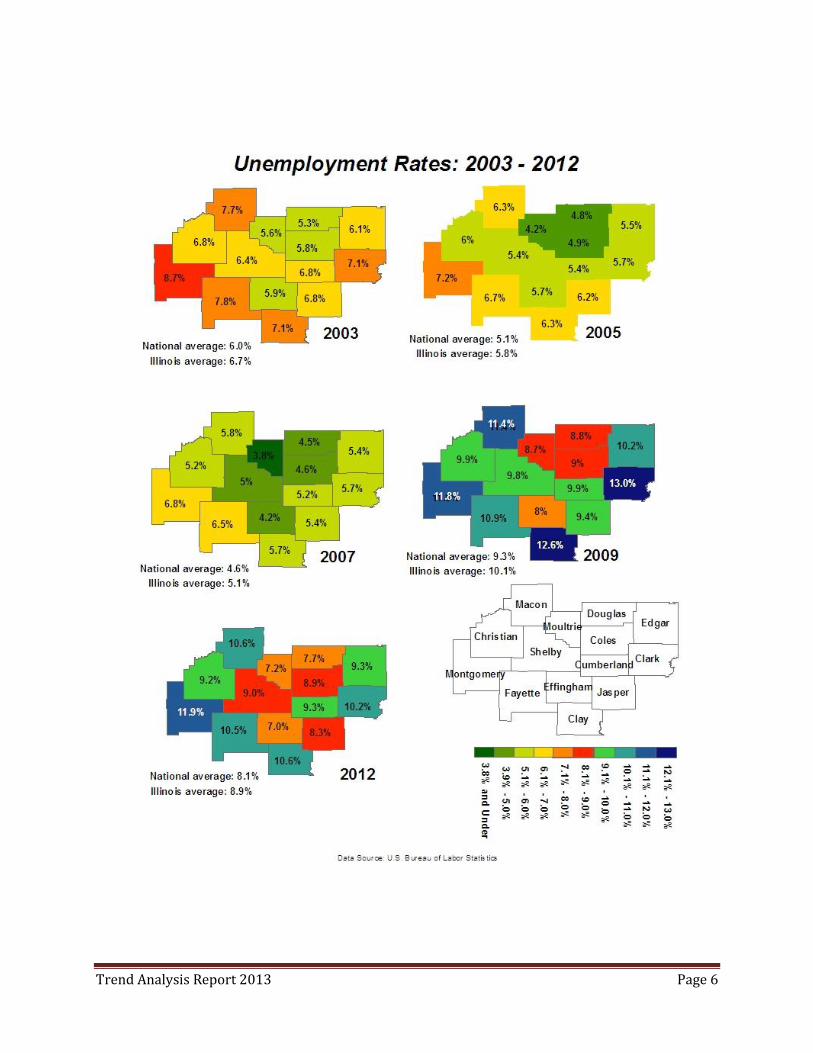
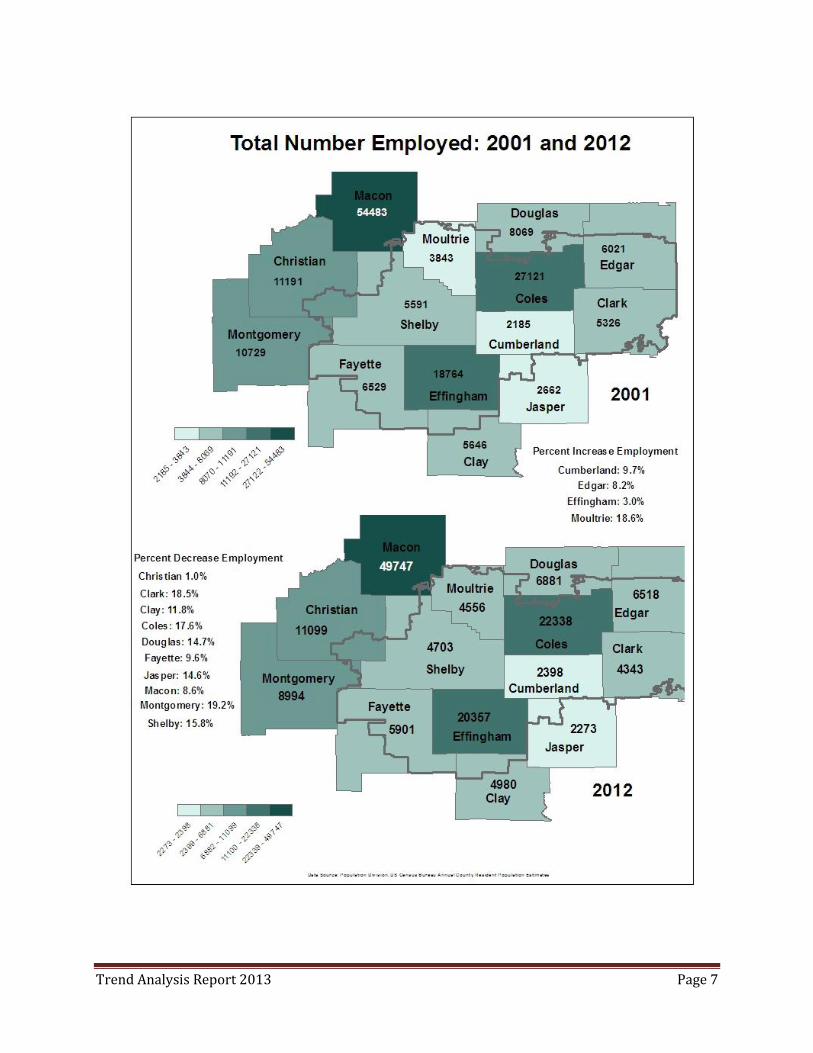
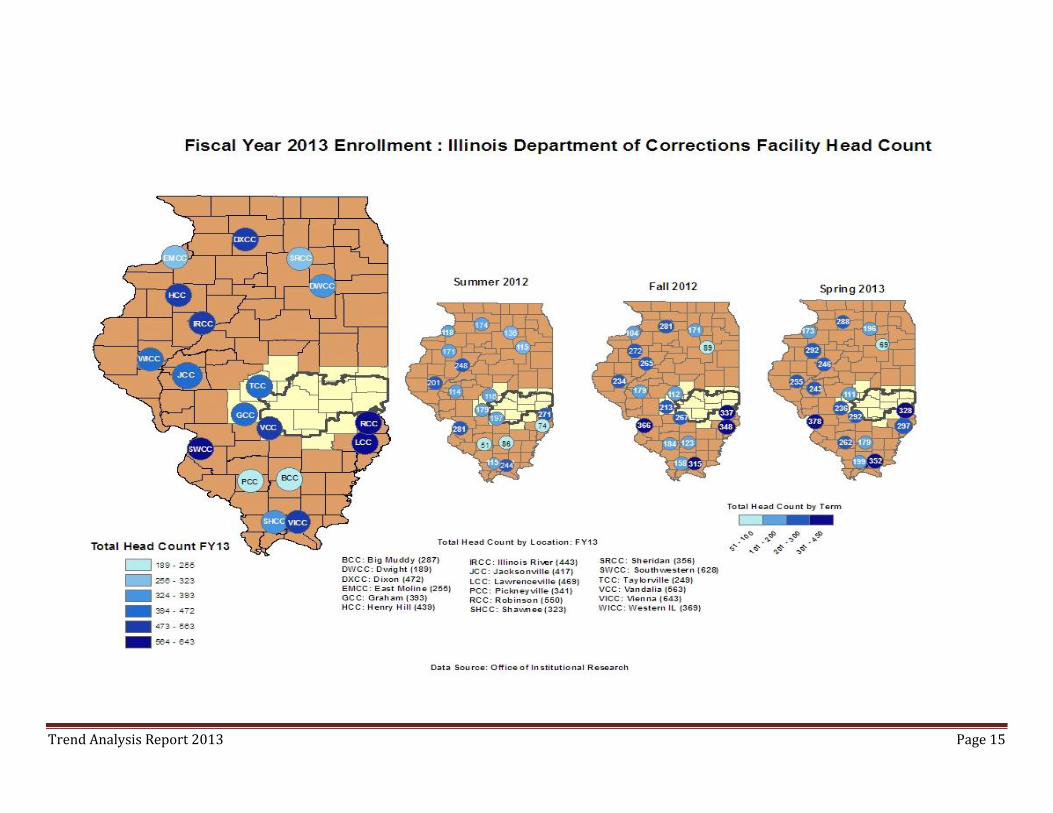
Section A: District Demographics provides a summary of Lake Land College’s district demographics. Lake Land’s district encompasses parts or all of the following counties: Effingham, Cumberland, Coles, Clark, Moultrie, Shelby, Fayette, Edgar, Clay, Christian, Montgomery, and Macon. Changes over time regarding the district’s population, median income, education attainment, unemployment, and employment by industry are presented via geospatial maps encompassing the counties listed above with an outline of the actual district Lake Land College serves. For median income and education attainment, state and national averages are provided on the maps for comparisons. Section B: Enrollment summarizes annual headcount, FTE and credit hours for Lake Land College students. Unless noted in the graphs, all headcount, FTE, and credit hours presented in this section exclude DOC students. Career students are defined as students seeking an AAS, ALS, or CRT degree. Transfer students are defined as students seeking an AA, AES, or AS degree. Annual headcount, FTE, and credit hours are based on end of term numbers unless otherwise stated. In addition, headcount numbers reflect unduplicated students with one exception. The Annual Headcount by Type of Course graph reflects duplicated students, since students can take an online, evening, and/or a weekend course. The final graphs in this section summarize enrollment in the top ten programs experiencing increasing or decreasing enrollment numbers. Section C: Student Demographics and Information presents data related to gender, age, race/ethnicity, financial aid, average ACT Scores, success rates, graduation rates, retention, GPA of Lake Land transfer students in their transfer university or college, student satisfaction, and assessment related to developmental courses. The headcount and percentages of students in most of the graphs reflect unduplicated students. However, the Number of Students Receiving Financial Aid and the Percentage of Students Testing into Developmental Courses reflect duplicated students, since students can receive more than one type of financial aid and assess into more than one developmental course area (e.g., math, English, and/or reading). The percentage of students receiving financial aid may be under
Trend Analysis Report 2013 Page 2
reported because the numbers presented in this report reflect only the financial aid which the college administers. These numbers exclude students receiving scholarships directly from the funding organization because the College is unaware of these scholarships. All three satisfaction measures presented in this report are pulled from the Noel Levitz Satisfaction Survey that Lake Land College administers to its students. Section D: Tuition, Fees, and Other Financial Data summarizes the history of Lake Land College’s tuition and fees, as well as, funding by source, net instructional costs, and EAV rates. In addition, several of the graphs provide a comparison of Lake Land College’s tuition and fees with all other community colleges in Illinois. While reviewing the figures in the document, please keep several things in mind. First, students can enroll through fall and spring terms. As a result, annual and end of term data may look quite different from ten day data, which is the data that the Illinois Community College Board (ICCB) presents in most of their reports. Second, several figures do not present fiscal year 2012 data. In these cases, final 2012 data is not available at this time.
Trend Analysis Report 2013 Page 3
Section A: District Demographics
Figure 1: Population Change
Trend Analysis Report 2013 Page 4
Figure 2: Median Income
Trend Analysis Report 2013 Page 5
Figure 3: Educational Attainment
Figure 4: Unemployment Rates
Trend Analysis Report 2013 Page 6
Fi
gure 5: Employment by County
Trend Analysis Report 2013 Page 7
Trend Analysis Report 2013 Page 8
Section B: Enrollment
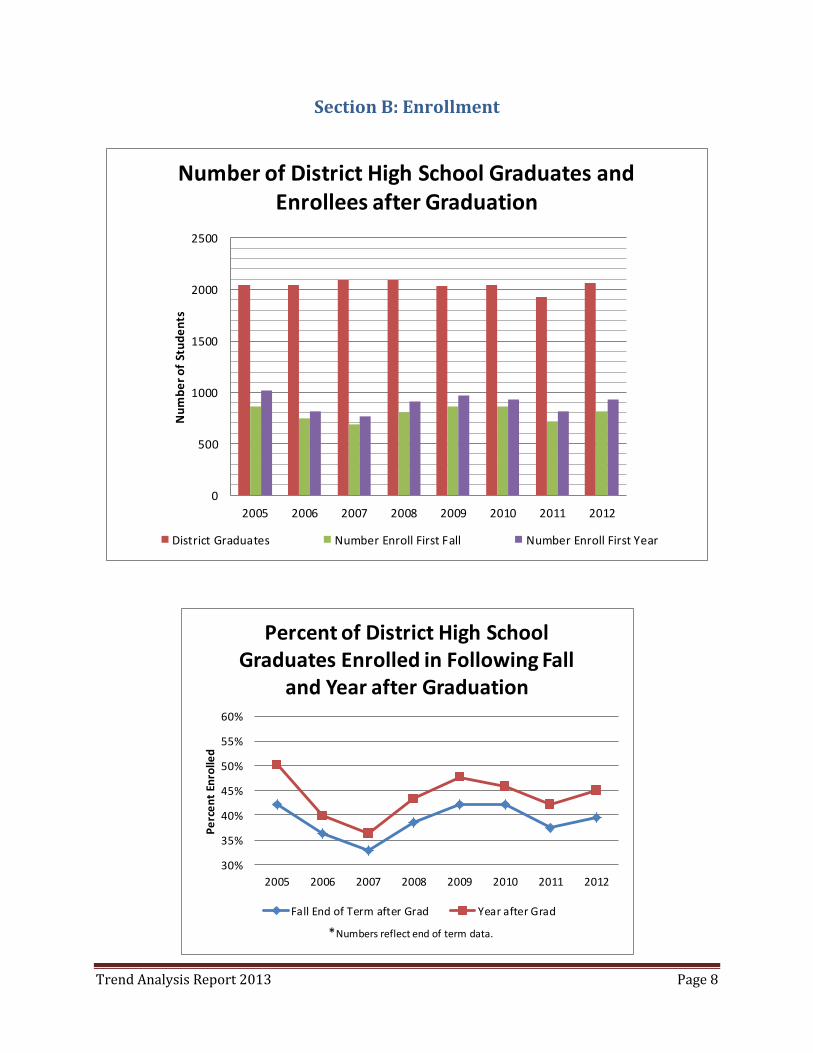
Figure 6: Number of District High School Graduates and Enrollees after Graduation
0
500
1000
1500
2000
2500
2005 2006 2007 2008 2009 2010 2011 2012
Nu
mb
er
of
Stu
de
nts
Number of District High School Graduates and Enrollees after Graduation
District Graduates Number Enroll First Fall Number Enroll First Year
Figure 7: Percent of District High School Graduates Enrolled in Following Fall and Year after Graduation
30%
35%
40%
45%
50%
55%
60%
2005 2006 2007 2008 2009 2010 2011 2012
Pe
rce
nt
Enro
lled
Percent of District High School Graduates Enrolled in Following Fall
and Year after Graduation
Fall End of Term after Grad Year after Grad
*Numbers reflect end of term data.
Trend Analysis Report 2013 Page 9
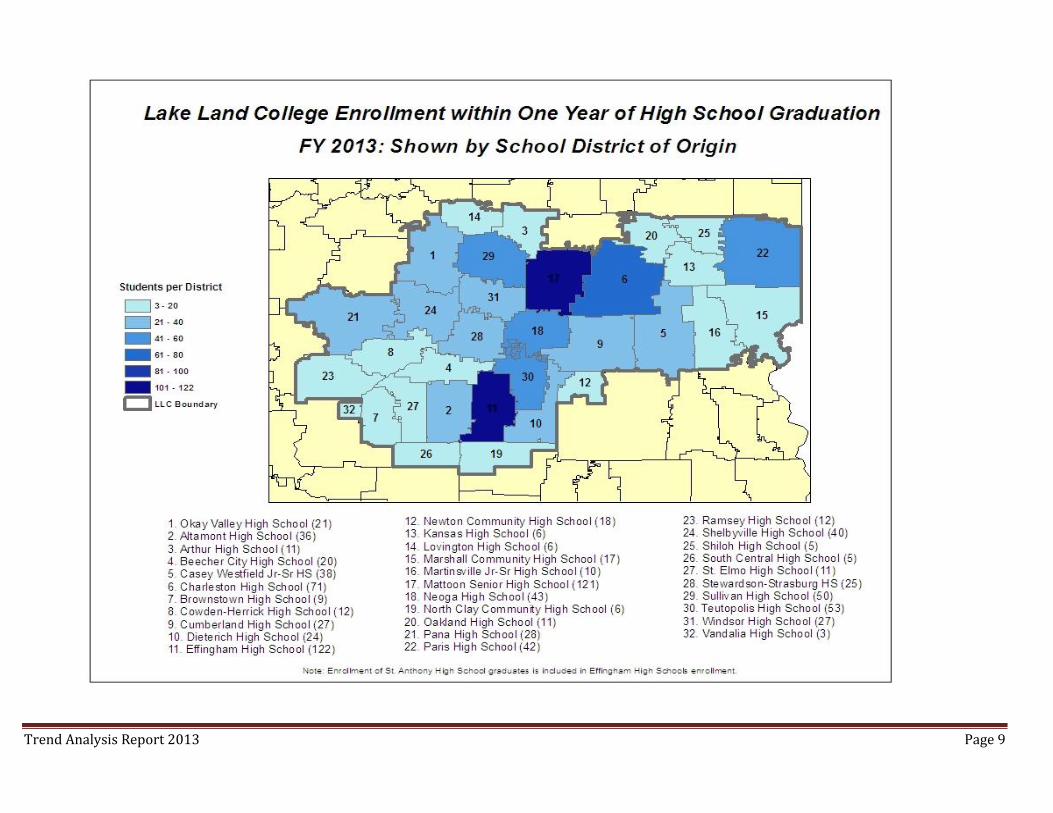
Figure 8: Lake Land College Enrollment within One Year of High School Graduation FY 2012: Shown by School District of Origin
Trend Analysis Report 2013 Page 10
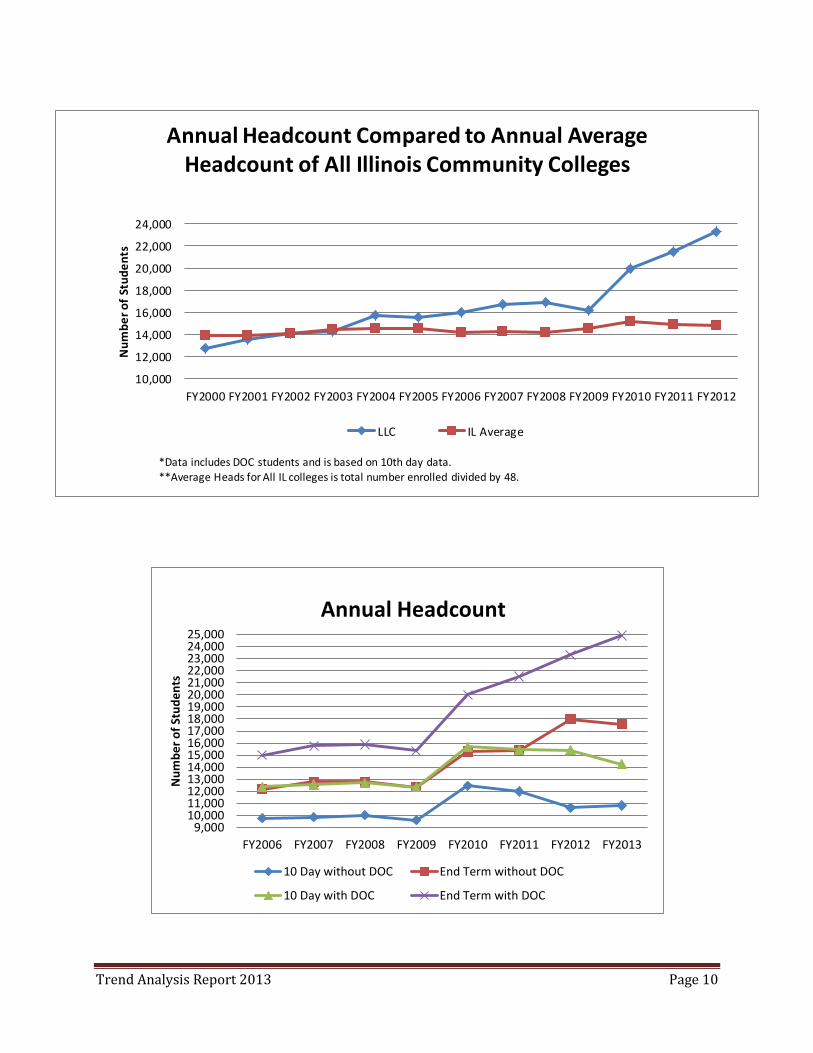
Figure 9: Annual Headcount Compared to Annual Average Headcount of All Illinois Community Colleges
9,00010,00011,00012,00013,00014,00015,00016,00017,00018,00019,00020,00021,00022,00023,00024,00025,000
FY2006 FY2007 FY2008 FY2009 FY2010 FY2011 FY2012 FY2013
Nu
mb
er
of
Stu
de
nts
Annual Headcount
10 Day without DOC End Term without DOC
10 Day with DOC End Term with DOC
Figure 10: Annual Headcount
10,000
12,000
14,000
16,000
18,000
20,000
22,000
24,000
FY2000 FY2001 FY2002 FY2003 FY2004 FY2005 FY2006 FY2007 FY2008 FY2009 FY2010 FY2011 FY2012
Nu
mb
er
of
Stu
de
nts
Annual Headcount Compared to Annual Average Headcount of All Illinois Community Colleges
LLC IL Average
*Data includes DOC students and is based on 10th day data.**Average Heads for All IL colleges is total number enrolled divided by 48.
Trend Analysis Report 2013 Page 11
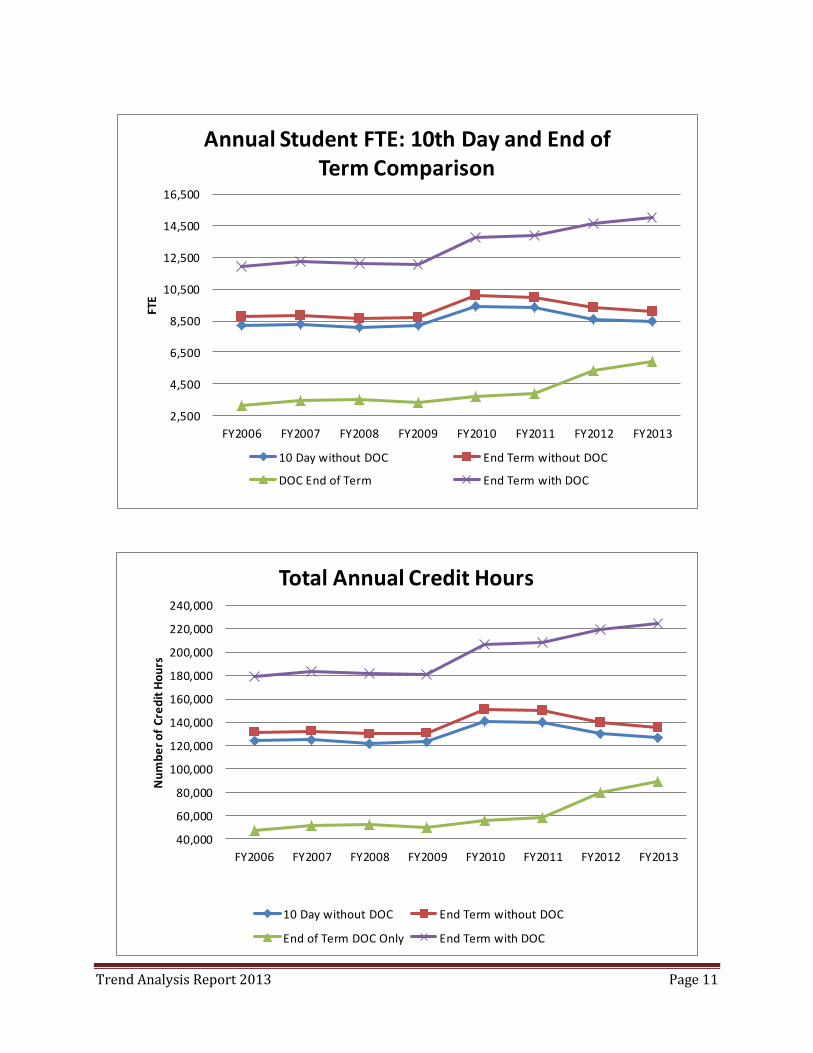
Figure 11: Annual Student FTE: 10th Day and End of Term Comparison
2,500
4,500
6,500
8,500
10,500
12,500
14,500
16,500
FY2006 FY2007 FY2008 FY2009 FY2010 FY2011 FY2012 FY2013
FTE
Annual Student FTE: 10th Day and End of Term Comparison
10 Day without DOC End Term without DOC
DOC End of Term End Term with DOC
Figure 12: Total Annual Credit Hours
40,000
60,000
80,000
100,000
120,000
140,000
160,000
180,000
200,000
220,000
240,000
FY2006 FY2007 FY2008 FY2009 FY2010 FY2011 FY2012 FY2013
Nu
mb
er
of
Cre
dit
Ho
urs
Total Annual Credit Hours
10 Day without DOC End Term without DOC
End of Term DOC Only End Term with DOC
Trend Analysis Report 2013 Page 12
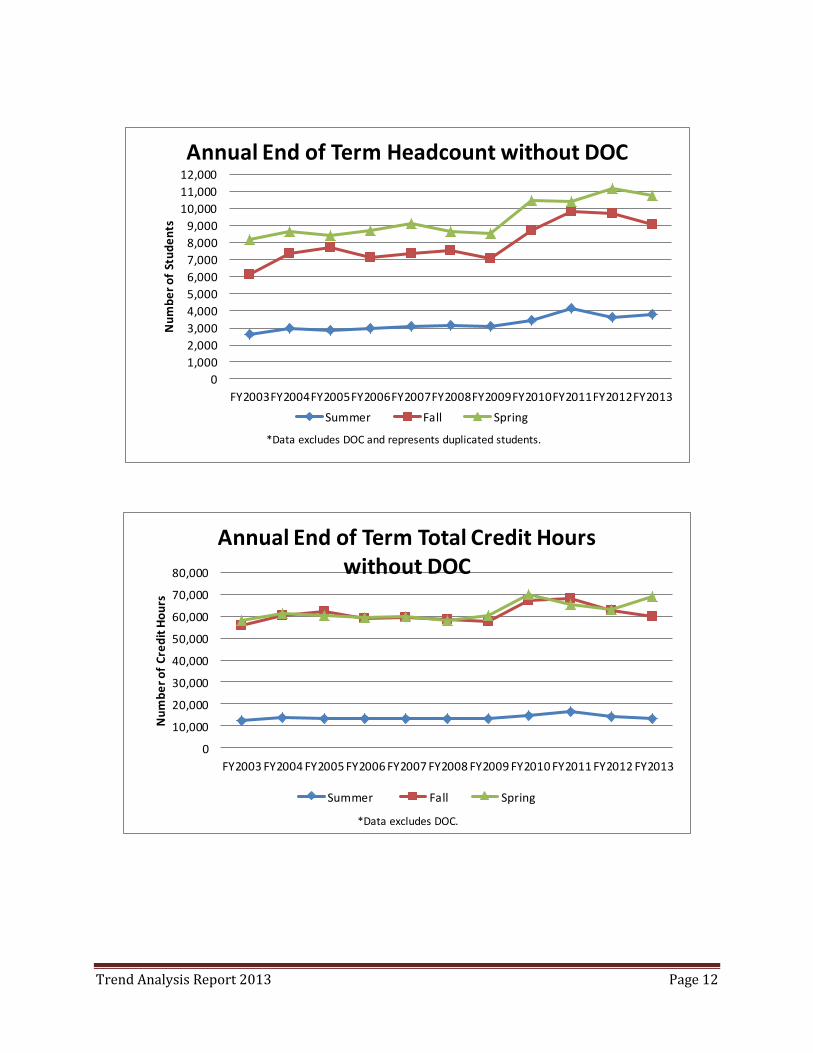
Figure 13: Annual End of Term Headcount without DOC
0
1,000
2,000
3,000
4,000
5,000
6,000
7,000
8,000
9,000
10,000
11,000
12,000
FY2003FY2004FY2005FY2006FY2007FY2008FY2009FY2010FY2011FY2012FY2013
Nu
mb
er
of
Stu
de
nts
Annual End of Term Headcount without DOC
Summer Fall Spring
*Data excludes DOC and represents duplicated students.
Figure 14: Annual End of Term Total Credit Hour without DOC
0
10,000
20,000
30,000
40,000
50,000
60,000
70,000
80,000
FY2003 FY2004 FY2005 FY2006 FY2007 FY2008 FY2009 FY2010 FY2011 FY2012 FY2013
Nu
mb
er
of
Cre
dit
Ho
urs
Annual End of Term Total Credit Hours without DOC
Summer Fall Spring
*Data excludes DOC.
Trend Analysis Report 2013 Page 13
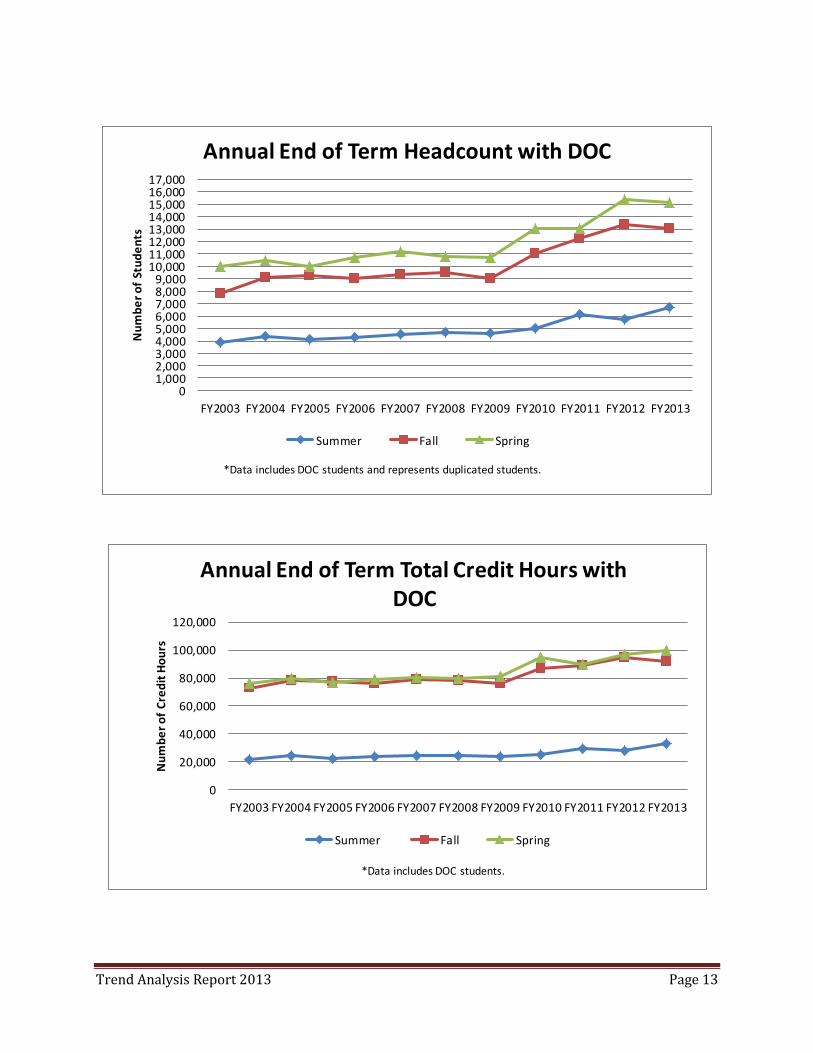
Figure 15: Annual End of Term Headcount with DOC
01,0002,0003,0004,0005,0006,0007,0008,0009,000
10,00011,00012,00013,00014,00015,00016,00017,000
FY2003 FY2004 FY2005 FY2006 FY2007 FY2008 FY2009 FY2010 FY2011 FY2012 FY2013
Nu
mb
er
of
Stu
de
nts
Annual End of Term Headcount with DOC
Summer Fall Spring
*Data includes DOC students and represents duplicated students.
Figure 16: Annual End of Term Total Credit Hours with DOC
0
20,000
40,000
60,000
80,000
100,000
120,000
FY2003 FY2004 FY2005 FY2006 FY2007 FY2008 FY2009 FY2010 FY2011 FY2012 FY2013
Nu
mb
er
of
Cre
dit
Ho
urs
Annual End of Term Total Credit Hours with DOC
Summer Fall Spring
*Data includes DOC students.
Trend Analysis Report 2013 Page 14
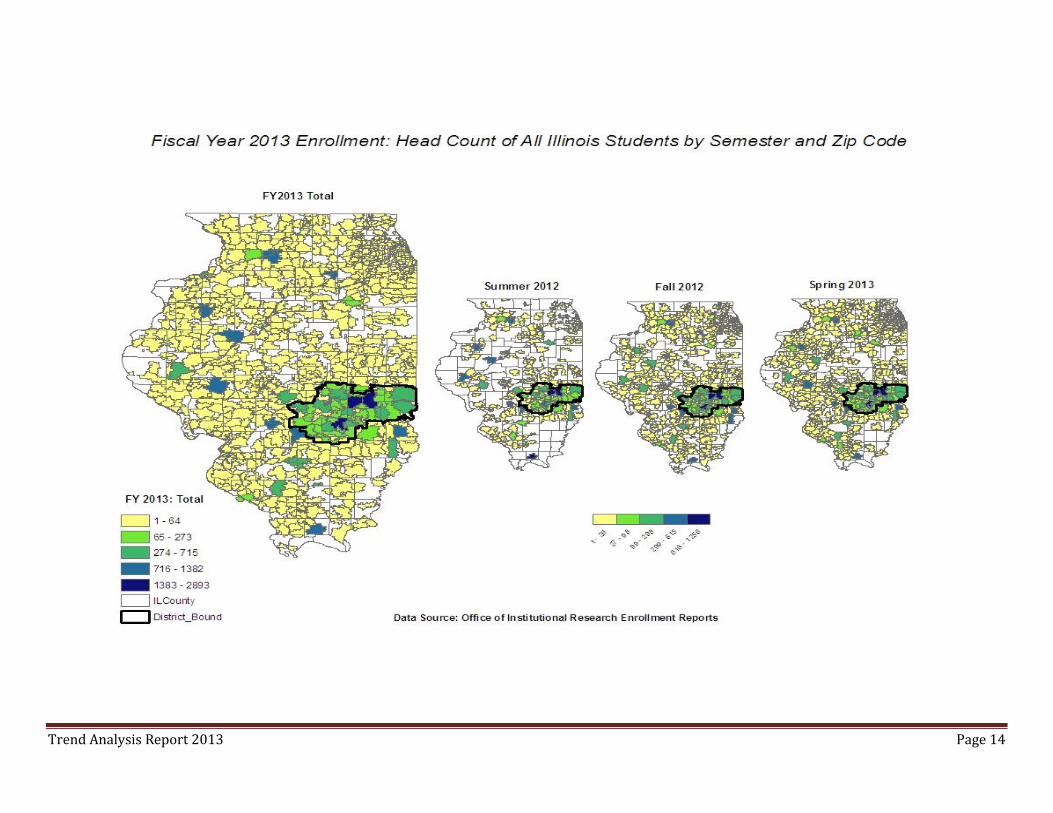
Figure 17: Fiscal Year 2012 Enrollment: Head Count of all Illinois students by Semester and Zip Codes
Trend Analysis Report 2013 Page 15
Figure 18: Fiscal Year 2012 Enrollment: Illinois Department of Corrections Facility Head Count
Trend Analysis Report 2013 Page 16
02,0004,0006,0008,000
10,00012,00014,00016,00018,00020,00022,00024,00026,00028,000
FY2005 FY2006 FY2007 FY2008 FY2009 FY2010 FY2011 FY2012 FY2013
Nu
mb
er
of
Stu
de
nts
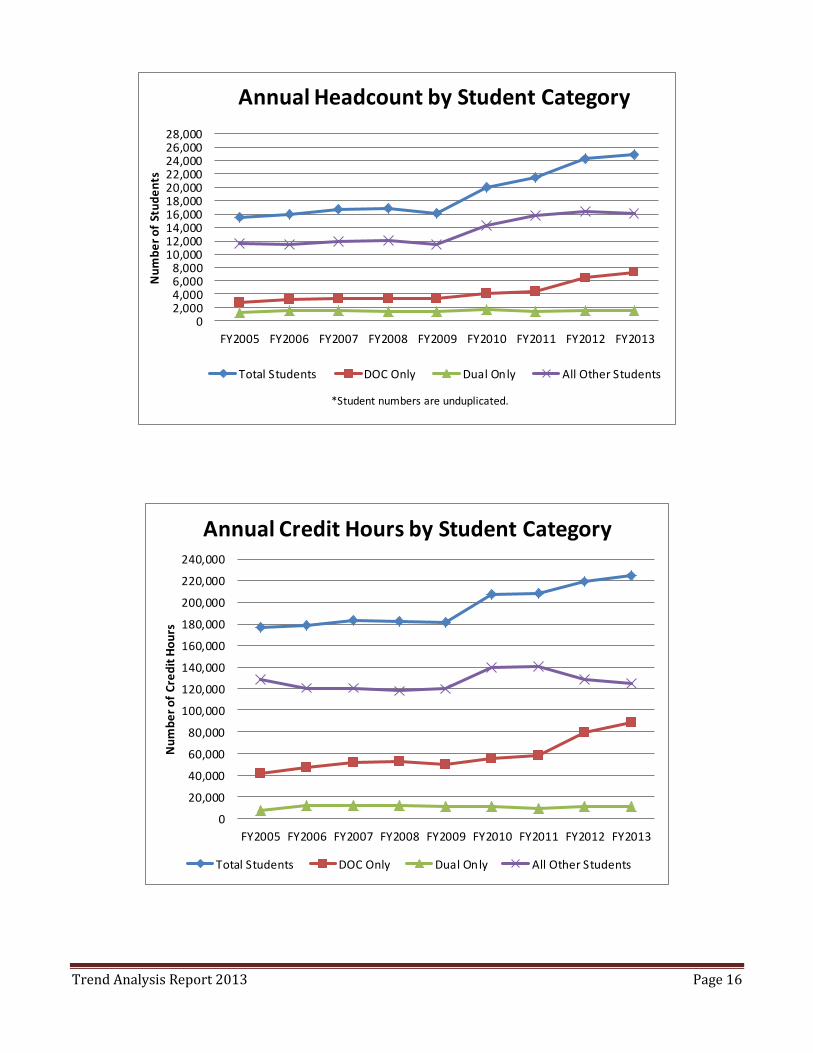
Annual Headcount by Student Category
Total Students DOC Only Dual Only All Other Students
*Student numbers are unduplicated.
Figure 19: Annual Headcount by Student Category
Figure 20: Annual Credit Hours by Student Category
0
20,000
40,000
60,000
80,000
100,000
120,000
140,000
160,000
180,000
200,000
220,000
240,000
FY2005 FY2006 FY2007 FY2008 FY2009 FY2010 FY2011 FY2012 FY2013
Nu
mb
er
of
Cre
dit
Ho
urs
Annual Credit Hours by Student Category
Total Students DOC Only Dual Only All Other Students
Trend Analysis Report 2013 Page 17
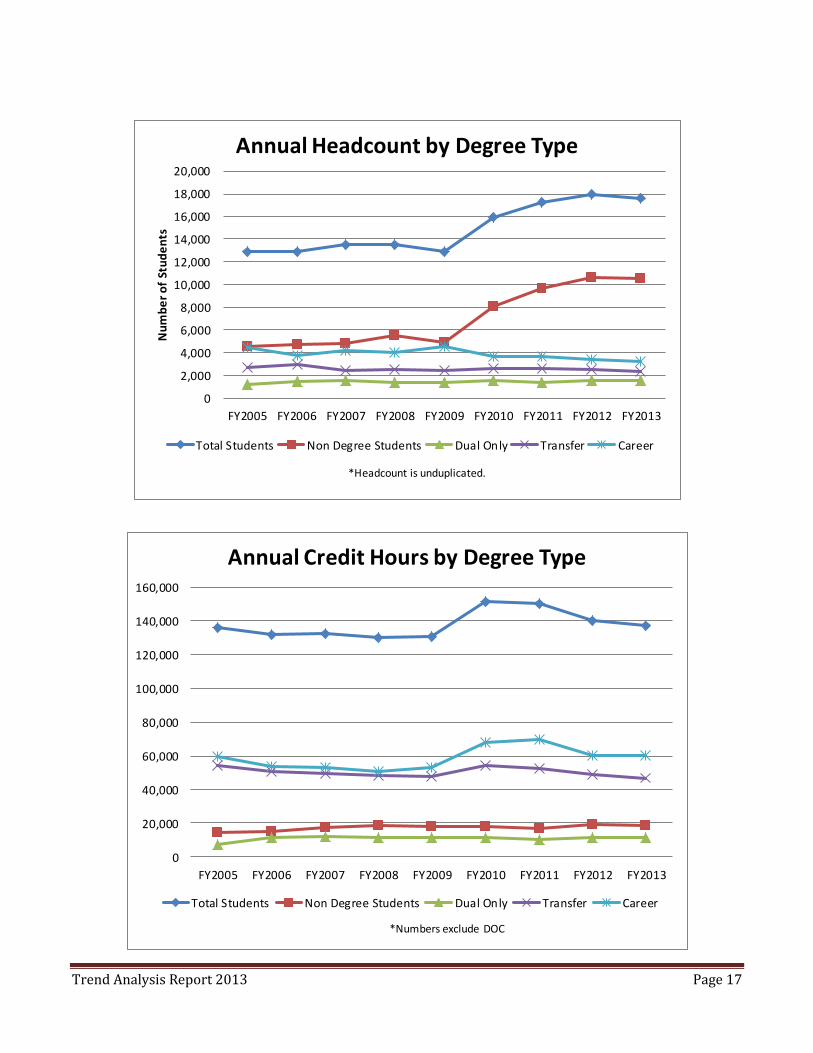
Figure 21: Annual Headcount by Degree Type
0
2,000
4,000
6,000
8,000
10,000
12,000
14,000
16,000
18,000
20,000
FY2005 FY2006 FY2007 FY2008 FY2009 FY2010 FY2011 FY2012 FY2013
Nu
mb
er
of
Stu
de
nts
Annual Headcount by Degree Type
Total Students Non Degree Students Dual Only Transfer Career
*Headcount is unduplicated.
Figure 22: Annual Credit Hours by Degree Type
0
20,000
40,000
60,000
80,000
100,000
120,000
140,000
160,000
FY2005 FY2006 FY2007 FY2008 FY2009 FY2010 FY2011 FY2012 FY2013
Annual Credit Hours by Degree Type
Total Students Non Degree Students Dual Only Transfer Career
*Numbers exclude DOC
Trend Analysis Report 2013 Page 18
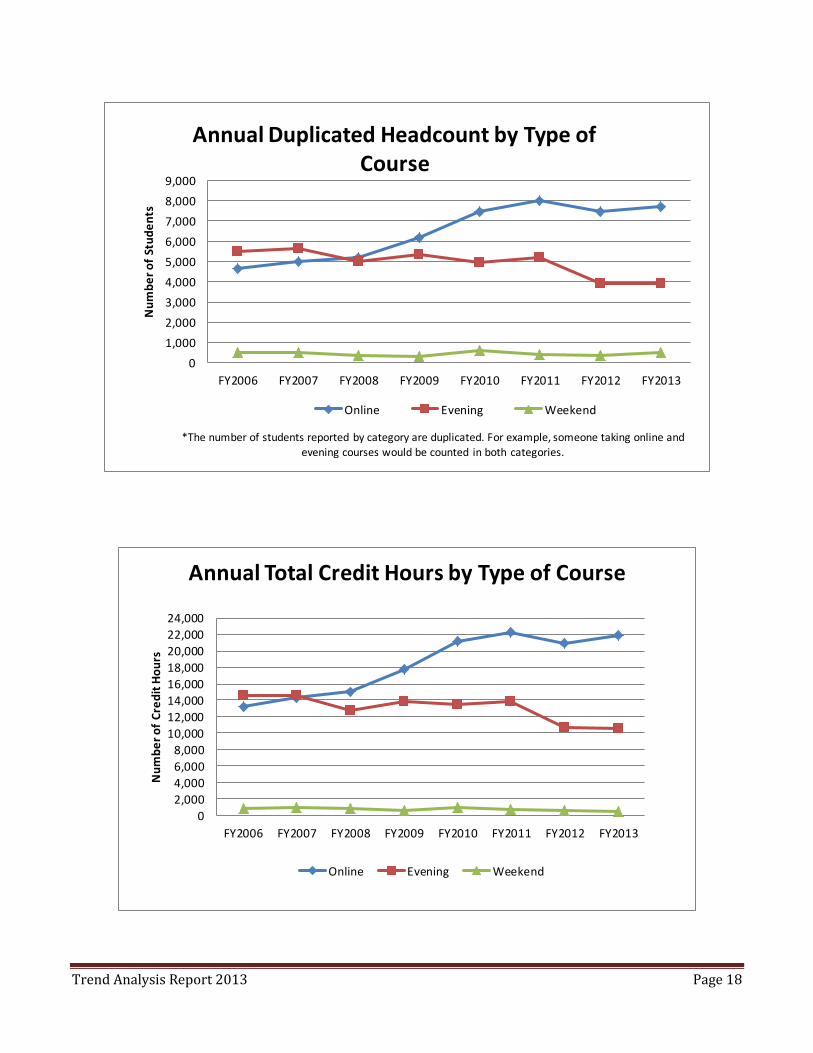
Figure 23: Annual Headcount by Type of Course
0
1,000
2,000
3,000
4,000
5,000
6,000
7,000
8,000
9,000
FY2006 FY2007 FY2008 FY2009 FY2010 FY2011 FY2012 FY2013
Nu
mb
er
of
Stu
de
nts
Annual Duplicated Headcount by Type of Course
Online Evening Weekend
*The number of students reported by category are duplicated. For example, someone taking online and evening courses would be counted in both categories.
Figure 24: Annual Total Credit Hours by Type of Course
0
2,000
4,000
6,000
8,000
10,000
12,000
14,000
16,000
18,000
20,000
22,000
24,000
FY2006 FY2007 FY2008 FY2009 FY2010 FY2011 FY2012 FY2013
Nu
mb
er
of
Cre
dit
Ho
urs
Annual Total Credit Hours by Type of Course
Online Evening Weekend
Trend Analysis Report 2013 Page 19
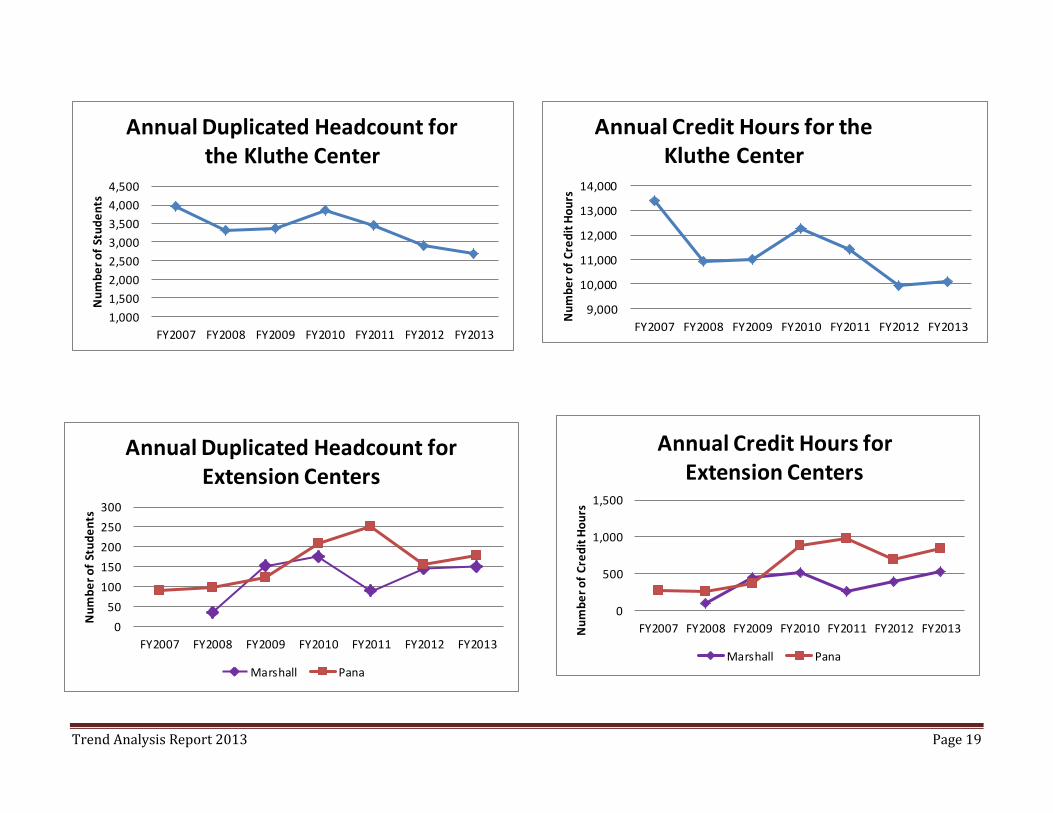
Figure 25: Annual Headcount for the Kluthe Center Figure 26: Annual Credit Hours for the Kluthe Center
Figure 28: Annual Credit Hours for Extension Centers Figure 27: Annual Headcount for Extension Centers
1,000
1,500
2,000
2,500
3,000
3,500
4,000
4,500
FY2007 FY2008 FY2009 FY2010 FY2011 FY2012 FY2013
Nu
mb
er
of
Stu
de
nts
Annual Duplicated Headcount for the Kluthe Center
0
50
100
150
200
250
300
FY2007 FY2008 FY2009 FY2010 FY2011 FY2012 FY2013
Nu
mb
er
of
Stu
de
nts
Annual Duplicated Headcount for Extension Centers
Marshall Pana
9,000
10,000
11,000
12,000
13,000
14,000
FY2007 FY2008 FY2009 FY2010 FY2011 FY2012 FY2013
Nu
mb
er
of
Cre
dit
Ho
urs
Annual Credit Hours for the Kluthe Center
0
500
1,000
1,500
FY2007 FY2008 FY2009 FY2010 FY2011 FY2012 FY2013Nu
mb
er
of
Cre
dit
Ho
urs
Annual Credit Hours for Extension Centers
Marshall Pana
Trend Analysis Report 2013 Page 20
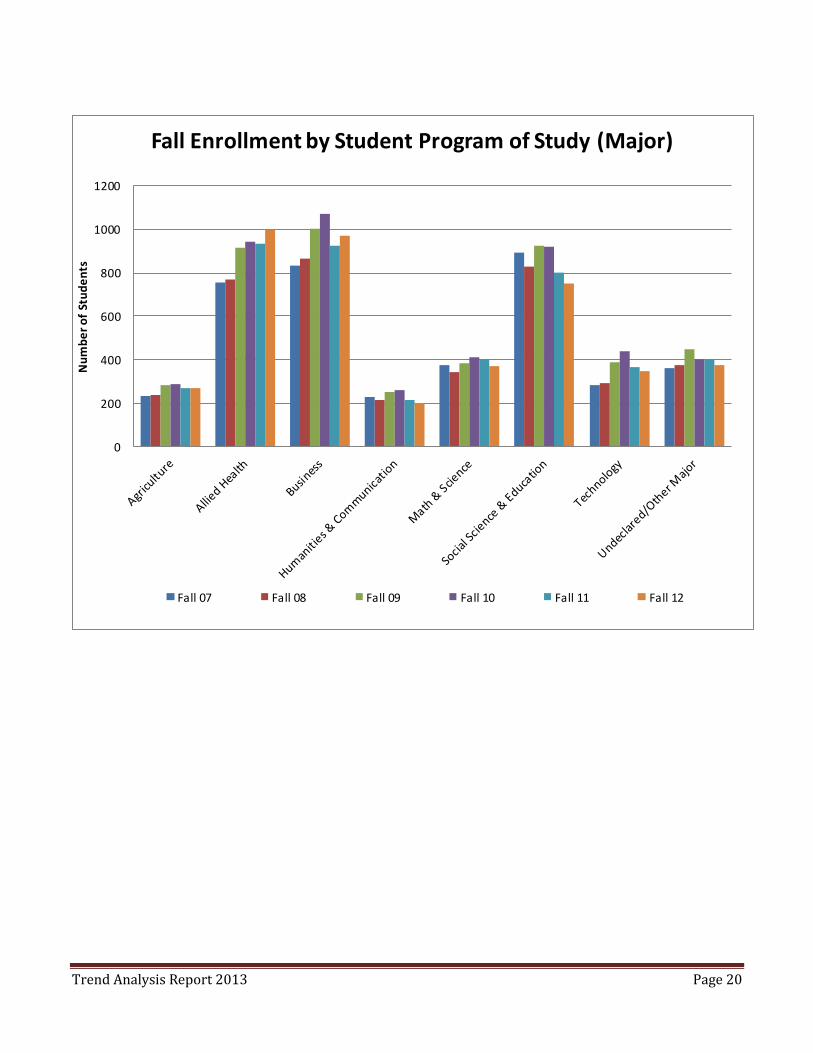
Figure 29: Fall Enrollment by Student Program of Study (Major)
0
200
400
600
800
1000
1200
Nu
mb
er
of
Stu
de
nts
Fall Enrollment by Student Program of Study (Major)
Fall 07 Fall 08 Fall 09 Fall 10 Fall 11 Fall 12
Trend Analysis Report 2013 Page 21
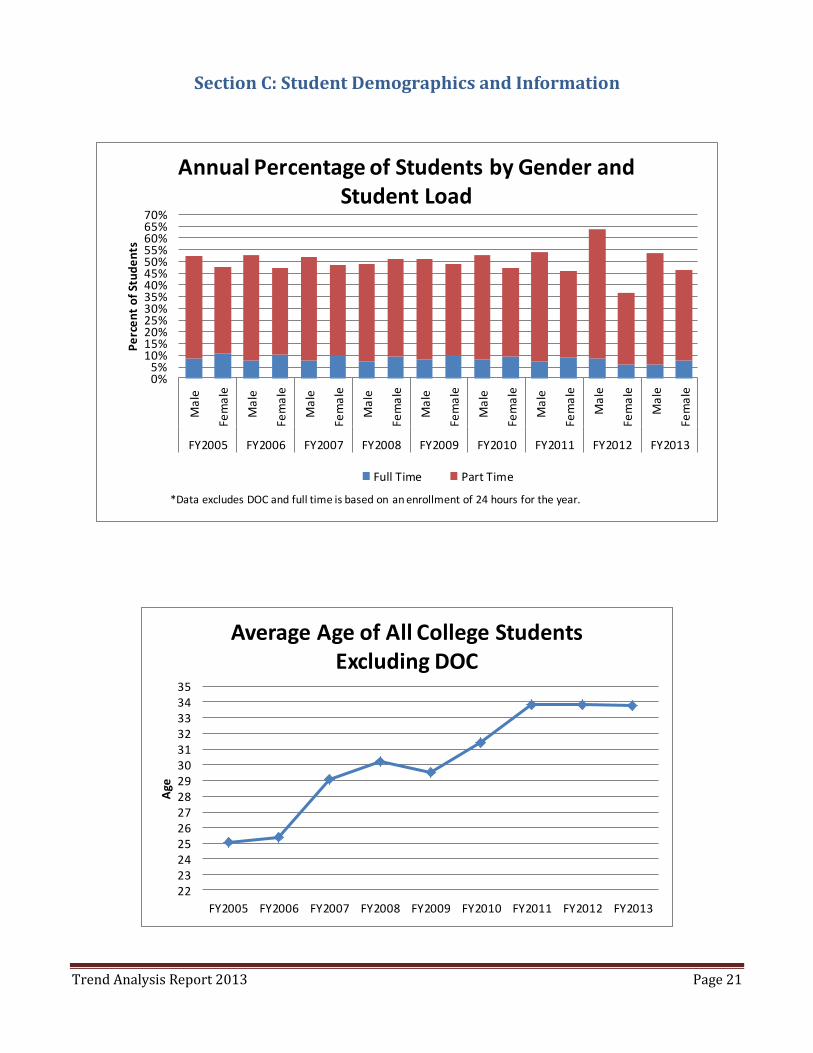
Section C: Student Demographics and Information
Figure 30: Annual Percentage of Students by Gender and Student Load
0%5%
10%15%20%25%30%35%40%45%50%55%60%65%70%
Ma
le
Fem
ale
Ma
le
Fem
ale
Ma
le
Fem
ale
Ma
le
Fem
ale
Ma
le
Fem
ale
Ma
le
Fem
ale
Ma
le
Fem
ale
Ma
le
Fem
ale
Ma
le
Fem
ale
FY2005 FY2006 FY2007 FY2008 FY2009 FY2010 FY2011 FY2012 FY2013
Pe
rce
nt
of
Stu
de
nts
Annual Percentage of Students by Gender and Student Load
Full Time Part Time
*Data excludes DOC and full time is based on an enrollment of 24 hours for the year.
Figure 31: Average Age of Students
2223242526272829303132333435
FY2005 FY2006 FY2007 FY2008 FY2009 FY2010 FY2011 FY2012 FY2013
Age
Average Age of All College Students Excluding DOC
Trend Analysis Report 2013 Page 22
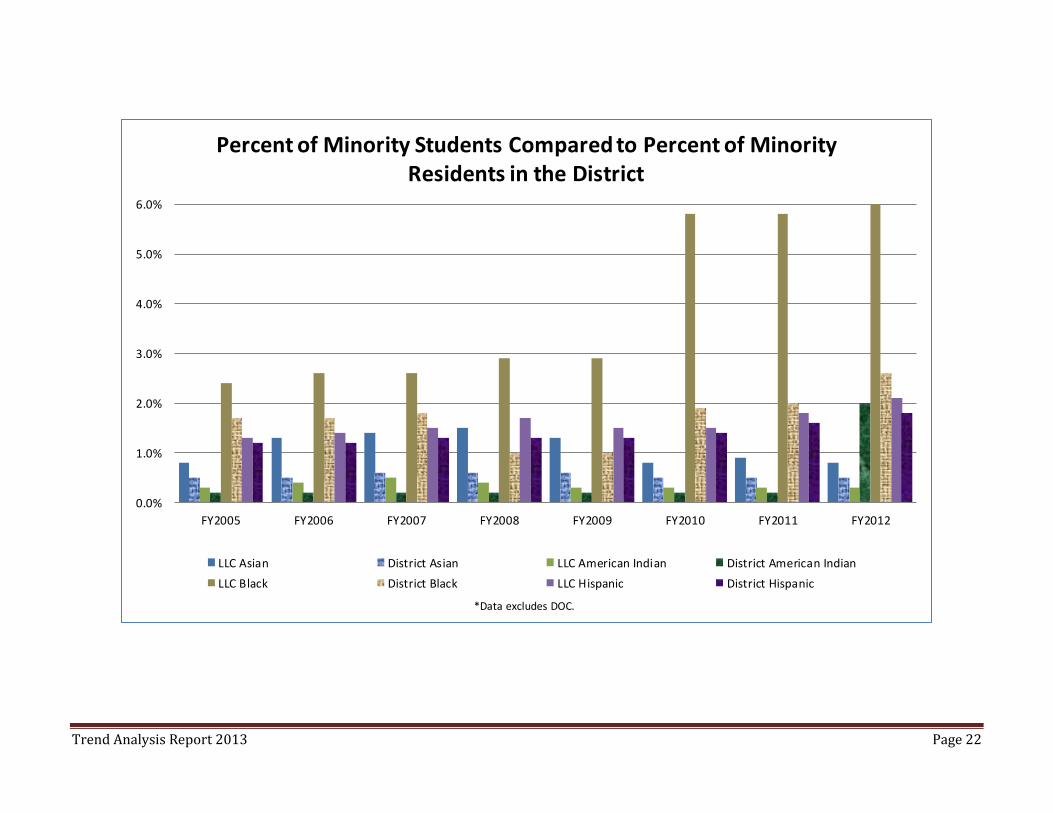
Figure 32: Percent of Minority Students Compared to Percent of Minority Residents in the District
0.0%
1.0%
2.0%
3.0%
4.0%
5.0%
6.0%
FY2005 FY2006 FY2007 FY2008 FY2009 FY2010 FY2011 FY2012
Percent of Minority Students Compared to Percent of Minority Residents in the District
LLC Asian District Asian LLC American Indian District American Indian
LLC Black District Black LLC Hispanic District Hispanic
*Data excludes DOC.
Trend Analysis Report 2013 Page 23
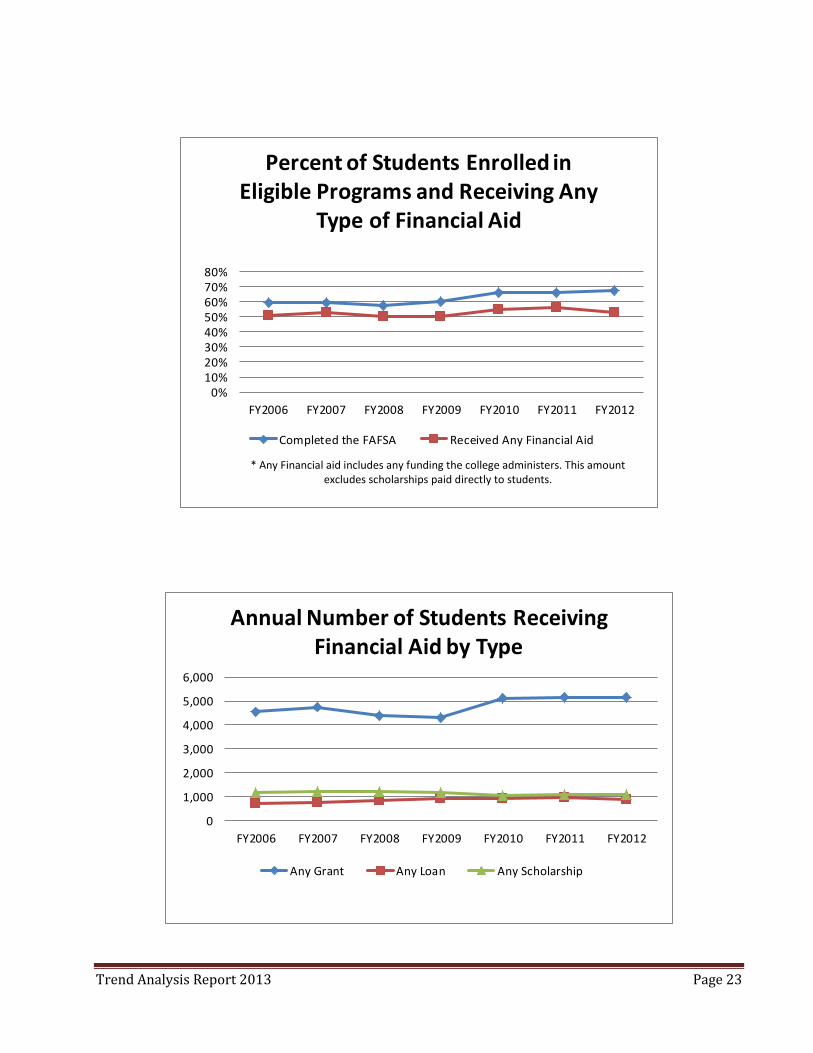
Figure 33: Percent of Students Enrolled in Eligible Programs and Receiving Any Type of Financial Aid
0%10%20%30%40%50%60%70%80%
FY2006 FY2007 FY2008 FY2009 FY2010 FY2011 FY2012
Percent of Students Enrolled in Eligible Programs and Receiving Any
Type of Financial Aid
Completed the FAFSA Received Any Financial Aid
Figure 34: Annual Number of Students Receiving Financial Aid by Type
0
1,000
2,000
3,000
4,000
5,000
6,000
FY2006 FY2007 FY2008 FY2009 FY2010 FY2011 FY2012
Annual Number of Students Receiving Financial Aid by Type
Any Grant Any Loan Any Scholarship
* Any Financial aid includes any funding the college administers. This amount excludes scholarships paid directly to students.
Trend Analysis Report 2013 Page 24
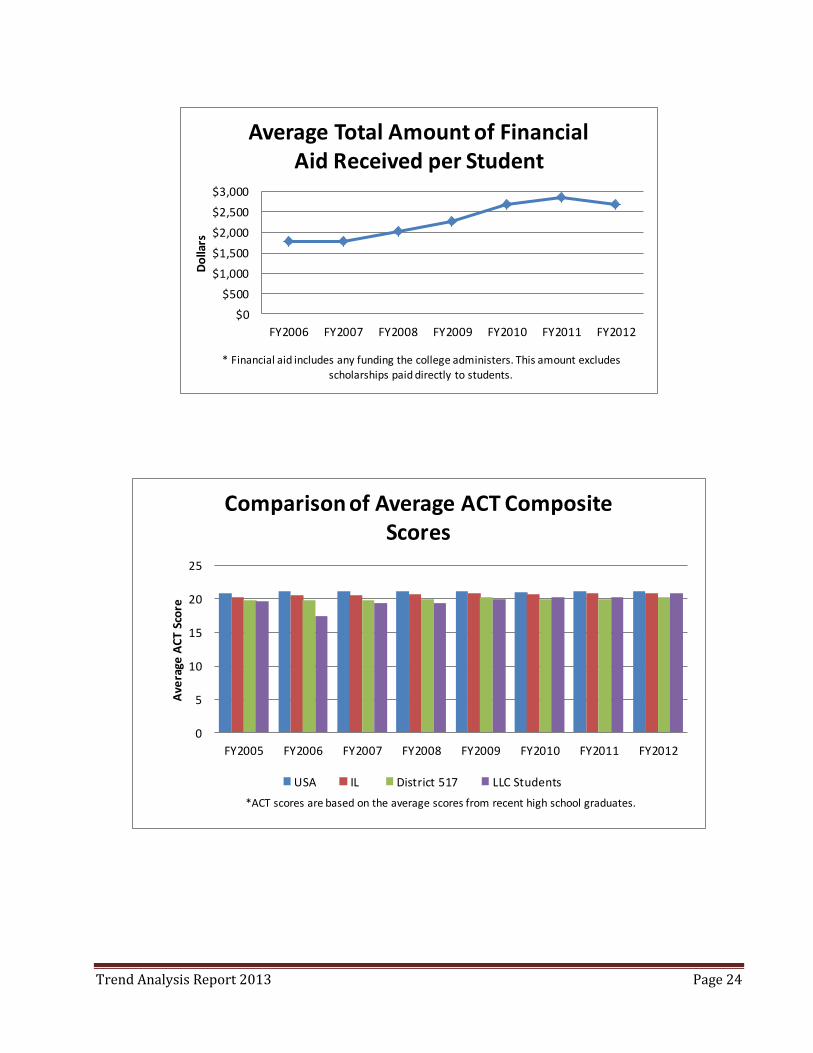
Figure 35: Average Total Amount of Financial Aid Received per Student
$0
$500
$1,000
$1,500
$2,000
$2,500
$3,000
FY2006 FY2007 FY2008 FY2009 FY2010 FY2011 FY2012
Do
llars
Average Total Amount of Financial Aid Received per Student
* Financial aid includes any funding the college administers. This amount excludes scholarships paid directly to students.
Figure 36: Comparison of Average ACT Composite Scores
0
5
10
15
20
25
FY2005 FY2006 FY2007 FY2008 FY2009 FY2010 FY2011 FY2012
Ave
rage
AC
T Sc
ore
Comparison of Average ACT Composite Scores
USA IL District 517 LLC Students
*ACT scores are based on the average scores from recent high school graduates.
Trend Analysis Report 2013 Page 25
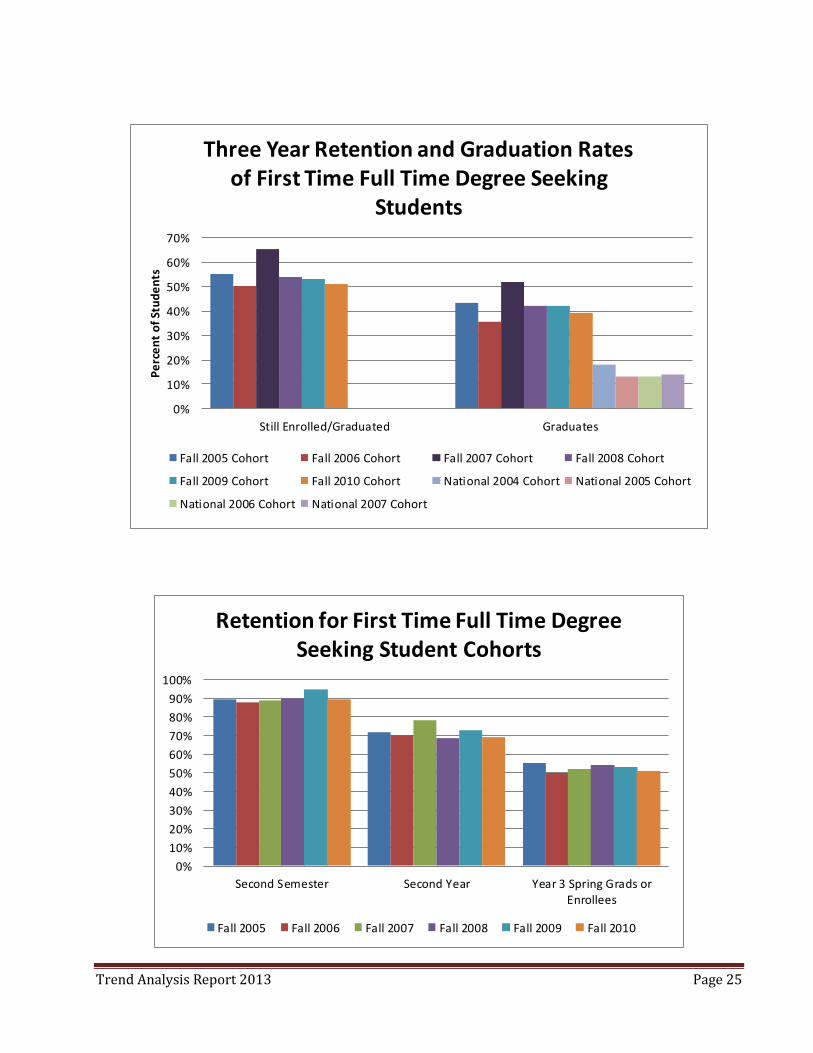
Figure 37: Three Year Retention and Graduation Rates of First Time Full Time Degree Seeking Students
0%
10%
20%
30%
40%
50%
60%
70%
Still Enrolled/Graduated Graduates
Pe
rce
nt
of
Stu
de
nts
Three Year Retention and Graduation Rates of First Time Full Time Degree Seeking
Students
Fall 2005 Cohort Fall 2006 Cohort Fall 2007 Cohort Fall 2008 Cohort
Fall 2009 Cohort Fall 2010 Cohort National 2004 Cohort National 2005 Cohort
National 2006 Cohort National 2007 Cohort
Figure 38: Retention for First Time Full Time Degree Seeking Student Cohorts
0%
10%
20%
30%
40%
50%
60%
70%
80%
90%
100%
Second Semester Second Year Year 3 Spring Grads orEnrollees
Retention for First Time Full Time Degree Seeking Student Cohorts
Fall 2005 Fall 2006 Fall 2007 Fall 2008 Fall 2009 Fall 2010
Trend Analysis Report 2013 Page 26
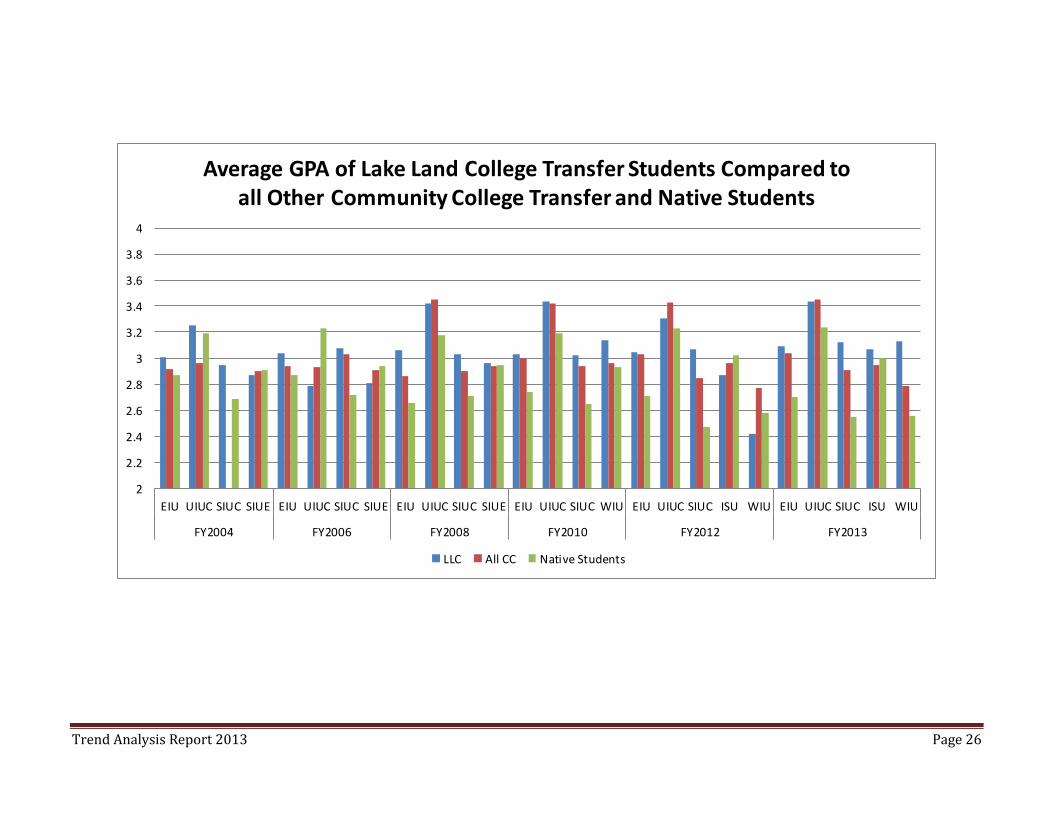
Figure 39: Average GPA of Lake Land College Transfer Students Compared to All Other Community College Transfer and Native Students
2
2.2
2.4
2.6
2.8
3
3.2
3.4
3.6
3.8
4
EIU UIUC SIUC SIUE EIU UIUC SIUC SIUE EIU UIUC SIUC SIUE EIU UIUC SIUC WIU EIU UIUC SIUC ISU WIU EIU UIUC SIUC ISU WIU
FY2004 FY2006 FY2008 FY2010 FY2012 FY2013
Average GPA of Lake Land College Transfer Students Compared to all Other Community College Transfer and Native Students
LLC All CC Native Students
Trend Analysis Report 2013 Page 27
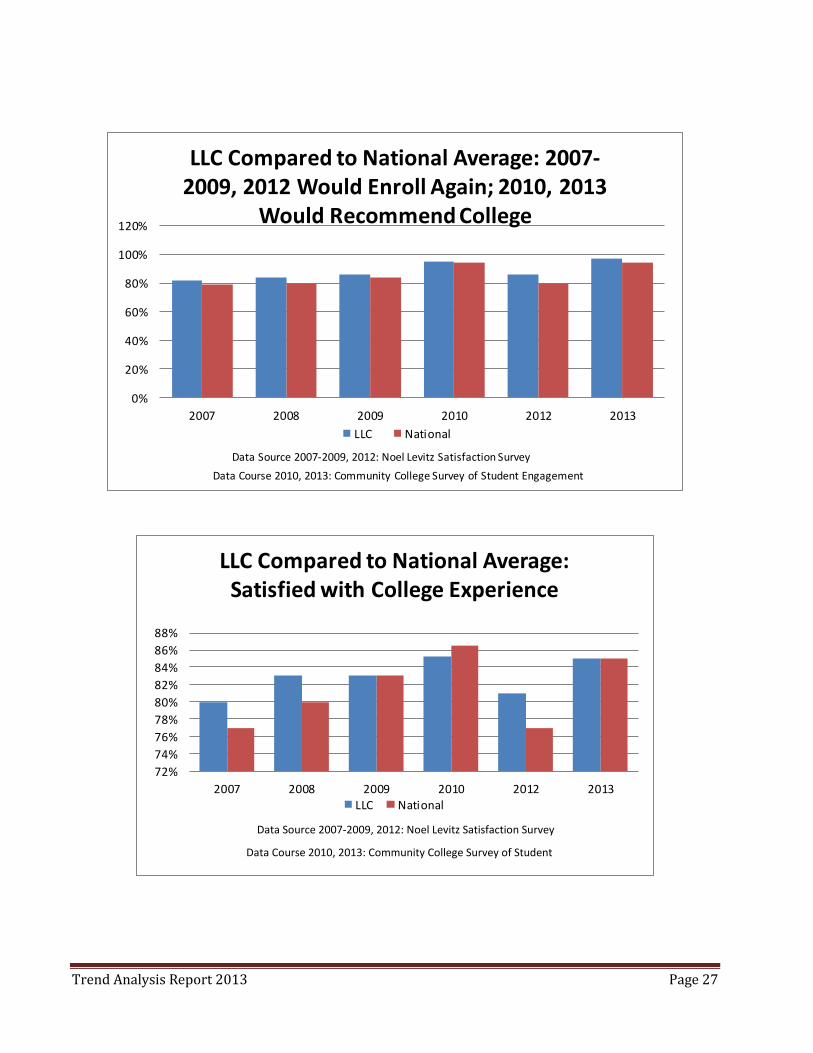
Figure 40: LLC Compared to National Average: 2007-2009, 2012 Would Enroll Again, 2010 Would Recommend College
0%
20%
40%
60%
80%
100%
120%
2007 2008 2009 2010 2012 2013
LLC Compared to National Average: 2007-2009, 2012 Would Enroll Again; 2010, 2013
Would Recommend College
LLC National
Data Source 2007-2009, 2012: Noel Levitz Satisfaction Survey
Data Course 2010, 2013: Community College Survey of Student Engagement
Figure 41: LLC Compared to National Average: Satisfied with College Experience
72%
74%
76%
78%
80%
82%
84%
86%
88%
2007 2008 2009 2010 2012 2013
LLC Compared to National Average: Satisfied with College Experience
LLC National
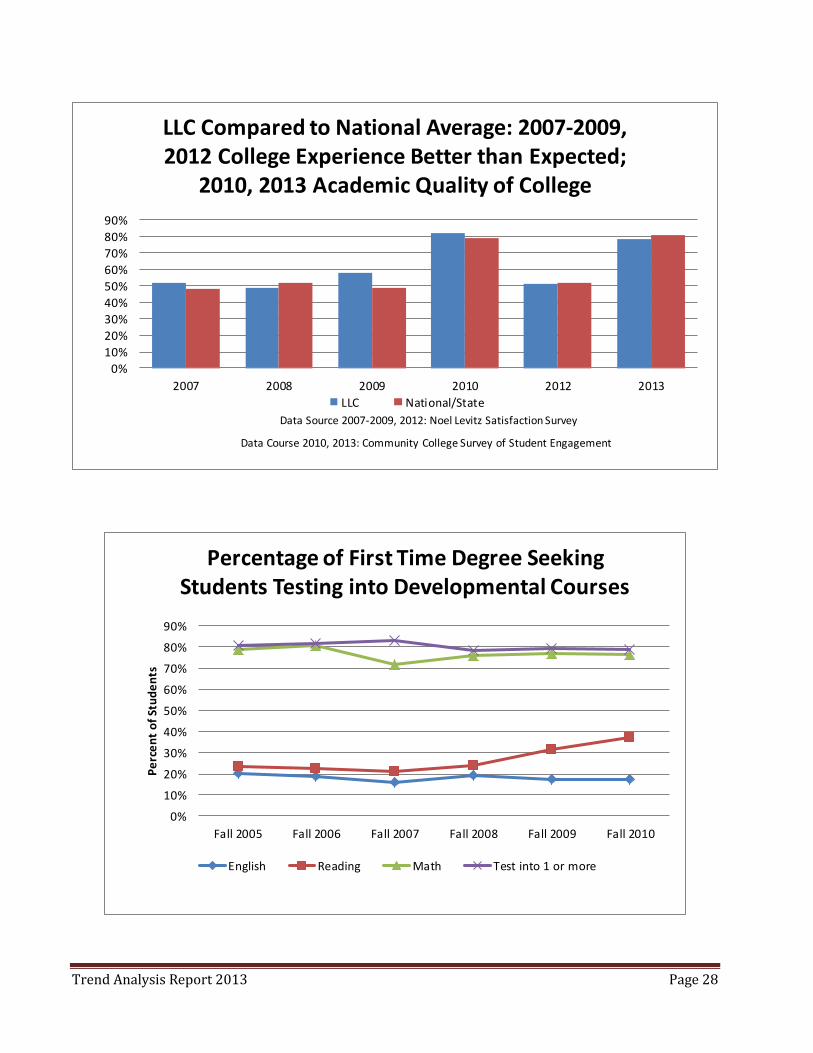
Figure 42: LLC Compared to National Average: 2007-2009, 2012 College Experience Better than Expected, 2010 Academic Quality of College
Data Source 2007-2009, 2012: Noel Levitz Satisfaction Survey
Data Course 2010, 2013: Community College Survey of Student Engagement
Trend Analysis Report 2013 Page 28
0%
10%
20%
30%
40%
50%
60%
70%
80%
90%
2007 2008 2009 2010 2012 2013
LLC Compared to National Average: 2007-2009, 2012 College Experience Better than Expected;
2010, 2013 Academic Quality of College
LLC National/State
Data Source 2007-2009, 2012: Noel Levitz Satisfaction Survey
Data Course 2010, 2013: Community College Survey of Student Engagement
Figure 43: Percentage of First Time Degree Seeking Students Testing into Developmental Courses
0%
10%
20%
30%
40%
50%
60%
70%
80%
90%
Fall 2005 Fall 2006 Fall 2007 Fall 2008 Fall 2009 Fall 2010
Pe
rce
nt
of
Stu
de
nts
Percentage of First Time Degree Seeking Students Testing into Developmental Courses
English Reading Math Test into 1 or more
Trend Analysis Report 2013 Page 29
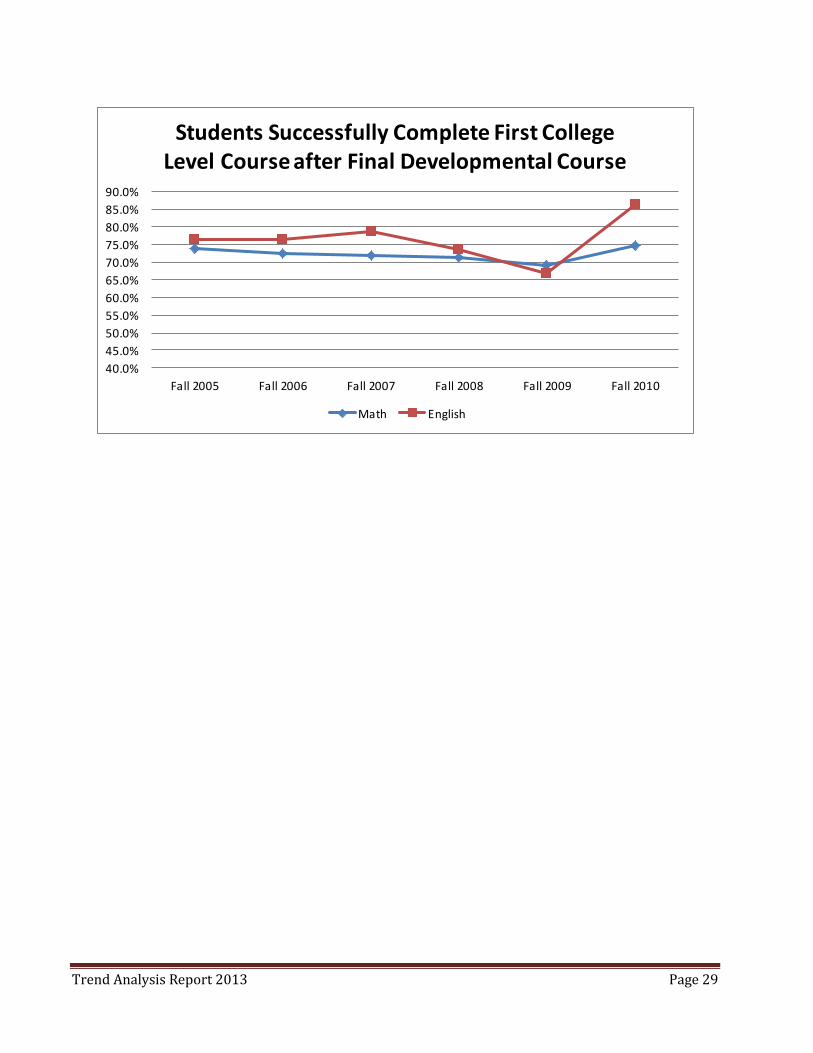
Figure 44: Students Successfully Complete First College Level Course after Final Developmental Course
40.0%
45.0%
50.0%
55.0%
60.0%
65.0%
70.0%
75.0%
80.0%
85.0%
90.0%
Fall 2005 Fall 2006 Fall 2007 Fall 2008 Fall 2009 Fall 2010
Students Successfully Complete First College Level Course after Final Developmental Course
Math English
Trend Analysis Report 2013 Page 30
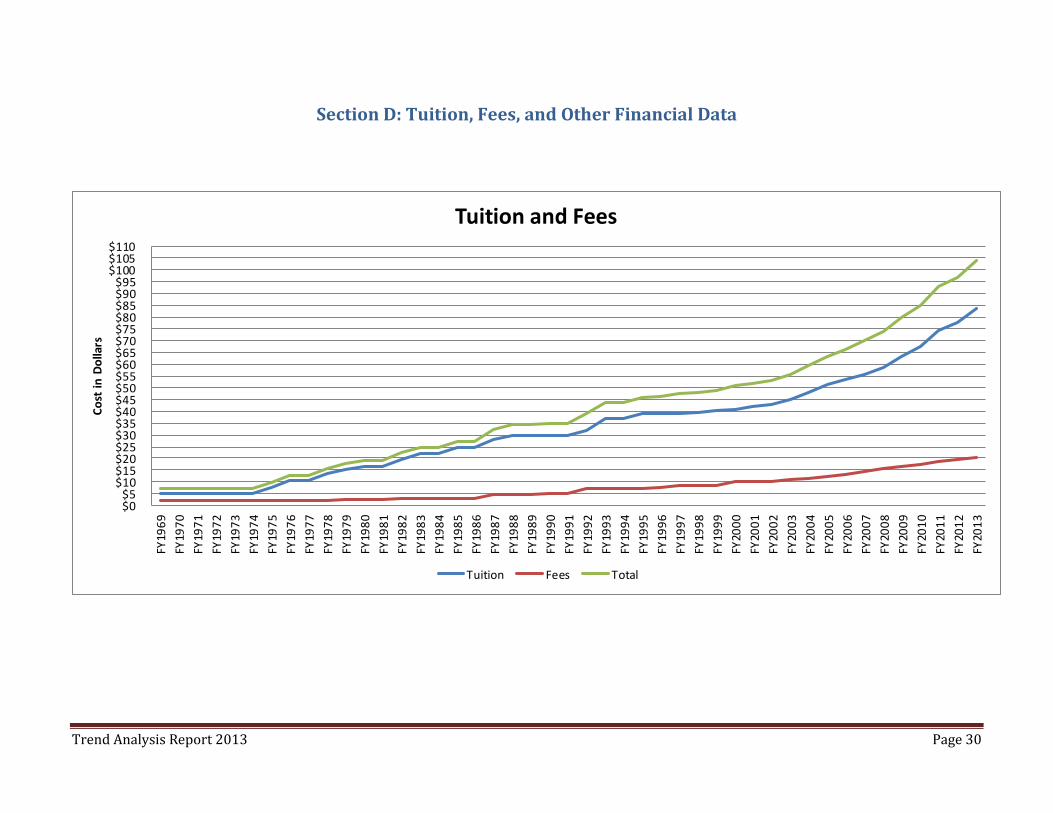
Section D: Tuition, Fees, and Other Financial Data
Figure 45: Tuition and Fees
$0$5
$10$15$20$25$30$35$40$45$50$55$60$65$70$75$80$85$90$95
$100$105$110
FY19
69
FY19
70
FY19
71
FY19
72
FY19
73
FY19
74
FY19
75
FY19
76
FY19
77
FY19
78
FY19
79
FY19
80
FY19
81
FY19
82
FY19
83
FY19
84
FY19
85
FY19
86
FY19
87
FY19
88
FY19
89
FY19
90
FY19
91
FY19
92
FY19
93
FY19
94
FY19
95
FY19
96
FY19
97
FY19
98
FY19
99
FY20
00
FY20
01
FY20
02
FY20
03
FY20
04
FY20
05
FY20
06
FY20
07
FY20
08
FY20
09
FY20
10
FY20
11
FY20
12
FY20
13
Co
st in
Do
llars
Tuition and Fees
Tuition Fees Total
Trend Analysis Report 2013 Page 31
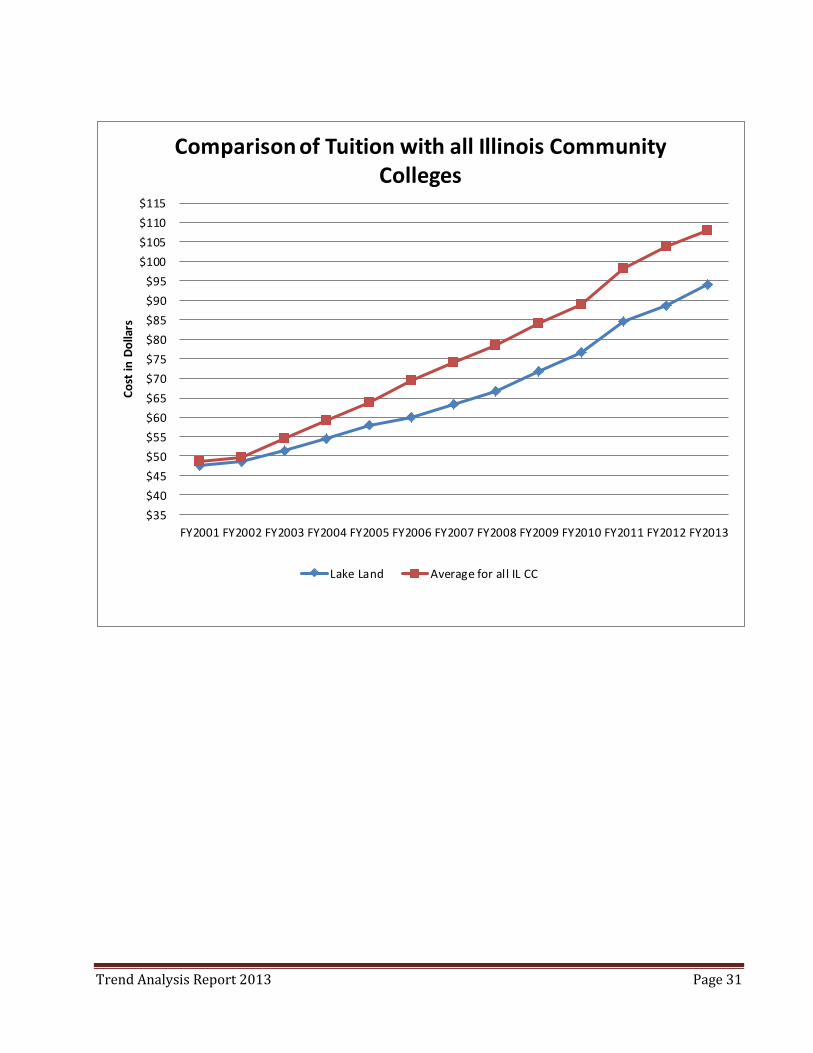
Figure 46: Comparison of Tuition with all Illinois Community Colleges
$35
$40
$45
$50
$55
$60
$65
$70
$75
$80
$85
$90
$95
$100
$105
$110
$115
FY2001 FY2002 FY2003 FY2004 FY2005 FY2006 FY2007 FY2008 FY2009 FY2010 FY2011 FY2012 FY2013
Co
st in
Do
llars
Comparison of Tuition with all Illinois Community Colleges
Lake Land Average for all IL CC
Trend Analysis Report 2013 Page 32
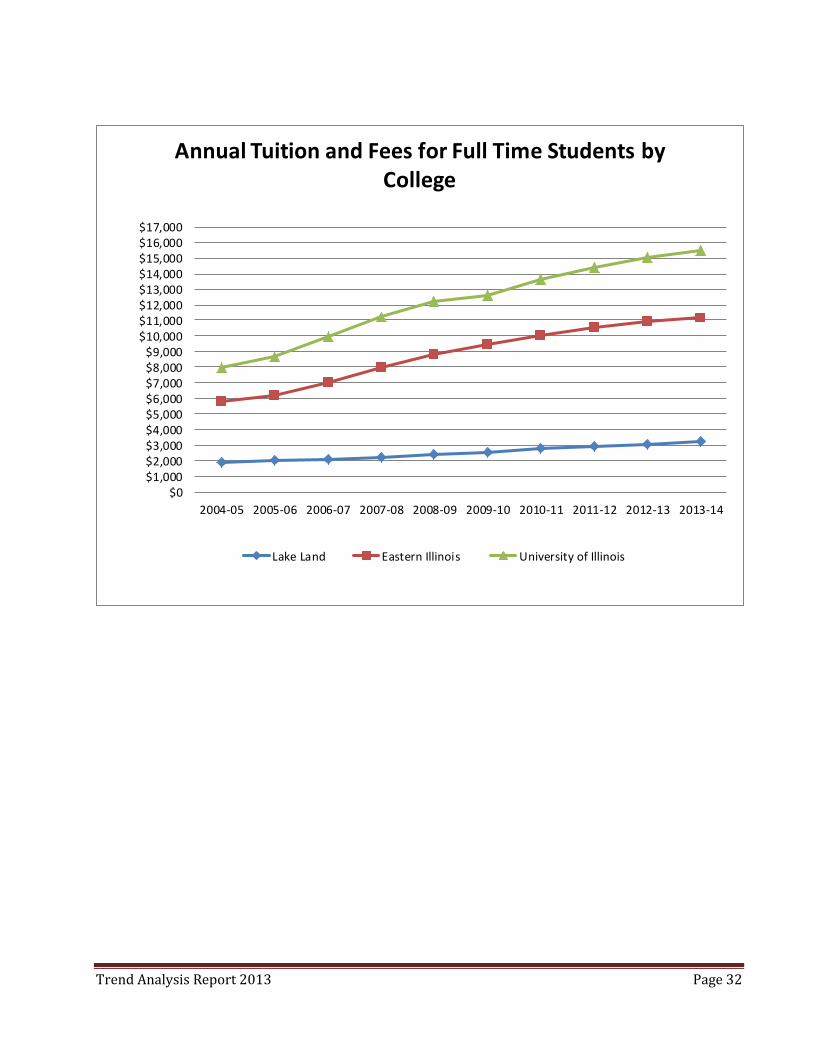
Figure 47: Annual Tuition and Fees for Full Time Students by College
$0$1,000$2,000$3,000$4,000$5,000$6,000$7,000$8,000$9,000
$10,000$11,000$12,000$13,000$14,000$15,000$16,000$17,000
2004-05 2005-06 2006-07 2007-08 2008-09 2009-10 2010-11 2011-12 2012-13 2013-14
Annual Tuition and Fees for Full Time Students by College
Lake Land Eastern Illinois University of Illinois
Trend Analysis Report 2013 Page 33
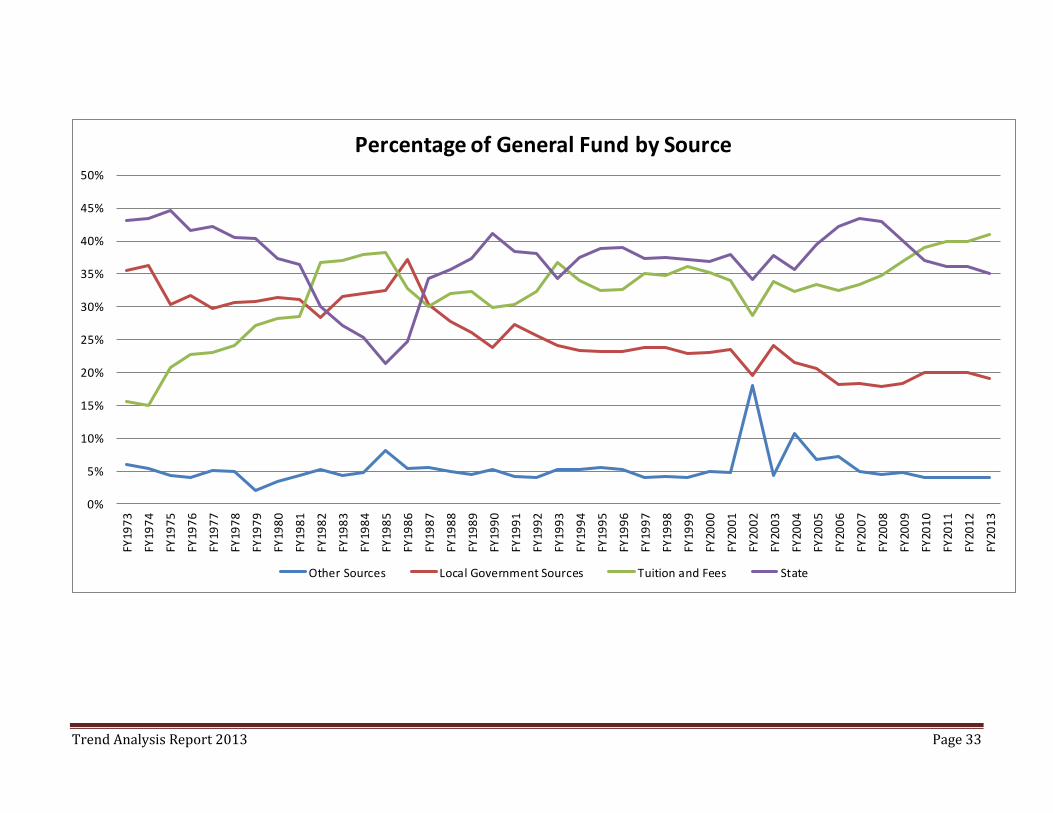
Figure 48: Percentage of General Fund by Source
0%
5%
10%
15%
20%
25%
30%
35%
40%
45%
50%
FY19
73
FY19
74
FY19
75
FY19
76
FY19
77
FY19
78
FY19
79
FY19
80
FY19
81
FY19
82
FY19
83
FY19
84
FY19
85
FY19
86
FY19
87
FY19
88
FY19
89
FY19
90
FY19
91
FY19
92
FY19
93
FY19
94
FY19
95
FY19
96
FY19
97
FY19
98
FY19
99
FY20
00
FY20
01
FY20
02
FY20
03
FY20
04
FY20
05
FY20
06
FY20
07
FY20
08
FY20
09
FY20
10
FY20
11
FY20
12
FY20
13
Percentage of General Fund by Source
Other Sources Local Government Sources Tuition and Fees State
Trend Analysis Report 2013 Page 34
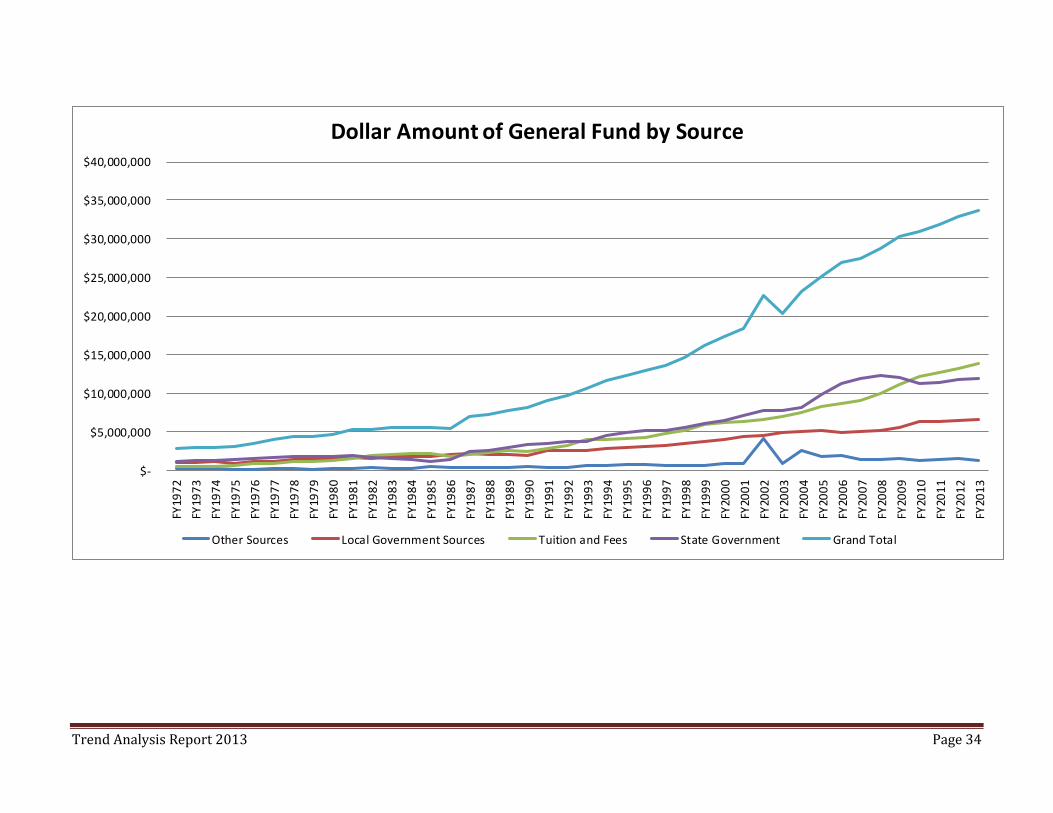
Figure 49: Dollar Amount of General Fund by Source
$-
$5,000,000
$10,000,000
$15,000,000
$20,000,000
$25,000,000
$30,000,000
$35,000,000
$40,000,000FY
197
2
FY19
73
FY19
74
FY19
75
FY19
76
FY19
77
FY19
78
FY19
79
FY19
80
FY19
81
FY19
82
FY19
83
FY19
84
FY19
85
FY19
86
FY19
87
FY19
88
FY19
89
FY19
90
FY19
91
FY19
92
FY19
93
FY19
94
FY19
95
FY19
96
FY19
97
FY19
98
FY19
99
FY20
00
FY20
01
FY20
02
FY20
03
FY20
04
FY20
05
FY20
06
FY20
07
FY20
08
FY20
09
FY20
10
FY20
11
FY20
12
FY20
13
Dollar Amount of General Fund by Source
Other Sources Local Government Sources Tuition and Fees State Government Grand Total
Trend Analysis Report 2013 Page 35
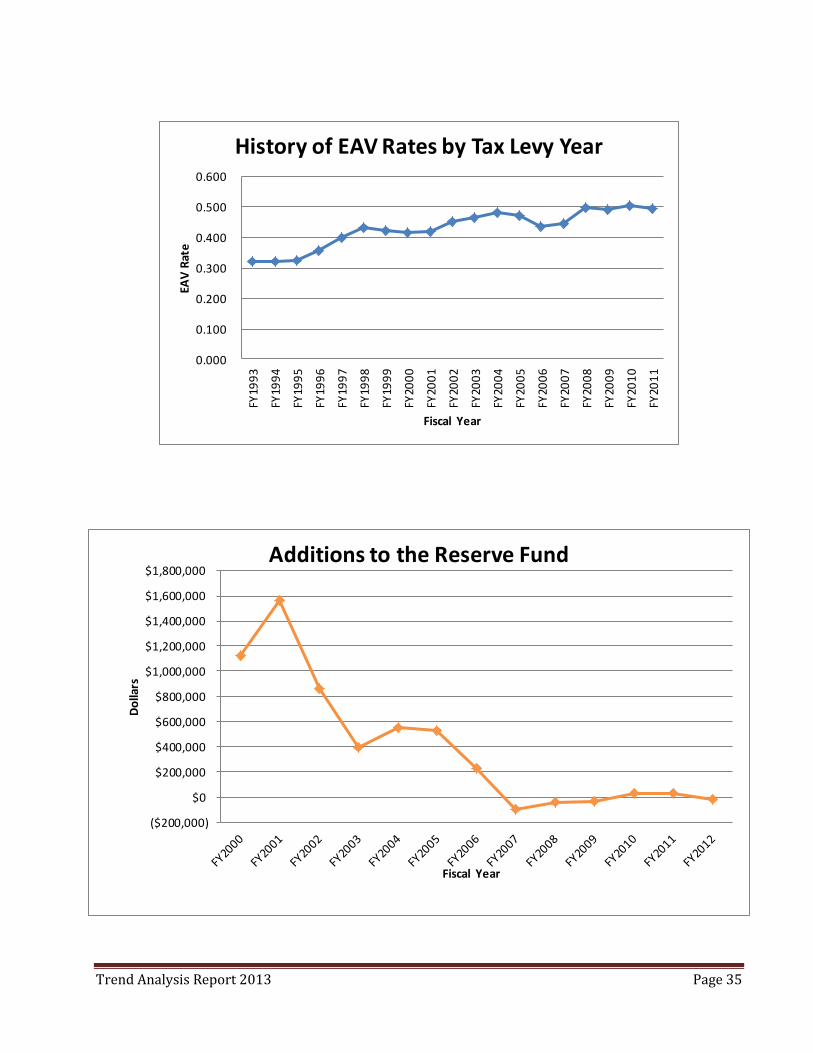
Figure 50: History of EAV Rates by Tax Levy Year
0.000
0.100
0.200
0.300
0.400
0.500
0.600
FY19
93
FY19
94
FY19
95
FY19
96
FY19
97
FY19
98
FY19
99
FY20
00
FY20
01
FY20
02
FY20
03
FY20
04
FY20
05
FY20
06
FY20
07
FY20
08
FY20
09
FY20
10
FY20
11
EAV
Rat
e
Fiscal Year
History of EAV Rates by Tax Levy Year
Figure 51: Additions to the Reserve Fund
($200,000)
$0
$200,000
$400,000
$600,000
$800,000
$1,000,000
$1,200,000
$1,400,000
$1,600,000
$1,800,000
Do
llars
Fiscal Year
Additions to the Reserve Fund


![DeRev - Crowdfunding World 2013: Report, analysis and trend [Italian version]](https://img.pdfslide.net/doc/110x75/5557bb6dd8b42af2178b4604/derev-crowdfunding-world-2013-report-analysis-and-trend-italian-version.jpg)