Embed Size (px)
Citation preview
T R E N D S I N H I G H E R E D U C A T I O N S E R I E S
Trends in College Pricing2009
T R E N D S I N H I G H E R E D U C A T I O N S E R I E S
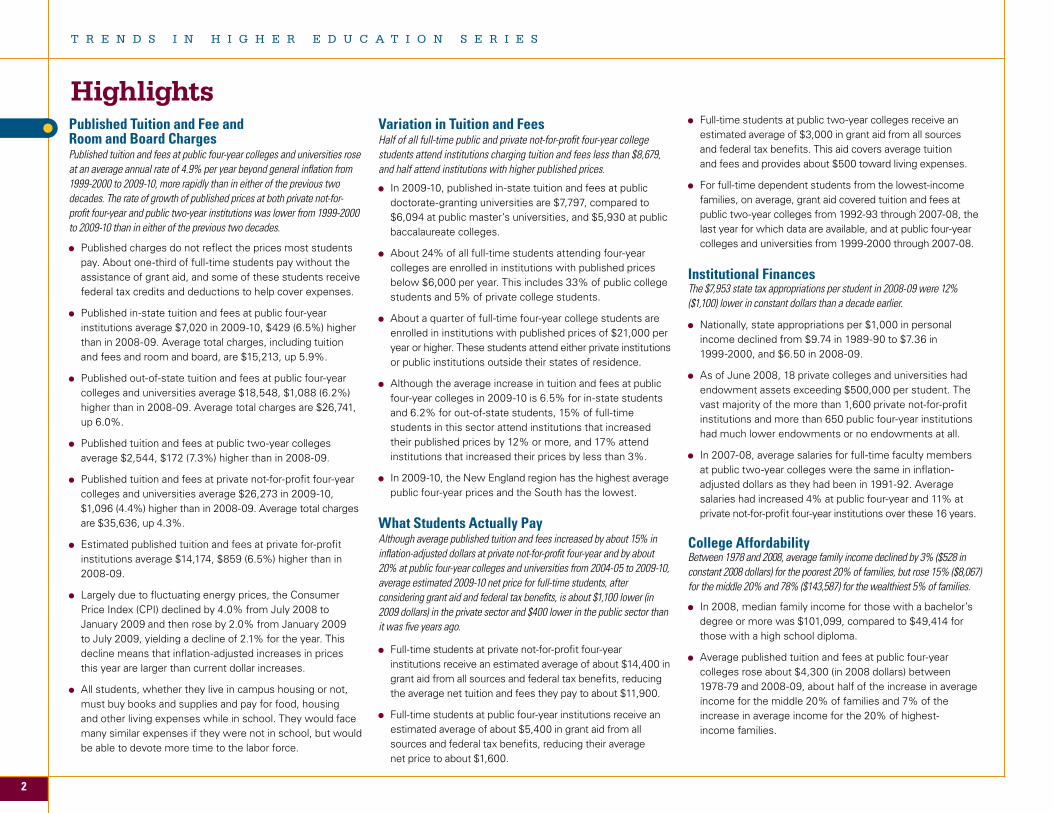
Published Tuition and Fee and Room and Board ChargesPublished tuition and fees at public four-year colleges and universities rose at an average annual rate of 4.9% per year beyond general inflation from 1999-2000 to 2009-10, more rapidly than in either of the previous two decades. The rate of growth of published prices at both private not-for-profit four-year and public two-year institutions was lower from 1999-2000 to 2009-10 than in either of the previous two decades.
Published charges do not reflect the prices most students pay. About one-third of full-time students pay without the assistance of grant aid, and some of these students receive federal tax credits and deductions to help cover expenses.
Published in-state tuition and fees at public four-year institutions average $7,020 in 2009-10, $429 (6.5%) higher than in 2008-09. Average total charges, including tuition and fees and room and board, are $15,213, up 5.9%.
Published out-of-state tuition and fees at public four-year colleges and universities average $18,548, $1,088 (6.2%) higher than in 2008-09. Average total charges are $26,741, up 6.0%.
Published tuition and fees at public two-year colleges average $2,544, $172 (7.3%) higher than in 2008-09.
Published tuition and fees at private not-for-profit four-year colleges and universities average $26,273 in 2009-10, $1,096 (4.4%) higher than in 2008-09. Average total charges are $35,636, up 4.3%.
Estimated published tuition and fees at private for-profit institutions average $14,174, $859 (6.5%) higher than in 2008-09.
Largely due to fluctuating energy prices, the Consumer Price Index (CPI) declined by 4.0% from July 2008 to January 2009 and then rose by 2.0% from January 2009 to July 2009, yielding a decline of 2.1% for the year. This decline means that inflation-adjusted increases in prices this year are larger than current dollar increases.
All students, whether they live in campus housing or not, must buy books and supplies and pay for food, housing and other living expenses while in school. They would face many similar expenses if they were not in school, but would be able to devote more time to the labor force.
Variation in Tuition and FeesHalf of all full-time public and private not-for-profit four-year college students attend institutions charging tuition and fees less than $8,679, and half attend institutions with higher published prices.
In 2009-10, published in-state tuition and fees at public doctorate-granting universities are $7,797, compared to $6,094 at public master’s universities, and $5,930 at public baccalaureate colleges.
About 24% of all full-time students attending four-year colleges are enrolled in institutions with published prices below $6,000 per year. This includes 33% of public college students and 5% of private college students.
About a quarter of full-time four-year college students are enrolled in institutions with published prices of $21,000 per year or higher. These students attend either private institutions or public institutions outside their states of residence.
Although the average increase in tuition and fees at public four-year colleges in 2009-10 is 6.5% for in-state students and 6.2% for out-of-state students, 15% of full-time students in this sector attend institutions that increased their published prices by 12% or more, and 17% attend institutions that increased their prices by less than 3%.
In 2009-10, the New England region has the highest average public four-year prices and the South has the lowest.
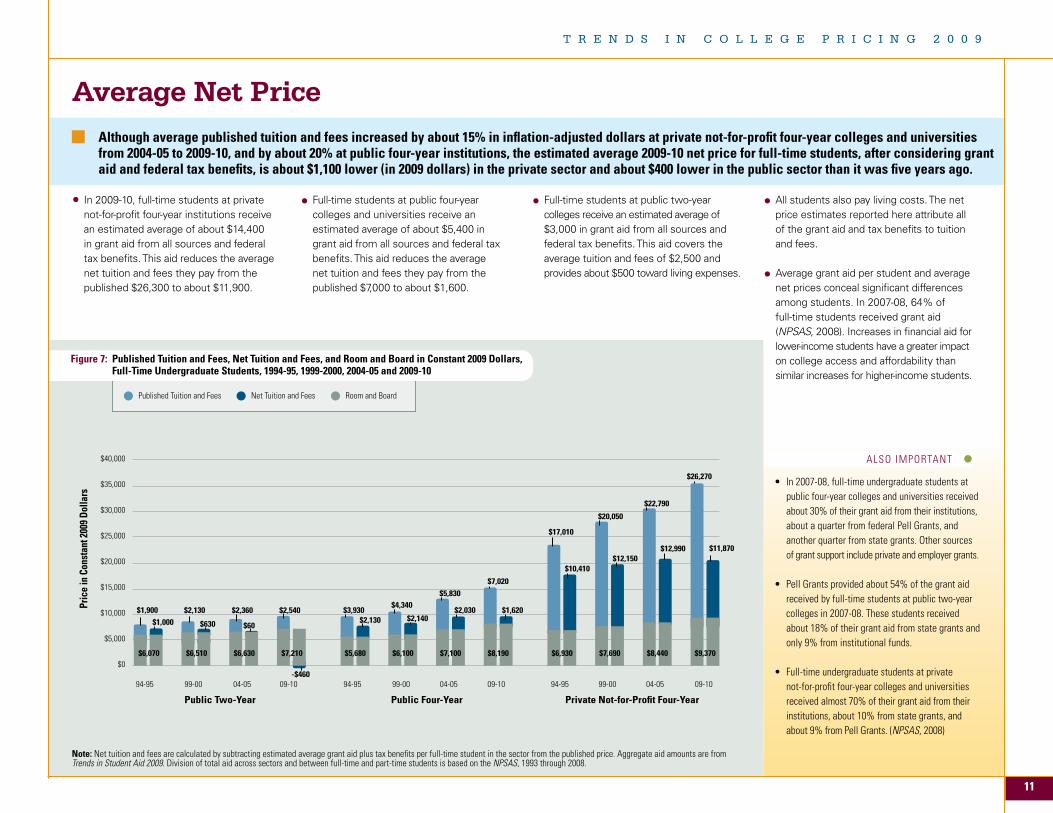
What Students Actually PayAlthough average published tuition and fees increased by about 15% in inflation-adjusted dollars at private not-for-profit four-year and by about 20% at public four-year colleges and universities from 2004-05 to 2009-10, average estimated 2009-10 net price for full-time students, after considering grant aid and federal tax benefits, is about $1,100 lower (in 2009 dollars) in the private sector and $400 lower in the public sector than it was five years ago.
Full-time students at private not-for-profit four-year institutions receive an estimated average of about $14,400 in grant aid from all sources and federal tax benefits, reducing the average net tuition and fees they pay to about $11,900.
Full-time students at public four-year institutions receive an estimated average of about $5,400 in grant aid from all sources and federal tax benefits, reducing their average net price to about $1,600.
Full-time students at public two-year colleges receive an estimated average of $3,000 in grant aid from all sources and federal tax benefits. This aid covers average tuition and fees and provides about $500 toward living expenses.
For full-time dependent students from the lowest-income families, on average, grant aid covered tuition and fees at public two-year colleges from 1992-93 through 2007-08, the last year for which data are available, and at public four-year colleges and universities from 1999-2000 through 2007-08.
Institutional FinancesThe $7,953 state tax appropriations per student in 2008-09 were 12% ($1,100) lower in constant dollars than a decade earlier.
Nationally, state appropriations per $1,000 in personal income declined from $9.74 in 1989-90 to $7.36 in 1999-2000, and $6.50 in 2008-09.
As of June 2008, 18 private colleges and universities had endowment assets exceeding $500,000 per student. The vast majority of the more than 1,600 private not-for-profit institutions and more than 650 public four-year institutions had much lower endowments or no endowments at all.
In 2007-08, average salaries for full-time faculty members at public two-year colleges were the same in inflation-adjusted dollars as they had been in 1991-92. Average salaries had increased 4% at public four-year and 11% at private not-for-profit four-year institutions over these 16 years.
College AffordabilityBetween 1978 and 2008, average family income declined by 3% ($528 in constant 2008 dollars) for the poorest 20% of families, but rose 15% ($8,067) for the middle 20% and 78% ($143,587) for the wealthiest 5% of families.
In 2008, median family income for those with a bachelor’s degree or more was $101,099, compared to $49,414 for those with a high school diploma.
Average published tuition and fees at public four-year colleges rose about $4,300 (in 2008 dollars) between 1978-79 and 2008-09, about half of the increase in average income for the middle 20% of families and 7% of the increase in average income for the 20% of highest- income families.
Highlights
2
$0
$5,000
$10,000
$15,000
$20,000
$25,000
$30,000
$35,000
$40,000
Und
ergr
adua
te B
udge
t
PublicTwo-YearCommuter
PublicFour-YearIn-State
On-Campus
PublicFour-Year
Out-of-StateOn-Campus
PrivateNot-for-Profit
Four-YearOn-Campus
$2,544
$7,202
$1,996
$1,445$1,098
$14,285
$7,020
$8,193
$1,974
$1,079$1,122
$19,388
$18,548
$8,193
$1,974
$1,079$1,122
$30,916
$26,273
$9,363
$1,427$849
$1,116
$39,028
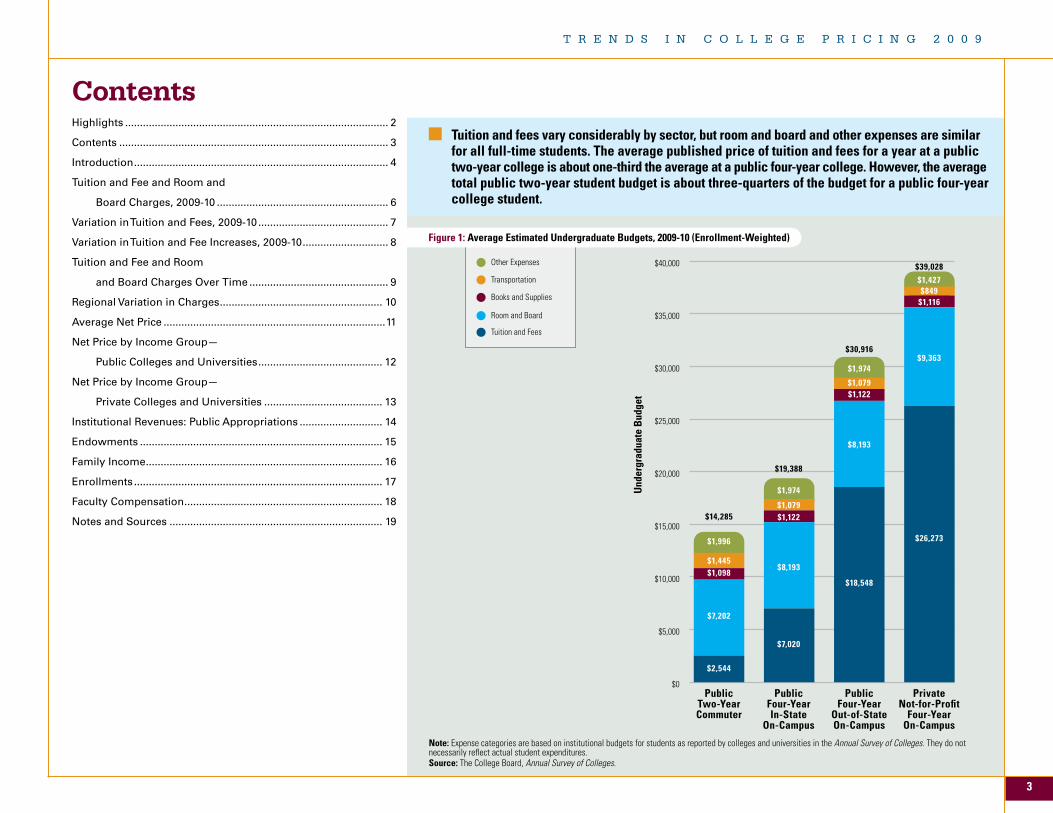
ContentsTuition and fees vary considerably by sector, but room and board and other expenses are similar for all full-time students. The average published price of tuition and fees for a year at a public two-year college is about one-third the average at a public four-year college. However, the average total public two-year student budget is about three-quarters of the budget for a public four-year college student.
Note: Expense categories are based on institutional budgets for students as reported by colleges and universities in the Annual Survey of Colleges. They do not necessarily reflect actual student expenditures.Source: The College Board, Annual Survey of Colleges.
Figure 1: Average Estimated Undergraduate Budgets, 2009-10 (Enrollment-Weighted)
Other Expenses
Transportation
Books and Supplies
Room and Board
Tuition and Fees
Highlights ......................................................................................... 2
Contents ........................................................................................... 3
Introduction ...................................................................................... 4
Tuition and Fee and Room and
Board Charges, 2009-10 .......................................................... 6
Variation in Tuition and Fees, 2009-10 ............................................ 7
Variation in Tuition and Fee Increases, 2009-10 ............................. 8
Tuition and Fee and Room
and Board Charges Over Time ............................................... 9
Regional Variation in Charges ....................................................... 10
Average Net Price ...........................................................................11
Net Price by Income Group—
Public Colleges and Universities .......................................... 12
Net Price by Income Group—
Private Colleges and Universities ........................................ 13
Institutional Revenues: Public Appropriations ............................ 14
Endowments .................................................................................. 15
Family Income ................................................................................ 16
Enrollments .................................................................................... 17
Faculty Compensation ................................................................... 18
Notes and Sources ........................................................................ 19
3
T R E N D S I N C O L L E G E P R I C I N G 2 0 0 9
Current economic circumstances have made the issue of rising college prices particularly salient. As Trends in College Pricing 2009 goes to press, family income has been stagnant or has declined at all levels of the income distribution over the past decade and the unemployment rate is approaching 10%. Yet the unemployment rate for individuals with a bachelor’s degree or higher is about half the rate for high school graduates (and the rate for those with some college falls between these two) (Bureau of Labor Statistics, 2009). Median income for families with a householder with at least a four-year college degree is more than $50,000 per year higher (and for those with an associate degree it is $20,000 higher) than for those with only a high school education. A college education is critical to long-term financial security, but feels out of reach to many students and families in today’s economy.
Trends in College Pricing provides extensive data describing the variety of college prices in the United States and tracking those prices over time. It focuses both on published prices and the lower net prices, taking grant aid into consideration, that better represent what students actually pay. It also includes information about college and university finances that can provide some insight into pricing patterns and trends, as well as some of the information on family incomes required to assess affordability. It does not attempt to provide a comprehensive explanation of price trends.
A thorough understanding of the forces affecting pricing would require better data than those available on the expenditure patterns of colleges and universities over time, as well as careful empirical analysis of all of the contributing forces. It is clear that the efficiency of campus operations, the level of governmental and philanthropic support, the prices of the goods and services educational institutions purchase, the nature and extent of the services and facilities provided, the academic preparation of the students who enroll, the level of demand for particular institutions, and competition among institutions all contribute to the rate of price increase.
If a college education is to become more affordable for more students, institutions will have to find ways to offer high-quality higher education in a more cost-effective manner, and state and federal governments will have to improve their systems for supporting both postsecondary institutions and the students they educate. The data provided in Trends and
the accompanying commentary can inform policymakers, researchers, student advocates and others in their analyses of these issues.
Every year since 1998, the College Board has published a new edition of Trends in College Pricing, providing detailed, up-to-date information on prices for tuition and fees and room and board at colleges and universities in the United States, as well as other expenses postsecondary students incur. In 2008, we introduced a new website that makes data easily available for reference and downloading. All of the graphs and the selected tables included in the print version can also be found online, along with substantial additional information. Go to www.collegeboard.com/trends to access data from both Trends in College Pricing and its companion publication, Trends in Student Aid.
The companion publication, Trends in Student Aid, provides detailed, up-to-date information on the sources, forms and amounts of financial aid available to assist students and families paying for postsecondary education. Although Trends in College Pricing 2009 provides data for the 2009-10 academic year, the latest data available for Trends in Student Aid 2009 are for the 2008-09 academic year.
Published Prices and Net PricesAlthough it is generally the published prices that make headlines, it is the net prices paid by individual students that matter most for college access and affordability.
The College Board began publishing Trends in Student Aid in 1983, and Trends in College Pricing has been reporting evidence on net prices since 2003. The published prices on which the analysis in Trends in College Pricing is based come from data reported by institutions on the College Board’s Annual Survey of Colleges. This survey is distributed to about 3,500 postsecondary institutions across the country, collecting a wealth of data on enrollment, admissions, degrees and majors, tuition, financial aid and other aspects of undergraduate education.
The definition of net price on which we rely is the average price paid by all full-time students — including those who do and do not receive student aid — after subtracting grant aid from all sources in addition to federal tax credits and
deductions. Data on prices from the Annual Survey of Colleges and on student aid from Trends in Student Aid allow us to generate new, updated estimates for average net prices by sector each year. Data from the National Postsecondary Student Aid Study (NPSAS), released about every four years, allow us to estimate net prices for students at different income levels. This year we include both analyses of net college prices.
The prices reported here are averages for one year of full-time enrollment. About 37% of all undergraduates and about 61% of those attending public two-year colleges are enrolled part-time. Because of the variety of enrollment and pricing patterns, it is not possible to provide estimates of the charges facing these students that would be as accurate as the information we provide about full-time students. Data on full-time charges provide the best basis for comparison both over time and across sectors.
The prices included in Trends represent best estimates of average prices for all full-time undergraduate students. However, a growing number of institutions charge different prices for different years and/or for different programs of study. We are able to incorporate differences in prices by year of study reported to us by individual institutions, but not differences by programs. Another complexity that has developed in recent years is in the division of institutions into the public two-year and public four-year sectors. More and more two-year colleges are offering a small number of four-year degrees or providing course work that leads to four-year degrees awarded on other campuses. While we make every effort to adjust our methodology to accommodate these changes, it is impossible to draw precise lines and to develop exact measures in all cases.
Trends in College Pricing 2009 presents detailed data on public two-year and four-year and private not-for-profit four-year institutions for the 2009-10 academic year. Comparable information about the growing for-profit sector of postsecondary education, which enrolls about 10% of all full-time undergraduate students, is not available. We do provide an estimate of the average charges at for-profit institutions, but because of the relatively small sample of those institutions from which we are able to collect data, it is important to interpret that information with extreme caution.
Introduction
4
T R E N D S I N H I G H E R E D U C A T I O N S E R I E S
For detailed background data and additional information, please visit www.collegeboard.com/trends.
Finally, in interpreting college prices, it is important to remember that Trends in College Pricing reports on the price of one year of college. Many students require more than two years of study to earn an associate degree or more than four years of study to earn a bachelor’s degree. It is critical to consider the total price for all years of study when thinking about what is required to pay for college. There is considerable variation across sectors as well as among institutions within sectors in both average time to degree and overall graduation rates.
How College Prices Are ChangingThe data in this report confirm the widespread perception that published college prices are rising more rapidly than the prices of other goods and services. This is not a new phenomenon, but one that has persisted over the entire 30-year period documented here. Annual percentage increases in tuition and fees consistently receive most of the attention, but a number of other aspects of college pricing affect access and affordability more.
Average net tuition and fees have declined consistently since the late 1990s at public two-year colleges, although increases in living costs have prevented those decreases in net tuition and fees from being reflected in total net costs of attendance. Average net tuition and fees at both public and private not-for-profit four-year colleges and universities declined from 2004-05 to 2008-09, but increased by about 2% in constant dollars in 2009-10.
Changes in average published prices or in average net prices do not necessarily describe the circumstances facing individual students. There is considerable variation in prices across sectors and across states and regions as well as among institutions within these categories. College students in the United States have a wide variety of educational institutions from which to choose, and these come with many different price tags. Moreover, different students pay different prices at the same institution. One of the problems many students face is how to make sense of all the options and complex pricing structures.
The scenario is even more complicated because of the wide variety of student aid programs and policies and because of changes over time in the distribution of student aid among students. A decline in the average net price at public four-year colleges in a particular state or at an individual private
institution should make education more affordable. But if at the same time grant aid migrates from low- and moderate-income students to wealthier student-athletes or merit scholars who have less financial need, more students will actually struggle to pay for college.
In considering the impact of price increases, it is accumulated patterns, not one-year changes, that determine current charges. Relatively low prices may rise rapidly in percentage terms without causing significant difficulties, while even freezing high prices does not put them within reach of the typical student. Current prices and dollar increases, not percentage increases, best measure the impact on students and families.
Tuition and Fees Versus Total ChargesSome of the graphs in this report focus only on tuition and fee charges, but we also report room and board charges for residential students, living costs for commuter students, and other components of student budgets. Because tuition and fees are relevant for all enrolled students, they are easiest to compare. However, whether students live on or off campus, they must also pay for housing and food, buy books and supplies, and cover transportation and other basic living costs.
While some students are able to live with family, and not all living costs are attributable to attending school, the cost of living poses a significant hurdle to many students. Even those who receive grant aid sufficient to cover tuition and fee charges may struggle to cover living expenses. It is not so much the prices charged by institutions that create the burden for these students, but the very real costs students incur to support themselves and their families while they are in school. For many students, the largest component of the cost of being a student is actually the result of devoting time to schooling rather than to the labor market. Forgone earnings are not addressed in this report.
The Consumer Price IndexWe provide much of our data in constant dollars, adjusting values for changes in the Consumer Price Index (CPI). We use the change in the CPI from July 2008 to July 2009 to measure inflation between 2008-09 and 2009-10. While CPI adjustment is necessary to make meaningful comparisons of values over
long periods of time, comparisons of one-year changes in constant dollars may be confusing. Large fluctuations in energy prices have led to an unusually volatile CPI recently. The 5.6% increase in the CPI from July 2007 to July 2008 was the highest annual inflation rate since 1982. As a result, constant dollar increases for academic year 2008-09 were small relative to current dollar increases. However, in the most recent year, between July 2008 and July 2009, the CPI declined by 2.1%, which results in constant dollar increases for academic year 2009-10 that are larger than current dollar increases.
A Note on Trends Data While the information reported here provides a best approximation of trends in college charges over time, we would caution readers about placing too much reliance on either precise dollar amounts or precise annual percentage changes. Each year we revise the average prices calculated the previous year to account for corrected data we receive from institutions and to provide an enrollment-weighted average based on the most recent available data on the number of full-time students attending each institution. If, over time, increasing numbers of students were to choose to enroll in the lower-priced institutions within a sector, our measure of the average price increase would be lower than if enrollment patterns were stable. Details relating to our methodology and to other technical issues and data reliability can be found in the Notes and Sources section.
The tables supporting all of the graphs in the Trends publications, PDF versions of the publications, PowerPoint files containing individual slides for all of the graphs, and other detailed data on student aid and college pricing are available on our website at www.collegeboard.com/trends. Please feel free to cite or reproduce the data in Trends for noncommercial purposes with proper attribution.
T R E N D S I N C O L L E G E P R I C I N G 2 0 0 9
5
ALSO IMPORTANT
Tuition and Fees Room and Board Total Charges $ % $ % $ %Sector 2009-10 2008-09 Change Change 2009-10 2008-09 Change Change 2009-10 2008-09 Change Change
Public Two-Year $2,544 $2,372 $172 7.3% — — — — — — — —
Public Four-Year In-State $7,020 $6,591 $429 6.5% $8,193 $7,773 $420 5.4% $15,213 $14,364 $849 5.9%
Public Four-Year Out-of-State $18,548 $17,460 $1,088 6.2% $8,193 $7,773 $420 5.4% $26,741 $25,233 $1,508 6.0%
Private Not-for-Profit Four-Year $26,273 $25,177 $1,096 4.4% $9,363 $8,986 $377 4.2% $35,636 $34,163 $1,473 4.3%
For-Profit $14,174 $13,315 $859 6.5% — — — — — — — —
Public Doctorate-Granting In-State $7,797 $7,316 $481 6.6% $8,643 $8,185 $458 5.6% $16,440 $15,501 $939 6.1%
Public Master’s In-State $6,094 $5,713 $381 6.7% $7,459 $7,090 $369 5.2% $13,553 $12,803 $750 5.9%
Public Baccalaureate In-State $5,930 $5,593 $337 6.0% $7,705 $7,387 $318 4.3% $13,635 $12,980 $655 5.0%
Private Doctorate-Granting $32,349 $31,079 $1,270 4.1% $10,951 $10,524 $427 4.1% $43,300 $41,603 $1,697 4.1%
Private Master’s $23,700 $22,683 $1,017 4.5% $9,057 $8,702 $355 4.1% $32,757 $31,385 $1,372 4.4%
Private Baccalaureate $24,040 $23,027 $1,013 4.4% $8,488 $8,131 $357 4.4% $32,528 $31,158 $1,370 4.4%
Table 1a: Average Published Charges for Undergraduates by Type and Control of Institution, 2009-10 (Enrollment-Weighted)
Table 1b: Average Published Charges for Undergraduates by Carnegie Classification, 2009-10 (Enrollment-Weighted)
Tuition and Fee and Room and Board Charges, 2009-10
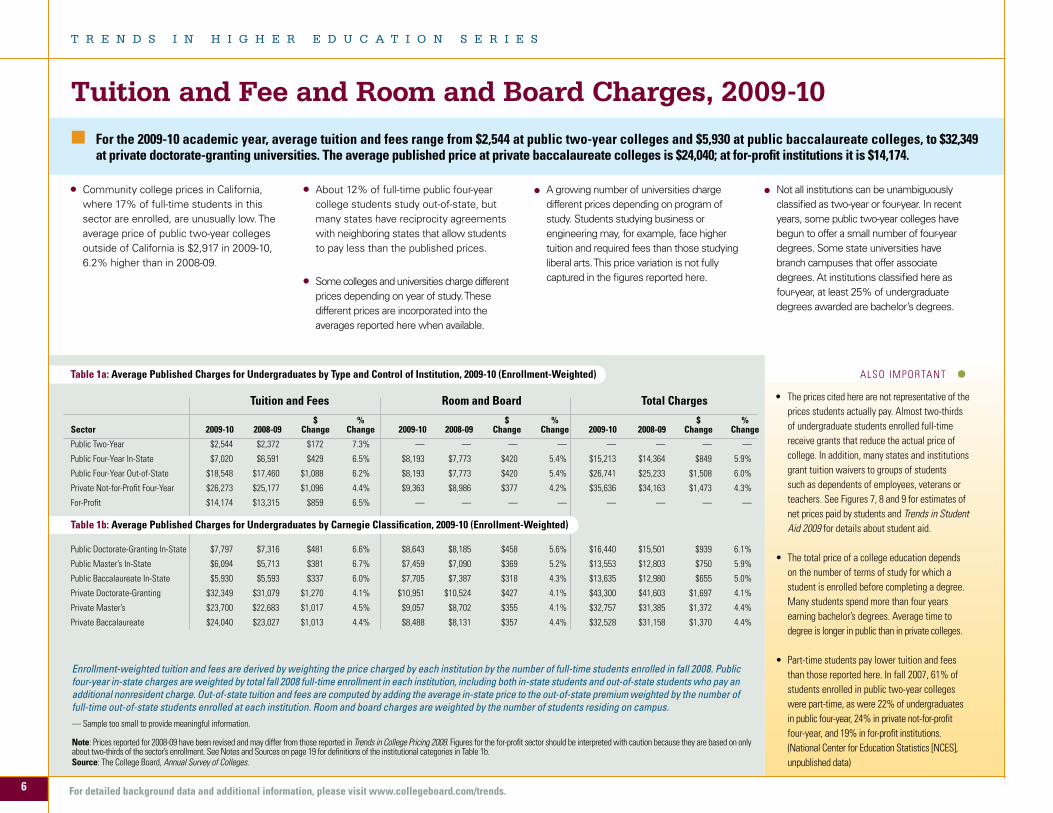
Enrollment-weighted tuition and fees are derived by weighting the price charged by each institution by the number of full-time students enrolled in fall 2008. Public four-year in-state charges are weighted by total fall 2008 full-time enrollment in each institution, including both in-state students and out-of-state students who pay an additional nonresident charge. Out-of-state tuition and fees are computed by adding the average in-state price to the out-of-state premium weighted by the number of full-time out-of-state students enrolled at each institution. Room and board charges are weighted by the number of students residing on campus. — Sample too small to provide meaningful information.
Note: Prices reported for 2008-09 have been revised and may differ from those reported in Trends in College Pricing 2008. Figures for the for-profit sector should be interpreted with caution because they are based on only about two-thirds of the sector’s enrollment. See Notes and Sources on page 19 for definitions of the institutional categories in Table 1b. Source: The College Board, Annual Survey of Colleges.
For the 2009-10 academic year, average tuition and fees range from $2,544 at public two-year colleges and $5,930 at public baccalaureate colleges, to $32,349 at private doctorate-granting universities. The average published price at private baccalaureate colleges is $24,040; at for-profit institutions it is $14,174.
Community college prices in California, where 17% of full-time students in this sector are enrolled, are unusually low. The average price of public two-year colleges outside of California is $2,917 in 2009-10, 6.2% higher than in 2008-09.
About 12% of full-time public four-year college students study out-of-state, but many states have reciprocity agreements with neighboring states that allow students to pay less than the published prices.
Some colleges and universities charge different prices depending on year of study. These different prices are incorporated into the averages reported here when available.
A growing number of universities charge different prices depending on program of study. Students studying business or engineering may, for example, face higher tuition and required fees than those studying liberal arts. This price variation is not fully captured in the figures reported here.
• The prices cited here are not representative of the prices students actually pay. Almost two-thirds of undergraduate students enrolled full-time receive grants that reduce the actual price of college. In addition, many states and institutions grant tuition waivers to groups of students such as dependents of employees, veterans or teachers. See Figures 7, 8 and 9 for estimates of net prices paid by students and Trends in Student Aid 2009 for details about student aid.
• Thetotalpriceofacollegeeducationdependson the number of terms of study for which a student is enrolled before completing a degree. Many students spend more than four years earning bachelor’s degrees. Average time to degree is longer in public than in private colleges.
• Part-timestudentspaylowertuitionandfeesthan those reported here. In fall 2007, 61% of students enrolled in public two-year colleges were part-time, as were 22% of undergraduates in public four-year, 24% in private not-for-profit four-year, and 19% in for-profit institutions. (National Center for Education Statistics [NCES], unpublished data)
Not all institutions can be unambiguously classified as two-year or four-year. In recent years, some public two-year colleges have begun to offer a small number of four-year degrees. Some state universities have branch campuses that offer associate degrees. At institutions classified here as four-year, at least 25% of undergraduate degrees awarded are bachelor’s degrees.
6
T R E N D S I N H I G H E R E D U C A T I O N S E R I E S
For detailed background data and additional information, please visit www.collegeboard.com/trends.
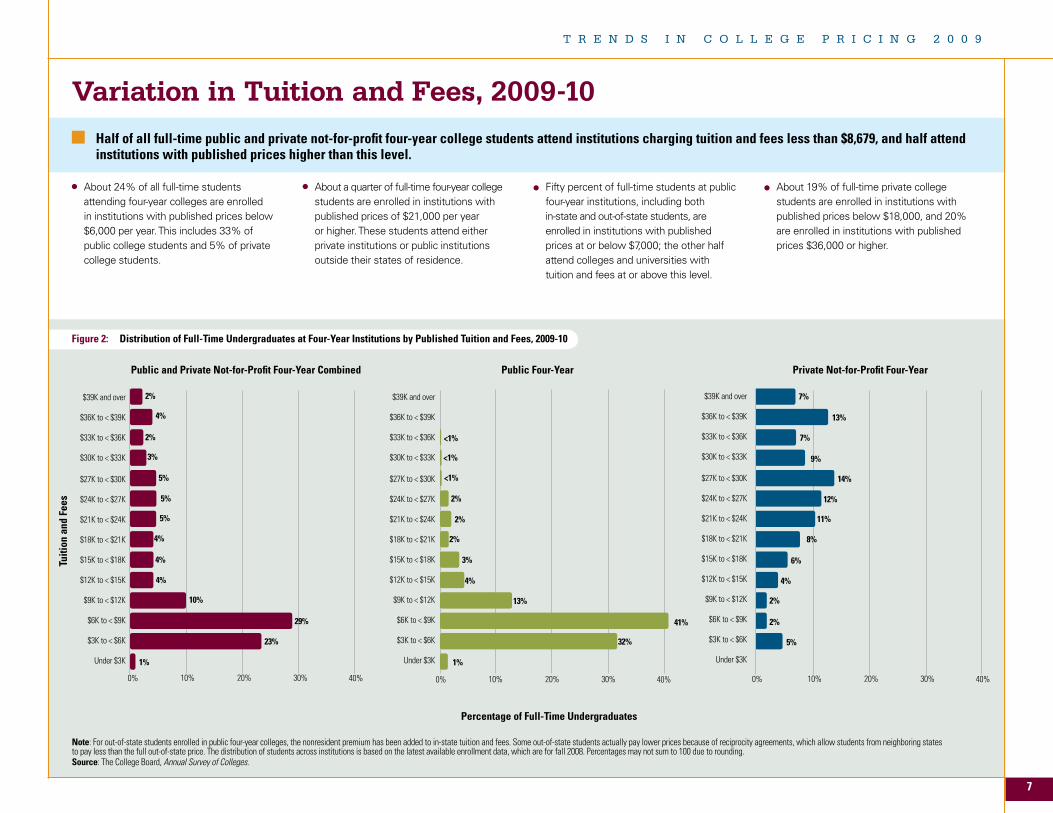
Variation in Tuition and Fees, 2009-10Half of all full-time public and private not-for-profit four-year college students attend institutions charging tuition and fees less than $8,679, and half attend institutions with published prices higher than this level.
Note: For out-of-state students enrolled in public four-year colleges, the nonresident premium has been added to in-state tuition and fees. Some out-of-state students actually pay lower prices because of reciprocity agreements, which allow students from neighboring states to pay less than the full out-of-state price. The distribution of students across institutions is based on the latest available enrollment data, which are for fall 2008. Percentages may not sum to 100 due to rounding. Source: The College Board, Annual Survey of Colleges.
About 24% of all full-time students attending four-year colleges are enrolled in institutions with published prices below $6,000 per year. This includes 33% of public college students and 5% of private college students.
About a quarter of full-time four-year college students are enrolled in institutions with published prices of $21,000 per year or higher. These students attend either private institutions or public institutions outside their states of residence.
Fifty percent of full-time students at public four-year institutions, including both in-state and out-of-state students, are enrolled in institutions with published prices at or below $7,000; the other half attend colleges and universities with tuition and fees at or above this level.
About 19% of full-time private college students are enrolled in institutions with published prices below $18,000, and 20% are enrolled in institutions with published prices $36,000 or higher.
Percentage of Full-Time Undergraduates
Tuiti
on a
nd F
ees
4%
4%
5%
5%
5%
3%
2%
4%
2%
Public Four-YearPublic and Private Not-for-Profit Four-Year Combined
1%
23%
29%
10%
4%
3%
2%
2%
2%
1%
32%
41%
13%
4%
6%
8%
11%
12%
14%
9%
7%
13%
7%
5%
2%
2%
4%
Private Not-for-Profit Four-Year
10% 20% 30% 40%0%
$39K and over
$36K to < $39K
$33K to < $36K
$30K to < $33K
$27K to < $30K
$24K to < $27K
$21K to < $24K
$18K to < $21K
$15K to < $18K
$12K to < $15K
$9K to < $12K
$6K to < $9K
$3K to < $6K
Under $3K
10% 20% 30% 40%0%
$39K and over
$36K to < $39K
$33K to < $36K
$30K to < $33K
$27K to < $30K
$24K to < $27K
$21K to < $24K
$18K to < $21K
$15K to < $18K
$12K to < $15K
$9K to < $12K
$6K to < $9K
$3K to < $6K
Under $3K
$39K and over
$36K to < $39K
$33K to < $36K
$30K to < $33K
$27K to < $30K
$24K to < $27K
$21K to < $24K
$18K to < $21K
$15K to < $18K
$12K to < $15K
$9K to < $12K
$6K to < $9K
$3K to < $6K
Under $3K
10% 20% 30% 40%0%
<1%
<1%
<1%
Figure 2: Distribution of Full-Time Undergraduates at Four-Year Institutions by Published Tuition and Fees, 2009-10
7
T R E N D S I N C O L L E G E P R I C I N G 2 0 0 9
ALSO IMPORTANT
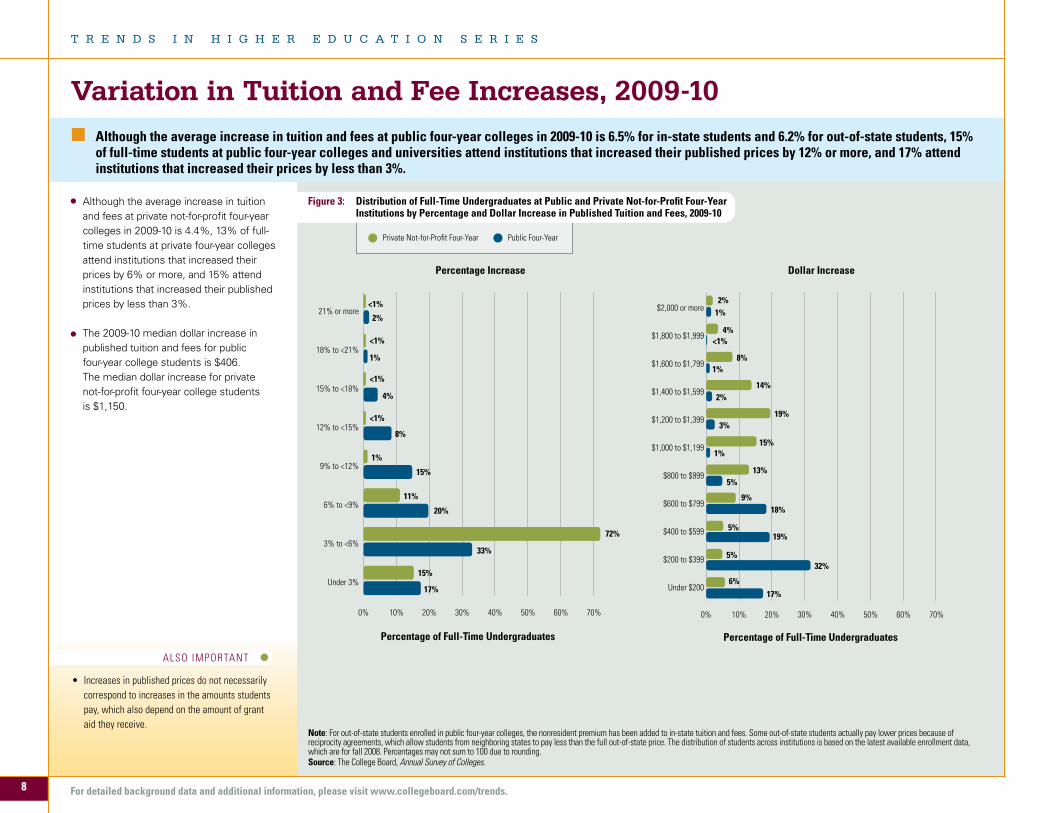
Variation in Tuition and Fee Increases, 2009-10Although the average increase in tuition and fees at public four-year colleges in 2009-10 is 6.5% for in-state students and 6.2% for out-of-state students, 15% of full-time students at public four-year colleges and universities attend institutions that increased their published prices by 12% or more, and 17% attend institutions that increased their prices by less than 3%.
Note: For out-of-state students enrolled in public four-year colleges, the nonresident premium has been added to in-state tuition and fees. Some out-of-state students actually pay lower prices because of reciprocity agreements, which allow students from neighboring states to pay less than the full out-of-state price. The distribution of students across institutions is based on the latest available enrollment data, which are for fall 2008. Percentages may not sum to 100 due to rounding. Source: The College Board, Annual Survey of Colleges.
Although the average increase in tuition and fees at private not-for-profit four-year colleges in 2009-10 is 4.4%, 13% of full-time students at private four-year colleges attend institutions that increased their prices by 6% or more, and 15% attend institutions that increased their published prices by less than 3%.
The 2009-10 median dollar increase in published tuition and fees for public four-year college students is $406. The median dollar increase for private not-for-profit four-year college students is $1,150.
• Increasesinpublishedpricesdonotnecessarilycorrespond to increases in the amounts students pay, which also depend on the amount of grant aid they receive.
21% or more
Percentage of Full-Time Undergraduates
<1%
0% 10% 20% 30% 40% 50% 60% 70%
18% to <21%
Under 3%
3% to <6%
6% to <9%
9% to <12%
12% to <15%
15% to <18%
2%
1%
4%
8%
1%
15%
11%
20%
72%
33%
15%
17%
$2,000 or more
Percentage of Full-Time Undergraduates
2%
0% 10% 20% 30% 40% 50% 60% 70%
$1,800 to $1,999
$600 to $799
$800 to $999
$1,000 to $1,199
$1,200 to $1,399
$1,400 to $1,599
$1,600 to $1,799
1%
4%
1%
14%2%
3%
15%1%
13%5%
Percentage Increase Dollar Increase
$400 to $599
$200 to $399
Under $200
5%
5%32%
6%17%
19%
18%9%
19%
8%
<1%
<1%
<1% <1%
Figure 3: Distribution of Full-Time Undergraduates at Public and Private Not-for-Profit Four-Year Institutions by Percentage and Dollar Increase in Published Tuition and Fees, 2009-10
Private Not-for-Profit Four-Year Public Four-Year
For detailed background data and additional information, please visit www.collegeboard.com/trends.8
T R E N D S I N H I G H E R E D U C A T I O N S E R I E S
ALSO IMPORTANT
• Inadditiontotuitionandfeesandroomandboard, students’ total cost of attendance includes allowances for books and supplies, transportation, and other expenses included in the student budgets reported in Figure 1.
• About40%offull-timedependentstudentsenrolled in public four-year institutions live on campus. Another 40% live in off-campus housing and about 20% live with their parents. Among dependent students at private not-for-profit four-year colleges, 70% live on campus, 17% live in off-campus housing, and 12% live with their parents. (NCES, NPSAS, 2008)
Tuition and Fee and Room and Board Charges Over Time
Figure 4: Average Annual Percentage Increase in Inflation-Adjusted Published Prices by Decade, 1979-80 to 2009-10
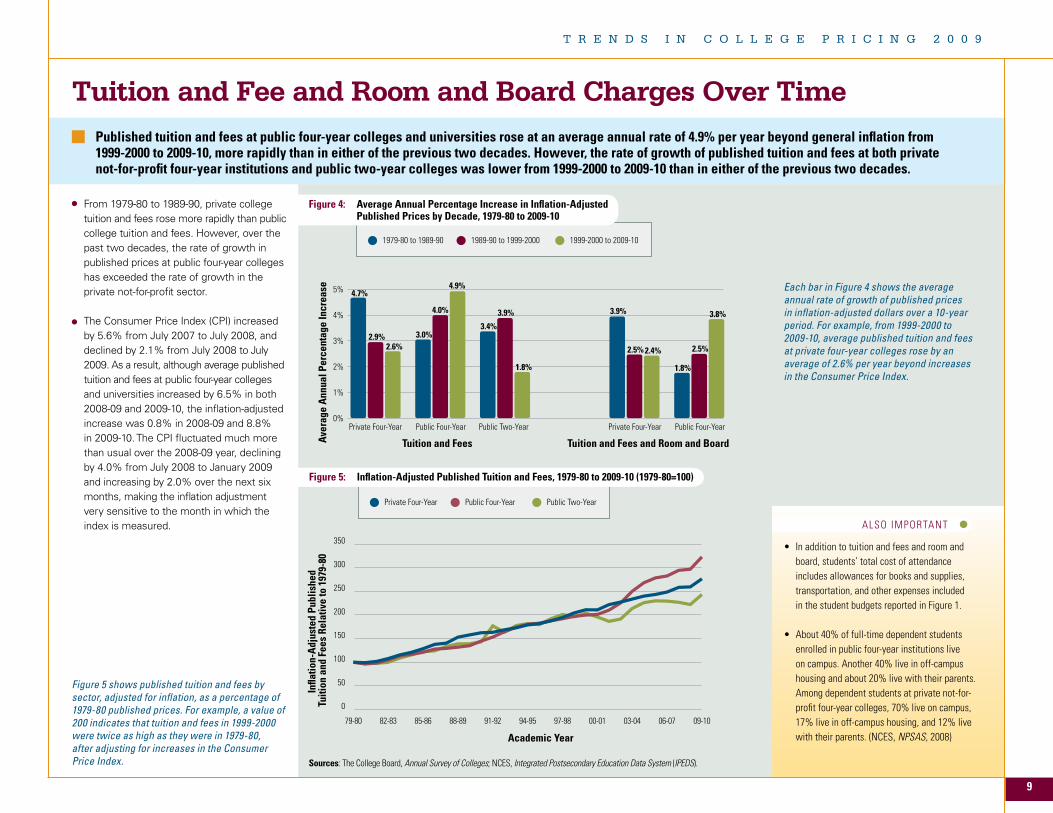
From 1979-80 to 1989-90, private college tuition and fees rose more rapidly than public college tuition and fees. However, over the past two decades, the rate of growth in published prices at public four-year colleges has exceeded the rate of growth in the private not-for-profit sector.
The Consumer Price Index (CPI) increased by 5.6% from July 2007 to July 2008, and declined by 2.1% from July 2008 to July 2009. As a result, although average published tuition and fees at public four-year colleges and universities increased by 6.5% in both 2008-09 and 2009-10, the inflation-adjusted increase was 0.8% in 2008-09 and 8.8% in 2009-10. The CPI fluctuated much more than usual over the 2008-09 year, declining by 4.0% from July 2008 to January 2009 and increasing by 2.0% over the next six months, making the inflation adjustment very sensitive to the month in which the index is measured.
Published tuition and fees at public four-year colleges and universities rose at an average annual rate of 4.9% per year beyond general inflation from 1999-2000 to 2009-10, more rapidly than in either of the previous two decades. However, the rate of growth of published tuition and fees at both private not-for-profit four-year institutions and public two-year colleges was lower from 1999-2000 to 2009-10 than in either of the previous two decades.
Figure 5: Inflation-Adjusted Published Tuition and Fees, 1979-80 to 2009-10 (1979-80=100)
0%
1%
2%
3%
4%
5%
Private Four-Year Public Four-Year Public Two-Year Private Four-Year Public Four-Year
Tuition and Fees Tuition and Fees and Room and BoardAver
age
Ann
ual P
erce
ntag
e In
crea
se 4.7%
2.9%2.6%
3.4%
4.0%
3.0%
3.9%
1.8%
4.9%
3.9%
2.5% 2.4%
1.8%
2.5%
3.8%
0
50
100
150
200
250
300
350
09-1006-0703-0400-0197-9894-9591-9288-8985-8682-8379-80
Infla
tion-
Adj
uste
d Pu
blis
hed
Tuiti
on a
nd F
ees
Rela
tive
to 1
979-
80
Academic Year
Sources: The College Board, Annual Survey of Colleges; NCES, Integrated Postsecondary Education Data System (IPEDS).
Each bar in Figure 4 shows the average annual rate of growth of published prices in inflation-adjusted dollars over a 10-year period. For example, from 1999-2000 to 2009-10, average published tuition and fees at private four-year colleges rose by an average of 2.6% per year beyond increases in the Consumer Price Index.
Figure 5 shows published tuition and fees by sector, adjusted for inflation, as a percentage of 1979-80 published prices. For example, a value of 200 indicates that tuition and fees in 1999-2000 were twice as high as they were in 1979-80, after adjusting for increases in the Consumer Price Index.
1979-80 to 1989-90 1989-90 to 1999-2000 1999-2000 to 2009-10
Private Four-Year Public Four-Year Public Two-Year
T R E N D S I N C O L L E G E P R I C I N G 2 0 0 9
9
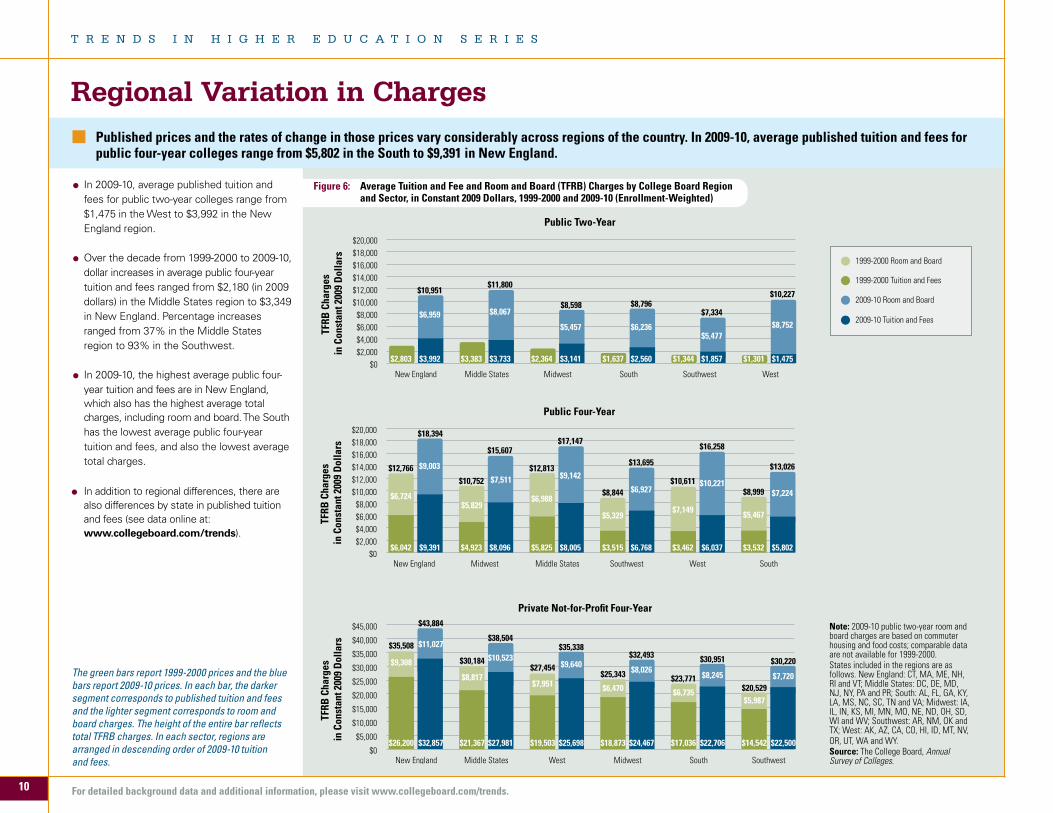
Regional Variation in ChargesPublished prices and the rates of change in those prices vary considerably across regions of the country. In 2009-10, average published tuition and fees for public four-year colleges range from $5,802 in the South to $9,391 in New England.
The green bars report 1999-2000 prices and the blue bars report 2009-10 prices. In each bar, the darker segment corresponds to published tuition and fees and the lighter segment corresponds to room and board charges. The height of the entire bar reflects total TFRB charges. In each sector, regions are arranged in descending order of 2009-10 tuition and fees.
$0$2,000$4,000$6,000$8,000
$10,000$12,000$14,000$16,000$18,000$20,000
New England Middle States Midwest South Southwest West
Public Two-Year
TFRB
Cha
rges
in
Con
stan
t 200
9 D
olla
rs
$2,803
$8,752$5,477
$6,236$5,457
$8,067$6,959
$1,475$1,301$1,857$1,344$2,560$1,637$3,141$2,364$3,733$3,383$3,992
$10,227
$7,334$8,796$8,598
$11,800$10,951
$0$2,000$4,000$6,000$8,000
$10,000$12,000$14,000$16,000$18,000$20,000
New England Middle StatesMidwest SouthSouthwest West
Public Four-Year
TFRB
Cha
rges
in
Con
stan
t 200
9 D
olla
rs
$6,042
$7,224$10,221
$6,927
$9,142$7,511
$9,003
$5,802$3,532$6,037$3,462$6,768$3,515$8,005$5,825$8,096$4,923$9,391
$13,026
$16,258
$13,695
$17,147$15,607
$18,394
$5,467$7,149$5,329
$6,988$5,829
$6,724 $8,999$8,844$10,752
$12,766 $12,813$10,611
$0
$5,000
$10,000
$15,000
$20,000
$25,000
$30,000
$35,000
$40,000
$45,000
New England Middle States Midwest South SouthwestWest
Private Not-for-Profit Four-Year
TFRB
Cha
rges
in
Con
stan
t 200
9 D
olla
rs
$26,200
$7,720$8,245$8,026
$9,640$10,523
$11,027
$22,500$14,542$22,706$17,036$24,467$18,873$25,698$19,503$27,981$21,367$32,857
$30,220$30,951$32,493$35,338
$38,504
$43,884
$5,987$6,735$6,470$7,951
$8,817
$9,308
$20,529
$25,343
$30,184
$35,508
$27,454$23,771
Figure 6: Average Tuition and Fee and Room and Board (TFRB) Charges by College Board Region and Sector, in Constant 2009 Dollars, 1999-2000 and 2009-10 (Enrollment-Weighted)
Note: 2009-10 public two-year room and board charges are based on commuter housing and food costs; comparable data are not available for 1999-2000. States included in the regions are as follows. New England: CT, MA, ME, NH, RI and VT; Middle States: DC, DE, MD, NJ, NY, PA and PR; South: AL, FL, GA, KY, LA, MS, NC, SC, TN and VA; Midwest: IA, IL, IN, KS, MI, MN, MO, NE, ND, OH, SD, WI and WV; Southwest: AR, NM, OK and TX; West: AK, AZ, CA, CO, HI, ID, MT, NV, OR, UT, WA and WY. Source: The College Board, Annual Survey of Colleges.
1999-2000 Room and Board
1999-2000 Tuition and Fees
2009-10 Room and Board
2009-10 Tuition and Fees
In 2009-10, average published tuition and fees for public two-year colleges range from $1,475 in the West to $3,992 in the New England region.
Over the decade from 1999-2000 to 2009-10, dollar increases in average public four-year tuition and fees ranged from $2,180 (in 2009 dollars) in the Middle States region to $3,349 in New England. Percentage increases ranged from 37% in the Middle States region to 93% in the Southwest.
In 2009-10, the highest average public four-year tuition and fees are in New England, which also has the highest average total charges, including room and board. The South has the lowest average public four-year tuition and fees, and also the lowest average total charges.
In addition to regional differences, there are also differences by state in published tuition and fees (see data online at: www.collegeboard.com/trends).
T R E N D S I N H I G H E R E D U C A T I O N S E R I E S
For detailed background data and additional information, please visit www.collegeboard.com/trends.10
ALSO IMPORTANT
• In2007-08,full-timeundergraduatestudentsatpublic four-year colleges and universities received about 30% of their grant aid from their institutions, about a quarter from federal Pell Grants, and another quarter from state grants. Other sources of grant support include private and employer grants.
• PellGrantsprovidedabout54%ofthegrantaidreceived by full-time students at public two-year colleges in 2007-08. These students received about 18% of their grant aid from state grants and only 9% from institutional funds.
• Full-timeundergraduatestudentsatprivatenot-for-profit four-year colleges and universities received almost 70% of their grant aid from their institutions, about 10% from state grants, and about 9% from Pell Grants. (NPSAS, 2008)
Average Net PriceAlthough average published tuition and fees increased by about 15% in inflation-adjusted dollars at private not-for-profit four-year colleges and universities from 2004-05 to 2009-10, and by about 20% at public four-year institutions, the estimated average 2009-10 net price for full-time students, after considering grant aid and federal tax benefits, is about $1,100 lower (in 2009 dollars) in the private sector and about $400 lower in the public sector than it was five years ago.
In 2009-10, full-time students at private not-for-profit four-year institutions receive an estimated average of about $14,400 in grant aid from all sources and federal tax benefits. This aid reduces the average net tuition and fees they pay from the published $26,300 to about $11,900.
Figure 7: Published Tuition and Fees, Net Tuition and Fees, and Room and Board in Constant 2009 Dollars, Full-Time Undergraduate Students, 1994-95, 1999-2000, 2004-05 and 2009-10
Public Two-Year Public Four-Year Private Not-for-Profit Four-Year
$0
$5,000
$10,000
$15,000
$20,000
$25,000
$30,000
$35,000
$40,000
94-95 99-00 04-05 09-1094-95 99-00 04-05 09-1094-95 99-00 04-05 09-10
Pric
e in
Con
stan
t 200
9 Do
llars
$6,070 $6,510 $6,630 $7,210 $5,680 $6,100 $7,100 $8,190 $6,930 $7,690 $8,440 $9,370
$1,900$1,000
$2,130
$630
$2,360
$60
$2,540
-$460
$3,930$2,130
$4,340
$2,140
$5,830
$2,030
$7,020
$1,620
$17,010
$10,410
$20,050
$12,150
$22,790
$12,990
$26,270
$11,870
Published Tuition and Fees Net Tuition and Fees Room and Board
Full-time students at public four-year colleges and universities receive an estimated average of about $5,400 in grant aid from all sources and federal tax benefits. This aid reduces the average net tuition and fees they pay from the published $7,000 to about $1,600.
Full-time students at public two-year colleges receive an estimated average of $3,000 in grant aid from all sources and federal tax benefits. This aid covers the average tuition and fees of $2,500 and provides about $500 toward living expenses.
All students also pay living costs. The net price estimates reported here attribute all of the grant aid and tax benefits to tuition and fees.
Average grant aid per student and average net prices conceal significant differences among students. In 2007-08, 64% of full-time students received grant aid (NPSAS, 2008). Increases in financial aid for lower-income students have a greater impact on college access and affordability than similar increases for higher-income students.
Note: Net tuition and fees are calculated by subtracting estimated average grant aid plus tax benefits per full-time student in the sector from the published price. Aggregate aid amounts are from Trends in Student Aid 2009. Division of total aid across sectors and between full-time and part-time students is based on the NPSAS, 1993 through 2008.
Published Tuition and Fees Net Tuition and Fees Room and Board
T R E N D S I N C O L L E G E P R I C I N G 2 0 0 9
11
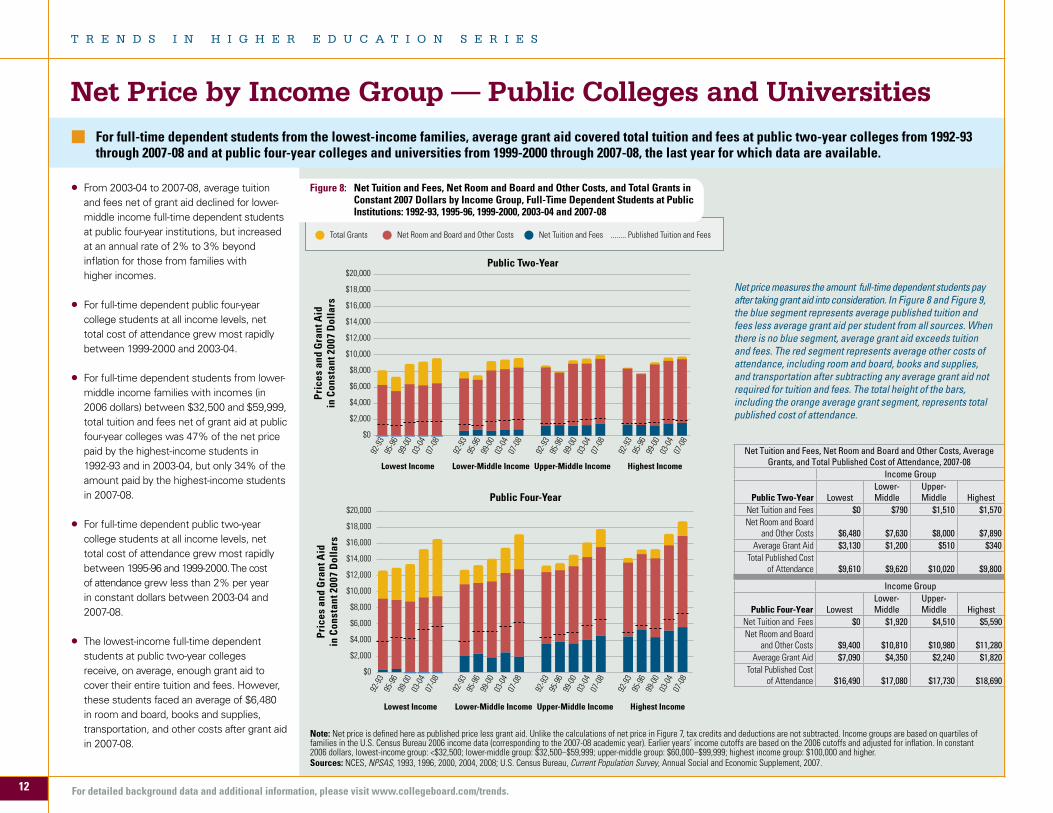
For full-time dependent students from the lowest-income families, average grant aid covered total tuition and fees at public two-year colleges from 1992-93 through 2007-08 and at public four-year colleges and universities from 1999-2000 through 2007-08, the last year for which data are available.
Net Price by Income Group — Public Colleges and Universities
From 2003-04 to 2007-08, average tuition and fees net of grant aid declined for lower-middle income full-time dependent students at public four-year institutions, but increased at an annual rate of 2% to 3% beyond inflation for those from families with higher incomes.
For full-time dependent public four-year college students at all income levels, net total cost of attendance grew most rapidly between 1999-2000 and 2003-04.
For full-time dependent students from lower-middle income families with incomes (in 2006 dollars) between $32,500 and $59,999, total tuition and fees net of grant aid at public four-year colleges was 47% of the net price paid by the highest-income students in 1992-93 and in 2003-04, but only 34% of the amount paid by the highest-income students in 2007-08.
For full-time dependent public two-year college students at all income levels, net total cost of attendance grew most rapidly between 1995-96 and 1999-2000. The cost of attendance grew less than 2% per year in constant dollars between 2003-04 and 2007-08.
The lowest-income full-time dependent students at public two-year colleges receive, on average, enough grant aid to cover their entire tuition and fees. However, these students faced an average of $6,480 in room and board, books and supplies, transportation, and other costs after grant aid in 2007-08.
$0
$2,000
$4,000
$6,000
$8,000
$10,000
$12,000
$14,000
$16,000
$18,000
$20,000
$0
$2,000
$4,000
$6,000
$8,000
$10,000
$12,000
$14,000
$16,000
$18,000
$20,000
03-0
407
-08
99-0
0
95-9
6
92-9
3
03-0
407
-08
99-0
0
95-9
6
92-9
3
03-0
407
-08
99-0
0
95-9
6
92-9
3
03-0
407
-08
99-0
0
95-9
6
92-9
3
Lowest Income Highest IncomeUpper-Middle IncomeLower-Middle Income
03-0
407
-08
99-0
0
95-9
6
92-9
3
03-0
407
-08
99-0
0
95-9
6
92-9
3
03-0
407
-08
99-0
0
95-9
6
92-9
3
03-0
407
-08
99-0
0
95-9
6
92-9
3
Public Two-Year
Public Four-Year
Pric
es a
nd G
rant
Aid
in C
onst
ant 2
007
Dol
lars
Pric
es a
nd G
rant
Aid
in C
onst
ant 2
007
Dol
lars
Lowest Income Highest IncomeUpper-Middle IncomeLower-Middle Income
$0
$2,000
$4,000
$6,000
$8,000
$10,000
$12,000
$14,000
$16,000
$18,000
$20,000
$0
$2,000
$4,000
$6,000
$8,000
$10,000
$12,000
$14,000
$16,000
$18,000
$20,000
03-0
407
-08
99-0
0
95-9
6
92-9
3
03-0
407
-08
99-0
0
95-9
6
92-9
3
03-0
407
-08
99-0
0
95-9
6
92-9
3
03-0
407
-08
99-0
0
95-9
6
92-9
3Lowest Income Highest IncomeUpper-Middle IncomeLower-Middle Income
03-0
407
-08
99-0
0
95-9
6
92-9
3
03-0
407
-08
99-0
0
95-9
6
92-9
3
03-0
407
-08
99-0
0
95-9
6
92-9
3
03-0
407
-08
99-0
0
95-9
6
92-9
3
Public Two-Year
Public Four-Year
Pric
es a
nd G
rant
Aid
in C
onst
ant 2
007
Dol
lars
Pric
es a
nd G
rant
Aid
in C
onst
ant 2
007
Dol
lars
Lowest Income Highest IncomeUpper-Middle IncomeLower-Middle Income
Net Tuition and Fees, Net Room and Board and Other Costs, Average Grants, and Total Published Cost of Attendance, 2007-08
Income Group
Public Two-Year LowestLower-Middle
Upper-Middle Highest
Net Tuition and Fees $0 $790 $1,510 $1,570Net Room and Board
and Other Costs $6,480 $7,630 $8,000 $7,890Average Grant Aid $3,130 $1,200 $510 $340
Total Published Cost of Attendance $9,610 $9,620 $10,020 $9,800
Income Group
Public Four-Year LowestLower-Middle
Upper-Middle Highest
Net Tuition and Fees $0 $1,920 $4,510 $5,590Net Room and Board
and Other Costs $9,400 $10,810 $10,980 $11,280Average Grant Aid $7,090 $4,350 $2,240 $1,820
Total Published Cost of Attendance $16,490 $17,080 $17,730 $18,690
Net price measures the amount full-time dependent students pay after taking grant aid into consideration. In Figure 8 and Figure 9, the blue segment represents average published tuition and fees less average grant aid per student from all sources. When there is no blue segment, average grant aid exceeds tuition and fees. The red segment represents average other costs of attendance, including room and board, books and supplies, and transportation after subtracting any average grant aid not required for tuition and fees. The total height of the bars, including the orange average grant segment, represents total published cost of attendance.
Note: Net price is defined here as published price less grant aid. Unlike the calculations of net price in Figure 7, tax credits and deductions are not subtracted. Income groups are based on quartiles of families in the U.S. Census Bureau 2006 income data (corresponding to the 2007-08 academic year). Earlier years’ income cutoffs are based on the 2006 cutoffs and adjusted for inflation. In constant 2006 dollars, lowest-income group: <$32,500; lower-middle group: $32,500–$59,999; upper-middle group: $60,000–$99,999; highest income group: $100,000 and higher. Sources: NCES, NPSAS, 1993, 1996, 2000, 2004, 2008; U.S. Census Bureau, Current Population Survey, Annual Social and Economic Supplement, 2007.
Total Grants Net Room and Board and Other Costs Net Tuition and Fees ........ Published Tuition and Fees
Figure 8: Net Tuition and Fees, Net Room and Board and Other Costs, and Total Grants in Constant 2007 Dollars by Income Group, Full-Time Dependent Students at Public Institutions: 1992-93, 1995-96, 1999-2000, 2003-04 and 2007-08
T R E N D S I N H I G H E R E D U C A T I O N S E R I E S
For detailed background data and additional information, please visit www.collegeboard.com/trends.12
ALSO IMPORTANT
Total Grants Net Room and Board and Other Costs Net Tuition and Fees ........ Published Tuition and Fees
Note: See page 12. Sources: NCES, NPSAS, 1993, 1996, 2000, 2004, 2008; U.S. Census Bureau, Current Population Survey, Annual Social and Economic Supplement, 2007.
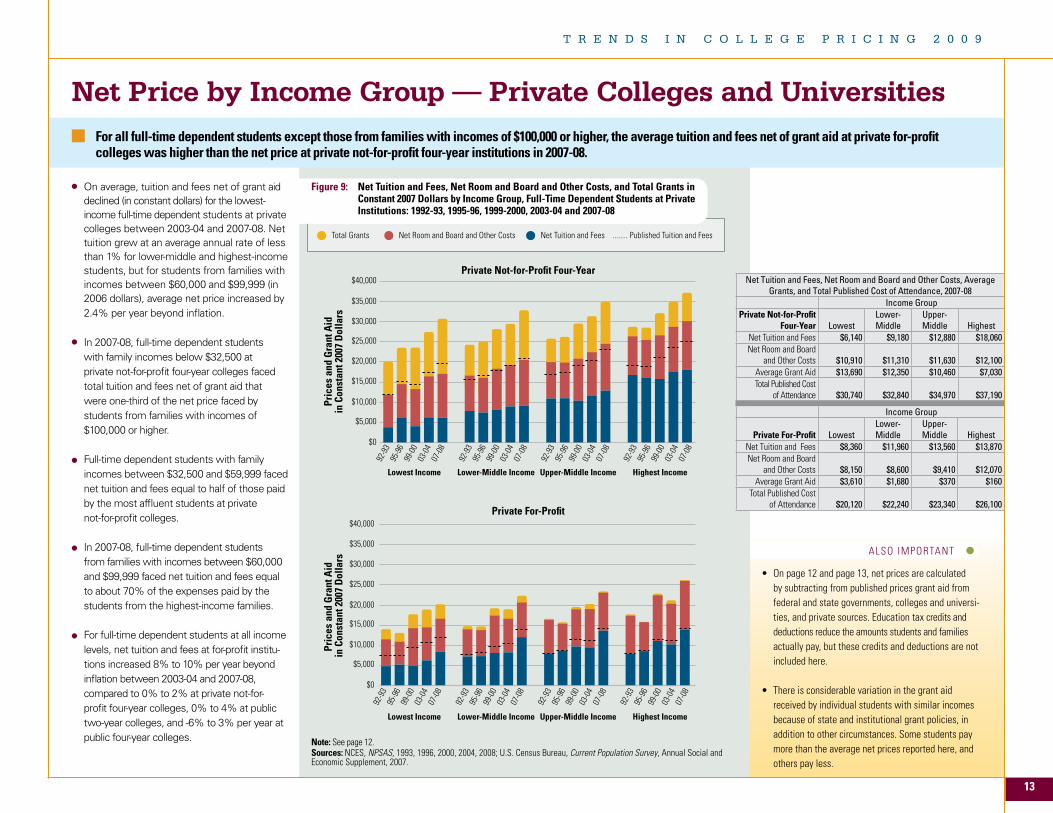
Figure 9: Net Tuition and Fees, Net Room and Board and Other Costs, and Total Grants in Constant 2007 Dollars by Income Group, Full-Time Dependent Students at Private Institutions: 1992-93, 1995-96, 1999-2000, 2003-04 and 2007-08
For all full-time dependent students except those from families with incomes of $100,000 or higher, the average tuition and fees net of grant aid at private for-profit colleges was higher than the net price at private not-for-profit four-year institutions in 2007-08.
Net Price by Income Group — Private Colleges and Universities
• Onpage12andpage13,netpricesarecalculatedby subtracting from published prices grant aid from federal and state governments, colleges and universi-ties, and private sources. Education tax credits and deductions reduce the amounts students and families actually pay, but these credits and deductions are not included here.
• Thereisconsiderablevariationinthegrantaid received by individual students with similar incomes because of state and institutional grant policies, in addition to other circumstances. Some students pay more than the average net prices reported here, and others pay less.
On average, tuition and fees net of grant aid declined (in constant dollars) for the lowest-income full-time dependent students at private colleges between 2003-04 and 2007-08. Net tuition grew at an average annual rate of less than 1% for lower-middle and highest-income students, but for students from families with incomes between $60,000 and $99,999 (in 2006 dollars), average net price increased by 2.4% per year beyond inflation.
In 2007-08, full-time dependent students with family incomes below $32,500 at private not-for-profit four-year colleges faced total tuition and fees net of grant aid that were one-third of the net price faced by students from families with incomes of $100,000 or higher.
Full-time dependent students with family
incomes between $32,500 and $59,999 faced net tuition and fees equal to half of those paid by the most affluent students at private not-for-profit colleges.
In 2007-08, full-time dependent students from families with incomes between $60,000 and $99,999 faced net tuition and fees equal to about 70% of the expenses paid by the students from the highest-income families.
For full-time dependent students at all income levels, net tuition and fees at for-profit institu-tions increased 8% to 10% per year beyond inflation between 2003-04 and 2007-08, compared to 0% to 2% at private not-for-profit four-year colleges, 0% to 4% at public two-year colleges, and -6% to 3% per year at public four-year colleges.
$0
$5,000
$10,000
$15,000
$20,000
$25,000
$30,000
$35,000
$40,000
$0
$5,000
$10,000
$15,000
$20,000
$25,000
$30,000
$35,000
$40,000
03-0
407
-08
99-0
0
95-9
6
92-9
3
03-0
407
-08
99-0
0
95-9
6
92-9
3
03-0
407
-08
99-0
0
95-9
6
92-9
3
03-0
407
-08
99-0
0
95-9
6
92-9
3
03-0
407
-08
99-0
0
95-9
6
92-9
3
03-0
407
-08
99-0
0
95-9
6
92-9
3
03-0
407
-08
99-0
0
95-9
6
92-9
3
03-0
407
-08
99-0
0
95-9
6
92-9
3
Private Not-for-Profit Four-Year
Private For-Profit
Pric
es a
nd G
rant
Aid
in C
onst
ant 2
007
Dol
lars
Pric
es a
nd G
rant
Aid
in
Con
stan
t 200
7 D
olla
rs
Lowest Income Highest IncomeUpper-Middle IncomeLower-Middle Income
Lowest Income Highest IncomeUpper-Middle IncomeLower-Middle Income
$0
$5,000
$10,000
$15,000
$20,000
$25,000
$30,000
$35,000
$40,000
$0
$5,000
$10,000
$15,000
$20,000
$25,000
$30,000
$35,000
$40,000
03-0
407
-08
99-0
0
95-9
6
92-9
3
03-0
407
-08
99-0
0
95-9
6
92-9
3
03-0
407
-08
99-0
0
95-9
6
92-9
3
03-0
407
-08
99-0
0
95-9
6
92-9
3
03-0
407
-08
99-0
0
95-9
6
92-9
3
03-0
407
-08
99-0
0
95-9
6
92-9
3
03-0
407
-08
99-0
0
95-9
6
92-9
3
03-0
407
-08
99-0
0
95-9
6
92-9
3
Private Not-for-Profit Four-Year
Private For-Profit
Pric
es a
nd G
rant
Aid
in C
onst
ant 2
007
Dol
lars
Pric
es a
nd G
rant
Aid
in
Con
stan
t 200
7 D
olla
rs
Lowest Income Highest IncomeUpper-Middle IncomeLower-Middle Income
Lowest Income Highest IncomeUpper-Middle IncomeLower-Middle Income
Net Tuition and Fees, Net Room and Board and Other Costs, Average Grants, and Total Published Cost of Attendance, 2007-08
Income GroupPrivate Not-for-Profit
Four-Year LowestLower-Middle
Upper-Middle Highest
Net Tuition and Fees $6,140 $9,180 $12,880 $18,060Net Room and Board
and Other Costs $10,910 $11,310 $11,630 $12,100Average Grant Aid $13,690 $12,350 $10,460 $7,030Total Published Cost
of Attendance $30,740 $32,840 $34,970 $37,190
Income Group
Private For-Profit LowestLower-Middle
Upper-Middle Highest
Net Tuition and Fees $8,360 $11,960 $13,560 $13,870Net Room and Board
and Other Costs $8,150 $8,600 $9,410 $12,070Average Grant Aid $3,610 $1,680 $370 $160
Total Published Cost of Attendance $20,120 $22,240 $23,340 $26,100
T R E N D S I N C O L L E G E P R I C I N G 2 0 0 9
13
ALSO IMPORTANT
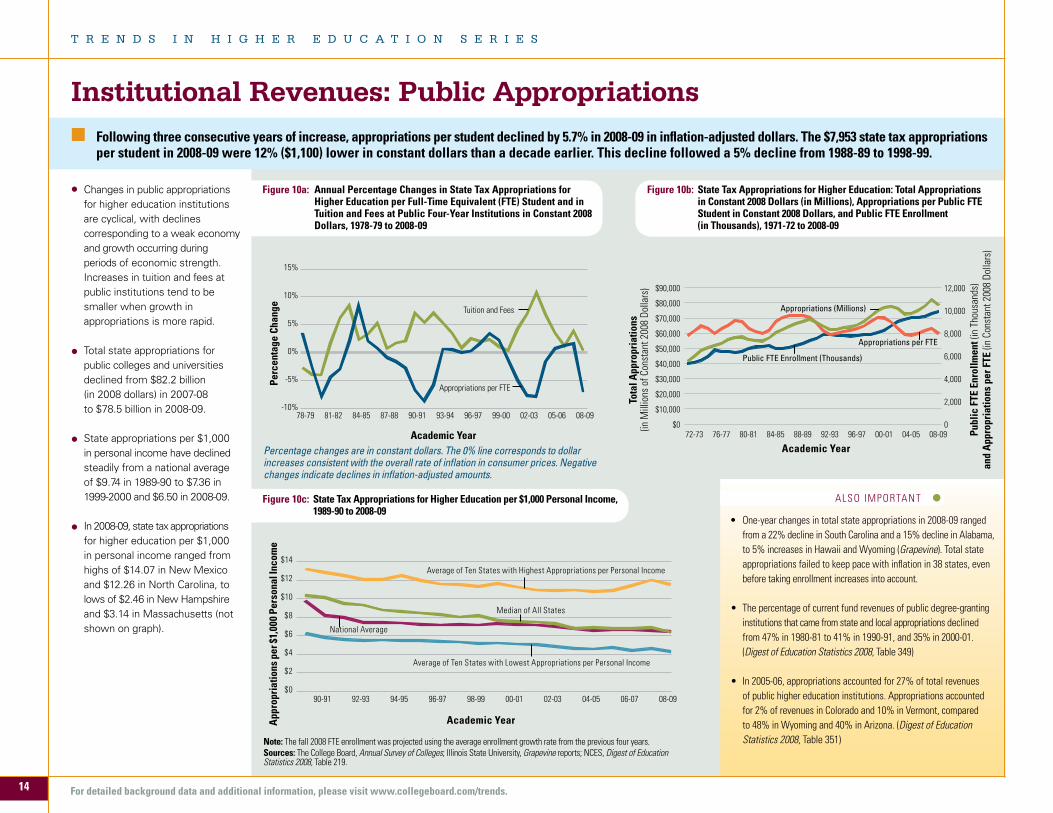
Institutional Revenues: Public AppropriationsFollowing three consecutive years of increase, appropriations per student declined by 5.7% in 2008-09 in inflation-adjusted dollars. The $7,953 state tax appropriations per student in 2008-09 were 12% ($1,100) lower in constant dollars than a decade earlier. This decline followed a 5% decline from 1988-89 to 1998-99.
Note: The fall 2008 FTE enrollment was projected using the average enrollment growth rate from the previous four years. Sources: The College Board, Annual Survey of Colleges; Illinois State University, Grapevine reports; NCES, Digest of Education Statistics 2008, Table 219.
Figure 10a: Annual Percentage Changes in State Tax Appropriations for Higher Education per Full-Time Equivalent (FTE) Student and in Tuition and Fees at Public Four-Year Institutions in Constant 2008 Dollars, 1978-79 to 2008-09
• One-year changes in total state appropriations in 2008-09 ranged from a 22% decline in South Carolina and a 15% decline in Alabama, to 5% increases in Hawaii and Wyoming (Grapevine). Total state appropriations failed to keep pace with inflation in 38 states, even before taking enrollment increases into account.
• Thepercentageofcurrentfundrevenuesofpublicdegree-grantinginstitutions that came from state and local appropriations declined from 47% in 1980-81 to 41% in 1990-91, and 35% in 2000-01. (Digest of Education Statistics 2008, Table 349)
• In2005-06,appropriationsaccountedfor27%oftotalrevenuesof public higher education institutions. Appropriations accounted for 2% of revenues in Colorado and 10% in Vermont, compared to 48% in Wyoming and 40% in Arizona. (Digest of Education Statistics 2008, Table 351)
Figure 10b: State Tax Appropriations for Higher Education: Total Appropriations in Constant 2008 Dollars (in Millions), Appropriations per Public FTE Student in Constant 2008 Dollars, and Public FTE Enrollment (in Thousands), 1971-72 to 2008-09
-10%
-5%
0%
5%
10%
15%
Tuition and Fees
Appropriations per FTE
Academic Year
78-79 81-82 84-85 87-88 90-91 93-94 96-97 99-00 02-03 05-06 08-09
Perc
enta
ge C
hang
e
Tota
l App
ropr
iatio
ns(in
Mill
ions
of C
onst
ant 2
008
Dolla
rs)
Publ
ic F
TE E
nrol
lmen
t (in
Tho
usan
ds)
and
App
ropr
iatio
ns p
er F
TE (i
n Co
nsta
nt 2
008
Dolla
rs)
Academic Year
0
2,000
4,000
6,000
8,000
10,000
12,000
$0
$10,000
$20,000
$30,000
$40,000
$50,000
$60,000
$70,000
$80,000
$90,000
Appropriations (Millions)
Public FTE Enrollment (Thousands)
Appropriations per FTE
72-73 76-77 80-81 84-85 88-89 92-93 96-97 00-01 04-05 08-09
$0
$2
$4
$6
$8
$10
$12
$14
08-0906-0704-0502-0300-0198-9996-9794-9592-9390-91
Academic YearApp
ropr
iatio
ns p
er $
1,00
0 Pe
rson
al In
com
e
Average of Ten States with Highest Appropriations per Personal Income
Median of All States
National Average
Average of Ten States with Lowest Appropriations per Personal Income
Percentage changes are in constant dollars. The 0% line corresponds to dollar increases consistent with the overall rate of inflation in consumer prices. Negative changes indicate declines in inflation-adjusted amounts.
Figure 10c: State Tax Appropriations for Higher Education per $1,000 Personal Income, 1989-90 to 2008-09
Changes in public appropriations for higher education institutions are cyclical, with declines corresponding to a weak economy and growth occurring during periods of economic strength. Increases in tuition and fees at public institutions tend to be smaller when growth in appropriations is more rapid.
Total state appropriations for public colleges and universities declined from $82.2 billion (in 2008 dollars) in 2007-08 to $78.5 billion in 2008-09.
State appropriations per $1,000 in personal income have declined steadily from a national average of $9.74 in 1989-90 to $7.36 in 1999-2000 and $6.50 in 2008-09.
In 2008-09, state tax appropriations for higher education per $1,000 in personal income ranged from highs of $14.07 in New Mexico and $12.26 in North Carolina, to lows of $2.46 in New Hampshire and $3.14 in Massachusetts (not shown on graph).
T R E N D S I N H I G H E R E D U C A T I O N S E R I E S
For detailed background data and additional information, please visit www.collegeboard.com/trends.14
Highest Decile Lowest Decile2nd 6th3rd 7th4th 8th5th 9th
ALSO IMPORTANT
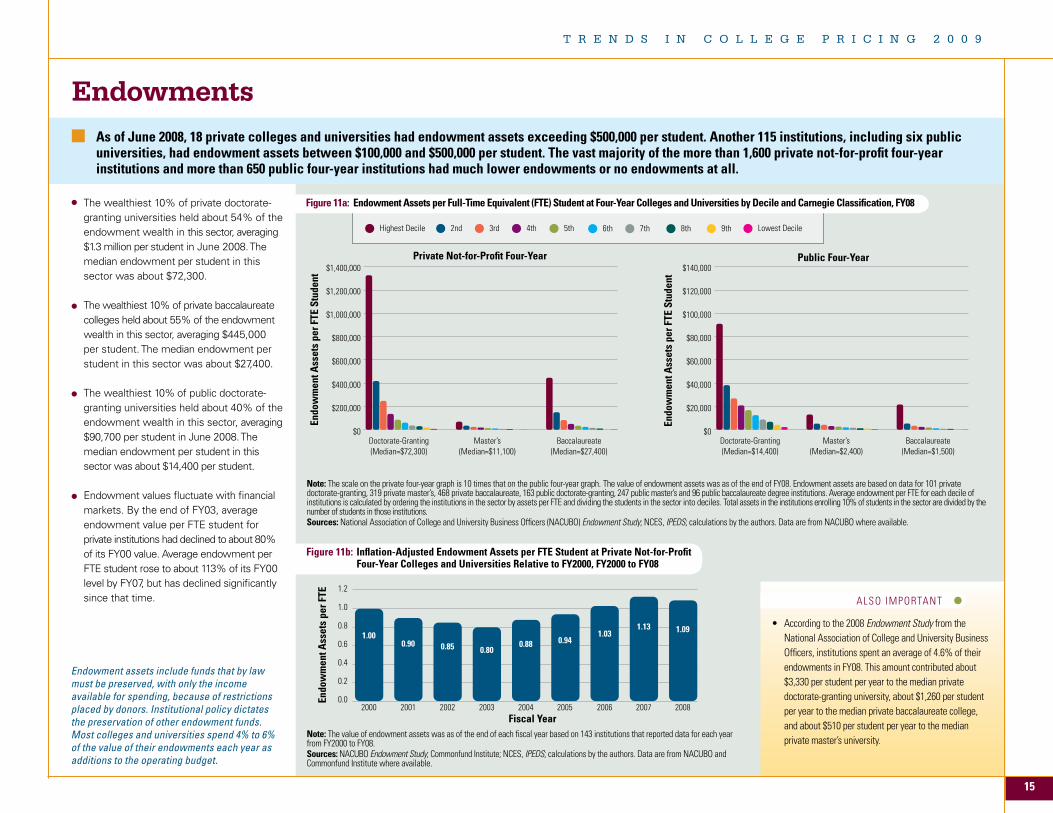
• According to the 2008 Endowment Study from the National Association of College and University Business Officers, institutions spent an average of 4.6% of their endowments in FY08. This amount contributed about $3,330 per student per year to the median private doctorate-granting university, about $1,260 per student per year to the median private baccalaureate college, and about $510 per student per year to the median private master’s university.
EndowmentsAs of June 2008, 18 private colleges and universities had endowment assets exceeding $500,000 per student. Another 115 institutions, including six public universities, had endowment assets between $100,000 and $500,000 per student. The vast majority of the more than 1,600 private not-for-profit four-year institutions and more than 650 public four-year institutions had much lower endowments or no endowments at all.
Figure 11a: Endowment Assets per Full-Time Equivalent (FTE) Student at Four-Year Colleges and Universities by Decile and Carnegie Classification, FY08
Figure 11b: Inflation-Adjusted Endowment Assets per FTE Student at Private Not-for-Profit Four-Year Colleges and Universities Relative to FY2000, FY2000 to FY08
Endowment assets include funds that by law must be preserved, with only the income available for spending, because of restrictions placed by donors. Institutional policy dictates the preservation of other endowment funds. Most colleges and universities spend 4% to 6% of the value of their endowments each year as additions to the operating budget.
The wealthiest 10% of private doctorate-granting universities held about 54% of the endowment wealth in this sector, averaging $1.3 million per student in June 2008. The median endowment per student in this sector was about $72,300.
The wealthiest 10% of private baccalaureate colleges held about 55% of the endowment wealth in this sector, averaging $445,000 per student. The median endowment per student in this sector was about $27,400.
The wealthiest 10% of public doctorate-granting universities held about 40% of the endowment wealth in this sector, averaging $90,700 per student in June 2008. The median endowment per student in this sector was about $14,400 per student.
Endowment values fluctuate with financial markets. By the end of FY03, average endowment value per FTE student for private institutions had declined to about 80% of its FY00 value. Average endowment per FTE student rose to about 113% of its FY00 level by FY07, but has declined significantly since that time.
$0
$200,000
$400,000
$600,000
$800,000
$1,000,000
$1,200,000
$1,400,000
$0
$20,000
$40,000
$60,000
$80,000
$100,000
$120,000
$140,000
Private Not-for-Profit Four-Year
Public Four-Year
Endo
wm
ent A
sset
s pe
r FTE
Stu
dent
Endo
wm
ent A
sset
s pe
r FTE
Stu
dent
Doctorate-Granting(Median=$72,300)
Master’s(Median=$11,100)
Baccalaureate(Median=$27,400)
Doctorate-Granting(Median=$14,400)
Master’s(Median=$2,400)
Baccalaureate(Median=$1,500)
$0
$200,000
$400,000
$600,000
$800,000
$1,000,000
$1,200,000
$1,400,000
$0
$20,000
$40,000
$60,000
$80,000
$100,000
$120,000
$140,000
Private Not-for-Profit Four-Year
Public Four-Year
Endo
wm
ent A
sset
s pe
r FTE
Stu
dent
Endo
wm
ent A
sset
s pe
r FTE
Stu
dent
Doctorate-Granting(Median=$72,300)
Master’s(Median=$11,100)
Baccalaureate(Median=$27,400)
Doctorate-Granting(Median=$14,400)
Master’s(Median=$2,400)
Baccalaureate(Median=$1,500)
Note: The scale on the private four-year graph is 10 times that on the public four-year graph. The value of endowment assets was as of the end of FY08. Endowment assets are based on data for 101 private doctorate-granting, 319 private master’s, 468 private baccalaureate, 163 public doctorate-granting, 247 public master’s and 96 public baccalaureate degree institutions. Average endowment per FTE for each decile of institutions is calculated by ordering the institutions in the sector by assets per FTE and dividing the students in the sector into deciles. Total assets in the institutions enrolling 10% of students in the sector are divided by the number of students in those institutions.Sources: National Association of College and University Business Officers (NACUBO) Endowment Study; NCES, IPEDS; calculations by the authors. Data are from NACUBO where available.
Note: The value of endowment assets was as of the end of each fiscal year based on 143 institutions that reported data for each year from FY2000 to FY08. Sources: NACUBO Endowment Study; Commonfund Institute; NCES, IPEDS; calculations by the authors. Data are from NACUBO and Commonfund Institute where available.
0.0
0.2
0.4
0.6
0.8
1.0
1.2
Fiscal Year
Endo
wm
ent A
sset
s pe
r FTE
20082007200620052004200320012000 2002
1.000.90
1.030.940.880.85 0.80
1.13 1.09
T R E N D S I N C O L L E G E P R I C I N G 2 0 0 9
15
ALSO IMPORTANT 0%
10%
20%
30%
40%
50%
1998–20081988–19981978–1988
Perc
enta
ge G
row
th
-5%
2% 5%
10%
19%
27%
6% 7%9% 11%
25%
40%
-4%-2%
0%2% 2% 1%
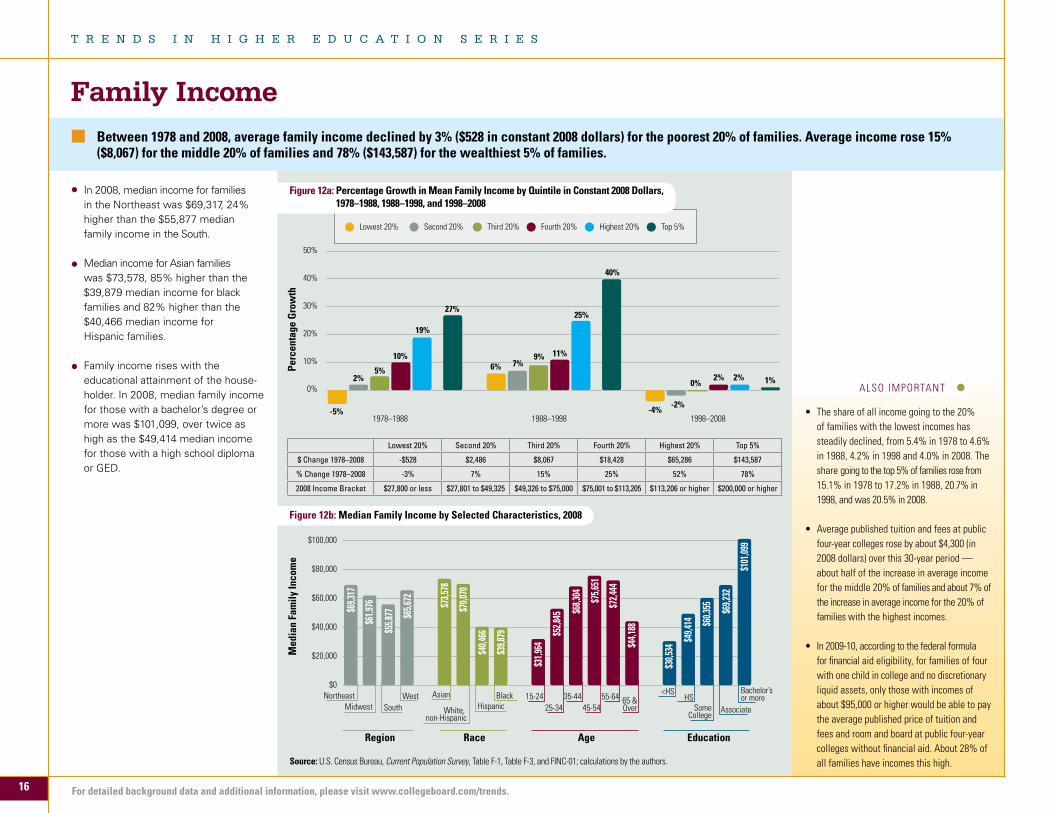
Figure 12b: Median Family Income by Selected Characteristics, 2008
• Theshareofallincomegoingtothe20%of families with the lowest incomes has steadily declined, from 5.4% in 1978 to 4.6% in 1988, 4.2% in 1998 and 4.0% in 2008. The share going to the top 5% of families rose from 15.1% in 1978 to 17.2% in 1988, 20.7% in 1998, and was 20.5% in 2008.
• Averagepublishedtuitionandfeesatpublicfour-year colleges rose by about $4,300 (in 2008 dollars) over this 30-year period — about half of the increase in average income for the middle 20% of families and about 7% of the increase in average income for the 20% of families with the highest incomes.
• In2009-10,accordingtothefederalformulafor financial aid eligibility, for families of four with one child in college and no discretionary liquid assets, only those with incomes of about $95,000 or higher would be able to pay the average published price of tuition and fees and room and board at public four-year colleges without financial aid. About 28% of all families have incomes this high.
Between 1978 and 2008, average family income declined by 3% ($528 in constant 2008 dollars) for the poorest 20% of families. Average income rose 15% ($8,067) for the middle 20% of families and 78% ($143,587) for the wealthiest 5% of families.
Family Income
In 2008, median income for families in the Northeast was $69,317, 24% higher than the $55,877 median family income in the South.
Median income for Asian families was $73,578, 85% higher than the $39,879 median income for black families and 82% higher than the $40,466 median income for Hispanic families.
Family income rises with the educational attainment of the house-holder. In 2008, median family income for those with a bachelor’s degree or more was $101,099, over twice as high as the $49,414 median income for those with a high school diploma or GED.
Source: U.S. Census Bureau, Current Population Survey, Table F-1, Table F-3, and FINC-01; calculations by the authors.
$0
$20,000
$40,000
$60,000
$80,000
$100,000
Med
ian
Fam
ily In
com
e
Region Race Age Education
$69,3
17
$61,9
76
$55,8
77 $65,6
72 $73,5
78
$70,0
70
$40,4
66
$39,8
79
$31,9
64
$52,8
45 $68,3
04 $75,6
51
$72,4
44
$44,1
88
$30,5
34
$49,4
14 $60,3
55 $69,2
32
$101
,099
NortheastMidwest South
West Asian
White, non-Hispanic
HispanicBlack 15-24
25-3435-44
45-5455-64 65 &
Over
<HSHS
SomeCollege
Associate
Bachelor’s or more
Lowest 20% Second 20% Third 20% Fourth 20% Highest 20% Top 5%
$ Change 1978–2008 -$528 $2,486 $8,067 $18,428 $65,286 $143,587
% Change 1978–2008 -3% 7% 15% 25% 52% 78%
2008 Income Bracket $27,800 or less $27,801 to $49,325 $49,326 to $75,000 $75,001 to $113,205 $113,206 or higher $200,000 or higher
Figure 12a: Percentage Growth in Mean Family Income by Quintile in Constant 2008 Dollars, 1978–1988, 1988–1998, and 1998–2008
Top 5%Highest 20%Fourth 20%Third 20%Second 20%Lowest 20%
T R E N D S I N H I G H E R E D U C A T I O N S E R I E S
For detailed background data and additional information, please visit www.collegeboard.com/trends.16
ALSO IMPORTANT
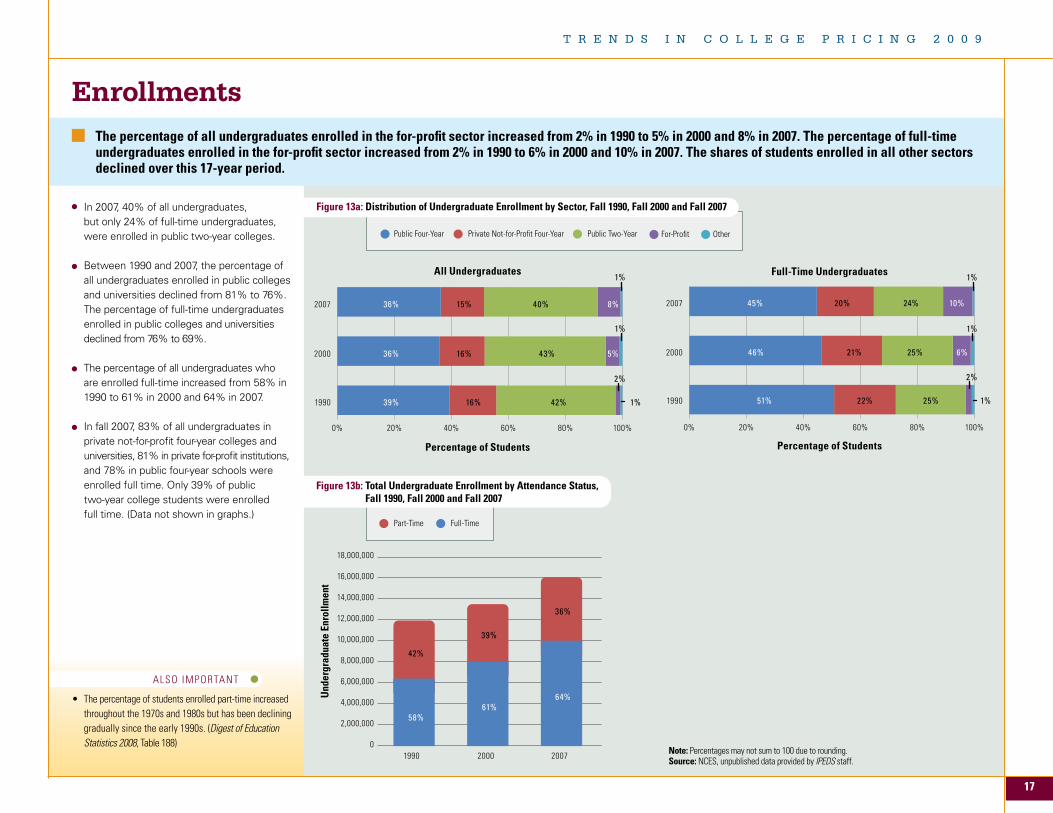
Percentage of Students
0% 20% 40% 60% 80% 100%
0% 20% 40% 60% 80% 100%
All Undergraduates
Full-Time Undergraduates
2007
2000
1990
2007
2000
1990
Percentage of Students
36% 15% 40% 8%
1%
36% 16% 43% 5%
1%
39% 16% 42%
2%
1%
45% 20% 24% 10%
1%
46% 21% 25% 6%
1%
51% 22% 25%
2%
1%
Percentage of Students
0% 20% 40% 60% 80% 100%
0% 20% 40% 60% 80% 100%
All Undergraduates
Full-Time Undergraduates
2007
2000
1990
2007
2000
1990
Percentage of Students
36% 15% 40% 8%
1%
36% 16% 43% 5%
1%
39% 16% 42%
2%
1%
45% 20% 24% 10%
1%
46% 21% 25% 6%
1%
51% 22% 25%
2%
1%
The percentage of all undergraduates enrolled in the for-profit sector increased from 2% in 1990 to 5% in 2000 and 8% in 2007. The percentage of full-time undergraduates enrolled in the for-profit sector increased from 2% in 1990 to 6% in 2000 and 10% in 2007. The shares of students enrolled in all other sectors declined over this 17-year period.
Note: Percentages may not sum to 100 due to rounding.Source: NCES, unpublished data provided by IPEDS staff.
In 2007, 40% of all undergraduates, but only 24% of full-time undergraduates, were enrolled in public two-year colleges.
Between 1990 and 2007, the percentage of all undergraduates enrolled in public colleges and universities declined from 81% to 76%. The percentage of full-time undergraduates enrolled in public colleges and universities declined from 76% to 69%.
The percentage of all undergraduates who are enrolled full-time increased from 58% in 1990 to 61% in 2000 and 64% in 2007.
In fall 2007, 83% of all undergraduates in private not-for-profit four-year colleges and universities, 81% in private for-profit institutions, and 78% in public four-year schools were enrolled full time. Only 39% of public two-year college students were enrolled full time. (Data not shown in graphs.)
Enrollments
0
2,000,000
4,000,000
6,000,000
8,000,000
10,000,000
12,000,000
14,000,000
16,000,000
18,000,000
1990 2000 2007
42%
39%
36%
58%61%
64%Und
ergr
adua
te E
nrol
lmen
t
• Thepercentageofstudentsenrolledpart-timeincreasedthroughout the 1970s and 1980s but has been declining gradually since the early 1990s. (Digest of Education Statistics 2008, Table 188)
Figure 13a: Distribution of Undergraduate Enrollment by Sector, Fall 1990, Fall 2000 and Fall 2007
Public Four-Year For-ProfitPrivate Not-for-Profit Four-Year OtherPublic Two-Year
Part-Time Full-Time
Figure 13b: Total Undergraduate Enrollment by Attendance Status, Fall 1990, Fall 2000 and Fall 2007
T R E N D S I N C O L L E G E P R I C I N G 2 0 0 9
17
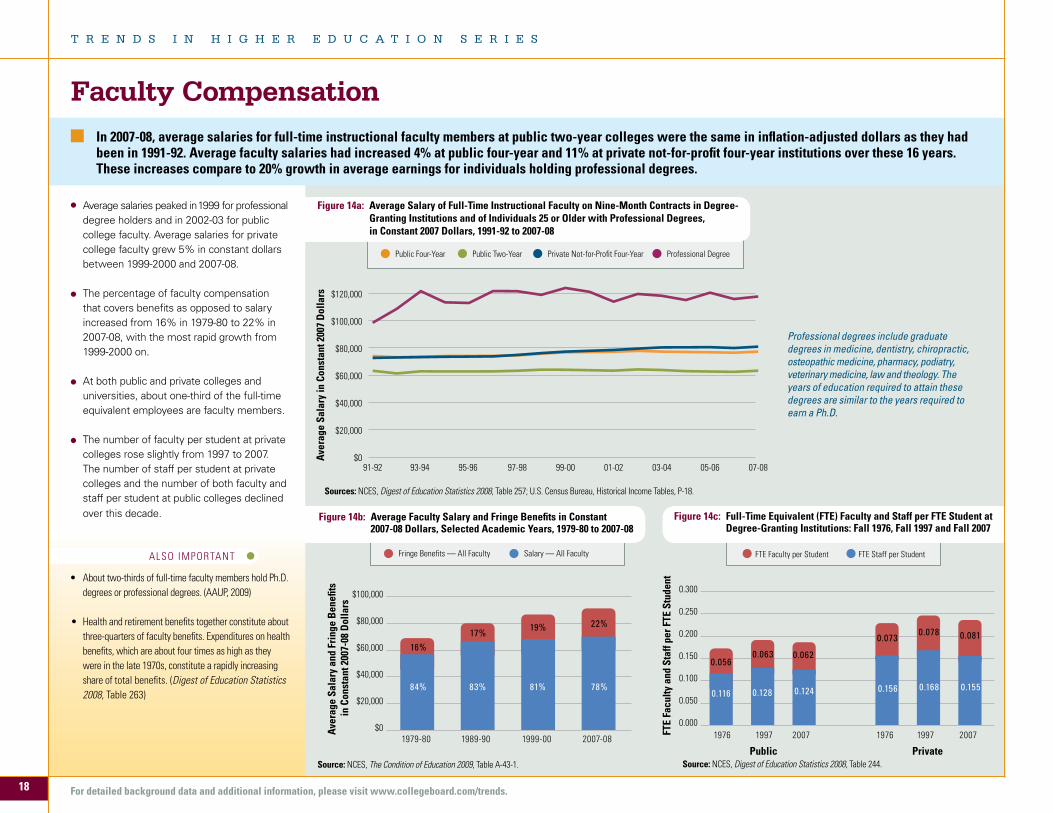
ALSO IMPORTANT
• About two-thirds of full-time faculty members hold Ph.D. degrees or professional degrees. (AAUP, 2009)
• Healthandretirementbenefitstogetherconstituteaboutthree-quarters of faculty benefits. Expenditures on health benefits, which are about four times as high as they were in the late 1970s, constitute a rapidly increasing share of total benefits. (Digest of Education Statistics 2008, Table 263)
In 2007-08, average salaries for full-time instructional faculty members at public two-year colleges were the same in inflation-adjusted dollars as they had been in 1991-92. Average faculty salaries had increased 4% at public four-year and 11% at private not-for-profit four-year institutions over these 16 years. These increases compare to 20% growth in average earnings for individuals holding professional degrees.
Sources: NCES, Digest of Education Statistics 2008, Table 257; U.S. Census Bureau, Historical Income Tables, P-18.
Source: NCES, The Condition of Education 2009, Table A-43-1.
Faculty Compensation
Average salaries peaked in 1999 for professional degree holders and in 2002-03 for public college faculty. Average salaries for private college faculty grew 5% in constant dollars between 1999-2000 and 2007-08.
The percentage of faculty compensation that covers benefits as opposed to salary increased from 16% in 1979-80 to 22% in 2007-08, with the most rapid growth from 1999-2000 on.
At both public and private colleges and universities, about one-third of the full-time equivalent employees are faculty members.
The number of faculty per student at private colleges rose slightly from 1997 to 2007. The number of staff per student at private colleges and the number of both faculty and staff per student at public colleges declined over this decade.
Aver
age
Sala
ry in
Con
stan
t 200
7 D
olla
rs
$0
$20,000
$40,000
$60,000
$80,000
$100,000
$120,000
07-0805-0603-0401-0299-0097-9895-96 93-94 91-92
Source: NCES, Digest of Education Statistics 2008, Table 244.
Professional degrees include graduate degrees in medicine, dentistry, chiropractic, osteopathic medicine, pharmacy, podiatry, veterinary medicine, law and theology. The years of education required to attain these degrees are similar to the years required to earn a Ph.D.
0.000
0.050
0.100
0.150
0.200
0.250
0.300
1997 2007
0.063
0.0730.078
0.128 0.156 0.168
1976
0.056
0.116
0.062
0.124
0.081
0.155
1997 20071976
Public Private
FTE
Facu
lty a
nd S
taff
per F
TE S
tude
nt
$0
$20,000
$40,000
$60,000
$80,000
$100,000
1989-90 1999-00 2007-08
17% 19% 22%
83% 81% 78%
1979-80
16%
84%
Aver
age
Sala
ry a
nd F
ring
e B
enefi
ts
in C
onst
ant 2
007-
08 D
olla
rs
Figure 14a: Average Salary of Full-Time Instructional Faculty on Nine-Month Contracts in Degree-Granting Institutions and of Individuals 25 or Older with Professional Degrees, in Constant 2007 Dollars, 1991-92 to 2007-08
Figure 14b: Average Faculty Salary and Fringe Benefits in Constant 2007-08 Dollars, Selected Academic Years, 1979-80 to 2007-08
Figure 14c: Full-Time Equivalent (FTE) Faculty and Staff per FTE Student at Degree-Granting Institutions: Fall 1976, Fall 1997 and Fall 2007
Public Four-Year Public Two-Year Private Not-for-Profit Four-Year Professional Degree
Fringe Benefits — All Faculty Salary — All Faculty FTE Faculty per Student FTE Staff per Student
T R E N D S I N H I G H E R E D U C A T I O N S E R I E S
For detailed background data and additional information, please visit www.collegeboard.com/trends.18
Notes and SourcesThe Annual Survey of CollegesPrices described in this report are based on data reported to the College Board by colleges and universities in the Annual Survey of Colleges. Data for 2009-10 are from an online questionnaire distributed in October 2008, with data collected and reviewed through early September 2009. Tuition and fee figures are based on charges to full-time students over the course of a nine-month academic year of 30 semester hours or 45 quarter hours. For those institutions with tuition and fees that vary by year of study, weighted average undergraduate tuition levels are used in the analysis. We are not able to estimate differences in tuition and fees by program, but rely on average prices reported by institutions.
Enrollment-Weighted and Unweighted DataThis report provides enrollment-weighted average prices.Charges reported by colleges with larger full-time enrollmentsare weighted more heavily than those of institutions withsmaller enrollments. Unweighted average prices, with thecharges of all reporting institutions treated equally, areavailable online at www.collegeboard.com/trends. The most recent enrollment data available are for fall 2008.While for 2008-09 and earlier years, prices are weighted bysame-year enrollments, for 2009-10, prices are weighted byfall 2008 enrollments. In other words, the percentage changesreported in Tables 1a and 1b reflect only price changes, notchanges in enrollment patterns. In contrast, the historical dataon changes in enrollment-weighted prices illustrated in Figures 4 and 5 reflect changes in both prices charged and in the distribution of full-time students across institutions.
In-State and Out-of-State Tuition and FeesIn-state tuition and fees are weighted by full-time enrollment.Out-of-state tuition and fees are calculated by adding the nonresident premium, weighted by full-time out-of-state enrollment, to average in-state tuition and fees.
Institutions Included in CalculationsOut of the 3,519 public two-year, public four-year, privatenot-for-profit four-year, and for-profit institutions that weresurveyed in both 2008 and 2009, 2,958 were included in thisyear’s analysis, including over 98% of the surveyed schoolsin the public and private not-for-profit sectors and 38% ofthose in the for-profit sector. Our imputation process allowsus to include schools for which we are missing one year of
data. We exclude from our calculations military academiesand other institutions that report zero tuition. Detailed information on the number of institutions included in the analysis for each sector is available online.
Revision of Base-Year ValuesThe prices for 2008-09 used in this analysis differ somewhatfrom the 2008-09 averages reported last year. One factorcontributing to the revision is the reweighting of the prices,shifting from fall 2007 to fall 2008 full-time enrollment figures.The base-year numbers also shift because several hundredinstitutions submit revised tuition figures for the previousyear. The recomputed average for 2008-09 tuition and fees at public four-year institutions is $6 higher than the level we reported last year for in-state students and $8 higher for out-of-state students. The recomputed average for 2008-09 tuition and fees is $34 higher than the level we reported last year for private not-for-profit four-year institutions and $30 lower for public two-year institutions. Our estimate of the average 2008-09 price for for-profit students is $269 higher than it was last year.
Net Price CalculationsThe calculations of average net price in Figure 7 for full-time undergraduate students are a best approximation and are based on the aggregate amounts of each type of aid reported in Trends in Student Aid 2009 and on the allocation of each type of aid across institution types and between part-time and full-time students reported in 1993, 1996, 2000, 2004 and 2008 National Postsecondary Student Aid Study (NPSAS) data. Total charges for public two-year students include an estimate of housing and food expenses for students not living with their parents, based on commuter room and board expenses reported by institutions when available and derived from public four-year room and board charges for earlier years in the analysis. The net price estimates reported here are notexactly comparable to those that appeared in 2008 becausesome figures have been updated.
Calculations of net price by income level in Figures 8 and 9 are based on NPSAS data. In contrast to the annual average net price calculations in Figure 7, only grant aid is subtracted from published prices to yield net prices. Federal tax credits and deductions are not considered here. Grant totals do not match precisely those used in Figure 7, because NPSAS estimates differ somewhat from the data reported in Trends in Student Aid 2009.
EndowmentsData on endowments are from the National Associationof College and University Business Officers (NACUBO) and Commonfund Institute, supplemented by data from IPEDS for institutions for which NACUBO or Commonfund data are not available. Public university foundation endowment assets are included.
Inflation AdjustmentThe Consumer Price Index for all urban consumers (CPI-U) is used to adjust for inflation. We use the CPI-U in July of the year in which the academic year begins. See ftp://ftp.bls.gov/pub/special.requests/cpi/cpiai.txt for changes in the CPI-U over time.
Carnegie Classification 2005: Basic Classification“Associate colleges” include institutions where all degrees are at the associate level, or where bachelor’s degrees account for less than 10% of all undergraduate degrees; “doctorate-granting universities” include institutions that award at least 20 doctoral degrees per year (excluding doctoral degrees that qualify recipients for entry into professional practice, such as the J.D., M.D., Pharm.D., DPT, etc.); “master’s colleges and universities” include institutions that award at least 50 master’s degrees per year; “baccalaureate colleges” include institutions where baccalaureate degrees represent at least 10% of all undergraduate degrees and that award fewer than 50 master’s degrees or fewer than 20 doctoral degrees per year. All of the categories above exclude “special focus institutions” and “tribal colleges.”
For more details on data sources and methodology, please see the Trends in College Pricing website at www.collegeboard.com/trends.
T R E N D S I N C O L L E G E P R I C I N G 2 0 0 9
19
T R E N D S I N H I G H E R E D U C A T I O N S E R I E S
Trends in College Pricing was authored byCollege Board senior policy analyst Sandy Baumand consultant Jennifer Ma, with assistance from Kathleen Payea, Patricia Steele and Anne Sturtevant.
Contact information for the authors:Sandy Baum, [email protected] Ma, [email protected]
Trends in College Pricing and its companion report,Trends in Student Aid, are supplemented by a website that makes detailed data available forreference and downloading. The PDF versionsof these reports, along with PowerPoint slidesof all the graphs, are available on the Web:www.collegeboard.com/trends.
Additional hard copies of the report can be orderedonline or via e-mail: [email protected], graphs and data in this report or excerptsthereof may be reproduced or cited, for noncommercial purposes only, provided that the following attribution is included:
Source: Trends in College Pricing. © 2009 The College Board. www.collegeboard.com
AcknowledgmentsThe publication would not have been possiblewithout the cooperation and support of manypeople at the College Board, including Tom Rudin, Sally Mitchell, Marilyn Cushman, Eleanor Vogelsang, Jonathan Van Arsdell and Edna DiFeo of the Washington Office.
We would also like to thank Edna Johnson, the Marketing & Publication Services staff, and the External Communications division. We are very grateful to Keryl Holman, Kimberly Gray Fess and the staff at Hawthorne Visual for their expert graphic design assistance.
Defining TermsAccording to the 1997 National Commission onthe Cost of Higher Education, defining “cost,” “price” and “subsidy” is critical to clarifying theissues in financing postsecondary education. “Costs” refer to the expenditures associated
with delivering instruction, including physical plant and salaries.
“Prices” are the expenses that students and parents face. “Published price” is the price institutions charge for tuition and fees as well as room and board, in the case of students residing on campus. A full student expense budget also includes books, supplies, transportation and other basic living costs. “Net price” is what the student and/or family must cover after grant aid and savings from tax credits and deductions are subtracted.
“General subsidies” make it possible for institutions to charge less than the actual costs of instruction. State, federal and local appropriations, as well as private philanthropy, reduce the prices faced by all students — whether or not they receive financial aid.
The College BoardThe College Board is a not-for-profit membership association whose mission is to connect students to college success and opportunity. Founded in 1900, the College Board is composed of more than 5,600 schools, colleges, universities and other educational organizations. Each year, the College Board serves seven million students and their parents, 23,000 high schools, and 3,800 colleges through major programs and services in college readiness, college admission, guidance, assessment, financial aid, enrollment, and teaching and learning. Among its best-known programs are the SAT®, the PSAT/NMSQT® and the Advanced Placement Program® (AP®). The College Board is committed to the principles of excellence and equity, and that commitment is embodied in all of its programs, services, activities and concerns.
The Washington Office of the College Boardconducts research relevant to public policy issuesin education. The office is located at 1233 20thStreet NW, Suite 600, Washington, DC 20036-2375.Phone: 202-741-4700.
For further information, visitwww.collegeboard.com.
© 2009 The College Board. College Board, Advanced Placement Program, AP, SAT and the acorn logo are registered trademarks of the College Board. inspiring minds is a trademark owned by the College Board. PSAT/NMSQT is a registered trademark of the College Board and National Merit Scholarship Corporation. All other products and services may be trademarks of their respective owners.
090343271