Embed Size (px)
Citation preview

Trends in Educational
Achievement:An International, National and Local Comparison of Student Performance
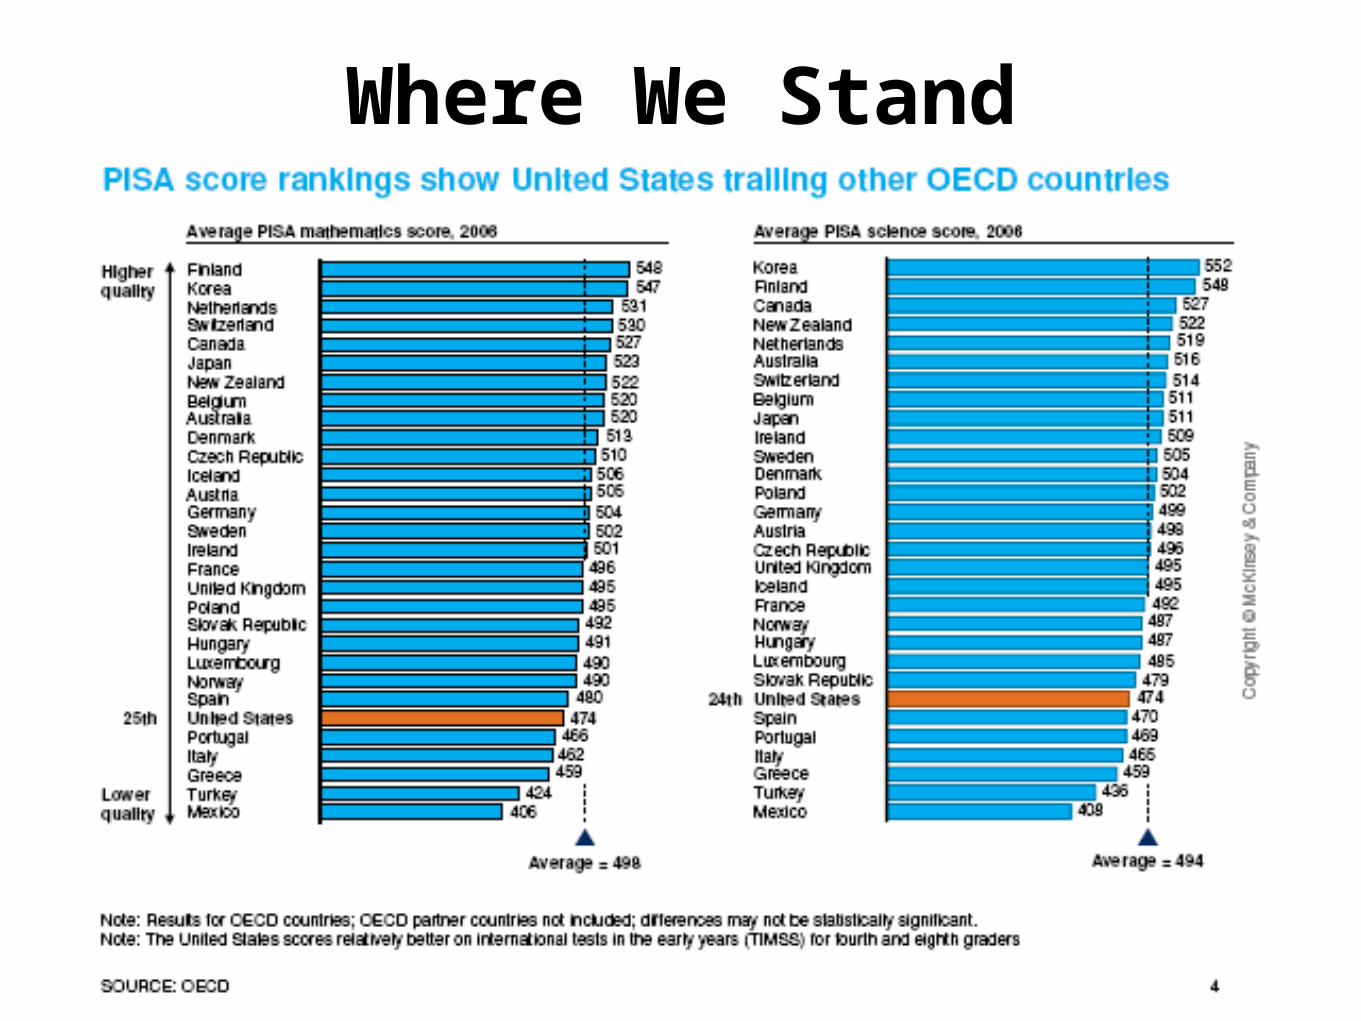
Where We Stand Internationally
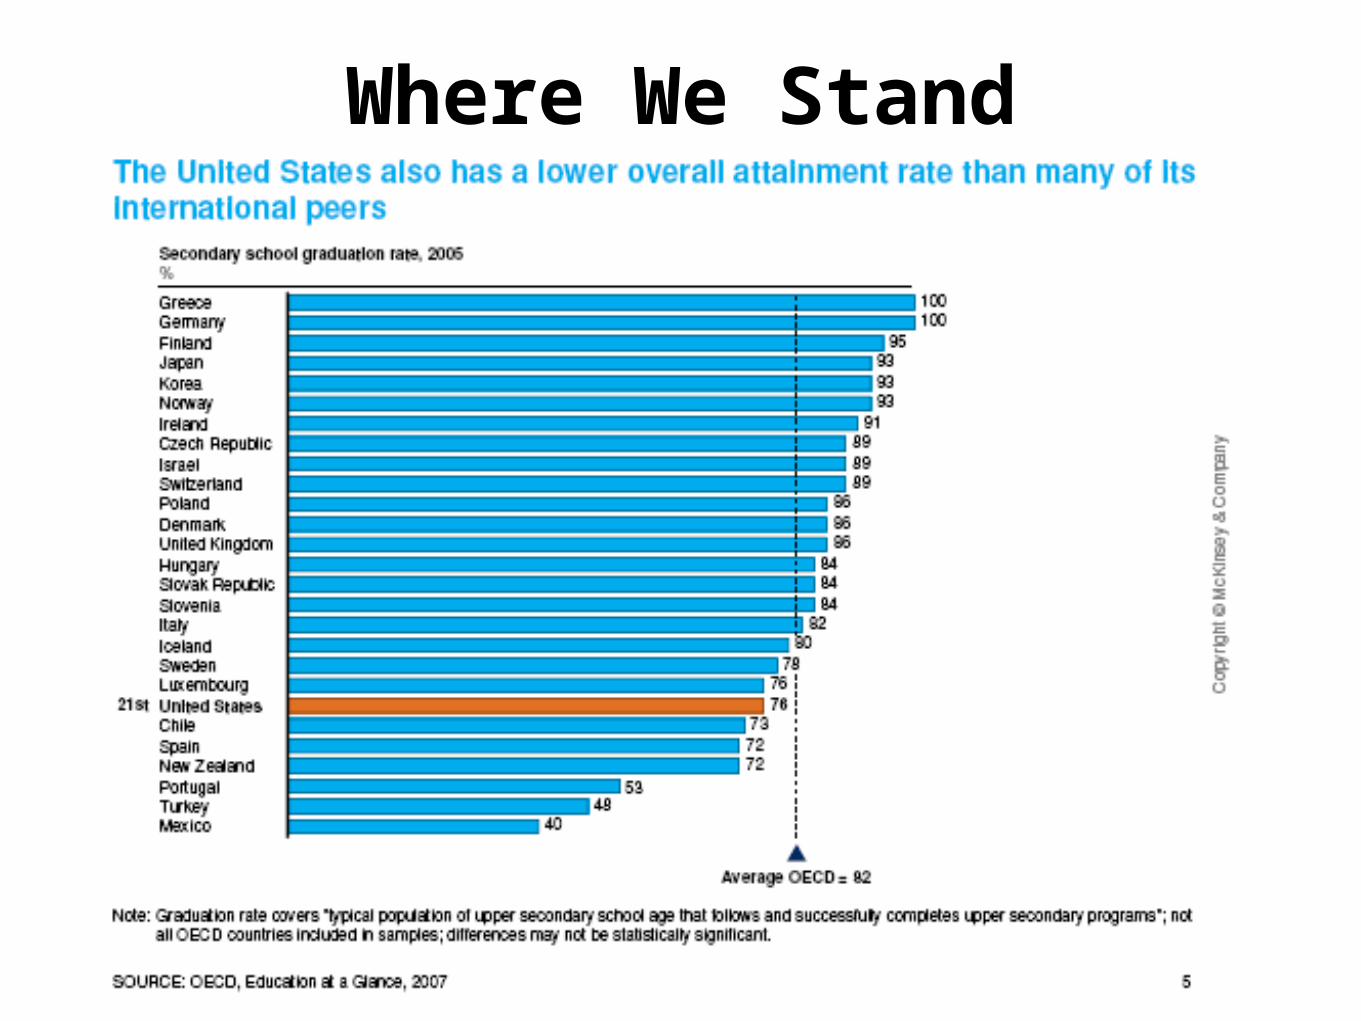
Where We Stand Internationally
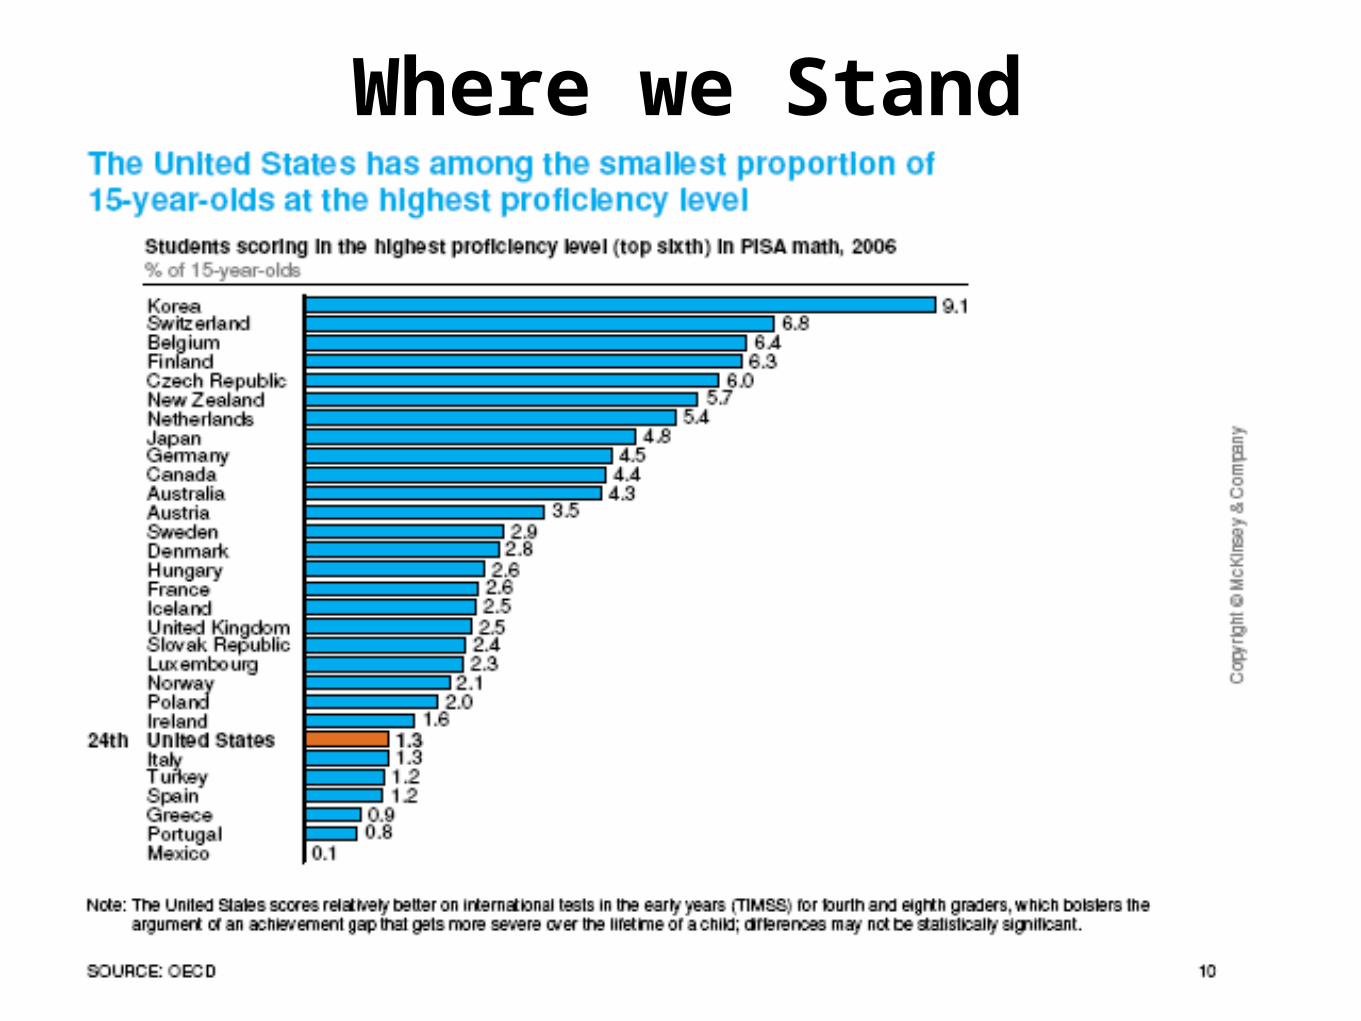
Where we Stand Internationally
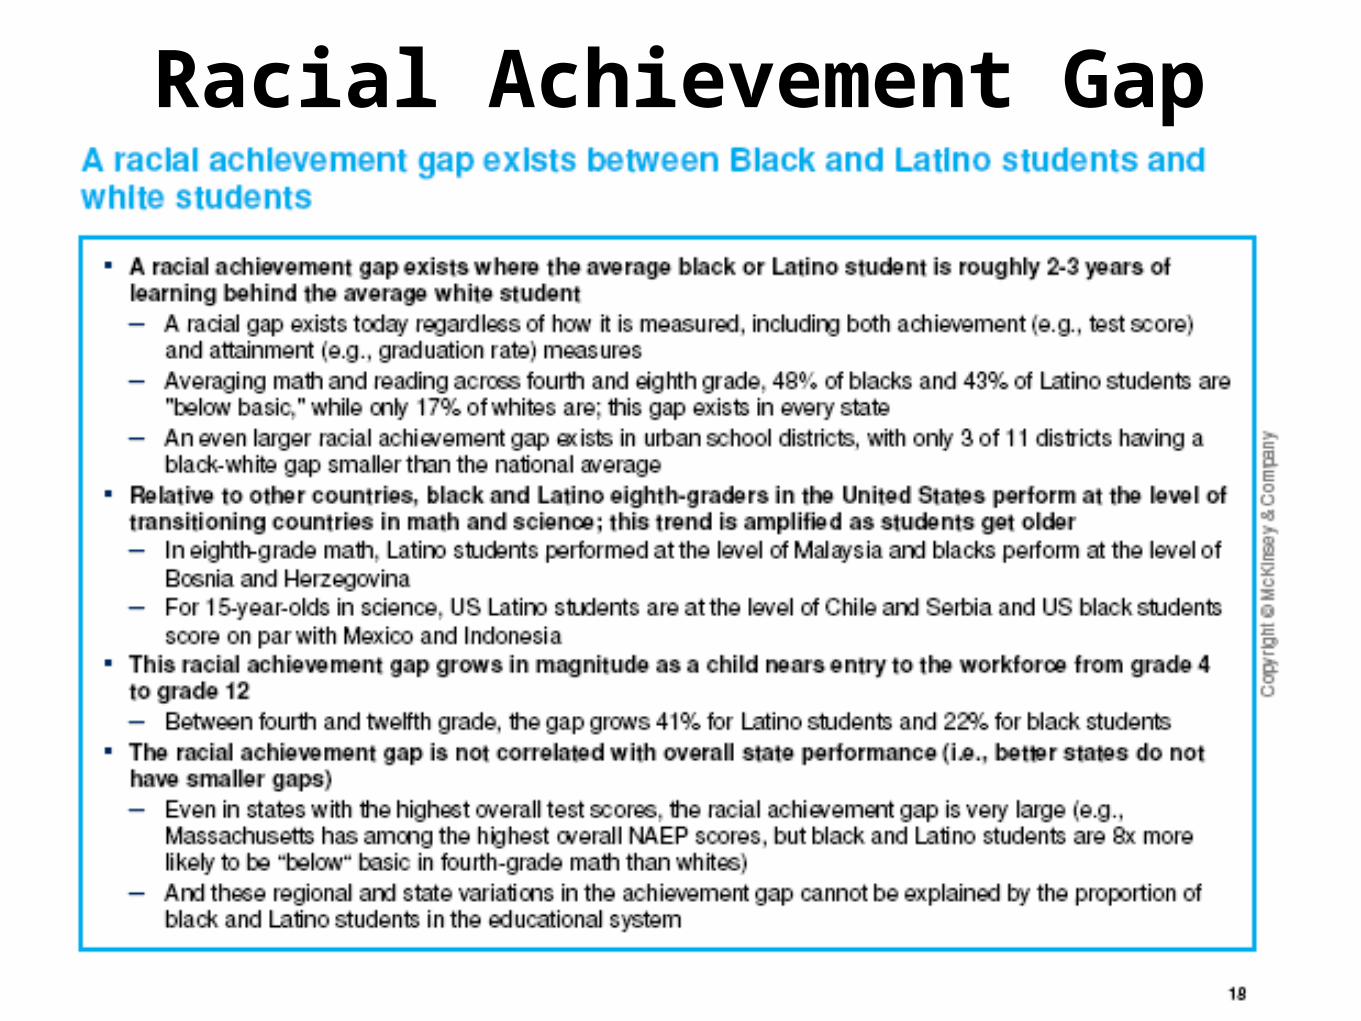
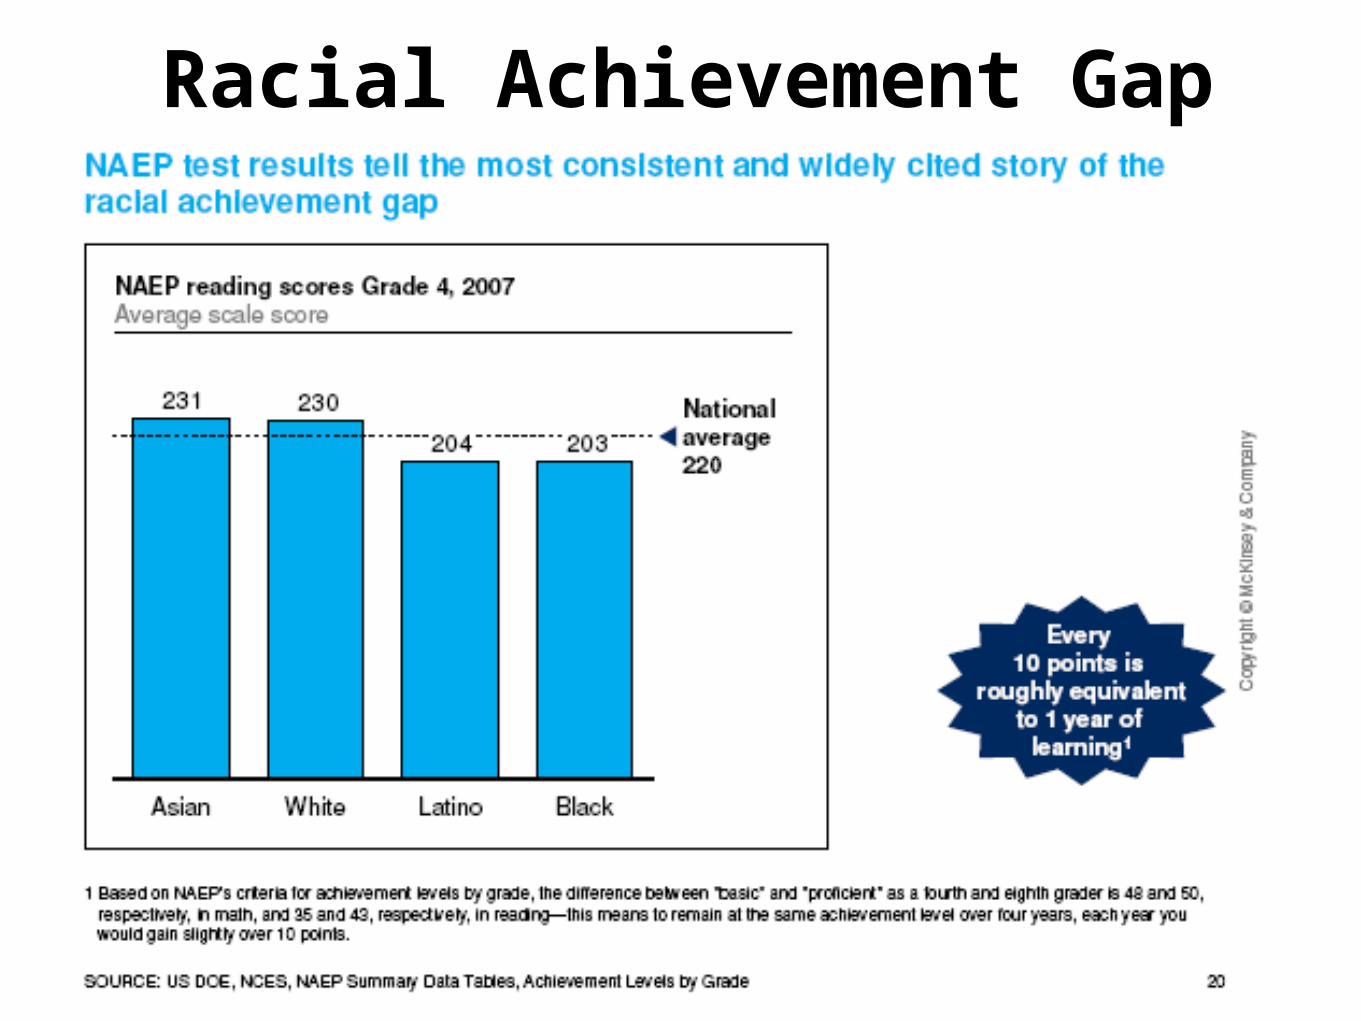
Racial Achievement Gap
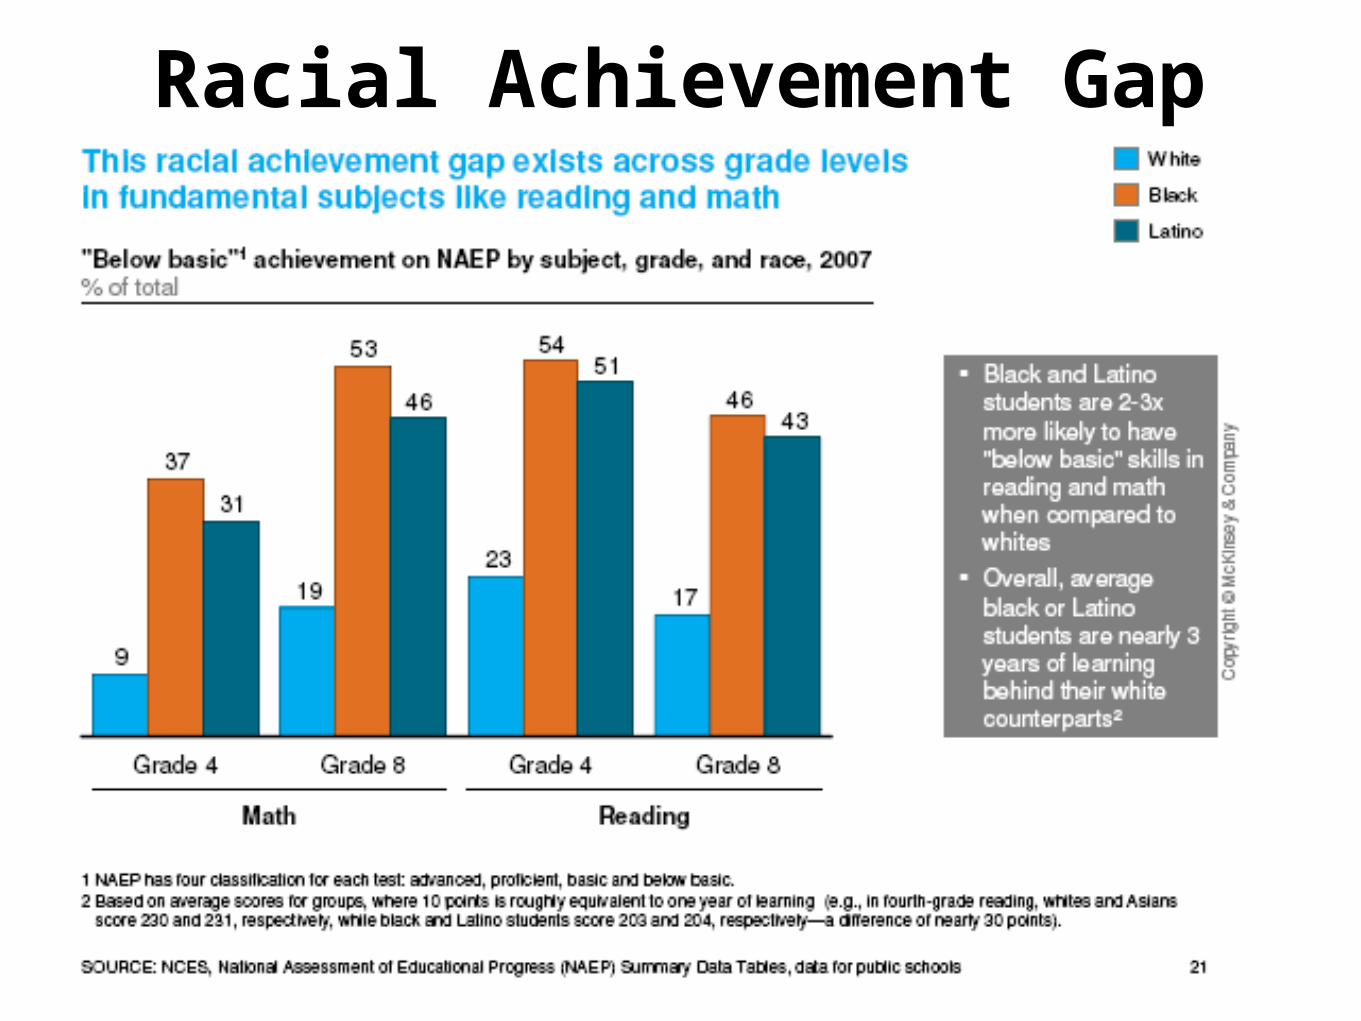
Racial Achievement Gap
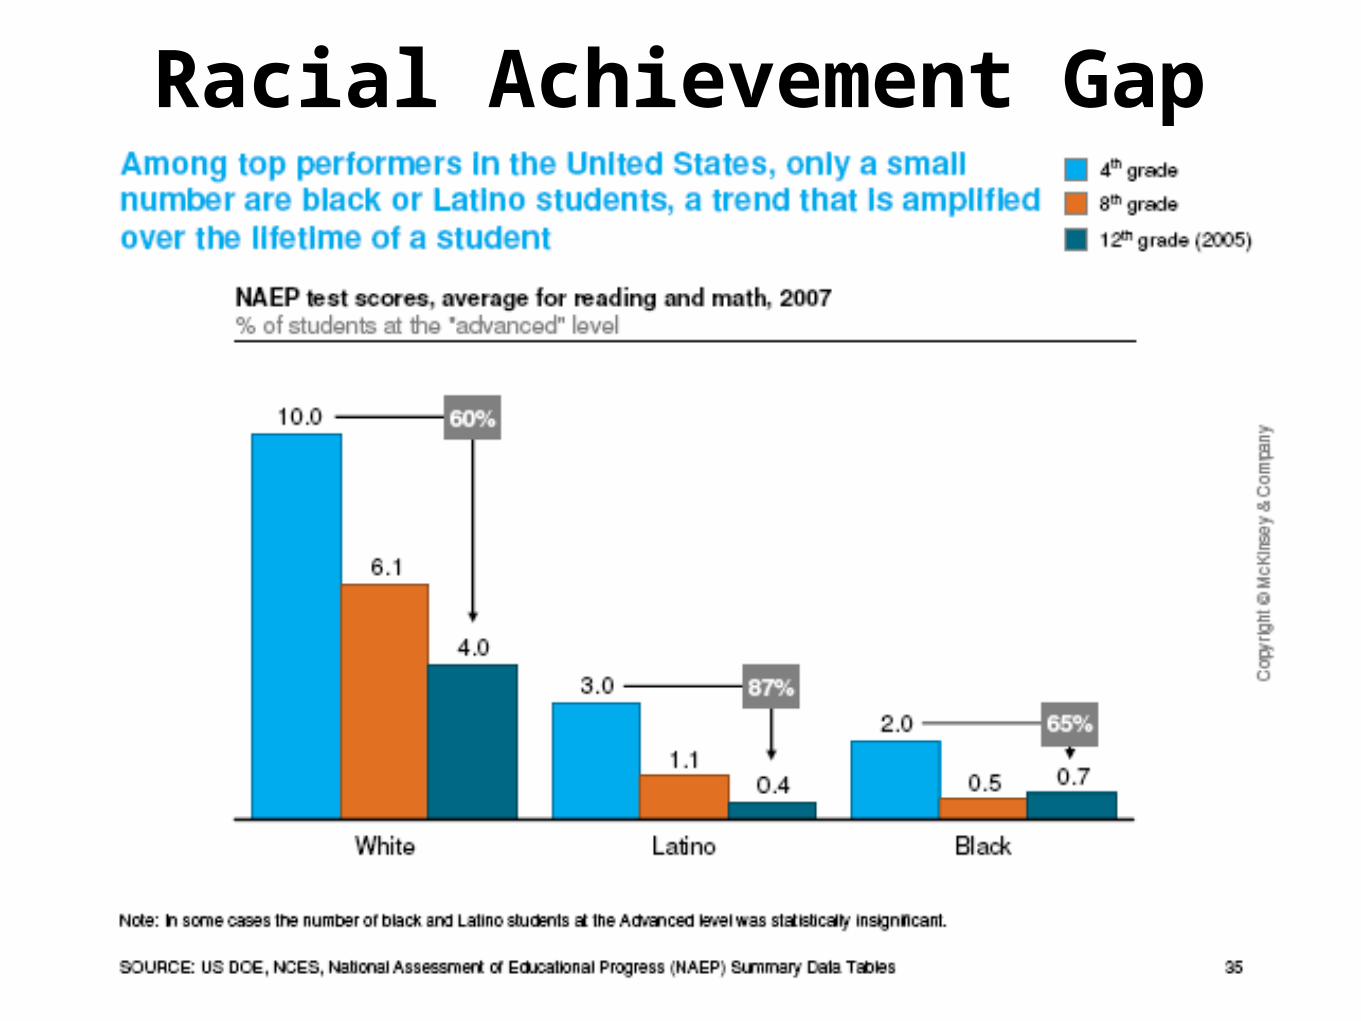
Racial Achievement Gap
Racial Achievement Gap
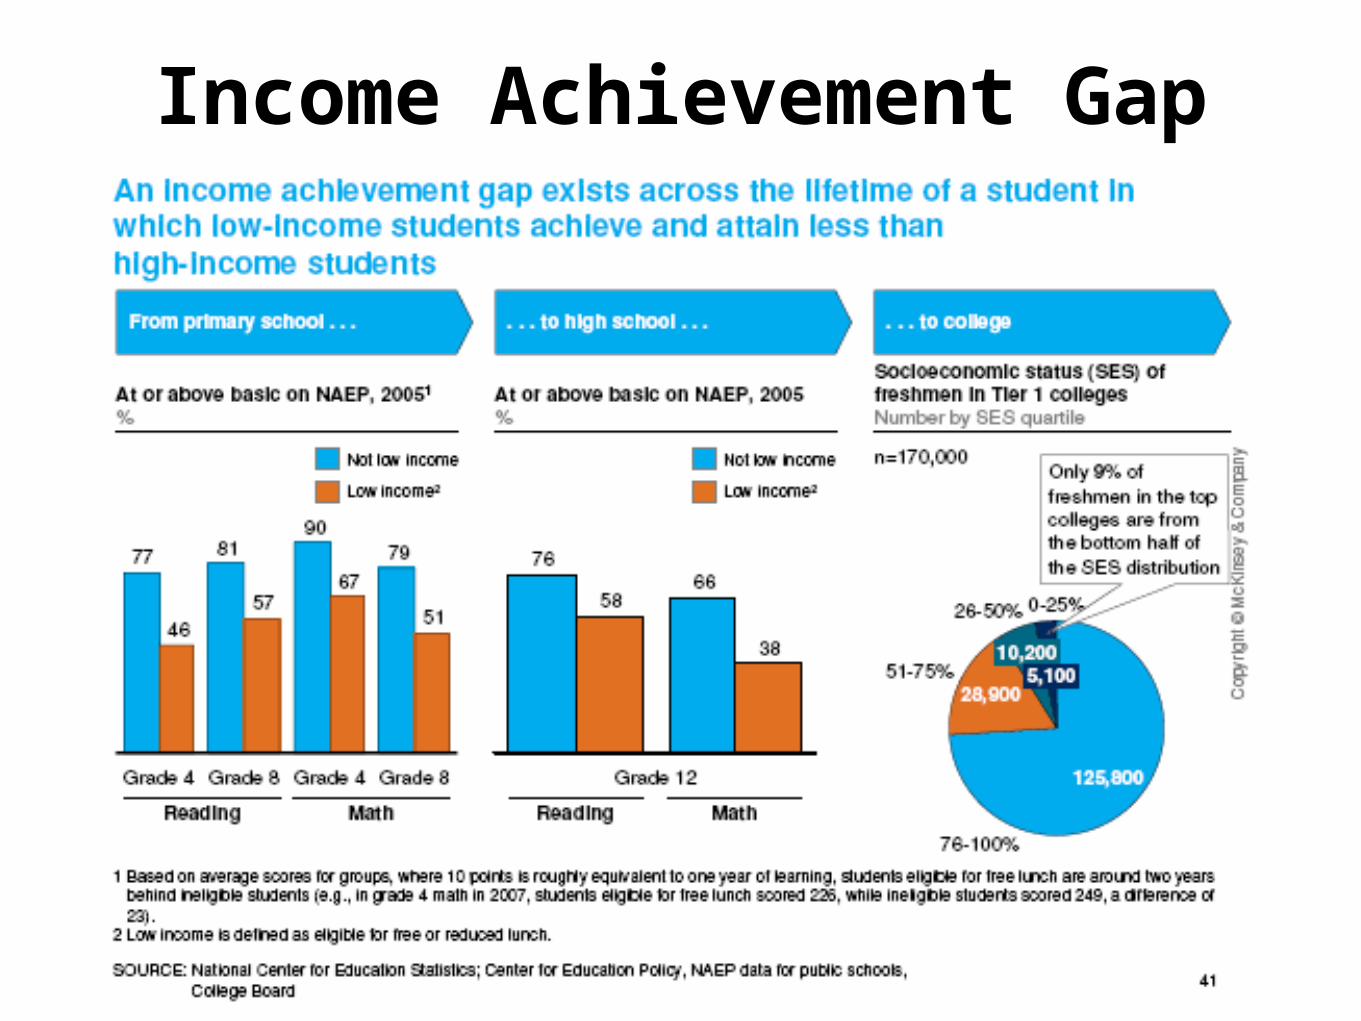
Income Achievement Gap
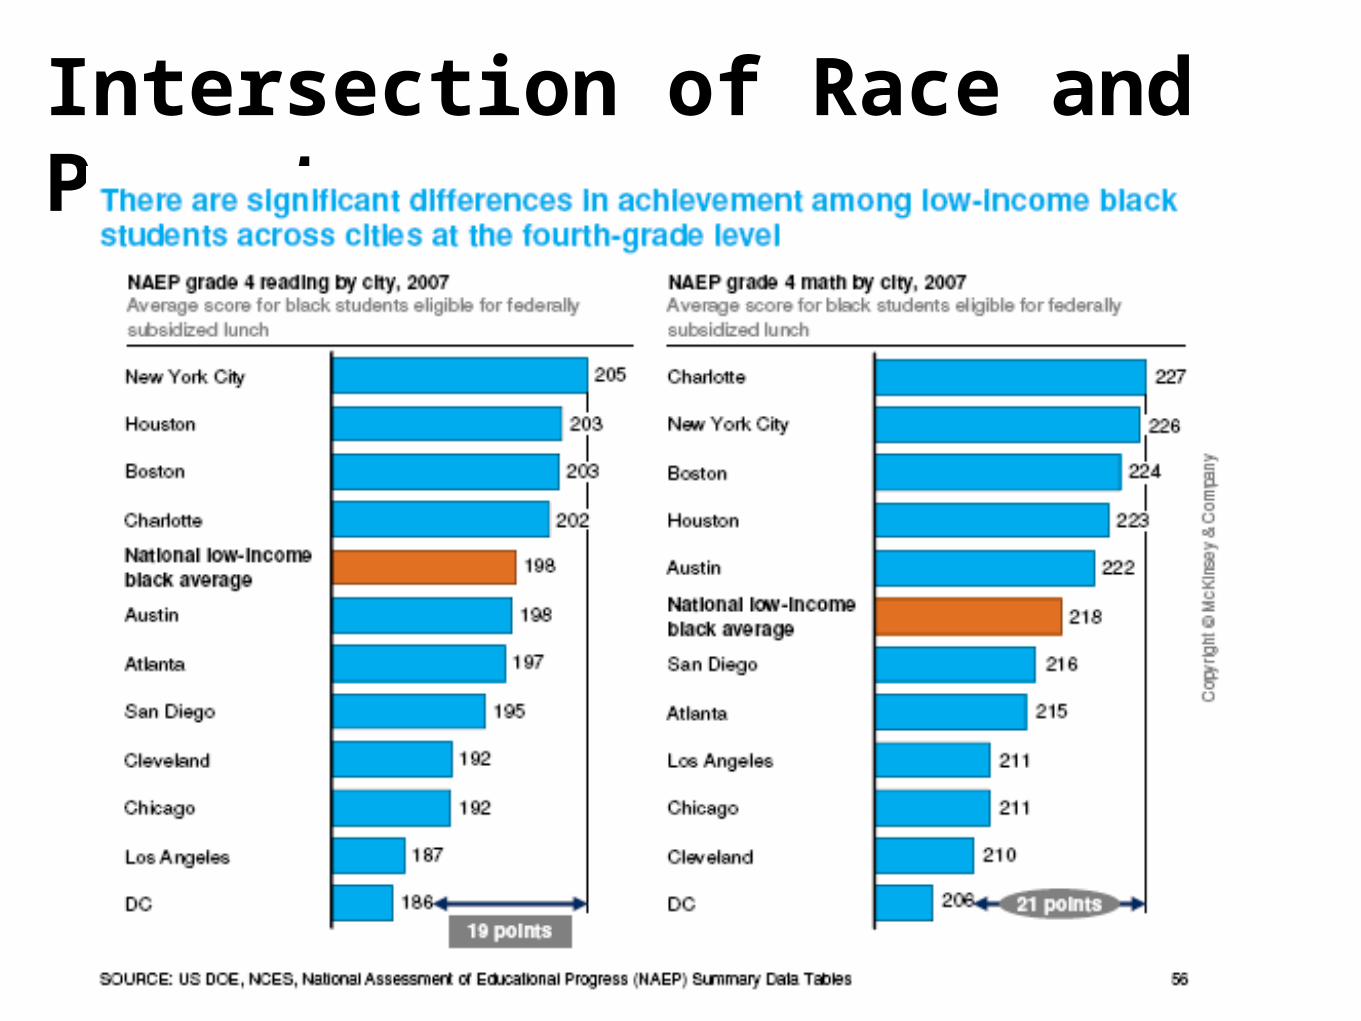
Intersection of Race and Poverty
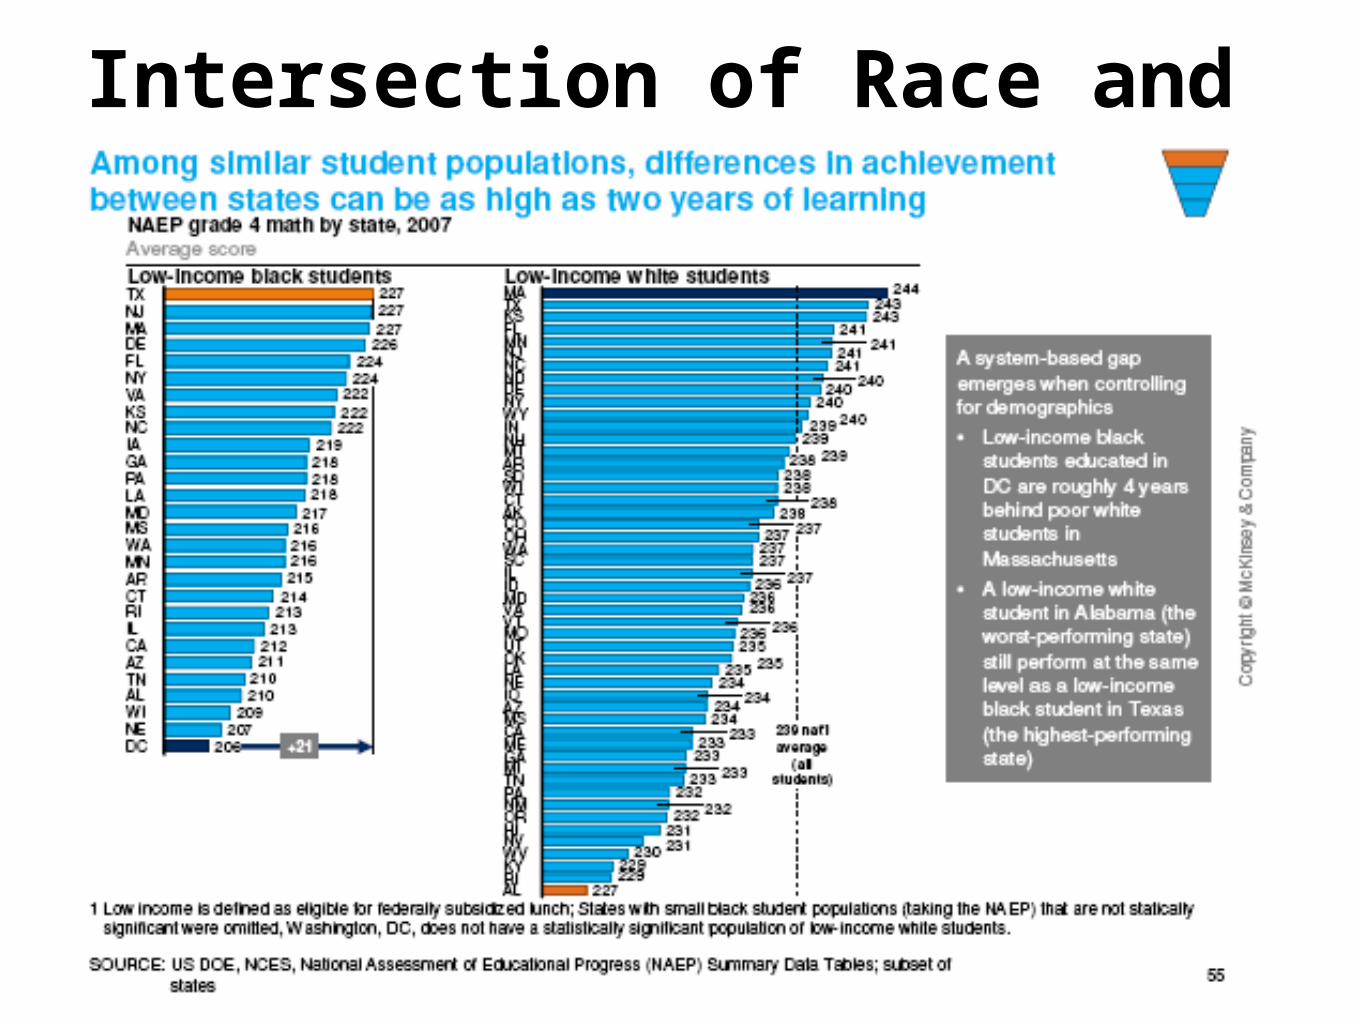
Intersection of Race and Poverty
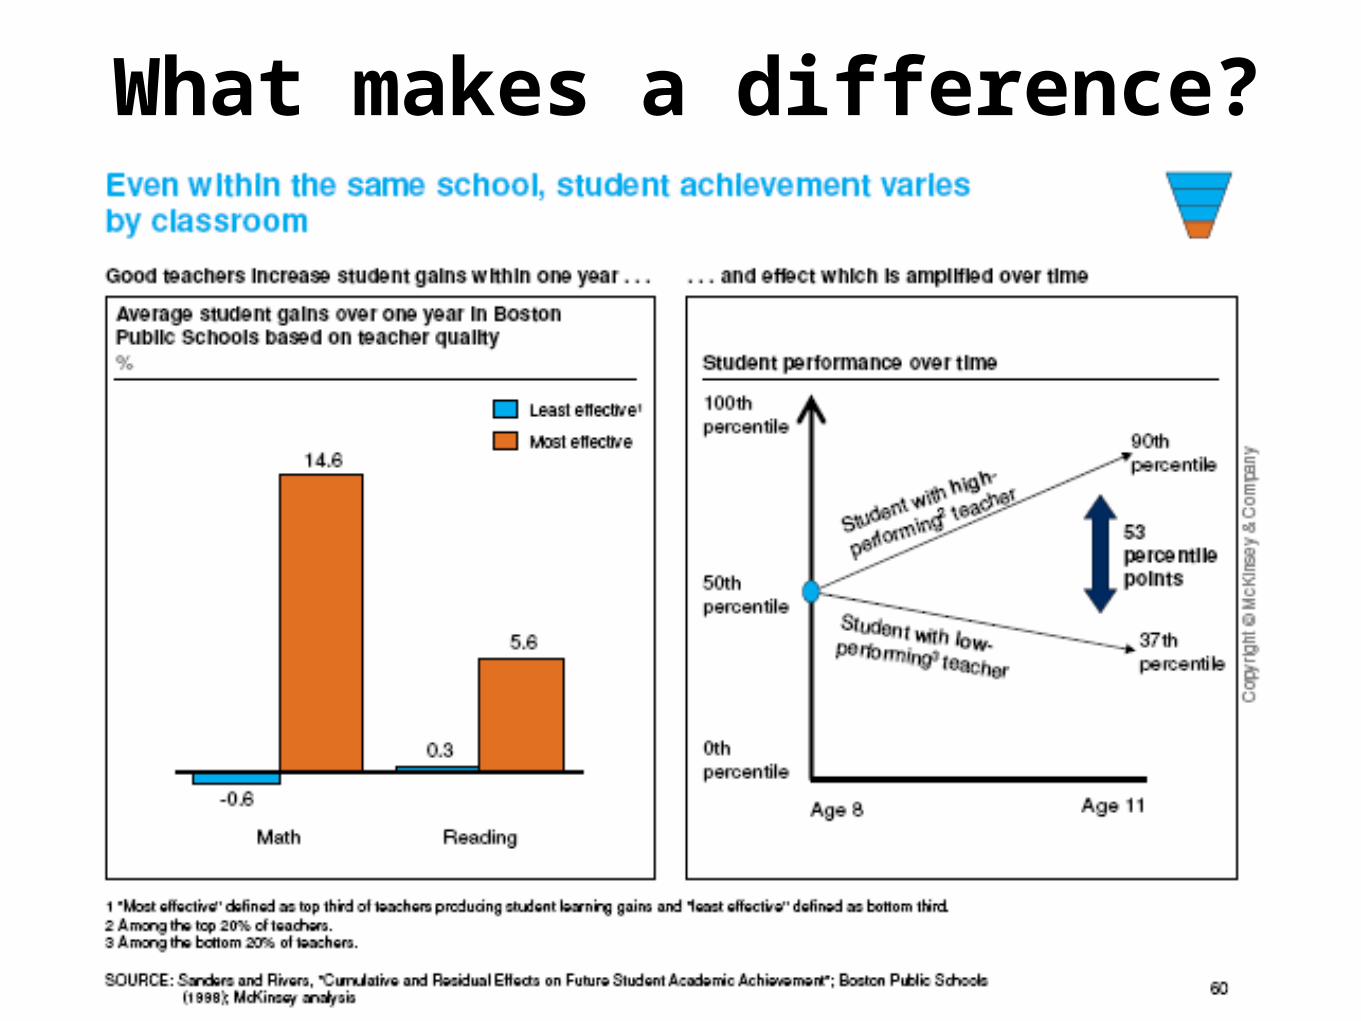
What makes a difference?
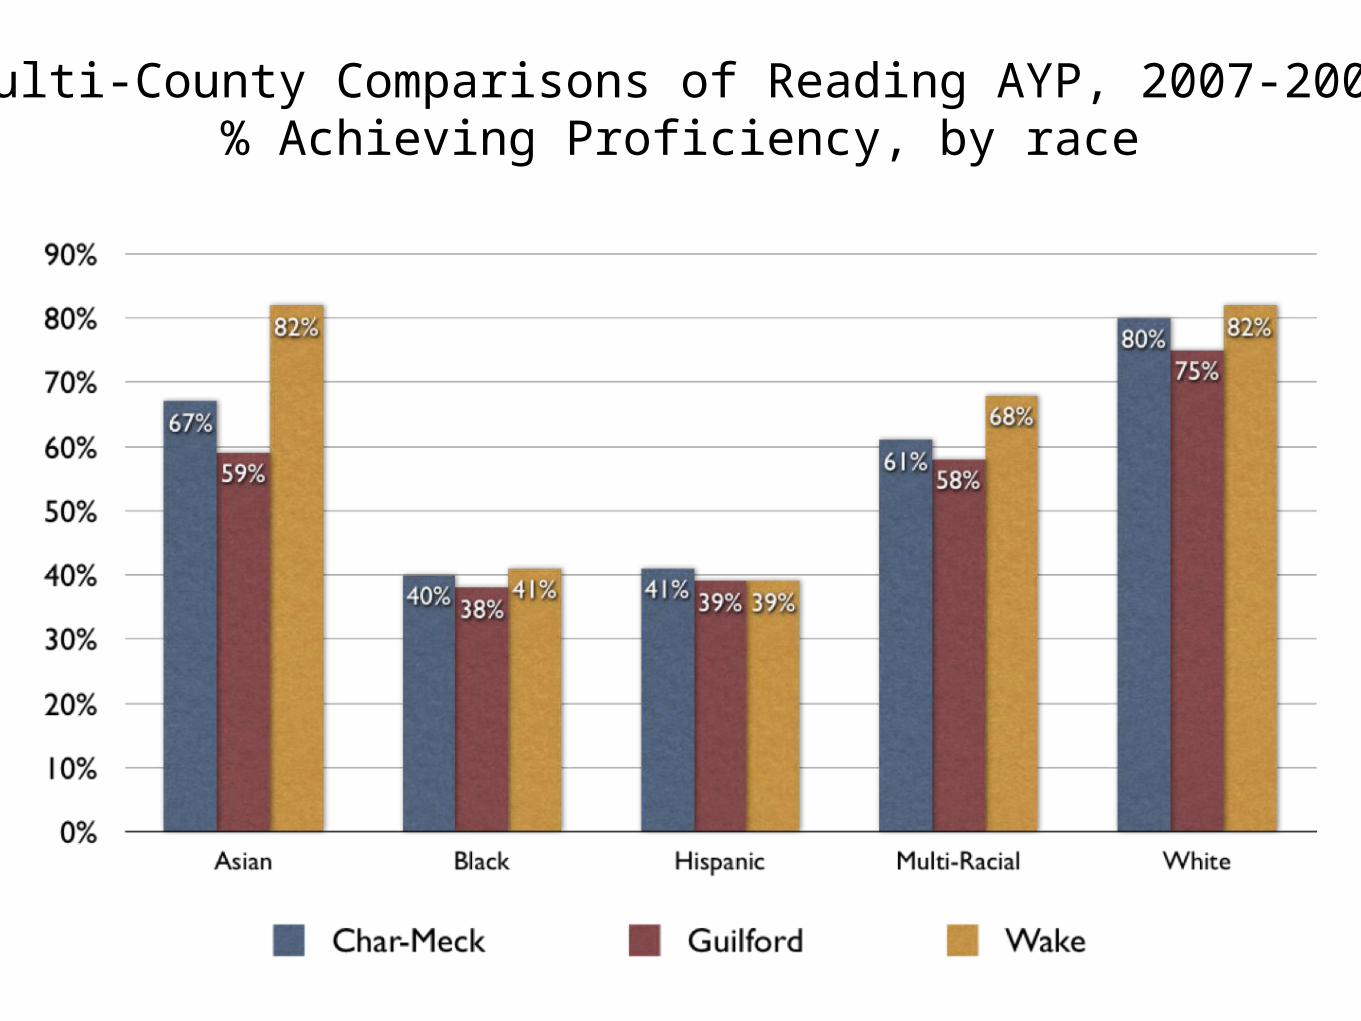
Multi-County Comparisons of Reading AYP, 2007-2008% Achieving Proficiency, by race
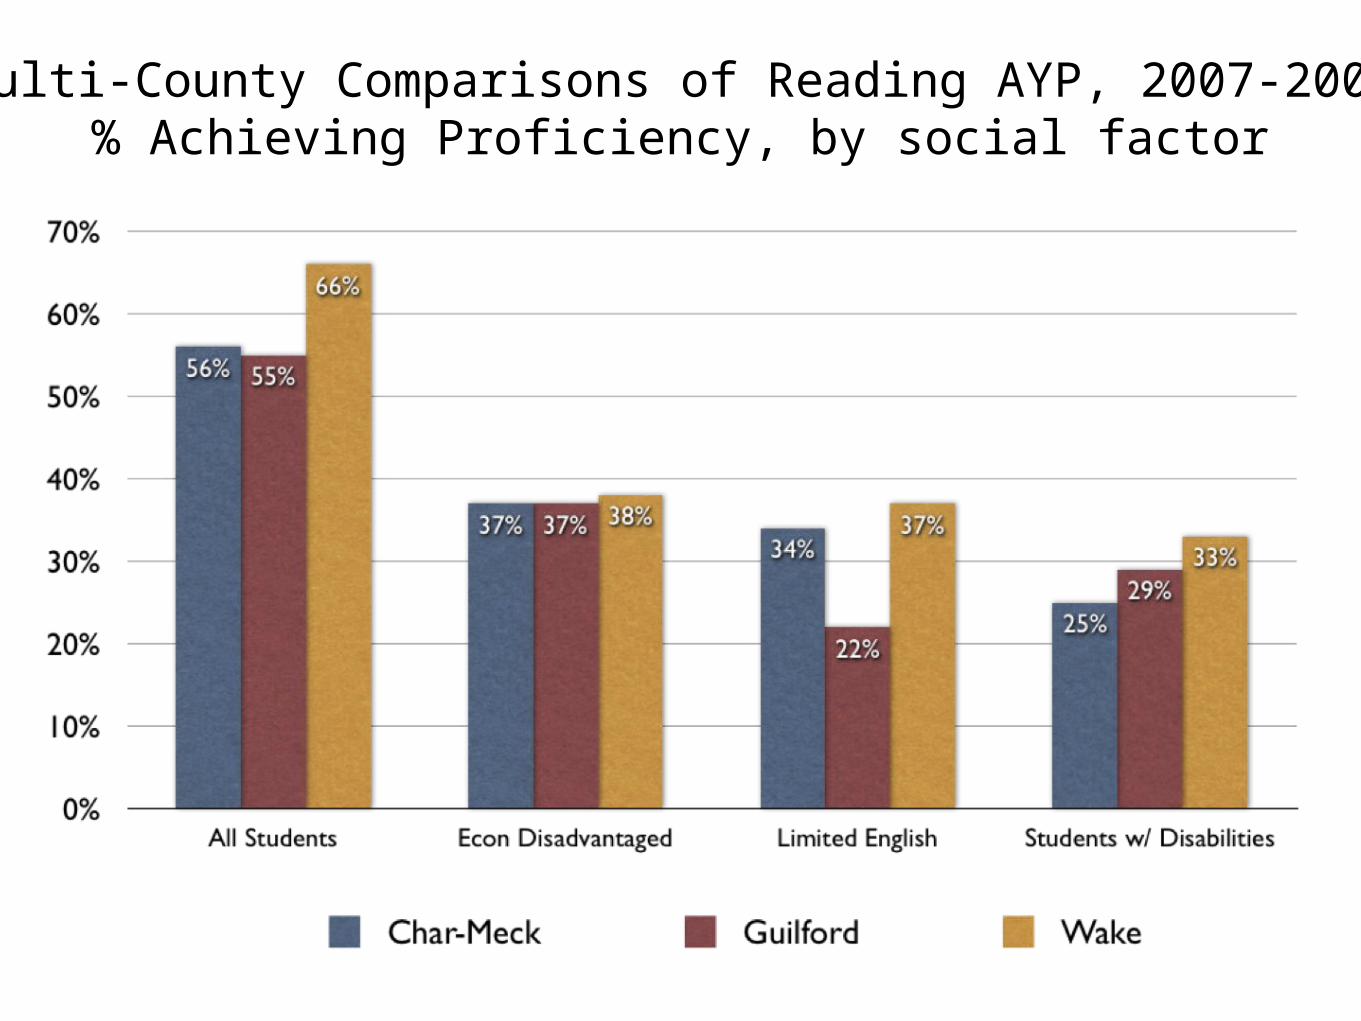
Multi-County Comparisons of Reading AYP, 2007-2008% Achieving Proficiency, by social factor
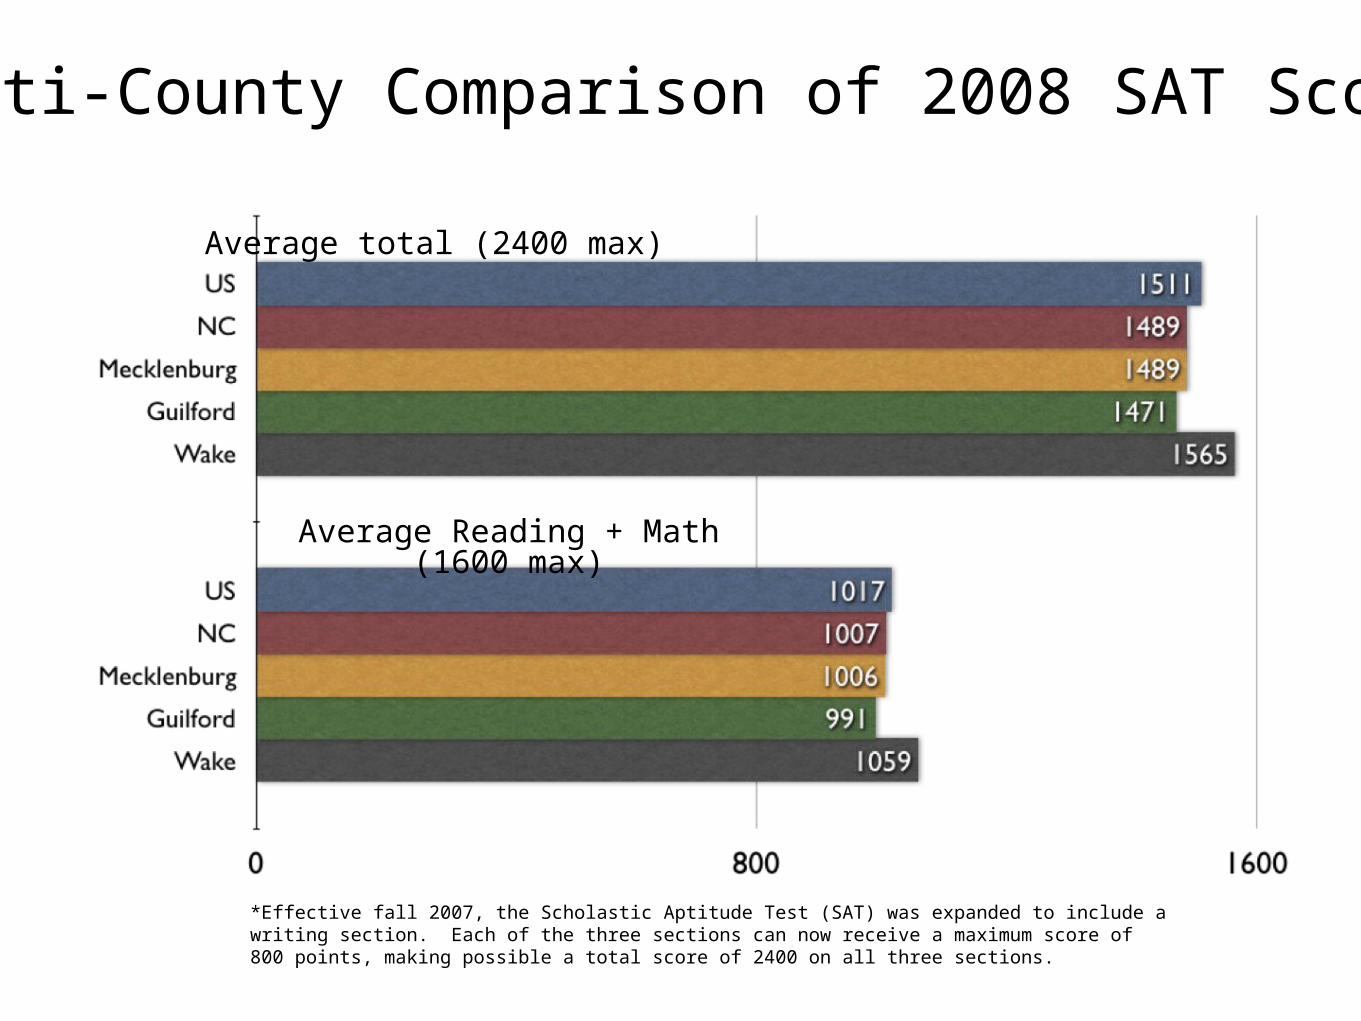
Multi-County Comparison of 2008 SAT Scores*
Average total (2400 max)
Average Reading + Math (1600 max)
*Effective fall 2007, the Scholastic Aptitude Test (SAT) was expanded to include a writing section. Each of the three sections can now receive a maximum score of 800 points, making possible a total score of 2400 on all three sections.
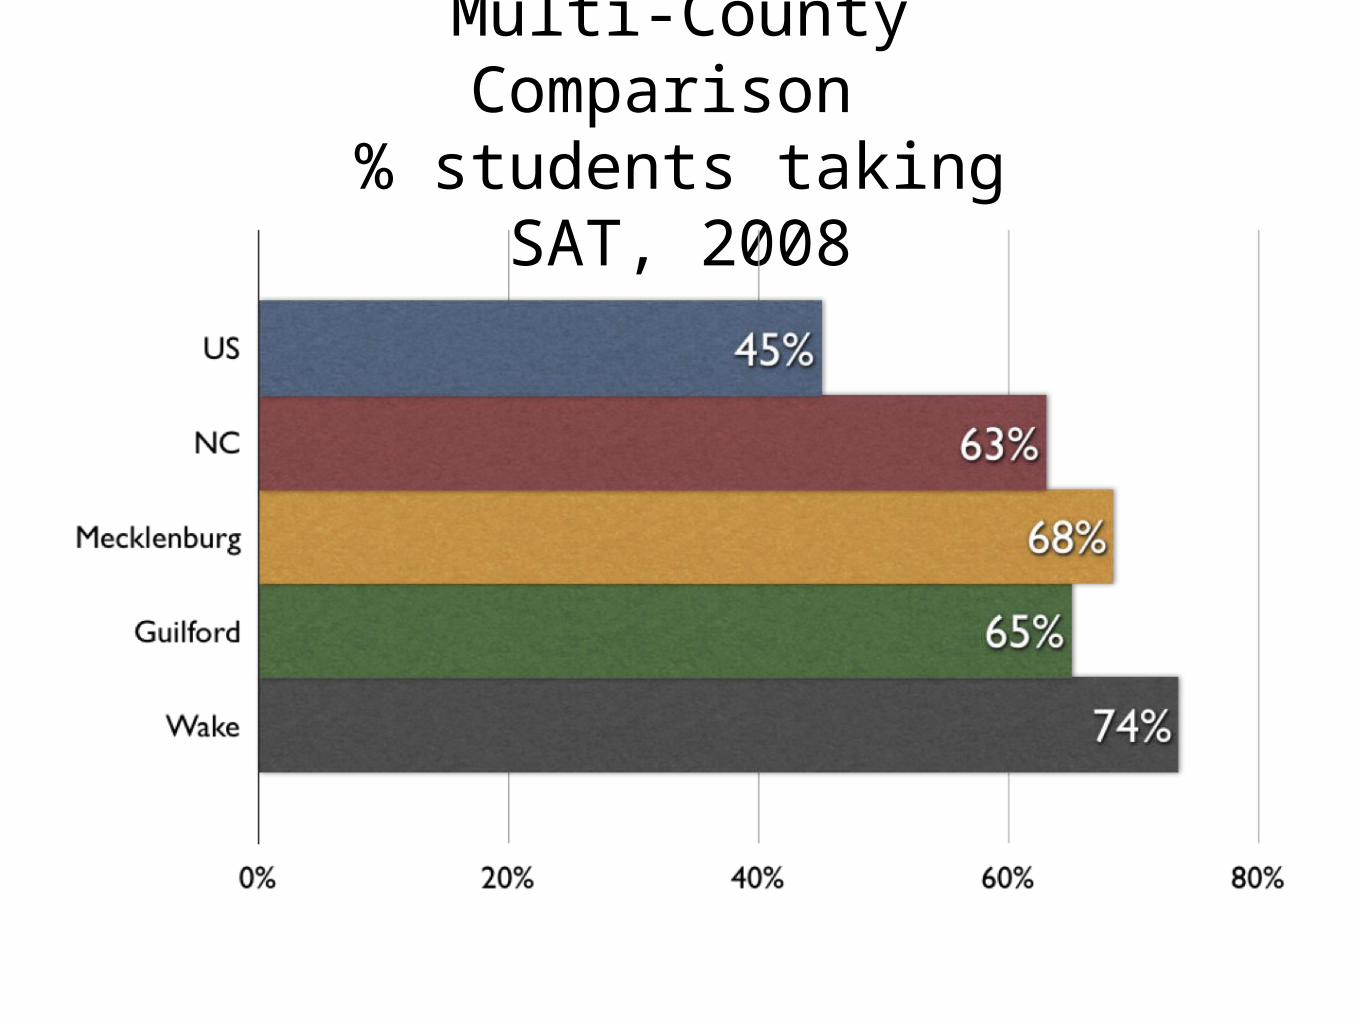
Multi-County Comparison
% students taking SAT, 2008
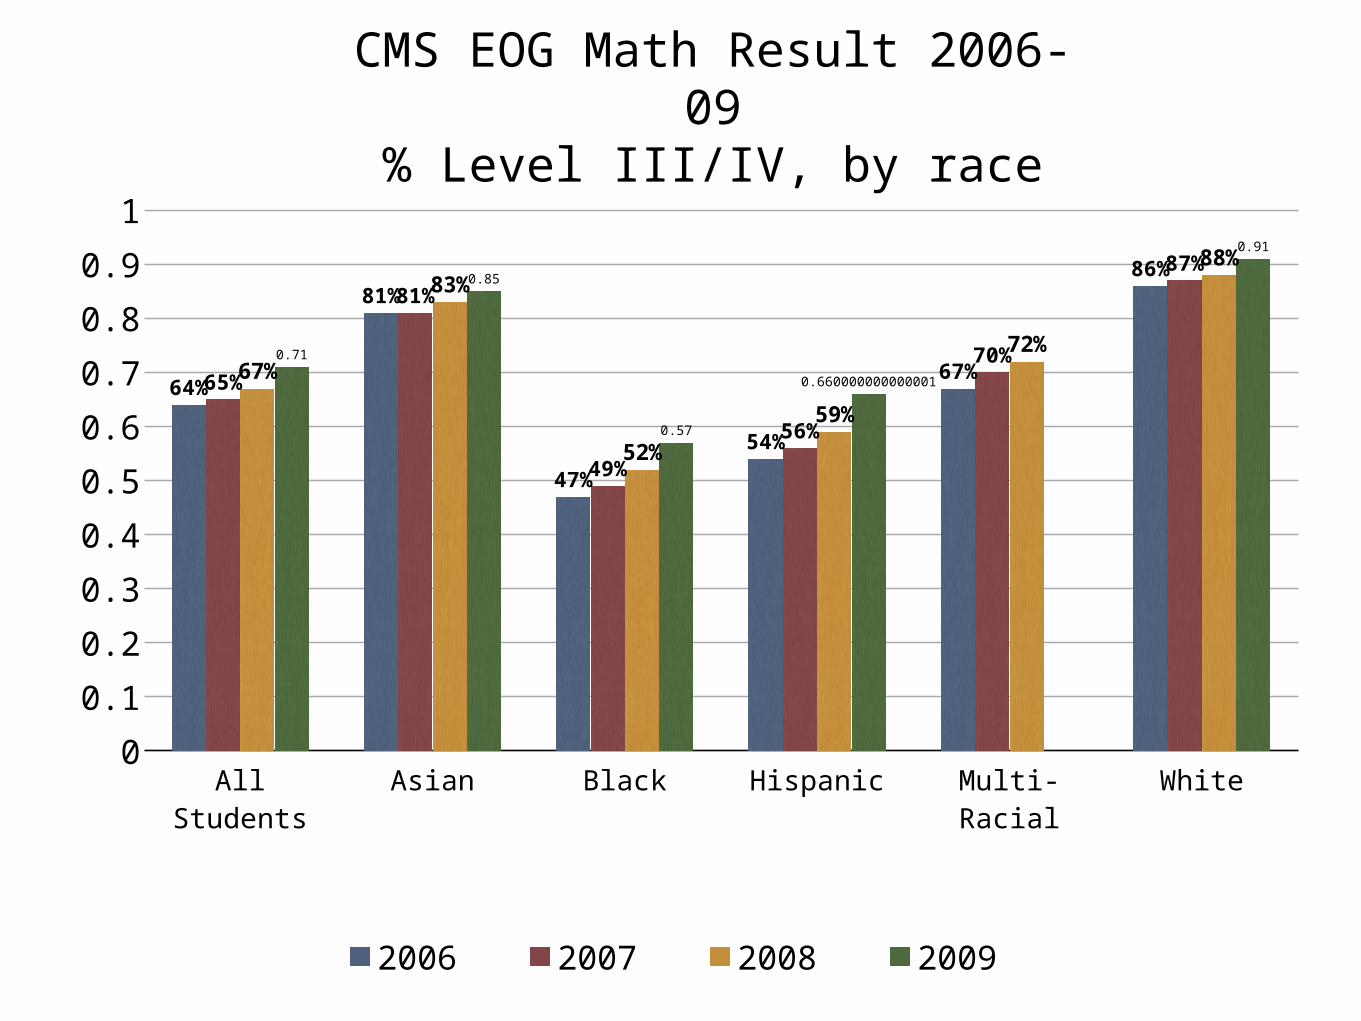
CMS EOG Math Result 2006-09
% Level III/IV, by race
All Students Asian Black Hispanic Multi-Racial White0
0.1
0.2
0.3
0.4
0.5
0.6
0.7
0.8
0.9
1
64%
81%
47%
54%
67%
86%
65%
81%
49%
56%
70%
87%
67%
83%
52%
59%
72%
88%
0.71
0.85
0.57
0.660000000000001
0.91
2006 2007 2008 2009
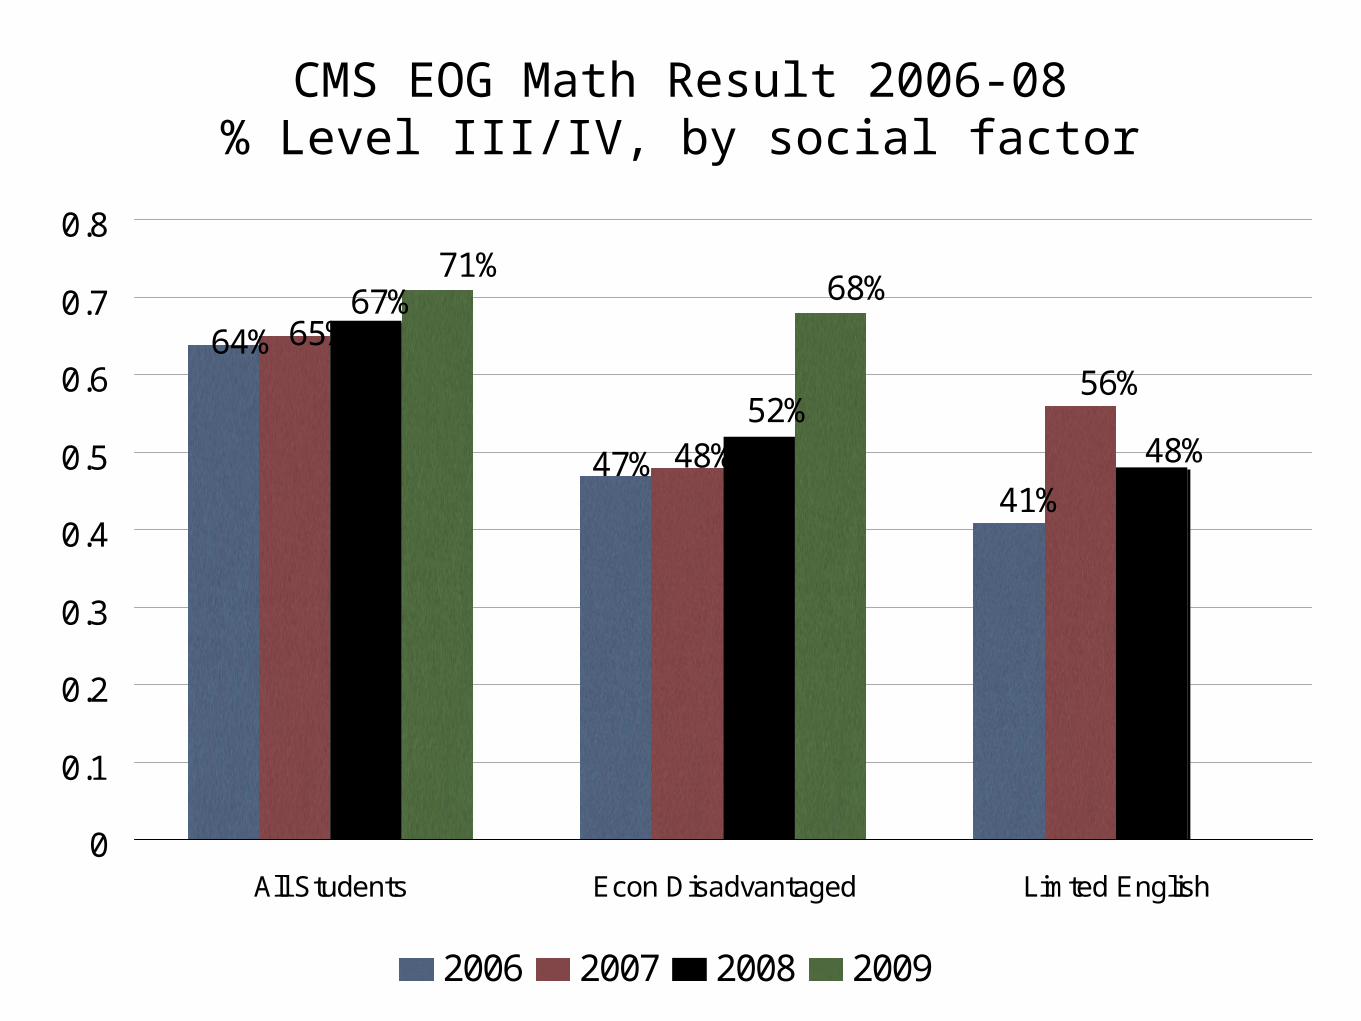
CMS EOG Math Result 2006-08% Level III/IV, by social factor
47%
64%
41%
56%
48%
65%
52%48%
67%71%
68%
0
0.1
0.2
0.3
0.4
0.5
0.6
0.7
0.8
All Students Econ Disadvantaged Limted English
2006 2007 2008 2009
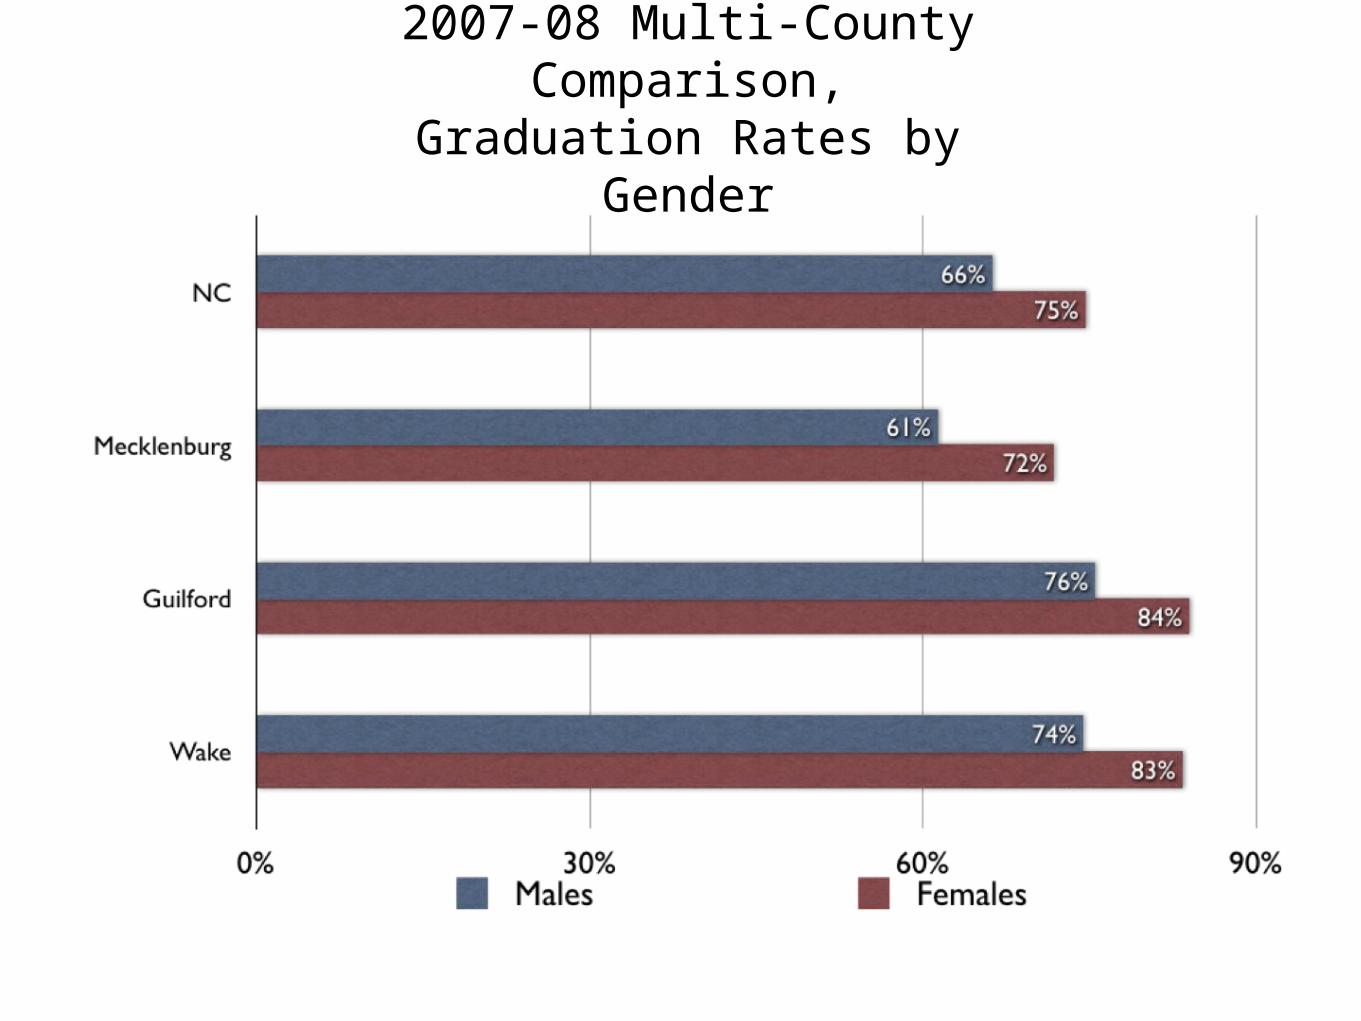
2007-08 Multi-County Comparison,
Graduation Rates by Gender
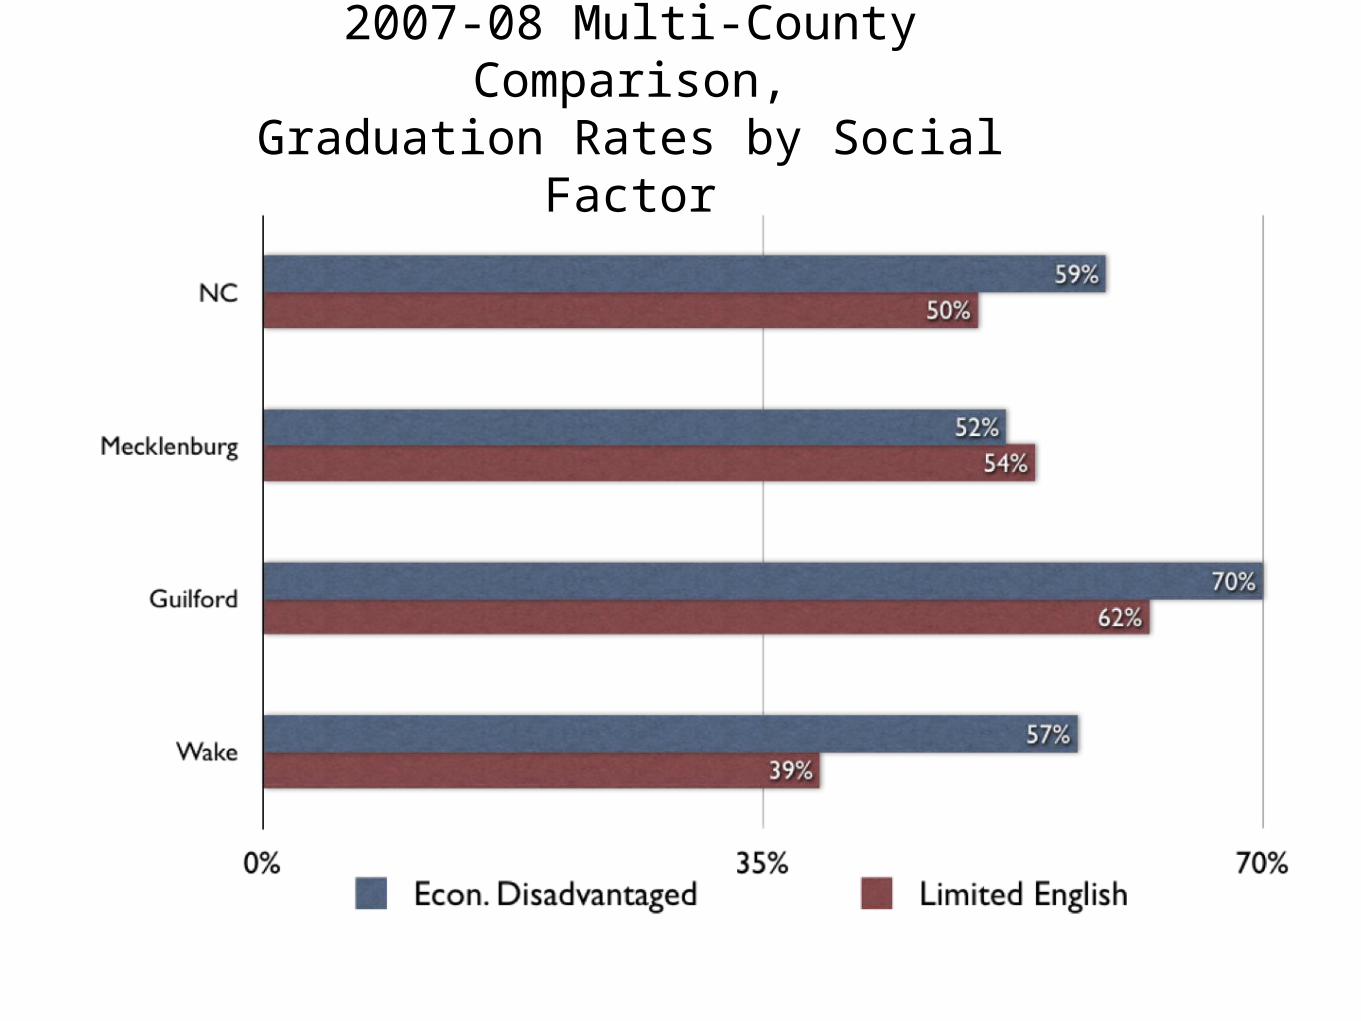
2007-08 Multi-County Comparison,Graduation Rates by Social Factor
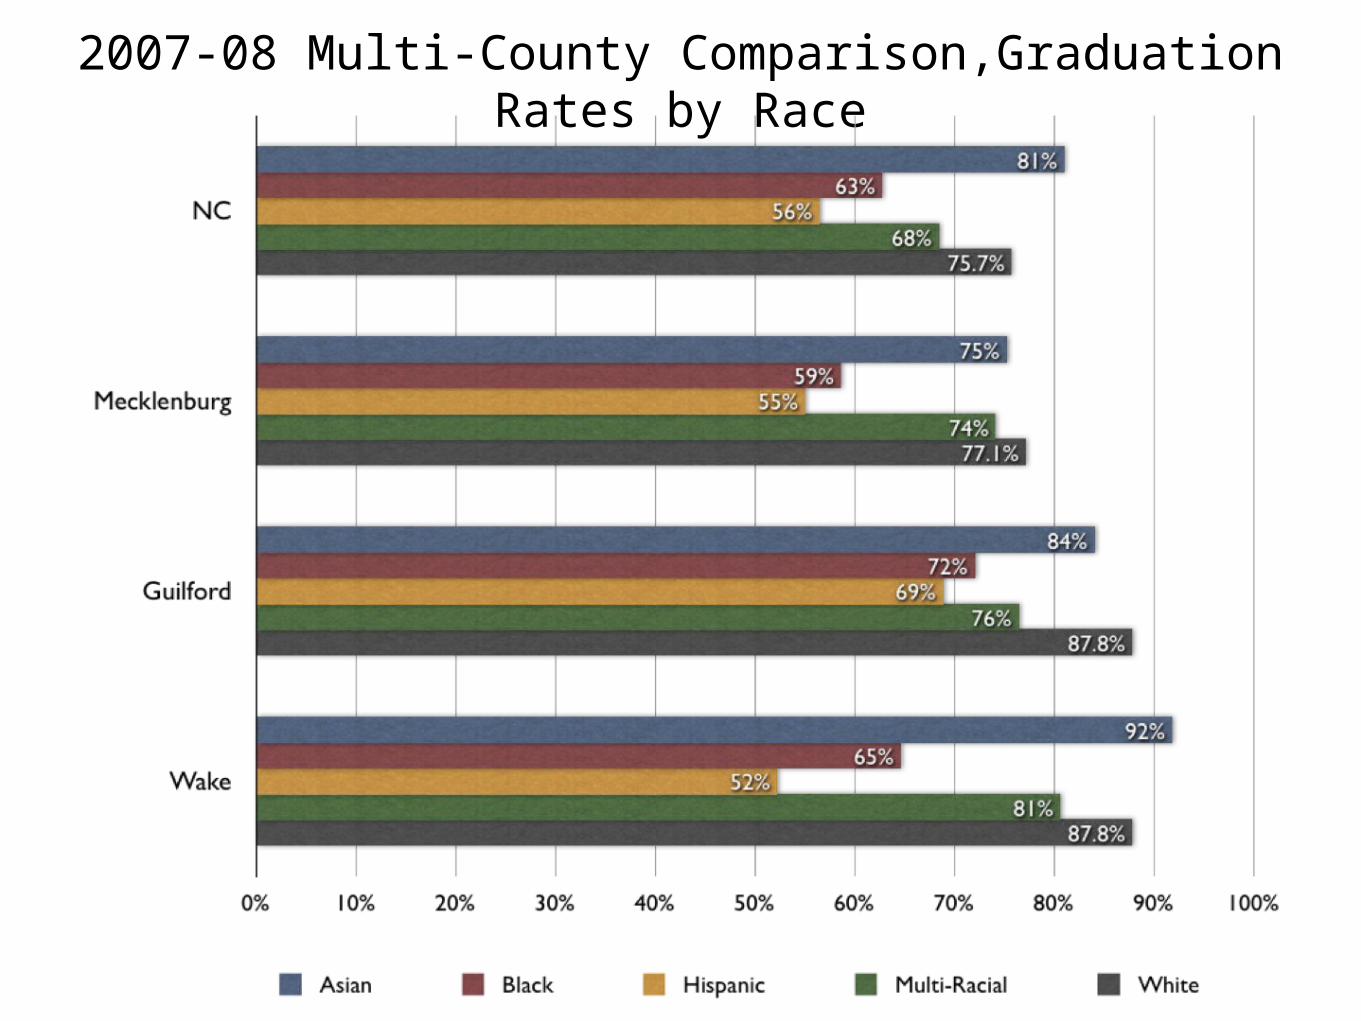
2007-08 Multi-County Comparison,Graduation Rates by Race
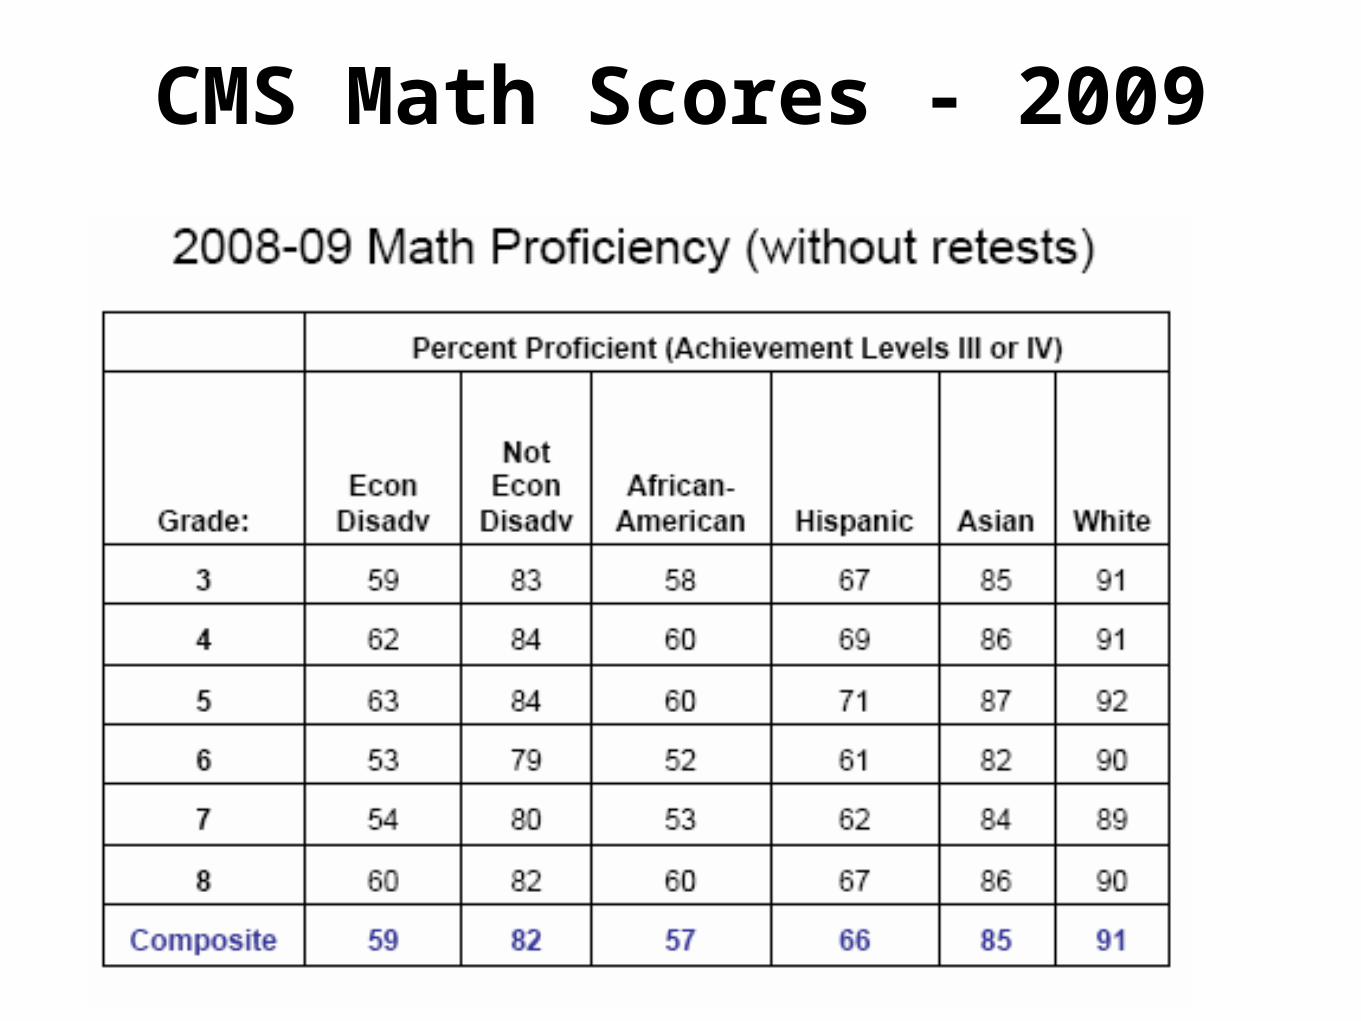
CMS Math Scores - 2009
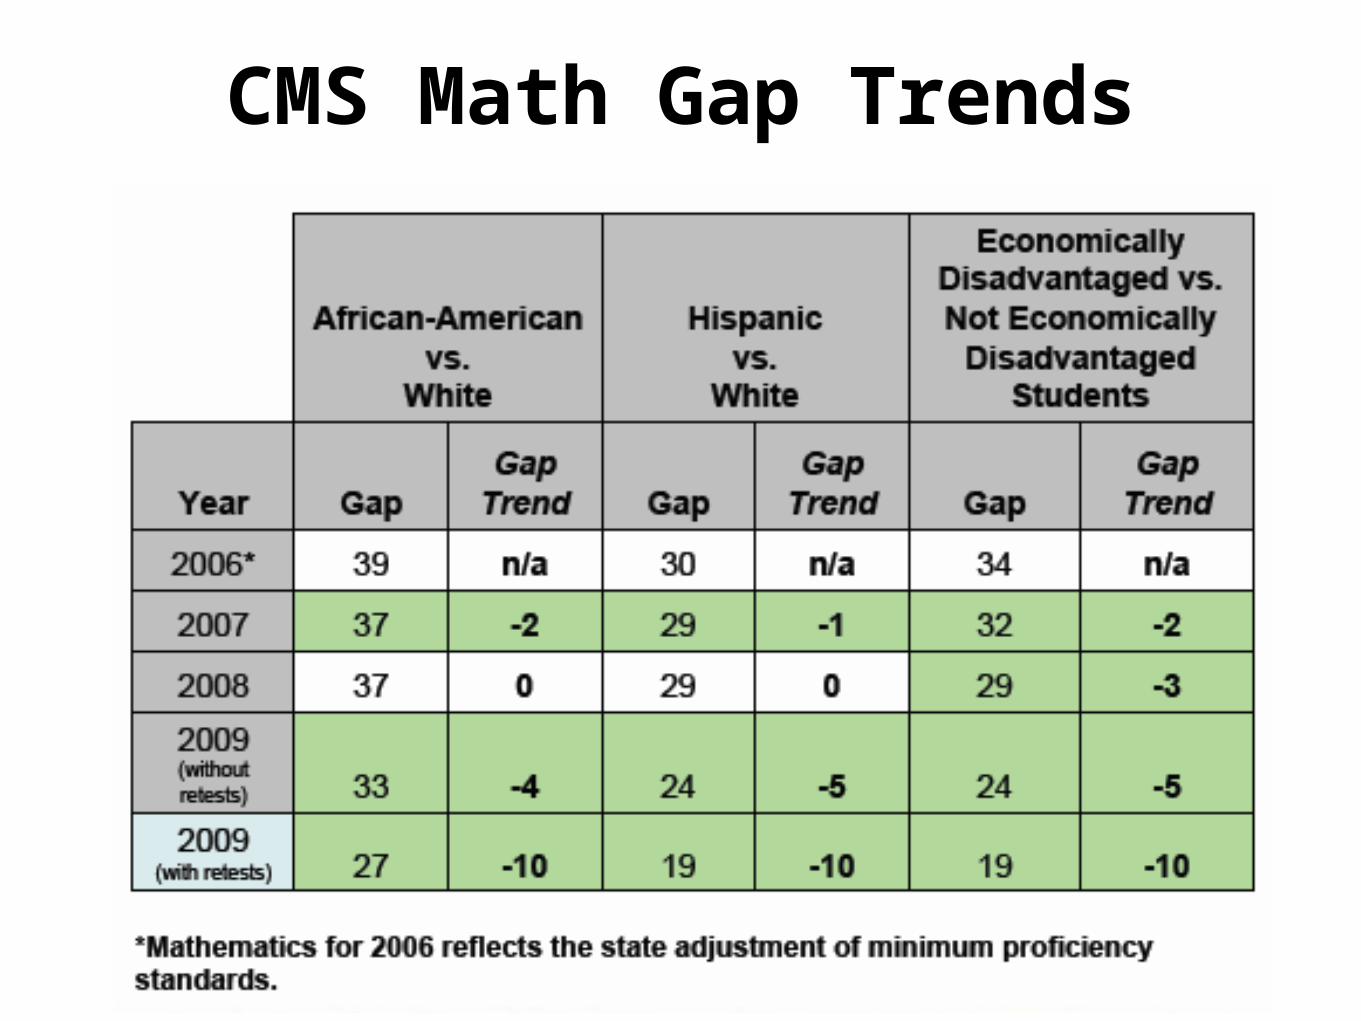
CMS Math Gap Trends
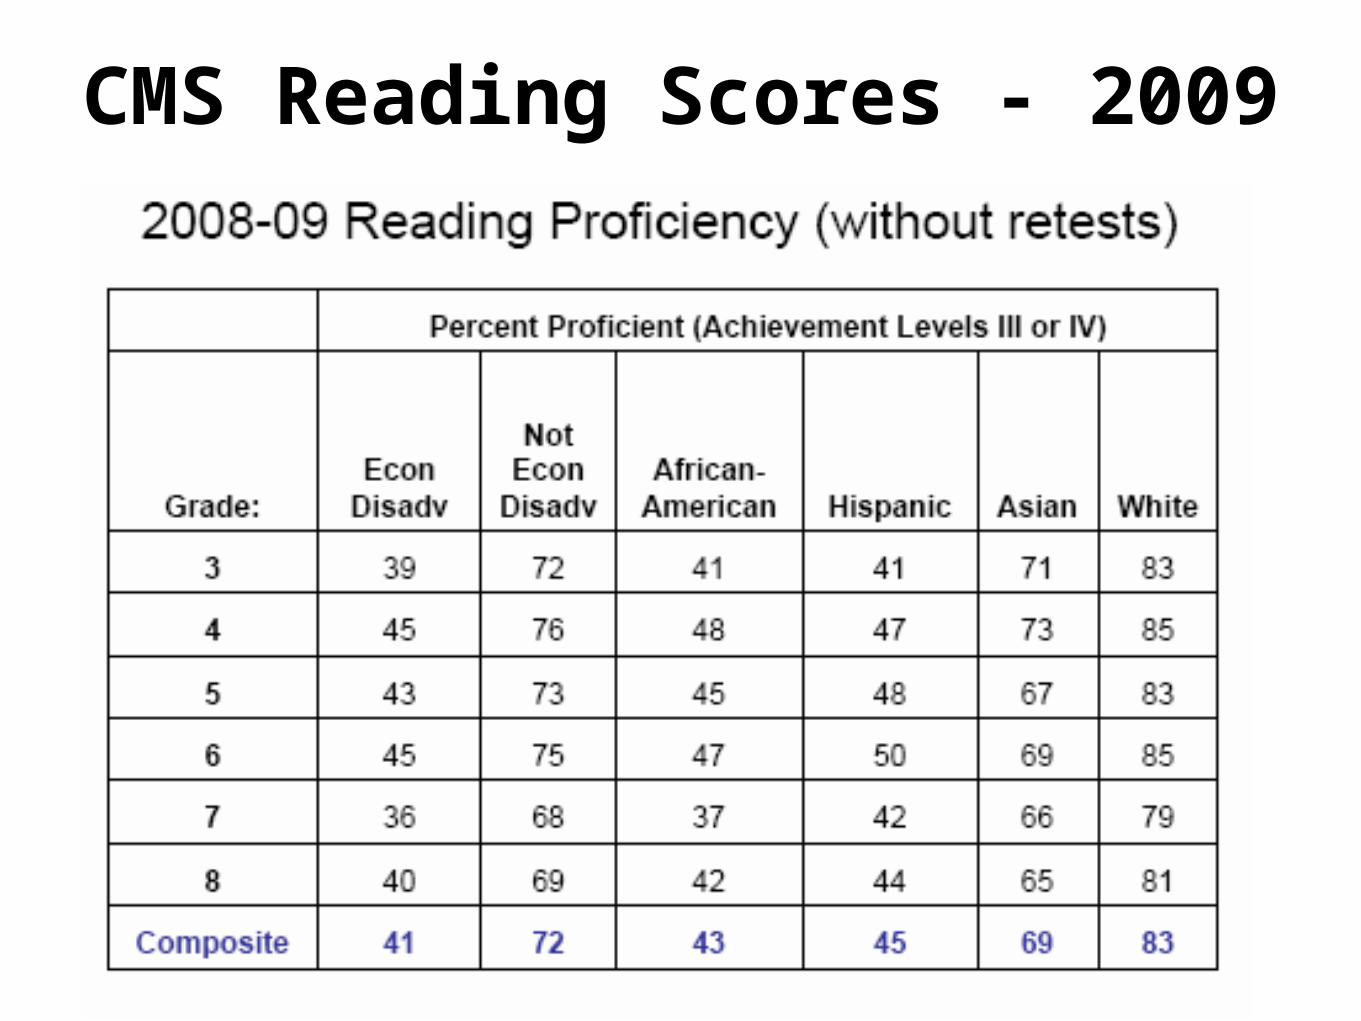
CMS Reading Scores - 2009
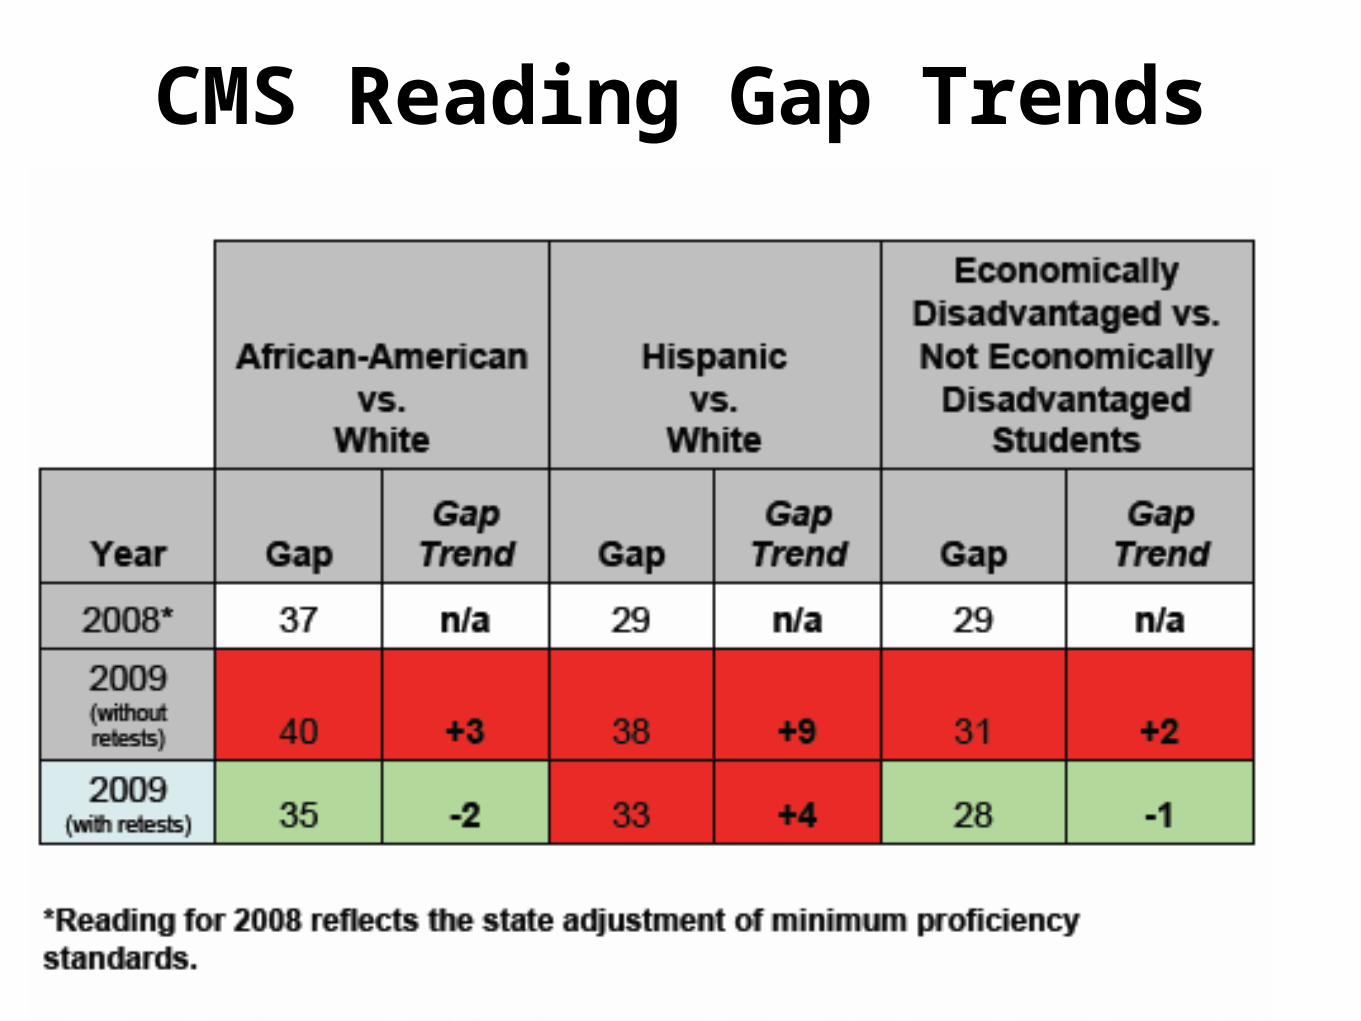
CMS Reading Gap Trends
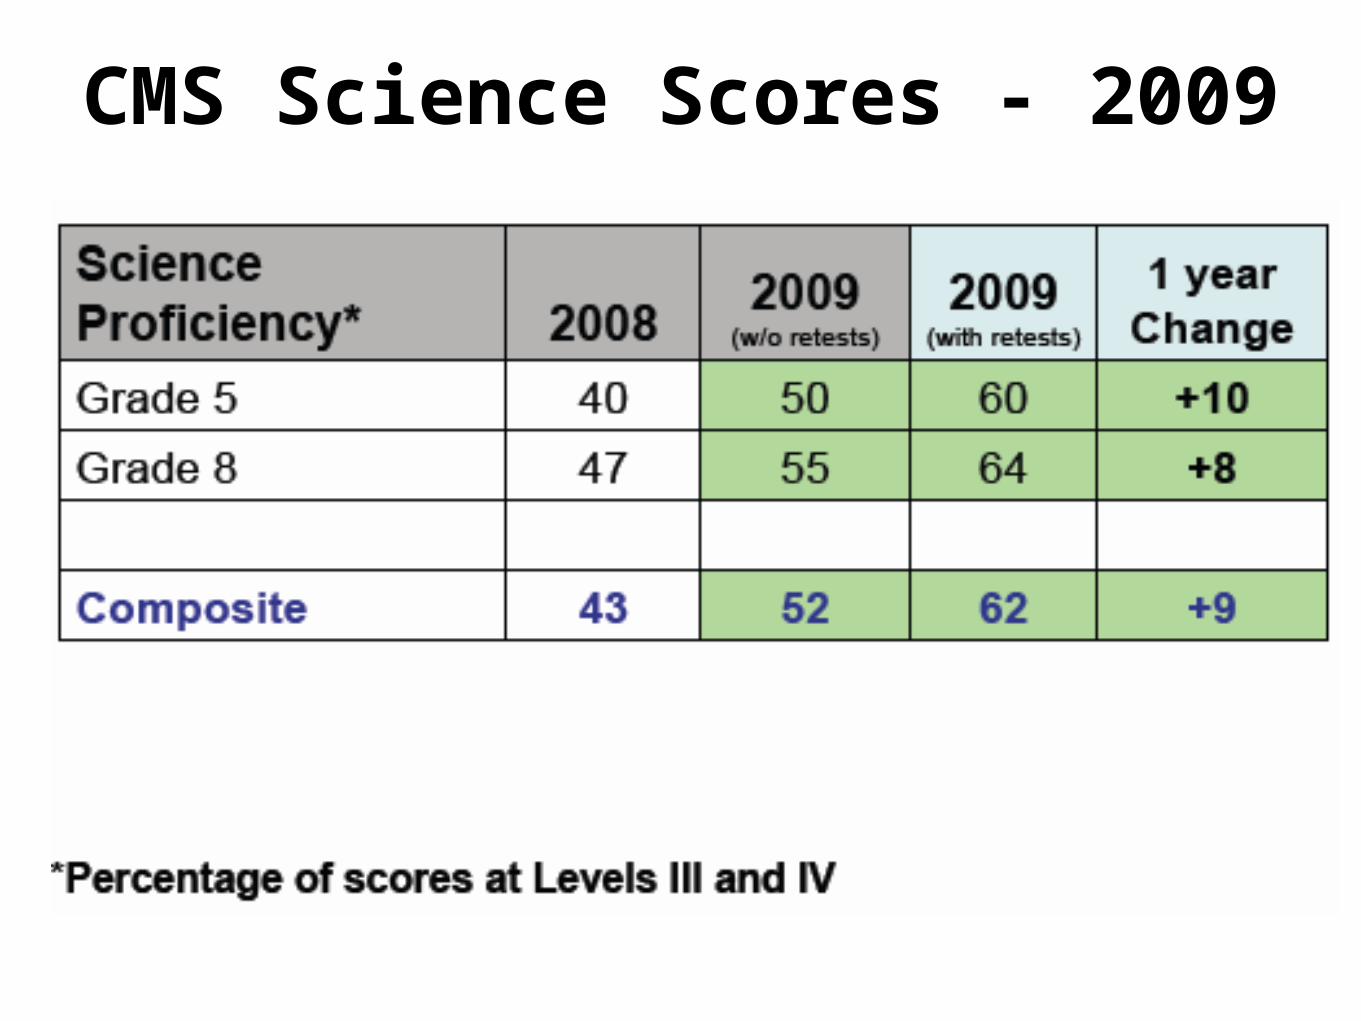
CMS Science Scores - 2009
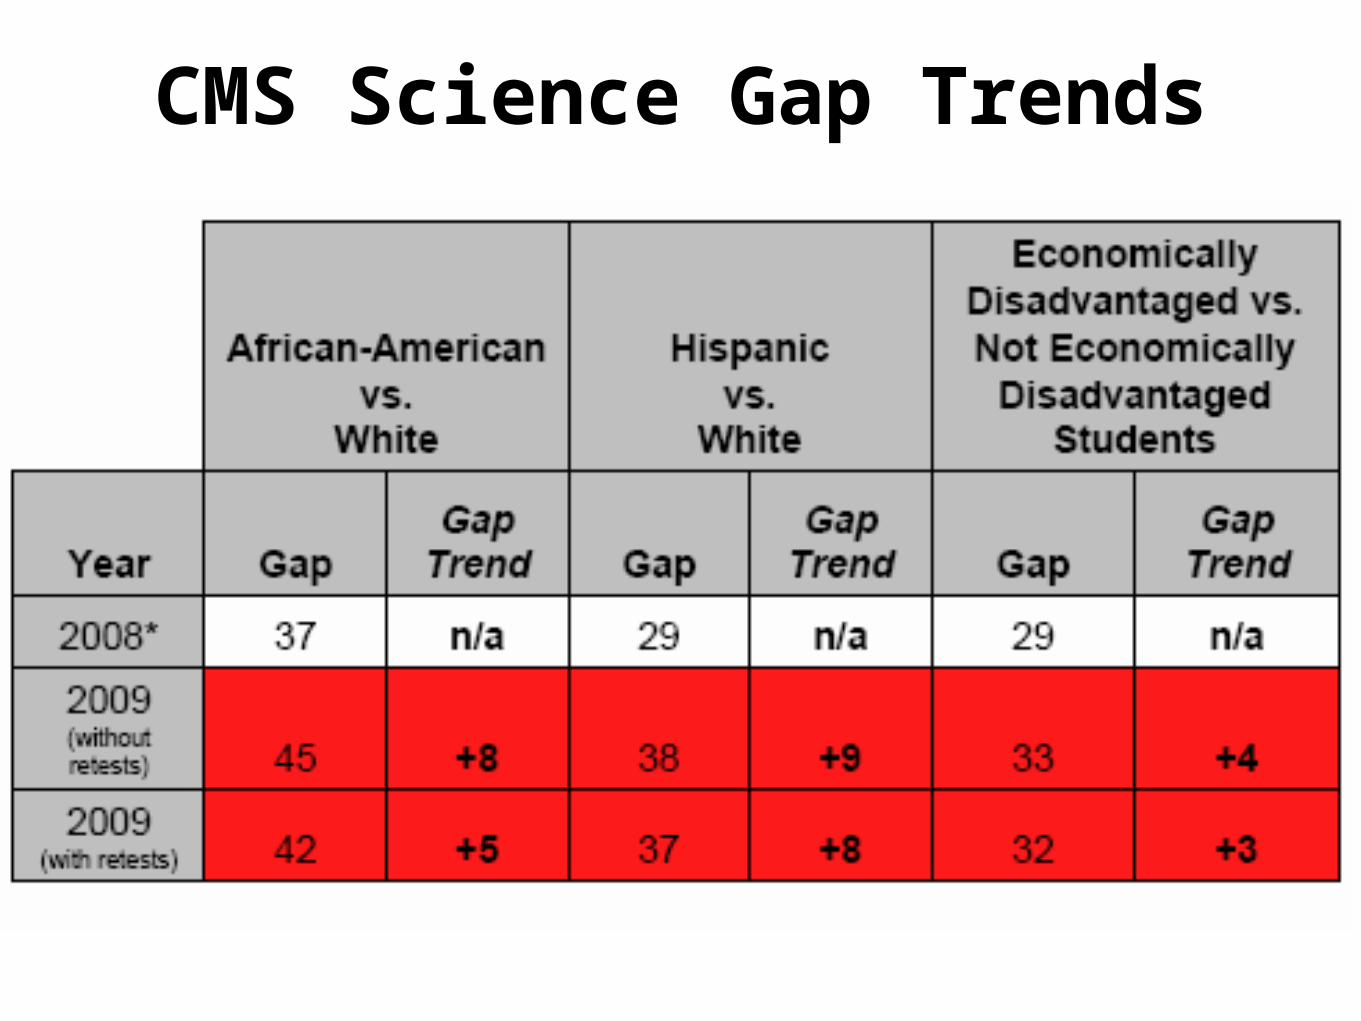
CMS Science Gap Trends
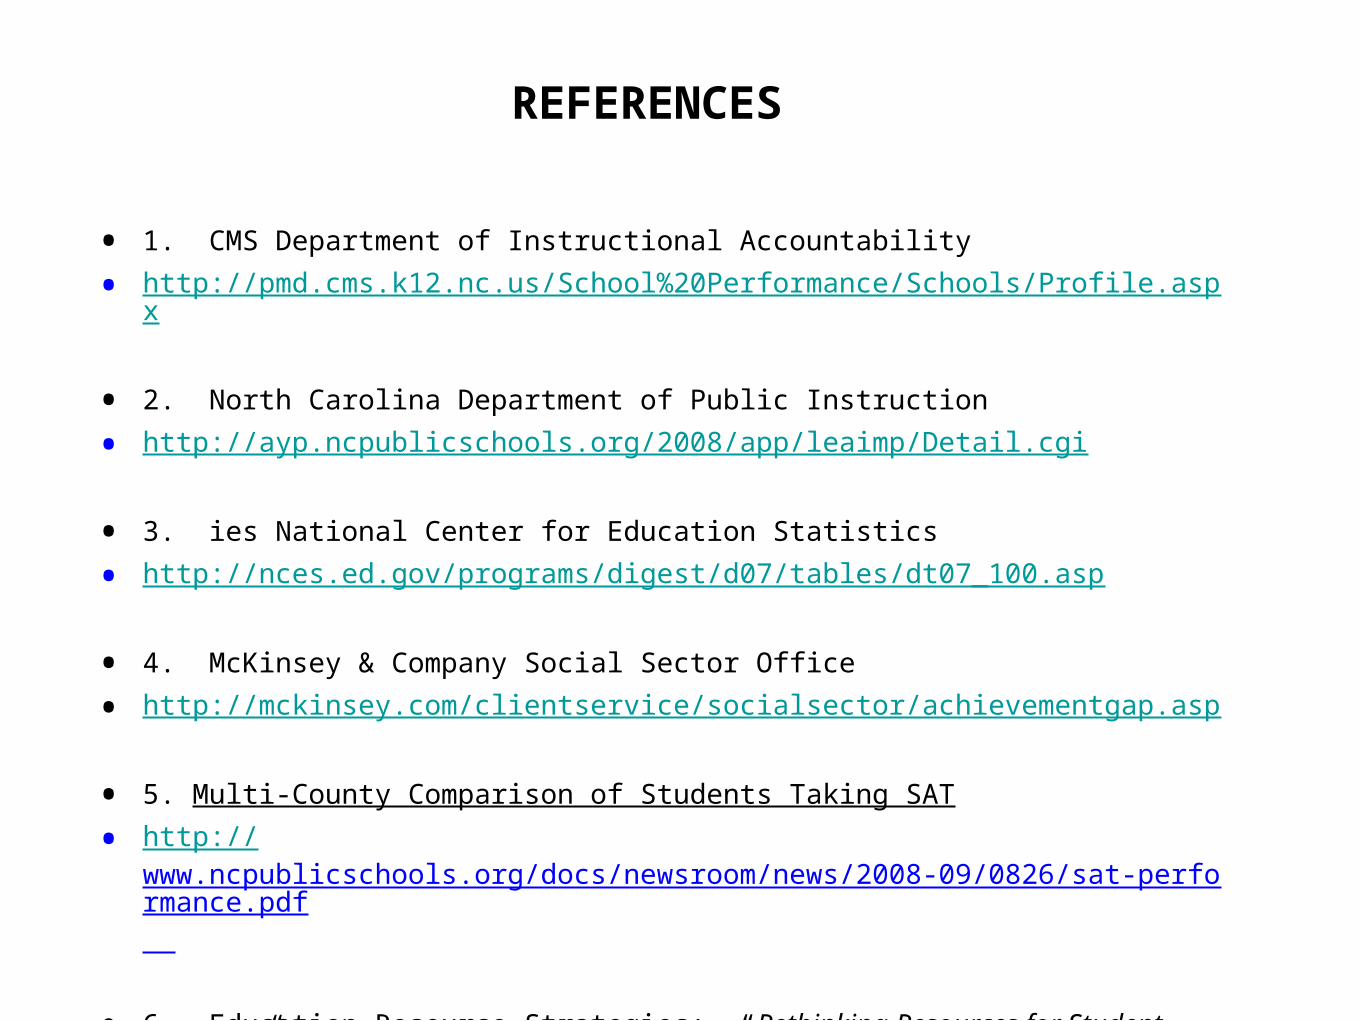
• 1. CMS Department of Instructional Accountability
• http://pmd.cms.k12.nc.us/School%20Performance/Schools/Profile.aspx
• 2. North Carolina Department of Public Instruction
• http://ayp.ncpublicschools.org/2008/app/leaimp/Detail.cgi
• 3. ies National Center for Education Statistics
• http://nces.ed.gov/programs/digest/d07/tables/dt07_100.asp
• 4. McKinsey & Company Social Sector Office
• http://mckinsey.com/clientservice/socialsector/achievementgap.asp
• 5. Multi-County Comparison of Students Taking SAT
• http://www.ncpublicschools.org/docs/newsroom/news/2008-09/0826/sat-performance.pdf
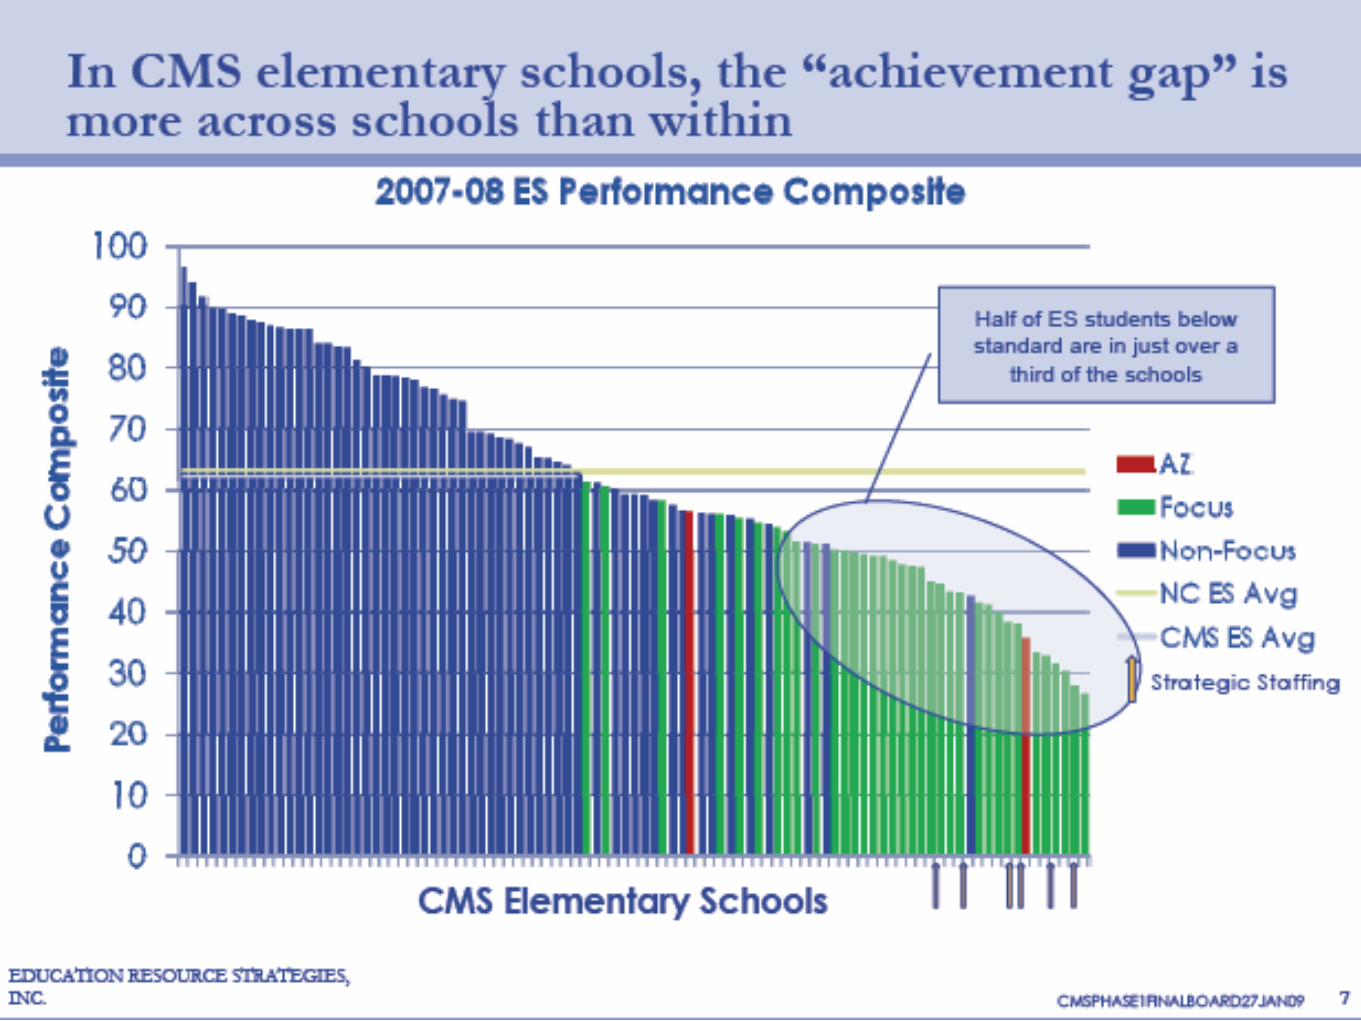
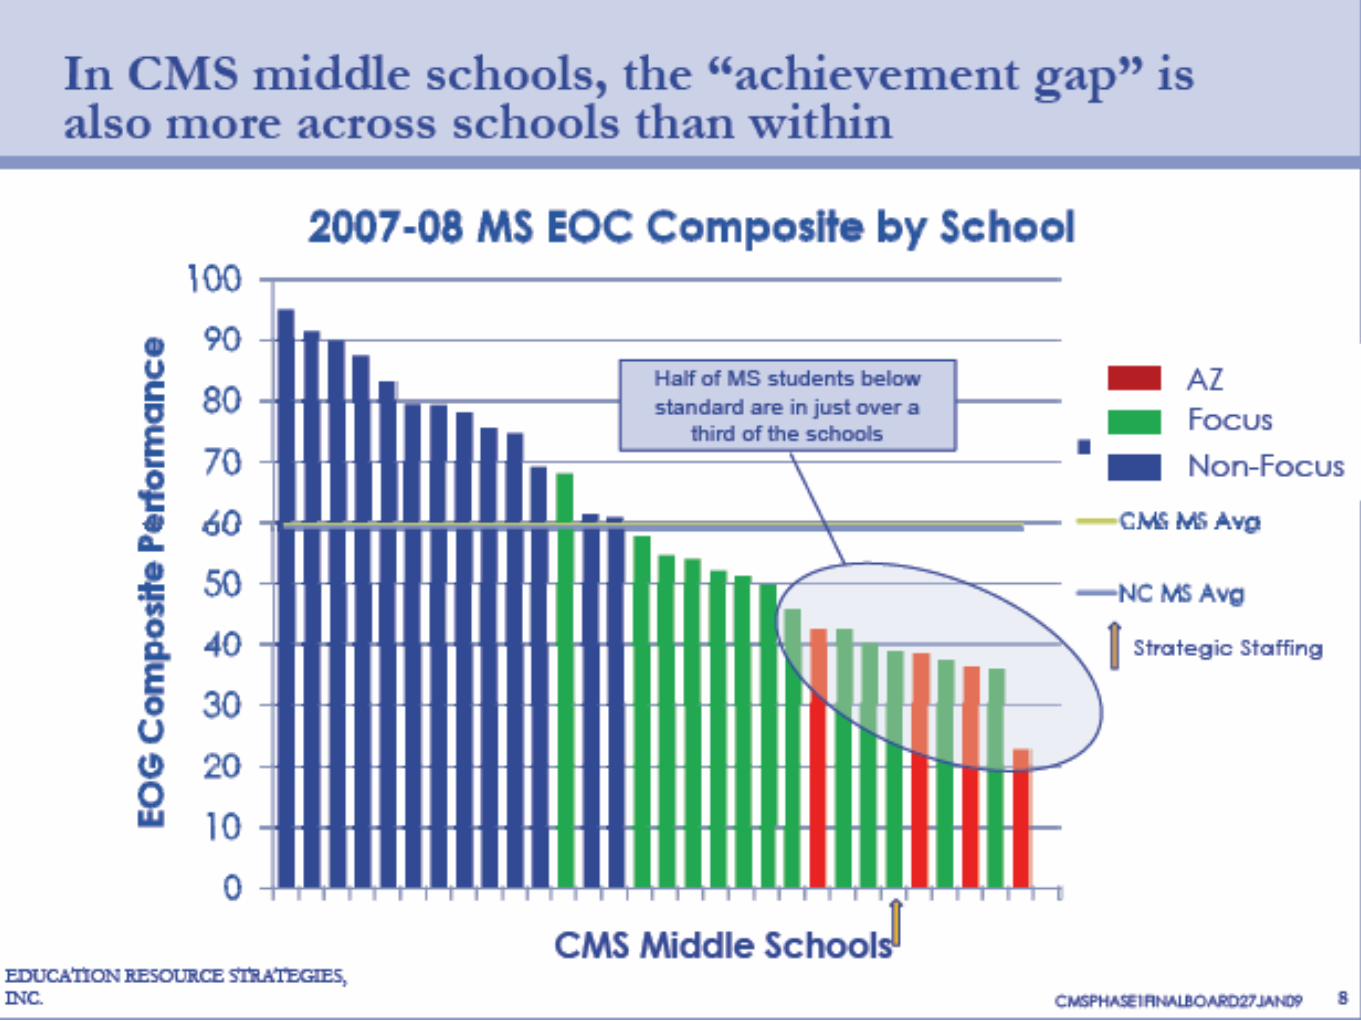
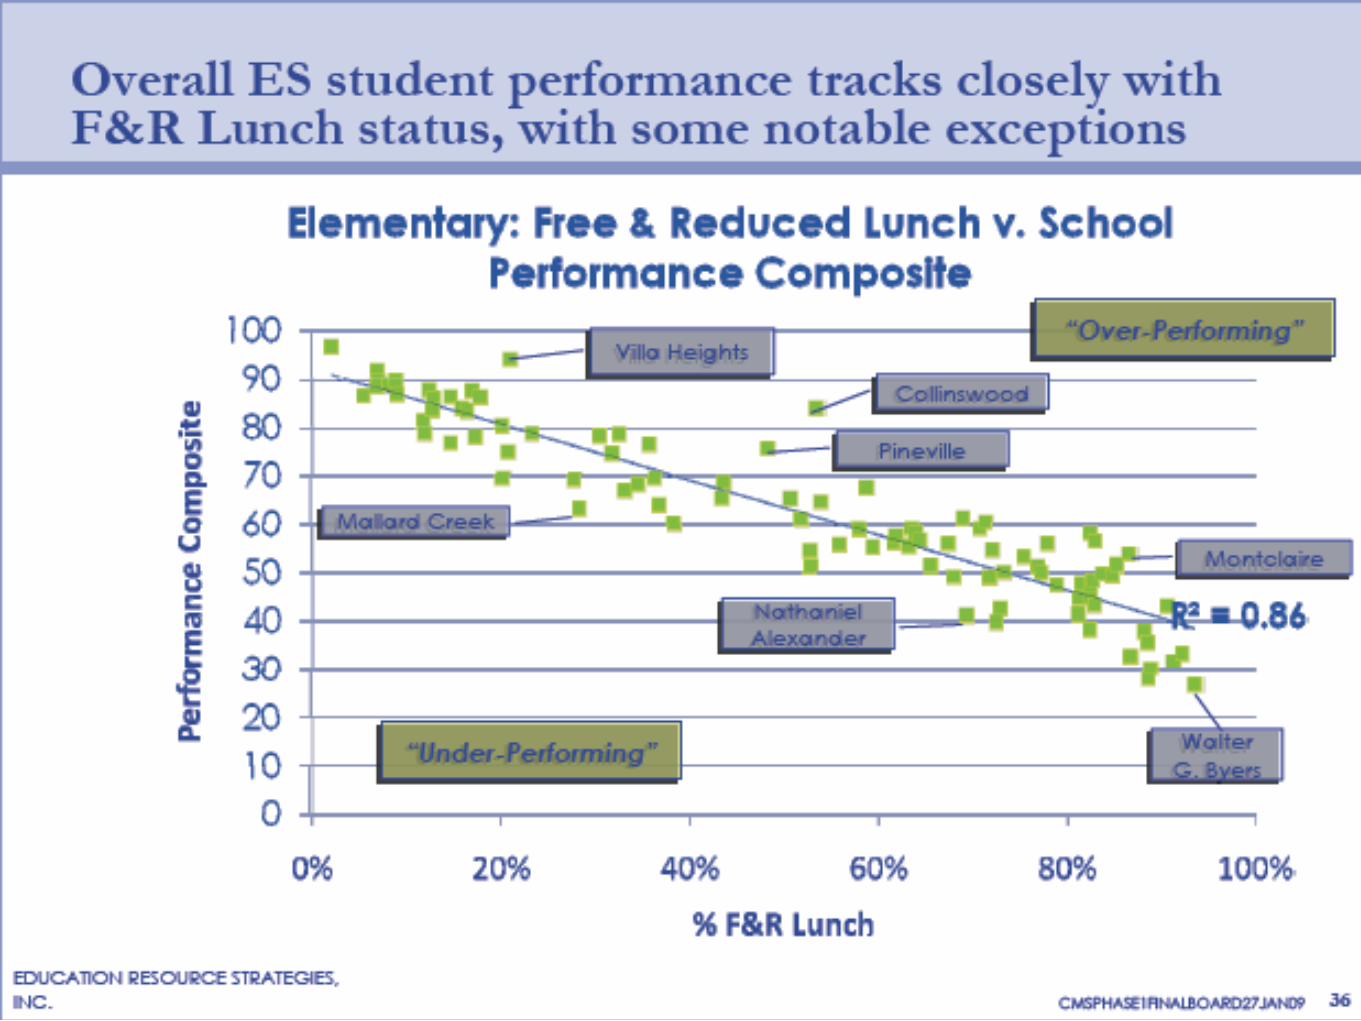
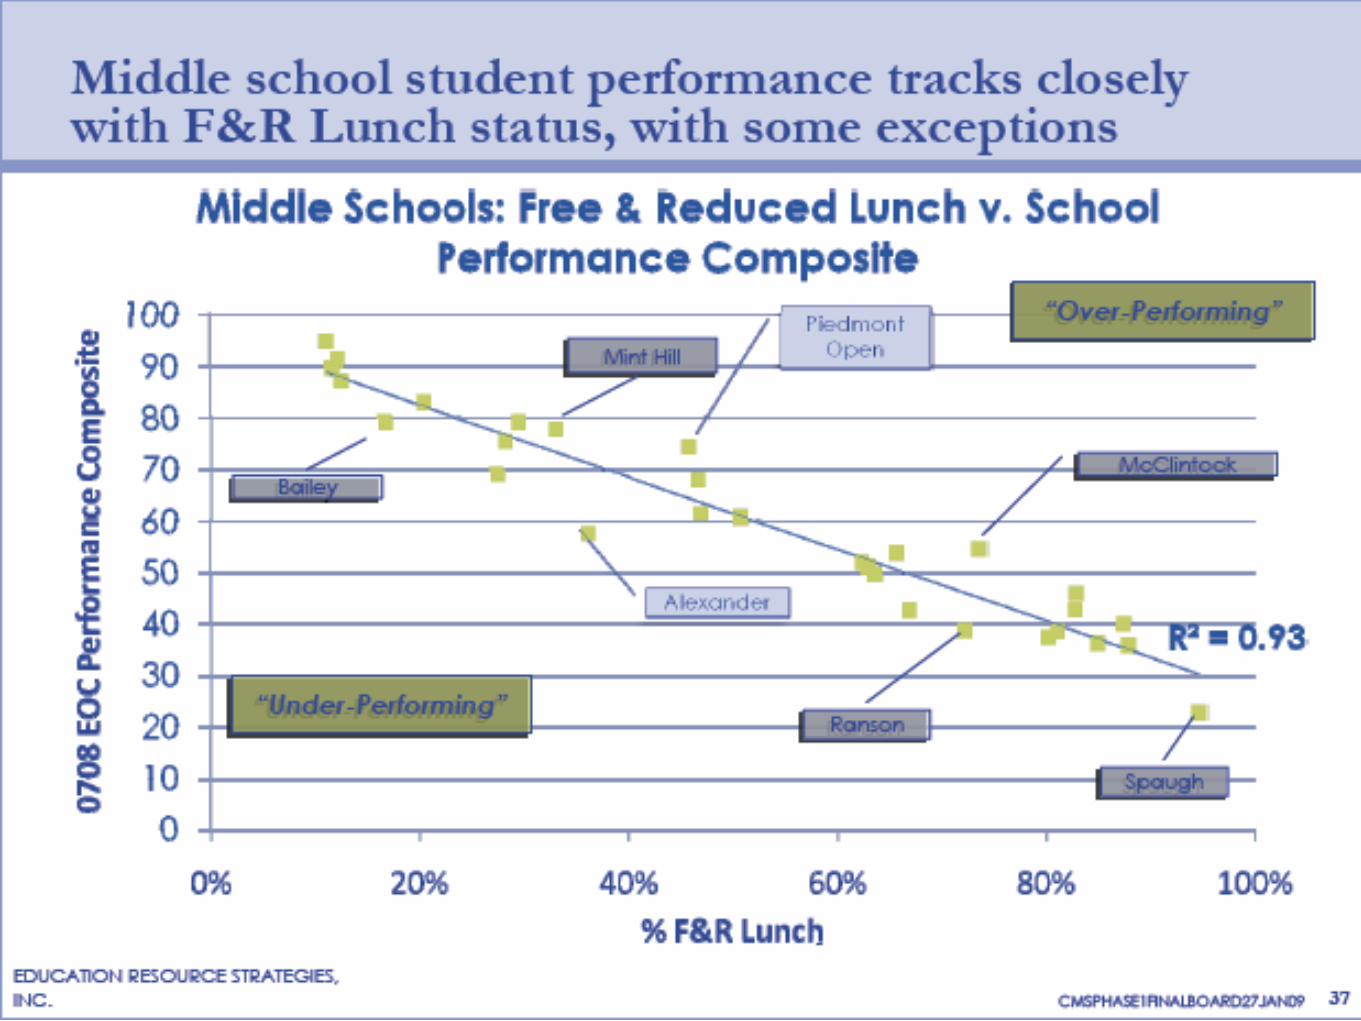
• 6. Education Resource Strategies: “Rethinking Resources for Student Success,” January 27, 2009
REFERENCES