Embed Size (px)
Citation preview
Trends in Employee Recognition
A Report by WorldatWork,
Underwritten by ITA Group
May 2015
About WorldatWork® – The Total Rewards Association
WorldatWork (www.worldatwork.org) is a nonprofit human resources association for
professionals and organizations focused on compensation, benefits, work-life effec-
tiveness and total rewards – strategies to attract, motivate and retain an engaged and
productive workforce. WorldatWork and its affiliates provide comprehensive education,
certification, research, advocacy and community, enhancing careers of professionals
and, ultimately, achieving better results for the organizations they serve. WorldatWork
has more than 65,000 members and subscribers worldwide; 80 percent of Fortune 500
companies employ a WorldatWork member. Founded in 1955, WorldaWork is affiliated
with more than 70 local human resources associations and has offices in Scottsdale,
Ariz., and Washington, D.C.
WorldatWork Society of Certified Professionals® is the certifying body for six presti-
gious designations: the Certified Compensation Professional® (CCP®), Certified Benefits
Professional® (CBP), Global Remuneration Professional (GRP®), Work-Life Certified
Professional® (WLCP®), Certified Sales Compensation Professional (CSCP)™ and
Certified Executive Compensation Professional (CECP)™.
The WorldatWork group of registered marks also includes: Alliance for Work-Life
Progress or AWLP, workspan and WorldatWork Journal.
Contact:
WorldatWork Customer Relations
14040 N. Northsight Blvd.
Scottsdale, Arizona USA
85260-3601
Toll free: 877-951-9191
Fax 480-483-8352
©2015 WorldatWork Any laws, regulations or other legal requirements noted in this publication are, to the best of the publisher’s knowledge, accurate and current
as of this report’s publishing date. WorldatWork is providing this information with the understanding that WorldatWork is not engaged, directly or by implication, in
rendering legal, accounting or other related professional services. You are urged to consult with an attorney, accountant or other qualified professional concerning
your own specific situation and any questions that you may have related to that.
No portion of this publication may be reproduced in any form without express written permission from WorldatWork.
ITA Group creates and manages events, incentives and recognition programs that align
and motivate your people. ITA Group is located in West Des Moines, Iowa, and also
has operations in Atlanta, Baltimore, Chicago, Charlotte, Dallas, Denver, Detroit,
Indianapolis, Los Angeles, Minneapolis, Philadelphia, Phoenix, San Francisco, Seattle
and the greater New York City area.
Visit us at www.itagroup.com to learn more.
Introduction & Methodology
This report summarizes the results of a February 2015 survey of WorldatWork members to gather information about trends in recognition programs. This survey is designed to measure specific types of recognition programs and the impact on the workforce. For the purposes of this survey, “recognition” is defined as: “a spontaneous gesture of thanks or a structured or planned program of recognition implemented to acknowledge employees and achieve desired performance.”
On Feb. 18, 2015, survey invitations were sent electronically to 6,197 WorldatWork members. Members selected for participation were participants from the WorldatWork 2013 “Trends in Employee Recognition” survey and randomly selected members. The survey was open to members in the United States, Canada and foreign countries meeting specific criteria. The survey closed on March 10, 2015, with 489 responses, an 8% response rate. The dataset was cleaned, resulting in a final dataset of 457 responses.
In order to provide the most accurate data possible, data was cleaned and analyzed using statistical software. Any duplicate records were removed. Data comparisons with any relevant, statistically significant differences are noted within this report.
The demographics of the survey sample and the respondents are similar to the WorldatWork membership as a whole. The typical WorldatWork member works at the managerial level or higher in the headquarters of a large company in North America.
The frequencies or response distributions listed in the report show the number of times or percentage of times a value appears in a dataset. Due to rounding, frequencies of data responses provided in this survey may not total exactly 100%.
WorldatWork conducted similar employee recognition program surveys in 2013, 2011, 2008, 2005, 2003, 2002 and 2001. These reports can be viewed on the WorldatWork website. Where possible, historical comparisons from data gathered in the previous survey are shown.
Trends in Employee Recognition 2015 WorldatWork 1
Table of Figures Demographics
Figure 1: Sector ................................................................................................................................................ 4 Figure 2: Organization size .............................................................................................................................. 4 Figure 3: Industry ............................................................................................................................................. 5 Figure 4: Voluntary turnover ............................................................................................................................ 5
Recognition Programs
Figure 5: Prevalence of recognition ................................................................................................................ 12 Figure 5a: Barriers to recognition programs .................................................................................................... 12 Figure 5b: Number of recognition programs offered ....................................................................................... 13 Figure 6: Change in recognition ...................................................................................................................... 13 Figure 7: Elimination of recognition programs in the past 12 months ............................................................ 13 Figure 8: New recognition programs ............................................................................................................... 14
Types of Programs Offered Figure 9: Types of recognition programs ........................................................................................................ 14 Figure 10: Formality of recognition ................................................................................................................. 15 Figure 11: Recognition program trends............................................................................................................ 15 Figure 11a: Top recognition programs ............................................................................................................. 16 Figure 12: Recognition program prevalence and percentage of employees recognized .................................. 16 Figure 13: International/global employees ...................................................................................................... 16 Figure 14: Recognition for international/global employees ............................................................................ 17
Program Strategy and Measures
Figure 15: Recognition strategy ....................................................................................................................... 17 Figure 16: Recognition and organizational strategy ......................................................................................... 18 Figure 17: Recognition objectives .................................................................................................................... 18 Figure 18: Success of recognition programs .................................................................................................... 19 Figure 19: Measuring success of recognition ................................................................................................... 19
Program Administration and Communication
Figure 20: Department administration of recognition programs ...................................................................... 20 Figure 21: Position administration of recognition programs ............................................................................ 20 Figure 22: Budgeting for recognition programs ............................................................................................... 21 Figure 23: Percentage of payroll budget for recognition programs ................................................................. 21 Figure 24: Budget for recognition programs (centralized or departmental) .................................................... 21 Figure 25: Presentation of recognition awards ................................................................................................ 22 Figure 26: Electronic communication of recognition awards ......................................................................... 22 Figure 27: Types of recognition awards (items) .............................................................................................. 22
Trends in Employee Recognition 2015 WorldatWork 2
Figure 28: Media communication of recognition programs ............................................................................. 23 Figure 29: Training for managers ..................................................................................................................... 24 Figure 29a: Culture of recognition embedded in organization ......................................................................... 24 Figure 30: Training methods used for managers .............................................................................................. 25 Figure 31: Senior management support for recognition programs ................................................................... 25 Figure 32: Senior management view of employee recognition programs ........................................................ 25
Program Effectiveness
Figure 33: Perceived workforce effect of recognition awards ........................................................................ 26 Figure 34: Use of recognition programs to attract employees ......................................................................... 26 Figure 35: Degree of recognition embedded in organization’s culture and perceived effect of recognition programs on employee engagement ................................................................................................................ 27 Figure 36: Degree of recognition embedded in organization’s culture and perceived effect of recognition programs on employee motivation ................................................................................................................... 27 Figure 37: Degree of recognition embedded in organization’s culture and perceived effect of recognition programs on employee satisfaction .................................................................................................................. 27 Figure 38: Degree of recognition embedded in organization’s culture and perceived effect of recognition programs on employee retention ...................................................................................................................... 27
Result-Driven Recognition Programs
Figure 39: Number of result-driven recognition programs in use at respondent organizations ....................... 28 Figure 40: Perception that recognition programs are meeting objectives/goals, by result-driven recognition program(s) ........................................................................................................................................................ 29 Figure 41: Use of a written strategy, by result-driven recognition program(s) ................................................ 29 Figure 42: Result-driven recognition programs and recognition presentations ............................................... 30 Figure 43: Result-driven recognition programs and recognition award items ................................................. 30 Figure 44: Result-driven recognition programs and perceived effect on employee motivation ...................... 30 Figure 45: Result-driven recognition programs and perceived effect on retention .......................................... 30 Figure 46: Result-driven recognition programs and the percentage of payroll budget used for recognition programs ........................................................................................................................................................... 31
Trends in Employee Recognition 2015 WorldatWork 3
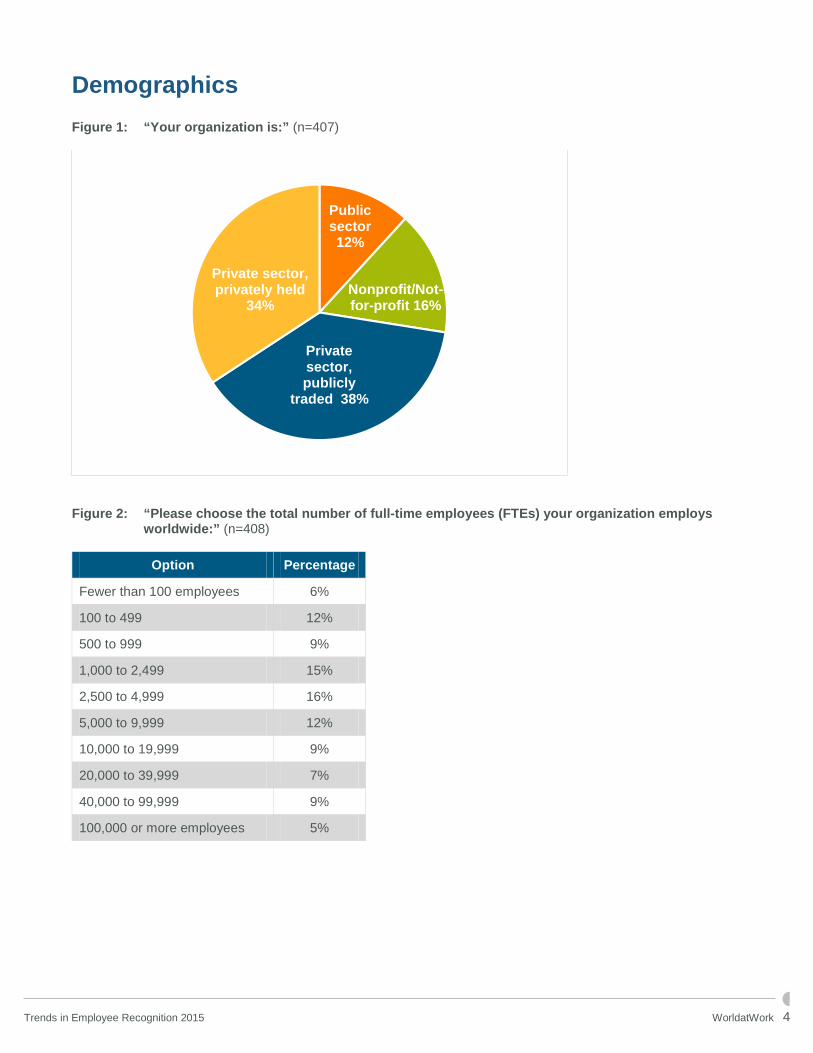
Demographics Figure 1: “Your organization is:” (n=407)
Figure 2: “Please choose the total number of full-time employees (FTEs) your organization employs
worldwide:” (n=408)
Option Percentage
Fewer than 100 employees 6%
100 to 499 12%
500 to 999 9%
1,000 to 2,499 15%
2,500 to 4,999 16%
5,000 to 9,999 12%
10,000 to 19,999 9%
20,000 to 39,999 7%
40,000 to 99,999 9%
100,000 or more employees 5%
Public sector 12%
Nonprofit/Not-for-profit 16%
Private sector, publicly
traded 38%
Private sector, privately held
34%
Trends in Employee Recognition 2015 WorldatWork 4
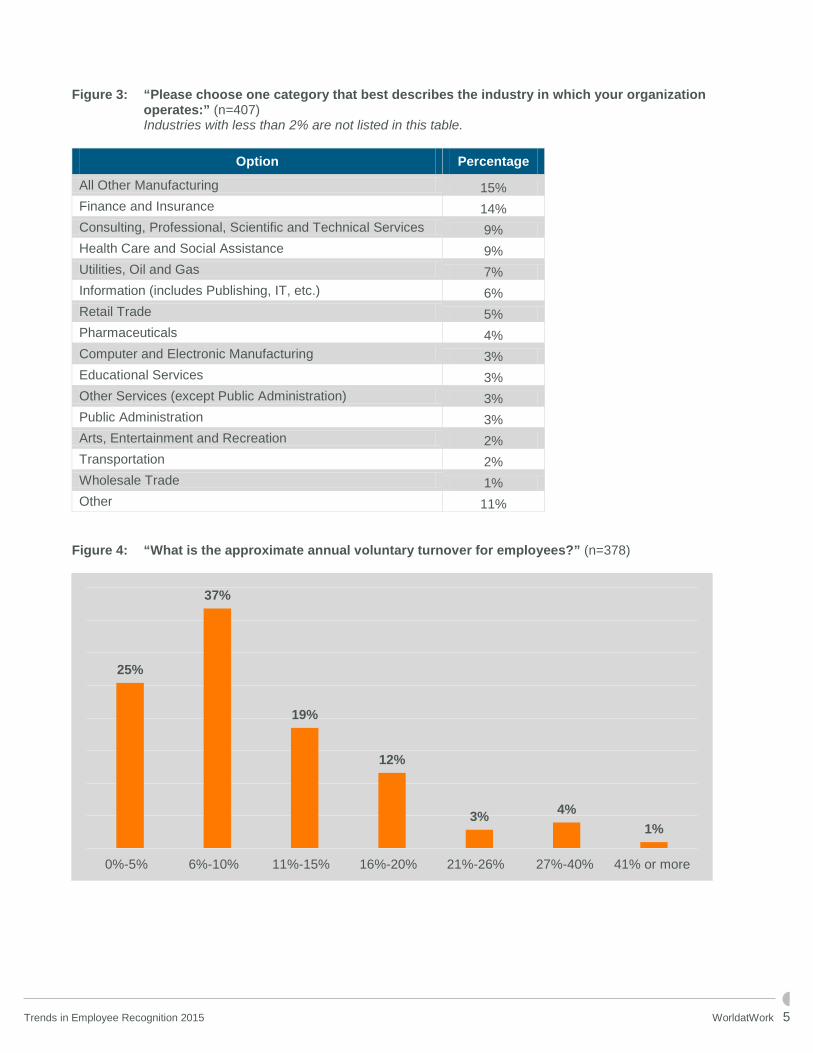
Figure 3: “Please choose one category that best describes the industry in which your organization
operates:” (n=407) Industries with less than 2% are not listed in this table.
Option Percentage
All Other Manufacturing 15% Finance and Insurance 14% Consulting, Professional, Scientific and Technical Services 9% Health Care and Social Assistance 9% Utilities, Oil and Gas 7% Information (includes Publishing, IT, etc.) 6% Retail Trade 5% Pharmaceuticals 4% Computer and Electronic Manufacturing 3% Educational Services 3% Other Services (except Public Administration) 3% Public Administration 3% Arts, Entertainment and Recreation 2% Transportation 2% Wholesale Trade 1% Other 11%
Figure 4: “What is the approximate annual voluntary turnover for employees?” (n=378)
25%
37%
19%
12%
3% 4%1%
0%-5% 6%-10% 11%-15% 16%-20% 21%-26% 27%-40% 41% or more
Trends in Employee Recognition 2015 WorldatWork 5
Executive Summary
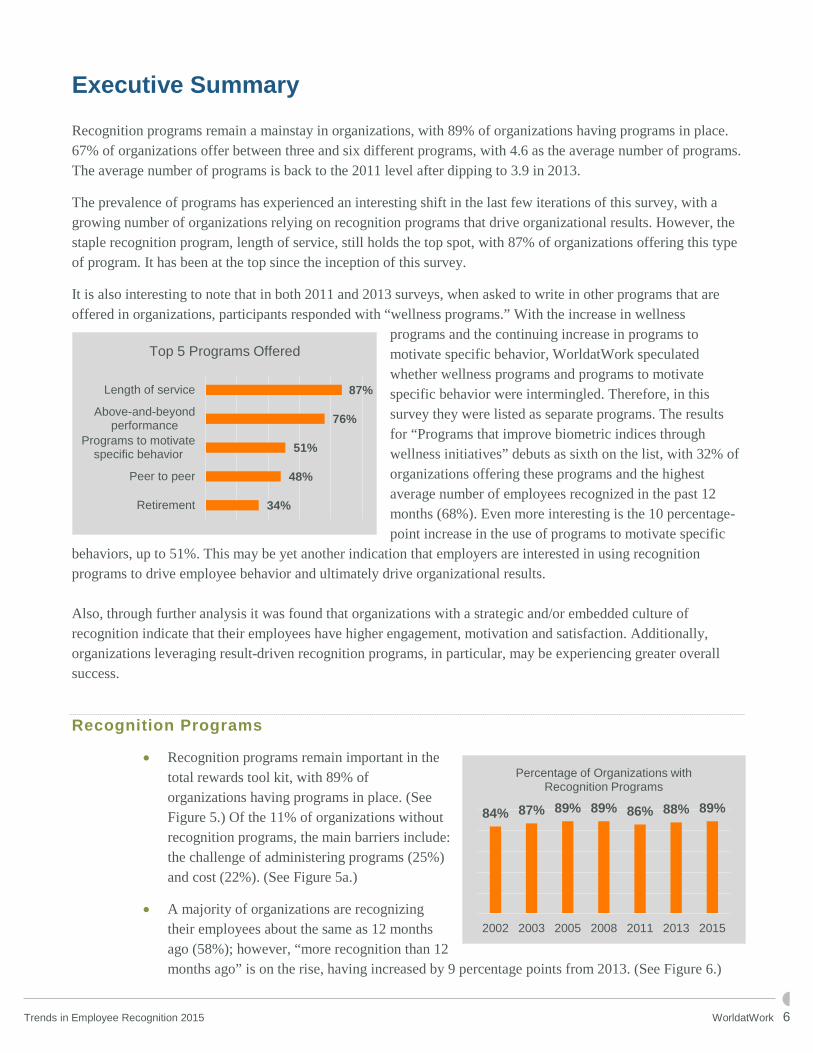
Recognition programs remain a mainstay in organizations, with 89% of organizations having programs in place. 67% of organizations offer between three and six different programs, with 4.6 as the average number of programs. The average number of programs is back to the 2011 level after dipping to 3.9 in 2013.
The prevalence of programs has experienced an interesting shift in the last few iterations of this survey, with a growing number of organizations relying on recognition programs that drive organizational results. However, the staple recognition program, length of service, still holds the top spot, with 87% of organizations offering this type of program. It has been at the top since the inception of this survey.
It is also interesting to note that in both 2011 and 2013 surveys, when asked to write in other programs that are offered in organizations, participants responded with “wellness programs.” With the increase in wellness
programs and the continuing increase in programs to motivate specific behavior, WorldatWork speculated whether wellness programs and programs to motivate specific behavior were intermingled. Therefore, in this survey they were listed as separate programs. The results for “Programs that improve biometric indices through wellness initiatives” debuts as sixth on the list, with 32% of organizations offering these programs and the highest average number of employees recognized in the past 12 months (68%). Even more interesting is the 10 percentage-point increase in the use of programs to motivate specific
behaviors, up to 51%. This may be yet another indication that employers are interested in using recognition programs to drive employee behavior and ultimately drive organizational results. Also, through further analysis it was found that organizations with a strategic and/or embedded culture of recognition indicate that their employees have higher engagement, motivation and satisfaction. Additionally, organizations leveraging result-driven recognition programs, in particular, may be experiencing greater overall success.
Recognition Programs
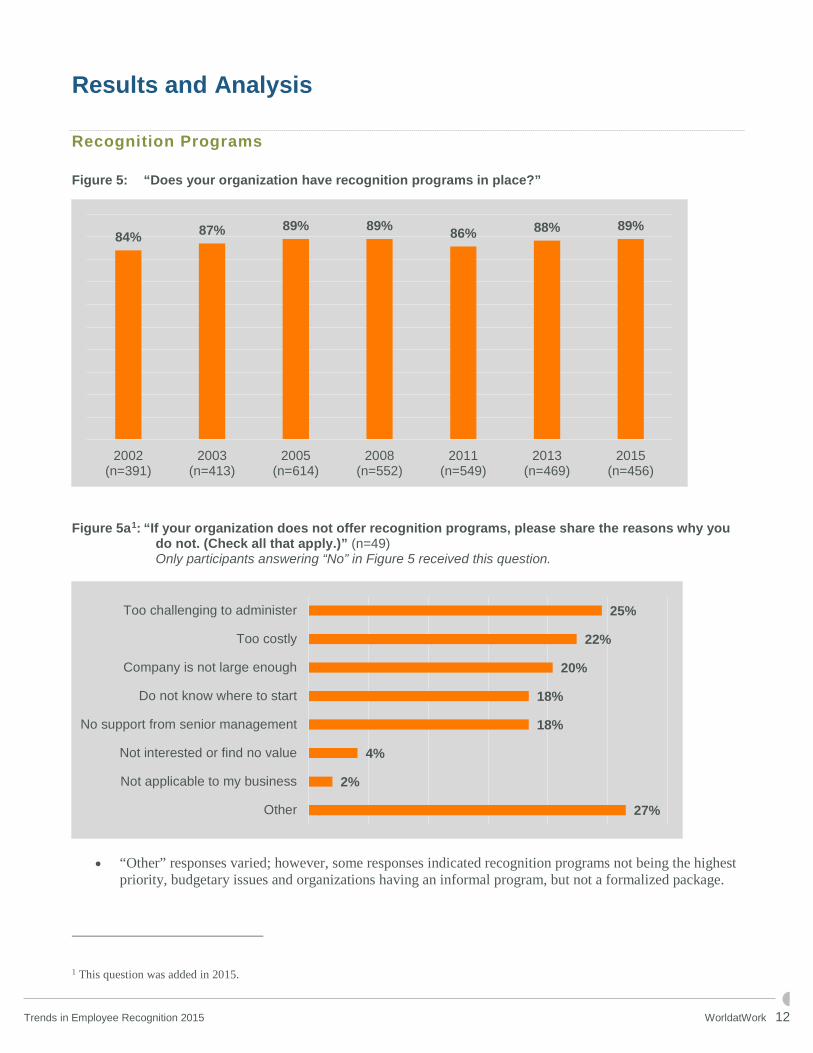
• Recognition programs remain important in the total rewards tool kit, with 89% of organizations having programs in place. (See Figure 5.) Of the 11% of organizations without recognition programs, the main barriers include: the challenge of administering programs (25%) and cost (22%). (See Figure 5a.)
• A majority of organizations are recognizing their employees about the same as 12 months ago (58%); however, “more recognition than 12 months ago” is on the rise, having increased by 9 percentage points from 2013. (See Figure 6.)
89%88%86%89%89%87%84%
2015201320112008200520032002
Percentage of Organizations with Recognition Programs
87%
76%
51%
48%
34%
Length of service
Above-and-beyondperformance
Programs to motivatespecific behavior
Peer to peer
Retirement
Top 5 Programs Offered
Trends in Employee Recognition 2015 WorldatWork 6
• 95% of organizations have not eliminated any recognition programs in the past 12 months. This is consistent with findings from 2013. (See Figure 7.) Although very few programs have been eliminated, over half of organizations are not considering implementing any new programs in the next 12 months. (See Figure 8.)
Types of Programs Offered
• Companywide recognition programs are widespread, offered by 80% of organizations; however, this has statistically significantly declined by 10 percentage points from 2013, which could be attributed to the addition of the individual recognition programs category. (See Figure 9.) Individual recognition programs and department/team-specific programs are also common, at 67% and 65% respectively.
• 75% of organizations operate their recognition programs both formally and informally. While formal recognition remains more widespread than informal, it has dropped 5 percentage points to 19% from 2013. (See Figure 10.)
• The top five recognition programs have remained the same since 2013: length of service (87%), above-and-beyond performance (76%), programs to motivate specific behaviors (51%), peer to peer recognition (48%) and retirement (34%). (See Figure 12.) Programs to motivate specific behavior continue to be on the rise, jumping to the third-most prevalent recognition program with a 10 percentage-point increase. (See Figure 11.) Retirement and length-of-service recognition programs continue to have a long history in organizations, and likely last many more years. Programs that improve biometric indices through wellness initiatives, almost breaking the top five programs, has been in place with 68% of organizations for one to five years. This program also has the highest average number of employees recognized in the past 12 months (37%). (See Figure 12.)
• Half of responding organizations employ employees outside of North America, an increase of 7 percentage points since 2013. (See Figure 13.) At 39% of those organizations, international/global employees participate in all or most of the same recognition programs as their North American counterparts. This has decreased since 2013, while international/global employees having their own recognition programs has been on the rise (25%). (See Figure 14.)
Program Strategy and Measures
• 53% of organizations have a written strategy behind their recognition programs (Figure 15), and 97% of those organizations say their strategies align with the organizational strategy (Figure 16).
Trends in Employee Recognition 2015 WorldatWork 7
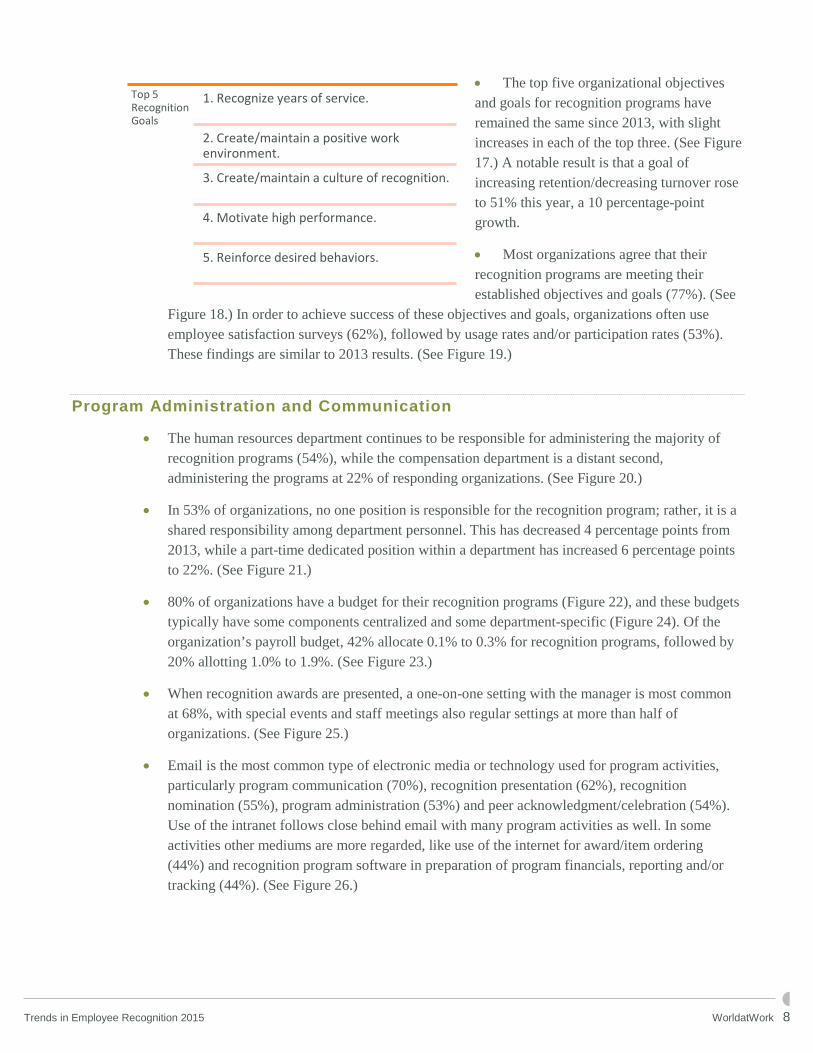
• The top five organizational objectives and goals for recognition programs have remained the same since 2013, with slight increases in each of the top three. (See Figure 17.) A notable result is that a goal of increasing retention/decreasing turnover rose to 51% this year, a 10 percentage-point growth.
• Most organizations agree that their recognition programs are meeting their established objectives and goals (77%). (See
Figure 18.) In order to achieve success of these objectives and goals, organizations often use employee satisfaction surveys (62%), followed by usage rates and/or participation rates (53%). These findings are similar to 2013 results. (See Figure 19.)
Program Administration and Communication
• The human resources department continues to be responsible for administering the majority of recognition programs (54%), while the compensation department is a distant second, administering the programs at 22% of responding organizations. (See Figure 20.)
• In 53% of organizations, no one position is responsible for the recognition program; rather, it is a shared responsibility among department personnel. This has decreased 4 percentage points from 2013, while a part-time dedicated position within a department has increased 6 percentage points to 22%. (See Figure 21.)
• 80% of organizations have a budget for their recognition programs (Figure 22), and these budgets typically have some components centralized and some department-specific (Figure 24). Of the organization’s payroll budget, 42% allocate 0.1% to 0.3% for recognition programs, followed by 20% allotting 1.0% to 1.9%. (See Figure 23.)
• When recognition awards are presented, a one-on-one setting with the manager is most common at 68%, with special events and staff meetings also regular settings at more than half of organizations. (See Figure 25.)
• Email is the most common type of electronic media or technology used for program activities, particularly program communication (70%), recognition presentation (62%), recognition nomination (55%), program administration (53%) and peer acknowledgment/celebration (54%). Use of the intranet follows close behind email with many program activities as well. In some activities other mediums are more regarded, like use of the internet for award/item ordering (44%) and recognition program software in preparation of program financials, reporting and/or tracking (44%). (See Figure 26.)
Top 5 Recognition Goals
1. Recognize years of service.
2. Create/maintain a positive work environment.
3. Create/maintain a culture of recognition.
4. Motivate high performance.
5. Reinforce desired behaviors.
Trends in Employee Recognition 2015 WorldatWork 8
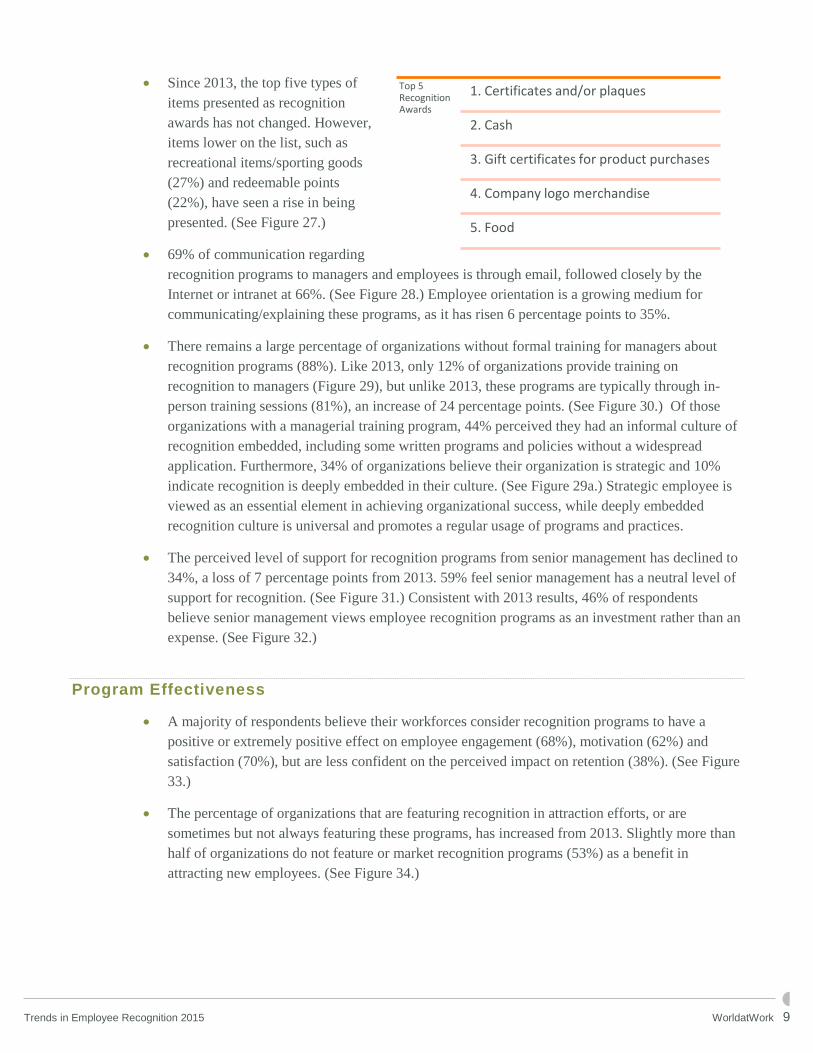
• Since 2013, the top five types of items presented as recognition awards has not changed. However, items lower on the list, such as recreational items/sporting goods (27%) and redeemable points (22%), have seen a rise in being presented. (See Figure 27.)
• 69% of communication regarding recognition programs to managers and employees is through email, followed closely by the Internet or intranet at 66%. (See Figure 28.) Employee orientation is a growing medium for communicating/explaining these programs, as it has risen 6 percentage points to 35%.
• There remains a large percentage of organizations without formal training for managers about recognition programs (88%). Like 2013, only 12% of organizations provide training on recognition to managers (Figure 29), but unlike 2013, these programs are typically through in-person training sessions (81%), an increase of 24 percentage points. (See Figure 30.) Of those organizations with a managerial training program, 44% perceived they had an informal culture of recognition embedded, including some written programs and policies without a widespread application. Furthermore, 34% of organizations believe their organization is strategic and 10% indicate recognition is deeply embedded in their culture. (See Figure 29a.) Strategic employee is viewed as an essential element in achieving organizational success, while deeply embedded recognition culture is universal and promotes a regular usage of programs and practices.
• The perceived level of support for recognition programs from senior management has declined to 34%, a loss of 7 percentage points from 2013. 59% feel senior management has a neutral level of support for recognition. (See Figure 31.) Consistent with 2013 results, 46% of respondents believe senior management views employee recognition programs as an investment rather than an expense. (See Figure 32.)
Program Effectiveness
• A majority of respondents believe their workforces consider recognition programs to have a positive or extremely positive effect on employee engagement (68%), motivation (62%) and satisfaction (70%), but are less confident on the perceived impact on retention (38%). (See Figure 33.)
• The percentage of organizations that are featuring recognition in attraction efforts, or are sometimes but not always featuring these programs, has increased from 2013. Slightly more than half of organizations do not feature or market recognition programs (53%) as a benefit in attracting new employees. (See Figure 34.)
Top 5 Recognition Awards
1. Certificates and/or plaques
2. Cash
3. Gift certificates for product purchases
4. Company logo merchandise
5. Food
Trends in Employee Recognition 2015 WorldatWork 9
Result-Driven Recognition Programs
In an effort to better understand the use and effectiveness of recognition programs that are designed to drive a specific result rather than to celebrate successes like tenure and culture, four recognition programs were identified and analyzed collectively as “result-driven recognition programs.” (See page 28 for more information.) The four programs are:
1. Above-and-beyond performance recognition
2. Peer-to-peer recognition
3. Recognition programs that motivate specific behaviors
4. Recognition programs to improve biometric indices through wellness initiatives.
Findings indicate that the more result-driven programs in place, the stronger the commitment from the organization and perceived success. It is unknown if these findings are simply the result of having better clarity around the intent of the program (because, by definition, it is designed to have a specific impact) and are therefore better communicated and easier to measure, or if it’s because recognition programs designed to drive specific results truly do have greater relational success compared to other recognition programs such as length of service or employee of the year, month and so on. Nonetheless, the findings at least reveal some interesting correlations:
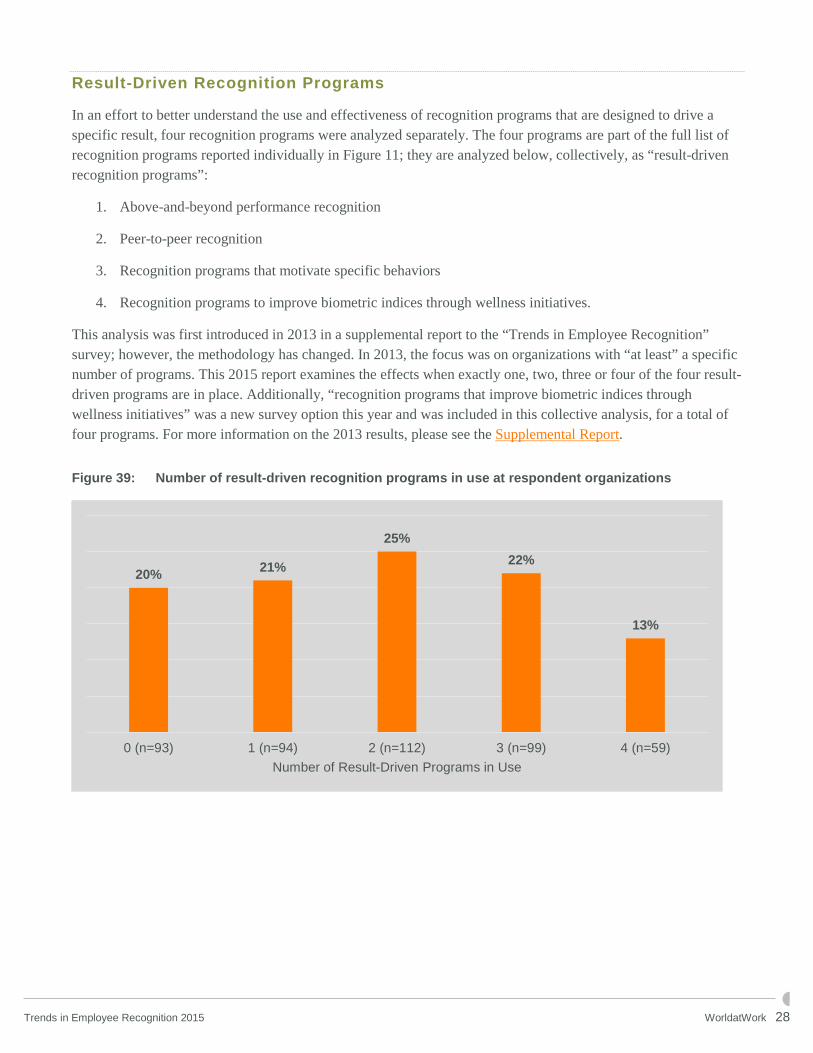
• 25% of all organizations surveyed offer two result-driven programs as part of their recognition programming. (See Figure 39.) Although two programs are the most common offering, this is comparable to the prevalence of organizations offering one program (21%) and three programs (22%). Only 13% of responding organizations use all four result-driven programs.
• With every additional result-driven program that organizations offer between one and four, there appears to be a connection to the perception that recognition programs in general are meeting objectives or goals. Reports of success go up by 6 to 12 percentage points each time the number of programs used goes up. (See Figure 40.)
• The prevalence of written strategies at responding organizations climbs dramatically as the number of result-driven recognition programs in use increases. When only one of the four programs is being used, 44% of organizations have a written strategy in place. When all four of the surveyed result-driven recognition programs are in use, 70% of organizations have a written strategy in place. (See Figure 41.) This finding, along with the data on recognition budgets found in Figure 46, may indicate that organizations with more programs are more committed. They clearly are more likely to have a written strategy in place. However, while some of the larger budget ranges are more prevalent for organizations offering three or four programs, it is not clear if more programs cost more, or if organizations with more programs may just be willing to invest a little more in recognition.
• The perceived effect on employee engagement, motivation and satisfaction improves as more result-driven recognition programs are used. Approximately half of organizations report a positive or extremely positive effect of recognition programs on employee engagement (54%), motivation (48%) and/or satisfaction (51%) when only one of the four programs is used. As the number of programs used increases to a total of four, the degree of positive impact grows considerably, to roughly three-fourths or more. This is better than the average of all respondents
Trends in Employee Recognition 2015 WorldatWork 10
(regardless of use of the four specific result-driven programs) of 62% to 70% depending on the factor. (See Figure 44.)
Trends in Employee Recognition 2015 WorldatWork 11
Results and Analysis
Recognition Programs Figure 5: “Does your organization have recognition programs in place?”
Figure 5a1: “If your organization does not offer recognition programs, please share the reasons why you
do not. (Check all that apply.)” (n=49) Only participants answering “No” in Figure 5 received this question.
• “Other” responses varied; however, some responses indicated recognition programs not being the highest priority, budgetary issues and organizations having an informal program, but not a formalized package.
1 This question was added in 2015.
84% 87% 89% 89% 86% 88% 89%
2002(n=391)
2003(n=413)
2005(n=614)
2008(n=552)
2011(n=549)
2013(n=469)
2015(n=456)
25%
22%
20%
18%
18%
4%
2%
27%
Too challenging to administer
Too costly
Company is not large enough
Do not know where to start
No support from senior management
Not interested or find no value
Not applicable to my business
Other
Trends in Employee Recognition 2015 WorldatWork 12
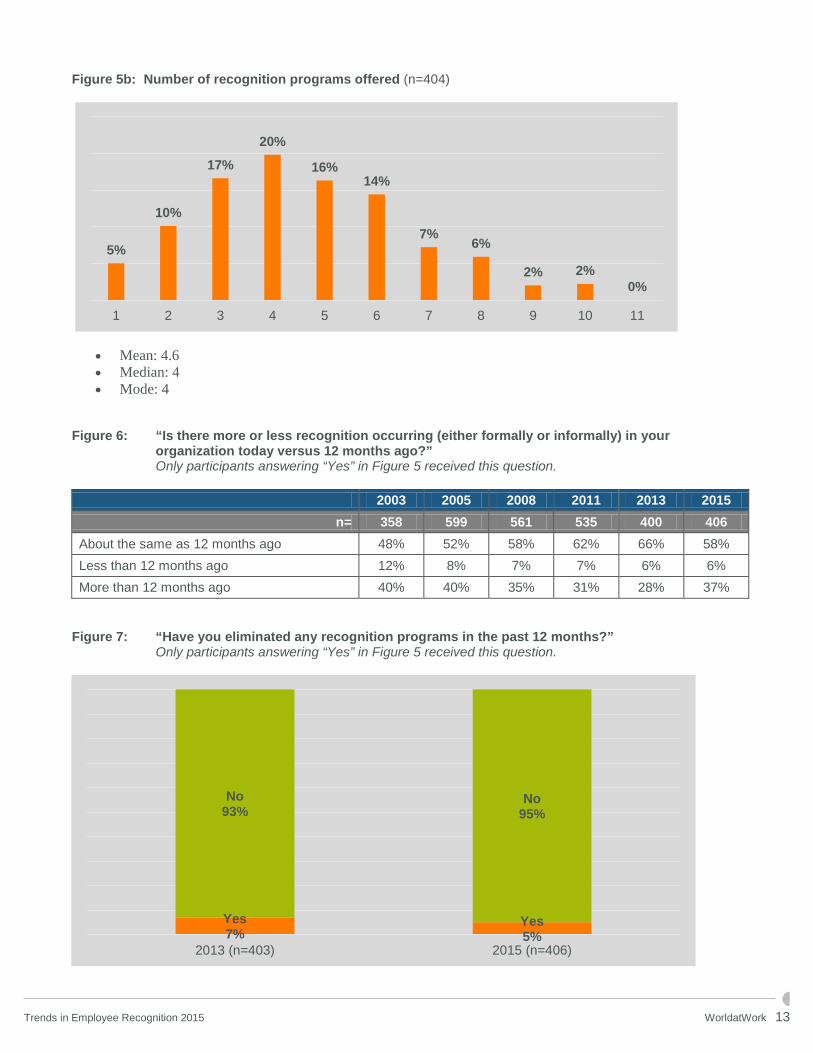
Figure 5b: Number of recognition programs offered (n=404)
• Mean: 4.6 • Median: 4 • Mode: 4
Figure 6: “Is there more or less recognition occurring (either formally or informally) in your
organization today versus 12 months ago?” Only participants answering “Yes” in Figure 5 received this question.
2003 2005 2008 2011 2013 2015 n= 358 599 561 535 400 406
About the same as 12 months ago 48% 52% 58% 62% 66% 58% Less than 12 months ago 12% 8% 7% 7% 6% 6% More than 12 months ago 40% 40% 35% 31% 28% 37%
Figure 7: “Have you eliminated any recognition programs in the past 12 months?” Only participants answering “Yes” in Figure 5 received this question.
5%
10%
17%
20%
16%14%
7%6%
2% 2%0%
1 2 3 4 5 6 7 8 9 10 11
Yes5%
Yes7%
No95%
No93%
2015 (n=406)2013 (n=403)
Trends in Employee Recognition 2015 WorldatWork 13
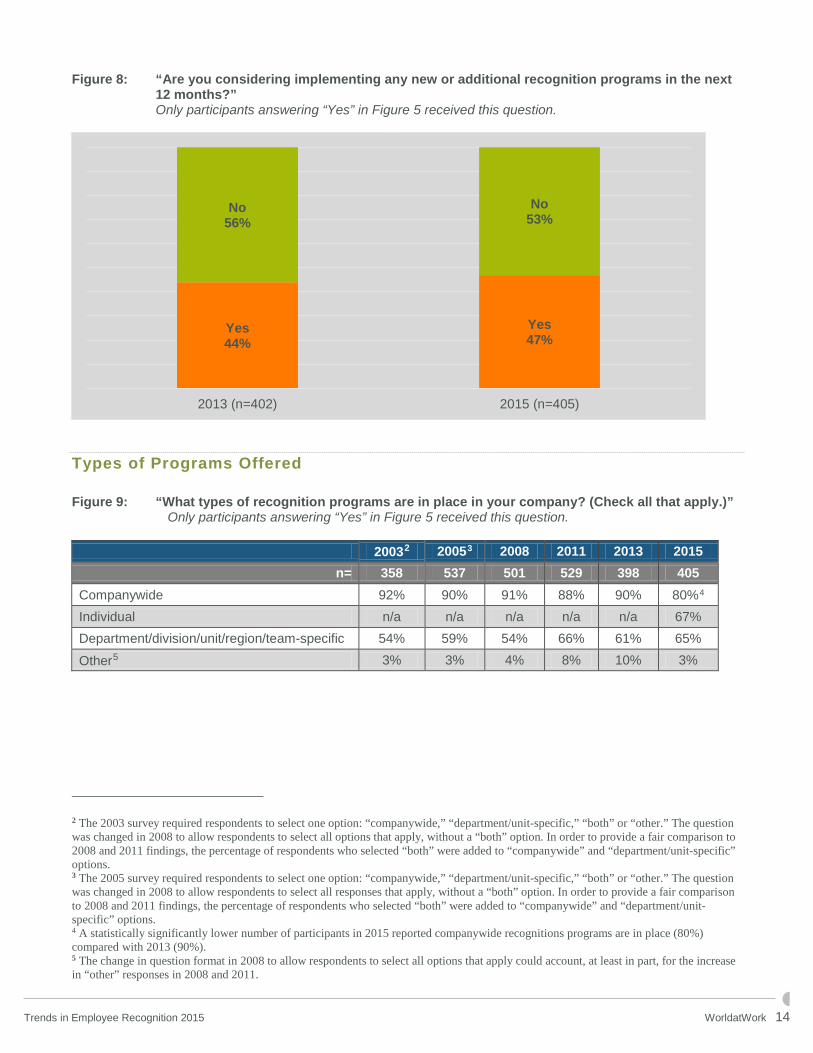
Figure 8: “Are you considering implementing any new or additional recognition programs in the next 12 months?”
Only participants answering “Yes” in Figure 5 received this question.
Types of Programs Offered Figure 9: “What types of recognition programs are in place in your company? (Check all that apply.)”
Only participants answering “Yes” in Figure 5 received this question.
20032 20053 2008 2011 2013 2015 n= 358 537 501 529 398 405
Companywide 92% 90% 91% 88% 90% 80%4 Individual n/a n/a n/a n/a n/a 67% Department/division/unit/region/team-specific 54% 59% 54% 66% 61% 65%
Other5 3% 3% 4% 8% 10% 3%
2 The 2003 survey required respondents to select one option: “companywide,” “department/unit-specific,” “both” or “other.” The question was changed in 2008 to allow respondents to select all options that apply, without a “both” option. In order to provide a fair comparison to 2008 and 2011 findings, the percentage of respondents who selected “both” were added to “companywide” and “department/unit-specific” options. 3 The 2005 survey required respondents to select one option: “companywide,” “department/unit-specific,” “both” or “other.” The question was changed in 2008 to allow respondents to select all responses that apply, without a “both” option. In order to provide a fair comparison to 2008 and 2011 findings, the percentage of respondents who selected “both” were added to “companywide” and “department/unit-specific” options. 4 A statistically significantly lower number of participants in 2015 reported companywide recognitions programs are in place (80%) compared with 2013 (90%). 5 The change in question format in 2008 to allow respondents to select all options that apply could account, at least in part, for the increase in “other” responses in 2008 and 2011.
Yes47%
Yes44%
No53%
No56%
2015 (n=405)2013 (n=402)
Trends in Employee Recognition 2015 WorldatWork 14
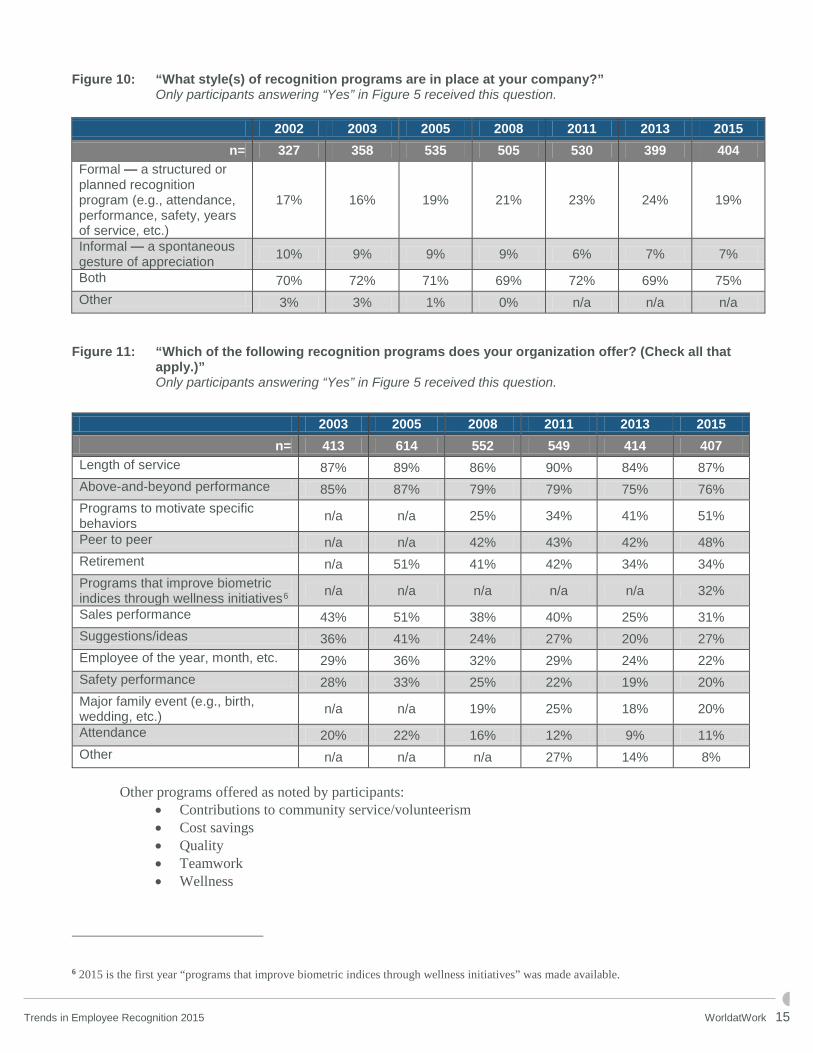
Figure 10: “What style(s) of recognition programs are in place at your company?” Only participants answering “Yes” in Figure 5 received this question.
2002 2003 2005 2008 2011 2013 2015 n= 327 358 535 505 530 399 404
Formal — a structured or planned recognition program (e.g., attendance, performance, safety, years of service, etc.)
17% 16% 19% 21% 23% 24% 19%
Informal — a spontaneous gesture of appreciation 10% 9% 9% 9% 6% 7% 7%
Both 70% 72% 71% 69% 72% 69% 75% Other 3% 3% 1% 0% n/a n/a n/a
Figure 11: “Which of the following recognition programs does your organization offer? (Check all that
apply.)” Only participants answering “Yes” in Figure 5 received this question.
Other programs offered as noted by participants:
• Contributions to community service/volunteerism • Cost savings • Quality • Teamwork • Wellness
6 2015 is the first year “programs that improve biometric indices through wellness initiatives” was made available.
2003 2005 2008 2011 2013 2015 n= 413 614 552 549 414 407
Length of service 87% 89% 86% 90% 84% 87% Above-and-beyond performance 85% 87% 79% 79% 75% 76% Programs to motivate specific behaviors n/a n/a 25% 34% 41% 51%
Peer to peer n/a n/a 42% 43% 42% 48% Retirement n/a 51% 41% 42% 34% 34% Programs that improve biometric indices through wellness initiatives6 n/a n/a n/a n/a n/a 32%
Sales performance 43% 51% 38% 40% 25% 31% Suggestions/ideas 36% 41% 24% 27% 20% 27% Employee of the year, month, etc. 29% 36% 32% 29% 24% 22% Safety performance 28% 33% 25% 22% 19% 20% Major family event (e.g., birth, wedding, etc.) n/a n/a 19% 25% 18% 20%
Attendance 20% 22% 16% 12% 9% 11% Other n/a n/a n/a 27% 14% 8%
Trends in Employee Recognition 2015 WorldatWork 15
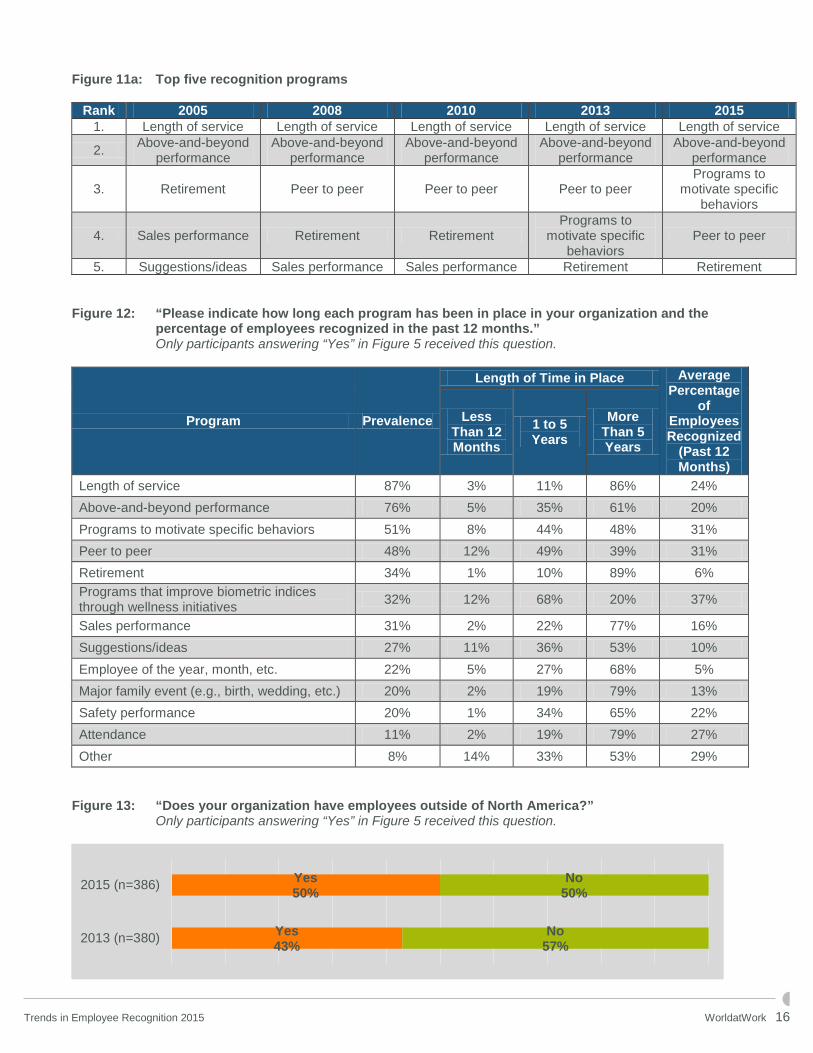
Figure 11a: Top five recognition programs
Rank 2005 2008 2010 2013 2015 1. Length of service Length of service Length of service Length of service Length of service
2. Above-and-beyond performance
Above-and-beyond performance
Above-and-beyond performance
Above-and-beyond performance
Above-and-beyond performance
3. Retirement Peer to peer Peer to peer Peer to peer Programs to
motivate specific behaviors
4. Sales performance Retirement Retirement Programs to
motivate specific behaviors
Peer to peer
5. Suggestions/ideas Sales performance Sales performance Retirement Retirement Figure 12: “Please indicate how long each program has been in place in your organization and the
percentage of employees recognized in the past 12 months.” Only participants answering “Yes” in Figure 5 received this question.
Program Prevalence
Length of Time in Place Average Percentage
of Employees Recognized
(Past 12 Months)
Less Than 12 Months
1 to 5 Years
More Than 5 Years
Length of service 87% 3% 11% 86% 24% Above-and-beyond performance 76% 5% 35% 61% 20% Programs to motivate specific behaviors 51% 8% 44% 48% 31% Peer to peer 48% 12% 49% 39% 31% Retirement 34% 1% 10% 89% 6% Programs that improve biometric indices through wellness initiatives 32% 12% 68% 20% 37%
Sales performance 31% 2% 22% 77% 16% Suggestions/ideas 27% 11% 36% 53% 10% Employee of the year, month, etc. 22% 5% 27% 68% 5% Major family event (e.g., birth, wedding, etc.) 20% 2% 19% 79% 13% Safety performance 20% 1% 34% 65% 22% Attendance 11% 2% 19% 79% 27% Other 8% 14% 33% 53% 29%
Figure 13: “Does your organization have employees outside of North America?” Only participants answering “Yes” in Figure 5 received this question.
Yes50%
Yes43%
No50%
No57%
2015 (n=386)
2013 (n=380)
Trends in Employee Recognition 2015 WorldatWork 16
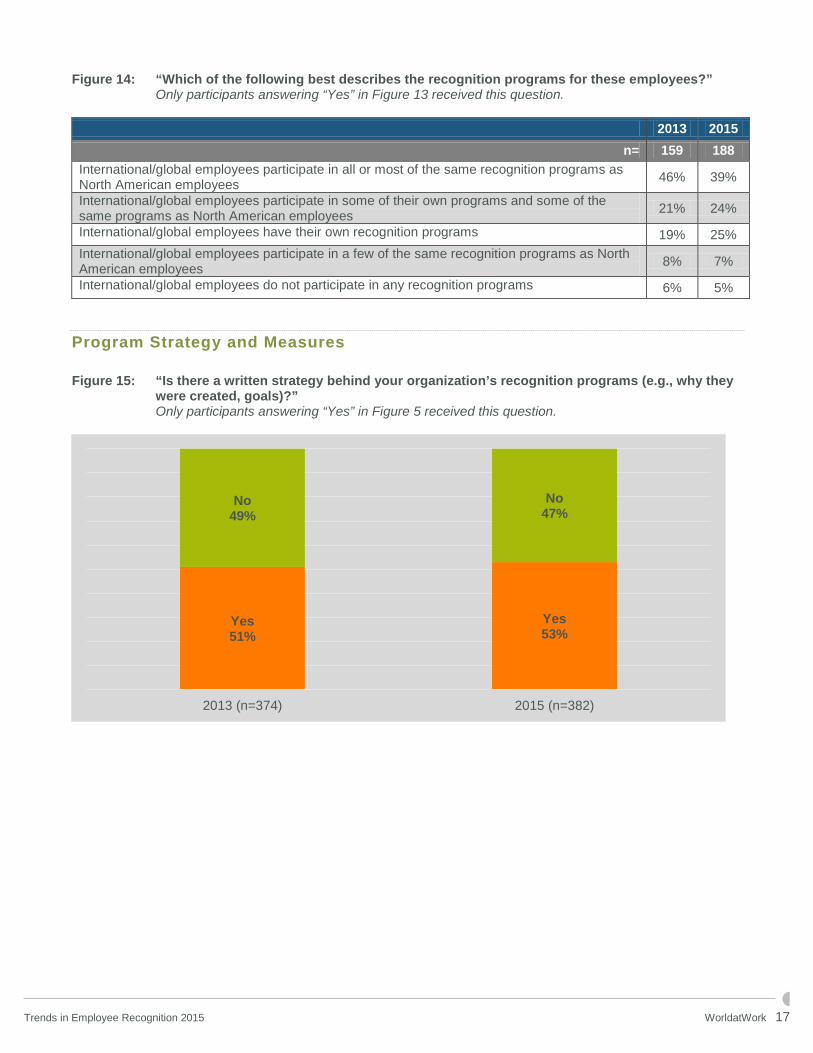
Figure 14: “Which of the following best describes the recognition programs for these employees?” Only participants answering “Yes” in Figure 13 received this question.
2013 2015 n= 159 188
International/global employees participate in all or most of the same recognition programs as North American employees 46% 39%
International/global employees participate in some of their own programs and some of the same programs as North American employees 21% 24%
International/global employees have their own recognition programs 19% 25% International/global employees participate in a few of the same recognition programs as North American employees 8% 7%
International/global employees do not participate in any recognition programs 6% 5%
Program Strategy and Measures Figure 15: “Is there a written strategy behind your organization’s recognition programs (e.g., why they
were created, goals)?” Only participants answering “Yes” in Figure 5 received this question.
Yes53%
Yes51%
No47%
No49%
2015 (n=382)2013 (n=374)
Trends in Employee Recognition 2015 WorldatWork 17
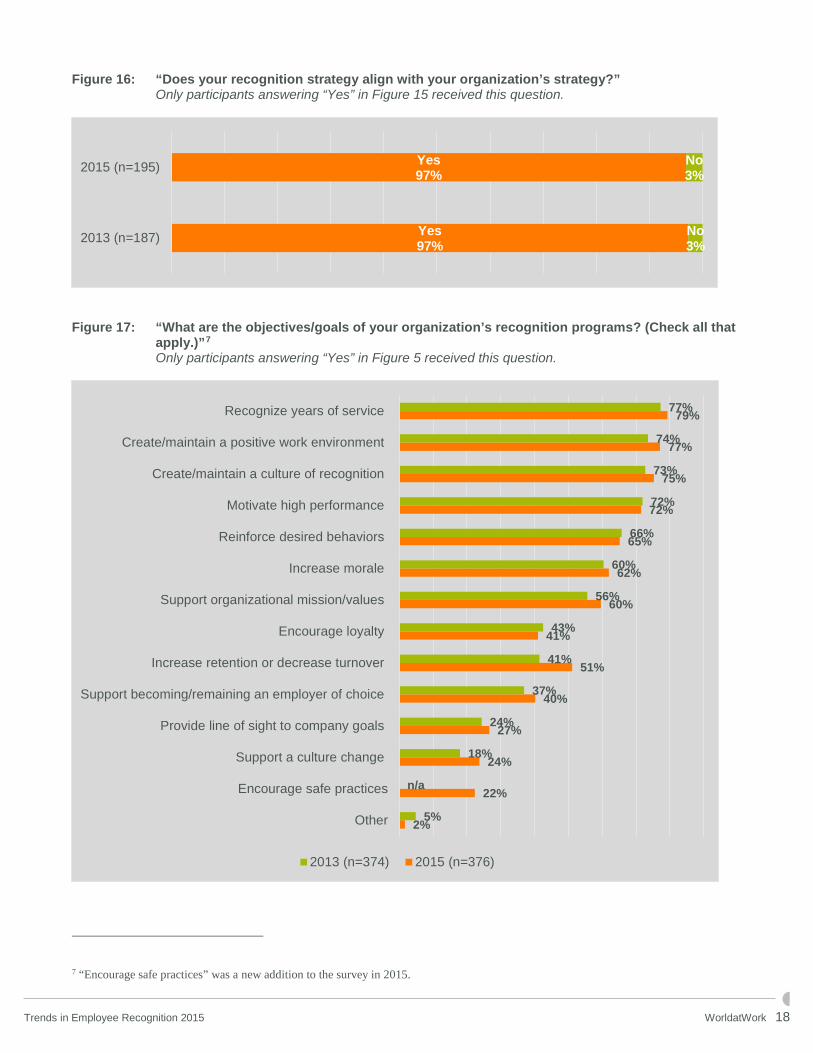
Figure 16: “Does your recognition strategy align with your organization’s strategy?” Only participants answering “Yes” in Figure 15 received this question.
Figure 17: “What are the objectives/goals of your organization’s recognition programs? (Check all that
apply.)”7 Only participants answering “Yes” in Figure 5 received this question.
7 “Encourage safe practices” was a new addition to the survey in 2015.
Yes97%
Yes97%
No3%
No3%
2015 (n=195)
2013 (n=187)
2%
22%
24%
27%
40%
51%
41%
60%
62%
65%
72%
75%
77%
79%
5%
n/a
18%
24%
37%
41%
43%
56%
60%
66%
72%
73%
74%
77%
Other
Encourage safe practices
Support a culture change
Provide line of sight to company goals
Support becoming/remaining an employer of choice
Increase retention or decrease turnover
Encourage loyalty
Support organizational mission/values
Increase morale
Reinforce desired behaviors
Motivate high performance
Create/maintain a culture of recognition
Create/maintain a positive work environment
Recognize years of service
2013 (n=374) 2015 (n=376)
Trends in Employee Recognition 2015 WorldatWork 18
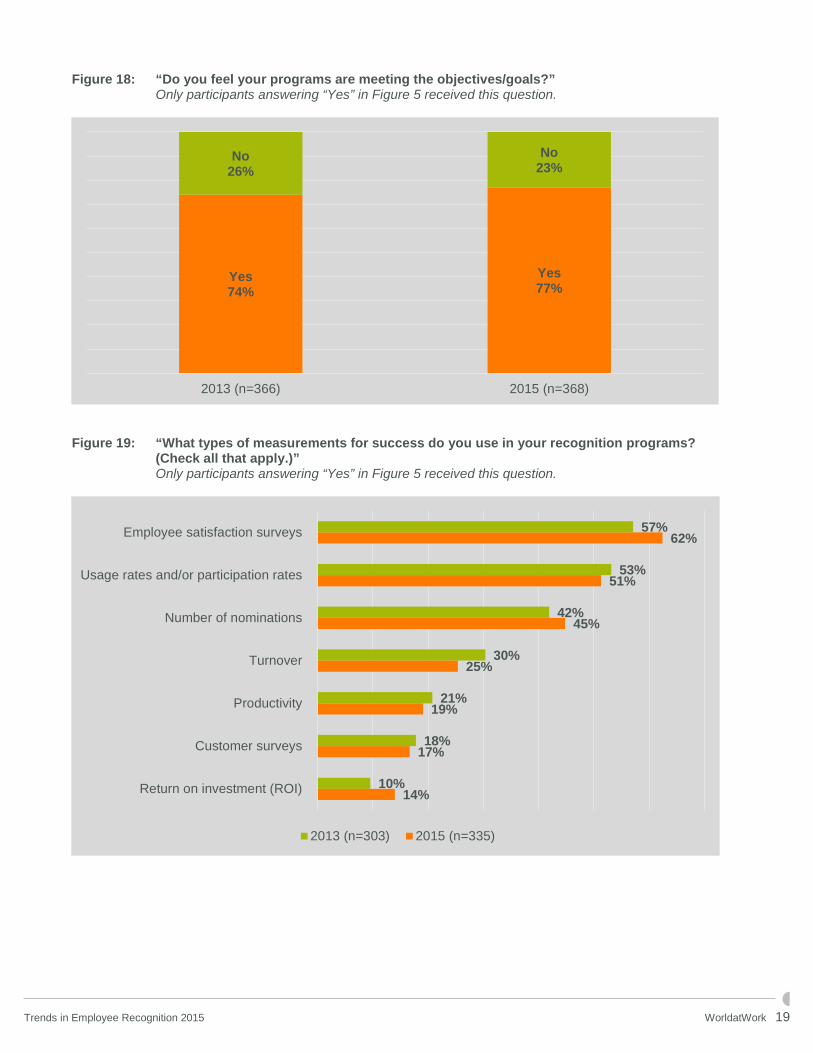
Figure 18: “Do you feel your programs are meeting the objectives/goals?” Only participants answering “Yes” in Figure 5 received this question.
Figure 19: “What types of measurements for success do you use in your recognition programs?
(Check all that apply.)” Only participants answering “Yes” in Figure 5 received this question.
Yes77%
Yes74%
No23%
No26%
2015 (n=368)2013 (n=366)
14%
17%
19%
25%
45%
51%
62%
10%
18%
21%
30%
42%
53%
57%
Return on investment (ROI)
Customer surveys
Productivity
Turnover
Number of nominations
Usage rates and/or participation rates
Employee satisfaction surveys
2013 (n=303) 2015 (n=335)
Trends in Employee Recognition 2015 WorldatWork 19
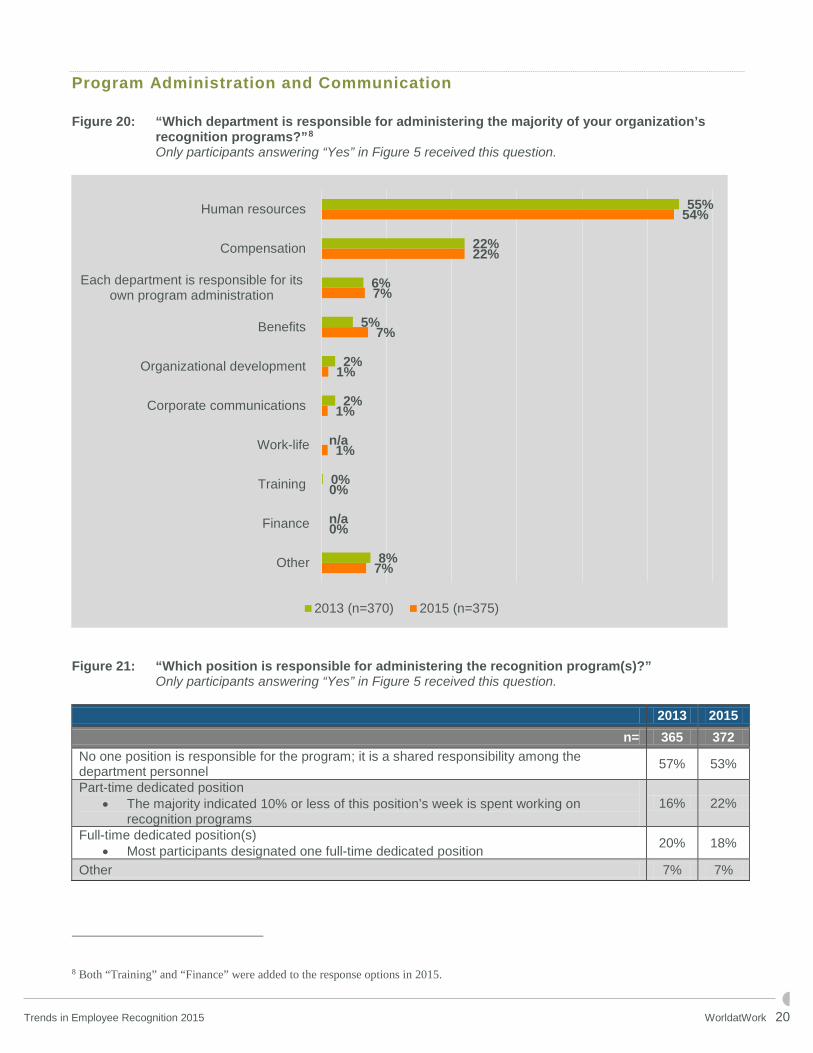
Program Administration and Communication Figure 20: “Which department is responsible for administering the majority of your organization’s
recognition programs?”8 Only participants answering “Yes” in Figure 5 received this question.
Figure 21: “Which position is responsible for administering the recognition program(s)?” Only participants answering “Yes” in Figure 5 received this question.
2013 2015 n= 365 372
No one position is responsible for the program; it is a shared responsibility among the department personnel 57% 53%
Part-time dedicated position • The majority indicated 10% or less of this position’s week is spent working on
recognition programs 16% 22%
Full-time dedicated position(s) • Most participants designated one full-time dedicated position 20% 18%
Other 7% 7%
8 Both “Training” and “Finance” were added to the response options in 2015.
7%
0%
0%
1%
1%
1%
7%
7%
22%
54%
8%
n/a
0%
n/a
2%
2%
5%
6%
22%
55%
Other
Finance
Training
Work-life
Corporate communications
Organizational development
Benefits
Each department is responsible for itsown program administration
Compensation
Human resources
2013 (n=370) 2015 (n=375)
Trends in Employee Recognition 2015 WorldatWork 20
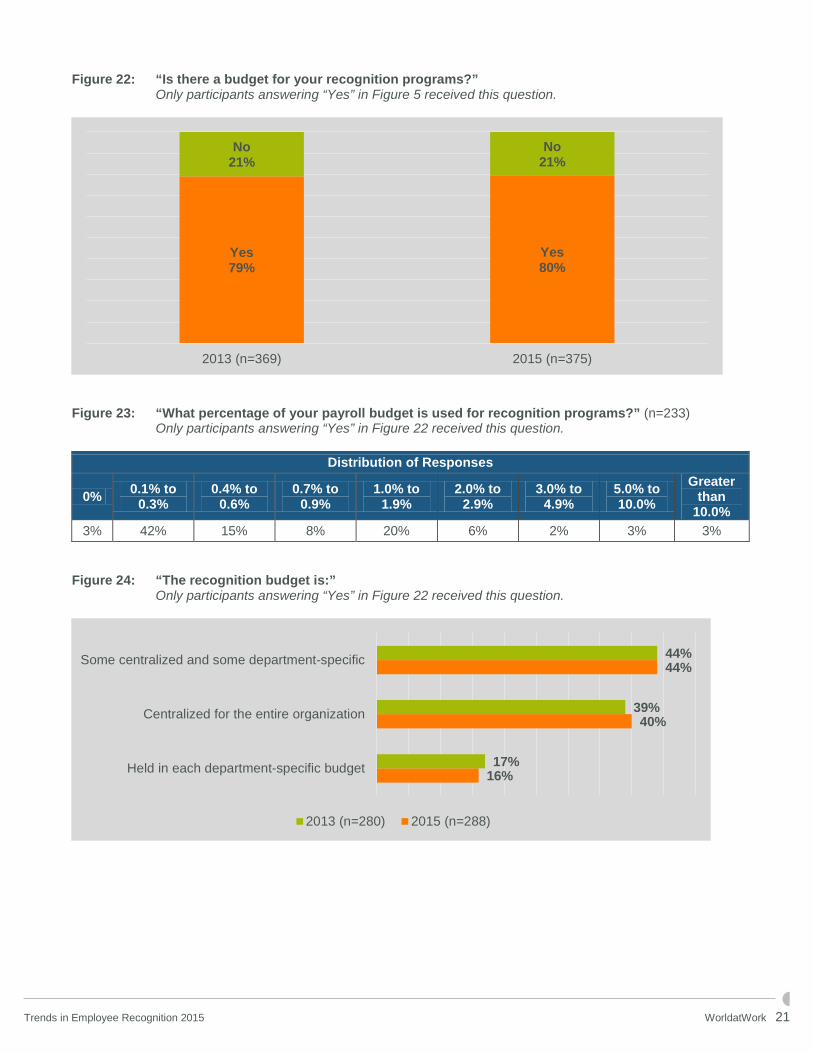
Figure 22: “Is there a budget for your recognition programs?” Only participants answering “Yes” in Figure 5 received this question.
Figure 23: “What percentage of your payroll budget is used for recognition programs?” (n=233) Only participants answering “Yes” in Figure 22 received this question.
Distribution of Responses
0% 0.1% to 0.3%
0.4% to 0.6%
0.7% to 0.9%
1.0% to 1.9%
2.0% to 2.9%
3.0% to 4.9%
5.0% to 10.0%
Greater than
10.0% 3% 42% 15% 8% 20% 6% 2% 3% 3%
Figure 24: “The recognition budget is:” Only participants answering “Yes” in Figure 22 received this question.
Yes80%
Yes79%
No21%
No21%
2015 (n=375)2013 (n=369)
16%
40%
44%
17%
39%
44%
Held in each department-specific budget
Centralized for the entire organization
Some centralized and some department-specific
2013 (n=280) 2015 (n=288)
Trends in Employee Recognition 2015 WorldatWork 21
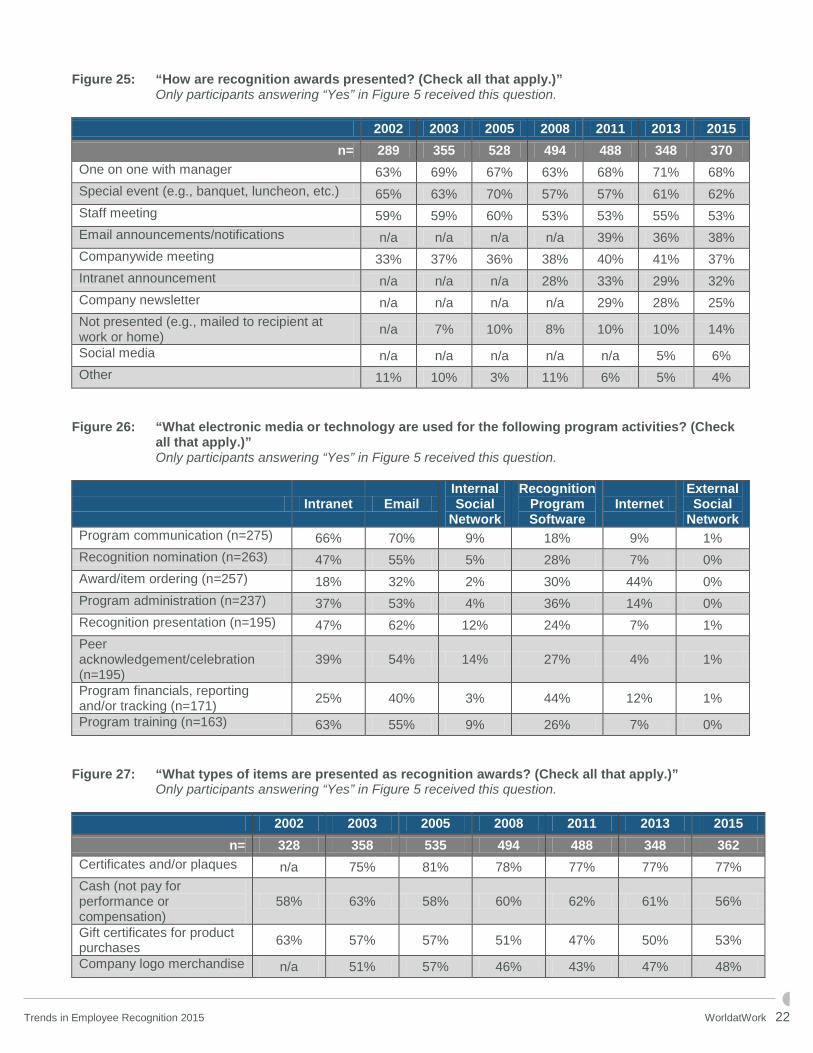
Figure 25: “How are recognition awards presented? (Check all that apply.)” Only participants answering “Yes” in Figure 5 received this question.
2002 2003 2005 2008 2011 2013 2015 n= 289 355 528 494 488 348 370
One on one with manager 63% 69% 67% 63% 68% 71% 68% Special event (e.g., banquet, luncheon, etc.) 65% 63% 70% 57% 57% 61% 62% Staff meeting 59% 59% 60% 53% 53% 55% 53% Email announcements/notifications n/a n/a n/a n/a 39% 36% 38% Companywide meeting 33% 37% 36% 38% 40% 41% 37% Intranet announcement n/a n/a n/a 28% 33% 29% 32% Company newsletter n/a n/a n/a n/a 29% 28% 25% Not presented (e.g., mailed to recipient at work or home) n/a 7% 10% 8% 10% 10% 14%
Social media n/a n/a n/a n/a n/a 5% 6% Other 11% 10% 3% 11% 6% 5% 4%
Figure 26: “What electronic media or technology are used for the following program activities? (Check
all that apply.)” Only participants answering “Yes” in Figure 5 received this question.
Intranet Email Internal Social
Network
Recognition Program Software
Internet External Social
Network Program communication (n=275) 66% 70% 9% 18% 9% 1% Recognition nomination (n=263) 47% 55% 5% 28% 7% 0% Award/item ordering (n=257) 18% 32% 2% 30% 44% 0% Program administration (n=237) 37% 53% 4% 36% 14% 0% Recognition presentation (n=195) 47% 62% 12% 24% 7% 1% Peer acknowledgement/celebration (n=195)
39% 54% 14% 27% 4% 1%
Program financials, reporting and/or tracking (n=171) 25% 40% 3% 44% 12% 1%
Program training (n=163) 63% 55% 9% 26% 7% 0% Figure 27: “What types of items are presented as recognition awards? (Check all that apply.)”
Only participants answering “Yes” in Figure 5 received this question.
2002 2003 2005 2008 2011 2013 2015 n= 328 358 535 494 488 348 362
Certificates and/or plaques n/a 75% 81% 78% 77% 77% 77% Cash (not pay for performance or compensation)
58% 63% 58% 60% 62% 61% 56%
Gift certificates for product purchases 63% 57% 57% 51% 47% 50% 53%
Company logo merchandise n/a 51% 57% 46% 43% 47% 48%
Trends in Employee Recognition 2015 WorldatWork 22
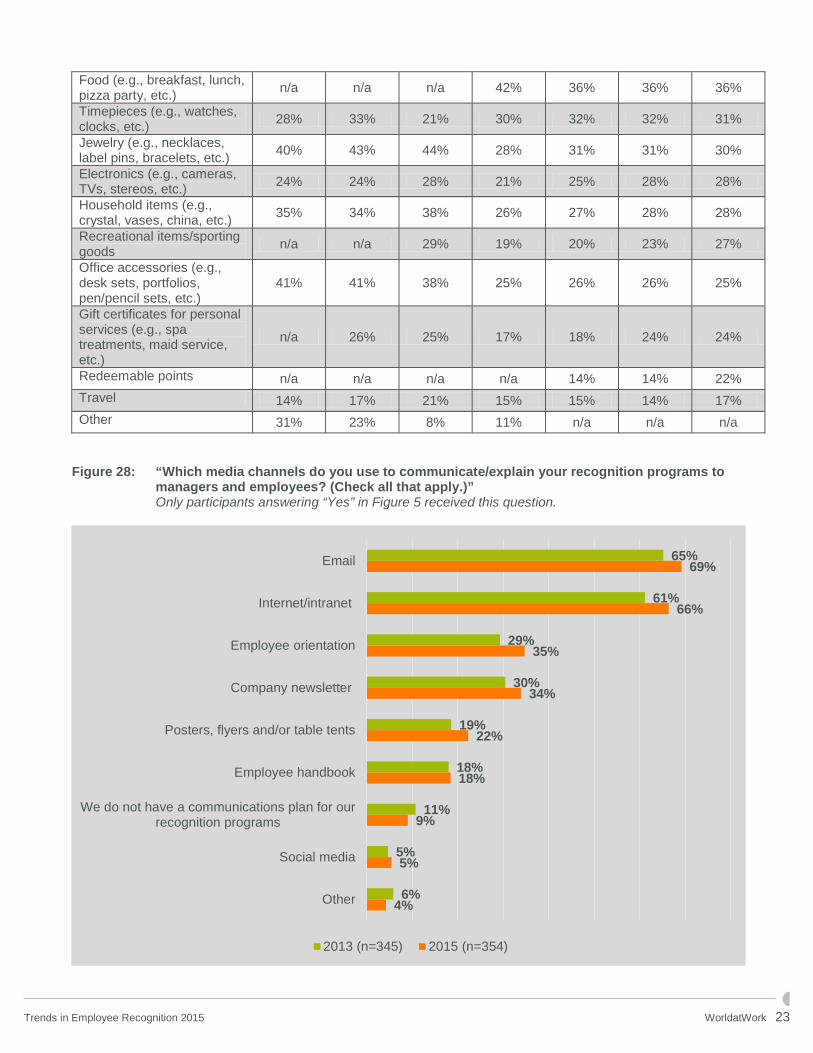
Food (e.g., breakfast, lunch, pizza party, etc.) n/a n/a n/a 42% 36% 36% 36%
Timepieces (e.g., watches, clocks, etc.) 28% 33% 21% 30% 32% 32% 31%
Jewelry (e.g., necklaces, label pins, bracelets, etc.) 40% 43% 44% 28% 31% 31% 30%
Electronics (e.g., cameras, TVs, stereos, etc.) 24% 24% 28% 21% 25% 28% 28%
Household items (e.g., crystal, vases, china, etc.) 35% 34% 38% 26% 27% 28% 28%
Recreational items/sporting goods n/a n/a 29% 19% 20% 23% 27%
Office accessories (e.g., desk sets, portfolios, pen/pencil sets, etc.)
41% 41% 38% 25% 26% 26% 25%
Gift certificates for personal services (e.g., spa treatments, maid service, etc.)
n/a 26% 25% 17% 18% 24% 24%
Redeemable points n/a n/a n/a n/a 14% 14% 22% Travel 14% 17% 21% 15% 15% 14% 17% Other 31% 23% 8% 11% n/a n/a n/a
Figure 28: “Which media channels do you use to communicate/explain your recognition programs to
managers and employees? (Check all that apply.)” Only participants answering “Yes” in Figure 5 received this question.
4%
5%
9%
18%
22%
34%
35%
66%
69%
6%
5%
11%
18%
19%
30%
29%
61%
65%
Other
Social media
We do not have a communications plan for ourrecognition programs
Employee handbook
Posters, flyers and/or table tents
Company newsletter
Employee orientation
Internet/intranet
2013 (n=345) 2015 (n=354)
Trends in Employee Recognition 2015 WorldatWork 23
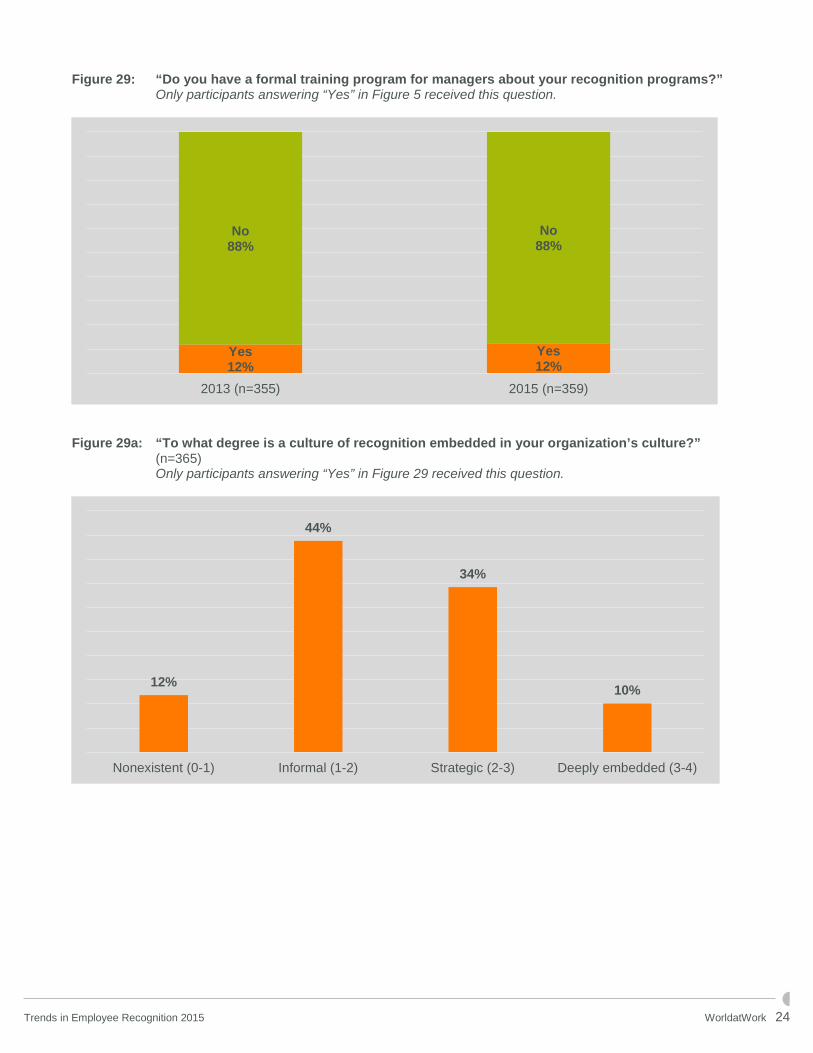
Figure 29: “Do you have a formal training program for managers about your recognition programs?” Only participants answering “Yes” in Figure 5 received this question.
Figure 29a: “To what degree is a culture of recognition embedded in your organization’s culture?”
(n=365) Only participants answering “Yes” in Figure 29 received this question.
Yes12%
Yes12%
No88%
No88%
2015 (n=359)2013 (n=355)
12%
44%
34%
10%
Nonexistent (0-1) Informal (1-2) Strategic (2-3) Deeply embedded (3-4)
Trends in Employee Recognition 2015 WorldatWork 24
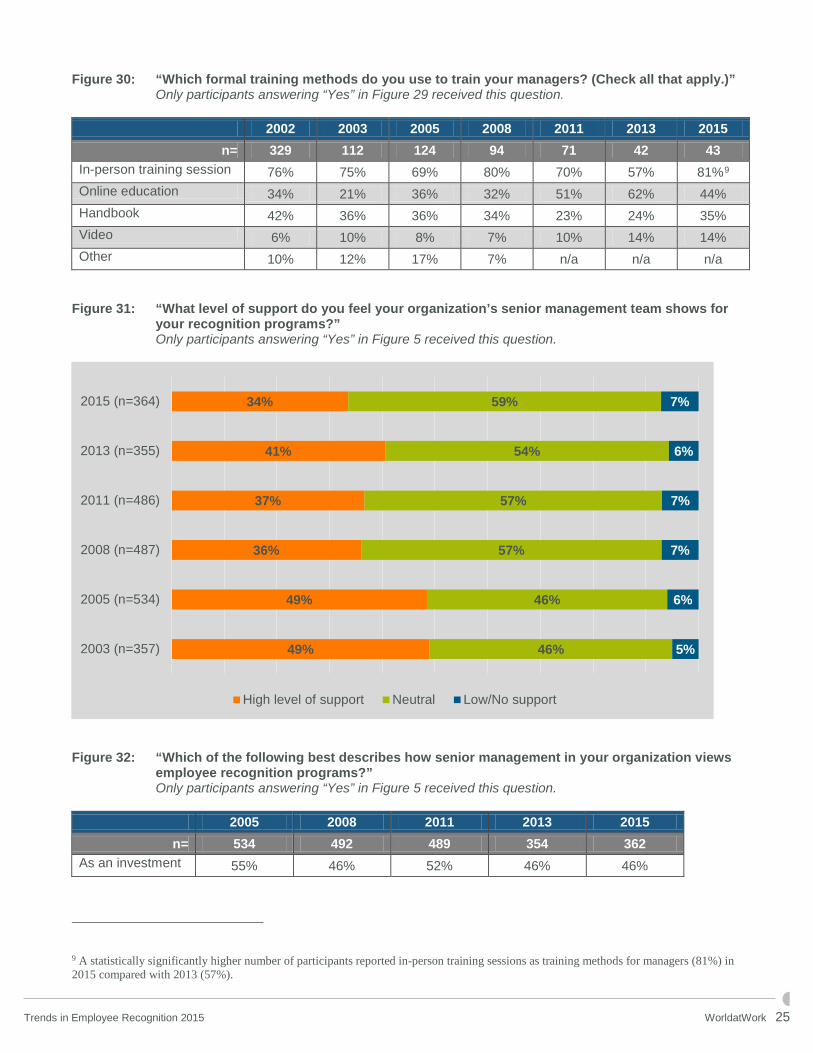
Figure 30: “Which formal training methods do you use to train your managers? (Check all that apply.)” Only participants answering “Yes” in Figure 29 received this question.
2002 2003 2005 2008 2011 2013 2015 n= 329 112 124 94 71 42 43
In-person training session 76% 75% 69% 80% 70% 57% 81%9 Online education 34% 21% 36% 32% 51% 62% 44% Handbook 42% 36% 36% 34% 23% 24% 35% Video 6% 10% 8% 7% 10% 14% 14% Other 10% 12% 17% 7% n/a n/a n/a
Figure 31: “What level of support do you feel your organization’s senior management team shows for
your recognition programs?” Only participants answering “Yes” in Figure 5 received this question.
Figure 32: “Which of the following best describes how senior management in your organization views
employee recognition programs?” Only participants answering “Yes” in Figure 5 received this question.
2005 2008 2011 2013 2015 n= 534 492 489 354 362
As an investment 55% 46% 52% 46% 46%
9 A statistically significantly higher number of participants reported in-person training sessions as training methods for managers (81%) in 2015 compared with 2013 (57%).
34%
41%
37%
36%
49%
49%
59%
54%
57%
57%
46%
46%
7%
6%
7%
7%
6%
5%
2015 (n=364)
2013 (n=355)
2011 (n=486)
2008 (n=487)
2005 (n=534)
2003 (n=357)
High level of support Neutral Low/No support
Trends in Employee Recognition 2015 WorldatWork 25
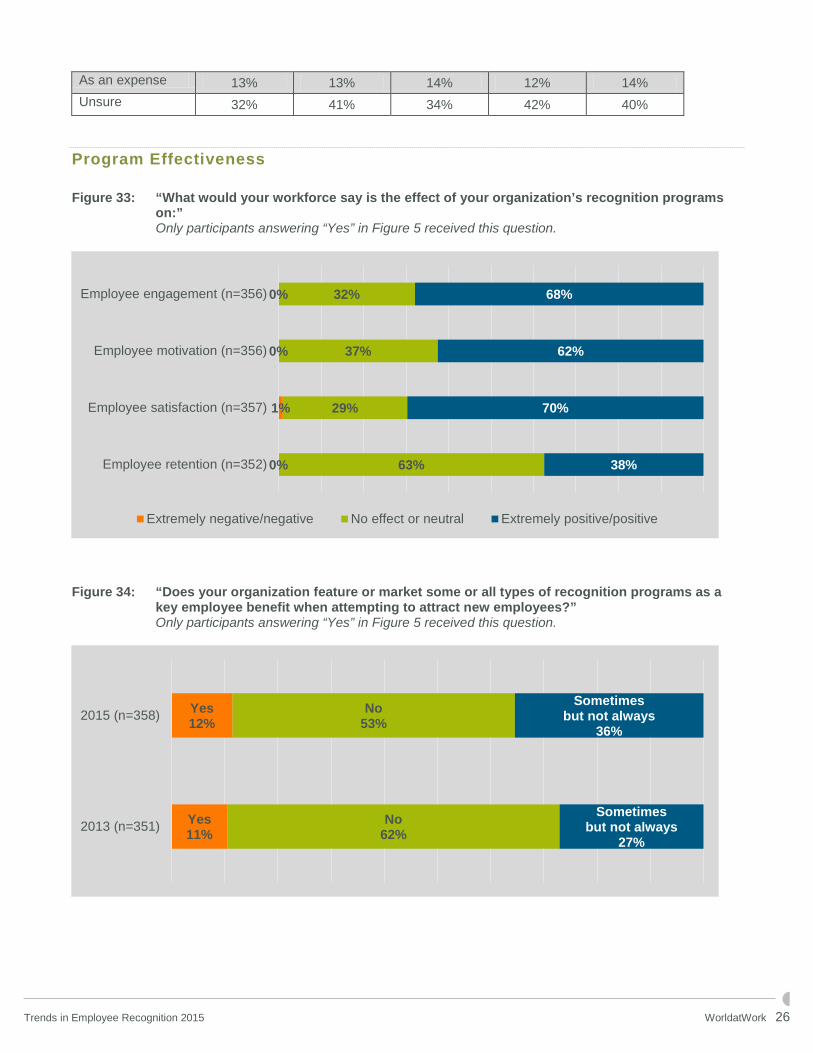
As an expense 13% 13% 14% 12% 14% Unsure 32% 41% 34% 42% 40%
Program Effectiveness Figure 33: “What would your workforce say is the effect of your organization’s recognition programs
on:” Only participants answering “Yes” in Figure 5 received this question.
Figure 34: “Does your organization feature or market some or all types of recognition programs as a
key employee benefit when attempting to attract new employees?” Only participants answering “Yes” in Figure 5 received this question.
0%
1%
0%
0%
63%
29%
37%
32%
38%
70%
62%
68%
Employee retention (n=352)
Employee satisfaction (n=357)
Employee motivation (n=356)
Employee engagement (n=356)
Extremely negative/negative No effect or neutral Extremely positive/positive
Yes12%
Yes11%
No53%
No62%
Sometimesbut not always
36%
Sometimesbut not always
27%
2015 (n=358)
2013 (n=351)
Trends in Employee Recognition 2015 WorldatWork 26
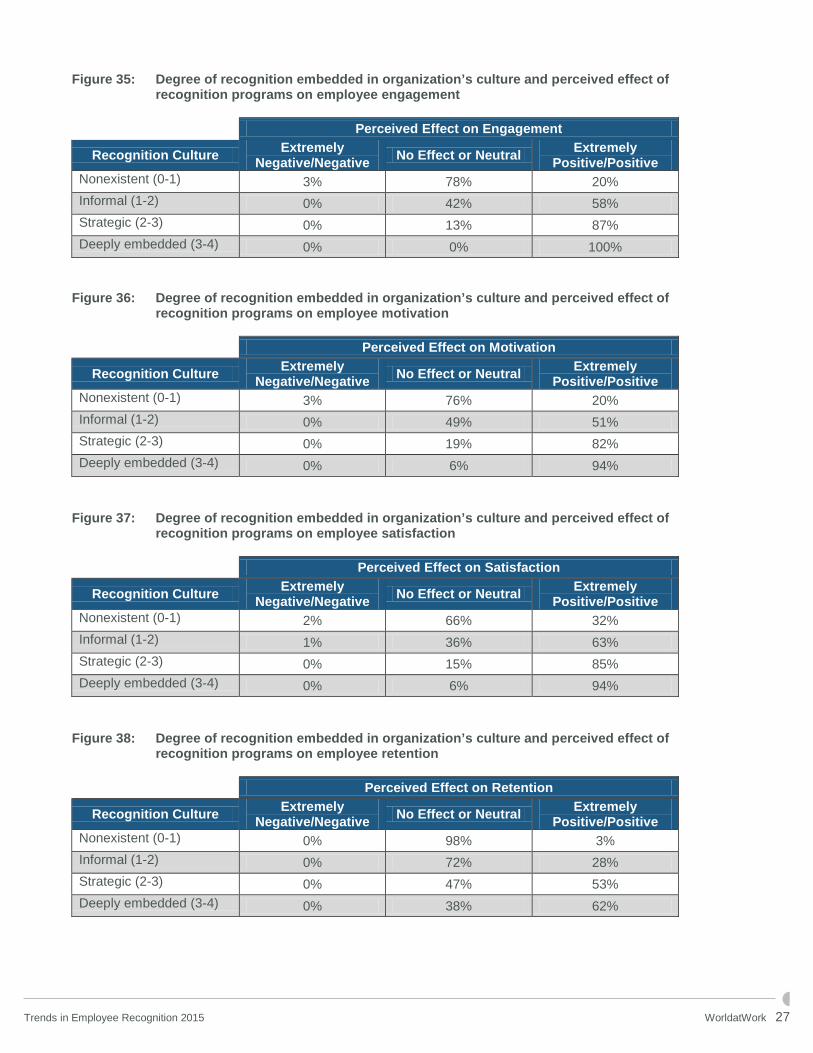
Figure 35: Degree of recognition embedded in organization’s culture and perceived effect of recognition programs on employee engagement
Perceived Effect on Engagement
Recognition Culture Extremely Negative/Negative No Effect or Neutral Extremely
Positive/Positive Nonexistent (0-1) 3% 78% 20% Informal (1-2) 0% 42% 58% Strategic (2-3) 0% 13% 87% Deeply embedded (3-4) 0% 0% 100%
Figure 36: Degree of recognition embedded in organization’s culture and perceived effect of
recognition programs on employee motivation
Perceived Effect on Motivation
Recognition Culture Extremely Negative/Negative No Effect or Neutral Extremely
Positive/Positive Nonexistent (0-1) 3% 76% 20% Informal (1-2) 0% 49% 51% Strategic (2-3) 0% 19% 82% Deeply embedded (3-4) 0% 6% 94%
Figure 37: Degree of recognition embedded in organization’s culture and perceived effect of
recognition programs on employee satisfaction
Perceived Effect on Satisfaction
Recognition Culture Extremely Negative/Negative No Effect or Neutral Extremely
Positive/Positive Nonexistent (0-1) 2% 66% 32% Informal (1-2) 1% 36% 63% Strategic (2-3) 0% 15% 85% Deeply embedded (3-4) 0% 6% 94%
Figure 38: Degree of recognition embedded in organization’s culture and perceived effect of
recognition programs on employee retention
Perceived Effect on Retention
Recognition Culture Extremely Negative/Negative No Effect or Neutral Extremely
Positive/Positive Nonexistent (0-1) 0% 98% 3% Informal (1-2) 0% 72% 28% Strategic (2-3) 0% 47% 53% Deeply embedded (3-4) 0% 38% 62%
Trends in Employee Recognition 2015 WorldatWork 27
Result-Driven Recognition Programs
In an effort to better understand the use and effectiveness of recognition programs that are designed to drive a specific result, four recognition programs were analyzed separately. The four programs are part of the full list of recognition programs reported individually in Figure 11; they are analyzed below, collectively, as “result-driven recognition programs”:
1. Above-and-beyond performance recognition
2. Peer-to-peer recognition
3. Recognition programs that motivate specific behaviors
4. Recognition programs to improve biometric indices through wellness initiatives.
This analysis was first introduced in 2013 in a supplemental report to the “Trends in Employee Recognition” survey; however, the methodology has changed. In 2013, the focus was on organizations with “at least” a specific number of programs. This 2015 report examines the effects when exactly one, two, three or four of the four result-driven programs are in place. Additionally, “recognition programs that improve biometric indices through wellness initiatives” was a new survey option this year and was included in this collective analysis, for a total of four programs. For more information on the 2013 results, please see the Supplemental Report.
Figure 39: Number of result-driven recognition programs in use at respondent organizations
20% 21%
25%22%
13%
0 (n=93) 1 (n=94) 2 (n=112) 3 (n=99) 4 (n=59)Number of Result-Driven Programs in Use
Trends in Employee Recognition 2015 WorldatWork 28
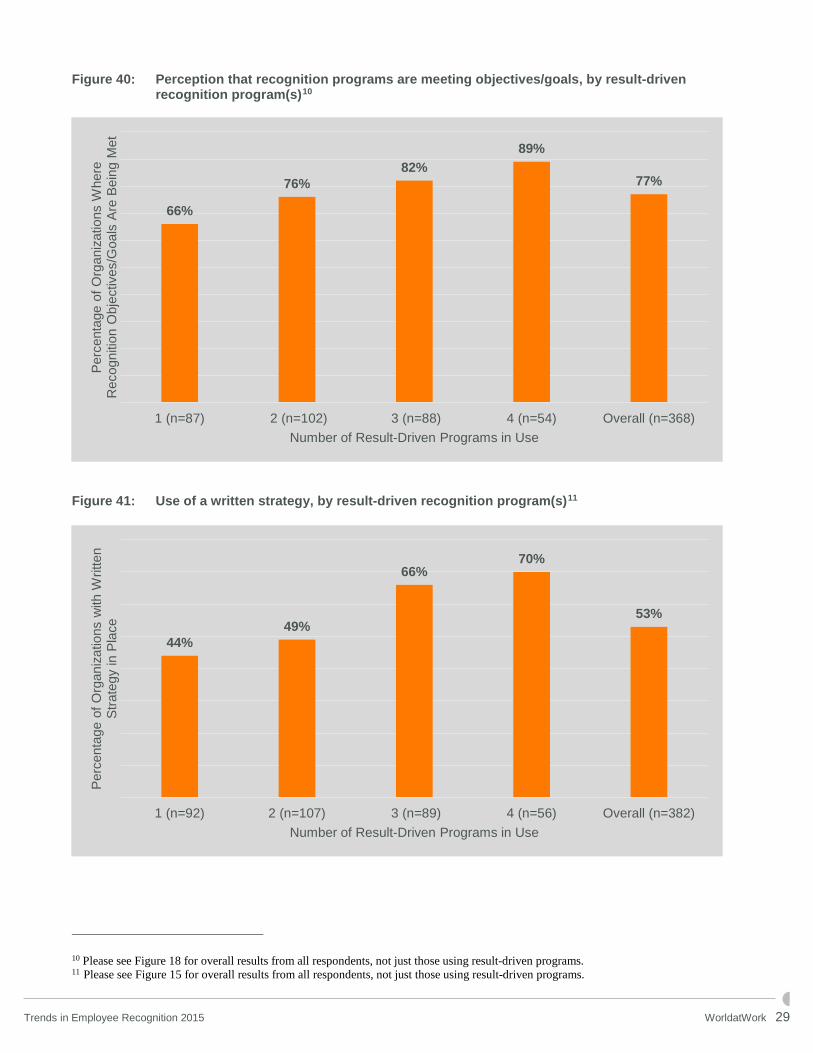
Figure 40: Perception that recognition programs are meeting objectives/goals, by result-driven recognition program(s)10
Figure 41: Use of a written strategy, by result-driven recognition program(s)11
10 Please see Figure 18 for overall results from all respondents, not just those using result-driven programs. 11 Please see Figure 15 for overall results from all respondents, not just those using result-driven programs.
66%
76%82%
89%
77%
1 (n=87) 2 (n=102) 3 (n=88) 4 (n=54) Overall (n=368)
Perc
enta
ge o
f Org
aniz
atio
ns W
here
R
ecog
nitio
n O
bjec
tives
/Goa
ls A
re B
eing
Met
Number of Result-Driven Programs in Use
44%49%
66%70%
53%
1 (n=92) 2 (n=107) 3 (n=89) 4 (n=56) Overall (n=382)
Perc
enta
ge o
f Org
aniz
atio
ns w
ith W
ritte
n St
rate
gy in
Pla
ce
Number of Result-Driven Programs in Use
Trends in Employee Recognition 2015 WorldatWork 29
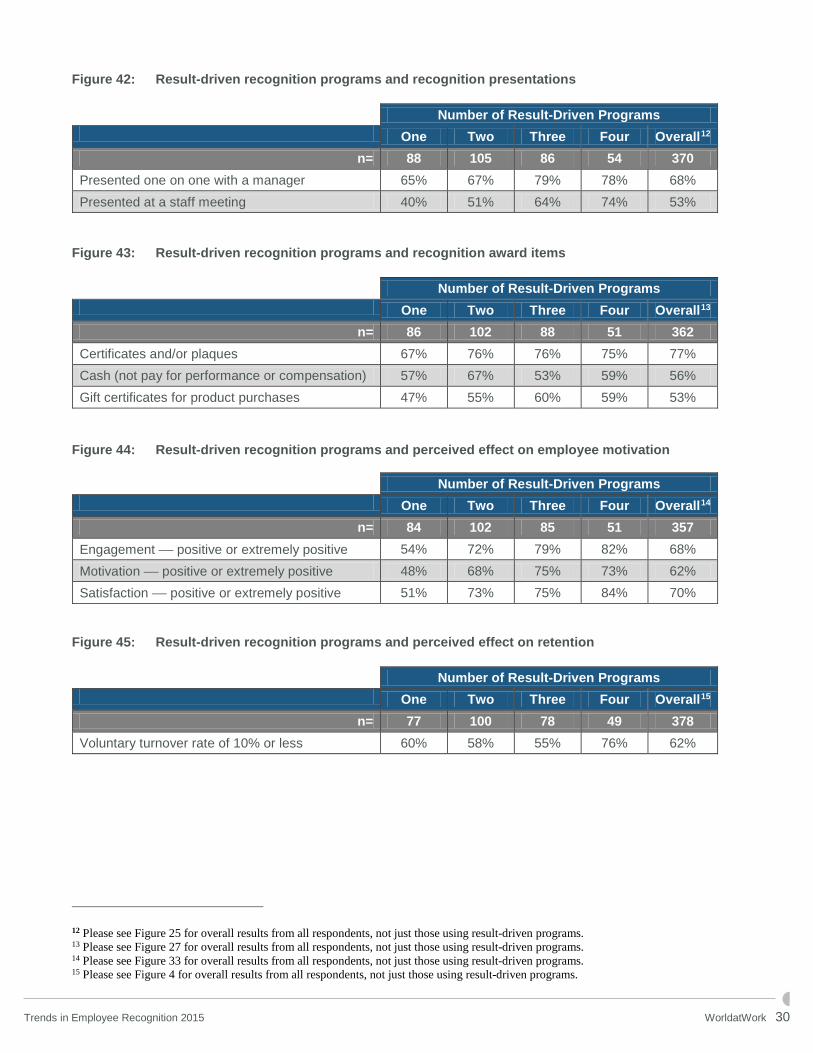
Figure 42: Result-driven recognition programs and recognition presentations
Number of Result-Driven Programs One Two Three Four Overall12
n= 88 105 86 54 370 Presented one on one with a manager 65% 67% 79% 78% 68% Presented at a staff meeting 40% 51% 64% 74% 53%
Figure 43: Result-driven recognition programs and recognition award items
Number of Result-Driven Programs One Two Three Four Overall13
n= 86 102 88 51 362 Certificates and/or plaques 67% 76% 76% 75% 77% Cash (not pay for performance or compensation) 57% 67% 53% 59% 56% Gift certificates for product purchases 47% 55% 60% 59% 53%
Figure 44: Result-driven recognition programs and perceived effect on employee motivation
Number of Result-Driven Programs One Two Three Four Overall14
n= 84 102 85 51 357 Engagement — positive or extremely positive 54% 72% 79% 82% 68% Motivation — positive or extremely positive 48% 68% 75% 73% 62% Satisfaction — positive or extremely positive 51% 73% 75% 84% 70%
Figure 45: Result-driven recognition programs and perceived effect on retention
Number of Result-Driven Programs One Two Three Four Overall15
n= 77 100 78 49 378 Voluntary turnover rate of 10% or less 60% 58% 55% 76% 62%
12 Please see Figure 25 for overall results from all respondents, not just those using result-driven programs. 13 Please see Figure 27 for overall results from all respondents, not just those using result-driven programs. 14 Please see Figure 33 for overall results from all respondents, not just those using result-driven programs. 15 Please see Figure 4 for overall results from all respondents, not just those using result-driven programs.
Trends in Employee Recognition 2015 WorldatWork 30
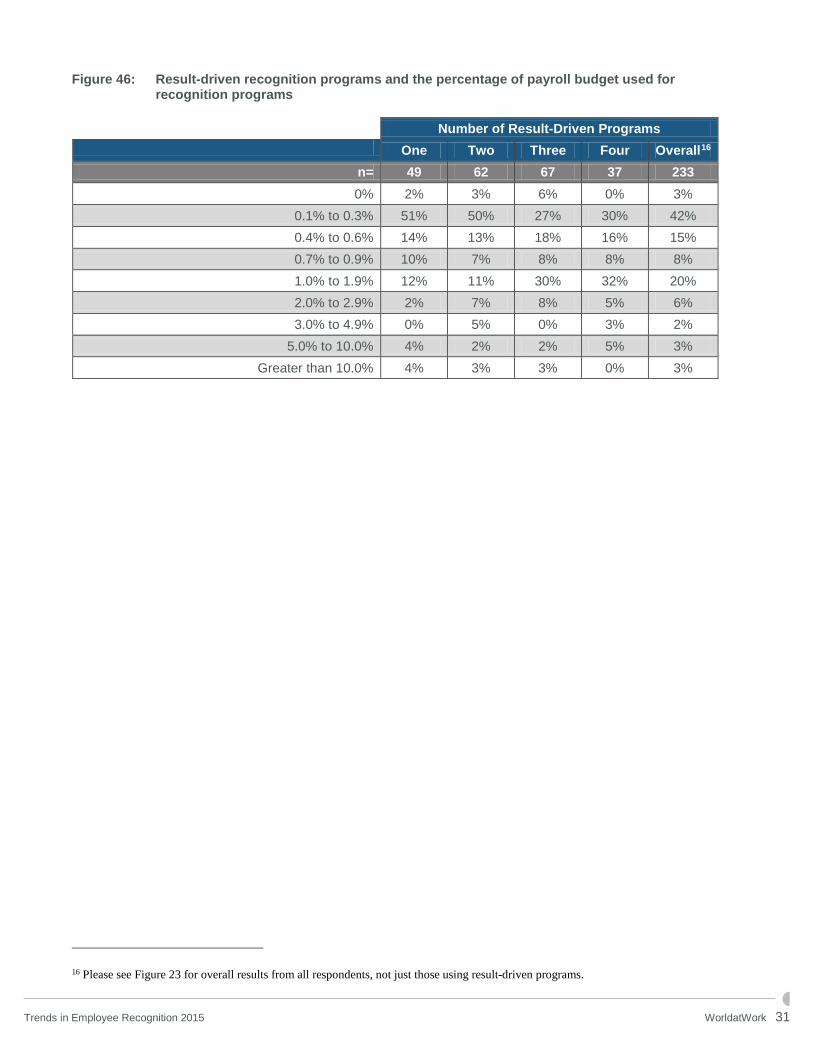
Figure 46: Result-driven recognition programs and the percentage of payroll budget used for recognition programs
Number of Result-Driven Programs One Two Three Four Overall16
n= 49 62 67 37 233 0% 2% 3% 6% 0% 3%
0.1% to 0.3% 51% 50% 27% 30% 42% 0.4% to 0.6% 14% 13% 18% 16% 15% 0.7% to 0.9% 10% 7% 8% 8% 8% 1.0% to 1.9% 12% 11% 30% 32% 20% 2.0% to 2.9% 2% 7% 8% 5% 6% 3.0% to 4.9% 0% 5% 0% 3% 2%
5.0% to 10.0% 4% 2% 2% 5% 3% Greater than 10.0% 4% 3% 3% 0% 3%
16 Please see Figure 23 for overall results from all respondents, not just those using result-driven programs.
Trends in Employee Recognition 2015 WorldatWork 31
Participating Organizations 2020 24 Hour Fitness USA Inc. AAM AbbVie Abt Associates Adventist Health System Air Liquide USA LLC Airbus Helicopters Inc. Alameda Health System Alexandria Renew Enterprises Alliance Data Alliance Data Retail Services Allianz Global Assistance Allied Motion Technologies Alta Resources AM Castle & Co. American Red Cross AMSEC LLC Anheuser-Busch Employees' Credit Union ANSYS Inc. ARAG Ascend Performance Materials Astron Solutions Asurion Atmos Energy Corp. Australian Pharmaceutical Industries Baird BASF Baxter Big Heart Pet Brands Black Hills Corp. Blue Cross Blue Shield of Kansas BlueCross BlueShield of South Carolina BMI Boeing Booz Allen Hamilton Brinker International Brookfield GRS BRP Inc. Canadian Science Publishing Canon Virginia Inc. Carlton & United Breweries Casino Pauma CEI Engineering Associates Celestica Centro Charter Communications Cincinnati Children's Hospital Cisco Systems City of Aspen City of Seattle
Coca-Cola Enterprises CommScope Community Health Plan of Washington Continental Automotive Systems Cook Children's Health Care System Corporate Compensation Strategies Country Casual County of Simcoe Crocs Cumberland Farms Inc. Cytec Industries Inc. Daiichi Sankyo DATA Group Ltd. Daymon Worldwide Delhaize America Desert Schools Federal Credit Union Dewberry DHL Express (Australia) Pty Ltd. DIALOG Dialog Semiconductor Digi International Dunkin' Brands Inc. Edmonton Kenworth Ltd. Eli Lilly and Co. Emergency Medical Care Emory Healthcare Empire Life Employers Resource Association Encana Endo International plc Equity & More Erie Insurance Group Exelon Corp. EZCORP Inc. Federal Home Loan Bank of Des Moines Federal Reserve Board Feeding America Ferrellgas Fike Corp. FINRA First American FirstEnergy Fluor Federal Petroleum Ford Motor Co. General Mills Goodman Networks Google Grande Cheese Co. Great River Energy Guild Mortgage Co. Halifax Port Authority
Trends in Employee Recognition 2015 WorldatWork 32
Hazelden Betty Ford Foundation Health Net Inc. Hendry County Henry Schein Canada Inc. Hess Hewlett-Packard HollyFrontier Holt Renfrew HomeAway Inc. Homesite Insurance HUB International HubSpot Hyundai Capital America Imerys USA Inc. Ingram Barge Co. Insperity Inter-Coastal Electronics Inc. International Dairy Queen Jack in the Box Inc. JEA Jet Propulsion Laboratory Jo-Ann Stores LLC Johns Hopkins-Applied Physics Laboratory Johnson & Johnson JT3 LLC K+S Potash Canada GP Kelsey-Seybold Clinic Kiewit Kingston General Hospital KSB Hospital Lake Region Medical Laureate Education Inc. Level 3 Communication Liberty Bank LifeLabs Lincoln Financial Group Louisiana State Civil Service Manitoba Liquor & Lotteries MAPFRE Insurance MassMutual Mazda Canada Inc. MillerCoors MIT Lincoln Laboratory Mitchell International Inc. MITRE Monsanto Motorola Solutions MSA Safety Inc. National Fuel Gas National Pen Co. Nature's Path Foods New Hampshire Housing Finance Authority Nike Inc. Nordion Inc.
Nordson Corp. North Shore Medical Center NorthStar Financial Services Group LLC NOVA Chemicals Novartis Oncor Electric Delivery Panasonic Corporation of North America Patheon Pentagon Federal Credit Union Perfetti Van Melle Philip Morris International Phoenix Children’s Hospital Piedmont Natural Gas Pinnacle Health System Polycom Princeton HealthCare System Printec Group of Companies Printronix Proteus Digital Health Protiviti Qualcomm Quantum Corp. RAE Engineering and Inspection Ltd. Regency Centers Regeneron Pharmaceuticals Revenu Québec Ridgewood Savings Bank Roche ROIG Lawyers Royal FrieslandCampina N.V. Rubino Consulting Services Ryerson University Rytec Corp. Safelite Group Saint Mary's Hospital Salt River Project Santee Cooper Savers Inc. Schindler Elevator Corp. SciClone Pharmaceuticals Inc. Seven West Media SharpShooter Imaging Shire Siemens (USA) Sierra Nevada Corp. Sirius Computer Solutions Smiths Medical ASD Inc. Sofina Foods Inc. Splunk Inc. Sports Authority St. Jude Children's Research Hospital St. Louis County Government Staples Canada Inc. State Farm
Trends in Employee Recognition 2015 WorldatWork 33
SYMANTEC Symetra Financial SYNNEX Corp. Tallgrass Energy Partners TEES Terumo BCT Texas Mutual Insurance Co. The Croner Co. The Lubrizol Corp. The Manitowoc Co. The Maschhoffs LLC The Queen's Medical Center The Urban Institute The Walt Disney Co. The Wawanesa Mutual Insurance Co. Topa Insurance Group Towers Watson Town of Gilbert, Arizona TransAlta Corp. Travelers TriZetto Unisys
University Hospitals University of California Riverside University of St. Thomas University of Toronto USG Corp. USO Inc. Vantage West Credit Union Vidant Health Vitamix Volvo Group US Whirlpool Corp. White Castle Wilson Group Wolseley Canada Wolverine Advanced Materials Wood Group Mustang Yakima Valley Memorial Hospital Yellow Pages YuMe Inc. Zimmer Inc. Zurich
Trends in Employee Recognition 2015 WorldatWork 34