Embed Size (px)
Citation preview
Triggering Mechanisms and Rainfall Thresholds of Shallow Landslides on Soil-mantled Hillslopes
with Permeable and Impermeable Bedrocks
January 2006
Yuki MATSUSHI
Triggering Mechanisms and Rainfall Thresholds of Shallow Landslides on
Soil-mantled Hillslopes with Permeable and Impermeable Bedrocks
A Dissertation Submitted to
the Graduate School of Life and Environmental Sciences,
the University of Tsukuba
in Partial Fulfillment of the Requirements
for the Degree of Doctor of Philosophy in Science
(Doctoral Program in Geoenvironmental Sciences)
Yuki MATSUSHI
i
Abstract
Rainfall-induced shallow landslides occur in most soil-mantled steep hillslopes as a
dominant denudation process in humid temperate regions. This study revealed the
hydrological-triggering mechanisms and rainfall thresholds of landslides in adjoining
hills with permeable sandstone and impermeable mudstone bedrocks in the Boso
Peninsula, Japan. Detailed field and laboratory investigations were conducted to
inspect the subsurface structures and to obtain geotechnical properties of slope
materials. The characteristics of slope hydrology were inferred from pressure-head
monitoring and rainfall–runoff observations. An analysis of slope stability identified
critical conditions for the several past landslides.
Hydrological triggering of landslides differs with hillslope lithology. Rainwater
percolates through the permeable sandstone slope as an unsaturated gravitational flow.
The wetting front migration results in a decrease in soil cohesion and causes
landsliding at the steep lower part of the hillslopes. In the hillslope with the
impermeable mudstone, the hydraulic discontinuity beneath a thin soil layer causes a
transient positive pressure head that generates a saturated subsurface storm flow. The
reduction in effective normal stress triggers a shallow soil slip at the uppermost part of
hollows.
An analysis of the relationship between the magnitude of rainfall and hillslope
instability provides a rainfall threshold for landsliding. The rainfall threshold can be
expressed by a power-law function that combines rainfall intensity and duration. The
site-specific combination of rainfall intensity and duration incorporates geotechnical
properties of hillslope materials and slope hydrological processes. The hillslope with

ii
permeable sandstone has greater critical rainfall and hence a longer recurrence interval
than the impermeable mudstone hillslope. This implies the lower potential for
landsliding in the sandstone hillslopes, corresponding to the lower landslide activity.
Keywords: shallow landslides, hillslope hydrology, slope stability, critical rainfall,
permeability, pressure head, soil-water characteristic curve, shear strength
iii
Contents
Page
Abstract i
Contents iii
List of Tables vi
List of Figures vii
Chapter I Introduction 1
I-1 Importance of rainfall-induced shallow landslides 1
I-2 Previous studies and their problems 3
I-3 Purpose and approach of this study 6
Chapter II Study area 8
II-1 General settings 8
II-2 Topography of the hills 9
II-3 Spatial and temporal distribution of shallow landslides 10
Chapter III Slope morphology and subsurface structure 13
III-1 Slopes 13
III-2 Soil sounding and geophysical surveys 13
III-3 Soil thickness 15
III-4 Geophysical structures 15
III-5 Sallow soil profiles 16
Chapter IV Geotechnical soil properties 18
IV-1 Soil sampling and geotechnical tests 18
IV-2 Basal soil properties 19
iv
IV-3 Permeability 19
IV-4 Soil-water retention characteristic 20
IV-5 Shear strength 22
Chapter V Slope hydrology 26
V-1 Methods of hydrological observations 26
V-2 Long-term fluctuations of pressure head and rainfall–runoff
characteristics 28
V-3 Short-term response of pressure head to rain infiltration and
subsurface water behavior 29
V-4 In situ soil-water retention characteristics 30
Chapter VI Discussion 32
VI-1 Landslide mechanisms 32
VI-1-1 Slope stability analysis 32
VI-1-2 Critical conditions for landsliding 34
VI-1-3 Hydrological triggering of the landslides 35
VI-1-4 Implication of the landslide-triggering mechanisms to
landslide locations and hill morphologies 39
VI-2 Rainfall thresholds for landsliding 40
VI-2-1 Changes in factor of safety during rain storms 40
VI-2-2 Analysis of the relationship between the magnitudes of
rainfall and slope instability 42
VI-2-3 Critical combinations of rainfall intensity and duration 45
VI-2-4 Recurrence intervals of the critical rainfall 47
VI-3 Summary of discussion, advantages and future prospects 48

v
Chapter VII Conclusions 50
Acknowledgements 52
References 53
Tables 64
Figures 73

vi
List of Tables
Page
Table 1 Sequence of landslide occurrence from aerial photographs 64
Table 2 Dimensions of the landslides 65
Table 3 Physical properties of the soils 66
Table 4 Optimum parameter values for the model fitted to soil-water
retention characteristics 67
Table 5 Moisture contents and shear test results for each specimen group 68
Table 6 Shear strength parameters obtained by a simple linear-regression
for the dataset of each specimen group 70
Table 7 Optimum parameter values for the regressions for reduction in
soil shear strength 71
Table 8 Parameter values for envelopes of in situ the soil-water retention
plots 72
vii
List of Figures
Page
Figure 1 Location and shaded relief map of the study area 73
Figure 2 Climatic conditions of the study area 74
Figure 3 Geologic map and topographic cross-sections of the study
area 75
Figure 4 Records of annual maximum daily rainfall in the study
area 76
Figure 5 Rainfall records of the 1989 storm 77
Figure 6 Aerial photographs taken in 1990 78
Figure 7 Landslide densities for the past two decades 79
Figure 8 Locations of the selected slopes and topographic maps
of the observed watersheds 80
Figure 9 Profiles of the selected slopes, and plan views and cross
sections of slip scars 81
Figure 10 Subsurface structures of the hillslopes inferred from soil
soundings and geophysical surveys 82
Figure 11 Shallow soil profiles at the soil pits with depth variations
of the cone penetration resistance 84
Figure 12 Grain-size distributions of the soils 85
Figure 13 Vertical profiles of hydraulic conductivity 86
Figure 14 Soil-water characteristic curves of the soils 87
Figure 15 Results of shear tests for the soil specimens with varied
moisture contents 88
viii
Figure 16 Relations between the volumetric water content and
shear strength parameters 89
Figure 17 Results of multiple linear-regression analyses for the
formulation of shear strength reduction 90
Figure 18 Reduction in shear strength with respect to increasing
soil volumetric water content 91
Figure 19 Comparison of measured and calculated shear strength 92
Figure 20 Pressure head fluctuations in slopes and hydrographs in
watersheds for the entire observation period 93
Figure 21 Short-term pressure head responses and equipotential
lines of hydraulic head during May 19 to 21, 2004 97
Figure 22 Changes in volumetric water content in slopes with
fluctuations of pressure head at corresponding depths 98
Figure 23 Soil-water retention plots from in situ monitoring 99
Figure 24 Schematic illustration of the infinite-slope model for the
limit equilibrium stability analysis 100
Figure 25 Simulation of the reduction in factor of safety with
increasing pressure head 101
Figure 26 Schematic illustrations showing hydrological landslide-
triggering mechanisms 102
Figure 27 Slope stability fluctuations calculated from observed
pressure heads 103
Figure 28 Analytical procedures for determining critical rainfall 105
ix
Figure 29 Inverse correlations between the minimum factors of
safety and mean rainfall intensities at the most effective
rainfall duration 106
Figure 30 Rainfall thresholds for landsliding and temporal changes
in mean rainfall intensity of the torrential rainfall on
August 1, 1989 107
Figure 31 Recurrence intervals of the critical rainfall 108
Figure 32 Hydrological landslide-triggering cycles in hillslopes with
permeable and impermeable bedrocks 109

1
Chapter I Introduction
I-1 Importance of rainfall-induced shallow landslides
Shallow landslides in response to heavy rainstorms occur in soil-mantled steep
hillslopes as a dominant erosional process in humid temperate regions. Landslides
remove materials from hillslopes and scour low-order channels, supplying a large
quantity of sediment to high-order fluvial systems (Dietrich and Dunne, 1978).
Denudation by landsliding occupies the majority of total sediment yield from drainage
basins (Aniya, 1985).
Most shallow landslides are located on unchanneled hollows as evidence of ongoing
upslope development of valley heads (Tsukamoto, 1973; Tsukamoto et al., 1982;
Reneau and Dietrich, 1987). Repetition of landslides promotes sustaining growth of
hillslope depression, determining persistent spacing of hollows and noses in drainage
basins (Iida and Okunishi, 1979, 1983). Therefore, location of landslides controls
expansion of channel networks (Montgomery and Dietrich, 1988, 1992). Frequent
landsliding enhances highly bifurcating drainage structure, by increasing density of
shallow drainage depressions in upper hillslopes (Inoue and Oguchi, 1995).
Drainage density correlates negatively with relative relief of basins or slopes in a
steep terrain subject to frequent landsliding (Oguchi, 1997; Tucker and Bras, 1998;
Talling and Sowter, 1999). This indicates that landslides play a vital role in forming
low-relief and finely-dissected landscapes (Mino, 1942, pp. 362–370; Yatsu, 1950),
since they actively reduce ridges and develop small headwaters. Consequently, spatial
and temporal distributions of shallow landslides are important controls on long-term
change of the hilly landscapes.
2
Hill morphology depends clearly on geology, reflecting the long-term results of
cumulative denudation of hillslopes. Suzuki et al. (1985) pointed out that permeability
and strength of bedrocks behave as crucial agents for landscape change, controlling the
basin relief and drainage density. Precipitation extremes are responsible for a
catastrophic denudational event that deforms the basins. However, actual
hydro-geomorphological processes in hillslopes during intense rainstorms remain
controversial.
Subsurface water behavior in hillslopes as well as the critical condition leading to
landslides thus has to be studied in detail in relation to physical and mechanical
properties of hillslope materials. Linkage between slope hydrology and slope
instability provides a clue to addressing the actuality of landscape change. Studies on
contemporary denudation by shallow landslides will exert a persuasion on explaining
evolution of the different hilly landscapes.
Rainfall-induced shallow landslides pose a grave threat to lives and property in
another standpoint, since they occur suddenly and often travel a long distance as a
high-speed debris flow. A shallow landslide and subsequent debris flow cause
thousands of deaths and serious economic damage worldwide, especially in
mountainous regions subjected to heavy rainfall. Although human activities such as
deforestation of hillslopes or cutting of the slope toe for construction purposes conduce
to landsliding, the majority of landslides occur simply as a result of intensive rainwater
infiltration to an otherwise stable natural hillslope. Prediction of landsliding of a
natural hillslope thus meets a societal demand on the hazard assessments.
Identifying a rainfall threshold for landslide initiation becomes a fundamental task to
predict and prevent the hazards. The rainfall threshold provides requisite information
3
to make a decision on issuing landslide warnings for a resident evacuation or road
closures. The threshold for landslide initiation is unlikely to be uniform in a regional
scale, but changes with geological settings. Hence, a quantitative evaluation of the
relativity of the site-specific thresholds to the nature of hillslope materials arises as an
important issue in the disaster mitigation practice.
I-2 Previous studies and their problems
Stability of natural slopes was analyzed as a one of longstanding geotechnical
problems (e.g. Skempton and Delory, 1957; Terzaghi, 1962). Carson and Petley (1970)
brought the geotechnical strategies into geomorphology for discussing denudation
processes operating on hillslopes. After the pioneering studies, geomorphologists
began to employ the mechanical slope stability analysis to evaluate denudation and
development of hillslopes (Carson, 1971; Prior and Graham, 1974; Rogers and Selby,
1980; Matsukura and Tanaka, 1983; Matsukura, 1984). Since shallow landslides in
humid tropical environments result mostly from heavy rains, identification of rainfall
threshold for landslide initiation becomes a coincident issue in this discipline.
A primitive concept of a landslide-triggering threshold of rainfall was developed
through separating the rainfall events that triggered landslides from non
landslide-triggering storms. Several researchers concentrated their efforts on
establishing this empirical threshold by identifying critical combinations of rainfall
intensity and duration (Caine, 1980; Cannon and Ellen, 1985; Wieczorek, 1987; Terlien,
1998; Jakob and Weatherly, 2003). The empirical threshold can be applied for issuing
landslide warnings in combination with real-time monitoring of a network of
telemetering rain gauges and regional precipitation forecasts. Implementation of this
4
warning system achieved an apparent success to predict landslide occurrence at a storm
in 1986 in California (Keefer et al., 1987).
A weak point of the empirical approach is to treat the physical processes in
hillslopes as a black box. The critical relationship between rainfall intensity and
duration must be strongly influenced by site-specific conditions, especially in physical
and mechanical properties of hillslope materials. The surface material on hillslopes
originates basically from decomposition of bedrock. Geological variation in the
bedrocks produces the varying physical and mechanical properties of soils. Thus the
rainfall threshold depends on geology of the hills. This becomes most obvious at
disparity in temporal and spatial landslide frequencies among natural drainage basins
with varying geological settings.
Several studies explained the effect of basin geology on landslide activity by
whether hillslopes tend to easily or hardly be saturated (Onda, 1992, 1994; Onda et al.,
2004). The landslide activity was interpreted by susceptibility of hillslopes to
generation of positive pressure heads under a saturated regime, in association with
water storage capacity of regolith zone and/or subsurface water flow paths. However,
this explanation is insufficient regarding the mechanism and threshold of landslide
initiation. Some landslides most probably occur under an unsaturated regime, resulting
only from a decrease in cohesive shear strength of the soil (Krahn et al., 1989;
Rahardjo et al., 1995; Terlien, 1997). Van Asch et al. (1999) emphasized the
importance of a comprehensive understanding of how the hydrological processes affect
the destabilization of hillslopes.
The theoretical relation between slope hydrology and landslide initiation was
analyzed using physically motivated models in late 1980s and 1990s. The models
5
developed in coupling a concept of steady-state saturated throughflow above an
impermeable bed with an infinite-slope stability analysis (Okimura and Ichikawa,
1985; Montgomery and Dietrich, 1989, 1994; Wu and Sidle, 1995). This steady-state
type model achieved success in explaining landslide distribution in mountain drainage
basins and assessing topographic control on landslide susceptibility of hillslopes (Iida,
1999; Borga et al., 2002). However, several issues remain unsolved in the steady-state
models regarding the supposed hydrological concept.
Results of hydrological observation in a natural hillslope contradicted the
steady-state slope hydrology (Yasuhara, 1984; Musiake et al., 1988; Johnson and Sitar,
1990; Fannin and Jaakkola, 1999; Fannin et al., 2000; Simoni et al., 2004). Direct
measurement of subsurface hydrological response during rainstorms revealed that the
soils on hillslopes respond quickly and transiently to rainfall, and non-steady moisture
redistribution follows the intense rainwater infiltration. Iverson (2000) pointed out the
timescale discrepancy between the conceptual and real slope hydrology in a landslide
source area. The concept of steady-state groundwater flow can predict only the
long-term distribution of pressure head, which should be identified as a predisposition
to landsliding.
The aforementioned shortcomings prevent the steady-state models from providing a
rationale for simultaneous landslide occurrence at a rainfall peak associated with
intense rainwater infiltration (Iverson, 2000; D’Odorico et al., 2005). In addition, the
concept of steady-state subsurface flow parallel to the slope cannot apply to hillslopes
underlain by highly permeable bedrocks. Lack of hydraulic discontinuity at the bottom
of a soil column allows vertical percolation of rainwater, and hence the near-surface
lateral water movement becomes an unfeasible proposition.
6
Recently, numerical simulations of rainwater infiltration greatly improved our
understanding of hydrological conditions for landslide initiation. A one- or
two-dimensional finite element method was typically used in combination with a slope
stability analysis. The finite element analysis proved that the vertical rainwater
infiltration and subsequent non-steady redistribution of pressure head are sufficiently
competent to trigger landslides (Gasmo et al., 2000; Cho and Lee, 2001; Collins and
Znidarcic, 2004; Kim et al., 2004).
However, there are still few quantitative studies of hillslope hydrological processes
connecting to landslide mechanisms based on field observations. We cannot expect
more pertinent discussion about the geologically controlled landslide mechanisms or
rainfall thresholds unless the actual slope hydrology is linked with the critical
condition for landsliding. Certain field evidence is needed to understand how
subsurface-water dynamics influence landslide initiation, denudation of hillslopes, and
landscape evolution.
I-3 Purpose and approach of this study
The present study aims to reveal slope hydrological processes and
landslide-triggering mechanisms in two hilly locations with contrasting morphology
and bedrock. Discussion in this study focuses on clearing the black box, by making a
quantitative association between stability limit of hillslopes, subsurface water behavior,
and critical rainfall for landsliding. The connection of properties of slope materials,
slope hydrology, and rainfall thresholds is an unprecedented attempt in the previous
studies, so that assures the novelty of this work.
Detailed field and laboratory investigations were conducted to accomplish the

7
objective. Geophysical inspections revealed the subsurface slope structures.
Geotechnical testing provided properties of slope materials relevant to slope stability
analysis. Hydro-climatic observations elucidated pressure head responses in hillslopes
to rainfall as well as rainfall–runoff characteristics in small watersheds.
8
Chapter II Study area
II-1 General settings
The study area is located in the south-west Boso Peninsula, central Japan (Fig. 1).
The peninsula lies on the southernmost margin of the North American plate, bordered
on the south by the Philippine Sea plate. Westward subduction of the Pacific plate
characterizes the geotectonic segments of this region as a non-volcanic outer arc above
the subduction boundary. This geotectonic environment activates the coseismic crustal
movement of this area, resulting in rapid uplifting at a rate of > 1 m/kyr throughout the
Quaternary (Kaizuka et al., 2000, p. 151).
Bedrock in this area belongs to the middle Pleistocene forearc basin fill, referred to
as the Kazusa Group (Ito, 1995, 1998). Submarine fan successions generated by
glacioeustasy cycles under the influence of paleo-ocean currents produced repeated
sandy and muddy depositional sequences (Ito, 1998; Ito and Horikawa, 2000). The
emergence of these submarine deposits in the last 500 ka has led to the development of
small hills ranging in elevation of 100–300 m.
The region has a humid temperate climate with average daily temperatures between
5°C and 30°C, and with mean annual rainfall of 1500–2000 mm (Fig. 2). The
orographic effect enhances the rainfall at the southern part of the peninsula. Seasonal
fronts in early summer and fall as well as occasional typhoons contribute to 40–50% of
the total rainfall. The area receives very little snowfall, and the snow coverage rarely
remains on the ground for extended periods.
Brown forest soil develops on the hillslopes, except for narrow ridges or steep slip
scars with bedrock exposures. A planted forest of cypress (Chamaecyparis obtusa) and
9
cedar (Cryptomeria japonica) covers the study area. Hardwood and various understory
species also coexist within the conifer stands. The forest age varies from several years
to several decades. No large-scale timber harvesting has been conducted in the recent
decades.
II-2 Topography of the hills
The study site exhibits distinct topographic characteristics that vary from hills in the
northwest to hills in the southeast. The dashed lines in Fig. 1 demarcate this boundary
between the varying morphometric characteristics. Hill terrains in the northwestern
section exhibit relatively high rounded crests (relative relief of 150–200 m) with low
drainage density (5–8 km−1). The southeastern hills display low rugged ridges (relative
relief of 50–100 m) with high drainage density (15–22 km−1).
The topographic difference corresponds to the geology of the area (Fig. 3). Coarse
sandstone and conglomerates (the Nagahama and Ichijuku Formations; ca. 600–700
ka) comprise the northwest high terrain, whereas muddy sandstone and sandy
mudstone (the Iwasaka and Awakura Formations; ca. 700–800 ka) make up the
southeast lower terrain. Hereafter, we call these two areas the sandstone area and the
mudstone area (Figs. 1 and 3).
Overall, the landscape with the two areas comprises cuesta-like landforms with
back-slopes facing northwest (Fig. 3). The southwest–northeast rows of the cuesta
ridges widely develop in the southern Boso Peninsula, which have been recognized as
a structural geomorphology reflecting a variety of bedrocks (Nakagawa, 1960; Suzuki,
1985; Kaizuka et al., 2000, pp. 151–152). Several major rivers on the peninsula (such
as the Koito River in Figs. 1 and 3) incise the cuesta rows as an antecedent valley prior
10
to the development of the geologically-controlled hilly landscapes.
II-3 Spatial and temporal distribution of shallow landslides
The study area has experienced episodic denudational events by shallow landsliding.
Heavy rainstorms trigger almost all shallow landslides in the study area, although large
earthquakes has also occurred periodically around the Boso Peninsula. Figure 4 shows
the records of annual maximum 1-day rainfall and the five largest earthquakes in the
study area. The earthquake on December 17, 1987 caused more than 380 cliffs or
slopes to fail in the northeastern part of the peninsula (Kamai and Noro, 1988). Intense
acceleration by the earthquake triggered not only the toppling or fall type of failures
but shallow slides of natural hillslopes (Kamai 1989; Waragai et al., 1993). However,
these failures took place within an area of 30–60 km northeast from the area of interest.
Hence only the rainfall extremes are responsible for shallow landsliding in the study
area at least for the recent decades.
Torrential rainfall on July 1, 1970 and August 1, 1989 caused the two largest
landslide events in the recent decades (Furuya and Ohkura, 1992; Numamoto et al.,
1999). The present study focuses on the latest one, the 1989 storm, of which the
detailed records of rainfall and landslides are available. Figure 5 shows the records of
the 1989 storm at four meteorological stations within a 30-km radius from the study
area. The storm provided the rainfall of 30–70 mm/h in the maximum 1-h intensity.
Cumulative rainfall of 250 mm fell at Yokohama in minimum and 450 mm fell at
Sakuma in maximum during approximate a day from the onset of the storm body.
The rainstorms produced many slides along the mudstone slopes, but only a few
hillslopes failed in the sandstone area (Fig. 6). Landslides occurred only on steep lower
11
parts of hillslopes adjacent to major valleys in the sandstone area, while the landslides
in the mudstone area took place mainly on uppermost hollows near slope crests
(Matsushi and Matsukura, 2004). Although area of the individual landslides could not
be measured precisely on the aerial photographs, the approximate size of landslide
sources in the sandstone area (width 30 m × length 50 m) tends to be larger than that in
the mudstone area (20 m × 40 m).
The number of the landslide scars produced over the past two decades was identified
using sequential air photographs taken by Geographical Survey Institute in 1981, 1984,
1990, 1995, and 2000 (Table 1). The photo-reading ambits were confined to six basins
of 3rd or 4th stream order in each area. The landslide distribution maps from the two
consecutive photos were superimposed to delimit landslides which had occurred during
the five periods: before 1981, 1981–84, 1984–90, 1990–95, and 1995–2000 (Fig. 4,
Table 1).
Figure 7 shows the changes in landslide density (number of slip scars per unit area)
in the five periods during the past two decades. The prominent bars on 1984–1990
resulted undoubtedly from the 1989 storm, since no other significant storms were
observed during the period (Fig. 4). The density of landslides by the storm in the
mudstone area reaches 71.1 km−2, being about 19 times larger than that in the
sandstone area (3.8 km−2). In the 20-year total, landslide density in the mudstone area
(127.6 km−2) is about 22 times larger than that in the sandstone area (5.7 km−2).
The adjoining hills have no great variation in climatic conditions, vegetation cover,
and tectonic settings. Therefore, the variation in the density and locations of the
landslides must reflect slope hydrology and mechanical stability limits for landsliding
of the hillslopes in each area. This study evaluates the hillslope hydrological processes,

12
and physical properties of the hillslope materials to explain the different landslide
activities.
13
Chapter III Slope morphology and subsurface structure
III-1 Slopes
Field and laboratory experiments were designed to understand hillslope hydrological
processes and obtain parameter values relevant to slope stability analyses. For these
purposes, three slipped slopes with a typical size and geometry were selected in each
area (Figs. 8A and 8C). Geotechnical properties of hillslope materials are assumed to
be spatially homogeneous within the area underlain by the same bedrock.
Figure 9 shows profiles of the six selected slopes, as well as the plan views and
cross sections of the slip scars on the slopes. All the scars have a shallow platy form
bounded by a small scar step, showing general geometry of a translational landslide
(Selby, 1993, pp.260–263). These landslides seem to have resulted from the 1989
storm, since they are first visible on the aerial photograph taken in 1990.
Landslides on the slopes with same bedrocks have similar slope angles and slip
depths (Table 2). The slope angles were determined from the longitudinal profiles of
the slip scars. The slip depths represent mean values estimated from the vertical
cross-sections of the landslides. Volumes were calculated by multiplying the mean slip
depth and the sliding area. The landslides on the sandstone slopes (1.4–1.7 m in depth,
37–38° in slope angle, and 3×10²–1×10³ m3 in volume) are deeper, steeper, and larger
than those on the mudstone slopes (0.6–0.7 m, 32–35°, and 4–5×101 m3).
III-2 Soil sounding and geophysical surveys
Soil soundings were conducted along the scar profiles on the S-1 (sandstone) and
M-1 (mudstone) slopes, using a simplified dynamic cone penetrometer (MARUTO
14
Testing Machine Co., Japan). The penetrometer consists of a penetration rod with a
cone tip (25-mm diameter with 60° tip angle), guide rods, and a 5-kg weight. The
weight drives the cone into subsoil, falling from a height of 50 cm along the guide rod.
Here the resistance value for the cone penetration Nc is defined as the number of
impacts needed for every 10-cm penetration. Using Nc-values, Wakatsuki et al. (2005)
distinguished four subsurface layers: 0 ≤ Nc < 5 (upper), 5 ≤ Nc < 10 (middle), 10 ≤ Nc
< 30 (lower), and Nc ≥ 30 (bedrock). Accordingly, the thickness of soil mantle is
defined as the depth attained when the Nc reaches 30.
The geophysical prospecting, refraction seismic survey and electrical resistivity
investigation, provides deep subsoil information of the S-1 and M-1 slopes. The
seismic velocities reflect contrasting mass densities in layered structure, whereas
electrical resistivities change depending on groundwater distributions or material
densities. The investigations were carried out on May 9, 2005. Total 20 mm rain fell on
the slopes during May 6 to 7 prior to the operating day.
A three-channel seismograph McSEIS-3 (OYO Inc., Japan) was used to measure
elastic wave velocities of both upper unconsolidated materials and intact bedrock, and
to calculate depths of the seismic layer boundaries. A sledge hammer was struck onto
an aluminum plate placed on the ground surface to produce a seismic signal. Travel
times of the elastic waves were collected with different distances at 2-m intervals; the
maximum distance is 50 m on S-1 slope and 25 m on M-1 slope.
A geo-electric apparatus Handy-ARM (OYO Inc., Japan) was used to determine
subsurface resistivity distribution. Thirty-two electrodes were set out at 1.5-m or 1-m
intervals following the configuration of pole-pole array. Direct current resistivity
between each of the electrodes was measured and recorded. The two-dimensional
15
resistivity tomogram was computed with the software ElecImager/2D-Lite (OYO Inc.,
Japan).
III-3 Soil thickness
The sandstone slope has thick soil mantles (Fig. 10A). The value of Nc for the
sandstone slope increases gradually and reaches 30 at depths of 6–7 m in maximum.
The slip plane of the landslide perches on the boundary of the upper (0 ≤ Nc < 5) and
middle (5 ≤ Nc < 10) layers. Thick soft soils (4–5 m of Nc < 30 layers) remain on the
bedrock at the scar head of the landslide.
The soil on the mudstone slope forms a thin veneer over the bedrock (Fig. 10B). The
soil thickness is up to a meter at the intact part of the slope upward from the scar head.
The soft upper soil (0 ≤ Nc < 5) has a sharp contact with the bedrock (Nc ≥ 30) at the
base of the soil layer. The slip plane of the landslides lies just above this soil–bedrock
boundary. Colluvial deposit of 2–3 m thick covers the foot of the slip scar, forming a
small debris tongue as a reminder of the past landslide.
III-4 Geophysical structures
The seismic refraction soundings revealed two boundaries in both S-1 and M-1
slopes (Fig. 10). The upper boundary with low elastic-wave velocities (0.8 km/s in S-1
and 0.4 km/s in M-1) indicates a base of soft soil layer or colluvial deposit, which
coincides with the lower bound of the layers with small Nc-values. The lower boundary
in bedrock (1.6 km/s in S-1 and 1.2 km/s in M-1) suggests a progression of deep
weathering which probably causes a decrease in density of the rock masses.
Direct current resistivity tomography in S-1 slope visualizes moisture distribution
16
and conjectural location of the groundwater table in the bedrock (Fig. 10A). The high
resistivity (> 400 Ω m) area near the slope surface represents a dry layer, where the
soil-water recharged by the prior rainfall had evaporated or drained. The base of this
dry layer corresponds roughly to the upper seismic boundary (0.8 km/s), suggesting
different water-retention capability between loose upper soils and firm subsoil
materials. The low resistivity (< 200 Ω m) region exists at the left bottom of the
tomogram. Upper face of this region corresponds in level to the channel with persistent
stream flow. This implies horizontal spreading of the groundwater table into bedrock.
Subsurface resistivity in M-1 slope tends to be lower than that of S-1 slopes (Fig.
10B). This indicates a relatively wetter condition or more consolidated nature of
subsurface materials in the mudstone hillslope. Resistivity islands with relatively high
values (> 150 Ω m) in the tomogram may reflect massive mudstone cores escaping
interstitial water invasion. This resistivity distribution does not allow us to figure out
much appropriate interpretations of subsurface structures, but for certain, there are no
evident groundwater systems in the mudstone bedrock.
III-5 Sallow soil profiles
Soil pits were dug at three points on the scar profiles in order to inspect shallow
subsurface structure (Fig. 9; pits 1 and 2 on the S-1 slope, and pit 3 on the M-1 slope).
Subsurface soil profiles were recorded using exposed upslope-face of the pits (Fig. 11).
The soil profiles at the scar head include a potential failure plane that corresponds to
the depth of an extension of the slip surface (the schematic in the lower right in Fig. 9).
In the soil profiles in pit 1 and pit 3 (at the scar heads), the depth of the potential failure
planes is 70–80 cm and 50–60 cm, respectively (Figs. 11A and 11C).

17
The shallow soil profile of the S-1 slope consists of homogeneous sand (Fig. 11A).
The Nc value in the pit 1 increases slightly with depth, but no apparent discontinuity is
found around the potential failure depth. The sand at the bottom of the pit 2 (lower part
of the slope: Fig. 9) holds the original beddings of the stratum (Fig. 11B). This
observation indicates that the slope material in this depth originates from in-situ
weathering of the sandstone bedrock.
The soil profile on the M-1 slope exhibits sharply demarcated weathering horizons
(Fig. 11C). Silty organic aggregates make up a soft loose soil (Nc < 5) that includes
scattered gravels in the uppermost 0.3 m. From 0.3 to 0.6 m deep, interlocking rock
fragments form a dense residual horizon (5 ≤ Nc < 30). The residual horizon sharply
switches into the parent material below 0.6-m depth.
18
Chapter IV Geotechnical soil properties
IV-1 Soil sampling and geotechnical tests
Undisturbed soil cores 5.0 cm in diameter and 5.1 cm in height (100 cm3 in volume)
were extracted at every 10–15 cm depth intervals from the soil profiles. The samples
from the pits 1 and 3 provided values of soil unit weight, porosity and grain-size
distribution through the shallow soil layers.
Vertical profiles of the hydraulic conductivity were determined for all pits. Saturated
hydraulic conductivity of soil was measured in the laboratory by a constant-head
permeability test. In-situ testing of the infiltration capacity was also conducted at the
bottom of the mudstone pit because of difficulty in undisturbed sampling.
The soil-water characteristic curve was determined by using the soil cores from the
depths of 30 cm and 75 cm in the pit 1, and the depths of 15 cm and 30 cm in the pit 3.
The samples were left in a water-poured container at least 48 hours for capillary
saturation. Drying soil-water characteristic curve was then measured by a water head
method for the range of pressure head from 0 to −0.6 m, and a vacuum method for the
range from −0.6 to −3.9 m.
Samples for testing soil shear strength were also obtained from the pits 1 and 3 using
a trimming ring of 6.0-cm bore diameter and 2.0-cm height. The dimension of the soil
specimens is identical to the direct shear instrument used in this study. Sampling depth
is 70–85 cm for the pit 1 (28 cores) and 35–40 cm for the pit 3 (24 cores), which is
close to the depth of the potential failure plane. The moisture contents of the specimens
were adjusted stepwise from an oven-dried condition to a capillary saturated condition.
These specimens were delicately placed into an isometric shear box after sealing them
19
in a plastic bag for at least a week to allow moisture equilibration.
Direct box shear tests using the undisturbed soil specimens provided the strength
parameters of the soils. Single stage shearing at a rate of 1 mm/min was conducted
under four different normal stresses (10, 20, 30 and 40 kPa). The volumetric water
content of the specimens was calculated from the weight difference between the
specimen just after the shear test and that in completely dried condition.
IV-2 Basal soil properties
The soils on the sandstone and mudstone slopes have significant difference in their
grain-size distributions (Fig. 12). Soils originating from the sandstone have a large
fraction of coarse and fine sands accounting for 80–90% of the total grains, whereas
soils originating from the mudstone contain finer materials accounting for 40–70% by
silt and clay. The physical properties of the soils reflect this grain-size characteristic
(Table 3). The soil on the sandstone slope has a greater average dry unit weight (12.7
kN/m3) and a smaller porosity (0.52) than the soil from the mudstone slope (11.1
kN/m3 and 0.58).
IV-3 Permeability
The vertical variation of the permeability depends strongly on geology. Figure 13
shows vertical profiles of the hydraulic conductivity, as well as the intensity of annual
maximum 1-h rainfall in the study area. The maximum intensities of 1-h rainfall range
from 5×10⁻⁶ to 2×10⁻⁵ m/s.
The permeability of the sandstone-soil shows a nearly straight vertical profile with
values around 10−4 m/s. No discontinuity of permeability was found across the

20
potential failure plane, and also at transition from the shallow soil layer (pit 1) down to
the bedrock (pit 2). The permeability exceeds the magnitude of annual maximum
rainfall intensities, so that the rainwater will be able to percolate into deep portion of
the hillslope.
The permeability of the mudstone-soil decreases significantly with depth. The value
on the order of 10−5 m/s near the surface falls abruptly to 8×10⁻⁷ m/s at 0.7-m depth.
Field measurement of the infiltration capacity (black squares in Fig. 13) gave the
minimum permeability of 5×10⁻⁸ m/s at the depth of 0.9 m. The permeability below
the depth of ~0.6 m is much lower than the maximum intensities of 1-h rainfall,
suggesting that infiltrated rainwater will accumulate upon the impervious bedrock.
IV-4 Soil-water retention characteristic
The soils originating from the two parent materials have different soil-water
retention characteristics (Fig. 14). The volumetric water content of the sandstone-soil
falls smoothly from 0.47 to 0.2 m3/m3 as the pressure head decreases from 0 to −1 m,
and then settles in a residual state as the soil contains only suspended water. The soil
on the mudstone slope rapidly drains water before the pressure head decreases to −0.5
m. However, the soil maintains relatively high volumetric water content around 0.35
m3/m3 even when the pressure head becomes −4 m.
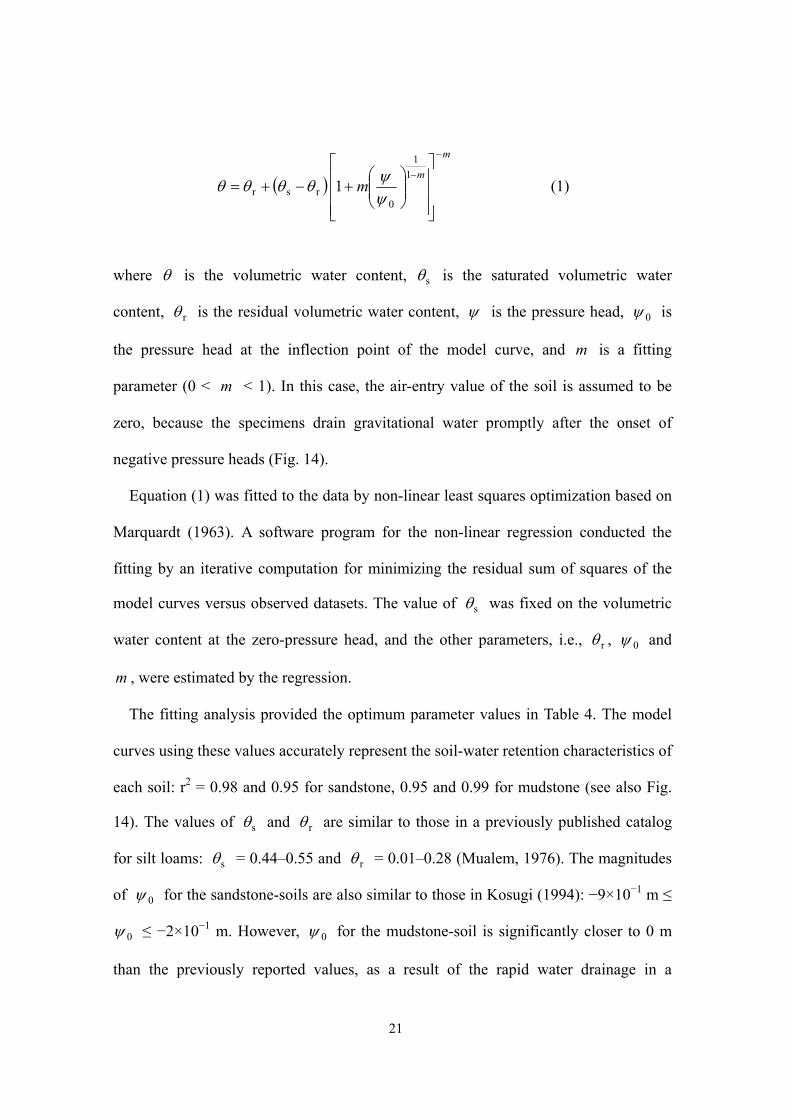
The broken and solid lines in Fig. 14 show the best-fit model curves. An equation of
van Genuchten’s (1980) model modified by Kosugi (1994) was adopted:
21
( )
m
mm
−
−
⎥⎥⎥
⎦
⎤
⎢⎢⎢
⎣
⎡
⎟⎟⎠
⎞⎜⎜⎝
⎛+−+=
11
0rsr 1
ψψθθθθ (1)
where θ is the volumetric water content, sθ is the saturated volumetric water
content, rθ is the residual volumetric water content, ψ is the pressure head, 0ψ is
the pressure head at the inflection point of the model curve, and m is a fitting
parameter (0 < m < 1). In this case, the air-entry value of the soil is assumed to be
zero, because the specimens drain gravitational water promptly after the onset of
negative pressure heads (Fig. 14).
Equation (1) was fitted to the data by non-linear least squares optimization based on
Marquardt (1963). A software program for the non-linear regression conducted the
fitting by an iterative computation for minimizing the residual sum of squares of the
model curves versus observed datasets. The value of sθ was fixed on the volumetric
water content at the zero-pressure head, and the other parameters, i.e., rθ , 0ψ and
m , were estimated by the regression.
The fitting analysis provided the optimum parameter values in Table 4. The model
curves using these values accurately represent the soil-water retention characteristics of
each soil: r2 = 0.98 and 0.95 for sandstone, 0.95 and 0.99 for mudstone (see also Fig.
14). The values of sθ and rθ are similar to those in a previously published catalog
for silt loams: sθ = 0.44–0.55 and rθ = 0.01–0.28 (Mualem, 1976). The magnitudes
of 0ψ for the sandstone-soils are also similar to those in Kosugi (1994): −9×10⁻¹ m ≤
0ψ ≤ −2×10⁻¹ m. However, 0ψ for the mudstone-soil is significantly closer to 0 m
than the previously reported values, as a result of the rapid water drainage in a
22
near-zero negative pressure head.
IV-5 Shear strength
The shear tests revealed the characteristics of decline in soil shear strength with
increasing moisture content. Table 5 and Fig. 15 show the test results for the specimens
with varied moisture conditions. The specimens were categorized into the six moisture
levels from oven-dried to capillary saturated conditions: groups A to F in the
sandstone-soil, and groups G to L in the mudstone-soil (Table 5). Solid lines in Fig. 15
indicate the results of a linear-regression for each specimen group. Inclination and
y-intercept of the lines correspond respectively to the angle of shearing resistance and
the cohesive strength for each moisture group.
The angles of shearing resistance for both soils decreased drastically from the largest
value in the driest condition to nearly a constant value at wetter conditions (Table 6,
Fig. 15). Figure 16A shows the relationships between the average volumetric water
content in each group and the angle of shearing resistance. The groups A and G, the
driest condition, show a significantly large angle of shearing resistance of 48.4° and
53.3°, respectively. The group H in the mudstone-soil also represents a large value of
47.7°, but this inclination seems to be affected by the result for normal stress of 40 kPa
(Fig. 15, Table 5). The other moisture conditions, the groups B to F and the groups I to
L, show the angles of shearing resistance within a narrow range in 25°–33° for the
sandstone-soil and 27°–31° for the mudstone-soil (Table 6).
The cohesive strength decreased with increasing moisture content and approached a
minimum value at saturated condition (Table 6). Figure 16B shows the relationships
between the average volumetric water content and the soil cohesion in each group. The
23
cohesive strength of the soils decreases exponentially with increasing volumetric water
content.
The reduction characteristics of the soil shear strength (Fig. 16) suggest the
following presumptions: (1) the angle of shearing resistance takes a constant value
independent of volumetric water content of the soil, (2) the soil cohesion is an
exponential function of volumetric water content. These presumptions lead to a
formulation of the decrease in soil shear strength:
φστ μθ tane += −C (2)
where τ is the shear strength, C is the apparent soil cohesion at dry condition, μ
is the reduction coefficient, σ is the applied normal stress, and φ is the apparent
angle of shearing resistance. Note that C is a hypothetical ultimate value when θ =
0; an increase in μ causes a significant reduction of cohesive strength.
Equation (2) is consistent with the existing discovery that only the cohesive
component decreases with increasing soil moisture (Fredlund et al., 1978; Escario and
Sáez, 1986; Gan et al., 1988; Vanapalli et al., 1996; Miao et al., 2002; Lee et al., 2003).
The previous studies employed a function of matric suction as a parameter of soil
moisture conditions. The matric suction in a soil is defined as pore-air pressure minus
pore-water pressure, which cannot be determined accurately in our shear tests.
Therefore, Eq. (2) is used as an approximate formula for evaluating the reduction in
shear strength of an unsaturated soil.
In the analyses, the test results of the driest conditions were excluded (groups A and
G, Table 5). This is because the angle of shearing resistance in these conditions was

24
significantly larger than that of the wetter conditions (Fig. 16A, Table 6). The reason
for this phenomenon is so far unclear, but cementation of fine materials and/or
shrinkage of the soil mass might contribute to enlarge frictional resistance of the soils
in an excessively dried condition. The present study targets only soils under moist
conditions of which the value of φ can be assumed to be constant.
To determine the values of unknowns (i.e., φ , C and μ ), Eq. (2) should be
linearized as follows:
[ ] Clntanln +−=− μθφστ . (3)
The left side of the equation represents logarithm of the cohesive component of the
shear strength. This equation allows us to execute a multiple linear-regression analysis
following the procedure described below:
1. Assign an arbitrary value to φ ,
2. Compute the term [ ]φστ tanln − for every dataset of τ and σ ,
3. Conduct a simple linear-regression for the datasets of [ ]φστ tanln − and θ ,
4. Repeat 1 to 3 to seek the most suitable value of φ , which yields the highest
correlation coefficient,
5. Compute the value of C and μ from the y-intercept ( Cln ) and inclination
( μ− ) of the regression line with the best-fit φ .
Results of the regression analyses are described in two stages as Fig. 17. Figure 17A
shows the changes in square of correlation coefficient of Eq. (3) with respect to
varying φ . The correlation reaches a peak at φ = 28.3° for the sandstone-soil, and at
25
27.7° for the mudstone-soil. Substituting the most suitable values of φ , the
relationships between [ ]φστ tanln − and θ were obtained as shown in Fig. 17B.
The parameters obtained by the regression are listed in Table 7. The variables in the
equations reflect liquefaction characteristics of the soils and susceptibility to changes
in pore-water pressure during shear deformation. Therefore, one must regard these
values as purely empirical rather than physically significant. Nonetheless, the
equations using these soil-specific parameters accurately represent the observed
strength reduction characteristics of each soil (Fig. 18).
Figure 19 compares the measured and calculated shear strength. In the diagram,
values of SE (standard error of estimate) are defined as a standard deviation of the
predictive residuals. The smaller value of SE indicates the more accurate prediction.
The values of SE were 2.67 kPa for the sandstone-soil, 4.25 kPa for the mudstone-soil.
Of note is that the SE in the mudstone-soil was significantly affected with the
anomalous shear strength value (an arrowed plot in Fig. 19). This plot is the test result
with normal stress of 40 kPa in the group H (Table 5, Fig. 15). Discounting the outlier,
the SE for the mudstone-soil comes down to 1.29 kPa.
26
Chapter V Slope hydrology
V-1 Methods of hydrological observations
Tensiometers with pressure transducers (RSUxx, IRROMETER Co. Inc., USA)
were set-up within 10 meters upslope from the scar head on S-1 and M-1 slopes to
monitor responses of pressure head in hillslopes to rainfall (Fig. 9). All tensiometers
were calibrated at laboratory before the installations within ±0.01 m precision of
pressure head. Two nests of tensiometers were established on the S-1 slope (ST1 and
ST 2, with ceramic cups at depths of 30, 75, and 120 cm). Three nests were set-up on
the M-1 slope (MT1, MT 2 and MT 3; depths of ceramic cups were 30 cm for MT1, 23
cm and 46 cm for MT2, and 30 cm, 60 cm, and 90 cm for MT3). A data logger
connected to the pressure transducers recorded the subsurface pressure head at every
10 minutes.
A soil moisture sensor (ThetaProbe TYPE ML2x, Delta-T Devices Ltd., UK) was
installed to monitor subsurface volumetric water content at 75 cm depth at ST 2 and at
60 cm depth at MT 3. The output from the sensor, dielectric constant of soil, was
collected with a data logger in 10-minute intervals. The recorded dielectric constants
were converted to volumetric water content with ±0.02 m3/m3 precision by a laboratory
calibration using the native material from the monitoring depths.
The simultaneous monitoring of pressure head and volumetric water content at a
corresponding depth permits to draw an ‘in situ’ soil-water characteristic curve
including hysteresis between drying and wetting processes of the soils. Therefore, the
‘in situ’ curve makes it possible to estimate the ranges of alteration in the ‘laboratory’
parameters for soil-water retention characteristics (Table 4).
27
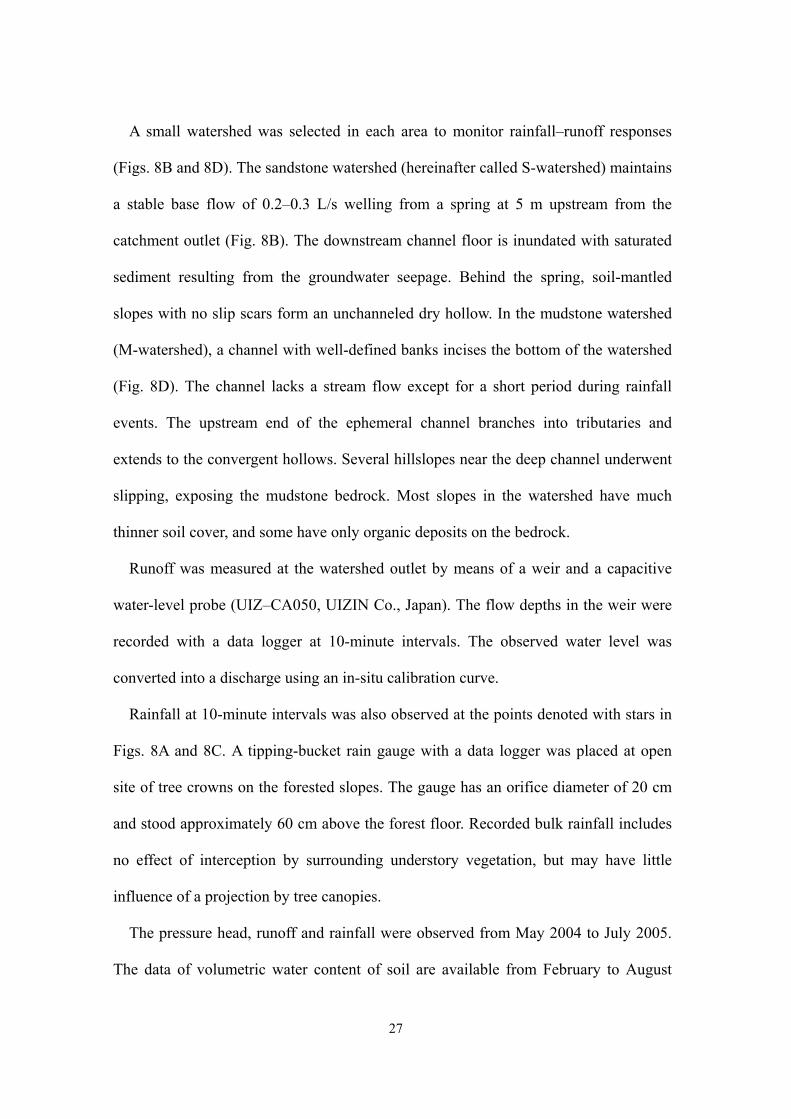
A small watershed was selected in each area to monitor rainfall–runoff responses
(Figs. 8B and 8D). The sandstone watershed (hereinafter called S-watershed) maintains
a stable base flow of 0.2–0.3 L/s welling from a spring at 5 m upstream from the
catchment outlet (Fig. 8B). The downstream channel floor is inundated with saturated
sediment resulting from the groundwater seepage. Behind the spring, soil-mantled
slopes with no slip scars form an unchanneled dry hollow. In the mudstone watershed
(M-watershed), a channel with well-defined banks incises the bottom of the watershed
(Fig. 8D). The channel lacks a stream flow except for a short period during rainfall
events. The upstream end of the ephemeral channel branches into tributaries and
extends to the convergent hollows. Several hillslopes near the deep channel underwent
slipping, exposing the mudstone bedrock. Most slopes in the watershed have much
thinner soil cover, and some have only organic deposits on the bedrock.
Runoff was measured at the watershed outlet by means of a weir and a capacitive
water-level probe (UIZ–CA050, UIZIN Co., Japan). The flow depths in the weir were
recorded with a data logger at 10-minute intervals. The observed water level was
converted into a discharge using an in-situ calibration curve.
Rainfall at 10-minute intervals was also observed at the points denoted with stars in
Figs. 8A and 8C. A tipping-bucket rain gauge with a data logger was placed at open
site of tree crowns on the forested slopes. The gauge has an orifice diameter of 20 cm
and stood approximately 60 cm above the forest floor. Recorded bulk rainfall includes
no effect of interception by surrounding understory vegetation, but may have little
influence of a projection by tree canopies.
The pressure head, runoff and rainfall were observed from May 2004 to July 2005.
The data of volumetric water content of soil are available from February to August
28
2005. All of the observations included temporal respites during extremely dry periods
or downtimes when loggers are filled up with data.
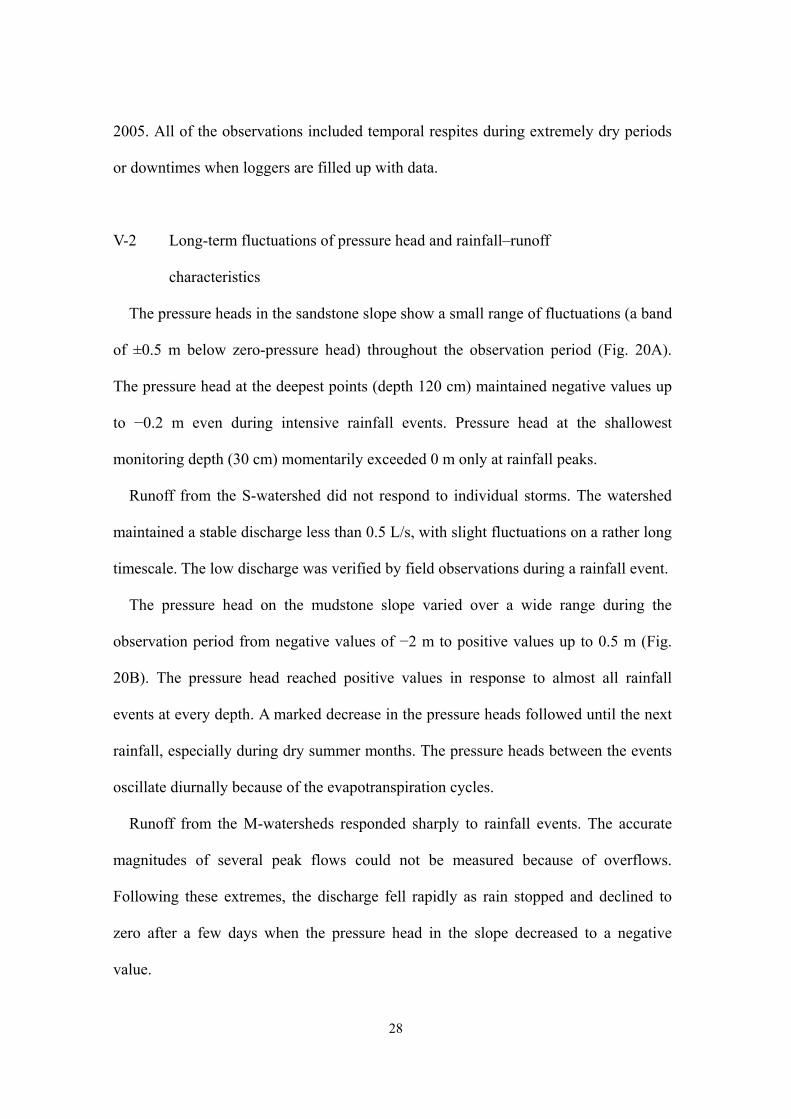
V-2 Long-term fluctuations of pressure head and rainfall–runoff
characteristics
The pressure heads in the sandstone slope show a small range of fluctuations (a band
of ±0.5 m below zero-pressure head) throughout the observation period (Fig. 20A).
The pressure head at the deepest points (depth 120 cm) maintained negative values up
to −0.2 m even during intensive rainfall events. Pressure head at the shallowest
monitoring depth (30 cm) momentarily exceeded 0 m only at rainfall peaks.
Runoff from the S-watershed did not respond to individual storms. The watershed
maintained a stable discharge less than 0.5 L/s, with slight fluctuations on a rather long
timescale. The low discharge was verified by field observations during a rainfall event.
The pressure head on the mudstone slope varied over a wide range during the
observation period from negative values of −2 m to positive values up to 0.5 m (Fig.
20B). The pressure head reached positive values in response to almost all rainfall
events at every depth. A marked decrease in the pressure heads followed until the next
rainfall, especially during dry summer months. The pressure heads between the events
oscillate diurnally because of the evapotranspiration cycles.
Runoff from the M-watersheds responded sharply to rainfall events. The accurate
magnitudes of several peak flows could not be measured because of overflows.
Following these extremes, the discharge fell rapidly as rain stopped and declined to
zero after a few days when the pressure head in the slope decreased to a negative
value.
29
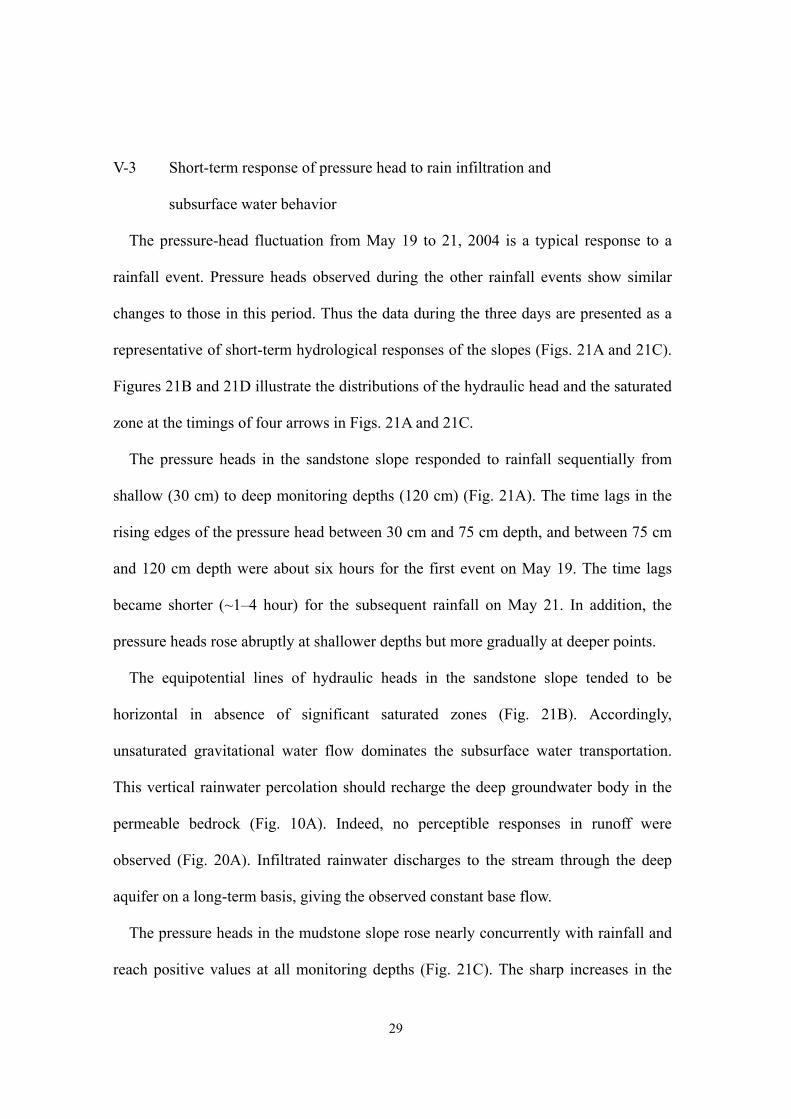
V-3 Short-term response of pressure head to rain infiltration and
subsurface water behavior
The pressure-head fluctuation from May 19 to 21, 2004 is a typical response to a
rainfall event. Pressure heads observed during the other rainfall events show similar
changes to those in this period. Thus the data during the three days are presented as a
representative of short-term hydrological responses of the slopes (Figs. 21A and 21C).
Figures 21B and 21D illustrate the distributions of the hydraulic head and the saturated
zone at the timings of four arrows in Figs. 21A and 21C.
The pressure heads in the sandstone slope responded to rainfall sequentially from
shallow (30 cm) to deep monitoring depths (120 cm) (Fig. 21A). The time lags in the
rising edges of the pressure head between 30 cm and 75 cm depth, and between 75 cm
and 120 cm depth were about six hours for the first event on May 19. The time lags
became shorter (~1–4 hour) for the subsequent rainfall on May 21. In addition, the
pressure heads rose abruptly at shallower depths but more gradually at deeper points.
The equipotential lines of hydraulic heads in the sandstone slope tended to be
horizontal in absence of significant saturated zones (Fig. 21B). Accordingly,
unsaturated gravitational water flow dominates the subsurface water transportation.
This vertical rainwater percolation should recharge the deep groundwater body in the
permeable bedrock (Fig. 10A). Indeed, no perceptible responses in runoff were
observed (Fig. 20A). Infiltrated rainwater discharges to the stream through the deep
aquifer on a long-term basis, giving the observed constant base flow.
The pressure heads in the mudstone slope rose nearly concurrently with rainfall and
reach positive values at all monitoring depths (Fig. 21C). The sharp increases in the
30
pressure heads began from the deepest point and rapidly moved to shallower depths,
indicating a rise in the saturated zone from the bottom to top. The positive pressures
persisted for several hours at 30-cm depth, but several days at 90-cm depth.
The resultant hydraulic head lines under the saturated regime tended to be
perpendicular to the slope, indicating downslope water movement upon the
impermeable bedrock (Fig. 21D). This subsurface lateral flow drained rainwater
through the soil layer out to channel systems, giving acute runoff peaks in response to
every rainfall event (Fig. 20B). In fact, discharge from the watershed continued while
the pressure head in the slope maintains a positive value, and declines as the pressure
head reverts to a negative value.
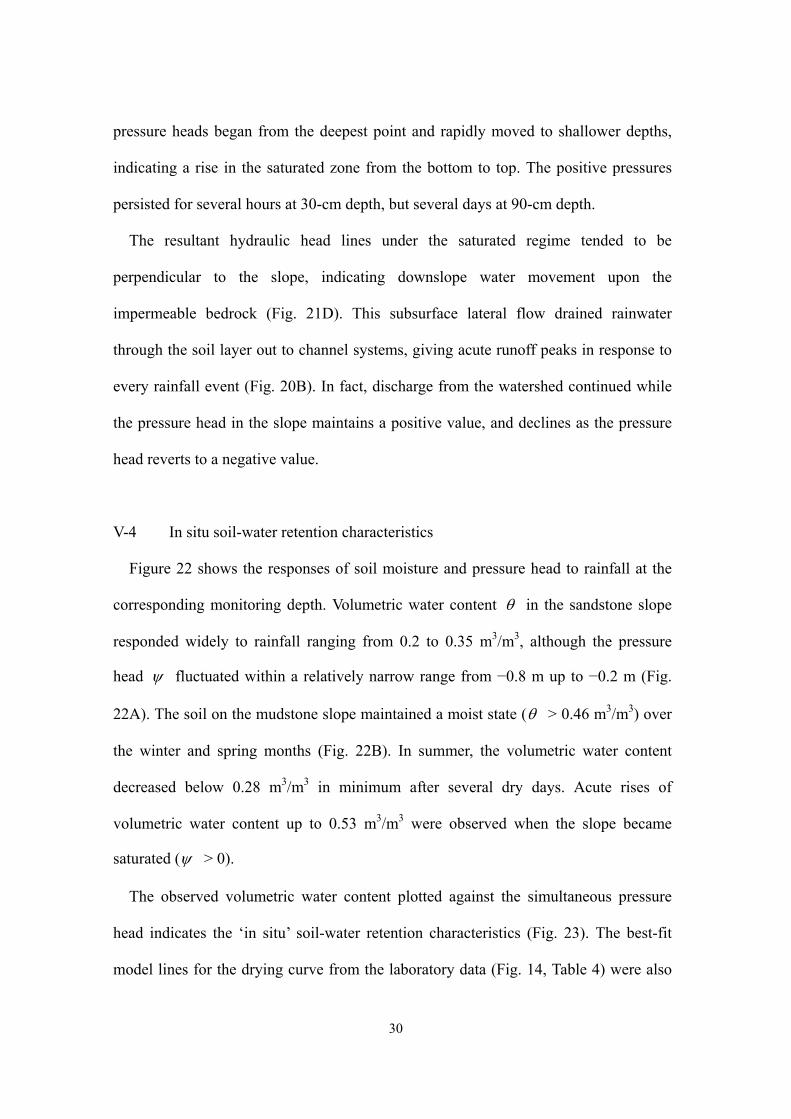
V-4 In situ soil-water retention characteristics
Figure 22 shows the responses of soil moisture and pressure head to rainfall at the
corresponding monitoring depth. Volumetric water content θ in the sandstone slope
responded widely to rainfall ranging from 0.2 to 0.35 m3/m3, although the pressure
head ψ fluctuated within a relatively narrow range from −0.8 m up to −0.2 m (Fig.
22A). The soil on the mudstone slope maintained a moist state (θ > 0.46 m3/m3) over
the winter and spring months (Fig. 22B). In summer, the volumetric water content
decreased below 0.28 m3/m3 in minimum after several dry days. Acute rises of
volumetric water content up to 0.53 m3/m3 were observed when the slope became
saturated (ψ > 0).
The observed volumetric water content plotted against the simultaneous pressure
head indicates the ‘in situ’ soil-water retention characteristics (Fig. 23). The best-fit
model lines for the drying curve from the laboratory data (Fig. 14, Table 4) were also
31
presented in the diagrams (solid and broken thin lines).
The in situ data from the sandstone slope sit on the immediate lower-right of the
drying soil-water characteristic curves (Fig. 23A). The upper edge of the in situ plots
corresponds to the drying curves, so that the observed data indicate the range of
hysteresis between drying and wetting processes of the soil. The values of θ
observed in situ were approximately 0.1 m3/m3 lower than the drying curve in
maximum. The gray bold lines on an opposite side across the plots represent the
envelopes covering the gap between the laboratory curves and in situ-observed data.
The envelope for the plots covers the divergence originating from the drying–wetting
hysteresis. Parameter values for these envelopes are listed in Table 8.
The in situ soil-water retention characteristic at the mudstone slope differs markedly
from the laboratory curves (Fig. 23B). Although the laboratory curves and the in situ
data exhibit similar values and changing trends at near-zero pressure head, the in situ
data track a more water-retentive path to drying. This may result from disparity in soil
texture through the soil profile (Fig. 11C), between shallower sampling points for
laboratory tests (the depths of 15 cm and 30 cm) and the deeper zone for the in situ
observation (60 cm depth). The upper envelope of the plots covers such a spatial
variance in the soil-water retention characteristic.
32
Chapter VI Discussion
VI-1 Landslide mechanisms
VI-1-1 Slope stability analysis
The landslides on the observed slopes have a shallow slip plane oriented parallel to
the original slope surface (Fig. 9). The slip scars have the geometry of an ellipsoidal
plate of which the depth is much smaller than width or length. Hence, an infinite-slope
stability model was employed to analyze the critical conditions for landsliding (Fig.
24). The analysis neglects all forces not resolvable on a potential failure plane that
parallels the ground surface. Reinforcement by piling and lateral tree roots was also not
taken into account, because the potential failure plane in the actual soil profiles lies
well below the major root zone (Figs. 11A and 11C).
In a limit equilibrium concept, materials on an elongated slope are subject to two
opposing forces: a downslope component of soil weight as a driving force, and shear
strength of the soil providing a resisting force (Fig. 24). The dimensionless factor of
safety FS balances them as:
weightsoil ofcomponent Downslopesoil ofstrength Shear
force Drivingforce Resisting
==FS . (4)
If FS reduces below unity, the slope fails along the potential failure plane.
Three instability factors were taken into account: (1) reduction of soil cohesion in
response to soil wetting, (2) weight increase of soil resulting from water absorption,
and (3) decrease in effective stress derived from pore-water pressures. The first two
33
were considered only in an unsaturated state, because the values of soil cohesion and
soil unit weight are fixed at a saturated condition. The third factor works only when the
pressure head in the soil reaches a positive value.
Assuming an equable wetting of homogeneous soil, i.e., uniform soil water content
and pressure heads from the land surface to the slip plane, FS is expressed as:
( ) ( ) ( ) ββθγγ
φγψβθγγμθ
cossintan0 ,Maxcose
wd
w2
wd
ZZC
FS+
−++=
−
(5)
where Z is vertical soil depth, β is slope angle, dγ is the dry unit weight of soil,
and wγ is the unit weight of water (9.8 kN/m3). Equation (5) can be algebraically
split into three components as:
( )( )
( ) ββθγγφγψ
ββθγγβφ μθ
cossintan0 ,Max
cossine
tantan
wd
w
wd ZZCFS
+−
++=
−
. (6)
The first term on the right side of Eq. (6) represents the frictional component of slope
stability. The second term expresses the changes in cohesive resistance in an
unsaturated state (on the basis of Eq. (2)). The third term refers to slope instabilization
by the positive pressure head in a saturated state (ψ > 0 m). Substitution of Eq. (1)
into Eq. (6) generates the factor of safety mediated by the pressure head, and allows a
simulation of slope instabilization for both unsaturated and saturated conditions.
The moisture condition of soil between the land surface and the slip plane is not
actually uniform. Soil moisture in an unsaturated slope during an intensive storm
34
decreases with increasing depth because of rainwater infiltration from the land surface.
Thus Eq. (6) may underestimate slightly the weight of soil mass in an unsaturated
condition. However, this underestimation has much smaller influence on FS-values
than the other parameters in the stability equation (Borga et al., 2002; Dykes, 2002).
Hence, the following analysis ignores the subtle effect of the weight heterogeneity in
the soil column.
VI-1-2 Critical conditions for landsliding
The slope stability analysis was applied to specify the critical conditions of the past
landslides whose scars are described in Fig. 9. Slip depths and slope angles of the
landslides, and the other input-variables for the analysis were already identified (Tables
2 to 4, 7 and 8). Hence, the factor of safety in those slipped slopes can be simulated as
a function of the pressure head at the slip plane. Parameters for soil-water
characteristic curves (Eq. (1)) were assigned in three ways for each soil: two laboratory
curves from different sampling depths (Table 4), and the parameter set for in situ
envelopes (Table 8).
Figure 25 juxtaposes curves showing the results of the stability simulation. Factor of
safety reduce with an increase in pressure heads. The FS-values for each of the three
slopes with the same bedrocks decrease with a similar pattern from an unsaturated to a
saturated condition. The similar FS-values result from the similarity of the slip depths
and slope angles in each of the sandstone and mudstone landslides (Table 2).
The variation of the soil-water characteristic curves transmutes delicately the shape
of FS-tracks in unsaturated states. However, the parameters for soil-water retention do
not affect the FS-values in saturated conditions. This is because the volumetric water
35
content of soil takes a constant value under saturated regimes.
Factors of safety for the sandstone slopes show relatively low values, for example,
around 2.0 at −0.9 m pressure head. The low FS-values result from a relatively deeper
(~1.7 m) and steeper (~38°) geometry of the landslides. Factors of safety for the
sandstone slopes fall below unity just before the saturation with −0.14 m ≤ ψ ≤ −0.01
m (Fig. 25A). This result implies that the sandstone slopes failed under an unsaturated
condition without positive pressure heads.
The mudstone slopes maintain a highly stable state, for example, around FS = 4.0 at
−0.9 m pressure head. The relatively shallower slip depth (~0.7 m), gentler slope angle
(~35°), and also cohesive characteristic of the soils (Fig. 17B, Table 7) are responsible
for the stable condition of the unsaturated mudstone slopes. Factors of safety become
1.7–1.8 even at the saturation point (ψ = 0 m), and sink below unity when the
pressure head reaches 0.7–0.8 m (Fig. 25B). This indicates the completely saturated
landsliding of the mudstone slopes.
VI-1-3 Hydrological triggering of the landslides
In the sandstone slope, infiltrated rainwater can seep down vertically through the
soil layers into bedrock, because there is no discontinuity of permeability in the
subsurface profile (Fig. 13). The thick soil layer on the permeable bedrock cannot
reach a saturated state (Fig. 20A). In this case, a wetting front migrates from land
surface into subsoil without a positive pressure head (Figs. 21A and 21B).
The unsaturated redistribution of rainwater causes reduction in cohesive strength of
the slope materials (Fig. 18). The critical pressure heads for the sandstone slopes were
calculated to be negative values (Fig. 25A). The stability simulation proves that the
36
sandstone slopes do not require positive pressure heads for landsliding. These facts
indicate that the wetting front migration by intense rainwater infiltration causes an
unsaturated landslide associated only with the reduction in soil cohesion.
Forefront of the down-seeping wetting band locates the slip plane of this type of
landslide. The same concept of landslide initiation is supported by a numerical
simulation of subsurface rainwater diffusion (Collins and Znidarcic, 2004). The
landsliding on the sandstone slope is controlled by whether or not the wetting front
reaches deep enough to form a failure plane.
The impermeable bedrock beneath a rather permeable soil layer prevents the
percolation of rainwater in the mudstone slopes (Fig. 13). The thin overburden
becomes a saturated state with a relatively small amount of rainfall (Fig. 20B). This
results in a generation of positive pressure heads, building up a shallow transient
groundwater table (Fig. 21D).
The pressure head in the mudstone slope responds promptly to rainfall, reaching a
positive state in a short period (Fig. 21C). This hydrological response lends support to
the concept of efficiency of pore-pressure transmission associated with slope-normal
rainwater infiltration (Iverson, 2000). It also implies that the concept of the steady-state
groundwater flow is not appropriate to assess the direct triggering of landslides, even
where the hillslopes are underlain by impermeable bedrock. In fact, landslides in the
mudstone area took place on uppermost hollows (Matsushi and Matsukura, 2004)
without large contributing areas assumed in the steady-state model.
The mudstone slopes become a critical condition when the pressure head reaches a
positive value of 0.7–0.8 m (Fig. 25B). The critical pressure head in the mudstone
slopes slightly exceeds the thickness of the landslides (Table 2). This indicates that the
37
slopes failed under a condition of high pore-pressures in excess of hydrostatic
maximum level generated by total saturation of the soil matrix. Such a localized
increase in pore pressures may be produced by preferential water flows in the soil layer
as demonstrated by Pierson (1983).
Water flows through macro pores in a soil layer affect hillslope stability. Rapid
discharge through a preferential conduit contributes to stabilizing a slope by increasing
the rate of soil drainage. On the contrary, when the passageway is blocked by sediment
and/or fills with water, generation of pore-water pressures in surrounding matrix
induces slope instability (Uchida et al., 2001). However, the field inspections as well as
the results of hydrological observations in the present study did not clarify that a
particular passageway of infiltrated rainwater contributes to destabilizing the
hillslopes.
Whatever the case, the positive pressure heads corresponding roughly to the soil
depth instigates a decrease in effective stress at the slip plane. The reduction of
effective stress in a maximum possible level in addition to the loss of soil cohesion
triggers a soil slip upon the impervious bedrock. This indicates that the maximum
possible pressure head causes a landslide with the minimum thickness, provided that
adequate depth of soil has developed on the bedrock.
Figure 26 illustrates the time-domain alterations in subsurface moisture and stress
states above permeable and impermeable bedrocks. The failure mechanisms were
illustrated schematically on the basis of the subsurface water behavior (Figs. 21B and
21D) and the critical conditions for landslide initiation (Fig. 25). In the sandstone slope,
the thick soil layer on the permeable bedrock cannot reach a saturated state (Fig. 26A).
In this case, wetting front migration causes reduction of cohesive strength, and the
38
slope material fails when the shearing resistance drops below the shear stress without
positive pressure head. In the slope with impermeable mudstone, the thin overburden
becomes saturated with a relatively small amount of rainfall, forming a transient
groundwater table (Fig. 26B). As a result, in addition to the reduction in soil cohesion,
a decrease in effective stress caused by positive pressure head triggers a soil slip upon
the bedrock.
These mechanisms of landslide initiation are verifiable through the rainfall amount
of the landslide-triggering storm on August 1, 1989. Total rainfall of 250 mm, 300 mm,
450 mm, and 350 mm fell respectively at Yokohama, Kisarazu, Sakuma, and Sakahata
from the beginning of rainfall on July 31 (Fig. 5). Rainfall provided to the studied hills
during the storm course can be estimated as ~340 mm from the average of these
records.
The pre-storm moisture conditions can be estimated from the pressure head
observation during irrigation intervals as ~ −0.5 m for the sandstone slope, and < −1 m
for the mudstone slope (Fig. 20). These pressure heads correspond to volumetric water
contents of 0.20 m3/m3 and 0.35 m3/m3, respectively (Fig. 23). Considering the
saturated volumetric water contents of 0.47 m3/m3 for the sandstone-soil and 0.53
m3/m3 for the mudstone-soil (Table 4), total saturation of the soils requires water inputs
of 0.27 m3/m3 and 0.18 m3/m3, respectively.
Depths of the landslides are 1.4–1.7 m for the sandstone slopes, and 0.6–0.7 m for
the mudstone slopes (Table 2). The saturation of the soil column needs a rainfall
amount of 380–460 mm for the sandstone slopes and 110–130 mm for the mudstone
slopes. The total rainfall provided by the storm (~340 mm) did not match up the
requirement of the saturation of the sandstone-soil, but sufficed for the complete
39
saturation of the mudstone-soil. These estimates support the concepts of the landslide
mechanism in each hillslope (Fig. 26).
VI-1-4 Implication of the landslide-triggering mechanisms to landslide
locations and hill morphologies
The landsliding with negative pressure heads usually occurs on hillslopes where the
slope angles are steeper than the angle of shearing resistance of the slope material (Rao,
1996). This is because the frictional component in resisting force bears the stability of
slopes, even if the cohesive strength completely vanishes away. Slopes gentler than the
angle of shearing resistance can slip only when the ascending force acts on the
potential failure material (Iverson and Major, 1986). However, such a buoyancy effect
is not expected for the sandstone slopes, because of the absence of the positive
pressure heads (Figs. 20A and 21A).
The angle of shearing resistance is 28.3° for the soil on the sandstone slope (Table 7).
Indeed, landslide locations in the sandstone area are confined to the steep (> 30°) lower
parts of the hillslopes (Matsushi and Matsukura, 2004). Thus, landslides do not erode
the gentle (typically < 20°) upper slopes, even where the thick soil mantles has
developed on the bedrock. This confinement of landslide locations may result in the
preservation of relatively high rounded hillcrests in the sandstone area (Fig. 3).
Generation of positive pressure head can triggers landslides even on relatively gentle
parts of the hillslopes, provided that adequately thick soil has developed on the
bedrock. Consequently, the soil thickness controls the landslide occurrence, rather than
slope angles in the mudstone hillslopes. The similar slope condition was reported in a
tropical rainforest in Brunei, where intensive rainstorms often hit the hillslopes (Dykes,
40
2002); only a thin soil layer covers the steep hillslopes of the rainforest, because of the
continuous soil removal by shallow landsliding. In a similar way, the mudstone area
has been eroded at a rate equivalent to the rate of bedrock weathering, maintaining
only thin overburden on the hillslopes.
Convergent hollows become the most feasible locations for the shallow landslides in
the mudstone hill, since they accumulate sediment from surrounding ridges or side
slopes in addition to the in-situ soil production from the bedrock (Reneau and Dietrich,
1987; Reneau et al., 1989, 1990; Yamada, 1999; Sasaki et al. 2000). Landslides on the
uppermost hollows probably spread their effect toward the hillcrest. The mudstone
hillcrests show a narrow bedrock-dominant edge, which is likely to be affected by
headward erosion of valley slopes. Dissection of the ridge crests by the frequent
landsliding of the hillslopes located on either side of the ridge line may be responsible
for evolving the rugged hilly landscapes (Figs. 1 and 3).
VI-2 Rainfall thresholds for landsliding
VI-2-1 Changes in factor of safety during rain storms
The slope stability analysis using Eqs. (6) and (1) allows us to pursuit stability
fluctuations of the studied slopes (Fig. 27). The factors of safety were calculated from
the observed pressure head at each monitoring depth with local slope angles (38.8° for
ST2, 35.7° for MT3). The two sets of parameters for soil-water characteristic curves
were used in the calculation: the set for deeper samples in each soil as a representative
of the laboratory curves (at 75-cm depth for the sandstone, 30-cm depth for the
mudstone, Table 4), and the set for in situ envelopes (Table 8). Other parameters in the
equations were assumed to be constant over the depth, being fixed on the values in
41
Tables 3 and 7.
The factor of safety in the sandstone slope shows a similar temporal variation in the
cases using the laboratory and in situ parameters for the assumed soil-water
characteristic curve (Figs. 27A and 27C). FS-values at 30-cm depth in the sandstone
slope sharply falls from 4.0–6.0 to nearly 2.0 during every rainfall events, whereas
those at depths of 75 cm and 120 cm respond more slowly with a narrow range of
fluctuations around FS = 1.0–3.0. The sensitive responses at the shallow zone are
induced by soil wetting from land surface. The subsequent rainwater redistribution
causes the instability in the deeper zones. The deepest point (120 cm) consistently
exhibits the low FS-values below 2.0, indicating the unstable predisposition of the
sandstone slope.
The changing patterns of FS in the mudstone slope differ with the setting parameters
for the soil-water characteristic curve. FS-values fluctuate within a relatively wide
range at the all monitoring depths, in the case using the laboratory parameters (Fig.
27B). Even at deeper points (60 cm or 90 cm), FS maintains relatively large values
around 3.0–4.0 during intervals of rainfall events. FS-values in the case using the in
situ parameters exhibit a relatively narrow range of fluctuations, especially in winter to
spring months below 2.0, at depths of 60 cm and 90 cm (Fig. 27D).
The difference in FS-values with the in-situ and laboratory soil-water retention
characteristics results from the water-retentive tendency of the in situ curve (Fig. 23B).
However, in both cases, positive pressure heads under a completely saturated condition
causes the eventual destabilization of the mudstone slope, reducing the factors of
safety to nearly the stability limit of FS = 1. Hence the difference between the
laboratory and in situ parameters does not affect the FS-values for the near-critical
42
state in the mudstone slope.
VI-2-2 Analysis of the relationship between the magnitudes of
rainfall and slope instability
The factor of safety decreases transiently, forming a temporal depression in response
to an individual rainfall (Fig. 28A). Relation between the magnitude of rainfall events
and the minimum FS-values was analyzed at the deepest monitoring depths which are
located roughly on an extension of the slip surface (ST2: 120 cm; MT3: 90 cm). The
analysis for the sandstone slope was performed for the two origins of FS-values, from
the laboratory and in situ soil-water retention curves, for evaluating the hysteresis
effect in soil wetting. This dual analysis makes no sense in the case of the mudstone
slope, because the minimum FS-values appear under completely saturated conditions.
The dimple of the FS-value develops with a delay from the rainfall peak. Rainfall
over a specified time period prior to the dimple appearance affects the minimum
FS-values. Hence the mean rainfall intensities during the preceding x hours were
calculated (Fig. 28A), where x is a series of 28 time frames of rainfall: 0.5, 1, 2, 3, 4, 5,
6, 8, 10, 12, 14, 16, 18, 20, 24, 30, 36, 48, 60, 72, 84, 96, 108, 120, 132, 144, 156, and
168 h. The datasets of the minimum FS-value and the 28 types of mean rainfall
intensity can be obtained from every rainfall event which renders transiently the slope
unstable.
The minimum factor of safety becomes smaller with increasing magnitude of
rainfall. Hence the minimum FS-value correlates inversely with the mean intensity of
the preceding rainfall (Fig. 28B). The relationships were examined sequentially
through the 28 rainfall durations with varying time periods. The correlation becomes
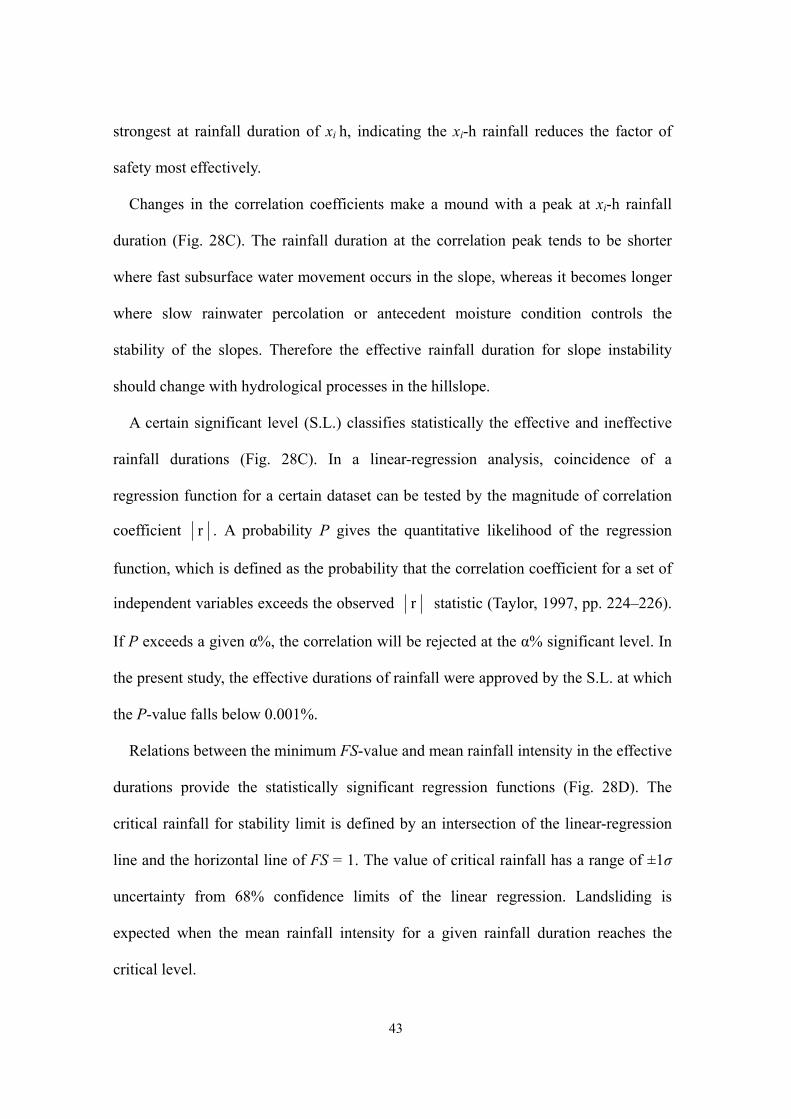
43
strongest at rainfall duration of xi h, indicating the xi-h rainfall reduces the factor of
safety most effectively.
Changes in the correlation coefficients make a mound with a peak at xi-h rainfall
duration (Fig. 28C). The rainfall duration at the correlation peak tends to be shorter
where fast subsurface water movement occurs in the slope, whereas it becomes longer
where slow rainwater percolation or antecedent moisture condition controls the
stability of the slopes. Therefore the effective rainfall duration for slope instability
should change with hydrological processes in the hillslope.
A certain significant level (S.L.) classifies statistically the effective and ineffective
rainfall durations (Fig. 28C). In a linear-regression analysis, coincidence of a
regression function for a certain dataset can be tested by the magnitude of correlation
coefficient r . A probability P gives the quantitative likelihood of the regression
function, which is defined as the probability that the correlation coefficient for a set of
independent variables exceeds the observed r statistic (Taylor, 1997, pp. 224–226).
If P exceeds a given α%, the correlation will be rejected at the α% significant level. In
the present study, the effective durations of rainfall were approved by the S.L. at which
the P-value falls below 0.001%.
Relations between the minimum FS-value and mean rainfall intensity in the effective
durations provide the statistically significant regression functions (Fig. 28D). The
critical rainfall for stability limit is defined by an intersection of the linear-regression
line and the horizontal line of FS = 1. The value of critical rainfall has a range of ±1σ
uncertainty from 68% confidence limits of the linear regression. Landsliding is
expected when the mean rainfall intensity for a given rainfall duration reaches the
critical level.
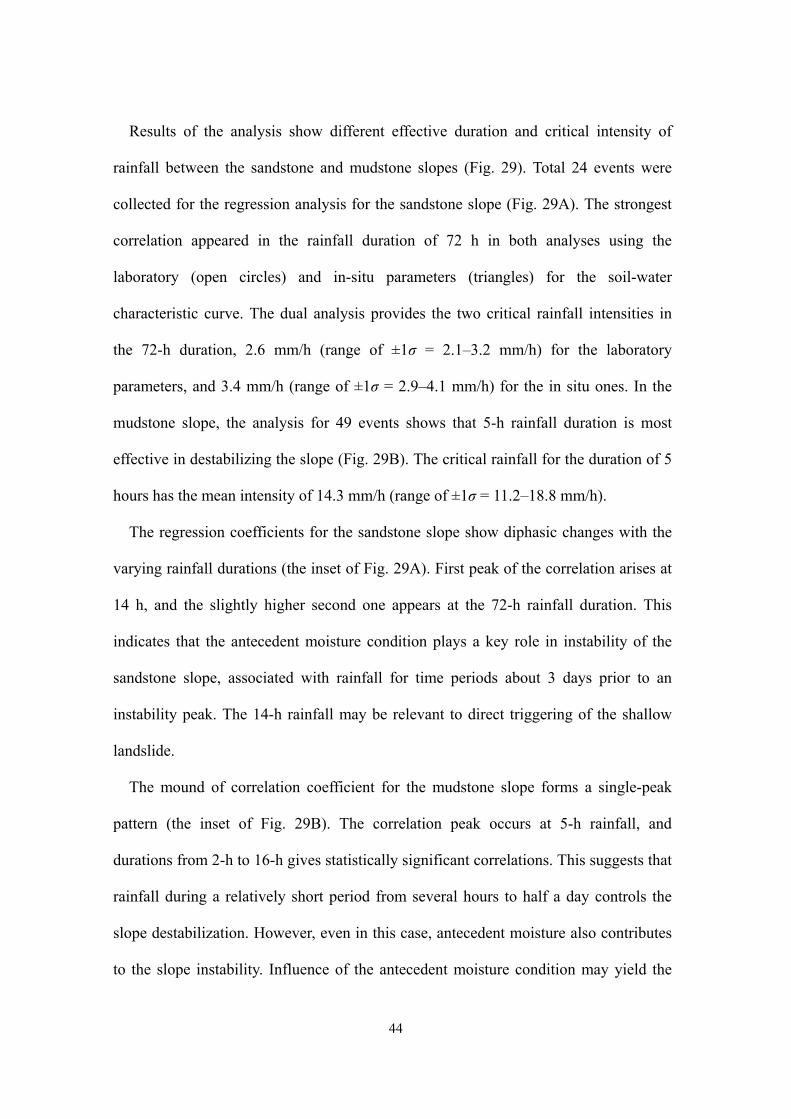
44
Results of the analysis show different effective duration and critical intensity of
rainfall between the sandstone and mudstone slopes (Fig. 29). Total 24 events were
collected for the regression analysis for the sandstone slope (Fig. 29A). The strongest
correlation appeared in the rainfall duration of 72 h in both analyses using the
laboratory (open circles) and in-situ parameters (triangles) for the soil-water
characteristic curve. The dual analysis provides the two critical rainfall intensities in
the 72-h duration, 2.6 mm/h (range of ±1σ = 2.1–3.2 mm/h) for the laboratory
parameters, and 3.4 mm/h (range of ±1σ = 2.9–4.1 mm/h) for the in situ ones. In the
mudstone slope, the analysis for 49 events shows that 5-h rainfall duration is most
effective in destabilizing the slope (Fig. 29B). The critical rainfall for the duration of 5
hours has the mean intensity of 14.3 mm/h (range of ±1σ = 11.2–18.8 mm/h).
The regression coefficients for the sandstone slope show diphasic changes with the
varying rainfall durations (the inset of Fig. 29A). First peak of the correlation arises at
14 h, and the slightly higher second one appears at the 72-h rainfall duration. This
indicates that the antecedent moisture condition plays a key role in instability of the
sandstone slope, associated with rainfall for time periods about 3 days prior to an
instability peak. The 14-h rainfall may be relevant to direct triggering of the shallow
landslide.
The mound of correlation coefficient for the mudstone slope forms a single-peak
pattern (the inset of Fig. 29B). The correlation peak occurs at 5-h rainfall, and
durations from 2-h to 16-h gives statistically significant correlations. This suggests that
rainfall during a relatively short period from several hours to half a day controls the
slope destabilization. However, even in this case, antecedent moisture also contributes
to the slope instability. Influence of the antecedent moisture condition may yield the
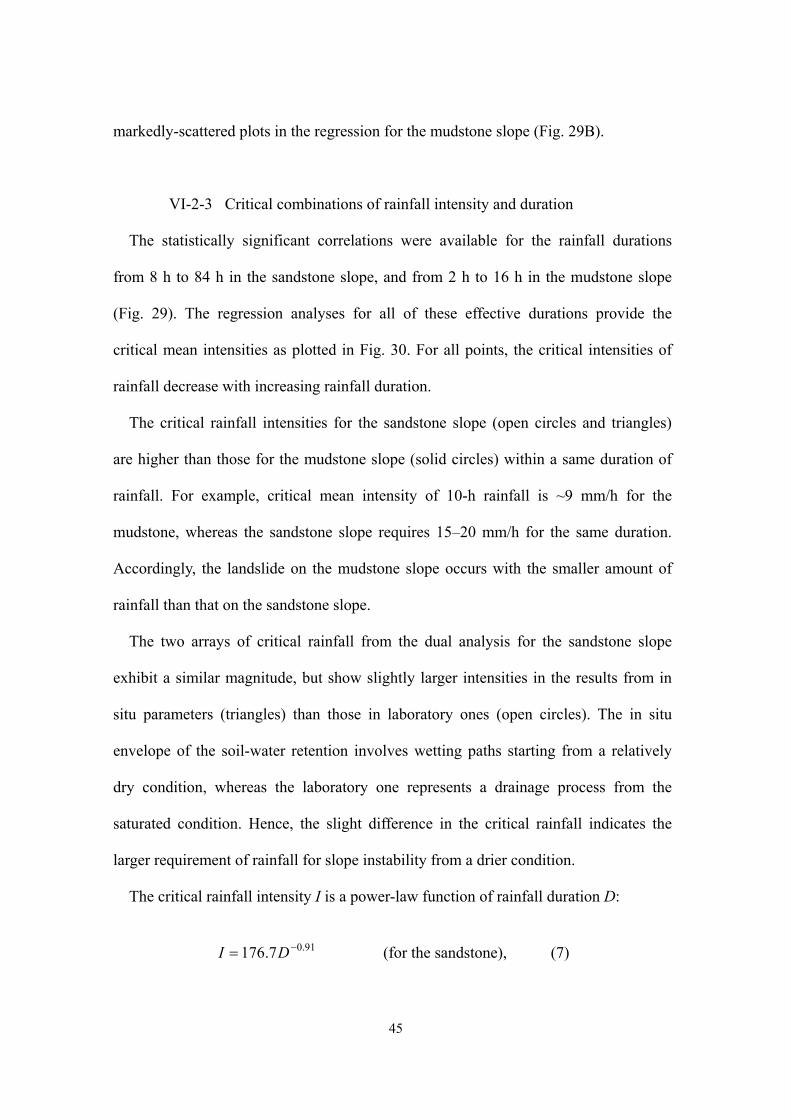
45
markedly-scattered plots in the regression for the mudstone slope (Fig. 29B).
VI-2-3 Critical combinations of rainfall intensity and duration
The statistically significant correlations were available for the rainfall durations
from 8 h to 84 h in the sandstone slope, and from 2 h to 16 h in the mudstone slope
(Fig. 29). The regression analyses for all of these effective durations provide the
critical mean intensities as plotted in Fig. 30. For all points, the critical intensities of
rainfall decrease with increasing rainfall duration.
The critical rainfall intensities for the sandstone slope (open circles and triangles)
are higher than those for the mudstone slope (solid circles) within a same duration of
rainfall. For example, critical mean intensity of 10-h rainfall is ~9 mm/h for the
mudstone, whereas the sandstone slope requires 15–20 mm/h for the same duration.
Accordingly, the landslide on the mudstone slope occurs with the smaller amount of
rainfall than that on the sandstone slope.
The two arrays of critical rainfall from the dual analysis for the sandstone slope
exhibit a similar magnitude, but show slightly larger intensities in the results from in
situ parameters (triangles) than those in laboratory ones (open circles). The in situ
envelope of the soil-water retention involves wetting paths starting from a relatively
dry condition, whereas the laboratory one represents a drainage process from the
saturated condition. Hence, the slight difference in the critical rainfall indicates the
larger requirement of rainfall for slope instability from a drier condition.
The critical rainfall intensity I is a power-law function of rainfall duration D:
91.07.176 −= DI (for the sandstone), (7)
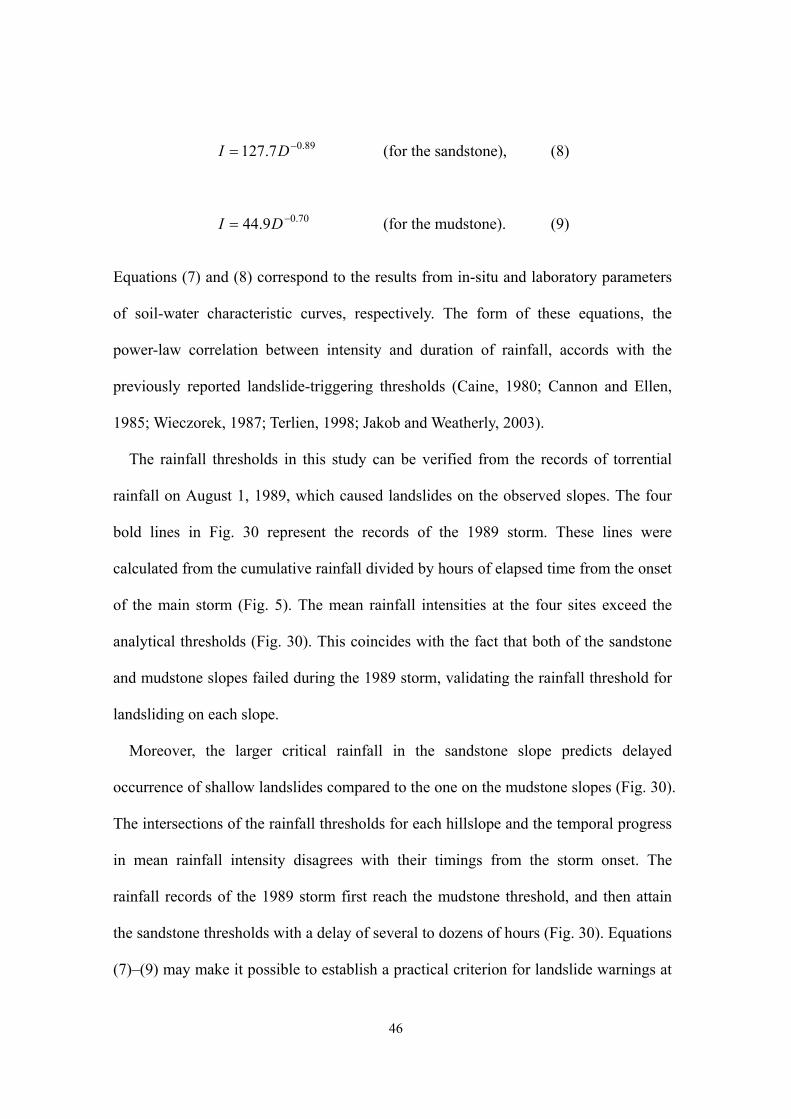
46
89.07.127 −= DI (for the sandstone), (8)
70.09.44 −= DI (for the mudstone). (9)
Equations (7) and (8) correspond to the results from in-situ and laboratory parameters
of soil-water characteristic curves, respectively. The form of these equations, the
power-law correlation between intensity and duration of rainfall, accords with the
previously reported landslide-triggering thresholds (Caine, 1980; Cannon and Ellen,
1985; Wieczorek, 1987; Terlien, 1998; Jakob and Weatherly, 2003).
The rainfall thresholds in this study can be verified from the records of torrential
rainfall on August 1, 1989, which caused landslides on the observed slopes. The four
bold lines in Fig. 30 represent the records of the 1989 storm. These lines were
calculated from the cumulative rainfall divided by hours of elapsed time from the onset
of the main storm (Fig. 5). The mean rainfall intensities at the four sites exceed the
analytical thresholds (Fig. 30). This coincides with the fact that both of the sandstone
and mudstone slopes failed during the 1989 storm, validating the rainfall threshold for
landsliding on each slope.
Moreover, the larger critical rainfall in the sandstone slope predicts delayed
occurrence of shallow landslides compared to the one on the mudstone slopes (Fig. 30).
The intersections of the rainfall thresholds for each hillslope and the temporal progress
in mean rainfall intensity disagrees with their timings from the storm onset. The
rainfall records of the 1989 storm first reach the mudstone threshold, and then attain
the sandstone thresholds with a delay of several to dozens of hours (Fig. 30). Equations
(7)–(9) may make it possible to establish a practical criterion for landslide warnings at
47
different timings in various rainfall situations. Unfortunately, no record of actual
landslide timings is available during the 1989 storm. The verification of this prediction
is left to future works which prove the time-lags of the landslides within a prolonged
storm event.
VI-2-4 Recurrence intervals of the critical rainfall
Rainfall records from 1940 to 2004 at Yokohama meteorological station provide
standard intensity–duration–frequency curves of rainfall (solid lines in Fig. 31). These
curves were calculated from the probable rainfall-intensity formula by the specific
coefficient method for annual maximum records of 1-h and 24-h rainfall (Iwai and
Ishiguro, 1970, pp. 162–177). This method is a statistical processing for estimating
non-exceedance probability of mean rainfall intensity during an arbitrary time-frame of
rainfall. Thus the curves indicate equipotential lines of probabilities (i.e., return
periods) for varying combinations of rainfall intensity and duration.
By combining with the return periods of rainfall, one can translate the critical
intensity–duration relationship to a recurrence interval of the landslide-triggering
rainfall. This refinement derives a minimum recurrence interval of landslide events,
based upon an implicit assumption of optimal material conditions for failure at all time.
The recurrence interval of the critical rainfall ranges 3–200 years for the sandstone
slope (incorporating the error bars), whereas it is 1.1–3 years for the mudstone slope
(Fig. 31). The discrete recurrence intervals of the critical rainfall implies that the
landslide probability varies from several to dozens of times during a given time period.
Of note is that the sandstone slope requires higher rainfall intensity and greater
rainfall duration, and thus longer recurrence intervals than the mudstone slope (Fig. 31).
48
This implies the lower potential for landsliding in the sandstone slope, corresponding
to the lower landslide activity (Fig. 7). Smaller landslide frequency is responsible for
the preservation of thick and hardly saturated soil layers on the hillslope as stated by
Onda (1992). This negative feedback system between the soil development and the soil
removal by landsliding may exist on the sandstone hillslope.
VI-3 Summary of discussion, advantages and future prospects
Figure 32 summarizes the hydrological triggering systems of the shallow landslides
in the studied hills. Weathering of bedrock under a certain climate condition provides
soils on hillslopes with site-specific physical properties, especially in shear strength
and soil-water retention characteristics. They affect mechanical stability limit of the
hillslopes. Permeability of the bedrock controls the hydrological processes in the
hillslopes and mechanisms of shallow landslide initiation.
Permeable bedrocks produce a deep and stable groundwater system across an entire
hillslope. Rainwater supplied to the slope seeps vertically through the near-surface
zone. The downward migration of the wetting front reduces soil cohesion, and results
in a shallow landslide under an unsaturated regime. Rain in excess of the threshold for
this type of landsliding falls over several hours to a few days, with a return period in
decadal scale.
Hillslopes with impervious bedrocks produce a shallow transient drainage system in
soils upon the bedrock. The relatively permeable soil layer drains incoming rainwater
out to slopes under saturated conditions. The shallow groundwater table builds up and
dissipates transiently, generating positive pressure head in the soil mass. The resultant
decrease in effective stress at the soil bottom triggers a slide of the soil layer. The
49
instantaneous rainfall with durations from several hours to half a day triggers a
landslide, which occurs within a short recurrence interval up to three years.
The rainfall thresholds in the present study incorporate the site-specific factors, such
as strength of slope materials or slope hydrological processes. These factors were
ignored or poorly taken into account in a traditional approach that differentiated the
landslide-triggering storms from non-landslide rainfall events (Cannon and Ellen,
1985; Keefer et al, 1987; Wieczorek, 1987; Jakob and Weatherly, 2003). The analytical
procedure for determining the site-specific threshold is applicable to any regions where
geotechnical soil properties and a certain amount of hydrological data are available.
Residents living in a vicinity of hazardous areas may be able to evacuate following the
warnings based on the site-specific critical combination of rainfall intensity and
duration.
Although the rainfall in excess of the threshold is a necessary, but it is not a
sufficient condition for landslide occurrence. Landslides would not occur under an
inadequate soil thickness. Soil depths on hillslopes changes both temporally and
spatially as the past scars with different ages recover sequentially with soil
accumulation and bedrock weathering (Shimokawa 1984; Trustrum and De Rose,
1988). Thus the spatial and temporal distribution of landslide is influenced strongly by
the historical sequence of landsliding (Iida, 2004). Quantitative evaluation of the actual
landslide frequencies requires a more integrated approach incorporating a numerical
modeling of subsurface water behavior, topographic effect of slope instability, and
basin wide distribution of soil thickness and its alteration in a long time-scale.
50
Chapter VII Conclusions
This study has focused on landslide mechanisms and rainfall threshold on hillslopes
underlain by permeable sandstone and impermeable mudstone in the Boso Peninsula,
central Japan. Pressure head monitoring revealed contrasting hydrological processes in
hillslopes, and a slope stability analysis including strength reduction of the slope
material specified the critical pressure heads for landslide initiation. An analysis of
relationship between the magnitude of rainfall and hillslope instability provides critical
combinations of rainfall intensity and duration. Hillslopes with different geological
settings are denudated by dissimilar landslides in their mechanisms and rainfall
thresholds.
In hillslopes with permeable sandstone, subsurface pressure head at the deepest
monitoring depth did not exceed 0 m in response to rainfall. Infiltrated rainwater
percolates through the bedrock as an unsaturated gravitational flow, giving a constant
base flow from the watershed. Critical pressure head for landslide initiation were
calculated to be −0.1–0 m, suggesting that the reduction in soil cohesion by
wetting-front migration causes a landslide. This type of landslide occurs entirely on a
steep lower part of the hillslopes (> ~30°) where the slope angles are larger than the
angle of shearing resistance of the soil. Rainfall during three days destabilizes the
sandstone hillslope most effectively, suggesting the significance of ancient soil
moisture for the initiation of the unsaturated landslide.
The pressure heads at a soil–bedrock boundary in hillslope with impermeable
mudstone reaches positive values of ~0.5 m in response to almost all rainfall. A
saturated subsurface storm flow drains the infiltrated rainwater and produces the acute
51
runoff responses from the watershed. Critical pressure head for landslide initiation
were calculated to be 0.7–0.8 m. In addition to a reduction in soil cohesion, a decrease
in effective stress causes a landslide under a saturated regime. The relatively shorter
rainfall with durations from several hours to half a day is crucial for this type of
landslide initiation. This indicates that an intense and instantaneous rainfall contributes
to triggering shallow landslides.
Rainfall intensity for landslide initiation is represented as a power-law function of
rainfall duration. The critical combination of rainfall intensity and duration for the
permeable sandstone slope recurs with a decadal return period (3–200 years), whereas
the impermeable mudstone slope has a threshold with a yearly recurrence interval
(1.1–3 years). The rainfall thresholds incorporate geotechnical soil properties and slope
hydrological processes in each hillslope. The longer return period of the threshold
implies the lower potential for landsliding, which corresponds to the lower landslide
activity in the hillslopes with permeable bedrocks.
52
Acknowledgements
I wish to appreciate Professor Dr. Yukinori Matsukura (University of Tsukuba) for
his valuable suggestions, guidance, and encouragement. Constructive comments by
Professor Dr. Norikazu Matsuoka (University of Tsukuba) benefited logical
organization of this study. I thank Professor Dr. Norikazu Matsuoka again for lending
the geo-electric apparatus for the subsurface resistivity inspections. The script of this
thesis was greatly improved with critical readings by Professor Dr. Norikazu Matsuoka,
Professor Dr. Tadashi Tanaka (University of Tsukuba), and Assistant Professor Dr.
Tomohiro Sekiguchi (University of Tsukuba). Professor Dr. Tadashi Tanaka lent me
generously the weirs and the rain gauge for field observations. Technical supports by
Dr. Tsuyoshi Hattanji (University of Tsukuba) permitted performance of the continuous
hydrological measurements. I thank also Mr. Tetsuya Kogure for his assists in
tensiometer settings and seismic soundings. My colleagues Mr. Tatsuya Watanabe, Ms.
Yasuko Fukai, Mr. Shouhei Kizaki, and Ms. Marie Yamamoto supported field work for
the electrical resistivity measurements. Discussions in regular seminars with members
of the geomorphology research group of the University of Tsukuba helped motivate
this work.
53
References
Aniya, M., 1985. Contemporary erosion rate by landsliding in Amahata River basin,
Japan. Zeitschrift für Geomorphologie Neue Folge 39, 301–314.
Borga, M., Fontana, G.D., Gregoretti, C., Marchi, L., 2002. Assessment of shallow
landsliding by using a physically based model of hillslope stability. Hydrological
Processes 16, 2833–2851.
Caine, N., 1980. The rainfall intensity–duration control of shallow landslides and
debris flows. Geografiska Annaler 62A, 23–27.
Cannon, S.H., Ellen, S., 1985. Rainfall conditions for abundant debris avalanches, San
Francisco Bay region, California. California Geology 38, 267–272.
Carson, M.A., 1971. An application of the concept of threshold slopes to the Laramie
Mountains, Wyoming. In: Brunsden, D., (Eds.), Slopes Form and Process.
Institute of British Geographers, Special Publication 3, 31–48.
Carson, M.A., Petley, D.J., 1970. The existence of threshold hillslopes in the
denudation of landscape. Institute of British Geographers Transactions 49, 71–95.
Cho, S.E., Lee, S.R., 2001. Instability of unsaturated soil slopes due to infiltration.
Computers and Geotechnics 28, 185–208.
Collins, B.D., Znidarcic, D., 2004. Stability analyses of rainfall induced landslides.
Journal of Geotechnical and Geoenvironmental Engineering 130, 362–372.
Dietrich, W.E., Dunne, T., 1978. Sediment budget for a small catchment in
mountainous terrain. Zeitschrift für Geomorphologie Neue Folge
Supplementbände 29, 191–206.
54
D’Odorico, P., Fagherazzi, S., Rigon, R., 2005. Potential for landsliding: Dependence
on hyetograph characteristics. Journal of Geophysical Research 110, F01007, doi:
10.1029/2004JF000127.
Dykes, A.P., 2002. Weathering-limited rainfall-triggered shallow mass movements in
undisturbed steepland tropical rainforest. Geomorphology 46, 73–93.
Escario, V., Sáez, J., 1986. The shear strength of partly saturated soils. Géotechnique
36, 453–456.
Fannin, R.J., Jaakkola, J., 1999. Hydrological response of hillslope soils above a
debris-slide headscarp. Canadian Geotechnical Journal 36, 1111–1122.
Fannin, R.J., Jaakkola, J., Wilkinson, J.M.T., Hetherington, E.D., 2000. Hydrologic
response of soils to precipitation at Carnation Creek, British Columbia, Canada.
Water Resources Research 36, 1481–1494.
Fredlund, D.G., Morgenstern, N.R., Widger, R.A., 1978. The shear strength of
unsaturated soils. Canadian Geotechnical Journal 15, 313–321.
Furuya, T., Ohkura, H., 1992. Some geological and geomorphological characteristics
of the slope failures on the Mt. Kano-zan and its environs in the Boso Peninsula,
Japan. Journal of Japan Landslide Society 28–4, 29–36 (in Japanese, with English
abstract).
Gan, J.K.M., Fredlund, D.G., Rahardjo, H., 1988. Determination of the shear strength
parameters of an unsaturated soil using the direct shear test. Canadian
Geotechnical Journal 25, 500–510.
Gasmo, J.M., Rahardjo, H., Leong, E.C., 2000. Infiltration effects on stability of a
residual soil slope. Computers and Geotechnics 26, 145–165.
55
Iida, T., 1999. A stochastic hydro-geomorphological model for shallow landsliding due
to rainstorm. Catena 34, 293–313.
Iida, T., 2004. Theoretical research on the relationship between return period of rainfall
and shallow landslides. Hydrological Processes 18, 739–756.
Iida, T., Okunishi, K., 1979. On the slope development caused by the surface
landslides. Geographical Review of Japan 52A, 426–438 (in Japanese, with
English abstract).
Iida, T., Okunishi, K., 1983. Development of hillslopes due to landslides. Zeitschrift
für Geomorphologie Neue Folge Supplementbände 46, 67–77.
Inoue, K., Oguchi, T., 1995. Effects of hillslope failure on stream bifurcation ratios and
stream length ratios for the Matsumoto region, Japan. Geographical Review of
Japan 68A, 447–464 (in Japanese, with English abstract).
Ito, M., 1995. Volcanic ash layers facilitate high-resolution sequence stratigraphy at
convergent plate margins: an example from the Plio–Pleistocene forearc basin fill
in the Boso Peninsula, Japan. Sedimentary Geology 95, 187–206.
Ito, M., 1998. Submarine fan sequences of the lower Kazusa Group, a Plio–Pleistocene
forearc basin fill in the Boso Peninsula, Japan. Sedimentary Geology 122, 69–93.
Ito, M., Horikawa, K., 2000. Millennial- to decadal-scale fluctuation in the
paleo-Kuroshio Current documented in the Middle Pleistocene shelf succession
on the Boso Peninsula, Japan. Sedimentary Geology 137, 1–8.
Iverson, R.M., 2000. Landslide triggering by rain infiltration. Water Resources
Research 36, 1897–1910.
56
Iverson, R.M., Major, J.J., 1986. Groundwater seepage vectors and the potential for
hillslope failure and debris flow mobilization. Water Resources Research 22,
1543–1548.
Iwai, S., Ishiguro, M., 1970. Applied Hydrological Statistics. Morikita Shuppan, Tokyo,
370 p (in Japanese).
Jakob, M., Weatherly, H., 2003. A hydroclimatic threshold for landslide initiation on
the North Shore Mountains of Vancouver, British Columbia. Geomorphology 54,
137–156.
Johnson, K.A., Sitar, N., 1990. Hydrologic conditions leading to debris-flow initiation.
Canadian Geotechnical Journal 27, 789–801.
Kaizuka, S., Koike, K., Endo, K., Yamazaki, H., Suzuki, T., 2000. Regional
Geomorphology of the Japanese Islands Vol. 4: Geomorphology of Kanto and
Izu-Ogasawara. University of Tokyo Press, Tokyo (in Japanese).
Kamai, T., 1989. Slope failures by the 1987 Chibaken-toho-oki Earthquake in the
Kazusa-Hills, Boso Peninsula, Central Japan —Classification of failures and
slope stability. Journal of Japan Landslide Society 26–1, 16–25 (in Japanese with
English abstract).
Kamai, T., Noro, H., 1988. Slope failures in Kazusa-Hills during the 1987
Chibaken-Touhouoki Earthquake —Distribution and shape of failures. Journal of
the Japan Society of Engineering Geology 29–4, 1–10 (in Japanese with English
abstract).
Keefer, D.K., Wilson, R.C., Mark, R.K., Brabb, E.E., Brown, W.M., Ellen, S.D., Harp,
E.L., Wieczorek, G.F., Alger, C.S., Zatkin, R.S., 1987. Real-time landslide
warning during heavy rainfall. Science 238, 921–925.
57
Kim, J., Jeong, S., Park, S., Sharma, J., 2004. Influence of rainfall-induced wetting on
the stability of slopes in weathered soils. Engineering Geology 75, 251–262.
Kosugi, K., 1994. Three-parameter lognormal distribution model for soil water
retention. Water Resources Research 30, 891–901.
Krahn, J., Fredlund, D.G., Klassen, M.J., 1989. Effect of soil suction on slope stability
at Notch Hill. Canadian Geotechnical Journal 26, 269–278.
Lee, S.J., Lee, S.R., Kim, Y.S., 2003. An approach to estimate unsaturated shear
strength using artificial neural network and hyperbolic formulation. Computers
and Geotechnics 30, 489–503.
Marquardt, D.W., 1963. An algorithm for least-squares estimation of non-linear
parameters. Journal of the Society for Industrial and Applied Mathematics 11,
431–441.
Matsukura, Y., 1984. Soil slips of two grus-slopes in Mino-mikawa Mountains, Central
Japan. Annual Report of the Institute of Geoscience, the University of Tsukuba 10,
59–62.
Matsukura, Y., Tanaka, Y., 1983. Stability analysis for soil slips of two gruss-slopes in
southern Abukuma Mountains, Japan. Transactions, Japanese Geomorphological
Union 4, 229–139.
Matsushi, Y., Matsukura, Y., 2004. Mechanism and location of slope failures in hilly
terrains with different bedrock permeability. Transactions, Japanese
Geomorphological Union 25, 139–159 (in Japanese, with English abstract).
Miao, L., Liu, S., Lai, Y., 2002. Research of soil-water characteristics and shear
strength features of Nanyang expansive soil. Engineering Geology 65, 261–267.
58
Mino, Y., 1942. Basis Theories of Geomorphology. Kokon-Shoin, Tokyo, 517 pp (in
Japanese).
Montgomery, D.R., Dietrich, W.E., 1988. Where do channels begin? Nature 336,
232–234.
Montgomery, D.R., Dietrich, W.E., 1989. Source areas, drainage density, and channel
initiation. Water Resources Research 25, 1907–1918.
Montgomery, D.R., Dietrich, W.E., 1992. Channel initiation and the problem of
landscape scale. Science 255, 826–830.
Montgomery, D.R., Dietrich, W.E., 1994. A physically based model for the topographic
control on shallow landsliding. Water Resources Research 30, 1153–1171.
Mualem, Y., 1976. A new model for predicting the hydraulic conductivity of
unsaturated porous media. Water Resources Research 12, 513–522.
Musiake, K., Oka, Y., Koike, M., 1988. Unsaturated zone soil moisture behavior under
temperate humid climatic conditions —Tensiometric observations and numerical
simulations. Journal of Hydrology 102, 179–200.
Nakagawa, H., 1960. On the cuesta topography of the Boso peninsula, Chiba
prefecture, Japan. Science reports of the Tohoku University, Second Series,
Geology, Special Volume 4, 385–391.
Numamoto, S., 1999. Monitoring of revegetation after slope failure using aerial
photography —A 25-year trend in slope failure sites created by the southern
Bousou storm in 1970. Journal of Japan Society of Erosion Control Engineering
223, 14–20 (in Japanese with English abstract).
Oguchi, T., 1997. Drainage density and relative relief in humid steep mountains with
frequent slope failure. Earth Surface Processes and Landforms 22, 107–120.
59
Okimura, T., Ichikawa, R., 1985. A prediction method for surface failures by
movements of infiltrated water in a surface soil layer. Natural Disaster Science 7,
41–51.
Onda, Y., 1992. Influence of water storage capacity in the regolith zone on
hydrological characteristics, slope processes, and slope form. Zeitschrift für
Geomorphologie Neue Folge 36, 165–178.
Onda, Y., 1994. Contrasting hydrological characteristics, slope processes and
topography underlain by Paleozoic sedimentary rocks and granite. Transactions,
Japanese Geomorphological Union 15, 49–65.
Onda, Y., Tsujimura, M., Tabuchi, H., 2004. The role of subsurface water flow paths on
hillslope hydrological processes, landslides and landform development in steep
mountains of Japan. Hydrological Processes 18, 637–650.
Pierson, T.C., 1983. Soil pipes and slope stability. Quarterly Journal of Engineering
Geology 16, 1–11.
Prior, D.B., Graham, J., 1974. Landslides in the Magho district of Fermanagh Northern
Ireland. Engineering Geology 8, 341–359.
Rahardjo, H., Lim, T.T., Chang, M.F., Fredlund, D.G., 1995. Shear-strength
characteristics of a residual soil. Canadian Geotechnical Journal 32, 60–77.
Rao, S.M., 1996. Role of apparent cohesion in the stability of Dominican allophane
soil slopes. Engineering Geology 43, 265–279.
Reneau, S.L., Dietrich, W.E., 1987. The importance of hollows in debris flow studies;
examples from Marin County, California. In: Costa, J.E., Wieczorek, G.F. (Eds.),
Debris flows/avalanches: process, recognition, and mitigation. Geological Society
of America, Reviews in Engineering Geology VII, 165–180.
60
Reneau, S.L., Dietrich, W.E., Donahue, D.J., Jull, A.J.T., Rubin, M., 1990. Late
Quaternary history of colluvial deposition and erosion in hollows, central
California Coast Ranges. Geological Society of America Bulletin 102, 969–982.
Reneau, S.L., Dietrich, W.E., Rubin, M., Donahue, D.J., Jull, A.J.T., 1989. Analysis of
hillslope erosion rates using dated colluvial deposits. Journal of Geology 97,
45–63.
Rogers, N.W., Selby, M.J., 1980. Mechanisms of shallow translational landsliding
during summer rainstorms: North Island, New Zealand. Geografiska Annaler 62A,
11–21.
Sasaki, Y., Fujii, A., Asai, K., 2000. Soil creep process and its role in debris slide
generation —field measurements on the north side of Tsukuba Mountain in Japan.
Engineering Geology 56, 163–183.
Selby, M.J., 1993. Hillslope Materials and Processes, Second Edition. Oxford
University Press, Oxford.
Shimokawa, E., 1984. A natural recovery process of vegetation on landslide scars and
landslide periodicity in forested drainage basins. Proceedings of the Symposium
on Effects of Forest Land Use on Erosion and Slope Stability, Hawaii, 99–107.
Simoni, A., Berti, M., Generali, M., Elmi, C., Ghirotti, M., 2004. Preliminary result
from pore pressure monitoring on an unstable clay slope. Engineering Geology 73,
117–128.
Skempton, A.W., DeLory, F.A., 1957. Proceedings of Fourth International Conference
on Soil Mechanics and Foundation Engineering, London 2, 378–381.
61
Suzuki, T., Tokunaga, E., Noda, H., Arakawa, H., 1985. Effects of rock strength and
permeability on hill morphology. Transactions, Japanese Geomorphological
Union 6, 101–130.
Talling, P.J., Sowter, M.J., 1999. Drainage density on progressively tilted surfaces with
different gradients, Wheeler Ridge, California. Earth Surface Processes and
Landforms 24, 809–824.
Taylor, J.R., 1997. An introduction to error analysis: the study of uncertainties in
physical measurements, Second edition. University Science Books, Mill Valley,
California, 328 p (translated to Japanese by Hayashi, S., Baba, R.).
Terlien, M.T.J., 1997. Hydrological landslide triggering in ash-covered slopes of
Manizales (Colombia). Geomorphology 20, 165–175.
Terlien, M.T.J., 1998. The determination of statistical and deterministic hydrological
landslide-triggering thresholds. Environmental Geology 35, 124–130.
Terzaghi, K., 1962. Stability of steep slopes on hard unweathered rock. Géotechnique
12, 251–270.
Trustrum, N.A., De Rose, R.C., 1988. Soil depth–age relationship of landslides on
deforested hillslopes, Taranaki, New Zealand. Geomorphology 1, 143–160.
Tsukamoto, Y., 1973. Study on the growth of stream channel (I) —Relationship
between stream channel growth and landslides occurring during heavy storm.
Journal of Japan Society of Erosion Control Engineering 87, 4–13 (in Japanese).
Tsukamoto, Y., Ohta, T., Noguchi, H., 1982. Hydrological and geomorphological
studies of debris slides on forested hillslopes in Japan. In: Walling, D.E. (Eds.),
Recent Development in the Explanation and Prediction of Erosion and Sediment
Yield. IAHS Publication 137, 89–98.
62
Tucker, G.E., Bras, R.L., 1998. Hillslope processes, drainage density, and landscape
morphology. Water Resources Research 34, 2751–2764.
Uchida, T., Kosugi, K., Mizuyama, T., 2001. Effects of pipeflow on hydrological
process and its relation to landslide: a review of pipeflow studies in forested
headwater catchments. Hydrological Processes 15, 2151–2174.
Vanapalli, S.K., Fredlund, D.G., Pufahl, D.E., Clifton, A.W., 1996. Model for the
prediction of shear strength with respect to soil suction. Canadian Geotechnical
Journal 33, 379–392.
Van Asch, Th.W.J, Buma, J., Van Beek, L.P.H., 1999. A view on some hydrological
triggering systems in landslides. Geomorphology 30, 25–32.
Van Genuchten, M.Th., 1980. A closed-form equation for predicting the hydraulic
conductivity of unsaturated soils. Soil Science Society of America Journal 44,
892–898.
Wakatsuki, T., Tanaka, Y., Matsukura, Y., 2005. Soil slips on weathering-limited slopes
underlain by coarse-grained granite or fine-grained gneiss near Seoul, Republic of
Korea. Catena 60, 181–203.
Waragai, T., Hirose, T., Matsukura, Y., 1993. Instability of a slope made of sandy
deposits due to earthquake on the northern Kazusa Hills. The Chiri Shiso, Annals
of the Geographical Association of Nihon University 35–1, 9–14 (in Japanese
with English abstract).
Wieczorek, G.F., 1987. Effect of rainfall intensity and duration on debris flows in
central Santa Cruz Mountains, California. In: Costa, J.E., Wieczorek, G.F. (Eds.),
Debris flows/avalanches: process, recognition, and mitigation. Geological Society
of America, Reviews in Engineering Geology VII, 93–104.
63
Wu, W., Sidle, R.C., 1995. A distributed slope stability model for steep forested basins.
Water Resources Research 31, 2097–2110.
Yamada, S., 1999. The role of soil creep and slope failure in the landscape evolution of
a head water basin: field measurements in a zero order basin of northern Japan.
Geomorphology 28, 329–344.
Yasuhara, M., 1984. Watershed response to a storm rainfall. Science Report of the
Institute of Geoscience, the University of Tsukuba 5A, 1–27.
Yatsu, E., 1950. On relief energy of the Chichibu Mountains, Japan. Transactions
Otsuka Geographical Association 6, 323–330 (in Japanese).
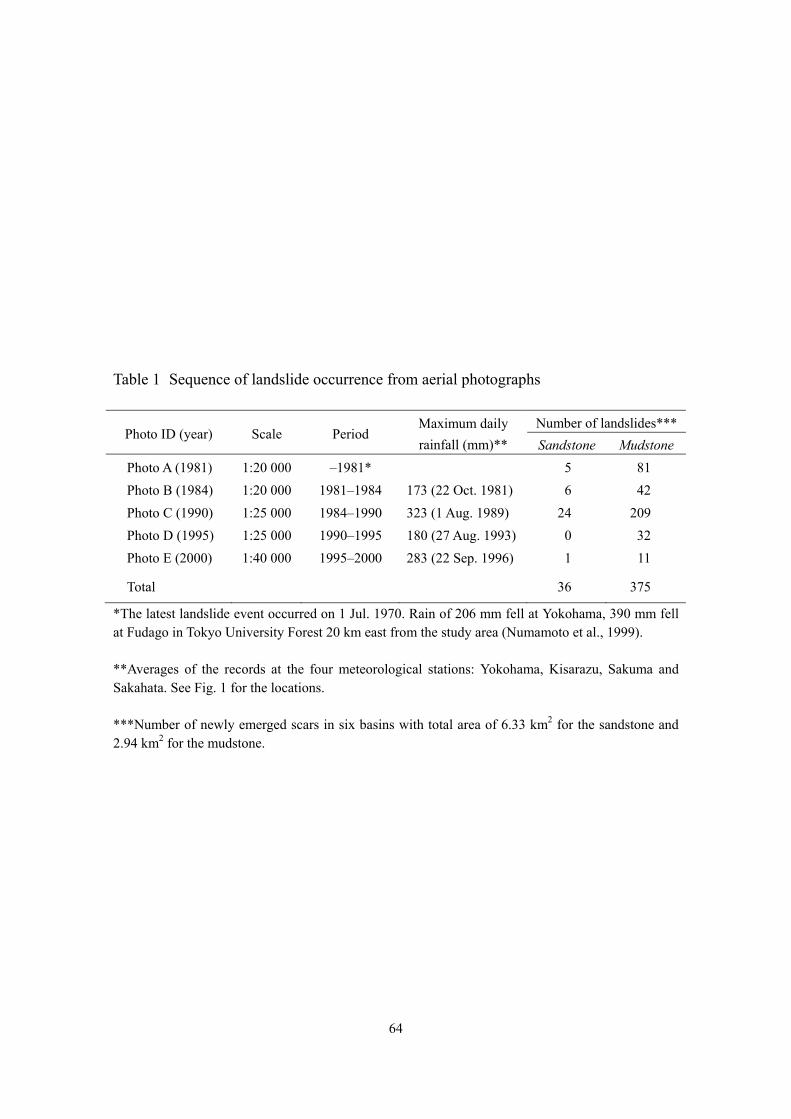
64
Table 1 Sequence of landslide occurrence from aerial photographs
Photo ID (year) Scale Period Maximum daily rainfall (mm)**
Number of landslides***Sandstone Mudstone
Photo A (1981) 1:20 000 –1981* 5 81 Photo B (1984) 1:20 000 1981–1984 173 (22 Oct. 1981) 6 42 Photo C (1990) 1:25 000 1984–1990 323 (1 Aug. 1989) 24 209 Photo D (1995) 1:25 000 1990–1995 180 (27 Aug. 1993) 0 32 Photo E (2000) 1:40 000 1995–2000 283 (22 Sep. 1996) 1 11
Total 36 375
*The latest landslide event occurred on 1 Jul. 1970. Rain of 206 mm fell at Yokohama, 390 mm fell at Fudago in Tokyo University Forest 20 km east from the study area (Numamoto et al., 1999).
**Averages of the records at the four meteorological stations: Yokohama, Kisarazu, Sakuma and Sakahata. See Fig. 1 for the locations.
***Number of newly emerged scars in six basins with total area of 6.33 km2 for the sandstone and 2.94 km2 for the mudstone.
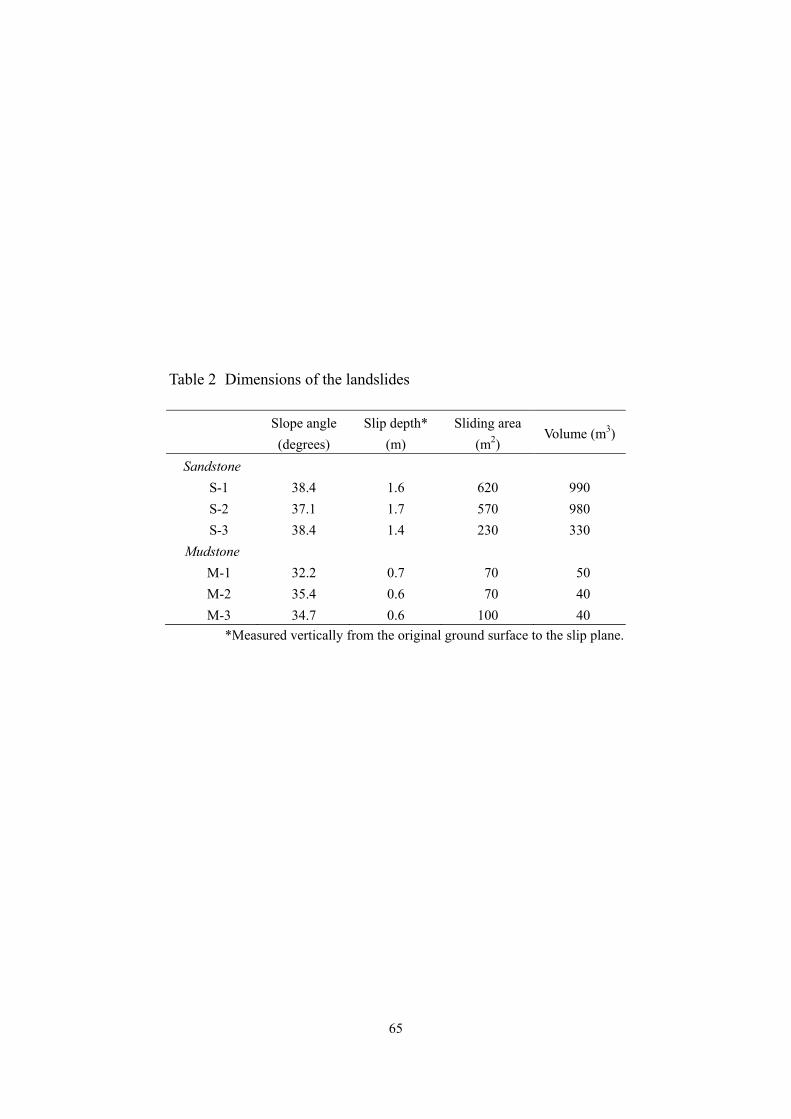
65
Table 2 Dimensions of the landslides
Slope angle (degrees)
Slip depth* (m)
Sliding area (m2)
Volume (m3)
Sandstone S-1 38.4 1.6 620 990 S-2 37.1 1.7 570 980 S-3 38.4 1.4 230 330
Mudstone M-1 32.2 0.7 70 50 M-2 35.4 0.6 70 40 M-3 34.7 0.6 100 40
*Measured vertically from the original ground surface to the slip plane.
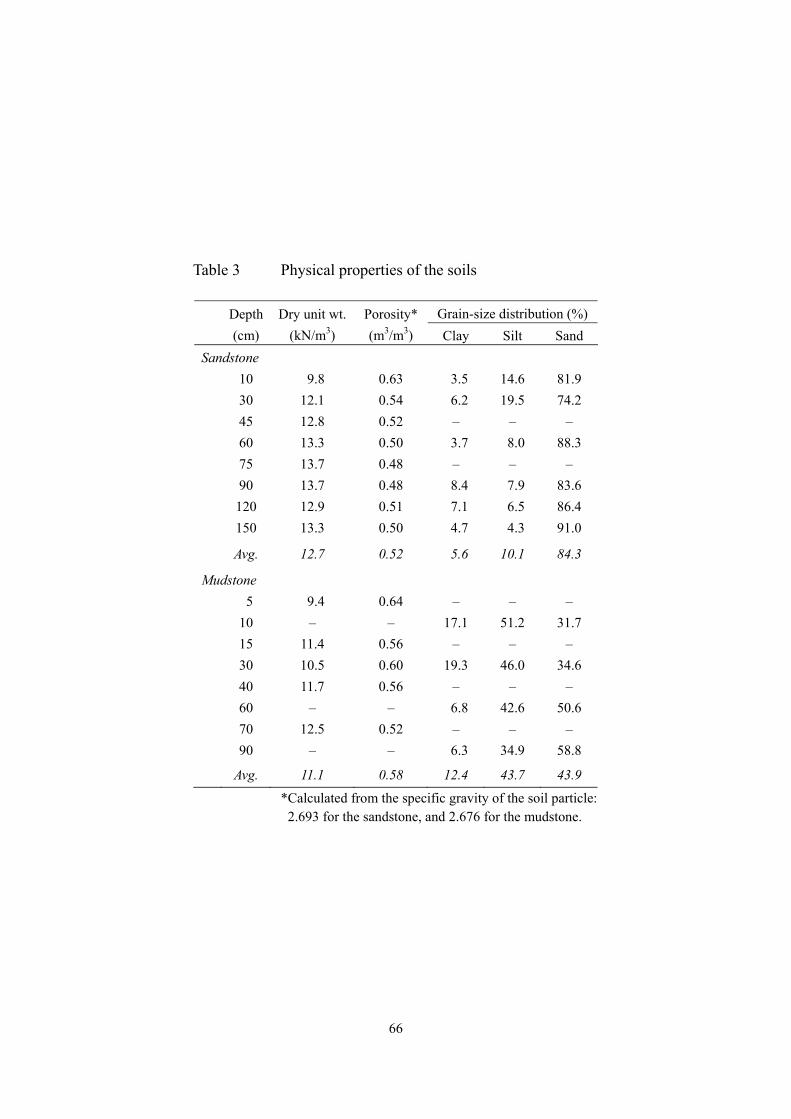
66
Table 3 Physical properties of the soils
Depth (cm)
Dry unit wt. (kN/m3)
Porosity* (m3/m3)
Grain-size distribution (%) Clay Silt Sand
Sandstone 10 9.8 0.63 3.5 14.6 81.9 30 12.1 0.54 6.2 19.5 74.2 45 12.8 0.52 – – – 60 13.3 0.50 3.7 8.0 88.3 75 13.7 0.48 – – – 90 13.7 0.48 8.4 7.9 83.6 120 12.9 0.51 7.1 6.5 86.4 150 13.3 0.50 4.7 4.3 91.0
Avg. 12.7 0.52 5.6 10.1 84.3
Mudstone 5 9.4 0.64 – – – 10 – – 17.1 51.2 31.7 15 11.4 0.56 – – – 30 10.5 0.60 19.3 46.0 34.6 40 11.7 0.56 – – – 60 – – 6.8 42.6 50.6 70 12.5 0.52 – – – 90 – – 6.3 34.9 58.8
Avg. 11.1 0.58 12.4 43.7 43.9
*Calculated from the specific gravity of the soil particle: 2.693 for the sandstone, and 2.676 for the mudstone.
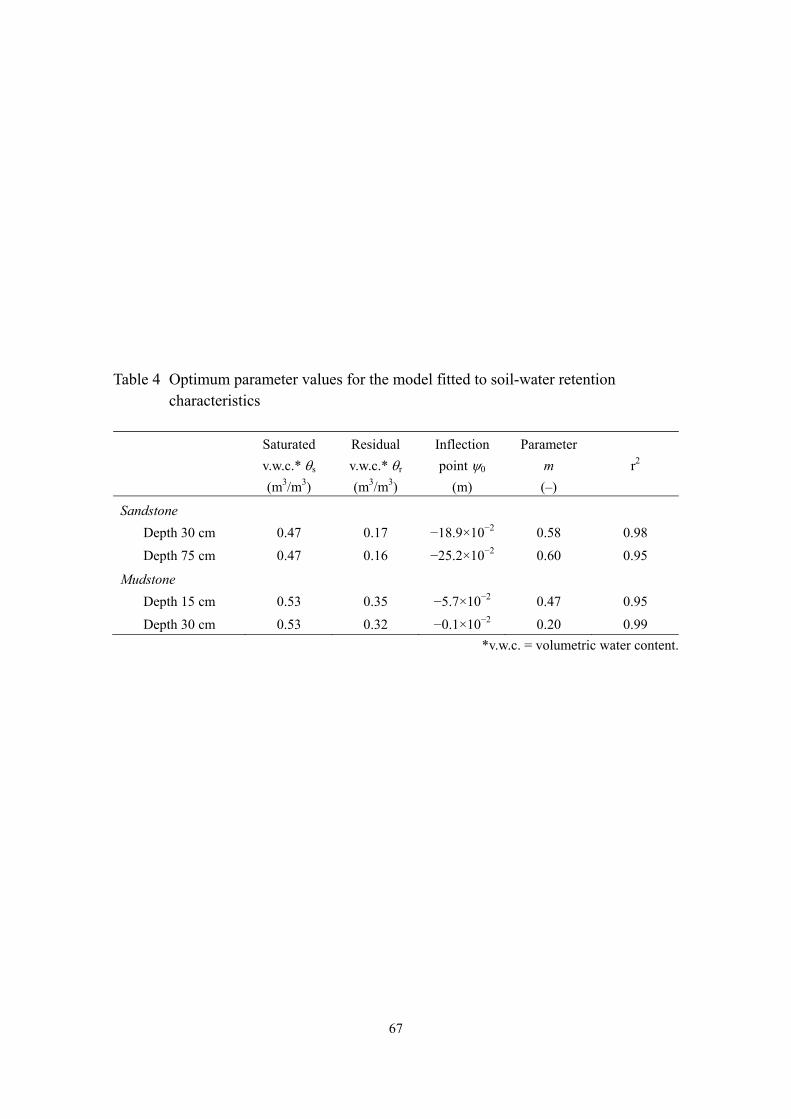
67
Table 4 Optimum parameter values for the model fitted to soil-water retention characteristics
Saturated v.w.c.* θs (m3/m3)
Residual v.w.c.* θr (m3/m3)
Inflection point ψ0
(m)
Parameter m (–)
r2
Sandstone
Depth 30 cm 0.47 0.17 −18.9×10⁻² 0.58 0.98
Depth 75 cm 0.47 0.16 −25.2×10⁻² 0.60 0.95
Mudstone
Depth 15 cm 0.53 0.35 −5.7×10⁻² 0.47 0.95
Depth 30 cm 0.53 0.32 −0.1×10⁻² 0.20 0.99 *v.w.c. = volumetric water content.
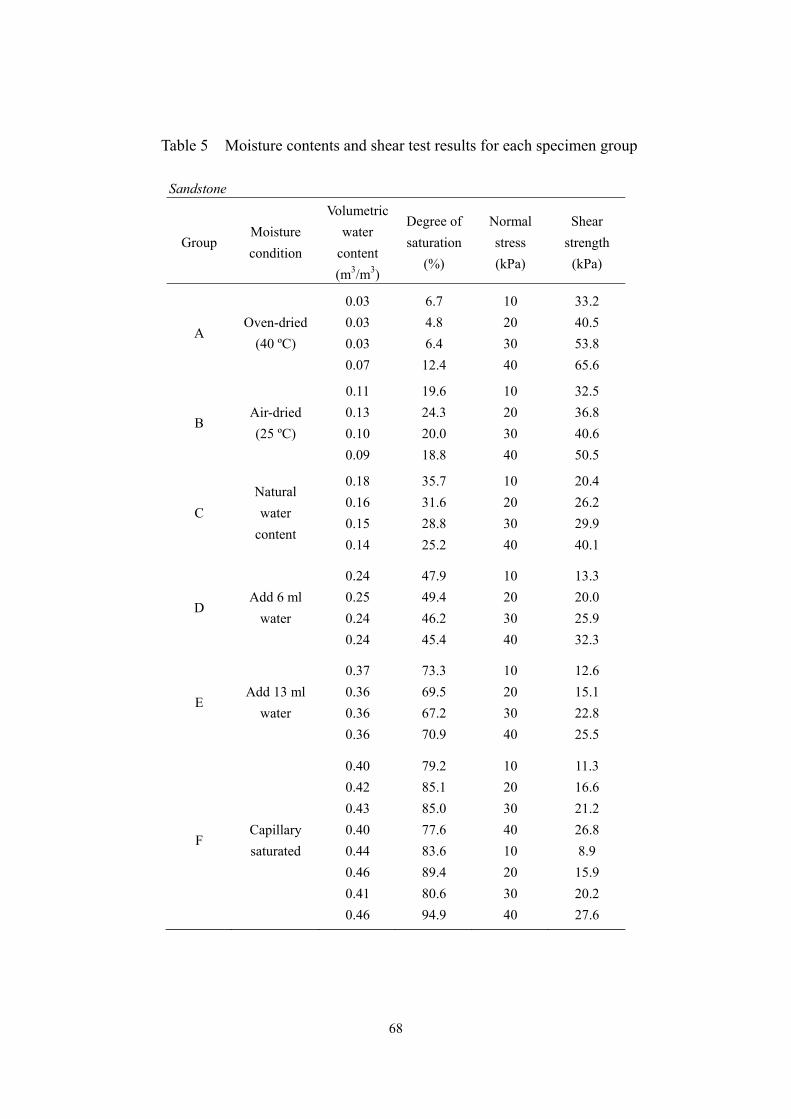
68
Table 5 Moisture contents and shear test results for each specimen group Sandstone
Group Moisture condition
Volumetric water
content (m3/m3)
Degree of saturation
(%)
Normal stress (kPa)
Shear strength
(kPa)
A Oven-dried
(40 ºC)
0.03 0.03 0.03 0.07
6.7 4.8 6.4
12.4
10 20 30 40
33.2 40.5 53.8 65.6
B Air-dried (25 ºC)
0.11 0.13 0.10 0.09
19.6 24.3 20.0 18.8
10 20 30 40
32.5 36.8 40.6 50.5
C Natural water
content
0.18 0.16 0.15 0.14
35.7 31.6 28.8 25.2
10 20 30 40
20.4 26.2 29.9 40.1
D Add 6 ml
water
0.24 0.25 0.24 0.24
47.9 49.4 46.2 45.4
10 20 30 40
13.3 20.0 25.9 32.3
E Add 13 ml
water
0.37 0.36 0.36 0.36
73.3 69.5 67.2 70.9
10 20 30 40
12.6 15.1 22.8 25.5
F Capillary saturated
0.40 0.42 0.43 0.40 0.44 0.46 0.41 0.46
79.2 85.1 85.0 77.6 83.6 89.4 80.6 94.9
10 20 30 40 10 20 30 40
11.3 16.6 21.2 26.8 8.9 15.9 20.2 27.6
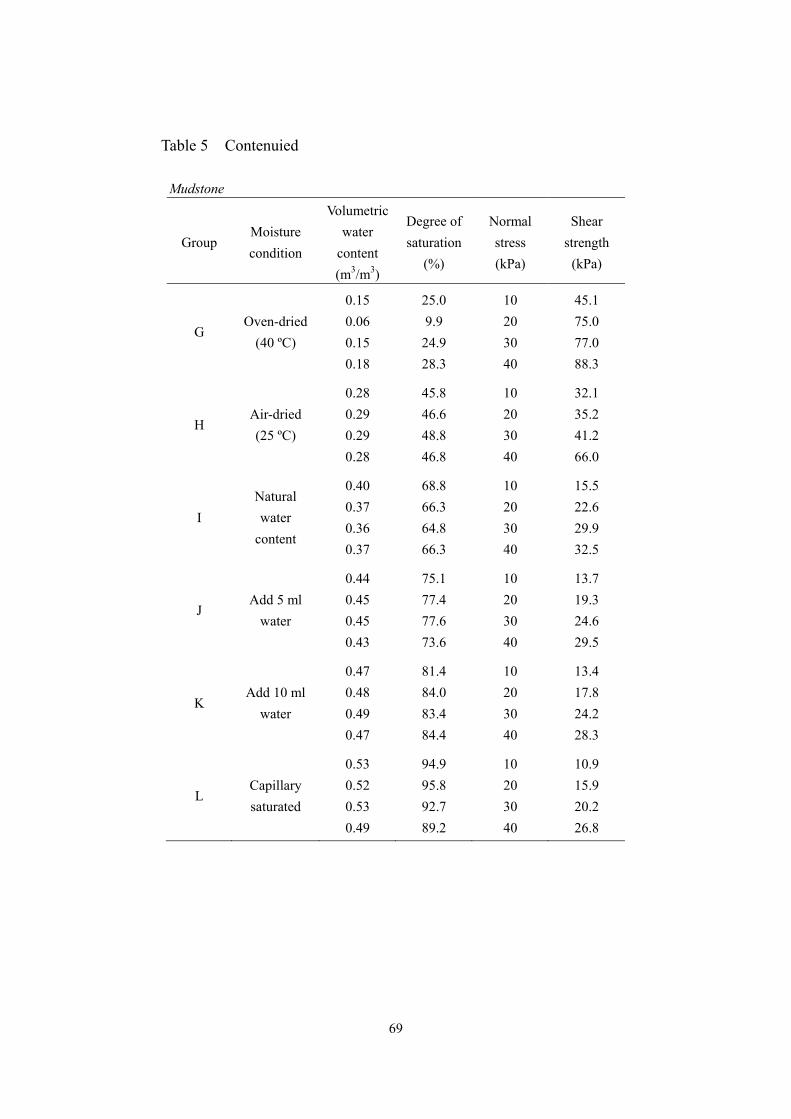
69
Table 5 Contenuied Mudstone
Group Moisture condition
Volumetric water
content (m3/m3)
Degree of saturation
(%)
Normal stress (kPa)
Shear strength
(kPa)
G Oven-dried
(40 ºC)
0.15 0.06 0.15 0.18
25.0 9.9
24.9 28.3
10 20 30 40
45.1 75.0 77.0 88.3
H Air-dried (25 ºC)
0.28 0.29 0.29 0.28
45.8 46.6 48.8 46.8
10 20 30 40
32.1 35.2 41.2 66.0
I Natural water
content
0.40 0.37 0.36 0.37
68.8 66.3 64.8 66.3
10 20 30 40
15.5 22.6 29.9 32.5
J Add 5 ml
water
0.44 0.45 0.45 0.43
75.1 77.4 77.6 73.6
10 20 30 40
13.7 19.3 24.6 29.5
K Add 10 ml
water
0.47 0.48 0.49 0.47
81.4 84.0 83.4 84.4
10 20 30 40
13.4 17.8 24.2 28.3
L Capillary saturated
0.53 0.52 0.53 0.49
94.9 95.8 92.7 89.2
10 20 30 40
10.9 15.9 20.2 26.8
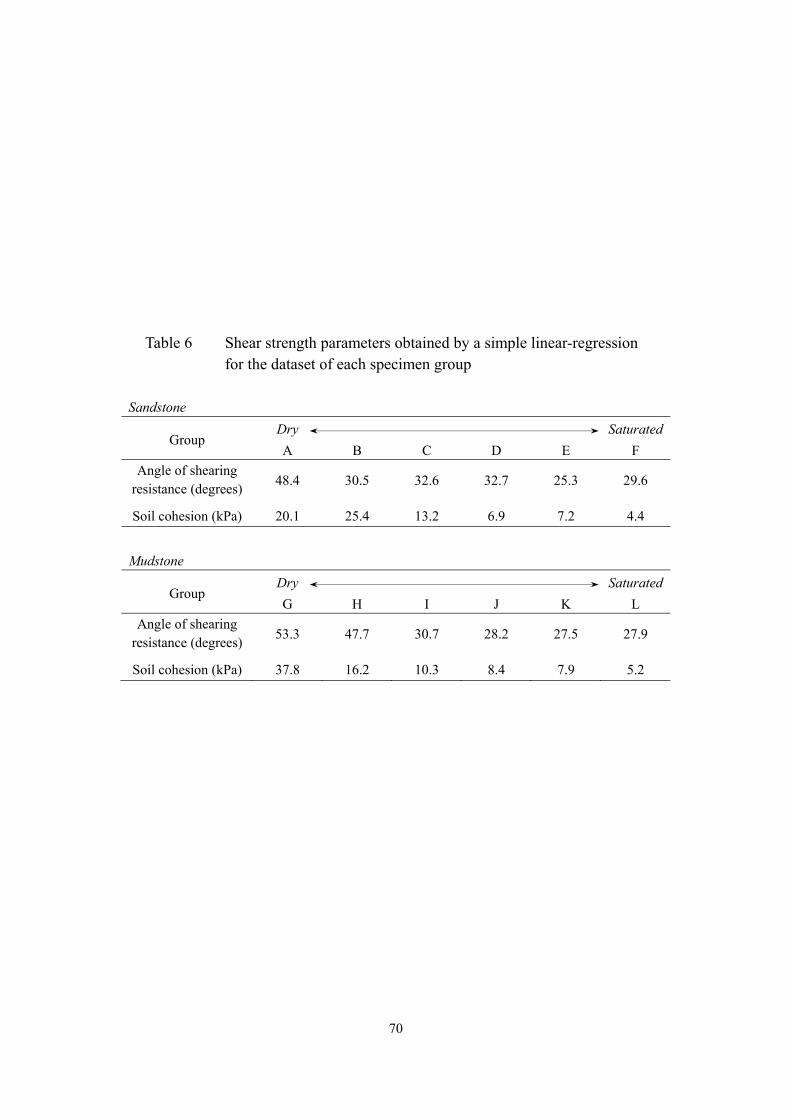
70
Table 6 Shear strength parameters obtained by a simple linear-regression for the dataset of each specimen group
Sandstone
Group Dry SaturatedA B C D E F
Angle of shearing resistance (degrees) 48.4 30.5 32.6 32.7 25.3 29.6
Soil cohesion (kPa) 20.1 25.4 13.2 6.9 7.2 4.4
Mudstone
Group Dry SaturatedG H I J K L
Angle of shearing resistance (degrees) 53.3 47.7 30.7 28.2 27.5 27.9
Soil cohesion (kPa) 37.8 16.2 10.3 8.4 7.9 5.2
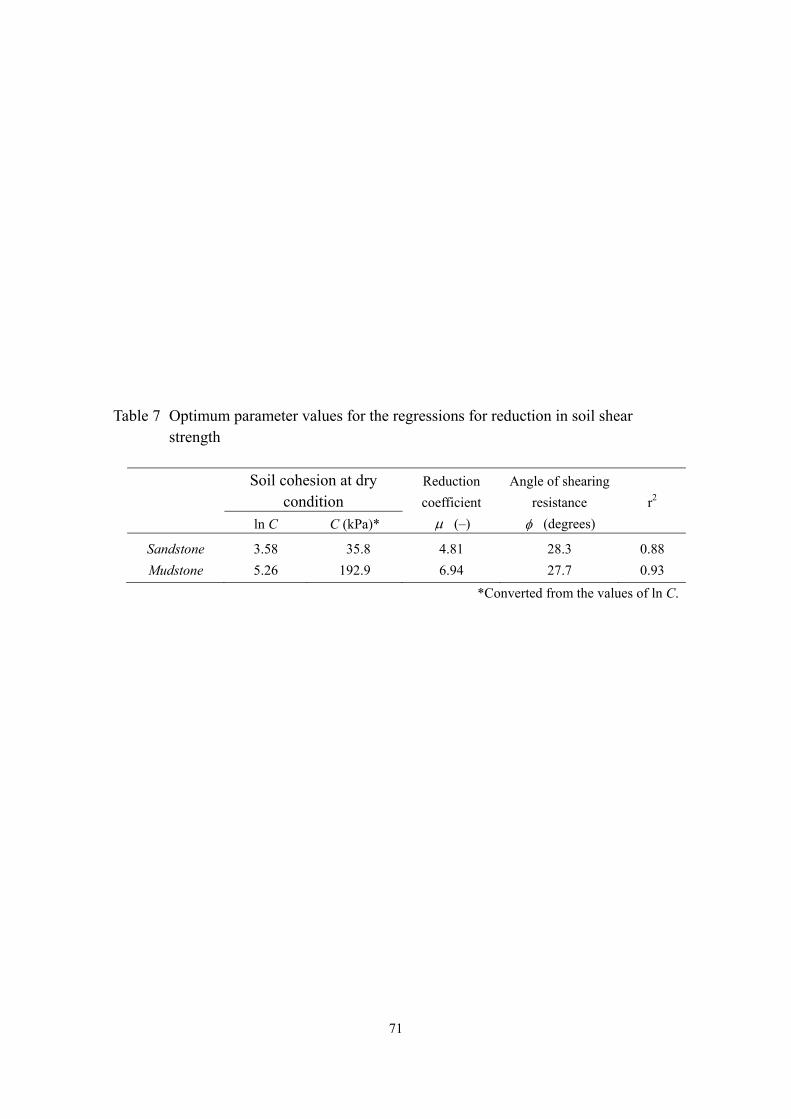
71
Table 7 Optimum parameter values for the regressions for reduction in soil shear strength
Soil cohesion at dry
condition Reduction coefficient
μ (–)
Angle of shearing resistance
φ (degrees) r2
ln C C (kPa)*
Sandstone Mudstone
3.58 5.26
35.8 192.9
4.81 6.94
28.3 27.7
0.88 0.93
*Converted from the values of ln C.

72
Table 8 Parameter values for envelopes of in situ soil-water retention plots
Saturated v.w.c.* θs (m3/m3)
Residual v.w.c.* θr (m3/m3)
Inflection point ψ0
(m)
Parameter m (–)
Sandstone 0.47 0.16 −10×10−2 0.56 Mudstone 0.53 0.20 −5×10⁻² 0.20
*v.w.c. = volumetric water content.
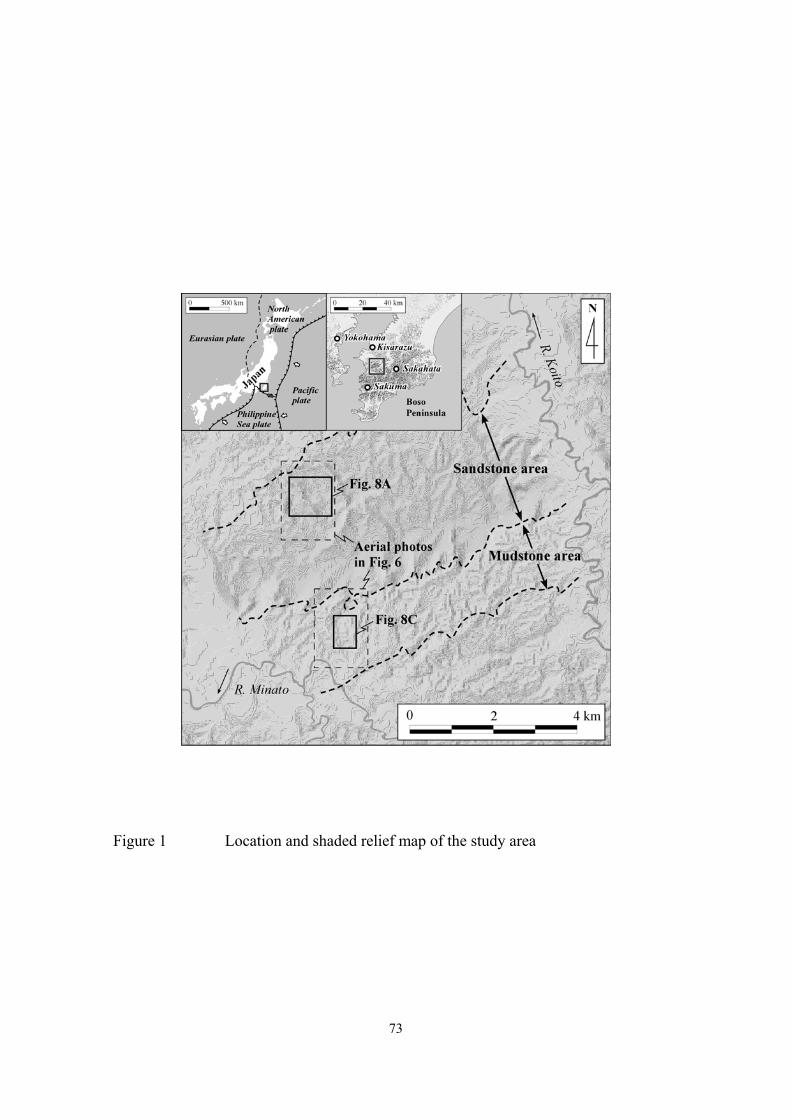
73
Figure 1 Location and shaded relief map of the study area
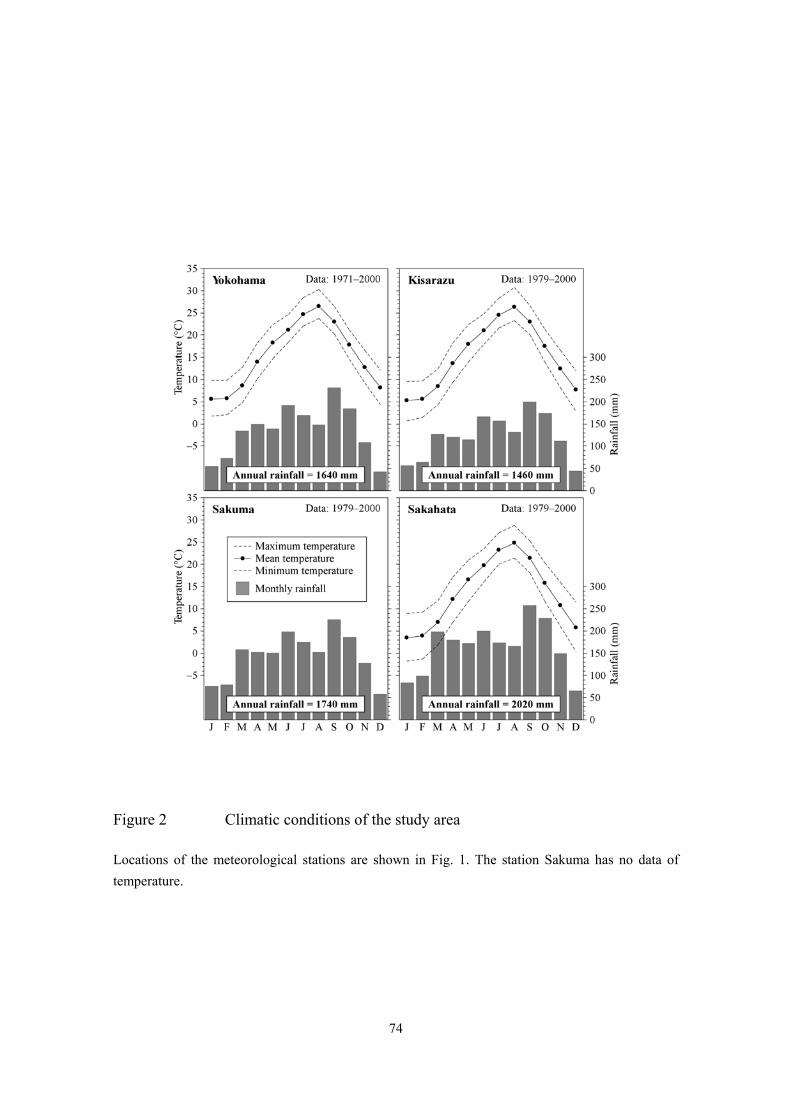
74
Figure 2 Climatic conditions of the study area
Locations of the meteorological stations are shown in Fig. 1. The station Sakuma has no data of temperature.
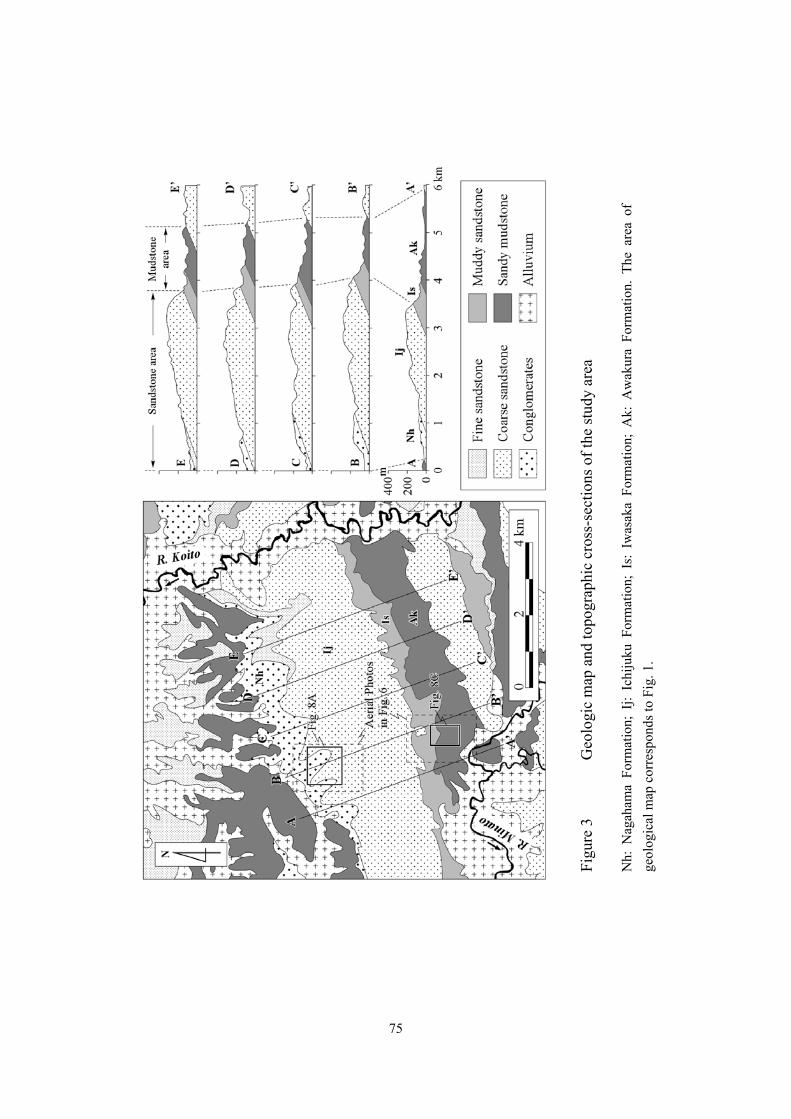
75
Figu
re 3
G
eolo
gic
map
and
topo
grap
hic
cros
s-se
ctio
ns o
f the
stud
y ar
ea
Nh:
Nag
aham
a Fo
rmat
ion;
Ij:
Ichi
juku
For
mat
ion;
Is:
Iw
asak
a Fo
rmat
ion;
Ak:
Aw
akur
a Fo
rmat
ion.
The
are
a of
ge
olog
ical
map
cor
resp
onds
to F
ig. 1
.
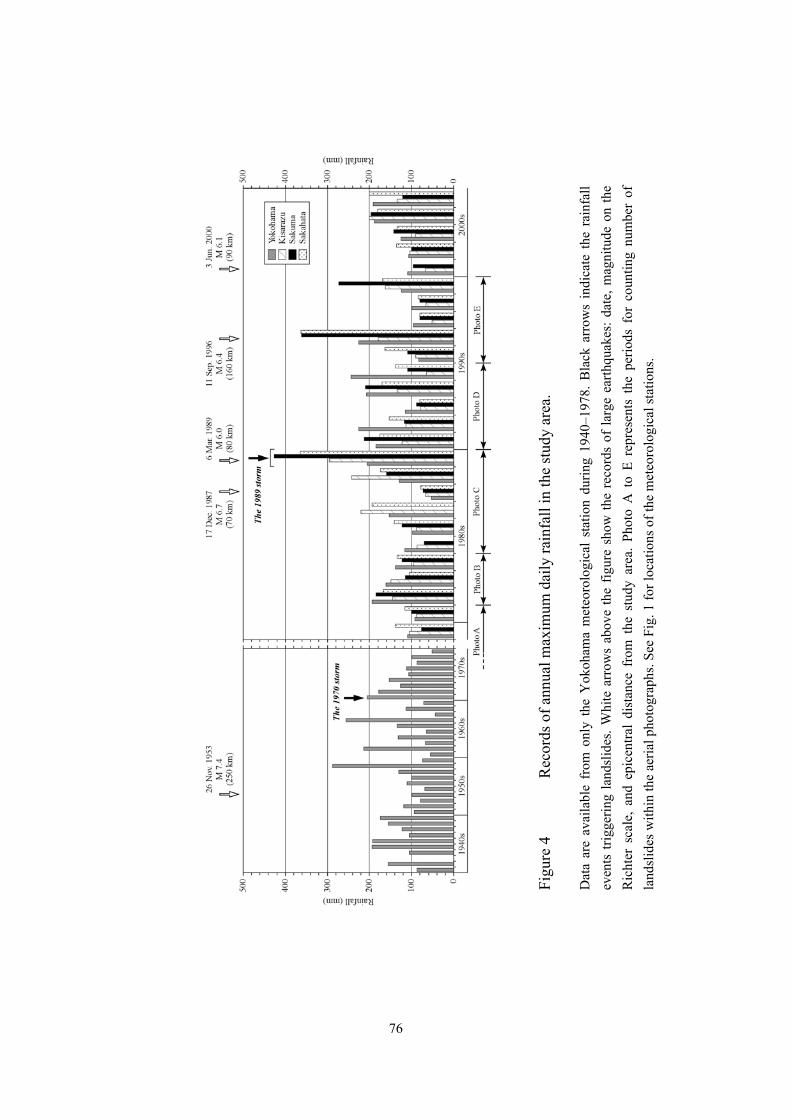
76
Figu
re 4
R
ecor
ds o
f ann
ual m
axim
um d
aily
rain
fall
in th
e st
udy
area
.
Dat
a ar
e av
aila
ble
from
onl
y th
e Y
okoh
ama
met
eoro
logi
cal
statio
n du
ring
1940
–197
8. B
lack
arr
ows
indi
cate
the
rai
nfal
l ev
ents
trig
gerin
g la
ndsl
ides
. Whi
te a
rrow
s ab
ove
the
figur
e sh
ow th
e re
cord
s of
larg
e ea
rthqu
akes
: dat
e, m
agni
tude
on
the
Ric
hter
sca
le,
and
epic
entra
l di
stan
ce f
rom
the
stu
dy a
rea.
Pho
to A
to
E re
pres
ents
the
per
iods
for
cou
ntin
g nu
mbe
r of
la
ndsl
ides
with
in th
e ae
rial p
hoto
grap
hs. S
ee F
ig. 1
for l
ocat
ions
of t
he m
eteo
rolo
gica
l sta
tions
.
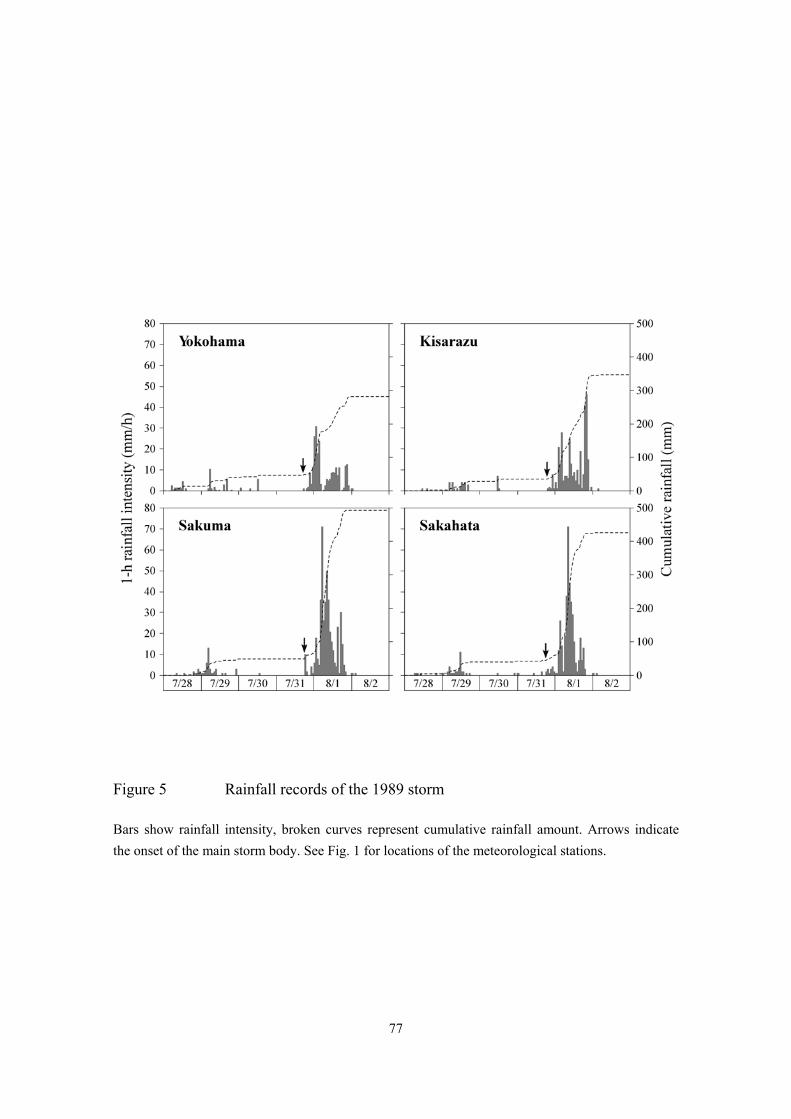
77
Figure 5 Rainfall records of the 1989 storm
Bars show rainfall intensity, broken curves represent cumulative rainfall amount. Arrows indicate the onset of the main storm body. See Fig. 1 for locations of the meteorological stations.
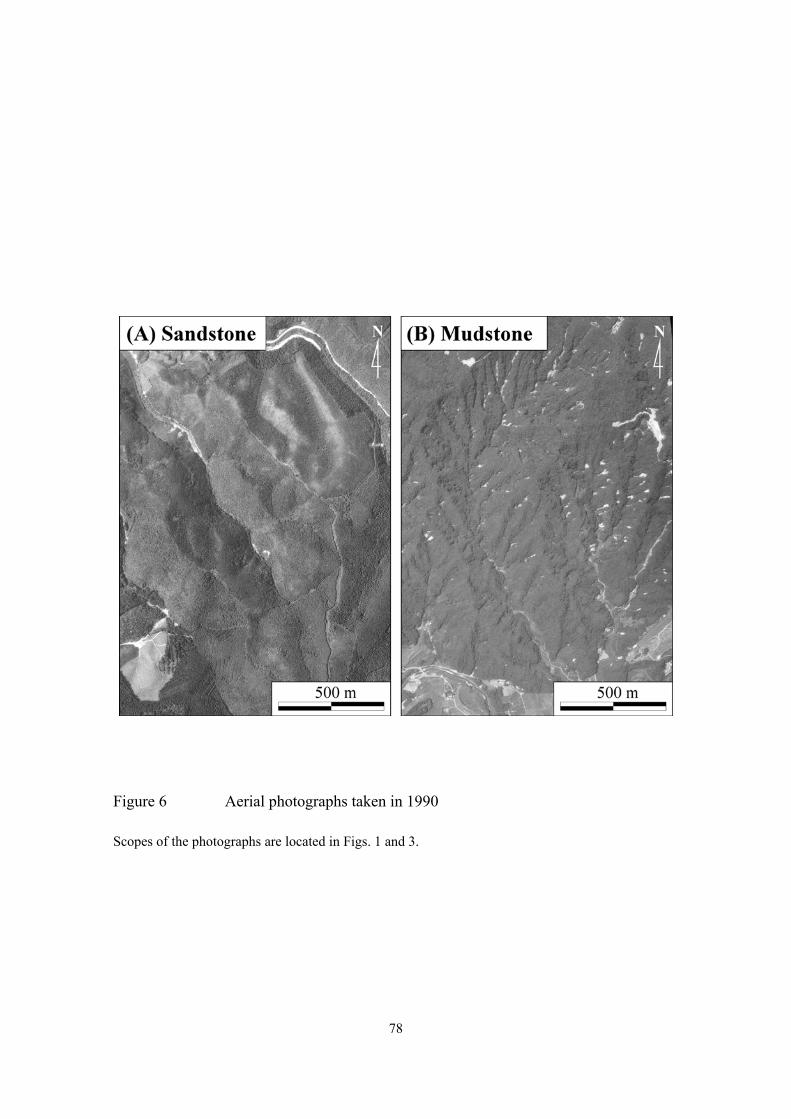
78
Figure 6 Aerial photographs taken in 1990
Scopes of the photographs are located in Figs. 1 and 3.
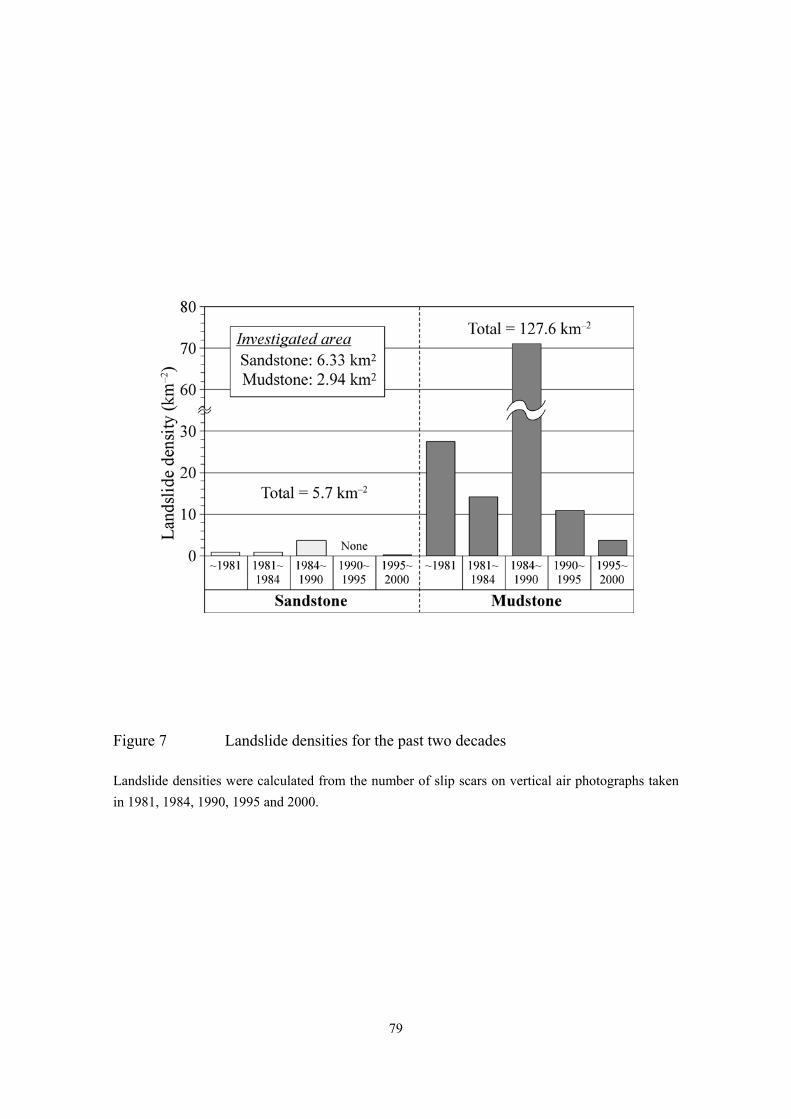
79
Figure 7 Landslide densities for the past two decades
Landslide densities were calculated from the number of slip scars on vertical air photographs taken in 1981, 1984, 1990, 1995 and 2000.
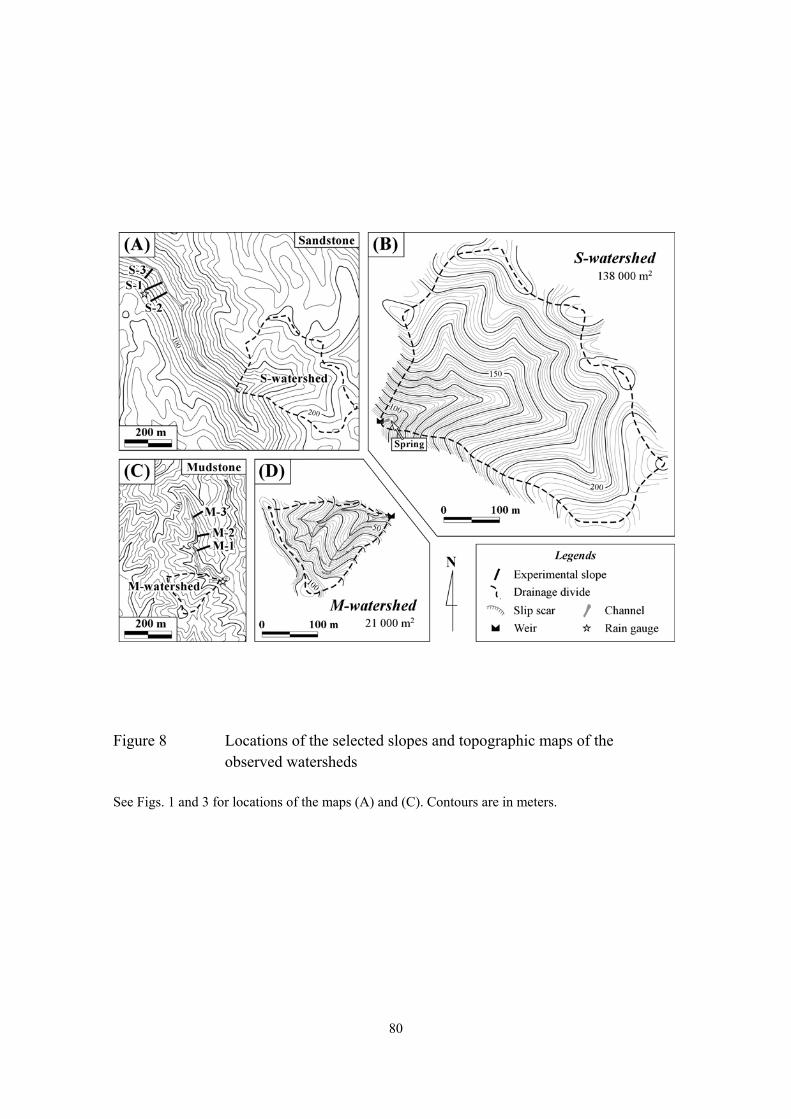
80
Figure 8 Locations of the selected slopes and topographic maps of the observed watersheds
See Figs. 1 and 3 for locations of the maps (A) and (C). Contours are in meters.
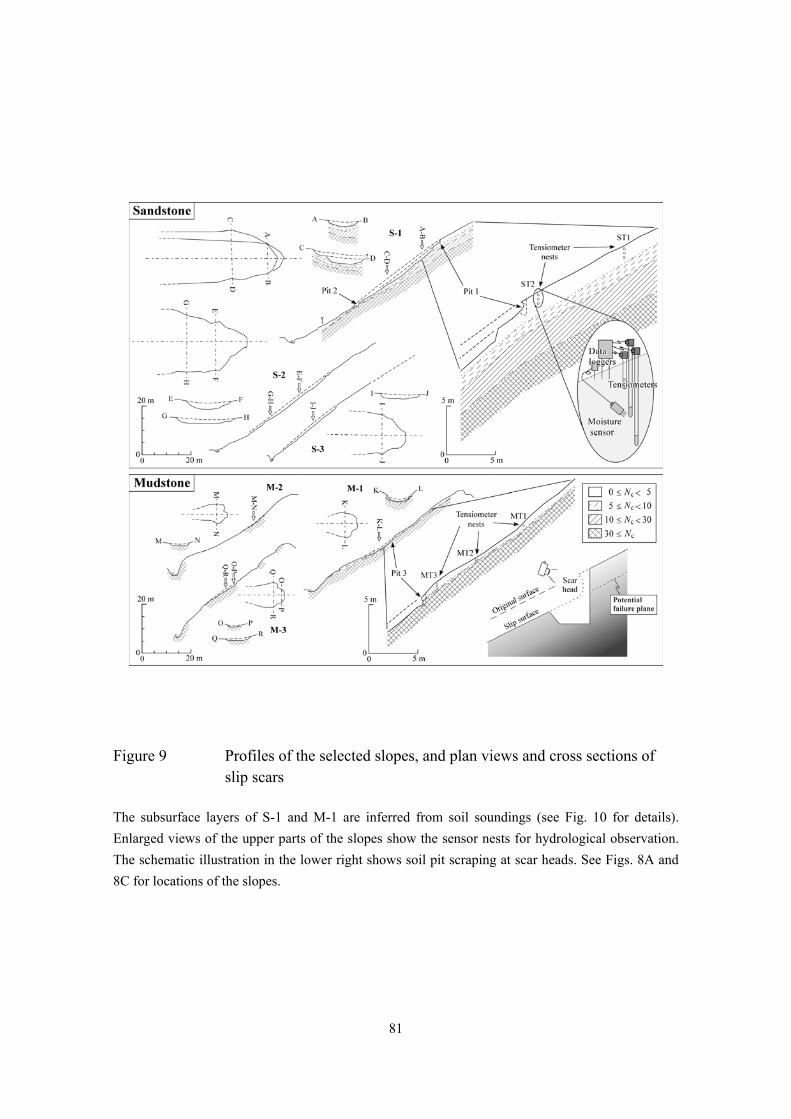
81
Figure 9 Profiles of the selected slopes, and plan views and cross sections of slip scars
The subsurface layers of S-1 and M-1 are inferred from soil soundings (see Fig. 10 for details). Enlarged views of the upper parts of the slopes show the sensor nests for hydrological observation. The schematic illustration in the lower right shows soil pit scraping at scar heads. See Figs. 8A and 8C for locations of the slopes.
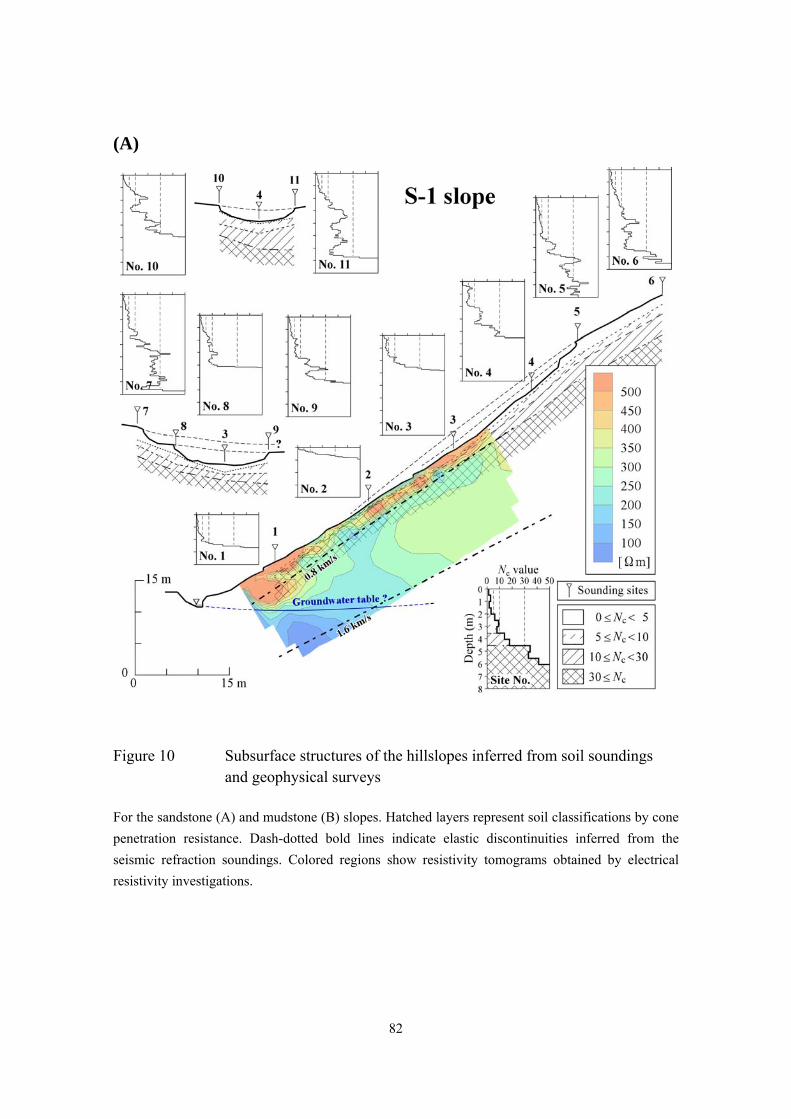
82
(A)
Figure 10 Subsurface structures of the hillslopes inferred from soil soundings and geophysical surveys
For the sandstone (A) and mudstone (B) slopes. Hatched layers represent soil classifications by cone penetration resistance. Dash-dotted bold lines indicate elastic discontinuities inferred from the seismic refraction soundings. Colored regions show resistivity tomograms obtained by electrical resistivity investigations.
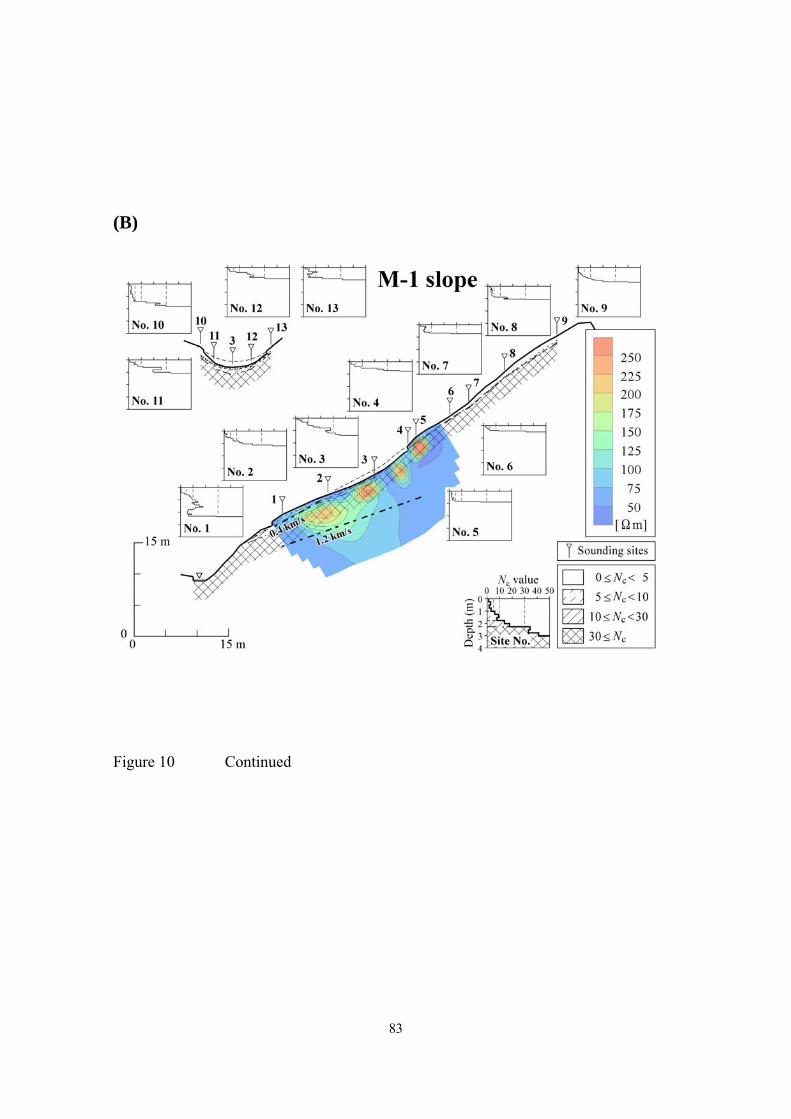
83
(B)
Figure 10 Continued
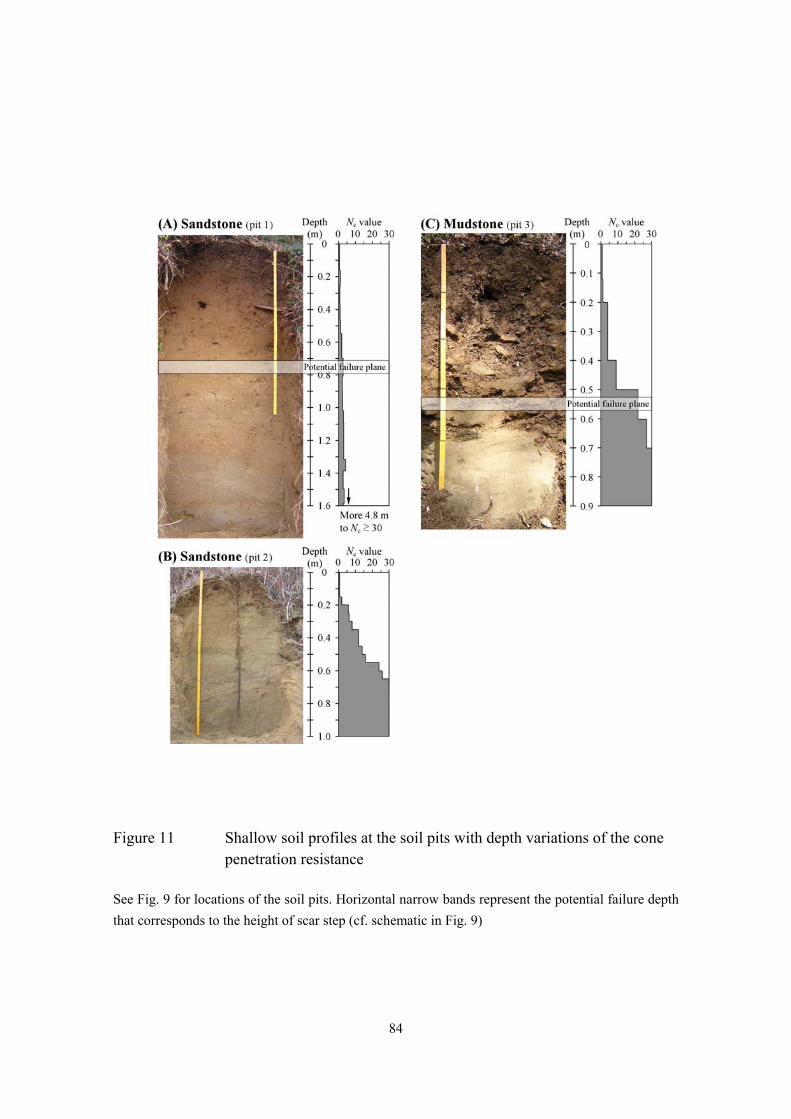
84
Figure 11 Shallow soil profiles at the soil pits with depth variations of the cone penetration resistance
See Fig. 9 for locations of the soil pits. Horizontal narrow bands represent the potential failure depth that corresponds to the height of scar step (cf. schematic in Fig. 9)
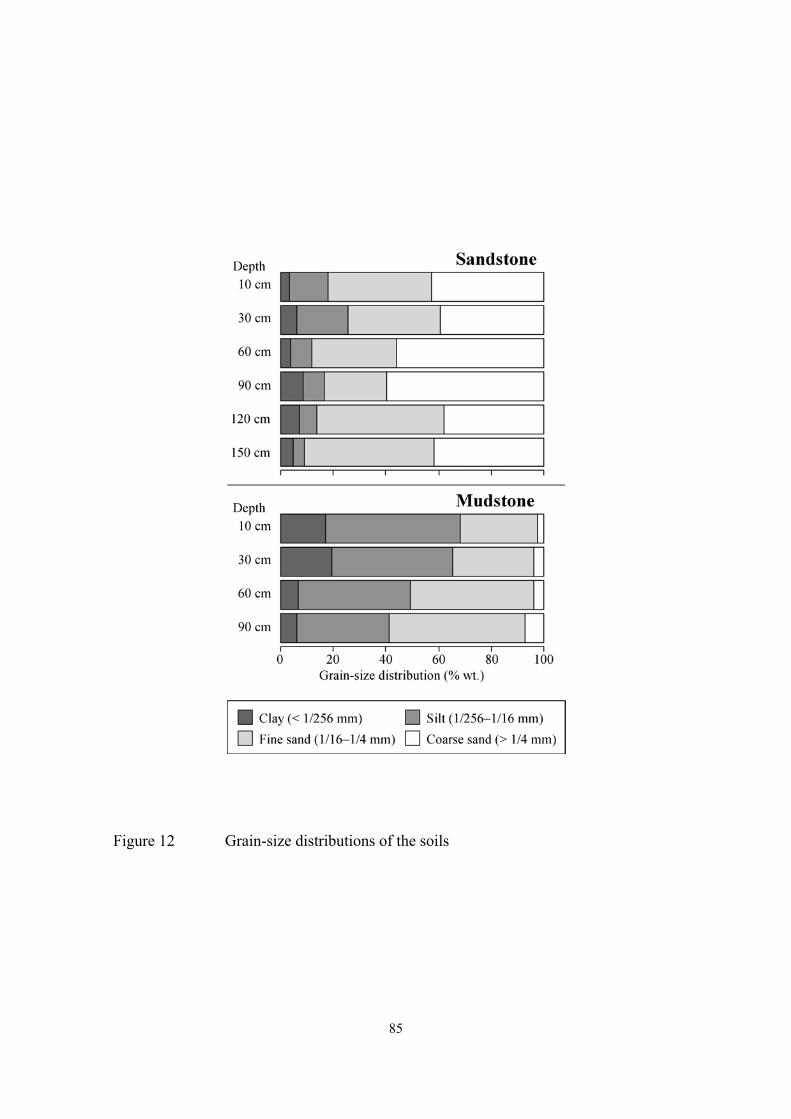
85
Figure 12 Grain-size distributions of the soils
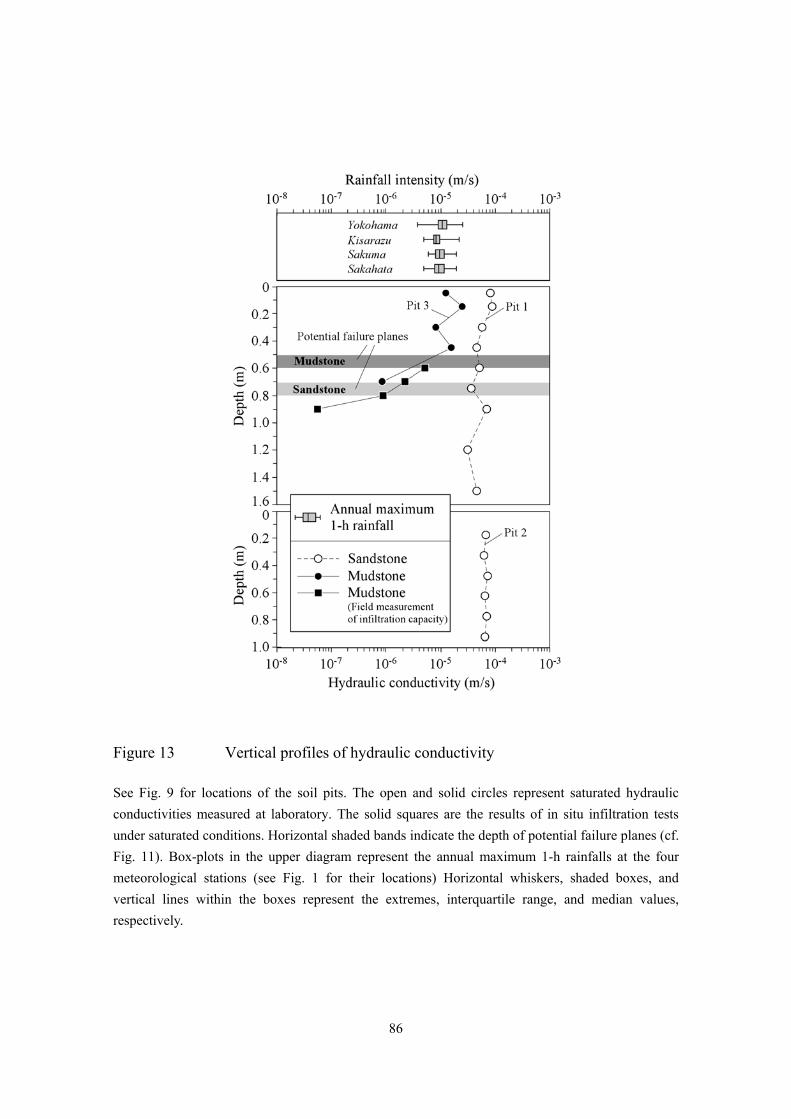
86
Figure 13 Vertical profiles of hydraulic conductivity
See Fig. 9 for locations of the soil pits. The open and solid circles represent saturated hydraulic conductivities measured at laboratory. The solid squares are the results of in situ infiltration tests under saturated conditions. Horizontal shaded bands indicate the depth of potential failure planes (cf. Fig. 11). Box-plots in the upper diagram represent the annual maximum 1-h rainfalls at the four meteorological stations (see Fig. 1 for their locations) Horizontal whiskers, shaded boxes, and vertical lines within the boxes represent the extremes, interquartile range, and median values, respectively.
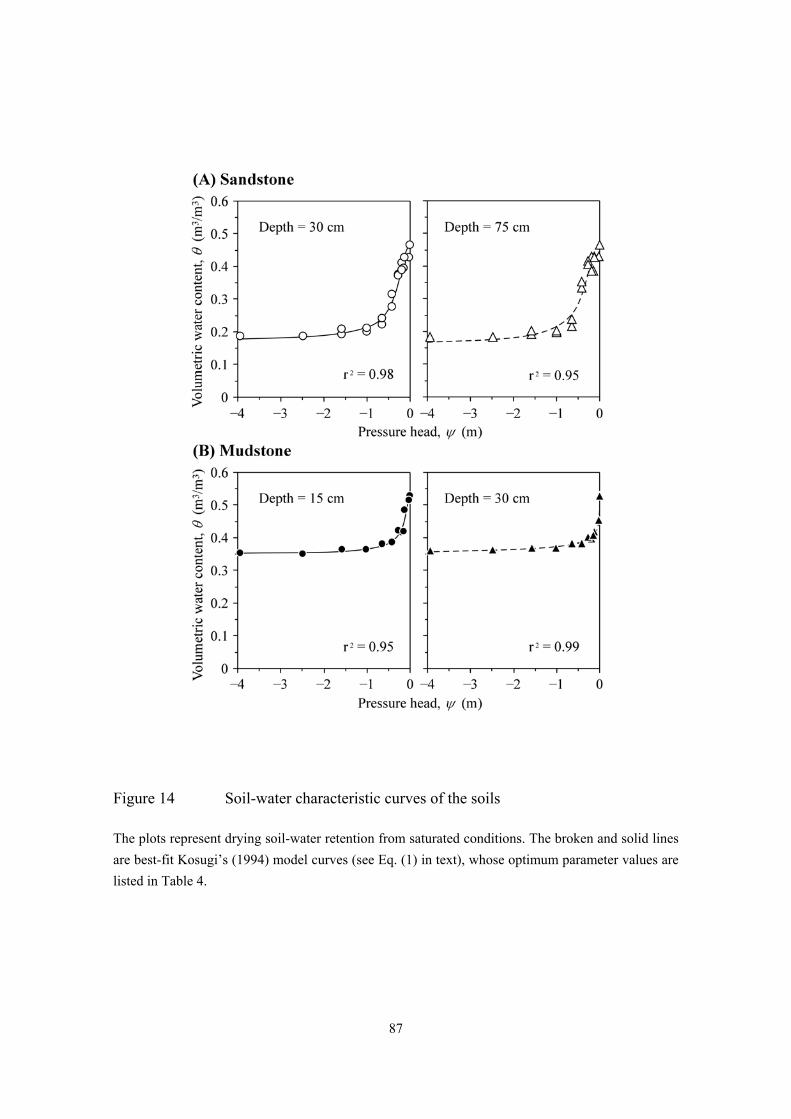
87
Figure 14 Soil-water characteristic curves of the soils
The plots represent drying soil-water retention from saturated conditions. The broken and solid lines are best-fit Kosugi’s (1994) model curves (see Eq. (1) in text), whose optimum parameter values are listed in Table 4.
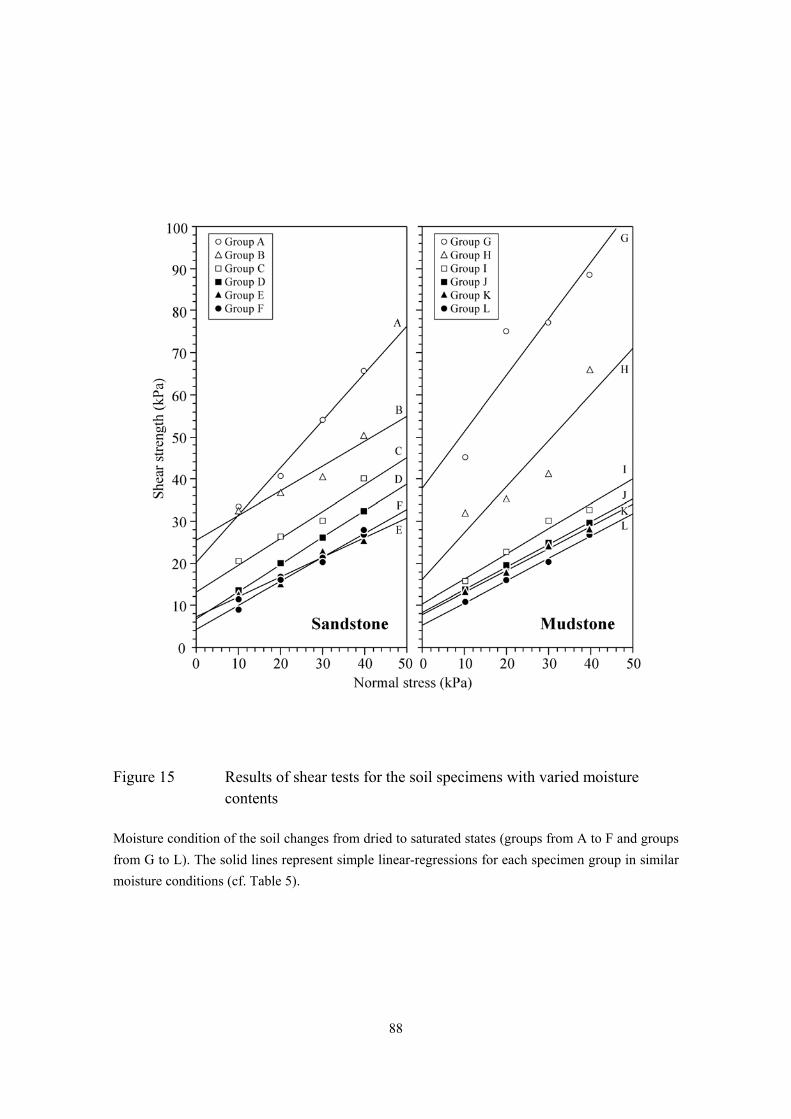
88
Figure 15 Results of shear tests for the soil specimens with varied moisture contents
Moisture condition of the soil changes from dried to saturated states (groups from A to F and groups from G to L). The solid lines represent simple linear-regressions for each specimen group in similar moisture conditions (cf. Table 5).
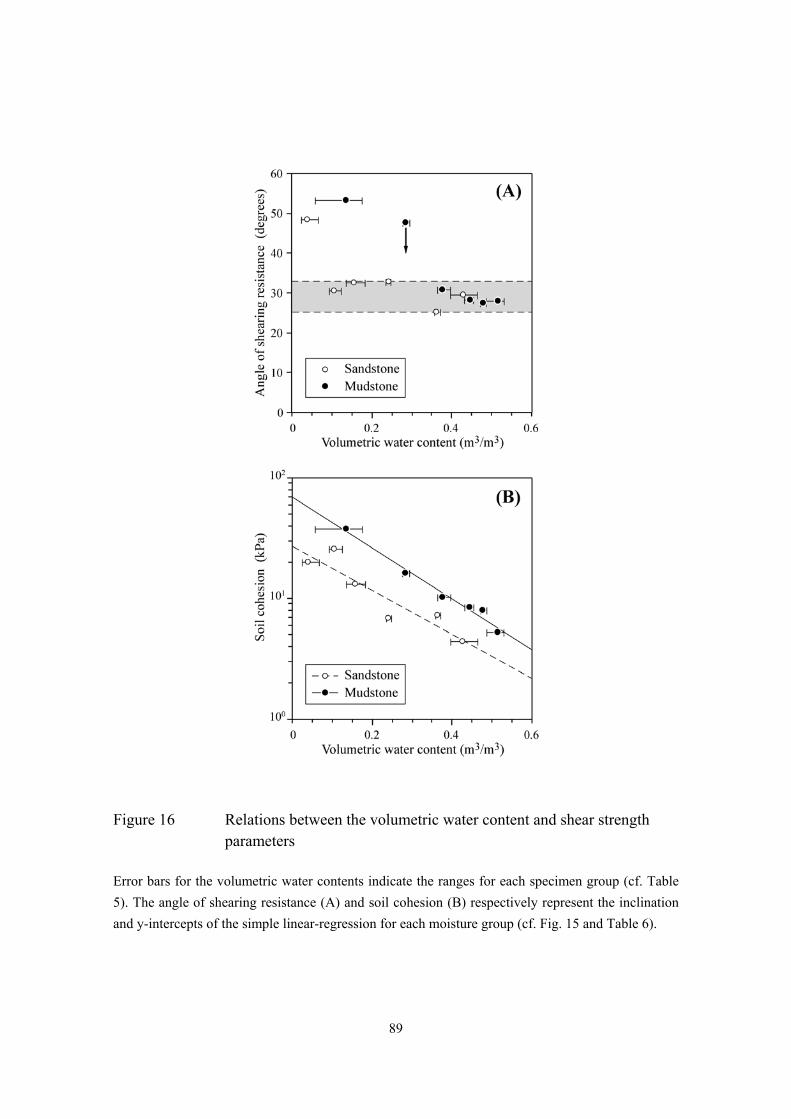
89
Figure 16 Relations between the volumetric water content and shear strength parameters
Error bars for the volumetric water contents indicate the ranges for each specimen group (cf. Table 5). The angle of shearing resistance (A) and soil cohesion (B) respectively represent the inclination and y-intercepts of the simple linear-regression for each moisture group (cf. Fig. 15 and Table 6).
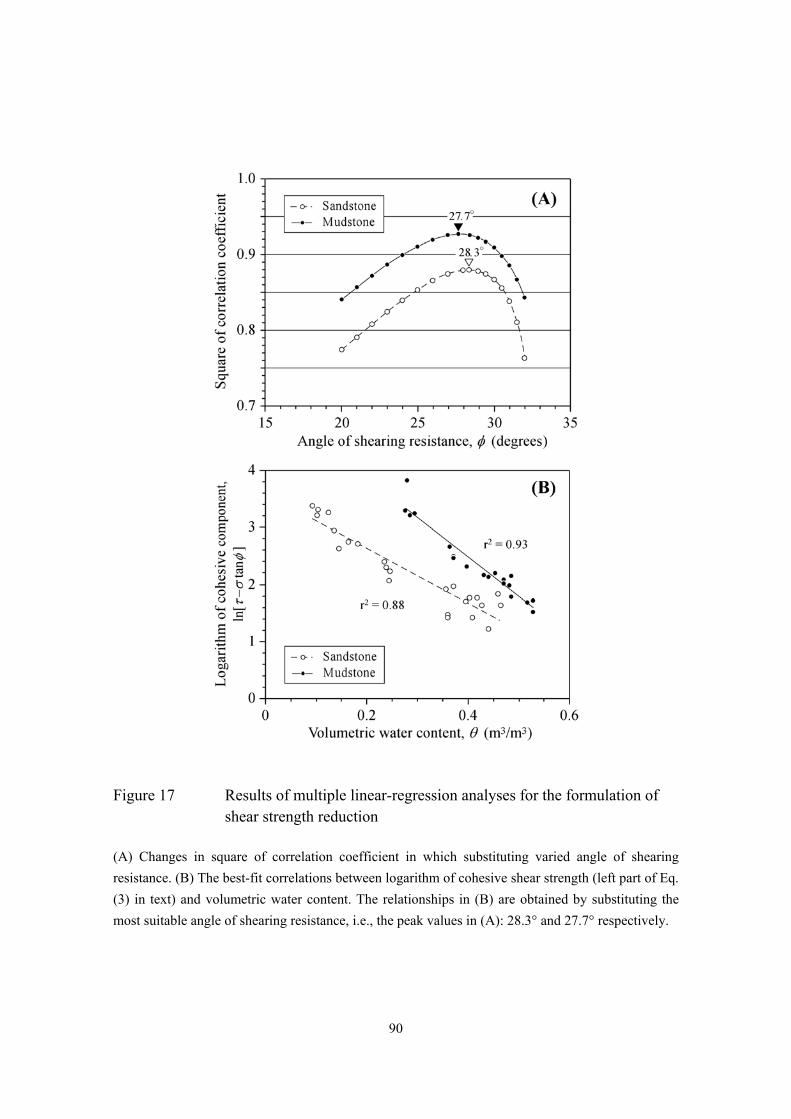
90
Figure 17 Results of multiple linear-regression analyses for the formulation of shear strength reduction
(A) Changes in square of correlation coefficient in which substituting varied angle of shearing resistance. (B) The best-fit correlations between logarithm of cohesive shear strength (left part of Eq. (3) in text) and volumetric water content. The relationships in (B) are obtained by substituting the most suitable angle of shearing resistance, i.e., the peak values in (A): 28.3° and 27.7° respectively.
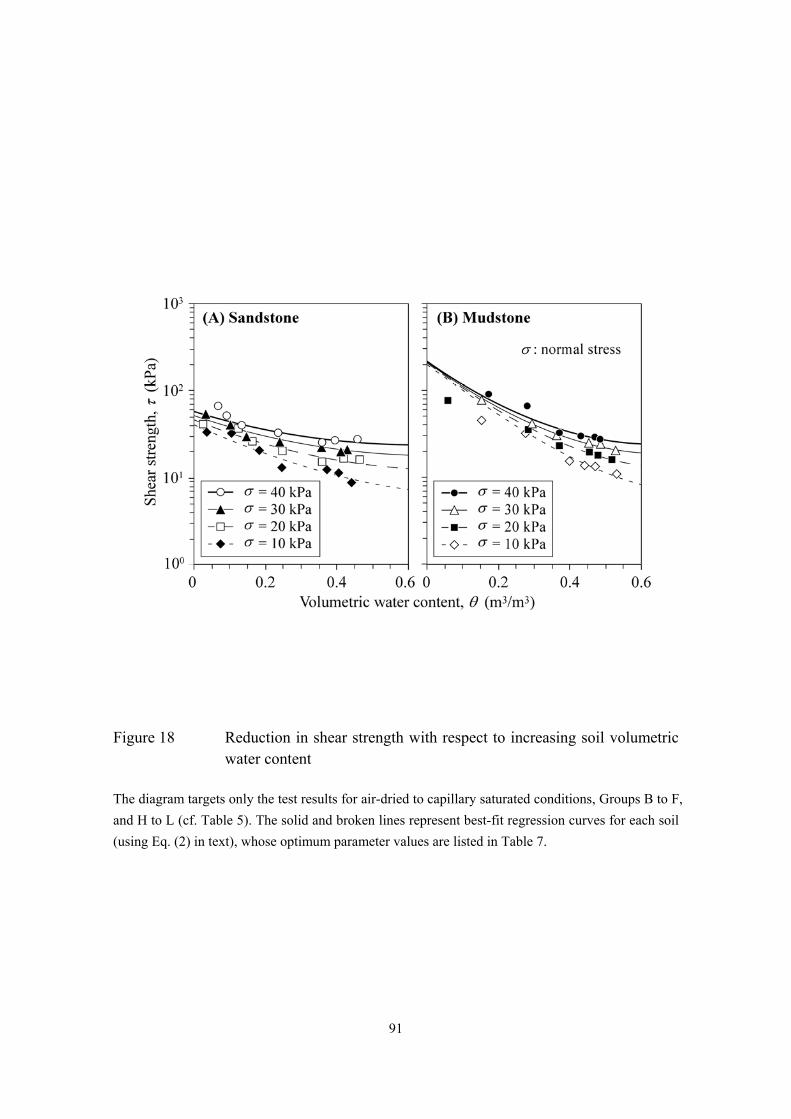
91
Figure 18 Reduction in shear strength with respect to increasing soil volumetric water content
The diagram targets only the test results for air-dried to capillary saturated conditions, Groups B to F, and H to L (cf. Table 5). The solid and broken lines represent best-fit regression curves for each soil (using Eq. (2) in text), whose optimum parameter values are listed in Table 7.
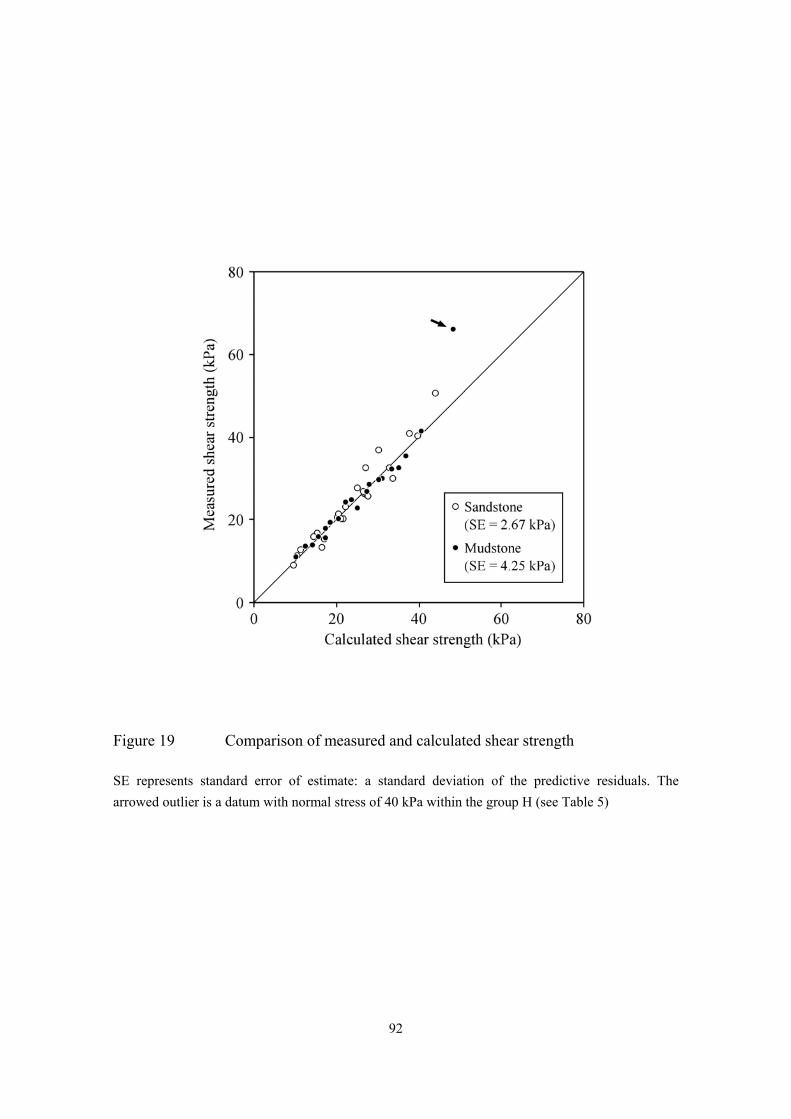
92
Figure 19 Comparison of measured and calculated shear strength
SE represents standard error of estimate: a standard deviation of the predictive residuals. The arrowed outlier is a datum with normal stress of 40 kPa within the group H (see Table 5)
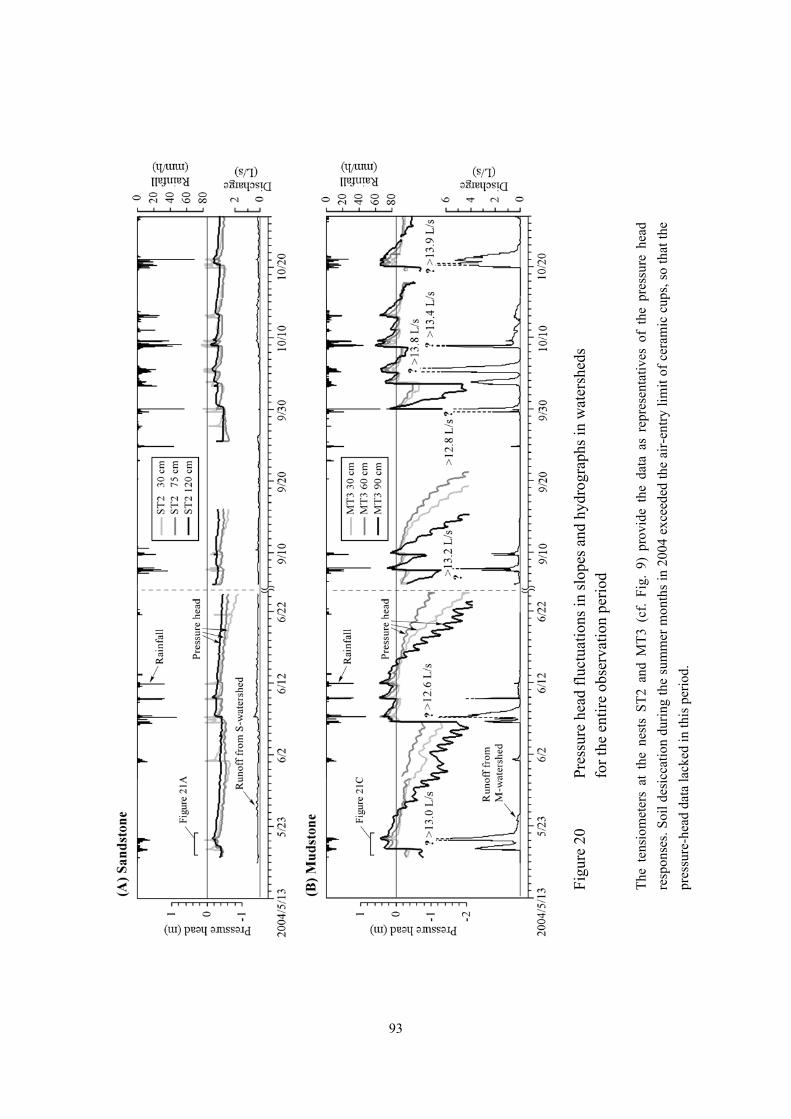
93
Figu
re 2
0 Pr
essu
re h
ead
fluct
uatio
ns in
slop
es a
nd h
ydro
grap
hs in
wat
ersh
eds
fo
r the
ent
ire o
bser
vatio
n pe
riod
The
tens
iom
eter
s at
the
nes
ts S
T2 a
nd M
T3 (
cf.
Fig.
9)
prov
ide
the
data
as
repr
esen
tativ
es o
f th
e pr
essu
re h
ead
resp
onse
s. So
il de
sicc
atio
n du
ring
the
sum
mer
mon
ths
in 2
004
exce
eded
the
air-
entry
lim
it of
cer
amic
cup
s, so
that
the
pres
sure
-hea
d da
ta la
cked
in th
is p
erio
d.
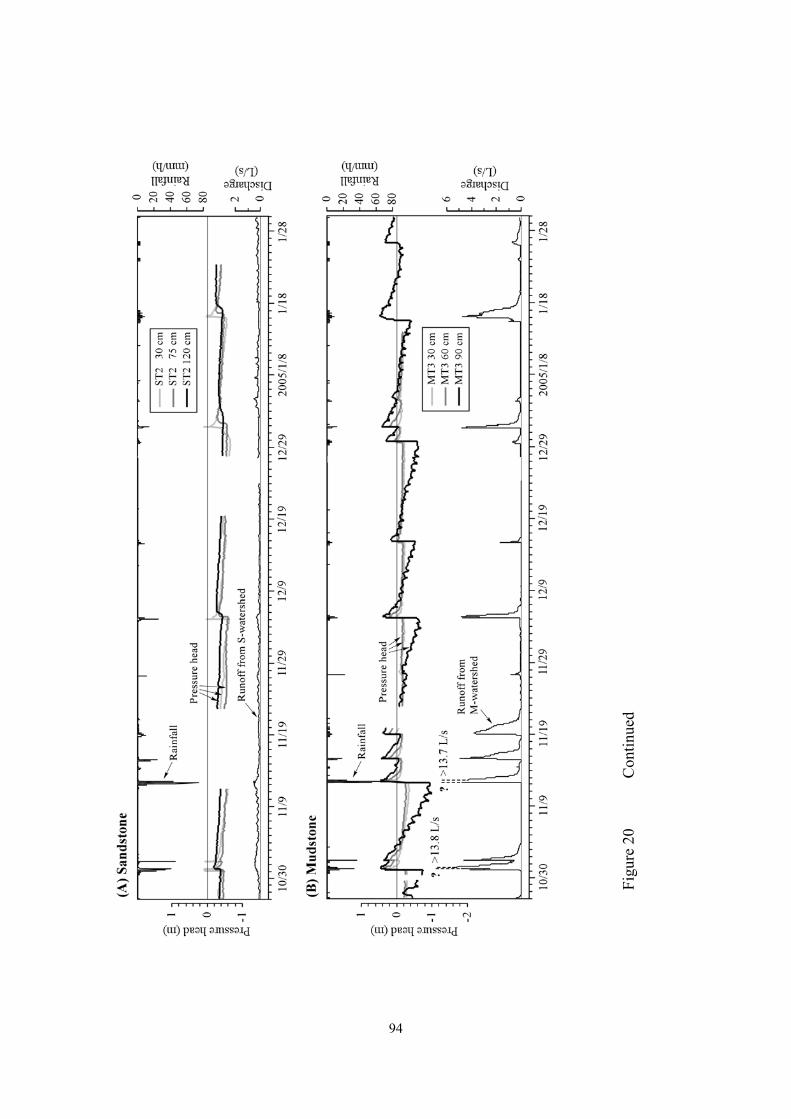
94
Figu
re 2
0 C
ontin
ued
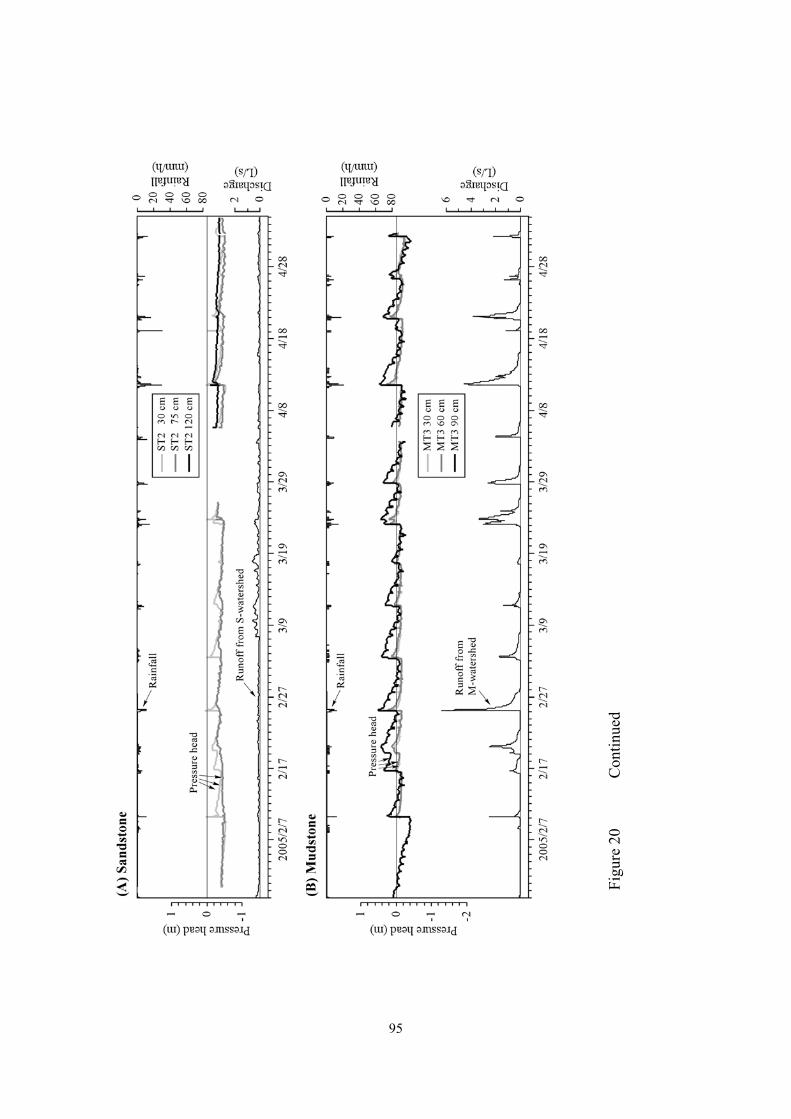
95
Figu
re 2
0 C
ontin
ued
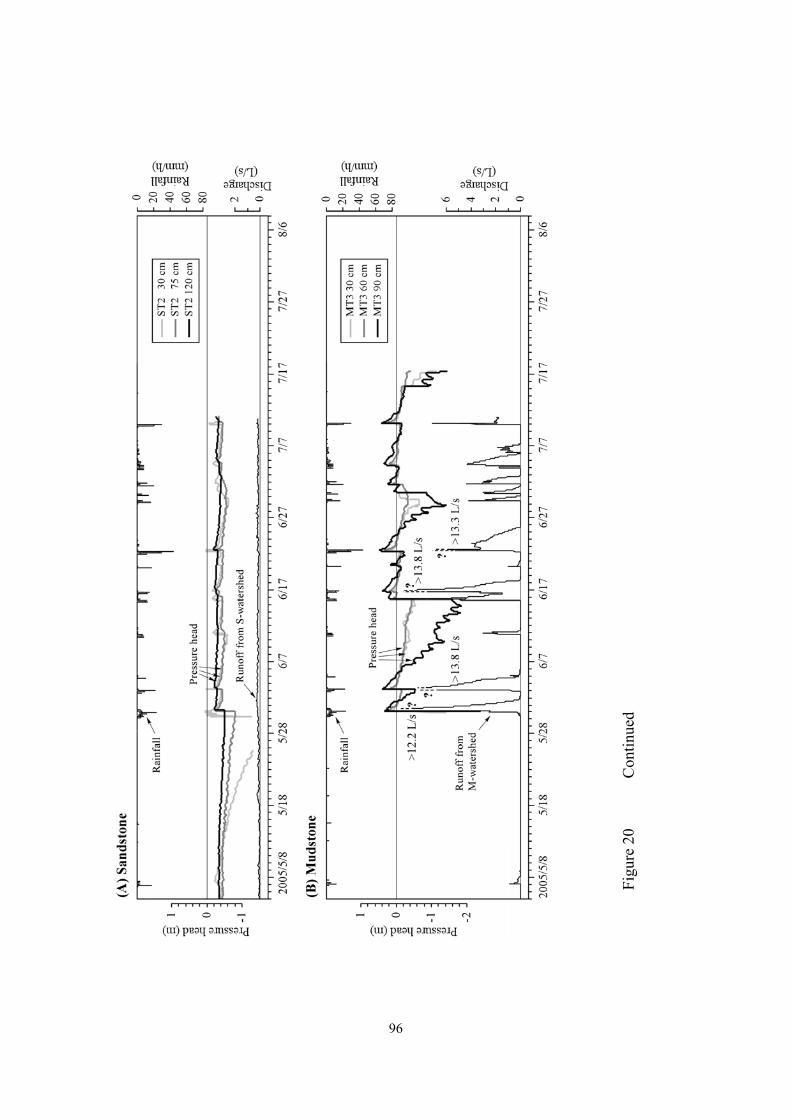
96
Figu
re 2
0 C
ontin
ued
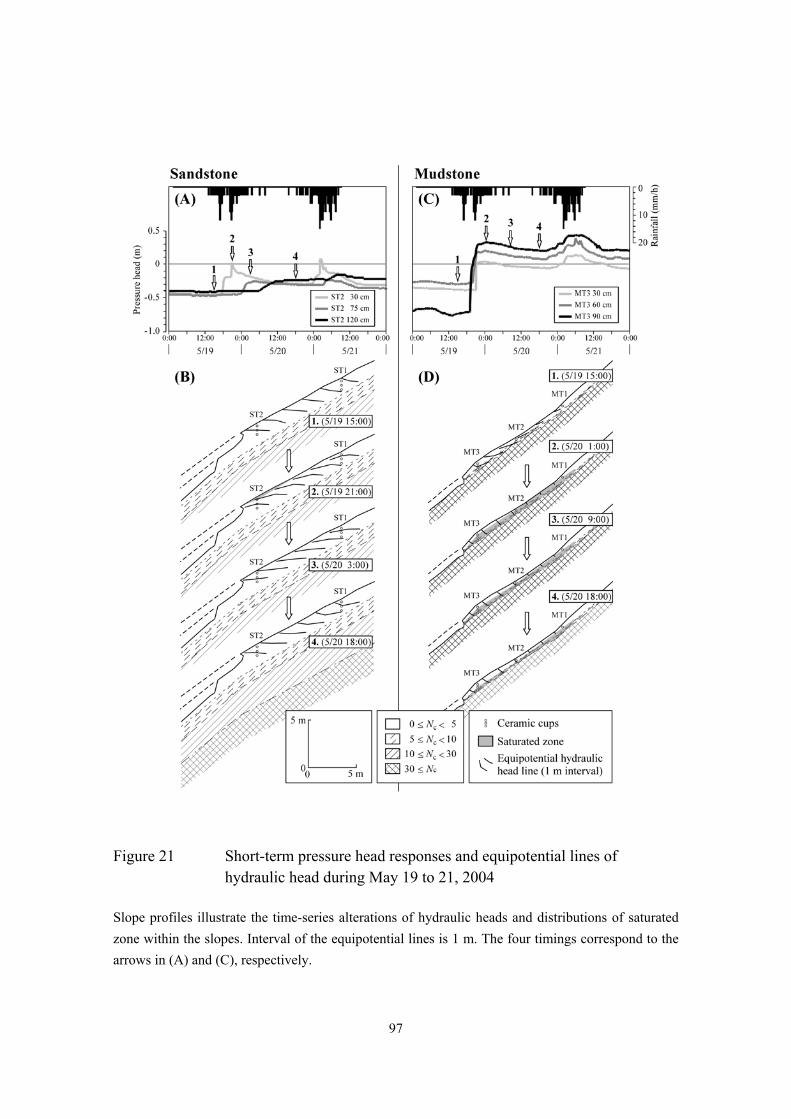
97
Figure 21 Short-term pressure head responses and equipotential lines of hydraulic head during May 19 to 21, 2004
Slope profiles illustrate the time-series alterations of hydraulic heads and distributions of saturated zone within the slopes. Interval of the equipotential lines is 1 m. The four timings correspond to the arrows in (A) and (C), respectively.
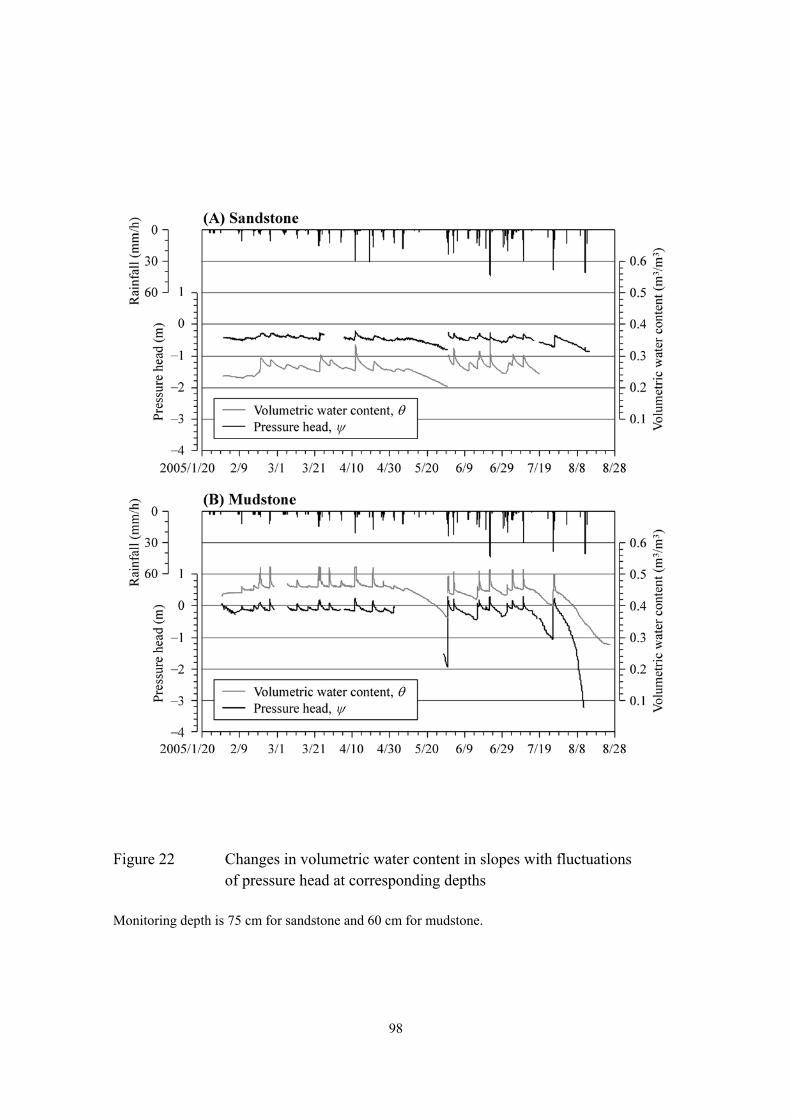
98
Figure 22 Changes in volumetric water content in slopes with fluctuations of pressure head at corresponding depths
Monitoring depth is 75 cm for sandstone and 60 cm for mudstone.
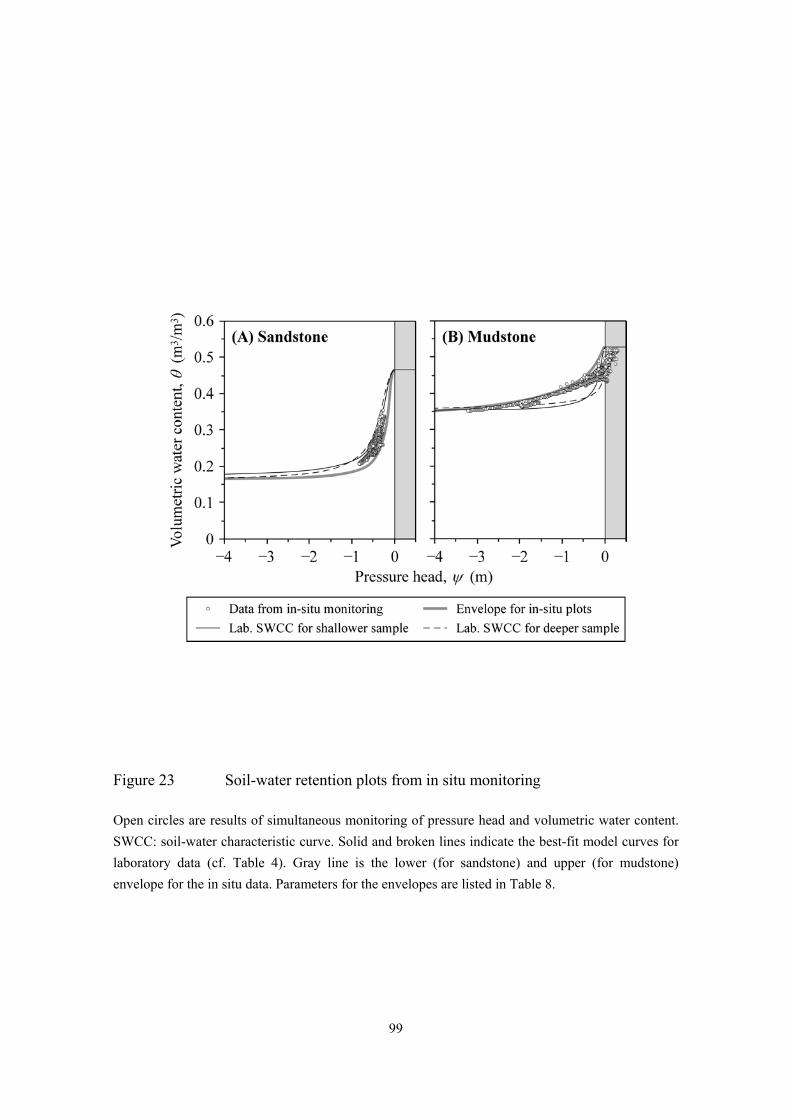
99
Figure 23 Soil-water retention plots from in situ monitoring
Open circles are results of simultaneous monitoring of pressure head and volumetric water content. SWCC: soil-water characteristic curve. Solid and broken lines indicate the best-fit model curves for laboratory data (cf. Table 4). Gray line is the lower (for sandstone) and upper (for mudstone) envelope for the in situ data. Parameters for the envelopes are listed in Table 8.
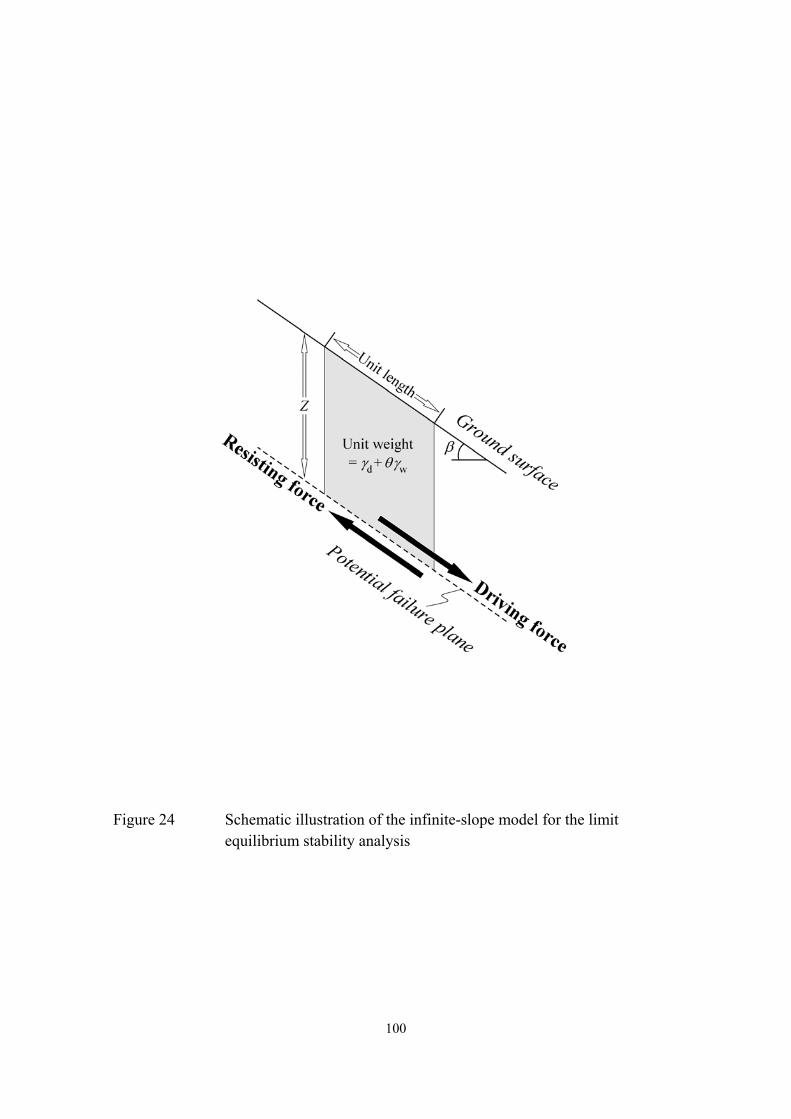
100
Figure 24 Schematic illustration of the infinite-slope model for the limit equilibrium stability analysis
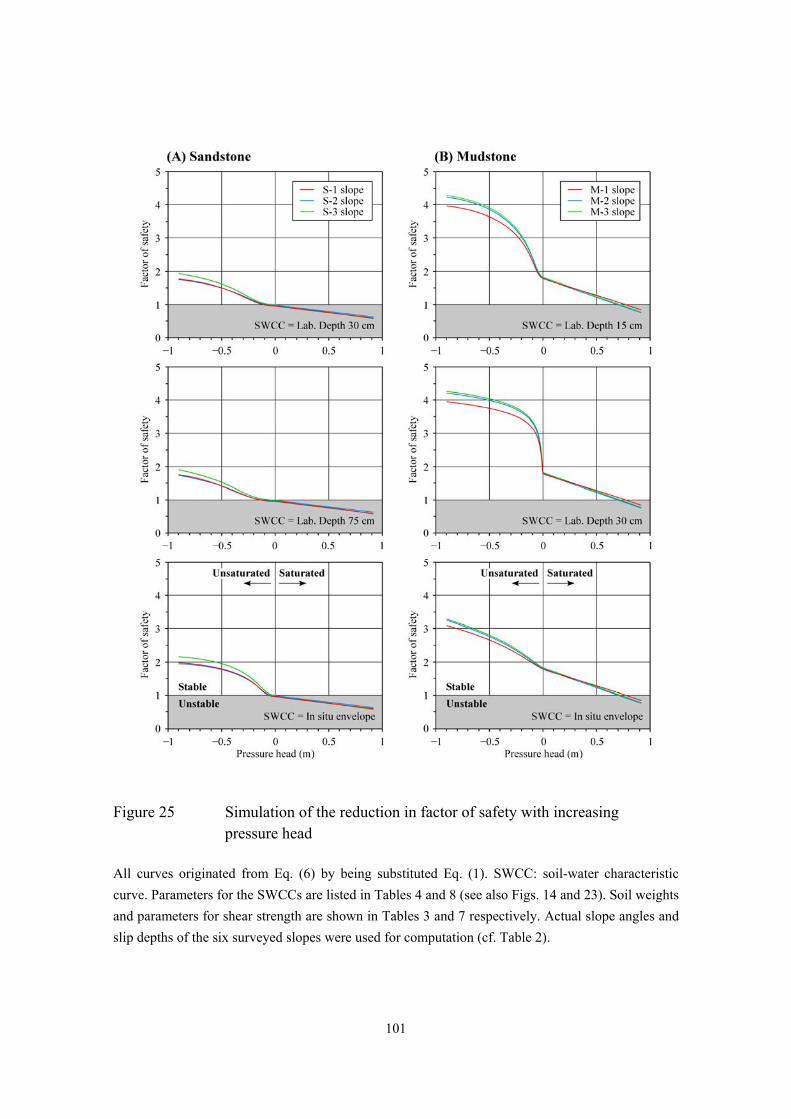
101
Figure 25 Simulation of the reduction in factor of safety with increasing pressure head
All curves originated from Eq. (6) by being substituted Eq. (1). SWCC: soil-water characteristic curve. Parameters for the SWCCs are listed in Tables 4 and 8 (see also Figs. 14 and 23). Soil weights and parameters for shear strength are shown in Tables 3 and 7 respectively. Actual slope angles and slip depths of the six surveyed slopes were used for computation (cf. Table 2).
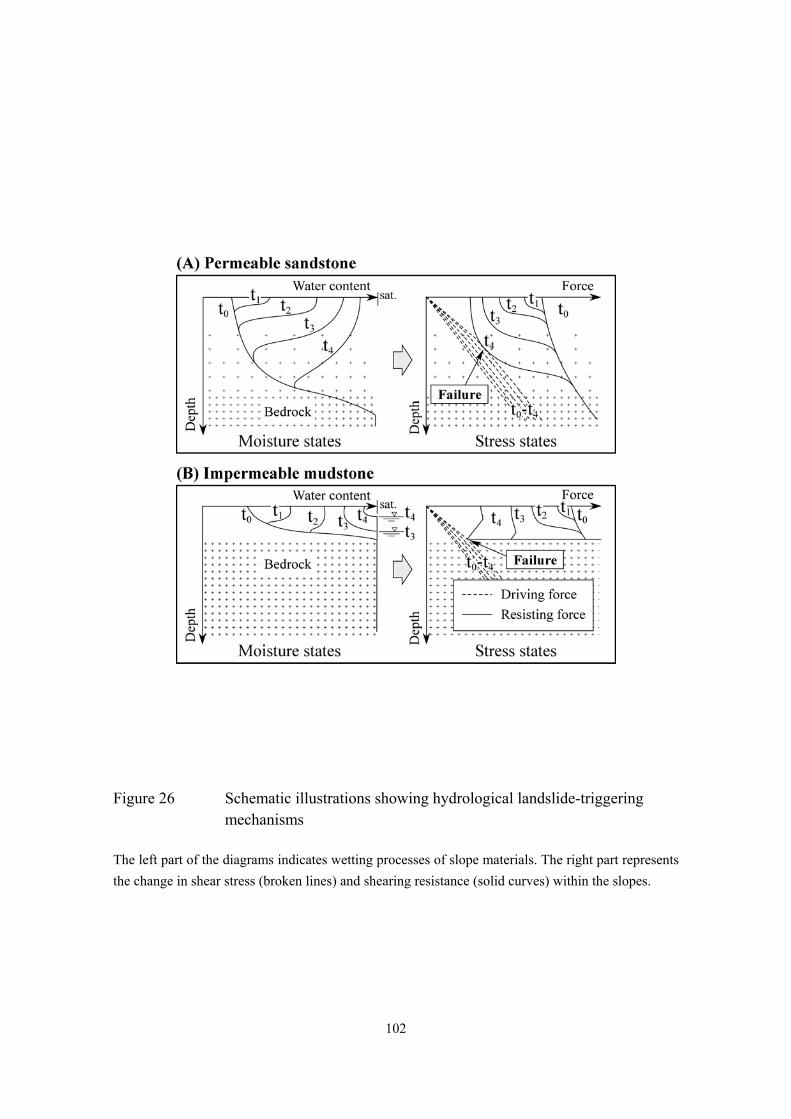
102
Figure 26 Schematic illustrations showing hydrological landslide-triggering mechanisms
The left part of the diagrams indicates wetting processes of slope materials. The right part represents the change in shear stress (broken lines) and shearing resistance (solid curves) within the slopes.
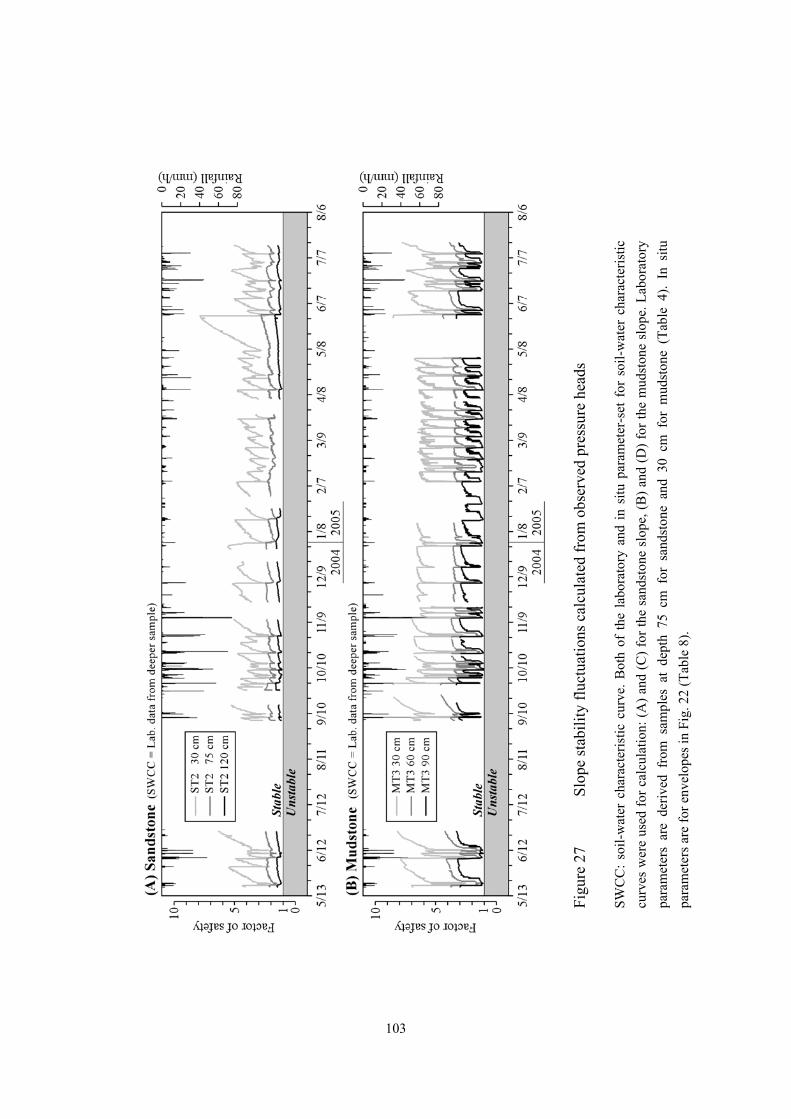
103
Figu
re 2
7 Sl
ope
stab
ility
fluc
tuat
ions
cal
cula
ted
from
obs
erve
d pr
essu
re h
eads
SWC
C: s
oil-w
ater
cha
ract
eris
tic c
urve
. Bot
h of
the
labo
rato
ry a
nd in
situ
par
amet
er-s
et f
or s
oil-w
ater
cha
ract
eris
tic
curv
es w
ere
used
for c
alcu
latio
n: (A
) and
(C) f
or th
e sa
ndst
one
slop
e, (B
) and
(D) f
or th
e m
udst
one
slop
e. L
abor
ator
y pa
ram
eter
s ar
e de
rived
fro
m s
ampl
es a
t de
pth
75 c
m f
or s
ands
tone
and
30
cm f
or m
udst
one
(Tab
le 4
). In
situ
pa
ram
eter
s are
for e
nvel
opes
in F
ig. 2
2 (T
able
8).
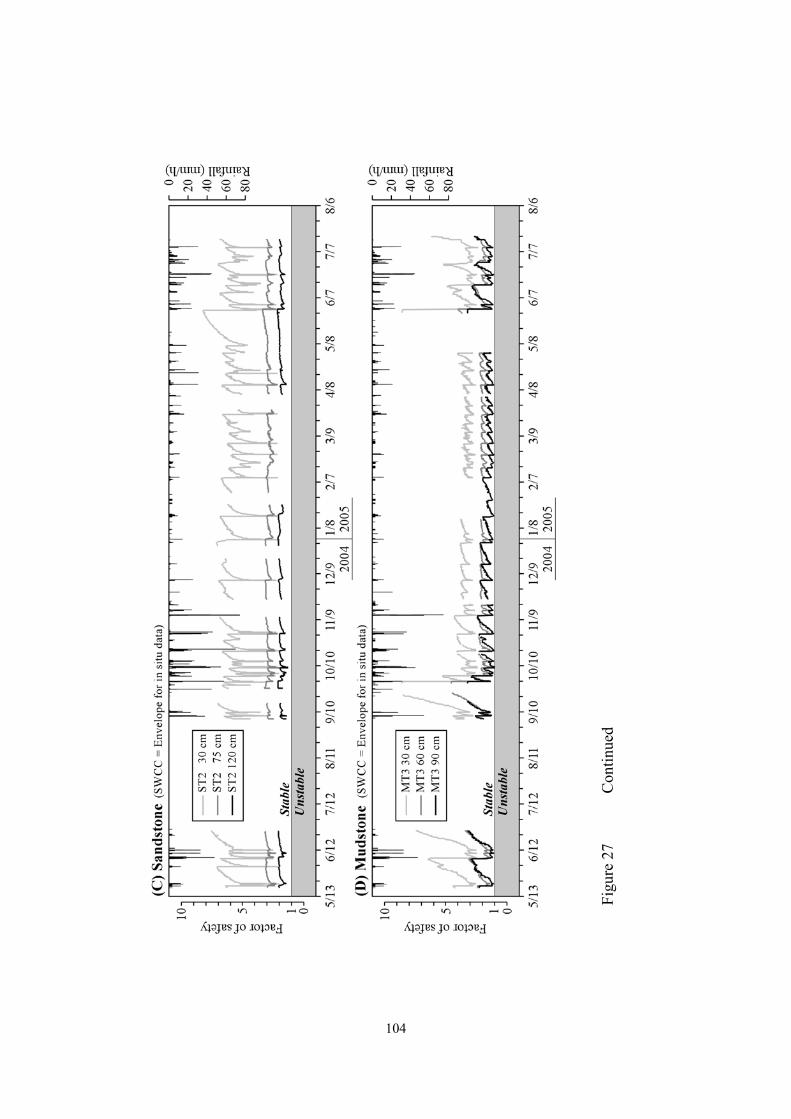
104
Figu
re 2
7 C
ontin
ued
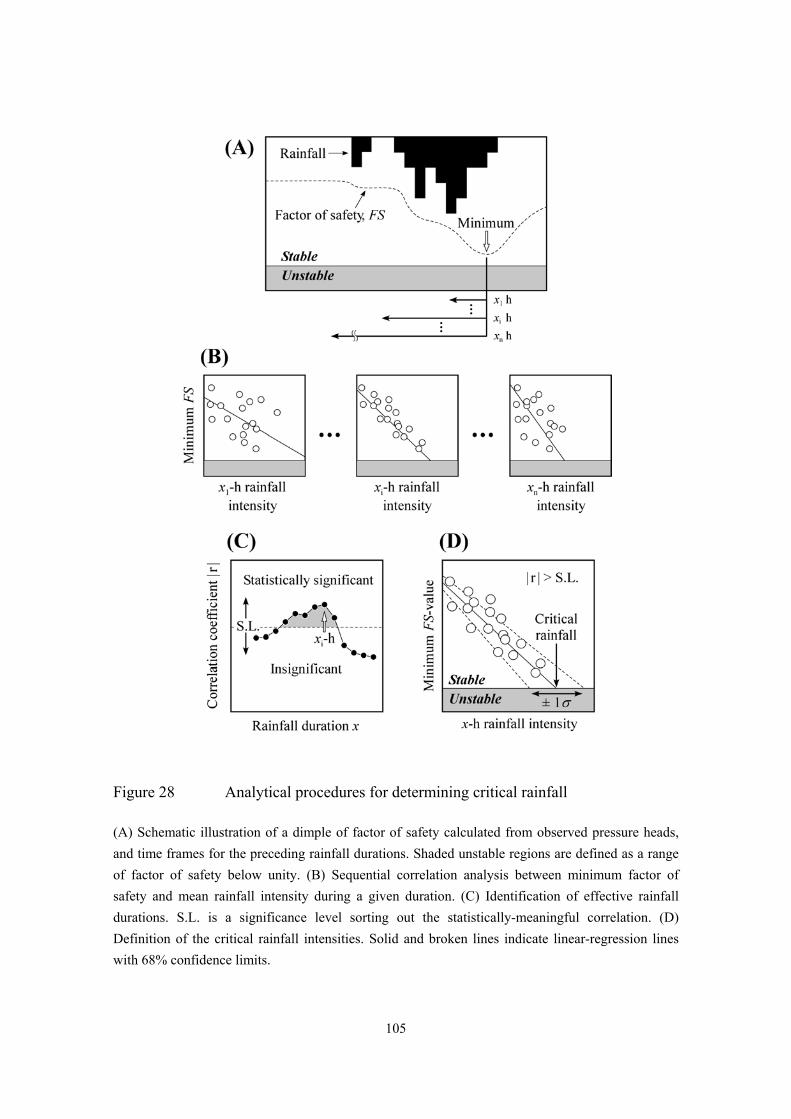
105
Figure 28 Analytical procedures for determining critical rainfall
(A) Schematic illustration of a dimple of factor of safety calculated from observed pressure heads, and time frames for the preceding rainfall durations. Shaded unstable regions are defined as a range of factor of safety below unity. (B) Sequential correlation analysis between minimum factor of safety and mean rainfall intensity during a given duration. (C) Identification of effective rainfall durations. S.L. is a significance level sorting out the statistically-meaningful correlation. (D) Definition of the critical rainfall intensities. Solid and broken lines indicate linear-regression lines with 68% confidence limits.
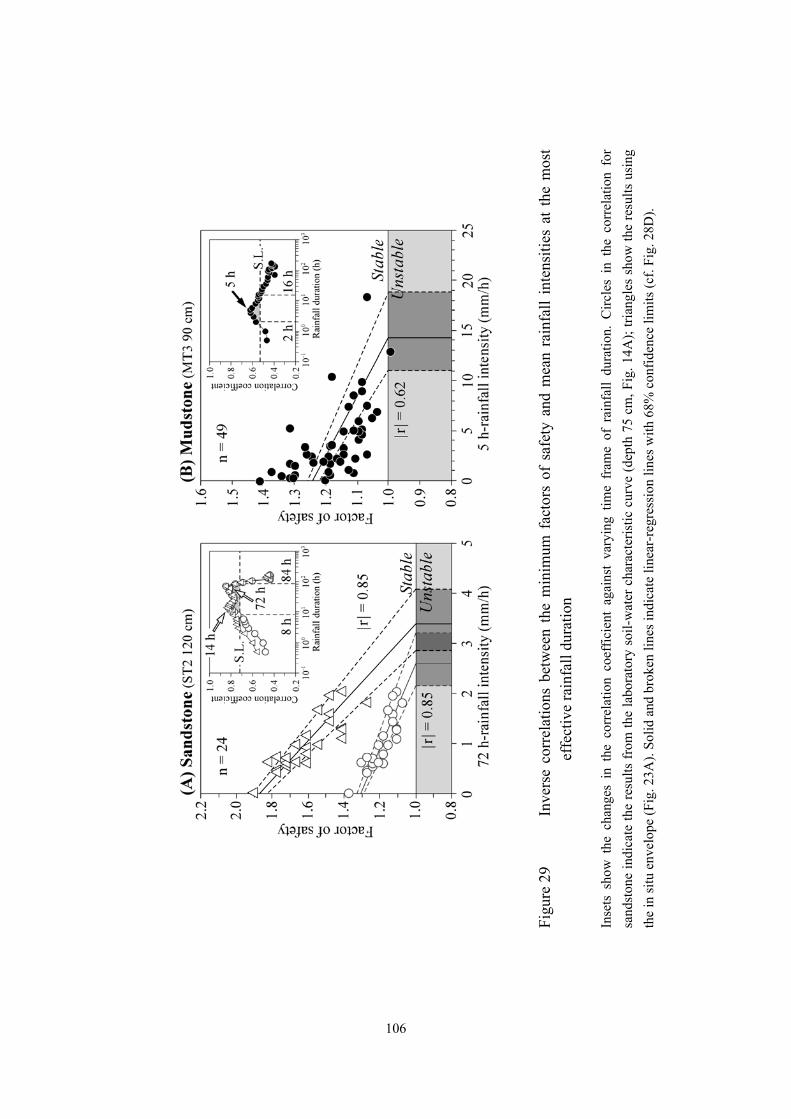
106
Figu
re 2
9 In
vers
e co
rrel
atio
ns b
etw
een
the
min
imum
fac
tors
of
safe
ty a
nd m
ean
rain
fall
inte
nsiti
es a
t the
mos
t
effe
ctiv
e ra
infa
ll du
ratio
n
Inse
ts s
how
the
cha
nges
in
the
corr
elat
ion
coef
ficie
nt a
gain
st v
aryi
ng t
ime
fram
e of
rai
nfal
l du
ratio
n. C
ircle
s in
the
cor
rela
tion
for
sand
ston
e in
dica
te th
e re
sults
from
the
labo
rato
ry s
oil-w
ater
cha
ract
eris
tic c
urve
(dep
th 7
5 cm
, Fig
. 14A
); tri
angl
es s
how
the
resu
lts u
sing
th
e in
situ
env
elop
e (F
ig. 2
3A).
Solid
and
bro
ken
lines
indi
cate
line
ar-r
egre
ssio
n lin
es w
ith 6
8% c
onfid
ence
lim
its (c
f. Fi
g. 2
8D).
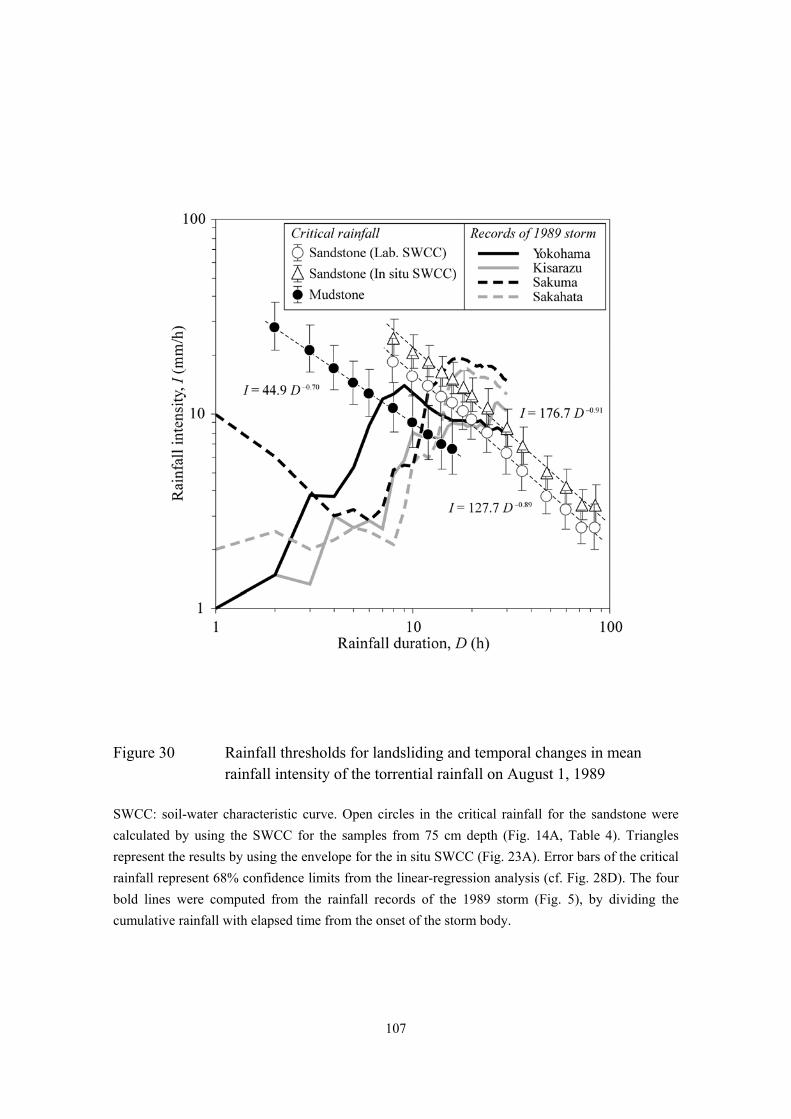
107
Figure 30 Rainfall thresholds for landsliding and temporal changes in mean rainfall intensity of the torrential rainfall on August 1, 1989
SWCC: soil-water characteristic curve. Open circles in the critical rainfall for the sandstone were calculated by using the SWCC for the samples from 75 cm depth (Fig. 14A, Table 4). Triangles represent the results by using the envelope for the in situ SWCC (Fig. 23A). Error bars of the critical rainfall represent 68% confidence limits from the linear-regression analysis (cf. Fig. 28D). The four bold lines were computed from the rainfall records of the 1989 storm (Fig. 5), by dividing the cumulative rainfall with elapsed time from the onset of the storm body.
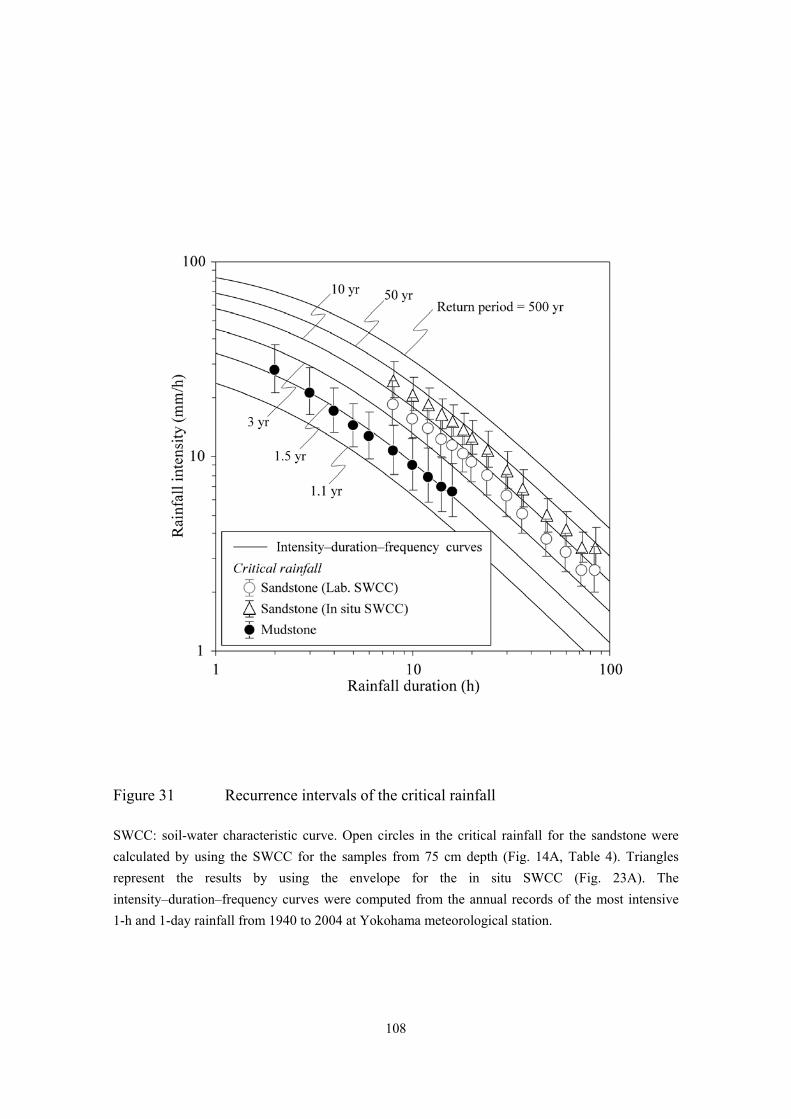
108
Figure 31 Recurrence intervals of the critical rainfall
SWCC: soil-water characteristic curve. Open circles in the critical rainfall for the sandstone were calculated by using the SWCC for the samples from 75 cm depth (Fig. 14A, Table 4). Triangles represent the results by using the envelope for the in situ SWCC (Fig. 23A). The intensity–duration–frequency curves were computed from the annual records of the most intensive 1-h and 1-day rainfall from 1940 to 2004 at Yokohama meteorological station.
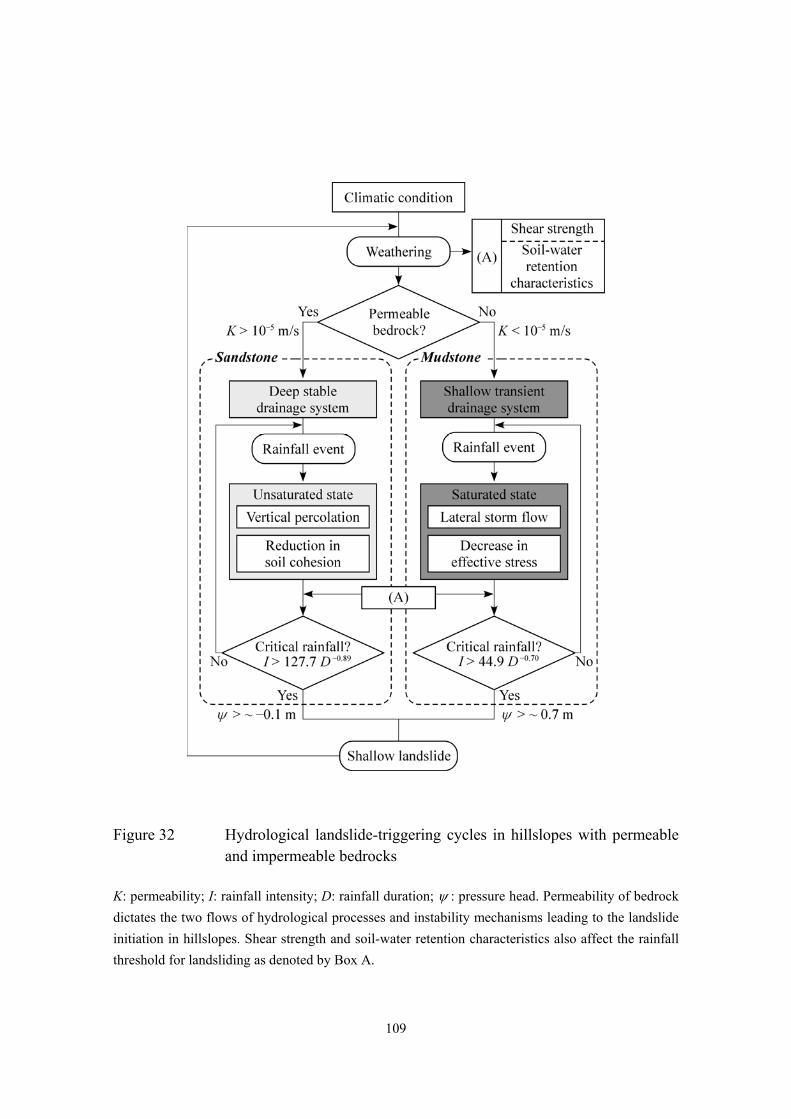
109
Figure 32 Hydrological landslide-triggering cycles in hillslopes with permeable and impermeable bedrocks
K: permeability; I: rainfall intensity; D: rainfall duration; ψ : pressure head. Permeability of bedrock dictates the two flows of hydrological processes and instability mechanisms leading to the landslide initiation in hillslopes. Shear strength and soil-water retention characteristics also affect the rainfall threshold for landsliding as denoted by Box A.


![arXiv:1912.01233v1 [stat.AP] 3 Dec 2019empirical observation that landslides occur as a result of multiple, interacting, conditioning and triggering factors. Based on this observation,](https://img.pdfslide.net/doc/110x75/60c23df223d67449835573c0/arxiv191201233v1-statap-3-dec-2019-empirical-observation-that-landslides-occur.jpg)