Embed Size (px)
Citation preview
Triple Threat Motorized Hybrid Bicycle
Martin Keyt
1 Abstract
The main objectives of this project were to gain an understanding of both electric motors and gasoline-powered internal combustion engines, basic microcontroller programming, and circuitry in order to ultimately design, construct, and optimize a three-way hybrid motorized bicycle. The front wheel of this bicycle is powered by an electric hub motor that operates independently of a four-stroke gasoline powered engine that powers the rear wheel. Furthermore, the rider can operate the bicycle through conventional pedaling. The speedometer incorporates an Arduino microcontroller that uses a Hall chip to sense the magnetic field of a magnet that rotates once per revolution of the wheel. Depending on which motor is being used for transportation, this bicycle travels at speeds of 11 to 27 MPH with a fuel efficiency of 94.64 MPG. At RPM of 350 to 750, the Arduino speedometer operates with 0.5% to 1.5% accuracy.
2 Introduction This hybrid motorbike will offer an innovative approach to convent-ional bicycle transportation. With the ability to be powered by an electric front-hub motor, a rear-gas motor, and wide-crank pedals, this hybrid bike has the ability to vary transportation modes while riding to offer a faster, greener, and more fun way of moving from point A to point B. With the ability to change between these modalities, the rider will experience the advantages of each. For example, the electric motor will excel in flat terrain at modest speeds of approximately 12 MPH where as the gas motor will enable the rider to easily climb hills in half
This paper was written for Dr. James Dann’s Applied Science Research class in the spring of 2012.
56 Martin Keyt
the time. Lastly, this motorbike will have an LCD screen displaying the bike’s current RPM, speed, and distance. This device will be powered by an Arduino Uno microcontroller.
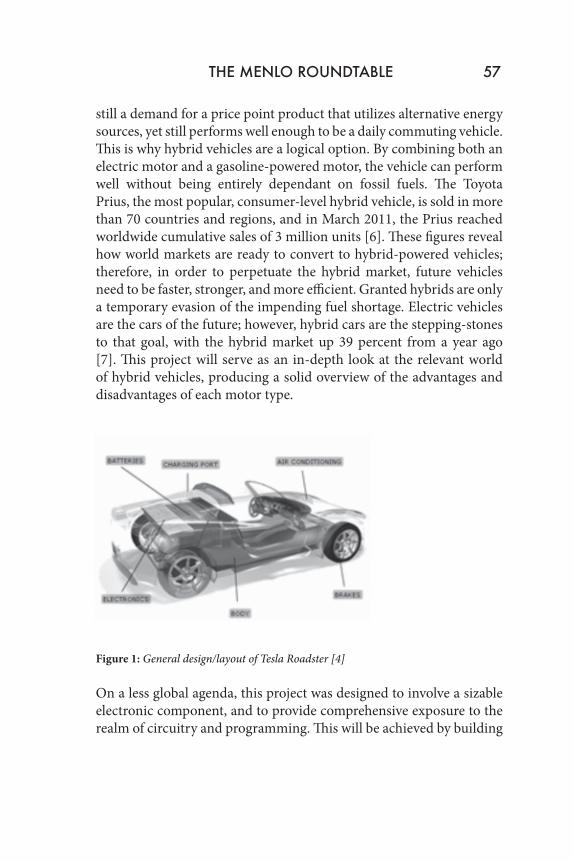
The origin of this project came from the increasing demand for hybrid vehicles. Granted motorcycles are one of the most dangerous forms of transportation [1]. But hybrid motorbikes serve as an elegant solution to the problems of commuting without being heavily dependent on fossil fuels. The specific origin of this project came from Prasanth Veerina’s regenerating braking system for electric bicycles, a former Menlo ASR Second Semester Project [2]. Upon seeing Prasanth riding this bike during the product faire, I noticed how nicely electric bicycles work as a means of transportation, not to mention the effectiveness of his regenerative braking system. Veerina’s project redefined the way I viewed bicycle transportation, which is why this project will take the idea of motorized bicycles even further. Not only will a conventional cruiser bike be converted into an electric bicycle, but a gas-powered motor will be added to offer a new range of versatility. The result will be a hybrid-powered motorbike. More broadly, the idea for this project spawned from worldwide over-dependency on fossil fuels. With the demand for gasoline continually increasing, innovations in alternative modes of transportation powered by more readily-available energy sources are becoming crucial. For example, President Barack Obama funded “$2.4 billion in stimulus grants to jump-start an electric vehicle industry centered in the Midwest” [3], thus symbolizing how world powers such as the United States are funding alternative energy industries in response to the dwindling fossil fuel supplies. In the realm of motorized vehicles, electricity is emerging as a possible surrogate for alternative energy transportation. Tesla Motors demonstrated this fact by manufacturing the Tesla Roadster, the world’s first high-performance electric car. Its maximum torque is 270 Newton meters, obtained at 0 RPM and almost constant up to 6,000 RPM, thus symbolizing how electric vehicles are capable of matching, even surpassing, internal combustion vehicles [5]. However, with starting prices at approximately $110,000, the Roadster is hardly a consumer-level product, which is why there is
THE MENLO ROUNDTABLE 57
still a demand for a price point product that utilizes alternative energy sources, yet still performs well enough to be a daily commuting vehicle. This is why hybrid vehicles are a logical option. By combining both an electric motor and a gasoline-powered motor, the vehicle can perform well without being entirely dependant on fossil fuels. The Toyota Prius, the most popular, consumer-level hybrid vehicle, is sold in more than 70 countries and regions, and in March 2011, the Prius reached worldwide cumulative sales of 3 million units [6]. These figures reveal how world markets are ready to convert to hybrid-powered vehicles; therefore, in order to perpetuate the hybrid market, future vehicles need to be faster, stronger, and more efficient. Granted hybrids are only a temporary evasion of the impending fuel shortage. Electric vehicles are the cars of the future; however, hybrid cars are the stepping-stones to that goal, with the hybrid market up 39 percent from a year ago [7]. This project will serve as an in-depth look at the relevant world of hybrid vehicles, producing a solid overview of the advantages and disadvantages of each motor type.
Figure 1: General design/layout of Tesla Roadster [4] On a less global agenda, this project was designed to involve a sizable electronic component, and to provide comprehensive exposure to the realm of circuitry and programming. This will be achieved by building
58 Martin Keyt
the accessories to the bike. Specifically, this will include an Arduino microcontroller-powered speedometer, odometer, and RPM device with a live-read LCD monitor, blinking turn signal lights, brake lights, and a sound system.
3 Theory
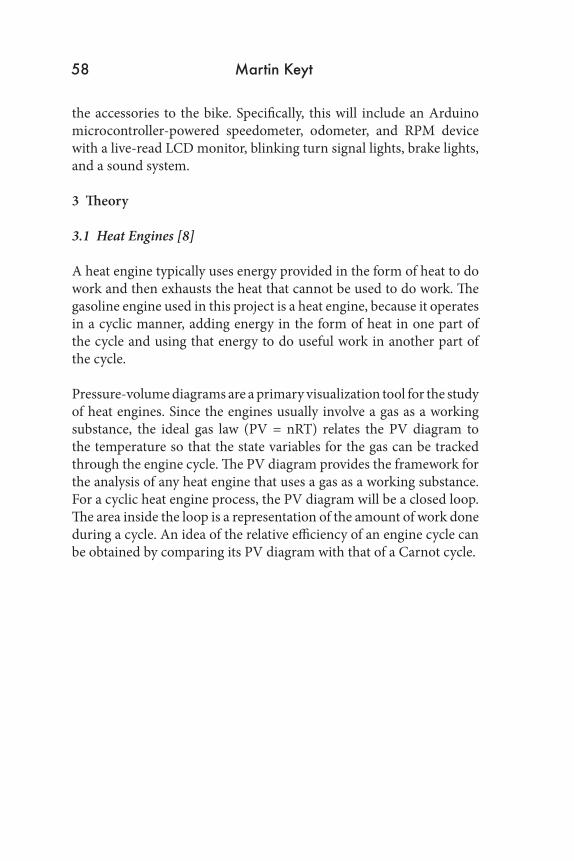
3.1 Heat Engines [8] A heat engine typically uses energy provided in the form of heat to do work and then exhausts the heat that cannot be used to do work. The gasoline engine used in this project is a heat engine, because it operates in a cyclic manner, adding energy in the form of heat in one part of the cycle and using that energy to do useful work in another part of the cycle. Pressure-volume diagrams are a primary visualization tool for the study of heat engines. Since the engines usually involve a gas as a working substance, the ideal gas law (PV = nRT) relates the PV diagram to the temperature so that the state variables for the gas can be tracked through the engine cycle. The PV diagram provides the framework for the analysis of any heat engine that uses a gas as a working substance. For a cyclic heat engine process, the PV diagram will be a closed loop. The area inside the loop is a representation of the amount of work done during a cycle. An idea of the relative efficiency of an engine cycle can be obtained by comparing its PV diagram with that of a Carnot cycle.
THE MENLO ROUNDTABLE 59
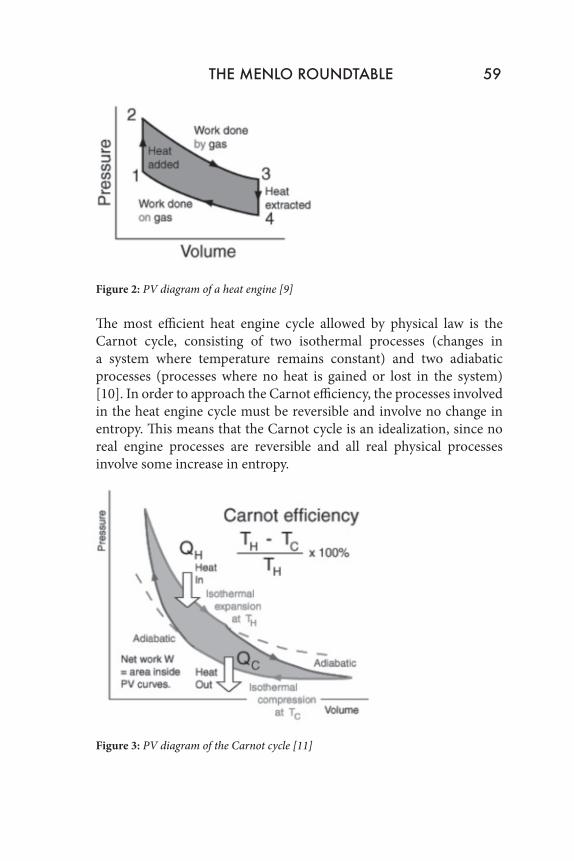
Figure 2: PV diagram of a heat engine [9] The most efficient heat engine cycle allowed by physical law is the Carnot cycle, consisting of two isothermal processes (changes in a system where temperature remains constant) and two adiabatic processes (processes where no heat is gained or lost in the system)[10]. In order to approach the Carnot efficiency, the processes involved in the heat engine cycle must be reversible and involve no change in entropy. This means that the Carnot cycle is an idealization, since no real engine processes are reversible and all real physical processes involve some increase in entropy.
Figure 3: PV diagram of the Carnot cycle [11]
60 Martin Keyt
The engine used in this project is a four-stroke, also known as four-cycle, internal combustion engine where the piston accomplishes four separate motions or “strokes.” The four strokes that make up the cycle of a four-stroke engine are: intake, compression, power, and exhaust. 3.2 Stages of the Carnot Cycle in Relation to a Four-Stroke Motor [12]
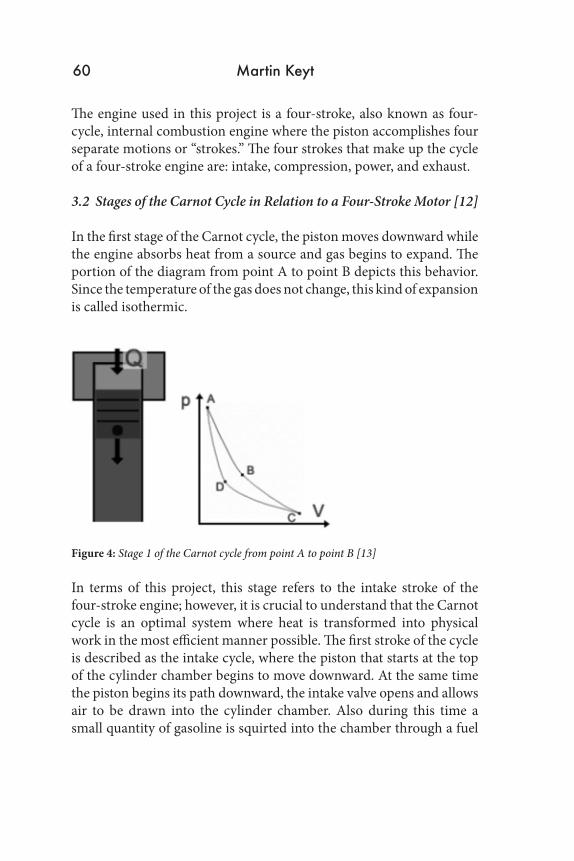
In the first stage of the Carnot cycle, the piston moves downward while the engine absorbs heat from a source and gas begins to expand. The portion of the diagram from point A to point B depicts this behavior. Since the temperature of the gas does not change, this kind of expansion is called isothermic.
Figure 4: Stage 1 of the Carnot cycle from point A to point B [13]
In terms of this project, this stage refers to the intake stroke of the four-stroke engine; however, it is crucial to understand that the Carnot cycle is an optimal system where heat is transformed into physical work in the most efficient manner possible. The first stroke of the cycle is described as the intake cycle, where the piston that starts at the top of the cylinder chamber begins to move downward. At the same time the piston begins its path downward, the intake valve opens and allows air to be drawn into the cylinder chamber. Also during this time a small quantity of gasoline is squirted into the chamber through a fuel
THE MENLO ROUNDTABLE 61
injector and mixes with the air. The perfect air to gas ratio is 14 parts air to one part fuel, thus allowing the fuel to burn.
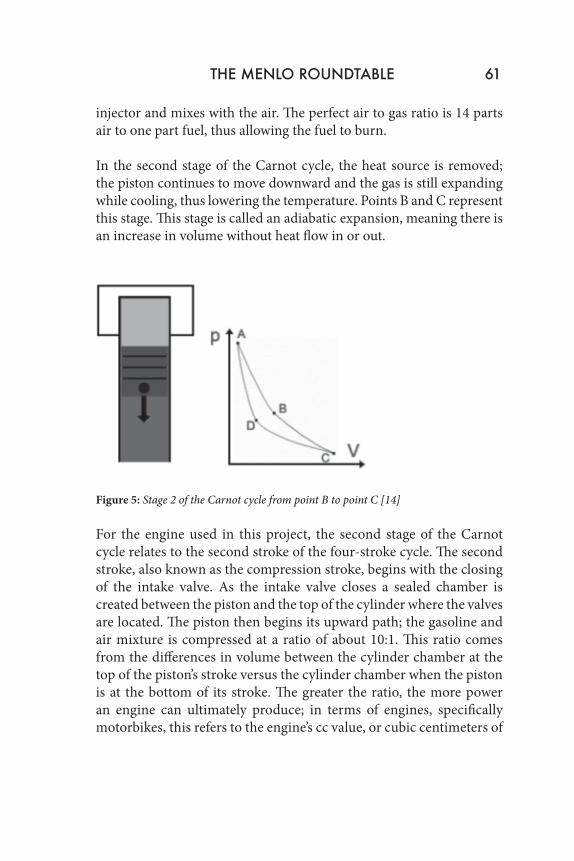
In the second stage of the Carnot cycle, the heat source is removed; the piston continues to move downward and the gas is still expanding while cooling, thus lowering the temperature. Points B and C represent this stage. This stage is called an adiabatic expansion, meaning there is an increase in volume without heat flow in or out.
Figure 5: Stage 2 of the Carnot cycle from point B to point C [14] For the engine used in this project, the second stage of the Carnot cycle relates to the second stroke of the four-stroke cycle. The second stroke, also known as the compression stroke, begins with the closing of the intake valve. As the intake valve closes a sealed chamber is created between the piston and the top of the cylinder where the valves are located. The piston then begins its upward path; the gasoline and air mixture is compressed at a ratio of about 10:1. This ratio comes from the differences in volume between the cylinder chamber at the top of the piston’s stroke versus the cylinder chamber when the piston is at the bottom of its stroke. The greater the ratio, the more power an engine can ultimately produce; in terms of engines, specifically motorbikes, this refers to the engine’s cc value, or cubic centimeters of
62 Martin Keyt
displacement. The engine used for this project is 49 cc. For example [15], a 454 in3 engine with 8 cylinders can hold 56.75 in3 per cylinder; therefore, with a compression ratio of 10:1, the engine can compress this to 5.67 in3 The resulting compression creates a lot of potential energy that can then be converted into kinetic energy in the next stroke.
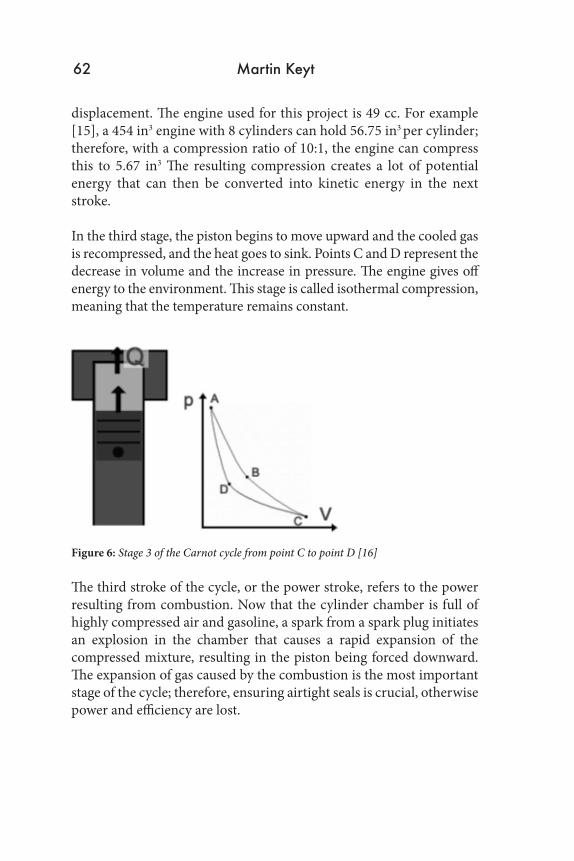
In the third stage, the piston begins to move upward and the cooled gas is recompressed, and the heat goes to sink. Points C and D represent the decrease in volume and the increase in pressure. The engine gives off energy to the environment. This stage is called isothermal compression, meaning that the temperature remains constant.
Figure 6: Stage 3 of the Carnot cycle from point C to point D [16] The third stroke of the cycle, or the power stroke, refers to the power resulting from combustion. Now that the cylinder chamber is full of highly compressed air and gasoline, a spark from a spark plug initiates an explosion in the chamber that causes a rapid expansion of the compressed mixture, resulting in the piston being forced downward. The expansion of gas caused by the combustion is the most important stage of the cycle; therefore, ensuring airtight seals is crucial, otherwise power and efficiency are lost.
THE MENLO ROUNDTABLE 63
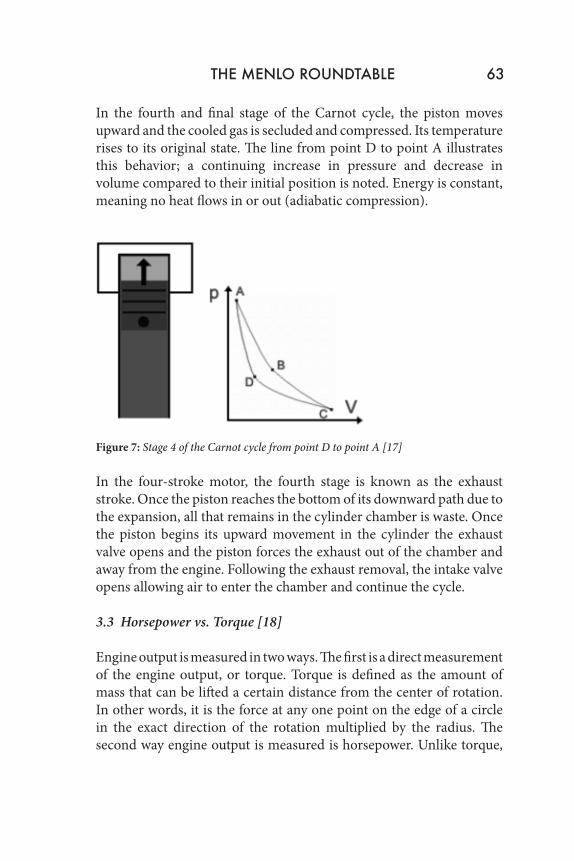
In the fourth and final stage of the Carnot cycle, the piston moves upward and the cooled gas is secluded and compressed. Its temperature rises to its original state. The line from point D to point A illustrates this behavior; a continuing increase in pressure and decrease in volume compared to their initial position is noted. Energy is constant, meaning no heat flows in or out (adiabatic compression).
Figure 7: Stage 4 of the Carnot cycle from point D to point A [17] In the four-stroke motor, the fourth stage is known as the exhaust stroke. Once the piston reaches the bottom of its downward path due to the expansion, all that remains in the cylinder chamber is waste. Once the piston begins its upward movement in the cylinder the exhaust valve opens and the piston forces the exhaust out of the chamber and away from the engine. Following the exhaust removal, the intake valve opens allowing air to enter the chamber and continue the cycle. 3.3 Horsepower vs. Torque [18]
Engine output is measured in two ways. The first is a direct measurement of the engine output, or torque. Torque is defined as the amount of mass that can be lifted a certain distance from the center of rotation. In other words, it is the force at any one point on the edge of a circle in the exact direction of the rotation multiplied by the radius. The second way engine output is measured is horsepower. Unlike torque,
64 Martin Keyt
horsepower is a calculated unit, meaning it is not directly measured. It can be thought of as the amount of torque an engine produces at a given RPM. For example, 1 hp is equal to 550 lb-ft/s, meaning horsepower is not actually being measured. Instead, the force exerted over a period of time results in horsepower. The force being measured is torque.
3.4 Torque to Horsepower Conversion [19]
Suppose a 1 ft wrench is attached to the end of a crankshaft and the engine rotates one revolution against one pound of resistance. The end of the wrench will move 6.2832 ft against a 1 lb weight. The end result is 6.2832 ft-lbs of work done at 1 ft-lb of torque:
1 hp = 550 ft-lbs/s = 33,000 ft-lbs/min
33,000 ft-lbs / 6.2832 ft-lbs = 5252
So, if the engine rotates against the 1 lb resistance at 5252 RPM:
6.2832 * 5252 = 33,000 ft-lbs/min = 1 hp
Because the 1 lb of resistance was moved 33,000 ft in 1 min:
(1 ft-lb * 5252) / 5252 = 1
Therefore, to convert torque to horsepower:
[(Torque )(RPM)] / 5252 = hp
For this project, the gasoline engine used has 5 hp. Since 5 hp = 165,000 ft-lbs/min, 1 lb of resistance can be moved 165,000 ft in 1 min.
THE MENLO ROUNDTABLE 65
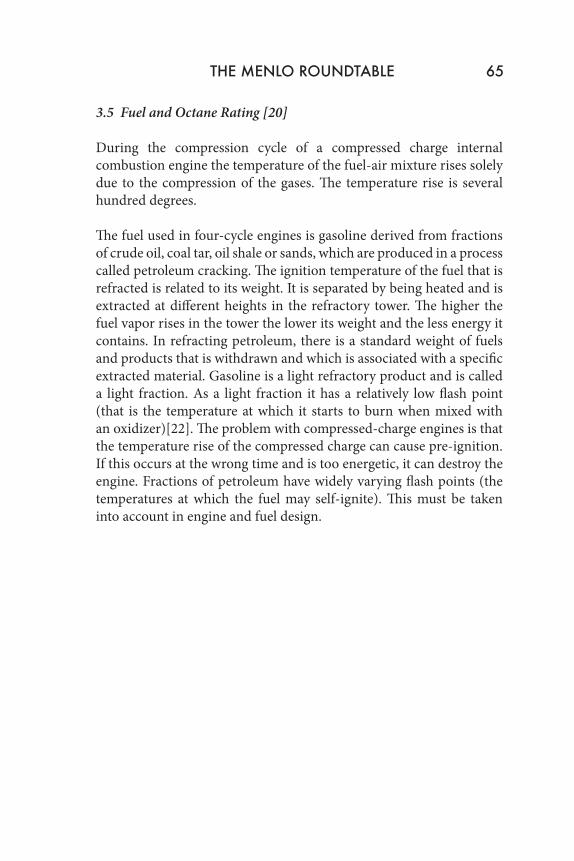
3.5 Fuel and Octane Rating [20] During the compression cycle of a compressed charge internal combustion engine the temperature of the fuel-air mixture rises solely due to the compression of the gases. The temperature rise is several hundred degrees. The fuel used in four-cycle engines is gasoline derived from fractions of crude oil, coal tar, oil shale or sands, which are produced in a process called petroleum cracking. The ignition temperature of the fuel that is refracted is related to its weight. It is separated by being heated and is extracted at different heights in the refractory tower. The higher the fuel vapor rises in the tower the lower its weight and the less energy it contains. In refracting petroleum, there is a standard weight of fuels and products that is withdrawn and which is associated with a specific extracted material. Gasoline is a light refractory product and is called a light fraction. As a light fraction it has a relatively low flash point (that is the temperature at which it starts to burn when mixed with an oxidizer)[22]. The problem with compressed-charge engines is that the temperature rise of the compressed charge can cause pre-ignition. If this occurs at the wrong time and is too energetic, it can destroy the engine. Fractions of petroleum have widely varying flash points (the temperatures at which the fuel may self-ignite). This must be taken into account in engine and fuel design.
66 Martin Keyt
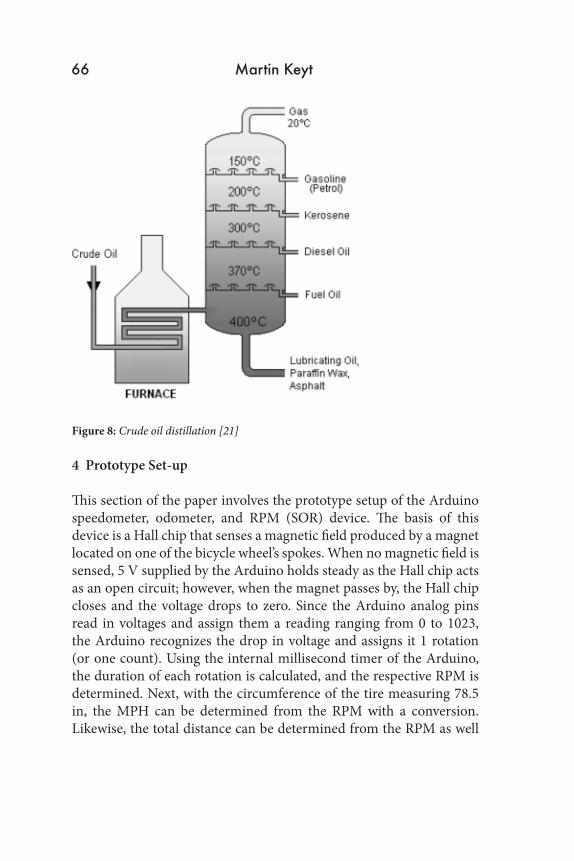
Figure 8: Crude oil distillation [21]
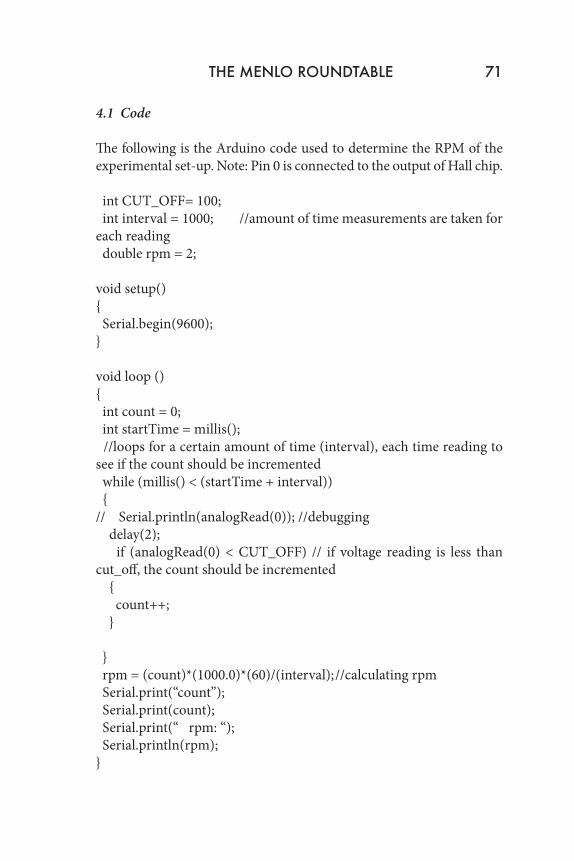
4 Prototype Set-up This section of the paper involves the prototype setup of the Arduino speedometer, odometer, and RPM (SOR) device. The basis of this device is a Hall chip that senses a magnetic field produced by a magnet located on one of the bicycle wheel’s spokes. When no magnetic field is sensed, 5 V supplied by the Arduino holds steady as the Hall chip acts as an open circuit; however, when the magnet passes by, the Hall chip closes and the voltage drops to zero. Since the Arduino analog pins read in voltages and assign them a reading ranging from 0 to 1023, the Arduino recognizes the drop in voltage and assigns it 1 rotation (or one count). Using the internal millisecond timer of the Arduino, the duration of each rotation is calculated, and the respective RPM is determined. Next, with the circumference of the tire measuring 78.5 in, the MPH can be determined from the RPM with a conversion. Likewise, the total distance can be determined from the RPM as well
THE MENLO ROUNDTABLE 67
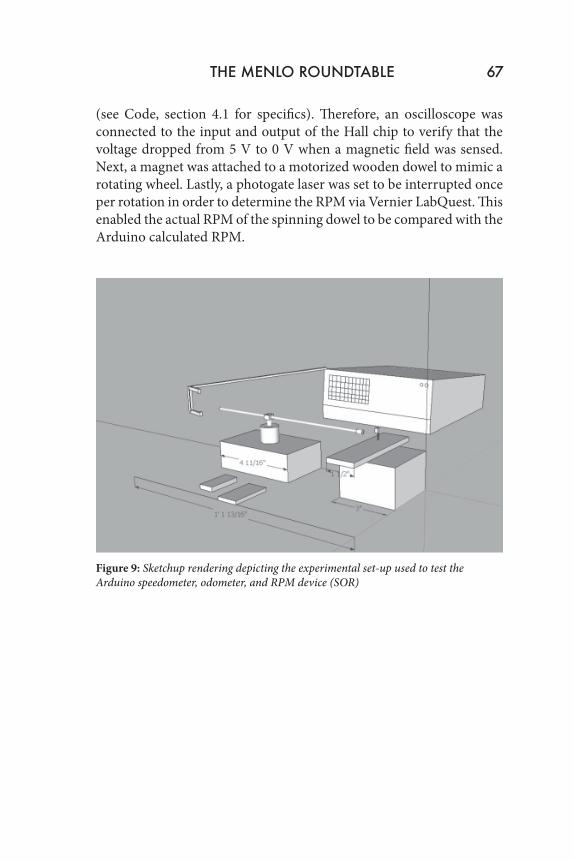
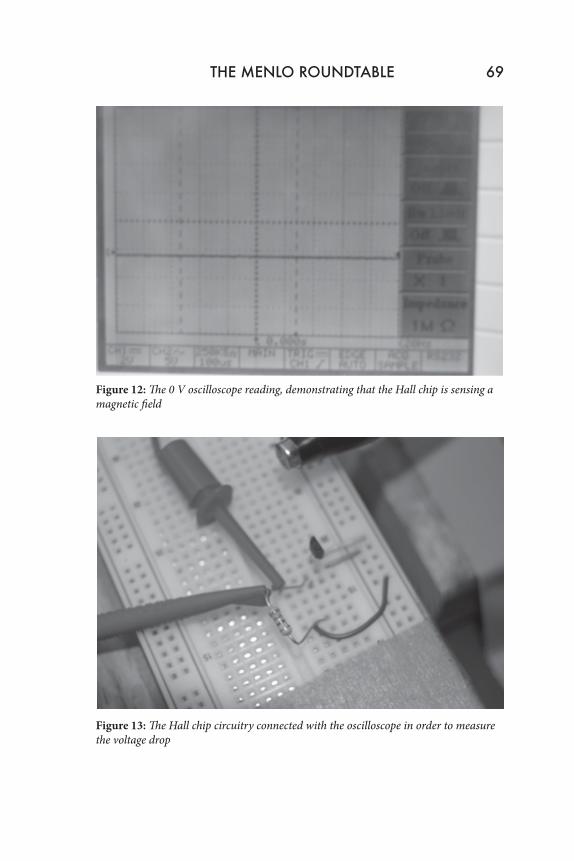
(see Code, section 4.1 for specifics). Therefore, an oscilloscope was connected to the input and output of the Hall chip to verify that the voltage dropped from 5 V to 0 V when a magnetic field was sensed. Next, a magnet was attached to a motorized wooden dowel to mimic a rotating wheel. Lastly, a photogate laser was set to be interrupted once per rotation in order to determine the RPM via Vernier LabQuest. This enabled the actual RPM of the spinning dowel to be compared with the Arduino calculated RPM.
Figure 9: Sketchup rendering depicting the experimental set-up used to test the Arduino speedometer, odometer, and RPM device (SOR)
68 Martin Keyt
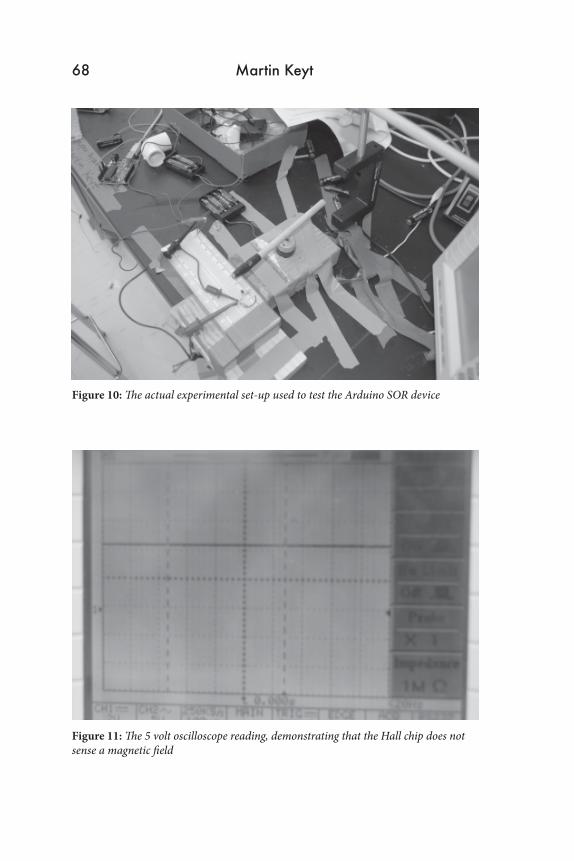
Figure 10: The actual experimental set-up used to test the Arduino SOR device
Figure 11: The 5 volt oscilloscope reading, demonstrating that the Hall chip does not sense a magnetic field
THE MENLO ROUNDTABLE 69
Figure 12: The 0 V oscilloscope reading, demonstrating that the Hall chip is sensing a magnetic field
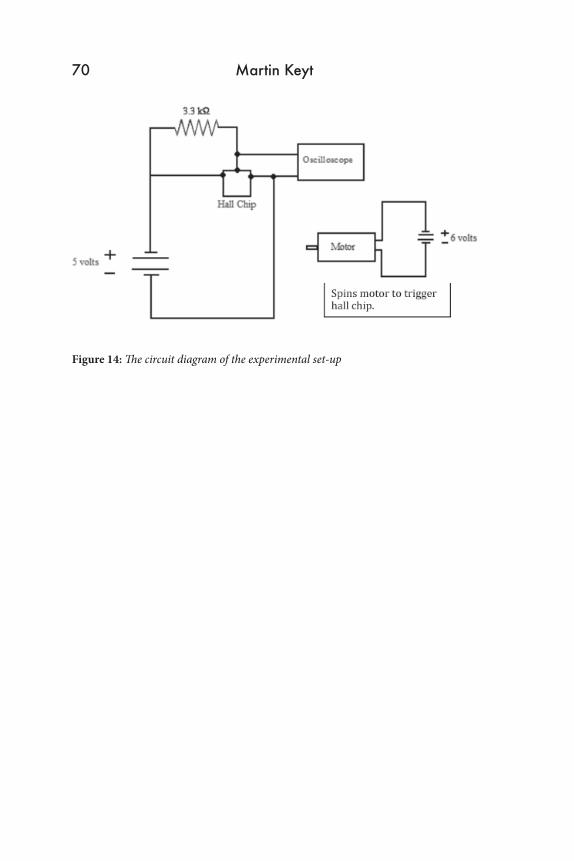
Figure 13: The Hall chip circuitry connected with the oscilloscope in order to measure the voltage drop
70 Martin Keyt
Figure 14: The circuit diagram of the experimental set-up
4.1 Code
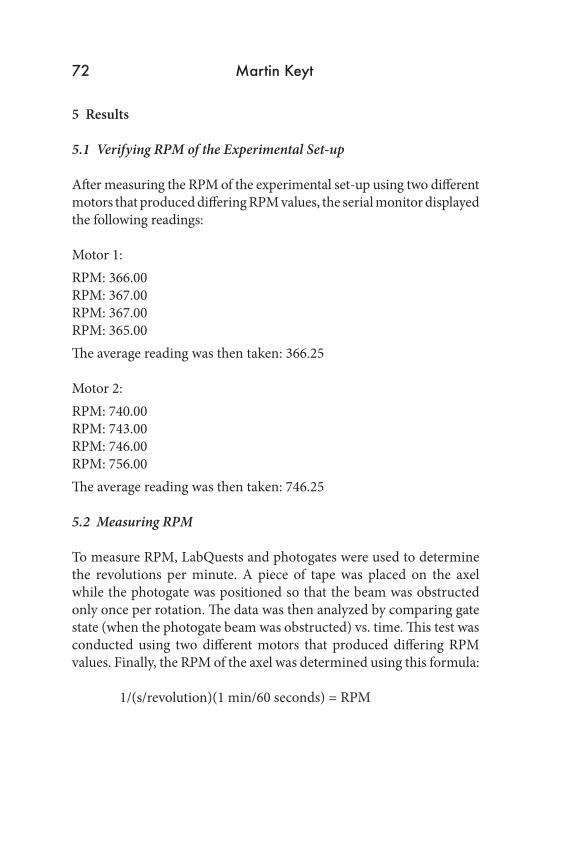
The following is the Arduino code used to determine the RPM of the experimental set-up. Note: Pin 0 is connected to the output of Hall chip.
int CUT_OFF= 100; int interval = 1000; //amount of time measurements are taken for each reading double rpm = 2;
void setup(){ Serial.begin(9600);}
void loop (){ int count = 0; int startTime = millis(); //loops for a certain amount of time (interval), each time reading to see if the count should be incremented while (millis() < (startTime + interval)) { // Serial.println(analogRead(0)); //debugging delay(2); if (analogRead(0) < CUT_OFF) // if voltage reading is less than cut_off, the count should be incremented { count++; }
} rpm = (count)*(1000.0)*(60)/(interval); //calculating rpm Serial.print(“count”); Serial.print(count); Serial.print(“ rpm: “); Serial.println(rpm);}
THE MENLO ROUNDTABLE 71
5 Results
5.1 Verifying RPM of the Experimental Set-up
After measuring the RPM of the experimental set-up using two different motors that produced differing RPM values, the serial monitor displayed the following readings:
Motor 1: RPM: 366.00RPM: 367.00RPM: 367.00RPM: 365.00The average reading was then taken: 366.25
Motor 2:RPM: 740.00RPM: 743.00RPM: 746.00RPM: 756.00The average reading was then taken: 746.25
5.2 Measuring RPM
To measure RPM, LabQuests and photogates were used to determine the revolutions per minute. A piece of tape was placed on the axel while the photogate was positioned so that the beam was obstructed only once per rotation. The data was then analyzed by comparing gate state (when the photogate beam was obstructed) vs. time. This test was conducted using two different motors that produced differing RPM values. Finally, the RPM of the axel was determined using this formula: 1/(s/revolution)(1 min/60 seconds) = RPM
72 Martin Keyt
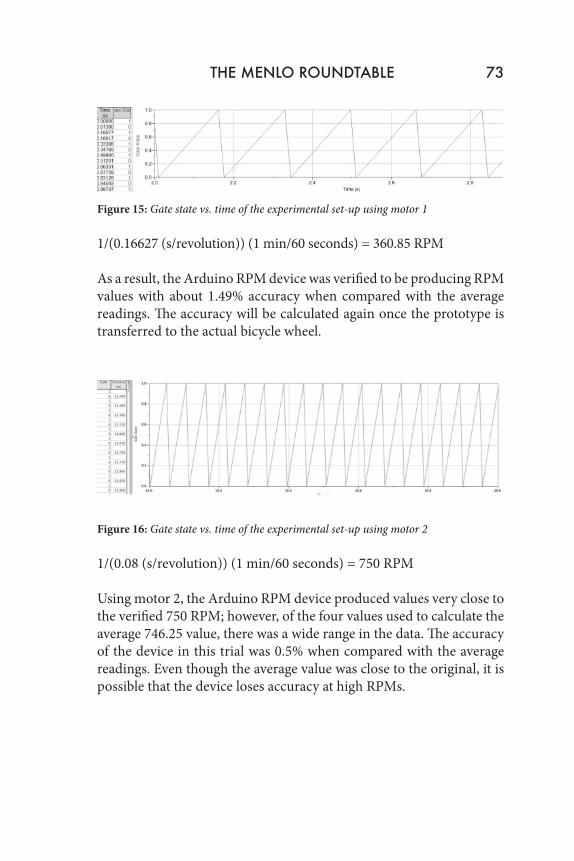
Figure 15: Gate state vs. time of the experimental set-up using motor 1 1/(0.16627 (s/revolution)) (1 min/60 seconds) = 360.85 RPM
As a result, the Arduino RPM device was verified to be producing RPM values with about 1.49% accuracy when compared with the average readings. The accuracy will be calculated again once the prototype is transferred to the actual bicycle wheel.
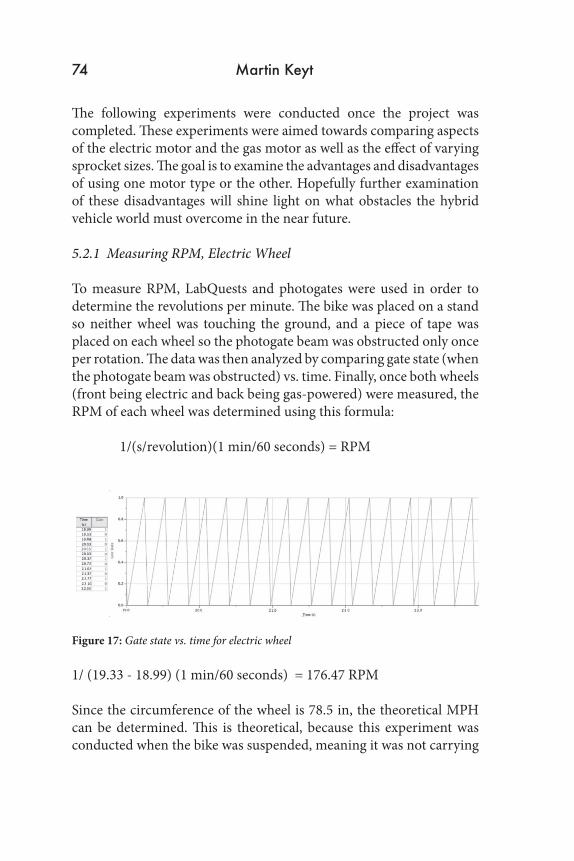
Figure 16: Gate state vs. time of the experimental set-up using motor 2
1/(0.08 (s/revolution)) (1 min/60 seconds) = 750 RPM
Using motor 2, the Arduino RPM device produced values very close to the verified 750 RPM; however, of the four values used to calculate the average 746.25 value, there was a wide range in the data. The accuracy of the device in this trial was 0.5% when compared with the average readings. Even though the average value was close to the original, it is possible that the device loses accuracy at high RPMs.
THE MENLO ROUNDTABLE 73
The following experiments were conducted once the project was completed. These experiments were aimed towards comparing aspects of the electric motor and the gas motor as well as the effect of varying sprocket sizes. The goal is to examine the advantages and disadvantages of using one motor type or the other. Hopefully further examination of these disadvantages will shine light on what obstacles the hybrid vehicle world must overcome in the near future.
5.2.1 Measuring RPM, Electric Wheel
To measure RPM, LabQuests and photogates were used in order to determine the revolutions per minute. The bike was placed on a stand so neither wheel was touching the ground, and a piece of tape was placed on each wheel so the photogate beam was obstructed only once per rotation. The data was then analyzed by comparing gate state (when the photogate beam was obstructed) vs. time. Finally, once both wheels (front being electric and back being gas-powered) were measured, the RPM of each wheel was determined using this formula:
1/(s/revolution)(1 min/60 seconds) = RPM
Figure 17: Gate state vs. time for electric wheel 1/ (19.33 - 18.99) (1 min/60 seconds) = 176.47 RPM
Since the circumference of the wheel is 78.5 in, the theoretical MPH can be determined. This is theoretical, because this experiment was conducted when the bike was suspended, meaning it was not carrying
74 Martin Keyt
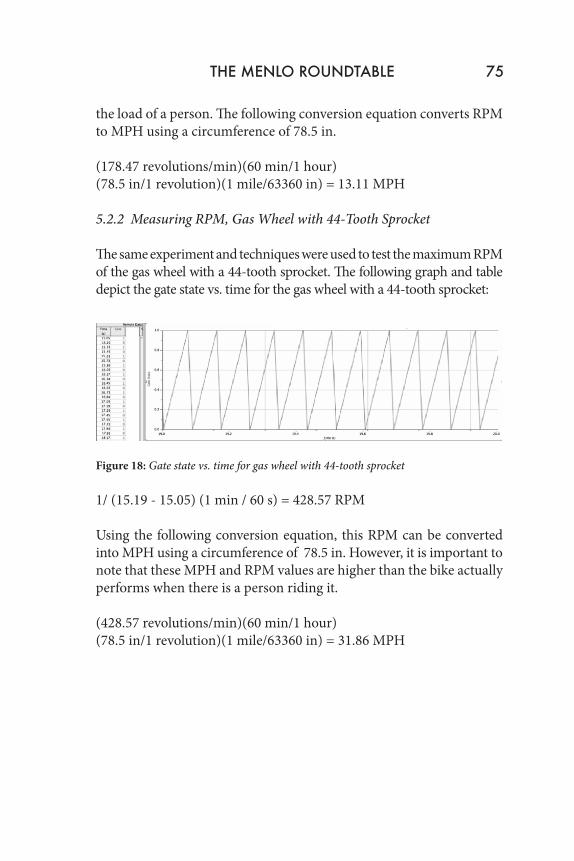
the load of a person. The following conversion equation converts RPM to MPH using a circumference of 78.5 in.
(178.47 revolutions/min)(60 min/1 hour)(78.5 in/1 revolution)(1 mile/63360 in) = 13.11 MPH
5.2.2 Measuring RPM, Gas Wheel with 44-Tooth Sprocket
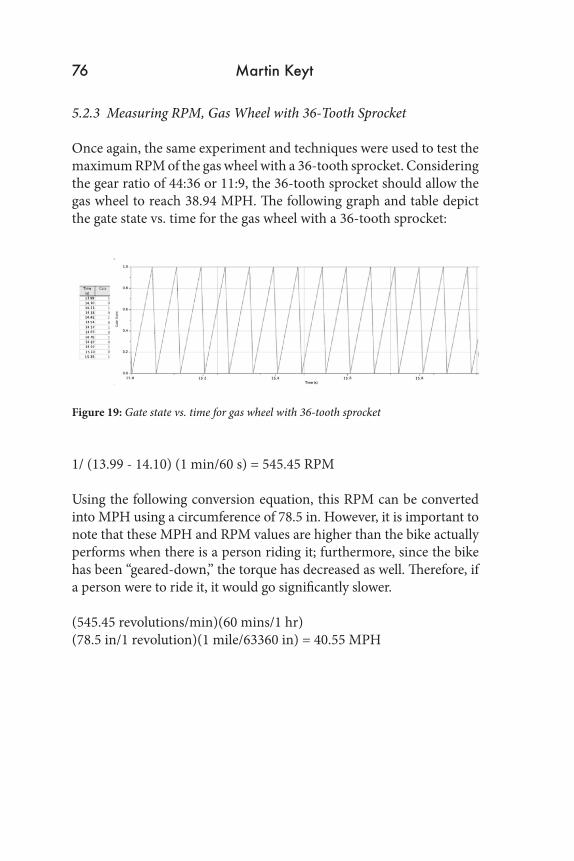
The same experiment and techniques were used to test the maximum RPM of the gas wheel with a 44-tooth sprocket. The following graph and table depict the gate state vs. time for the gas wheel with a 44-tooth sprocket:
Figure 18: Gate state vs. time for gas wheel with 44-tooth sprocket
1/ (15.19 - 15.05) (1 min / 60 s) = 428.57 RPM
Using the following conversion equation, this RPM can be converted into MPH using a circumference of 78.5 in. However, it is important to note that these MPH and RPM values are higher than the bike actually performs when there is a person riding it.
(428.57 revolutions/min)(60 min/1 hour) (78.5 in/1 revolution)(1 mile/63360 in) = 31.86 MPH
THE MENLO ROUNDTABLE 75
5.2.3 Measuring RPM, Gas Wheel with 36-Tooth Sprocket
Once again, the same experiment and techniques were used to test the maximum RPM of the gas wheel with a 36-tooth sprocket. Considering the gear ratio of 44:36 or 11:9, the 36-tooth sprocket should allow the gas wheel to reach 38.94 MPH. The following graph and table depict the gate state vs. time for the gas wheel with a 36-tooth sprocket:
Figure 19: Gate state vs. time for gas wheel with 36-tooth sprocket
1/ (13.99 - 14.10) (1 min/60 s) = 545.45 RPM
Using the following conversion equation, this RPM can be converted into MPH using a circumference of 78.5 in. However, it is important to note that these MPH and RPM values are higher than the bike actually performs when there is a person riding it; furthermore, since the bike has been “geared-down,” the torque has decreased as well. Therefore, if a person were to ride it, it would go significantly slower.
(545.45 revolutions/min)(60 mins/1 hr)(78.5 in/1 revolution)(1 mile/63360 in) = 40.55 MPH
76 Martin Keyt
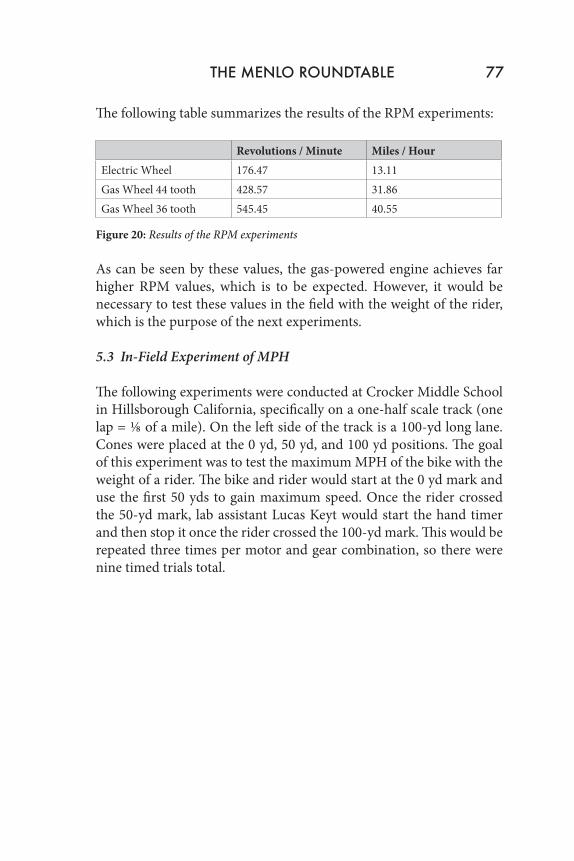
The following table summarizes the results of the RPM experiments:
Revolutions / Minute Miles / HourElectric Wheel 176.47 13.11Gas Wheel 44 tooth 428.57 31.86Gas Wheel 36 tooth 545.45 40.55
Figure 20: Results of the RPM experiments
As can be seen by these values, the gas-powered engine achieves far higher RPM values, which is to be expected. However, it would be necessary to test these values in the field with the weight of the rider, which is the purpose of the next experiments.
5.3 In-Field Experiment of MPH
The following experiments were conducted at Crocker Middle School in Hillsborough California, specifically on a one-half scale track (one lap = 1/8 of a mile). On the left side of the track is a 100-yd long lane. Cones were placed at the 0 yd, 50 yd, and 100 yd positions. The goal of this experiment was to test the maximum MPH of the bike with the weight of a rider. The bike and rider would start at the 0 yd mark and use the first 50 yds to gain maximum speed. Once the rider crossed the 50-yd mark, lab assistant Lucas Keyt would start the hand timer and then stop it once the rider crossed the 100-yd mark. This would be repeated three times per motor and gear combination, so there were nine timed trials total.
THE MENLO ROUNDTABLE 77
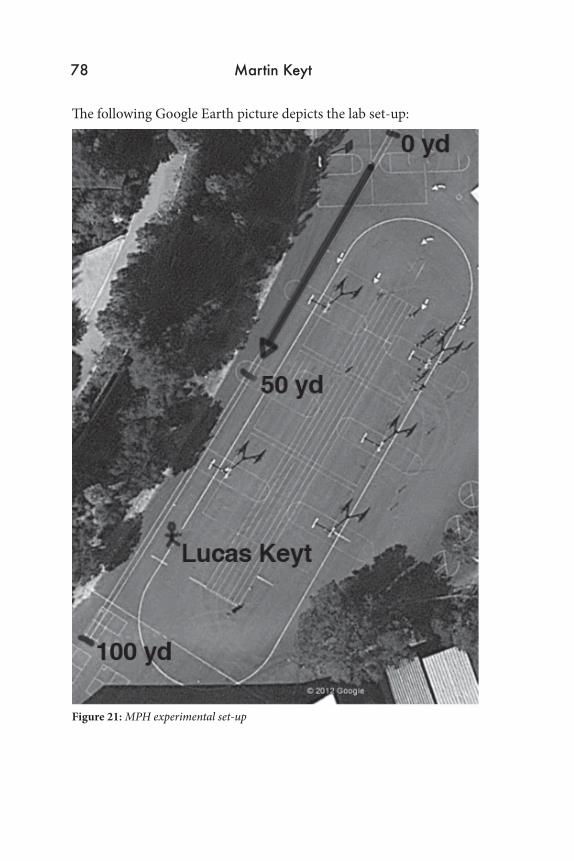
The following Google Earth picture depicts the lab set-up:
Figure 21: MPH experimental set-up
78 Martin Keyt
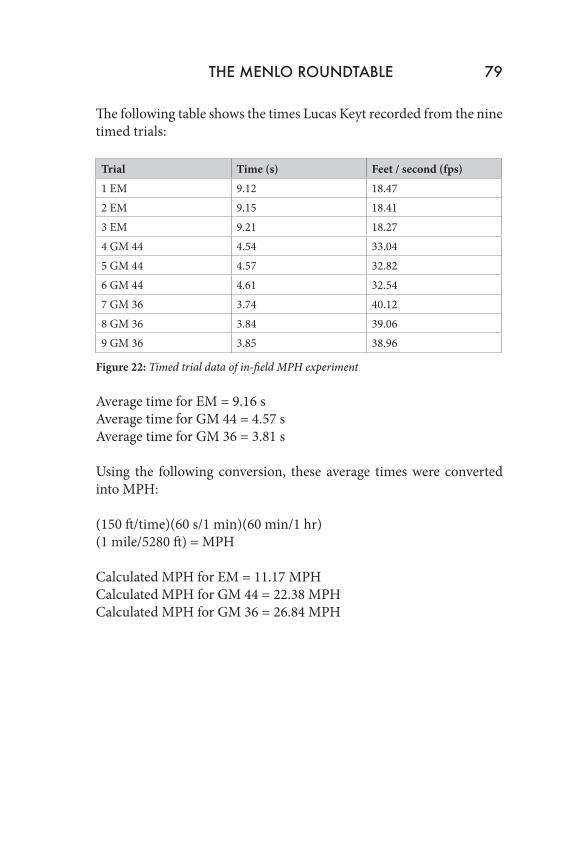
The following table shows the times Lucas Keyt recorded from the nine timed trials:
Trial Time (s) Feet / second (fps) 1 EM 9.12 18.47 2 EM 9.15 18.413 EM 9.21 18.274 GM 44 4.54 33.045 GM 44 4.57 32.826 GM 44 4.61 32.547 GM 36 3.74 40.128 GM 36 3.84 39.069 GM 36 3.85 38.96
Figure 22: Timed trial data of in-field MPH experiment
Average time for EM = 9.16 sAverage time for GM 44 = 4.57 sAverage time for GM 36 = 3.81 s
Using the following conversion, these average times were converted into MPH:
(150 ft/time)(60 s/1 min)(60 min/1 hr) (1 mile/5280 ft) = MPH
Calculated MPH for EM = 11.17 MPHCalculated MPH for GM 44 = 22.38 MPHCalculated MPH for GM 36 = 26.84 MPH
THE MENLO ROUNDTABLE 79
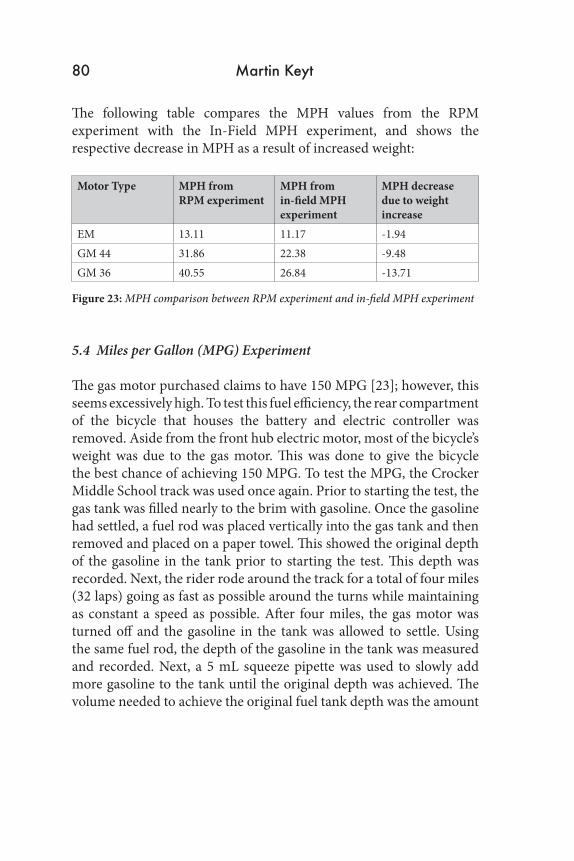
The following table compares the MPH values from the RPM experiment with the In-Field MPH experiment, and shows the respective decrease in MPH as a result of increased weight:
Motor Type MPH from RPM experiment
MPH from in-field MPH experiment
MPH decrease due to weight increase
EM 13.11 11.17 -1.94GM 44 31.86 22.38 -9.48GM 36 40.55 26.84 -13.71
Figure 23: MPH comparison between RPM experiment and in-field MPH experiment
5.4 Miles per Gallon (MPG) Experiment
The gas motor purchased claims to have 150 MPG [23]; however, this seems excessively high. To test this fuel efficiency, the rear compartment of the bicycle that houses the battery and electric controller was removed. Aside from the front hub electric motor, most of the bicycle’s weight was due to the gas motor. This was done to give the bicycle the best chance of achieving 150 MPG. To test the MPG, the Crocker Middle School track was used once again. Prior to starting the test, the gas tank was filled nearly to the brim with gasoline. Once the gasoline had settled, a fuel rod was placed vertically into the gas tank and then removed and placed on a paper towel. This showed the original depth of the gasoline in the tank prior to starting the test. This depth was recorded. Next, the rider rode around the track for a total of four miles (32 laps) going as fast as possible around the turns while maintaining as constant a speed as possible. After four miles, the gas motor was turned off and the gasoline in the tank was allowed to settle. Using the same fuel rod, the depth of the gasoline in the tank was measured and recorded. Next, a 5 mL squeeze pipette was used to slowly add more gasoline to the tank until the original depth was achieved. The volume needed to achieve the original fuel tank depth was the amount
80 Martin Keyt
of gasoline consumed during the four miles. This ratio would then be expanded to determine the experimental MPG. The 44-tooth sprocket was used to perform this test.
Original depth of gasoline prior to riding four miles: 6.2 cmDepth of gasoline after riding four miles: 5.8 cmAmount of gasoline added to achieve a depth of 6.2 cm: 160 mL
Using the following conversion, 1 gallon = 3785.41178 mL, the experimental MPG can be determined using a proportion:
160 mL = 0.042268 gallon
4 miles / 0.042268 gallon = x miles / 1 gallonx = 94.64 miles
The experimental miles per gallon = 94.64 MPG
This is only about 60% as fuel efficient as advertised; however, 95 MPG is still quite fuel-efficient. Considering how long this experiment took (several hours to complete including set-up/clean-up), an additional trial using the 36-tooth sprocket could not be conducted. It is likely that the MPG would increase using the smaller sprocket; however, it is not likely to achieve 150 MPG. Furthermore, an interesting experiment would be to mimic the techniques used, but instead use the 36-tooth sprocket and the electric motor at the same time. In other words, both motors would be operating at the same time during this trial.
5.5 Static Torque Experiment
The static torque demonstrates the initial force that the motor exerts over the distance between the center of the object and the object being rotated (in this case the radius of the wheel’s axel). Since the radius of each axel was measured with a caliper, the only other measurement needed was the force that the motor initially exerts. This was obtained
THE MENLO ROUNDTABLE 81
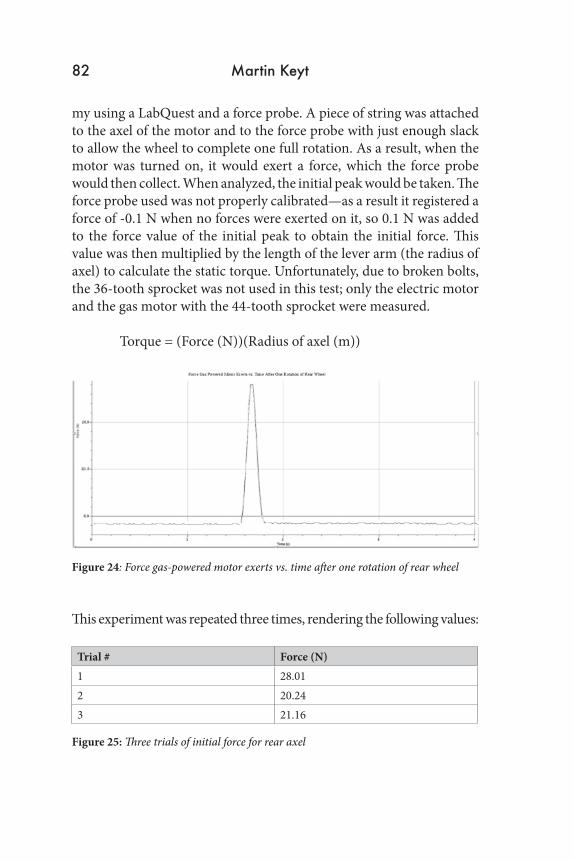
my using a LabQuest and a force probe. A piece of string was attached to the axel of the motor and to the force probe with just enough slack to allow the wheel to complete one full rotation. As a result, when the motor was turned on, it would exert a force, which the force probe would then collect. When analyzed, the initial peak would be taken. The force probe used was not properly calibrated—as a result it registered a force of -0.1 N when no forces were exerted on it, so 0.1 N was added to the force value of the initial peak to obtain the initial force. This value was then multiplied by the length of the lever arm (the radius of axel) to calculate the static torque. Unfortunately, due to broken bolts, the 36-tooth sprocket was not used in this test; only the electric motor and the gas motor with the 44-tooth sprocket were measured.
Torque = (Force (N))(Radius of axel (m))
Figure 24: Force gas-powered motor exerts vs. time after one rotation of rear wheel
This experiment was repeated three times, rendering the following values:
Trial # Force (N)1 28.012 20.243 21.16
Figure 25: Three trials of initial force for rear axel
82 Martin Keyt
These values were then averaged to render the result: 23.14 NTorque = (Force (N))(Radius of axel (m))
(23.14 N)(0.0325 m) = 0.75205 Nm for gas motor
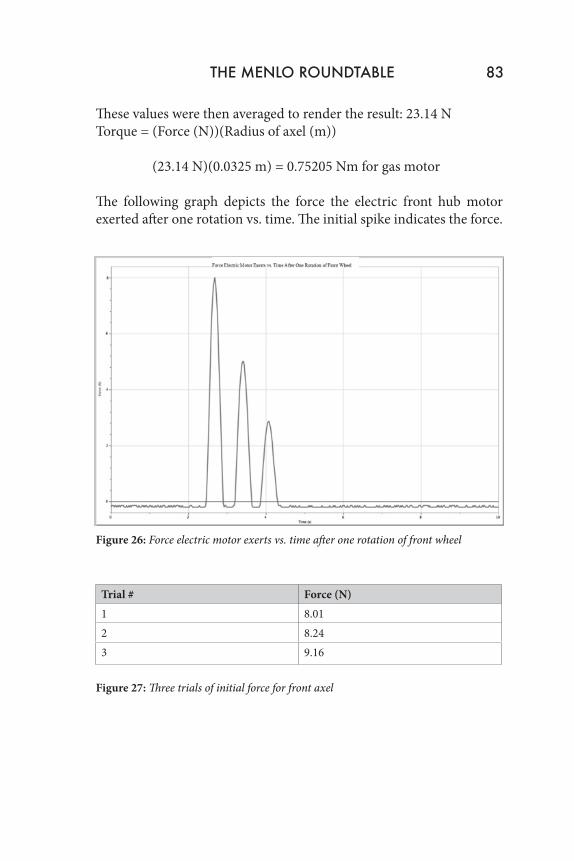
The following graph depicts the force the electric front hub motor exerted after one rotation vs. time. The initial spike indicates the force.
Figure 26: Force electric motor exerts vs. time after one rotation of front wheel
Trial # Force (N)1 8.012 8.243 9.16
Figure 27: Three trials of initial force for front axel
THE MENLO ROUNDTABLE 83
These values were then averaged to render the result: 8.47 NTorque = (Force (N))(Radius of axel (m))
(8.47 N)(0.0325 m) = 0.27528 Nm for electric motor
6 History
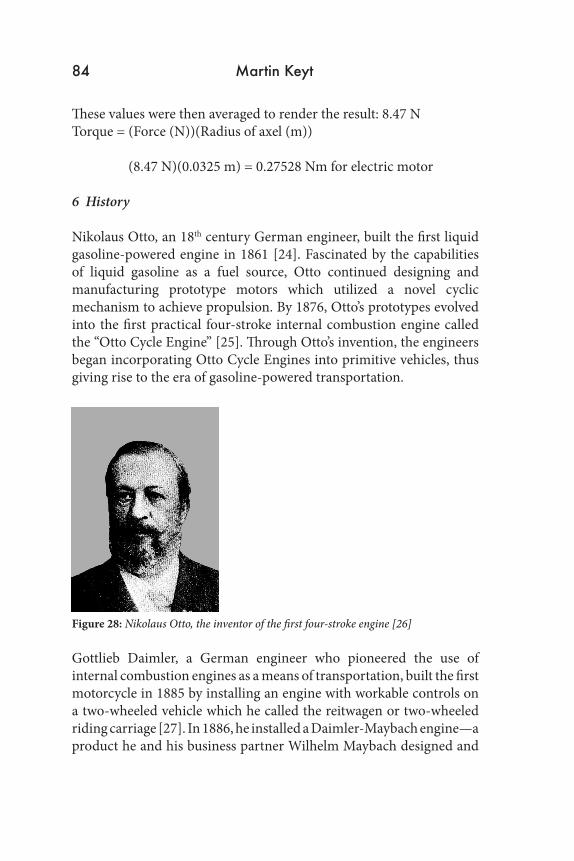
Nikolaus Otto, an 18th century German engineer, built the first liquid gasoline-powered engine in 1861 [24]. Fascinated by the capabilities of liquid gasoline as a fuel source, Otto continued designing and manufacturing prototype motors which utilized a novel cyclic mechanism to achieve propulsion. By 1876, Otto’s prototypes evolved into the first practical four-stroke internal combustion engine called the “Otto Cycle Engine” [25]. Through Otto’s invention, the engineers began incorporating Otto Cycle Engines into primitive vehicles, thus giving rise to the era of gasoline-powered transportation.
Figure 28: Nikolaus Otto, the inventor of the first four-stroke engine [26]
Gottlieb Daimler, a German engineer who pioneered the use of internal combustion engines as a means of transportation, built the first motorcycle in 1885 by installing an engine with workable controls on a two-wheeled vehicle which he called the reitwagen or two-wheeled riding carriage [27]. In 1886, he installed a Daimler-Maybach engine—a product he and his business partner Wilhelm Maybach designed and
84 Martin Keyt
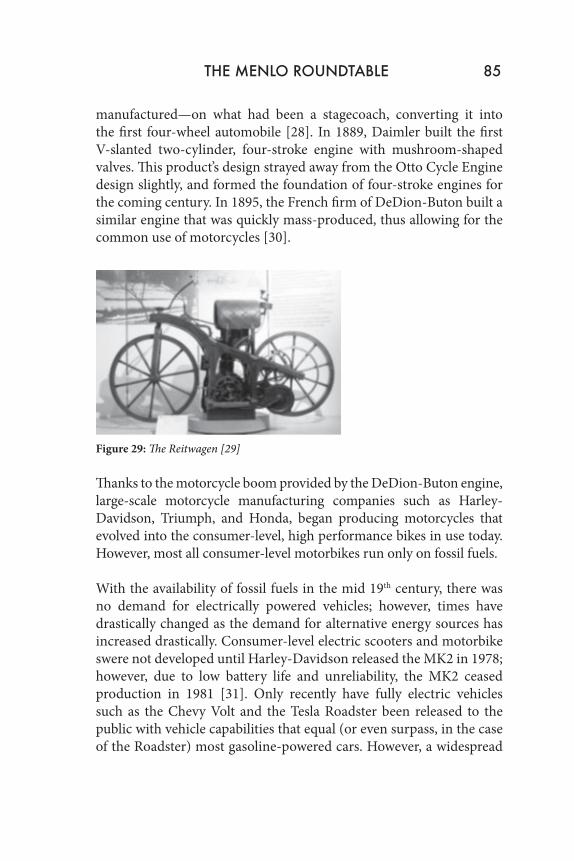
manufactured—on what had been a stagecoach, converting it into the first four-wheel automobile [28]. In 1889, Daimler built the first V-slanted two-cylinder, four-stroke engine with mushroom-shaped valves. This product’s design strayed away from the Otto Cycle Engine design slightly, and formed the foundation of four-stroke engines for the coming century. In 1895, the French firm of DeDion-Buton built a similar engine that was quickly mass-produced, thus allowing for the common use of motorcycles [30].
Figure 29: The Reitwagen [29]
Thanks to the motorcycle boom provided by the DeDion-Buton engine, large-scale motorcycle manufacturing companies such as Harley-Davidson, Triumph, and Honda, began producing motorcycles that evolved into the consumer-level, high performance bikes in use today. However, most all consumer-level motorbikes run only on fossil fuels.
With the availability of fossil fuels in the mid 19th century, there was no demand for electrically powered vehicles; however, times have drastically changed as the demand for alternative energy sources has increased drastically. Consumer-level electric scooters and motorbike swere not developed until Harley-Davidson released the MK2 in 1978; however, due to low battery life and unreliability, the MK2 ceased production in 1981 [31]. Only recently have fully electric vehicles such as the Chevy Volt and the Tesla Roadster been released to the public with vehicle capabilities that equal (or even surpass, in the case of the Roadster) most gasoline-powered cars. However, a widespread
THE MENLO ROUNDTABLE 85
movement towards electric vehicles will require further engineering, which is where hybrid motorbikes play a pertinent role. When it comes to fuel efficiency, very few vehicles achieve as high an MPG rate as motorcycles. Furthermore, the relatively lightweight frame of a motorcycle enables electric motors to operate without excessively draining batteries. In tandem, these two motor options will allow for an economical, effective, and fun way to travel. The future of motor vehicles is in fact electrically powered motors; however, the near future is hybrids.
7 Citations
[1] Edgar Snyder, Motorcycle Accident Statistics, Edgar Snyder & Associates, January 2011.
[2] Prasanth Veerina, Regenerative Braking System for an Electric Bicycle, Menlo School Round Table, November 2010.
[3] Elizabeth Williamson, Funds Flow to Electric Cars, The Wall Street Journal, August 6, 2009.
[4] Tesla Motors Official Website.
[5] Ibid.
[6] February 2011 Dashboard: Hybrid Sale Outpace Growing Auto Market, HybridCars, March 2, 2011.
[7] Ibid.
[8] HyperPhysics Heat Engines, Georgia State University, July 2009.
[9] Ibid.
[10] W.R. Salzman, Heat Engines and the Carnot Cycle, Arizona State University, November 5, 2004.
86 Martin Keyt
[11] Ibid.
[12] The Carnot Cycle, Thinkquest.org, January 2000.
[13] Ibid.
[14] Ibid.
[15] The Four-Stroke Engine, Harley-Davidson Museum Online, December 2009.
[16] Ibid.
[17] Stages of a Four-Stroke Internal Combustion Engine, National Aeronautics and Space Administration, July 11, 2008.
[18] Ed Lansinger, Horsepower vs Torque, AllPar.com, July 2011.
[19] Horsepower and Torque: A Practical Explanation, Car Explanations, December 2010.
[20] Fuels with High Octane Ratings, HubPages, February 10, 2012.
[21] Ibid.
[22] Fuel Flash Point, The Engineering ToolBox, March 12, 2008.
[23] 5 HP 4 Stroke Pull Start 48 cc Engine, Moped Parts and Engines, August 24, 2011.
[24] Nikolaus Otto: History of Cars, About.com/Inventors, March 2009.
[25] The Otto Engine, Start Your Engines, May 2010.
[26] Ibid.
THE MENLO ROUNDTABLE 87
[27] Gottlieb Daimler, Spartacus Educational, January 12, 2011.
[28] Ibid.
[29] Ibid.
[30] World’s Oldest Running Car: 1884 De Dion Bouton Et Trepardoux, San Francisco Chronicle, October 10, 2011.
[31] Electric Motorcycle and Scooters: History, Electric Vehicles News, May 2009.
88 Martin Keyt