Embed Size (px)
Citation preview
Ecological Applications, 17(4), 2007, pp. 1156–1167� 2007 by the Ecological Society of America
TSUGA CANADENSIS (L.) CARR. MORTALITY WILL IMPACTHYDROLOGIC PROCESSES IN SOUTHERN APPALACHIAN
FOREST ECOSYSTEMS
CHELCY R. FORD1
AND JAMES M. VOSE
USDA FS SRS Coweeta Hydrologic Lab, Otto, North Carolina 28763 USA
Abstract. Eastern hemlock (Tsuga canadensis (L.) Carr.) is one of the principal riparianand cove canopy species in the southern Appalachian Mountains. Throughout its range,eastern hemlock is facing potential widespread mortality from the hemlock woolly adelgid(HWA). If HWA-induced eastern hemlock mortality alters hydrologic function, landmanagers will be challenged to develop management strategies that restore function ormitigate impacts. To estimate the impact that the loss of this forest species will have on thehydrologic budget, we quantified and modeled transpiration over a range of tree sizes andenvironmental conditions. We used heat dissipation probes, leaf-level gas-exchangemeasurements, allometric scaling, and time series modeling techniques to quantify whole-tree and leaf-level transpiration (EL) of eastern hemlock. We monitored trees ranging from 9.5to 67.5 cm in diameter along a riparian corridor in western North Carolina, USA during 2004and 2005.
Maximum rates of daily tree water use varied by diameter and height, with large treestranspiring a maximum of 178–186 kg H2O�tree�1�d�1. Values of EL could be predicted fromcurrent and lagged environmental variables. We forecasted eastern hemlock EL for inventoriedstands and estimated a mean annual transpiration rate of 63.3 mm/yr for the hemlockcomponent, with 50% being transpired in the winter and spring. In typical southernAppalachian stands, eastern hemlock mortality would thus reduce annual stand-leveltranspiration by ;10% and reduce winter and spring stand-level transpiration by ;30%.
Eastern hemlock in the southern Appalachians has two distinct ecohydrological roles: anevergreen tree that maintains year-round transpiration rates and a riparian tree that has hightranspiration rates in the spring. No other native evergreen in the southern Appalachians willlikely fill the ecohydrological role of eastern hemlock if widespread mortality occurs. With theloss of this species, we predict persistent increases in discharge, decreases in the diurnalamplitude of streamflow, and increases in the width of the variable source area.
Key words: Appalachian Mountains; conductance; eastern hemlock; hemlock woolly adelgid (HWA);hydrology; sap flux; scaling; time-series; transpiration; Tsuga canadensis (L.) Carr.; water relations; wateruse.
INTRODUCTION
Individual tree species can exert enormous control on
forest transpiration and interception rates, and on the
intra-annual dynamics of these two processes (see Bosch
and Hewlett 1982, Swank et al. 1988, Pataki and Oren
2003, Moore et al. 2004, Ewers et al. 2005). Mechanis-
tically, differences in transpiration rates among species
arise from both structural and physiological adapta-
tions, such as leaf habit and phenology (Oren and Pataki
2001), stomatal and leaf hydraulic conductance (Sack
and Tyree 2005), stomatal sensitivity to vapor pressure
deficit (Oren et al. 1999), and differences in sapwood
area and leaf area (Wullschleger et al. 1998, Meinzer et
al. 2005). Ecologically, the spatial location of individual
species can also influence the magnitude and dynamics
of the hydrologic budget. For example, species that
predominately grow in areas with stable access to water
may potentially transpire longer or at greater rates
compared to species without access to stable water
sources (Dawson 1993). Thus, on short and long
temporal scales, the loss of a single forest tree species
from a catchment or landscape can impact the
hydrologic budget. Furthermore, depending on the
ecology and physiology of the extirpated species, the
magnitude of impact on the hydrologic budget will vary.
Many eastern North American forest tree species have
been eliminated or reduced in dominance as a result of
insect and pathogen outbreaks (Allison et al. 1986,
Ellison et al. 2005). Although the functional loss of
forest species has occurred several times in the past, the
impact of their respective losses on the hydrologic cycle
is unknown. At present, Tsuga canadensis (L.) Carr.,
eastern hemlock trees, are declining and facing potential
extirpation throughout their range because of an
introduced insect, the hemlock woolly adelgid (HWA;
Manuscript received 9 January 2006; revised 4 August 2006;accepted 26 October 2006. Corresponding Editor: D. D.Breshears.
1 E-mail: [email protected]
1156
Adelges tsugae Annand). Although the present infesta-
tion ranges from Maine to Georgia and west to
Tennessee, the rate of HWA dispersal and tree decline
is most pronounced at the southern extent due to the
non-lethal winter temperatures on HWA populations
(Skinner et al. 2003). Thus, forests in the southern extent
of eastern hemlock’s range will likely experience the first
hydrologic consequences resulting from its potential
decline. In addition, eastern hemlock is one of the
principal riparian and cove canopy species in the
southern Appalachian Mountains and commonly the
only evergreen canopy species in mesic sites (Brown
2004; K. Elliott, unpublished data). Thus, it is likely an
important species in terms of direct and indirect effects
on hydrologic processes. To our knowledge, reported
rates of eastern hemlock water use and transpiration do
not exist for the southern Appalachians; however, sap
flow and stomatal conductance rates for eastern
hemlock in the northeast (which occur not only in
riparian areas, but also as almost pure stands across the
landscape) are reported to be ,20% of co-occurring
dominant hardwood species (Catovsky et al. 2002). Due
to the distribution of hemlock, and thus the likely
differences in water availability between the northern
and southern extents of the species range, these reported
rates may underestimate the impact that eastern
hemlock mortality could have on the hydrologic budget
in southern Appalachian ecosystems.
We have a unique opportunity to document the
ecological role of eastern hemlock on hydrologic
processes prior to large-scale HWA-induced mortality
and to use this information to predict the consequences
its loss may have on future hydrologic-cycling processes.
If HWA-induced mortality alters hydrologic function,
land managers will be challenged to develop manage-
ment strategies that restore hydrologic function or
mitigate impacts. In this study, we focused specifically
on the transpiration component of the hydrologic cycle,
as this component alone constitutes 30–40% of the water
budget in southern Appalachian systems (Swift et al.
1975). Working in typical habitat at the southern limit of
this species’ range, our goals were (1) to evaluate whole-
tree transpiration over a range of tree sizes and
environmental conditions and describe the temporal
dynamics, (2) to develop an empirical model of
transpiration per unit leaf area over time, and because
an initial consequence of infestation appears to be a shift
in the proportion of young to old foliage (Stadler et al.
2005), our last goal was (3) to evaluate differences in
stomatal conductance between young and old foliage
age classes. The purpose of objective three was to
determine if changes in leaf area of different age classes,
rather than a uniform decrease in all leaf area of all age
classes, would have an impact on whole-tree transpira-
tion, and thus the model developed in objective two. We
conclude with a discussion of the potential impact of
loosing this species on the hydrology of the system.
METHODS
Study site
The study site was located in the riparian corridor
(;700 m above sea level) along Shope Fork, a third-
order stream draining the Coweeta Basin in the
Nantahala Mountain Range of western North Carolina,
USA. Species composition in riparian corridors and
mesic coves in this area is dominated by eastern hemlock
(50% of the basal area); rosebay rhododendron (Rhodo-
dendron maximum L. [an ericaceous woody shrub], 2000
stems/ha, 5% of the basal area); and sweet birch (Betula
lenta L., 5% of the basal area; Brown 2004). The
remaining 40% of basal area is composed of various
hardwood species, including Quercus spp., Carya spp.,
Nyssa sylvatica, and Liriodendron tulipifera; however,
their frequency and density are not consistent in these
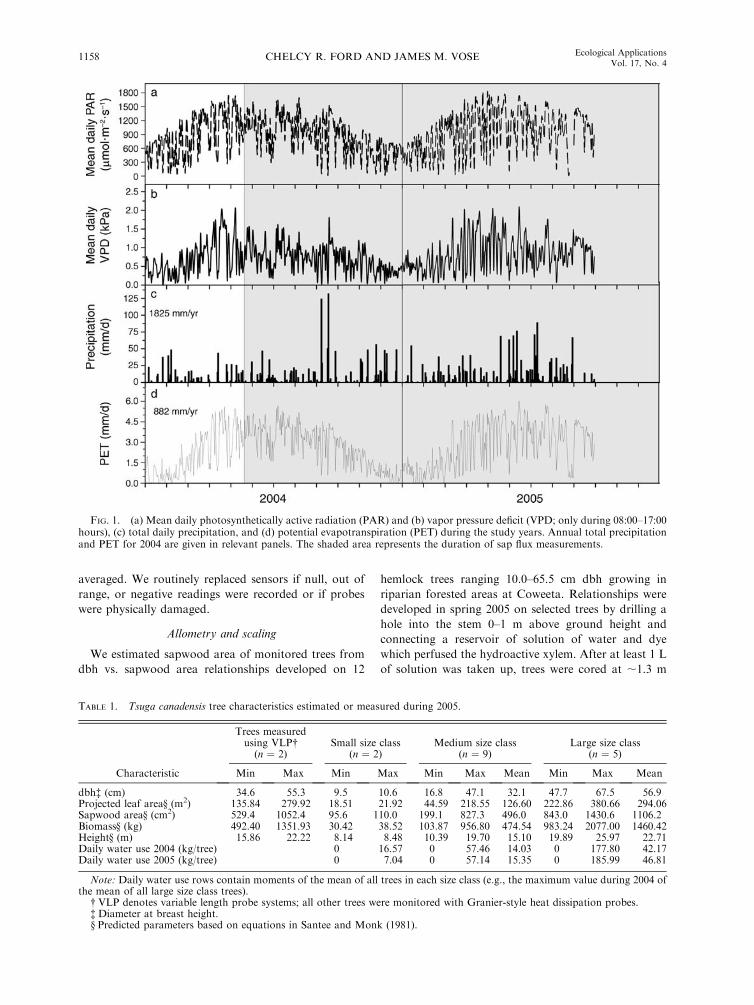
areas. Climate in the Coweeta Basin is classified as
marine humid temperate (Swift et al. 1988). Average
annual precipitation on the valley floor of the basin is
1821 mm, and mean annual temperature is 12.68C (Swift
et al. 1988). Climatic conditions during the period of
study are shown in Fig. 1.
Sap flux measurements
We monitored sap flux density on 16 trees between
April 2004 and November 2005 (Table 1). We installed
thermal dissipation probes (Granier 1985) to determine
sap flux density of the outer 2 or 3 cm of the functional
xylem. Based on increment cores taken from adjacent
trees, 3 cm length probes were needed to cover at least
30% of the sapwood depth in trees larger than 45 cm
diameter at breast height (dbh). Thus, for trees with a dbh
(measured ;1.3 m above the ground) up to 45 cm, we
installed 2 cm probes; and for trees larger than 45 cm, we
installed 3-cm probes. For each tree monitored, two sets
of sap flux density probes were installed circumferentially
at least 908 apart. Granier-style sap flux density sensors
(Granier 1985) consisted of one upper heated probe and
one lower reference probe, each containing one thermo-
couple junction suspended in the shaft at the midpoint
(i.e., 1 cm and 1.5 cm). In each sample tree, at ;1.3 m
height, we drilled two parallel holes separated vertically
by 5 cm, but not separated horizontally. We removed
enough bark and cambium around the holes to insert the
sensors entirely into the xylem. Probes were coated with
thermally-conductive silicone grease before placement in
the trees. Areas around the probe insertion points were
protected with foam blocks, and the tree stem was
wrapped 3608 with reflective insulation (Reflectix, Mar-
kleville, Indiana, USA) to shield probes from solar
radiation, thermal gradients, and rainfall.
Dataloggers queried the sensors every 30 s and logged
15-min means (Model CR10X, Campbell Scientific,
Logan, Utah, USA). The temperature difference be-
tween the upper and lower probes was converted to sap
flux density using the equation of Granier (1985). For all
trees, readings for the two replicate sets of sensors were
June 2007 1157ECOHYDROLOGY OF EASTERN HEMLOCK
averaged. We routinely replaced sensors if null, out of
range, or negative readings were recorded or if probes
were physically damaged.
Allometry and scaling
We estimated sapwood area of monitored trees from
dbh vs. sapwood area relationships developed on 12
hemlock trees ranging 10.0–65.5 cm dbh growing in
riparian forested areas at Coweeta. Relationships were
developed in spring 2005 on selected trees by drilling a
hole into the stem 0–1 m above ground height and
connecting a reservoir of solution of water and dye
which perfused the hydroactive xylem. After at least 1 L
of solution was taken up, trees were cored at ;1.3 m
TABLE 1. Tsuga canadensis tree characteristics estimated or measured during 2005.
Characteristic
Trees measuredusing VLP�(n ¼ 2)
Small size class(n ¼ 2)
Medium size class(n ¼ 9)
Large size class(n ¼ 5)
Min Max Min Max Min Max Mean Min Max Mean
dbh� (cm) 34.6 55.3 9.5 10.6 16.8 47.1 32.1 47.7 67.5 56.9Projected leaf area§ (m2) 135.84 279.92 18.51 21.92 44.59 218.55 126.60 222.86 380.66 294.06Sapwood area§ (cm2) 529.4 1052.4 95.6 110.0 199.1 827.3 496.0 843.0 1430.6 1106.2Biomass§ (kg) 492.40 1351.93 30.42 38.52 103.87 956.80 474.54 983.24 2077.00 1460.42Height§ (m) 15.86 22.22 8.14 8.48 10.39 19.70 15.10 19.89 25.97 22.71Daily water use 2004 (kg/tree) 0 16.57 0 57.46 14.03 0 177.80 42.17Daily water use 2005 (kg/tree) 0 7.04 0 57.14 15.35 0 185.99 46.81
Note: Daily water use rows contain moments of the mean of all trees in each size class (e.g., the maximum value during 2004 ofthe mean of all large size class trees).
� VLP denotes variable length probe systems; all other trees were monitored with Granier-style heat dissipation probes.� Diameter at breast height.§ Predicted parameters based on equations in Santee and Monk (1981).
FIG. 1. (a) Mean daily photosynthetically active radiation (PAR) and (b) vapor pressure deficit (VPD; only during 08:00–17:00hours), (c) total daily precipitation, and (d) potential evapotranspiration (PET) during the study years. Annual total precipitationand PET for 2004 are given in relevant panels. The shaded area represents the duration of sap flux measurements.
CHELCY R. FORD AND JAMES M. VOSE1158 Ecological ApplicationsVol. 17, No. 4
height (above the perfusion point), and the sapwood
radius was measured as the radial length of dyed xylem.
From these data, both heartwood, and heartwood and
sapwood radii could be predicted as a function of over-
bark dbh (r2 ¼ 0.97, P , 0.01). Over-bark dbh was
recorded for all measured trees in the winter of 2004 and
2005.
To scale sap flux density measurements made in the
outer 2 or 3 cm of sapwood to whole-tree sap flow (i.e.,
sapwood radius was longer than probe depth in all
trees), we developed a general radial profile determined
on two trees in a similar site along Shope Fork using
variable length sap flux probes (VLP) and heating
circuits constructed according to James et al. (2001). The
diameter range of the VLP trees monitored encompassed
the 45–90th percentile size class range of the trees being
measured with the 2- and 3-cm Granier-style probes
(Table 1). Up to eight sets of variable length probes were
inserted into the xylem of these trees as described above,
spiraling around the trees to minimize interference.
Probes were inserted at 1 cm depth intervals and were
assumed to measure sap flux density in discrete depths
(e.g., 0–1, 1–2, . . . , 7–8 cm). Sap flux density and sap-
wood area measurements were made on these trees
during June 2005 as described above. We scaled sap flux
density (v, g H2O�m�2 sapwood�s�1) to sap flow (F, g
H2O�s�1) by assuming that v measured by each probe
corresponded to that occurring in discrete sapwood
annuli (Hatton et al. 1990). From the radial profiles of F
(i.e., F as a function of increasing depth into the xylem
from the cambium), we developed a relationship
between F in the outer sapwood, 0–2 cm or 0–3 cm
below the cambium and F at all other radial depths. We
did this by setting F in the outer sapwood equal to 1
(representing maximum flows) and calculating F in all
other depths as a fraction of that occurring in the outer
sapwood using only a subset of the data (Fig. 2). Using
this relationship combined with estimated sapwood area
and sap flow calculated for the outer sapwood on the 16
trees, we estimated sap flow for the remaining sapwood
area and summed F for all depths to scale to the entire
tree. We calculated EL, transpiration per unit projected
leaf area (mmol H2O�m�2�s�1) by dividing F by the
projected leaf area estimated for each tree (Table 1).
Leaf area for all 16 trees was estimated using allometric
equations developed on 10 T. canadensis trees at
Coweeta spanning a range of dbh up to 26 cm during
1970 (Santee 1978, Santee and Monk 1981) and three
large trees (37.7–57.1 cm dbh) from riparian areas in the
Coweeta Basin harvested in late summer 2005. Equa-
tions predicted projected leaf area from dbh (log leaf
area [m2]¼ 1.54196[log dbh (cm)] � 0.27440; R2¼ 0.95;
correction factor¼ 1.082; Sprugel 1983; B. D. Kloeppel
et al., unpublished data).
Climate data
An open-field climate station (CS01), located ;1 km
away from the site, measured the following variables
every 1 min and logged 15- and 60-min means: air
temperature (T) and relative humidity (RH; temperature
and relative humidity sensor model HMP45C, Campbell
Scientific, Logan, Utah, USA), wind speed and direction
(Met One 014A anemometer, Campbell Scientific), and
global radiation (W/m2, pyranometer model 8-48,
Eppley Lab, Newport, Rhode Island, USA). From
ambient T, saturation vapor pressure (es) was calculated
according to Lowe (1977). Actual vapor pressure (ea)
was calculated from fractional RH and es. Air vapor
pressure deficit (VPD) was calculated as the difference
between es and ea. We also estimated photosynthetically
active radiation (PAR, lmoles�m�2�s�1) from global
radiation by assuming that 50% was in the 400–700 nm
wavelength (Landsberg and Waring 1997) and used the
conversion factor of 4.608 lmol quanta/J (Campbell and
Norman 1998). From daytime mean T and RH and total
daily global radiation, we calculated daily potential
evapotranspiration (PET) according to the Turc equa-
tion (Fig. 1; see Lu et al. 2005).
Leaf gas exchange measurements
Leaf gas exchange measurements were made on two
age classes of fully expanded needles on five saplings in
the field in 2005. We compared the youngest (i.e.,
current year) vs. the oldest foliage age class (i.e., 4-yr-
old) to maximize our ability to detect age–class related
differences in leaf gas exchange. We determined foliage
age class by branching pattern and visually inspecting
nodes between flushes. Prior to measurements in the
summer of 2005, saplings were sprayed twice with a 2%
(volume/volume) insecticidal soap solution to prevent
HWA infestation. At the time of the gas exchange
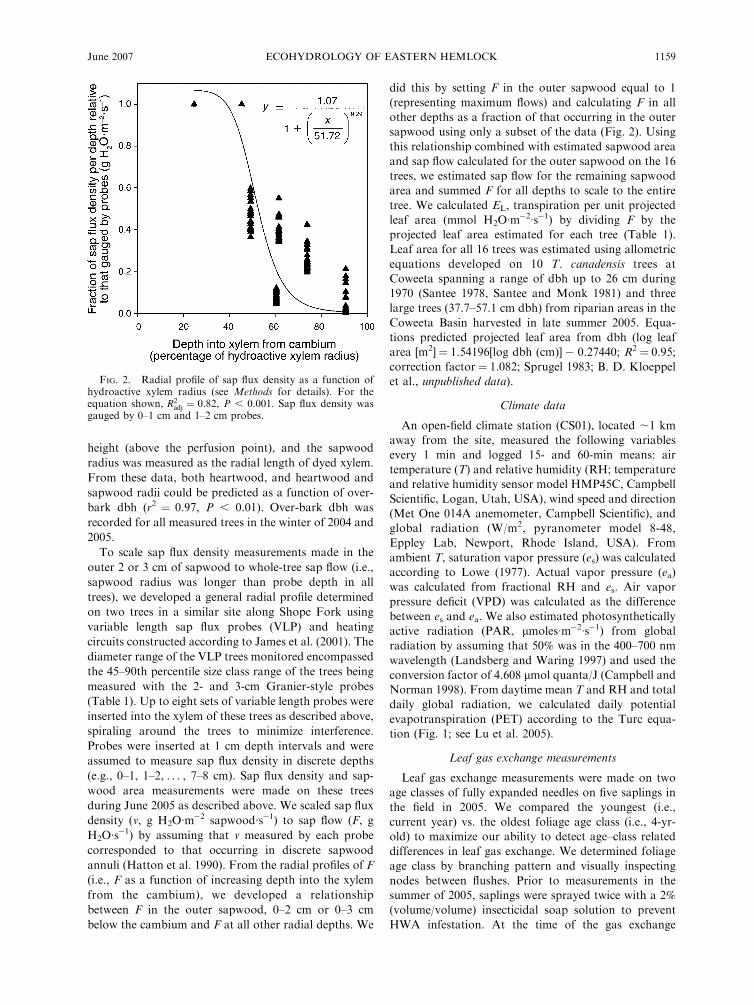
FIG. 2. Radial profile of sap flux density as a function ofhydroactive xylem radius (see Methods for details). For theequation shown, R2
adj ¼ 0.82, P , 0.001. Sap flux density wasgauged by 0–1 cm and 1–2 cm probes.
June 2007 1159ECOHYDROLOGY OF EASTERN HEMLOCK
measurements, no visible HWA infestation was appar-
ent. All measurements were conducted from 09:00 to
15:00 hours and were randomized among saplings and
cohorts to account for diurnal variation. We measured
stomatal conductance to water vapor and photosynthe-
sis with an open-system infrared gas analyzer (LICOR
6400, LICOR, Lincoln, Nebraska, USA) using a red–
blue light source. Chamber conditions were set to
ambient temperature, VPD, and CO2 concentration,
whereas a constant PAR level of 100 lmol�m�2�s�1 wasset. This PAR level was near ambient for all days and
times due to the shaded understory environment, but a
constant PAR inside the chamber was used to eliminate
variance.
We tested for differences in stomatal conductance to
water vapor between age classes using the response
variable gs ref (Oren et al. 1999, Ewers et al. 2001), which
is stomatal conductance to water vapor at a reference
vapor pressure deficit (VPD ¼ 1 kPa). For this test, we
used a paired t test with each seedling as the replicate.
We also tested for differences in photosynthetic rate (A)
at a reference PAR level (100 lmol CO2�m�2�s�1) and for
differences in water-use efficiency (WUE ¼ A/EL). For
response variables A and WUE, we used a single-factor,
blocked experimental design with each seedling as the
blocking factor (random effect) and cohort as the single
factor (fixed effect with two levels). A blocking factor
was used because leaf cohorts on each seedling were not
independent. All statistical tests were done at the a ¼0.05 level using PROC ANOVA and TTEST in SAS
software (version 9, SAS Institute, Cary, North Caro-
lina, USA).
Modeling
We used autoregressive integrative moving average
(ARIMA) time series modeling to build a model
predicting daytime (defined as 05:15–20:00 hours)
instantaneous transpiration rates EL (mmol�m�2�s�1)from the environmental variables recorded at the
open-field weather station (see Ford et al. 2005 for
details). We used 3299 data points on a 15-min time step
spanning 55 days (days of year 165–228) in 2005 to
parameterize the model. Model selection was based on
the weighted Akaike’s Information Criterion (AIC). The
AIC provides an estimate of the expected relative
distance between the fitted model and the underlying
process which generated the observations (Burnham and
Anderson 2002). When multiple candidate models are
constructed, each with an AIC, the weighted AIC is a
ranking of each candidate model post hoc that provides
evidence of the best model given the set of candidate
models. To validate the model, we used an independent
data subset of 2600 data points on a 15-min time step
spanning 43 days (days of year 229–291) in 2005. One
model was constructed for each size class using PROC
ARIMA in SAS software. All EL and climate data series
were stationary after differencing by a period of 1; a
stationary series is one in which the mean, variance, and
autocorrelation structures do not change over time.
We applied daily versions of these models to five
riparian stands, each 20 3 40 m in area, throughout the
basin for 2004. These stands represented typical riparian
and cove habitat; in them, eastern hemlock frequency
ranged from 25% to 78% and density ranged from 250 to
1038 stems/ha (K. Elliott and J. Vose, unpublished data).
From mensurational data in these plots (e.g., dbh), we
used time series model transpiration for the correspond-
ing size class for each tree and climate data from the
closest colocated meteorological stations in the basin
(CS01 or climate station 17; the latter also measured T,
RH, wind speed, and PAR (quantum sensor, model LI-
190SA, LICOR, Lincoln, Nebraska, USA). We summed
the output from this analysis over time, converted
millimoles of H2O to cubic meters of H2O and then
multiplied this by the ratio of estimated leaf area for the
tree from allometric equations to the ground area of the
plot. Resulting units were in millimeters per year. We
compared the magnitude of hemlock annual and
seasonal modeled transpiration in these stands to known
annual and seasonal transpiration rates in the basin
(specifically watershed 18) and estimated the decrease in
transpiration with the loss of eastern hemlock (without
replacement).
RESULTS
As with most trees with tracheid xylem anatomy, the
radial profile of sap flux density in hemlock decreased
with increasing depth into the xylem from the cambium
(Fig. 2). The highest fluxes occurred in the outer 30% of
the hydroactive xylem radius. Only 40% of the
maximum sap flux rate occurred in the area occupying
50–75% of the hydroactive xylem radius. Approximately
20% or less of the maximum sap flux rate occurred in the
area occupying the rest of the hydroactive xylem radius.
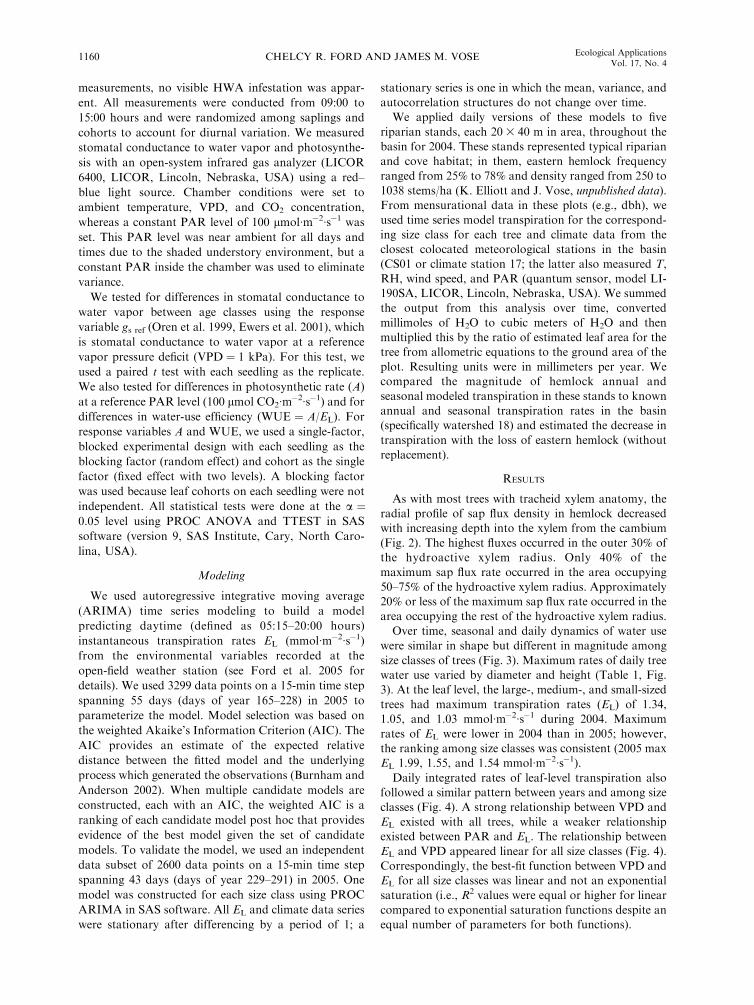
Over time, seasonal and daily dynamics of water use
were similar in shape but different in magnitude among
size classes of trees (Fig. 3). Maximum rates of daily tree
water use varied by diameter and height (Table 1, Fig.
3). At the leaf level, the large-, medium-, and small-sized
trees had maximum transpiration rates (EL) of 1.34,
1.05, and 1.03 mmol�m�2�s�1 during 2004. Maximum
rates of EL were lower in 2004 than in 2005; however,
the ranking among size classes was consistent (2005 max
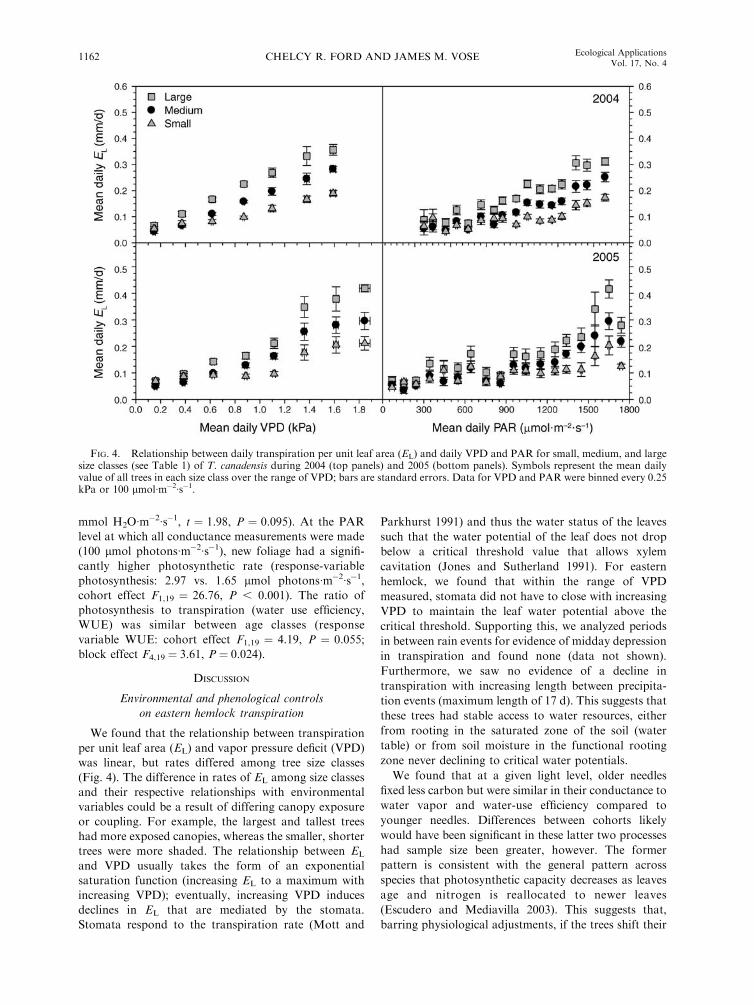
EL 1.99, 1.55, and 1.54 mmol�m�2�s�1).Daily integrated rates of leaf-level transpiration also
followed a similar pattern between years and among size
classes (Fig. 4). A strong relationship between VPD and
EL existed with all trees, while a weaker relationship
existed between PAR and EL. The relationship between
EL and VPD appeared linear for all size classes (Fig. 4).
Correspondingly, the best-fit function between VPD and
EL for all size classes was linear and not an exponential
saturation (i.e., R2 values were equal or higher for linear
compared to exponential saturation functions despite an
equal number of parameters for both functions).
CHELCY R. FORD AND JAMES M. VOSE1160 Ecological ApplicationsVol. 17, No. 4
Seasonally, peak water use occurred in the spring, and
minimum rates occurred in December and January (Fig.3). Year-round water use by this species was a function
of the evergreen leaf habit and relatively mild wintertemperatures (Fig. 1) typical of the southern Appala-
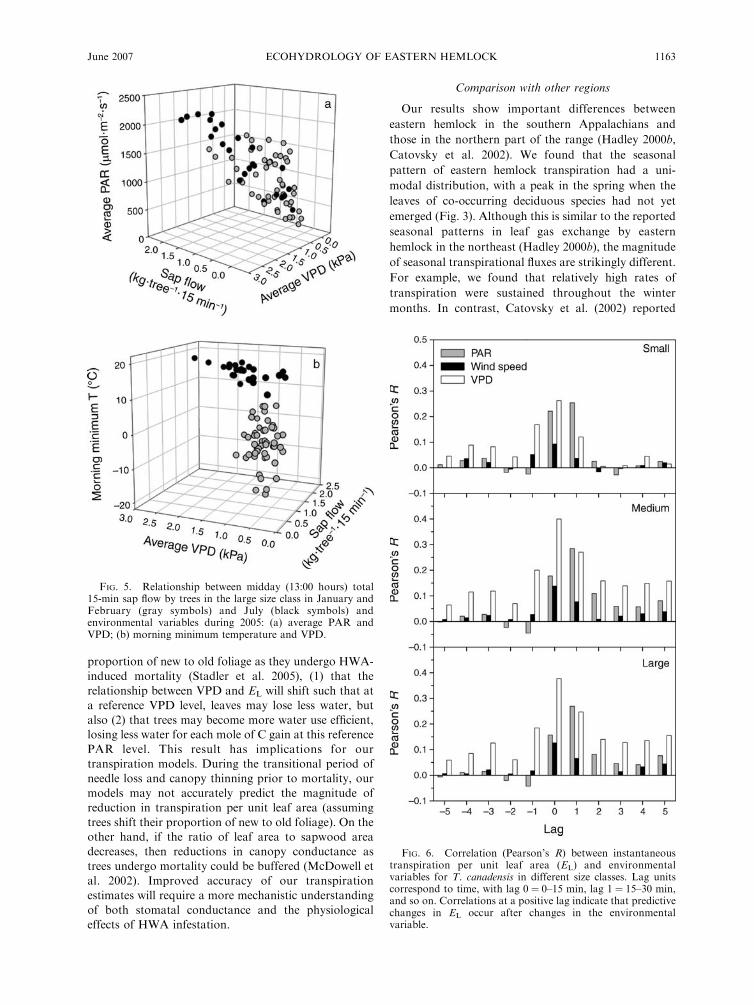
chians. Despite the relatively mild winter temperatures,minimum temperatures in the winter did negativelyaffect transpiration: for any midday VPD and PAR
level, when minimum morning temperatures were low,midday hourly rates of sap flow (13:00 hours) were
reduced (Fig. 5b) for all size classes (only large-sizedtrees are shown in Fig. 5). A boundary-line analysis ofthe data in Fig. 5b (i.e., least-squares regression through
the 10th percentile) indicates that minimum morningtemperatures falling below �108C reduced midday
hemlock transpiration regardless of daily PAR andVPD conditions.We found that changes in EL (when estimated from
sap flow measured at 1.3 m above ground height) for allsize class trees lagged behind changes in PAR by 15–30
min, inferred from the maximum correlation coefficient
at a positive lag of one time step, where each time step
was 15 min (Fig. 6). Changes in EL did not lag behindchanges in VPD, however, with a maximum correlation
at a lag of 0–15 min. Transpiration per unit leaf areafrom medium- and large-sized trees was more strongly
related to VPD and wind speed than EL from smalltrees. Time series models differed in their fit andparameter estimates depending upon size class (Table
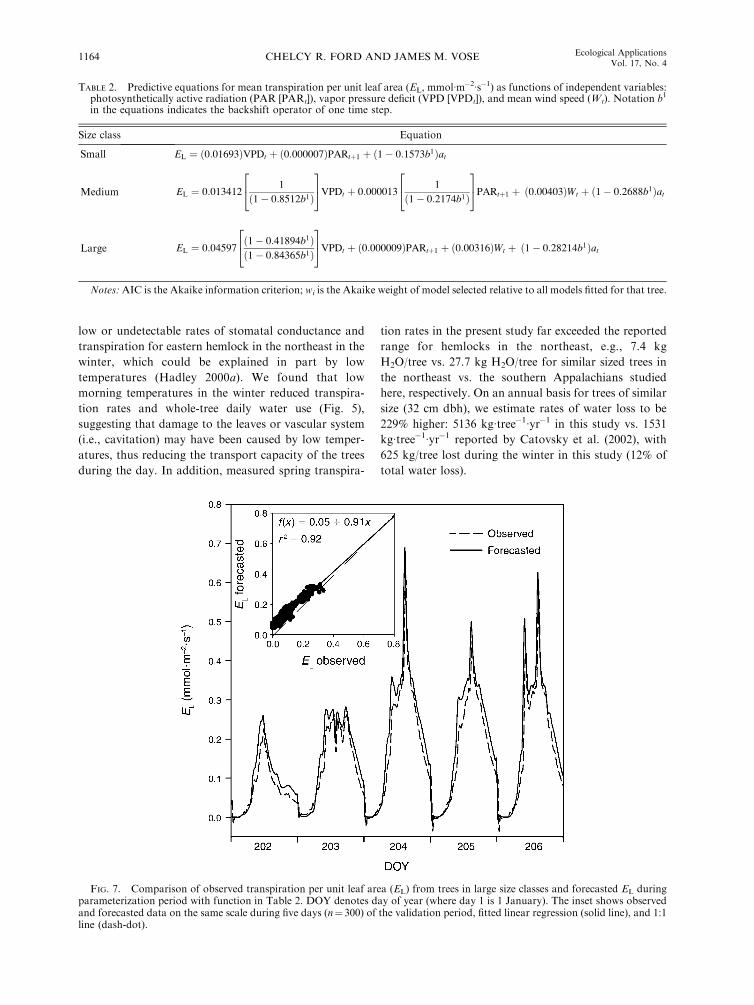
2, Fig. 7). All EL series had significant autocorrelation ata lag of one time step (i.e., AR(1) structure) and had this
term in the final model. Transpiration per unit leaf areaof large size class trees could be predicted from currentvalues of mean wind speed and VPD and from previous
values of PAR (Figs. 6 and 7). Transpiration per unitleaf area of medium size class trees could be predicted
from current values of mean wind speed and previousvalues of VPD of PAR.
Leaf-level gas exchange data showed that at a
reference VPD level of 1 kPa, new foliage and oldfoliage had similar conductance to water vapor (0.042 6
0.008 mmol H2O�m�2�s�1 [mean 6 SE] vs. 0.025 6 0.004
FIG. 3. Mean daily water use over the study period by Tsuga canadensis trees in large, medium, and small diameter size classes(see Table 1; also note breaks in y-axes). Horizontal black bars at tops of panels show the periods of leaf expansion and fall of co-occurring deciduous trees. Gaps in the record are from equipment failure. The inset shows daily water use for all trees as a functionof diameter at breast height (dbh) by size class (different symbols) for day of year (DOY) 128 in 2005 (DOY 1¼ 1 January) (y¼8.13e0.05x, R2
adj ¼ 0.71, P , 0.001).
June 2007 1161ECOHYDROLOGY OF EASTERN HEMLOCK
mmol H2O�m�2�s�1, t ¼ 1.98, P ¼ 0.095). At the PAR
level at which all conductance measurements were made
(100 lmol photons�m�2�s�1), new foliage had a signifi-
cantly higher photosynthetic rate (response-variable
photosynthesis: 2.97 vs. 1.65 lmol photons�m�2�s�1,cohort effect F1,19 ¼ 26.76, P , 0.001). The ratio of
photosynthesis to transpiration (water use efficiency,
WUE) was similar between age classes (response
variable WUE: cohort effect F1,19 ¼ 4.19, P ¼ 0.055;
block effect F4,19 ¼ 3.61, P ¼ 0.024).
DISCUSSION
Environmental and phenological controls
on eastern hemlock transpiration
We found that the relationship between transpiration
per unit leaf area (EL) and vapor pressure deficit (VPD)
was linear, but rates differed among tree size classes
(Fig. 4). The difference in rates of EL among size classes
and their respective relationships with environmental
variables could be a result of differing canopy exposure
or coupling. For example, the largest and tallest trees
had more exposed canopies, whereas the smaller, shorter
trees were more shaded. The relationship between EL
and VPD usually takes the form of an exponential
saturation function (increasing EL to a maximum with
increasing VPD); eventually, increasing VPD induces
declines in EL that are mediated by the stomata.
Stomata respond to the transpiration rate (Mott and
Parkhurst 1991) and thus the water status of the leaves
such that the water potential of the leaf does not drop
below a critical threshold value that allows xylem
cavitation (Jones and Sutherland 1991). For eastern
hemlock, we found that within the range of VPD
measured, stomata did not have to close with increasing
VPD to maintain the leaf water potential above the
critical threshold. Supporting this, we analyzed periods
in between rain events for evidence of midday depression
in transpiration and found none (data not shown).
Furthermore, we saw no evidence of a decline in
transpiration with increasing length between precipita-
tion events (maximum length of 17 d). This suggests that
these trees had stable access to water resources, either
from rooting in the saturated zone of the soil (water
table) or from soil moisture in the functional rooting
zone never declining to critical water potentials.
We found that at a given light level, older needles
fixed less carbon but were similar in their conductance to
water vapor and water-use efficiency compared to
younger needles. Differences between cohorts likely
would have been significant in these latter two processes
had sample size been greater, however. The former
pattern is consistent with the general pattern across
species that photosynthetic capacity decreases as leaves
age and nitrogen is reallocated to newer leaves
(Escudero and Mediavilla 2003). This suggests that,
barring physiological adjustments, if the trees shift their
FIG. 4. Relationship between daily transpiration per unit leaf area (EL) and daily VPD and PAR for small, medium, and largesize classes (see Table 1) of T. canadensis during 2004 (top panels) and 2005 (bottom panels). Symbols represent the mean dailyvalue of all trees in each size class over the range of VPD; bars are standard errors. Data for VPD and PAR were binned every 0.25kPa or 100 lmol�m�2�s�1.
CHELCY R. FORD AND JAMES M. VOSE1162 Ecological ApplicationsVol. 17, No. 4
proportion of new to old foliage as they undergo HWA-
induced mortality (Stadler et al. 2005), (1) that the
relationship between VPD and EL will shift such that at
a reference VPD level, leaves may lose less water, but
also (2) that trees may become more water use efficient,losing less water for each mole of C gain at this reference
PAR level. This result has implications for our
transpiration models. During the transitional period of
needle loss and canopy thinning prior to mortality, our
models may not accurately predict the magnitude of
reduction in transpiration per unit leaf area (assuming
trees shift their proportion of new to old foliage). On theother hand, if the ratio of leaf area to sapwood area
decreases, then reductions in canopy conductance as
trees undergo mortality could be buffered (McDowell et
al. 2002). Improved accuracy of our transpiration
estimates will require a more mechanistic understanding
of both stomatal conductance and the physiological
effects of HWA infestation.
Comparison with other regions
Our results show important differences between
eastern hemlock in the southern Appalachians and
those in the northern part of the range (Hadley 2000b,
Catovsky et al. 2002). We found that the seasonal
pattern of eastern hemlock transpiration had a uni-
modal distribution, with a peak in the spring when the
leaves of co-occurring deciduous species had not yet
emerged (Fig. 3). Although this is similar to the reported
seasonal patterns in leaf gas exchange by eastern
hemlock in the northeast (Hadley 2000b), the magnitude
of seasonal transpirational fluxes are strikingly different.
For example, we found that relatively high rates of
transpiration were sustained throughout the winter
months. In contrast, Catovsky et al. (2002) reported
FIG. 5. Relationship between midday (13:00 hours) total15-min sap flow by trees in the large size class in January andFebruary (gray symbols) and July (black symbols) andenvironmental variables during 2005: (a) average PAR andVPD; (b) morning minimum temperature and VPD.
FIG. 6. Correlation (Pearson’s R) between instantaneoustranspiration per unit leaf area (EL) and environmentalvariables for T. canadensis in different size classes. Lag unitscorrespond to time, with lag 0 ¼ 0–15 min, lag 1 ¼ 15–30 min,and so on. Correlations at a positive lag indicate that predictivechanges in EL occur after changes in the environmentalvariable.
June 2007 1163ECOHYDROLOGY OF EASTERN HEMLOCK
low or undetectable rates of stomatal conductance and
transpiration for eastern hemlock in the northeast in the
winter, which could be explained in part by low
temperatures (Hadley 2000a). We found that low
morning temperatures in the winter reduced transpira-
tion rates and whole-tree daily water use (Fig. 5),
suggesting that damage to the leaves or vascular system
(i.e., cavitation) may have been caused by low temper-
atures, thus reducing the transport capacity of the trees
during the day. In addition, measured spring transpira-
tion rates in the present study far exceeded the reported
range for hemlocks in the northeast, e.g., 7.4 kg
H2O/tree vs. 27.7 kg H2O/tree for similar sized trees in
the northeast vs. the southern Appalachians studied
here, respectively. On an annual basis for trees of similar
size (32 cm dbh), we estimate rates of water loss to be
229% higher: 5136 kg�tree�1�yr�1 in this study vs. 1531
kg�tree�1�yr�1 reported by Catovsky et al. (2002), with
625 kg/tree lost during the winter in this study (12% of
total water loss).
TABLE 2. Predictive equations for mean transpiration per unit leaf area (EL, mmol�m�2�s�1) as functions of independent variables:photosynthetically active radiation (PAR [PARt]), vapor pressure deficit (VPD [VPDt]), and mean wind speed (Wt). Notation b1
in the equations indicates the backshift operator of one time step.
Size class Equation
Small EL ¼ ð0:01693ÞVPDt þ ð0:000007ÞPARtþ1 þ ð1� 0:1573b1Þat
Medium EL ¼ 0:0134121
ð1� 0:8512b1Þ
24
35VPDt þ 0:000013
1
ð1� 0:2174b1Þ
24
35PARtþ1 þ ð0:00403ÞWt þ ð1� 0:2688b1Þat
Large EL ¼ 0:04597ð1� 0:41894b1Þð1� 0:84365b1Þ
24
35VPDt þ ð0:000009ÞPARtþ1 þ ð0:00316ÞWt þ ð1� 0:28214b1Þat
Notes:AIC is the Akaike information criterion; wi is the Akaike weight of model selected relative to all models fitted for that tree.
FIG. 7. Comparison of observed transpiration per unit leaf area (EL) from trees in large size classes and forecasted EL duringparameterization period with function in Table 2. DOY denotes day of year (where day 1 is 1 January). The inset shows observedand forecasted data on the same scale during five days (n¼ 300) of the validation period, fitted linear regression (solid line), and 1:1line (dash-dot).
CHELCY R. FORD AND JAMES M. VOSE1164 Ecological ApplicationsVol. 17, No. 4
Impacts of mortality on stand-level water budgets
In typical riparian and cove stands, we predicted a
mean annual transpiration rate of 63.3 mm/yr for the
hemlock component. Approximately 50% of this annual
total was transpired in the winter and spring (9.1 mm/yr
and 25.9 mm/yr, respectively). We do not have estimates
of stand-level transpiration specifically for riparian
areas; however, watershed-based estimates of transpira-
tion for Coweeta hardwood stands that contain mixtures
of deciduous hardwoods, pine, hemlock, and evergreen
understories are on the order of 600–700 mm/yr (Swift et
al. 1975, Vose and Swank 1994), with winter and spring
transpiration ;15% of the annual total (;100 mm/yr).
If we apply the watershed-level estimates to the riparian
areas as a first approximation, hemlock mortality would
reduce annual stand-level transpiration by ;10% and
reduce winter and spring stand-level transpiration by
;30%. We would also expect decreases in interception
capacity resulting from needle loss and eventual decay of
standing dead hemlock snags. Combined, a reduction in
transpiration and interception could, at least in the short
term, result in (1) increased soil moisture, (2) increased
discharge, (3) decreased diurnal amplitude of stream-
flow, and (4) increased width of the variable source area
(see Dunford and Fletcher 1947, Bren 1997).
Longer term hydrologic responses will most likely be
determined by postmortality successional patterns.
Combining historical and current species distributions,
we predict that two different scenarios may occur with
the potential decline in eastern hemlock in the southern
Appalachians. First, on sites with a dense Rhododendron
maximum subcanopy, post-hemlock mortality seedling
recruitment of any species into the canopy will likely be
low (Clinton and Vose 1996, Beckage et al. 2000, Nilsen
et al. 2001, Lei et al. 2002); however, R. maximum
biomass increases will likely occur with increased
resource availability. Despite a predicted increase in R.
maximum biomass, eastern hemlock mortality will likely
result in long-term decreases in riparian forest transpi-
ration because low leaf conductivities to water vapor in
R. maximum (Nilsen 1985, Lipp and Nilsen 1997) will
limit the responsiveness at the watershed scale. A second
outcome may be expected on sites with little to no R.
maximum subcanopy. Historical pollen record evidence
indicates that when the eastern hemlock and chestnut
waned in dominance, birch (an early successional
species) increased first, followed by red maple and oaks
(later successional canopy species; Allison et al. 1986).
Hence, we expect early successional species (i.e., B.
lenta) to increase in dominance (Orwig and Foster 1998),
then eventually be replaced with late-successional
canopy species. Ecologically, sweet birch is relatively
shade tolerant and takes advantage of gap openings and
N patches for regeneration (Crabtree and Bazzaz 1993);
however, sweet birch is a short-lived species and over
longer time scales, other species also common to
riparian corridors in the southern Appalachians may
increase in dominance, such as Nyssa sylvatica L. (black
gum) and Liriodendron tulipifera L. (yellow poplar;
Brown 2004). We predict that decreases in the amount of
riparian-forest leaf area and the seasonal leaf-area
dynamics (deciduous vs. evergreen) will result in at least
a short-term increase in transpiration per unit leaf area,
an overall decrease in riparian forest transpiration, and
profoundly decreased rates of winter and early spring
transpiration. Because of its riparian and cove distribu-
tion, the loss of eastern hemlock in the southern
Appalachians may have a greater hydrologic impact
than losses in other ecosystems where eastern hemlock
trees are distributed more uniformly across the land-
scape (e.g., southern Appalachians vs. New England).
The loss of eastern hemlock in the southern Appala-
chians will likely cause significant changes in soil
moisture dynamics within the riparian zone and
subsequently impact nutrient and carbon cycling pro-
cesses.
APPLICATIONS
Understanding the functional implications, such as
impacts on hydrologic processes of individual species
loss or gain in complex ecosystems, is a challenging task.
Although studies that link leaf-level physiology to
landscape-level hydrology are rare, studies in the
western U.S. have highlighted the effect that changes
in single species can have on hydrology. For example,
Scott et al. (2006) show that with the encroachment of
velvet mesquite into riparian areas groundwater table
depth decreased, ET (evapotranspiration) increased, and
growing-season ET exceeded P (precipitation) input.
Similarly, Pataki et al. (2005) show that salt cedar
invasion into riparian stands decreases transpiration and
productivity of native Fremont cottonwood stands.
Although ecosystem function is often related to struc-
ture, targeting forest structure as a restoration goal does
not always result in a comparable restoration of desired
function. For example, in a review of the impacts of
removing salt cedar from western U.S. riparian corri-
dors on water yield, Shafroth et al. (2005) found that
TABLE 2. Extended.
AIC wi
�18 944.1 0.97
�17 794.2 1.00
�15 513.3 1.00
June 2007 1165ECOHYDROLOGY OF EASTERN HEMLOCK
water yield only increased when the vegetation that
replaced salt cedar had a lower leaf-area index.
The potential for widespread losses of forest tree
species due to non-native or invasive insects and diseases
is a growing concern (Ellison et al. 2005). For hemlock
woolly adelgid (HWA), natural resource managers are
now faced with the daunting task of trying to control the
rate of spread and impacts of HWA at landscape scales.
If control efforts are not successful, the next task will be
to decide on appropriate restoration-based management
actions. These actions should include prescriptions that
restore both structure and function. Our study shows
that eastern hemlock in the southern Appalachians has
two distinct ecohydrological roles: one role is an
evergreen tree that has relatively stable water fluxes
throughout the year; the other is a riparian tree that has
high rates of water flux in the spring. It is probable that
no other native tree species will fill these ecohydrological
roles if hemlock is lost from southern Appalachian
ecosystems. Reductions in ET will likely decrease and we
can expect four hydrological consequences: (1) increased
soil moisture, (2) increased discharge, (3) decreased
diurnal amplitude of streamflow, and (4) increased
width of the variable source area. These consequences
should be used to guide the intensity and extent of
control efforts and approaches to restore both structure
and function.
ACKNOWLEDGMENTS
This study was supported by the USDA Forest Service,Southern Research Station and by NSF grant DEB 9632854and DEB-0218001 to the Coweeta LTER program. Weacknowledge the support of many individuals, past and present,as well as the long-term climate and hydrologic data network atCoweeta Hydrologic Lab. We are grateful to K. Elliott forsharing unpublished data. We thank B. Clinton, B. Ewers, W.Swank, S. Wullschleger, and two anonymous reviewers forhelpful comments on a previous version of this manuscript. Wethank M. Crawford, D. Fowler, J. Kitchner, S. Laseter, C.Marshall, R. McCollum, B. McCoy, J. Teskey, for logisticalhelp, help with field work, and overall support. This article waswritten and prepared by U.S. Government employees onofficial time, and the textual content is therefore in the publicdomain and not subject to copyright.
LITERATURE CITED
Allison, T. D., R. E. Moeller, and M. B. Davis. 1986. Pollen inlaminated sediments provides evidence of mid-Holoceneforest pathogen outbreak. Ecology 67:1101–1105.
Beckage, B., J. S. Clark, B. D. Clinton, and B. L. Haines. 2000.A long-term study of tree seedling recruitment in southernAppalachian forests: the effects of canopy gaps and shrubunderstories. Canadian Journal of Forest Research 30:1617–1631.
Bosch, J. M., and J. D. Hewlett. 1982. A review of catchmentexperiments to determine the effect of vegetation changes onwater yield and evapotranspiration. Journal of Hydrology55:3–23.
Bren, L. J. 1997. Effects of slope vegetation removal on thediurnal variations of a small mountain stream. WaterResources Research 33:321–331.
Brown, J. 2004. Impacts of hemlock woolly adelgid onCanadian hemlock forests. A report by the Carolina
Environmental Program Highlands Biological Station, High-lands, North Carolina, USA.
Burnham, K. P., and D. R. Anderson. 2002. Model selectionand multimodel inference: a practical information-theoreticapproach. Second edition. Springer-Verlag, New York, NewYork, USA.
Campbell, G. S., and J. M. Norman. 1998. Radiation basics.Pages 147–165 in An introduction to environmental biophys-ics. Springer-Verlag, New York, New York, USA.
Catovsky, S., N. M. Holbrook, and F. A. Bazzaz. 2002.Coupling whole-tree transpiration and canopy photosynthe-sis in coniferous and broad-leaved tree species. CanadianJournal of Forest Research 32:295–309.
Clinton, B. D., and J. M. Vose. 1996. Effects of Rhododendronmaximum L. on Acer rubrum L. seedling establishment.Castanea 61:38–45.
Crabtree, R. C., and F. A. Bazzaz. 1993. Seedling response offour birch species to simulated nitrogen deposition: ammo-nium vs. nitrate. Ecological Applications 3:315–321.
Dawson, T. E. 1993. Hydraulic lift and water-use by plants—implications for water-balance, performance and plant–plantinteractions. Oecologia 95:565–574.
Dunford, E. G., and P. W. Fletcher. 1947. Effect of removal ofstream-bank vegetation upon water yield. Transactions of theAmerican Geophysical Union 28:105–110.
Ellison, A. M., et al. 2005. Loss of foundation species:consequences for the structure and dynamics of forestedecosystems. Frontiers in Ecology and the Environment 9:479–486.
Escudero, A., and S. Mediavilla. 2003. Decline in photosyn-thetic nitrogen use efficiency with leaf age and nitrogenresorption as determinants of leaf life span. Journal ofEcology 91:880–889.
Ewers, B. E., S. T. Gower, B. Bond-Lamberty, and C. K.Wang. 2005. Effects of stand age and tree species on canopytranspiration and average stomatal conductance of borealforests. Plant Cell and Environment 28:660–678.
Ewers, B. E., R. Oren, K. H. Johnsen, and J. J. Landsberg.2001. Estimating maximum mean canopy stomatal conduc-tance for use in models. Canadian Journal of Forest Research31:198–207.
Ford, C. R., C. E. Goranson, R. J. Mitchell, R. E. Will, andR. O. Teskey. 2005. Modeling canopy transpiration usingtime series analysis: a case study illustrating the effect of soilmoisture deficit on Pinus taeda. Agricultural and ForestMeteorology 130:163–175.
Granier, A. 1985. Une nouvelle methode pour la mesure du fluxde seve brute dans le tronc des arbres. Annales des SciencesForestieres 42:193–200.
Hadley, J. L. 2000a. Effect of daily minimum temperature onphotosynthesis in eastern hemlock (Tsuga canadensis L.) inautumn and winter. Arctic, Antarctic, and Alpine Research32:368–374.
Hadley, J. L. 2000b. Understory microclimate and photosyn-thetic response of saplings in an old-growth eastern hemlock(Tsuga canadensis L.) forest. Ecoscience 7:66–72.
Hatton, T. J., E. A. Catchpole, and R. A. Vertessy. 1990.Integration of sapflow velocity to estimate plant water-use.Tree Physiology 6:201–209.
James, S. A., M. J. Clearwater, F. C. Meinzer, and G.Goldstein. 2001. Heat dissipation sensors of variable lengthfor the measurement of sap flow in trees with deep sapwood.Tree Physiology 22:277–283.
Jones, H. G., and R. A. Sutherland. 1991. Stomatal control ofxylem embolism. Plant Cell and Environment 14:607–612.
Landsberg, J. J., and R. H. Waring. 1997. A generalised modelof forest productivity using simplified concepts of radiation-use efficiency, carbon balance and partitioning. ForestEcology and Management 95:209–228.
CHELCY R. FORD AND JAMES M. VOSE1166 Ecological ApplicationsVol. 17, No. 4
Lei, T. T., S. W. Semones, J. F. Walker, B. D. Clinton, andE. T. Nilsen. 2002. Effects of Rhododendron maximumthickets on tree seed dispersal, seedling morphology, andsurvivorship. International Journal of Plant Sciences 163:991–1000.
Lipp, C. C., and E. T. Nilsen. 1997. The impact of subcanopylight environment on the hydraulic vulnerability of Rhodo-dendron maximum to freeze–thaw cycles and drought. PlantCell and Environment 20:1264–1272.
Lowe, P. R. 1977. An approximating polynomial for thecomputation of saturation vapor pressure. Journal ofApplied Meteorology 16:100–103.
Lu, J., G. Sun, S. G. McNulty, and D. M. Amatya. 2005. Acomparison of six potential evapotranspiration methods forregional use in the southeastern United States. Journal of theAmerican Water Resources Association 41:621–633.
McDowell, N., et al. 2002. The relationship between tree heightand leaf area: sapwood area ratio. Oecologia 132:12–20.
Meinzer, F. C., B. J. Bond, J. M. Warren, and D. R. Woodruff.2005. Does water transport scale universally with tree size?Functional Ecology 19:558–565.
Moore, G. W., B. J. Bond, J. A. Jones, N. Phillips, and F. C.Meinzer. 2004. Structural and compositional controls ontranspiration in 40- and 450-year-old riparian forests inwestern Oregon, USA. Tree Physiology 24:481–491.
Mott, K. A., and D. F. Parkhurst. 1991. Stomatal responses tohumidity in air and helox. Plant Cell and Environment 14:509–515.
Nilsen, E. T. 1985. Seasonal and diurnal leaf movements ofRhododendron maximum L. in contrasting irradiance envi-ronments. Oecologia 65:296–302.
Nilsen, E. T., B. D. Clinton, T. T. Lei, O. K. Miller, S. W.Semones, and J. F. Walker. 2001. Does Rhododendronmaximum L. (Ericaceae) reduce the availability of resourcesabove and belowground for canopy tree seedlings? AmericanMidland Naturalist 145:325–343.
Oren, R., and D. E. Pataki. 2001. Transpiration in response tovariation in microclimate and soil moisture in southeasterndeciduous forests. Oecologia 127:549–559.
Oren, R., J. S. Sperry, G. G. Katul, D. E. Pataki, B. E. Ewers,N. Phillips, and K. V. R. Schafer. 1999. Survey and synthesisof intra- and interspecific variation in stomatal sensitivity tovapour pressure deficit. Plant Cell and Environment 22:1515–1526.
Orwig, D. A., and D. R. Foster. 1998. Forest response to theintroduced hemlock woolly adelgid in southern NewEngland, USA. Journal of the Torrey Botanical Society125:60–73.
Pataki, D. E., S. E. Bush, P. Gardner, D. K. Solomon, and J. R.Ehleringer. 2005. Ecohydrology in a Colorado River riparianforest: implications for the decline of Populus fremontii.Ecological Applications 15:1009–1018.
Pataki, D. E., and R. Oren. 2003. Species differences instomatal control of water loss at the canopy scale in a mature
bottomland deciduous forest. Advances in Water Resources26:1267–1278.
Sack, L., and M. T. Tyree. 2005. Leaf hydraulics and itsimplications in plant structure and function. Pages 93–114 inN. M. Holbrook and M. A. Zwieniecki, editors. VascularTransport in Plants. Elsevier, Boston, Massachusetts, USA.
Santee, W. R. 1978. A dimensional analysis of eastern hemlock(Tsuga canadensis). Thesis. University of Georgia, Athens,Georgia, USA.
Santee, W. R., and C. D. Monk. 1981. Stem diameter and dryweight relationships in Tsuga canadensis (L.) Carr. Bulletin ofthe Torrey Botanical Club 108:320–323.
Scott, R. L., T. E. Huxman, D. G. Williams, and D. C.Goodrich. 2006. Ecohydrological impacts of woody-plantencroachment: seasonal patterns of water and carbon dioxideexchange within a semiarid riparian environment. GlobalChange Biology 12:311–324.
Shafroth, P. B., J. R. Cleverly, T. L. Dudley, J. P. Taylor, C.Van Riper III, E. P. Weeks, and J. N. Stuart. 2005. Controlof Tamarix in the western US: implications for water salvage,wildlife use, and riparian restoration. Environmental Man-agement 35:231–246.
Skinner, M., B. L. Parker, S. Gouli, and T. Ashikaga. 2003.Regional responses of hemlock woolly adelgid (Homoptera:Adelgidae) to low temperatures. Environmental Entomology32:523–528.
Sprugel, D. G. 1983. Correcting for bias in log-transformedallometric equations. Ecology 64:209–210.
Stadler, B., T. Muller, D. Orwig, and R. Cobb. 2005. Hemlockwoolly adelgid in New England Forests: canopy impactstransforming ecosystem processes and landscapes. Ecosys-tems 8:233–247.
Swank, W. T., L. W. Swift, Jr., and I. E. Douglass. 1988.Streamflow changes associated with forest cutting, speciesconversions, and natural disturbances. Pages 297–312 inW. T. Swank and D. A. Crossley, Jr., editors. Ecologicalstudies, volume 66: Forest hydrology and ecology at Cow-eeta. Springer-Verlag, New York, New York, USA.
Swift, L. W., G. B. Cunningham, and J. E. Douglass. 1988.Climate and hydrology. Pages 35–55 in W. T. Swank andD. A. Crossley, editors. Ecological studies, volume 66: Foresthydrology and ecology at Coweeta. Springer-Verlag, NewYork, New York, USA.
Swift, L. W., W. T. Swank, J. B. Mankin, R. J. Luxmoore, andR. A. Goldstein. 1975. Simulation of evapotranspiration anddrainage from mature and clear-cut deciduous forests andyoung pine plantation. Water Resources Research 11:667–673.
Vose, J. M., and W. T. Swank. 1994. Effects of long-termdrought on the hydrology and growth of a white pineplantation in the southern Appalachians. Forest Ecology andManagement 64:25–39.
Wullschleger, S. D., F. C. Meinzer, and R. A. Vertessy. 1998. Areview of whole-plant water use studies in trees. TreePhysiology 18:499–512.
June 2007 1167ECOHYDROLOGY OF EASTERN HEMLOCK


![[Tsuga Sword Scantrad]Edição de Mangás](https://img.pdfslide.net/doc/110x75/557212a8497959fc0b90ac20/tsuga-sword-scantradedicao-de-mangas.jpg)