Embed Size (px)
Citation preview
Tucannon River Spring Chinook Salmon
Captive Broodstock Program
2006 Annual Report January 2006 – December 2006
Michael P. Gallinat Lance A. Ross
Washington Department of Fish and Wildlife
Snake River Laboratory 401 S. Cottonwood St.
Dayton, WA 99328
Prepared for:
U.S. Department of Energy
Bonneville Power Administration P.O. Box 3621
Portland, OR 97283-3621
Project Number 2000-019-00 Primary Contract Number 00024827
Secondary Contract Number 00030131
May 2007
Acknowledgments
The Tucannon River spring Chinook salmon captive broodstock program is the result of efforts by many individuals within the Washington Department of Fish and Wildlife (WDFW) and from other agencies. We thank Steve Rodgers, Lyons Ferry Hatchery (LFH) Complex Manager, for his coordination efforts and oversight of all hatchery operations concerning the captive brood program. We thank Dick Rogers, Doug Maxey, Severin Erickson, and Steve Jones for their cooperation with hatchery sampling, providing information regarding hatchery operations and records, and input on evaluation and research activities. We also thank all the LFH personnel who provide day-to-day care of the captive brood and for their assistance with spawning, sampling, and record keeping. Joe Bumgarner, Jerry Dedloff, Jeromy Jording, and Michelle Varney of the Snake River Lab provided helpful assistance during spawning, sorting, and PIT tagging. Thank you to Steve Roberts, Fish Health Specialist, for providing information on all fish health issues that arose with the captive brood fish. We sincerely thank personnel from the Nez Perce Tribe (NPT) and Confederated Tribes of the Umatilla Indian Reservation (CTUIR) who participated and provided comments during the development of the Tucannon Master Plan and for their continual input into the captive brood program. We also thank NOAA Fisheries staff for approving the captive broodstock program through the ESA Section 10 permit process, and finding the program necessary for recovery/stabilization of the Tucannon River spring Chinook stock. Without these respective agencies’ support, this program would not have proceeded. Todd Kassler and Denise Hawkins, WDFW Genetics Lab, provided the baseline genetic analysis for the captive brood program. We thank the Bonneville Power Administration (BPA) for their financial support during FY2006. Peter Lofy provided invaluable support and assistance regarding the captive brood program contract. Finally, we thank Mark Schuck, Glen Mendel and Todd Pearsons of the WDFW, and Peter Lofy of BPA for their critical reviews and helpful comments on the draft report.
Abstract
This report summarizes the objectives, tasks, and accomplishments of the Tucannon River Spring Chinook Captive Broodstock Program during 2006. Results should be considered preliminary until published is a peer-reviewed journal. The WDFW initiated a captive broodstock program in 1997. The captive broodstock program collected juvenile hatchery supplementation fish from five (1997-2001) brood years (BY) with additional fish collected from the 2002 BY. The overall goal of the Tucannon River captive broodstock program is for the short-term, and eventually long-term, rebuilding of the Tucannon River spring Chinook salmon population, with the hope that natural production will sustain itself in the future. The project goal is to rear captive salmon selected from the supplementation program to adults, spawn them, rear their progeny, and release approximately 150,000 smolts annually into the Tucannon River between 2003-2007. These smolts, in combination with the current hatchery supplementation program (132,000 smolts) and wild production, are expected to produce 600-700 returning adult spring Chinook to the Tucannon River each year from 2005-2010. The 2006 eggtake from the 2001 brood year (Age 5) was 17,042 eggs from 8 ripe females. Egg survival was 54%. Mean fecundity based on the 8 fully spawned females was 2,130 eggs/female. The 2006 eggtake from the 2002 brood year (Age 4) was 145,694 eggs from 78 ripe females. Egg survival was 62%. Mean fecundity based on the 78 fully spawned fish was 1,868 eggs/female. The total 2006 eggtake from the captive brood program was 162,736 eggs. A total of 63,316 dead eggs (38.9%) were removed with 99,420 live eggs remaining for the program. An additional 19,988 dead eggs/fry (20.1%) were picked at ponding leaving 79,432 fish for rearing. Only two captive brood progeny adult returns were recovered during 2006. Survival to adult returns has been poor for this program to date. Microsatellite DNA analysis to date provides evidence that the captive broodstock program has been an effective method of preserving overall genetic variation in Tucannon River spring Chinook while providing additional smolts for release. During April 2007, WDFW volitionally released 90,056 BY 2005 captive broodstock progeny smolts from Curl Lake Acclimation Pond into the Tucannon River. These fish were marked only with a CWT in order to differentiate them from the supplementation fish (CWT/Right Red VIE/No Finclip). One thousand captive brood progeny smolts were PIT tagged to compare their outmigration with smolts from the supplementation program (1,002 tagged). Monitoring their survival and adult returns, along with future natural production levels, will be used to determine the success or failure of this captive broodstock program.
Tucannon River Spring Chinook Salmon Captive Broodstock Program May 2007 FY2006 Annual Report
i
Table of Contents
Abstract………............................................................................................................................. i Table of Contents......................................................................................................................... ii List of Tables.. ............................................................................................................................ iii List of Figures. ............................................................................................................................ iv List of Appendices ........................................................................................................................v Introduction…...............................................................................................................................1 Reporting Period ...............................................................................................................1 Tucannon River Spring Chinook Program Overview.......................................................1 Tucannon River Watershed Characteristics......................................................................3 Facility Descriptions .........................................................................................................5 Monitoring and Evaluation ...............................................................................................5 Captive Broodstock Program........................................................................................................6 Source of Captive Population ...........................................................................................7 Rearing, Spawning, and Release.......................................................................................9 2001 Brood Rearing............................................................................................10 2002 Brood Rearing............................................................................................11 2006 Spawning, with Comparisons to the Supplementation Broodstock...........11 2005 Progeny ......................................................................................................15 2006 Progeny ......................................................................................................16 PIT Tagging ........................................................................................................16 Adult Returns ..................................................................................................................17 Survival Rates .................................................................................................................17 DNA Genetic Samples....................................................................................................19 2006 Brood Year.................................................................................................19 2005 Brood Year.................................................................................................19 Coordination and Reporting............................................................................................19 Literature Cited ...........................................................................................................................20 Appendices…..............................................................................................................................22
Tucannon River Spring Chinook Salmon Captive Broodstock Program May 2007 FY2006 Annual Report
ii
List of Tables
Table 1. Comparison of mean fork length (cm) and mean egg size (g/egg) from female captive broodstock (2000-2006) and female supplementation broodstock (1988-2006)..................................................................................................................14 Table 2. Length and weight statistics of the 2005 brood year supplementation (Supp.) and captive brood (C.B.) progeny PIT tagged in February 2007 .......................................16 Table 3. Summary of sample sizes (N), mean lengths (mm), coefficients of variation (CV), condition factors (K), and fish/lb (FPP) of 2005 BY juveniles sampled at TFH and Curl Lake...............................................................................................................16 Table 4. Summary of spring Chinook captive brood progeny smolt releases in the Tucannon River, 2005 brood year .................................................................................................16 Table 5. Cumulative detection (one unique detection per tag code) and travel time (TD) summaries of PIT tagged hatchery spring Chinook salmon released from Curl Lake Acclimation Pond (rkm 65.6) on the Tucannon River at downstream Snake and Columbia River dams during 2006 .......................................................................17 Table 6. Captive brood progeny adult returns collected from the Tucannon River during 2006 ...................................................................................................................17 Table 7. Estimates of Tucannon River spring Chinook salmon captive brood abundance by life stage for the 2000-2006 brood years ................................................................18 Table 8. Survival rates (%) by brood year for various life stages for Tucannon River spring Chinook captive brood progeny........................................................................18
Tucannon River Spring Chinook Salmon Captive Broodstock Program May 2007 FY2006 Annual Report
iii
List of Figures
Figure 1. Total estimated escapement of Tucannon River spring Chinook
salmon from 1985-2006...............................................................................................2 Figure 2. Return per spawner (with replacement line) for Tucannon
River spring Chinook salmon for the 1985-2002 brood years......................................3 Figure 3. Location of the Tucannon River within the Snake River Basin, and locations of
Lyons Ferry Hatchery, Tucannon Hatchery, and Curl Lake Acclimation Pond within the Tucannon River Basin.............................................................................................4
Figure 4. Diagram of the 2 x 2 mating scheme used by WDFW in the conventional
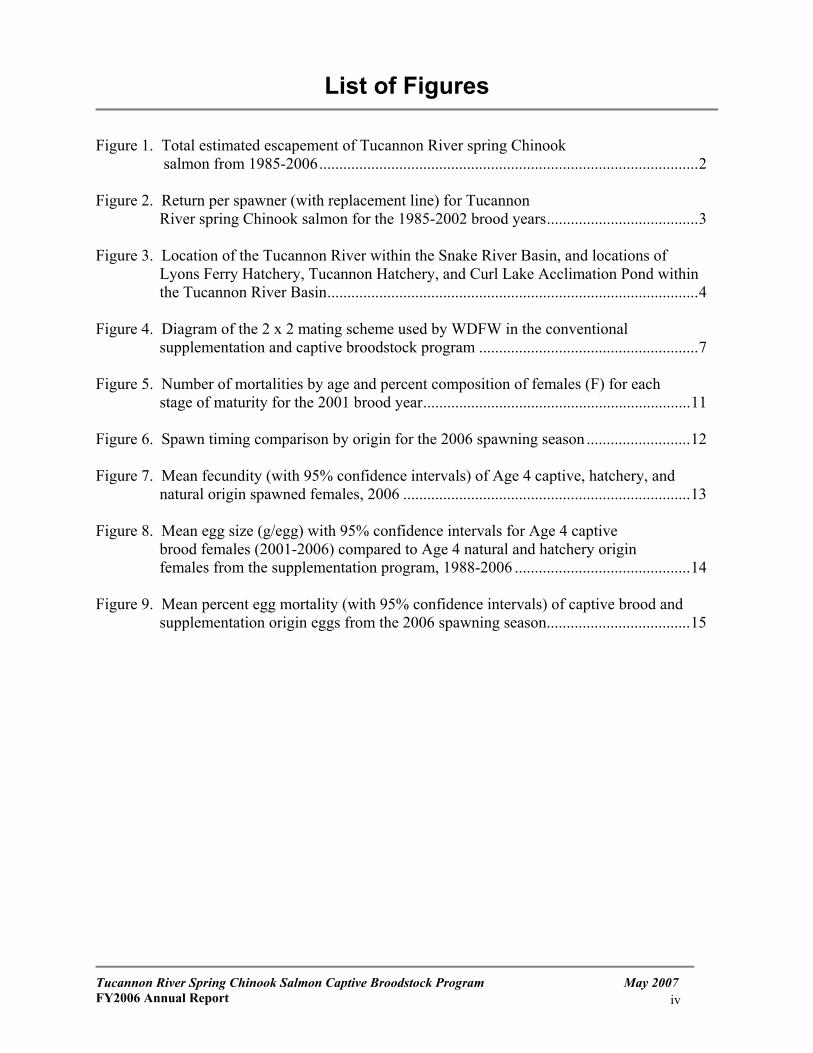
supplementation and captive broodstock program .......................................................7 Figure 5. Number of mortalities by age and percent composition of females (F) for each stage of maturity for the 2001 brood year...................................................................11 Figure 6. Spawn timing comparison by origin for the 2006 spawning season ..........................12 Figure 7. Mean fecundity (with 95% confidence intervals) of Age 4 captive, hatchery, and natural origin spawned females, 2006 ........................................................................13 Figure 8. Mean egg size (g/egg) with 95% confidence intervals for Age 4 captive brood females (2001-2006) compared to Age 4 natural and hatchery origin females from the supplementation program, 1988-2006 ............................................14 Figure 9. Mean percent egg mortality (with 95% confidence intervals) of captive brood and supplementation origin eggs from the 2006 spawning season....................................15
Tucannon River Spring Chinook Salmon Captive Broodstock Program May 2007 FY2006 Annual Report
iv
List of Appendices
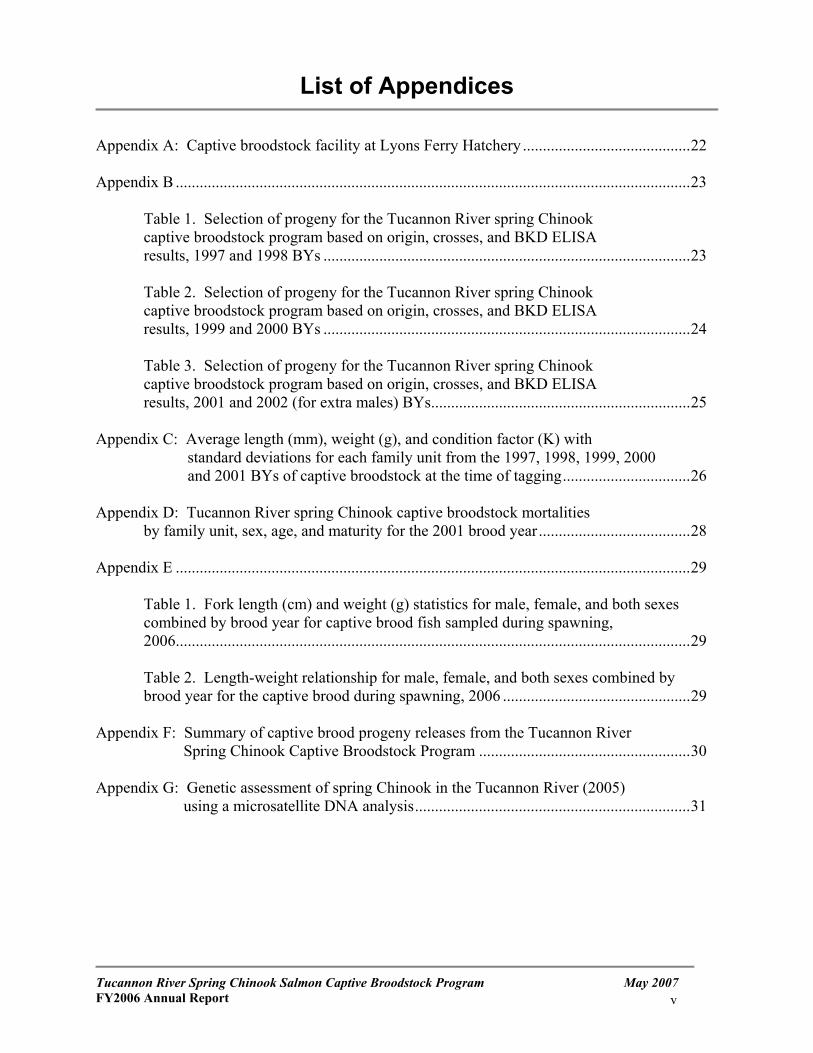
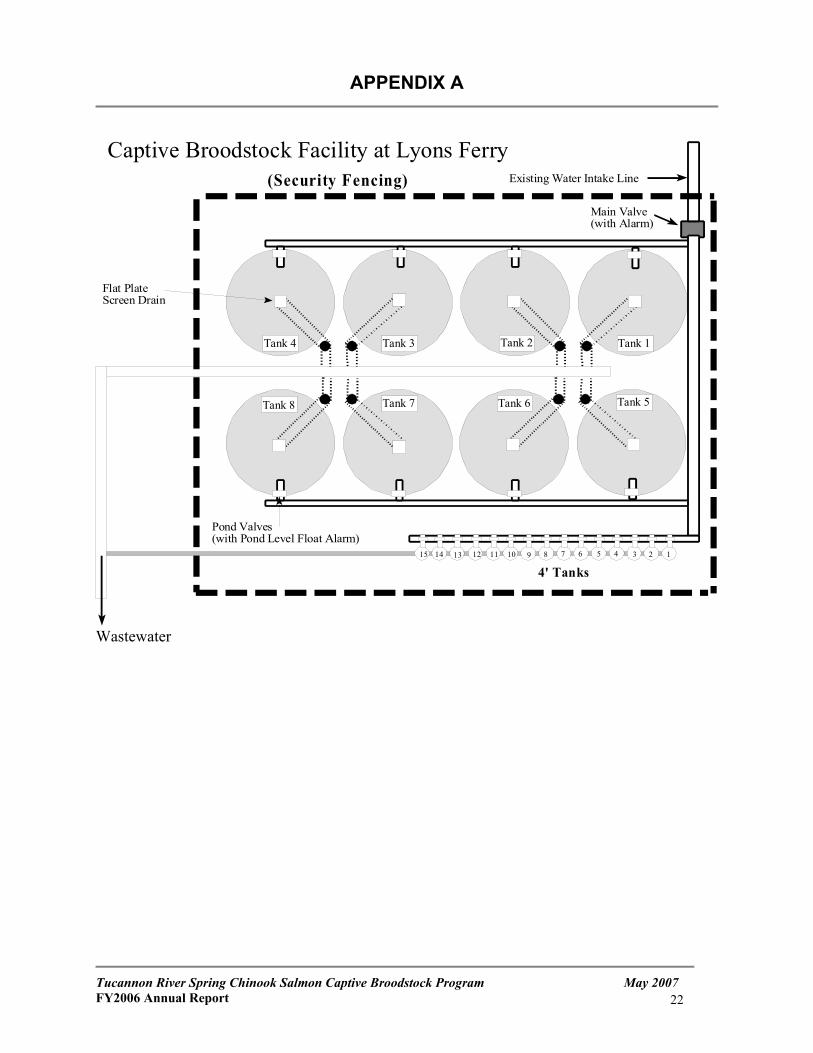
Appendix A: Captive broodstock facility at Lyons Ferry Hatchery ..........................................22 Appendix B .................................................................................................................................23
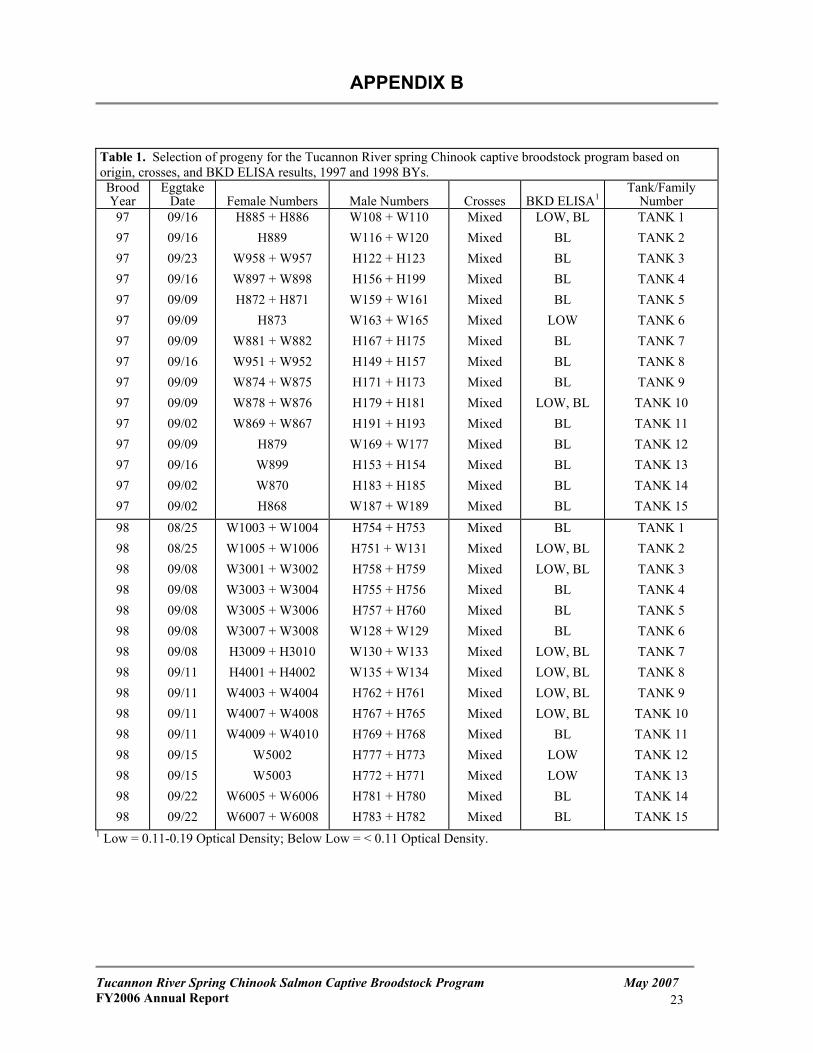
Table 1. Selection of progeny for the Tucannon River spring Chinook captive broodstock program based on origin, crosses, and BKD ELISA results, 1997 and 1998 BYs ............................................................................................23 Table 2. Selection of progeny for the Tucannon River spring Chinook captive broodstock program based on origin, crosses, and BKD ELISA results, 1999 and 2000 BYs ............................................................................................24
Table 3. Selection of progeny for the Tucannon River spring Chinook captive broodstock program based on origin, crosses, and BKD ELISA results, 2001 and 2002 (for extra males) BYs.................................................................25
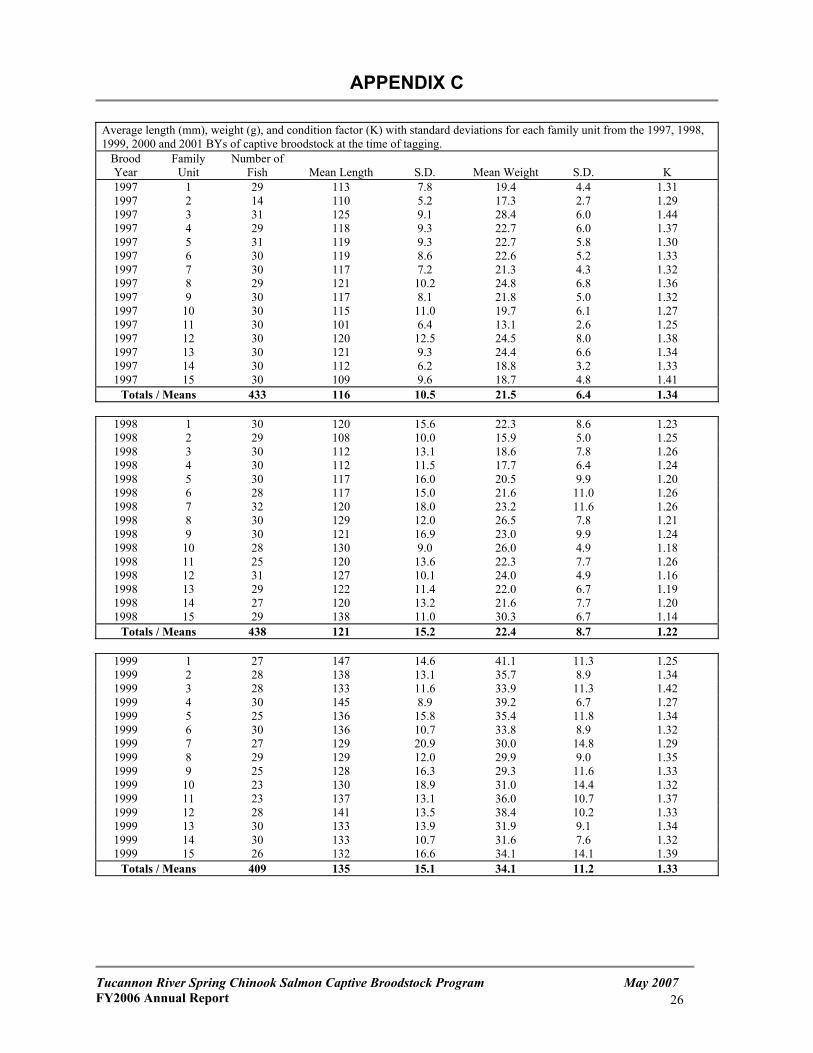
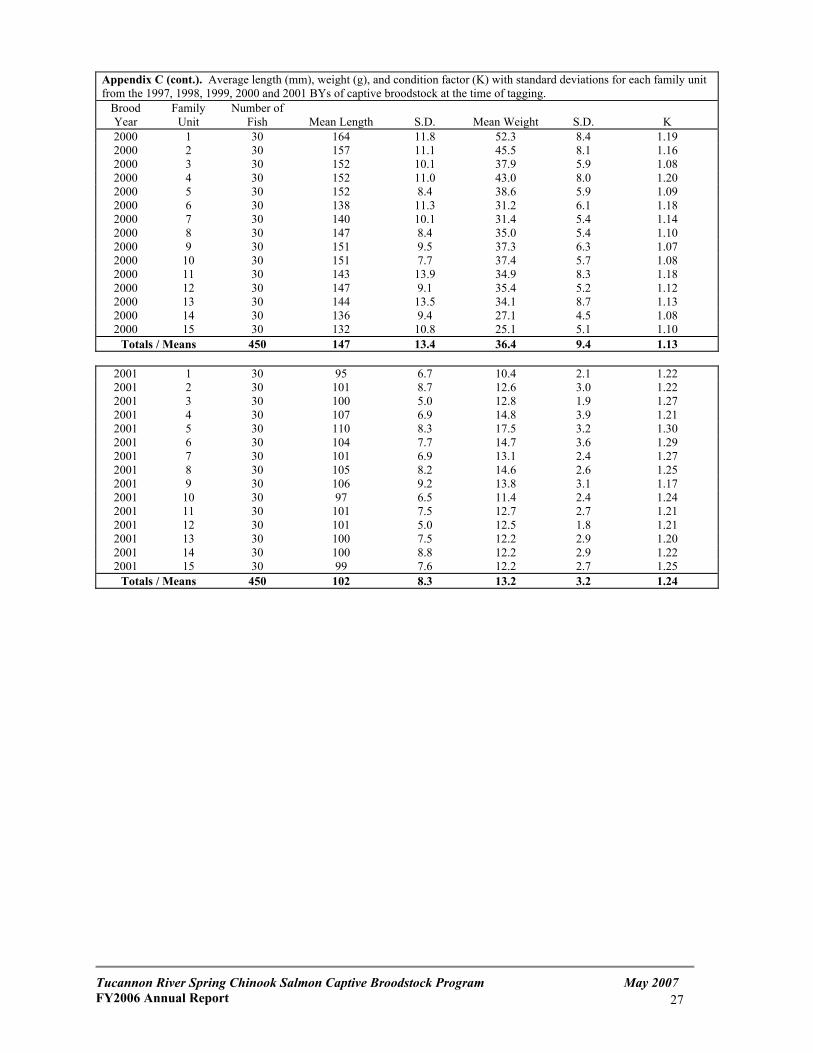
Appendix C: Average length (mm), weight (g), and condition factor (K) with
standard deviations for each family unit from the 1997, 1998, 1999, 2000 and 2001 BYs of captive broodstock at the time of tagging................................26
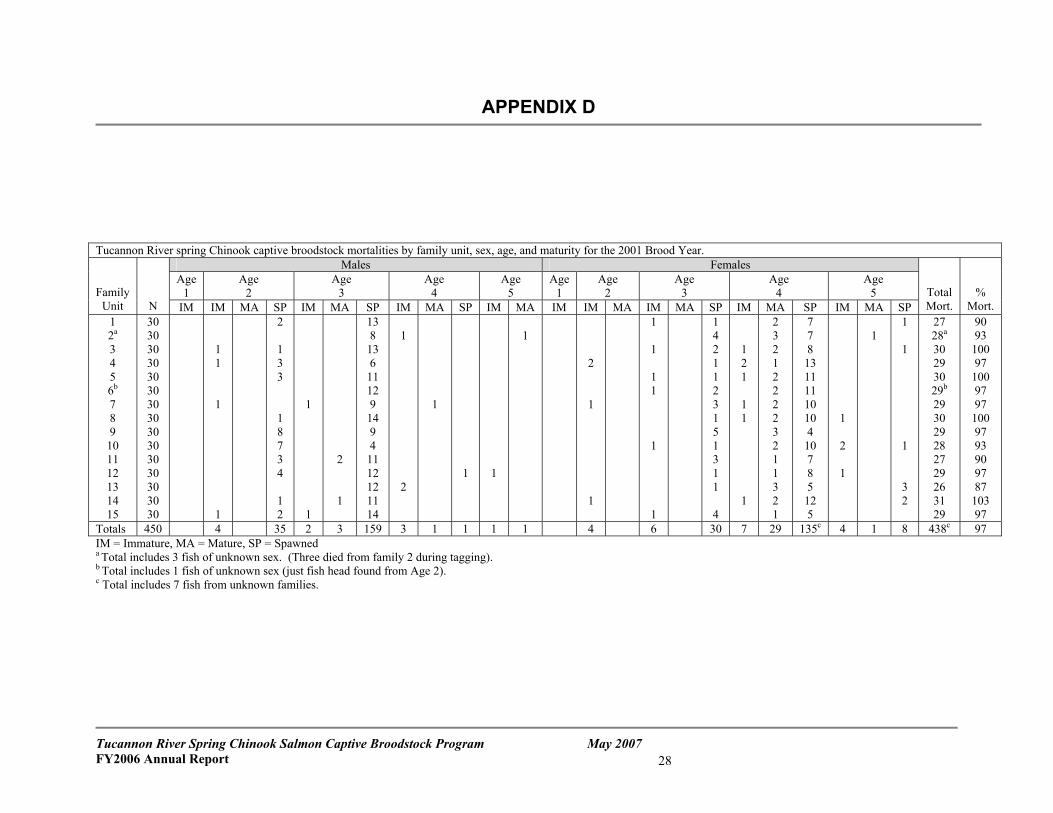
Appendix D: Tucannon River spring Chinook captive broodstock mortalities by family unit, sex, age, and maturity for the 2001 brood year......................................28 Appendix E .................................................................................................................................29
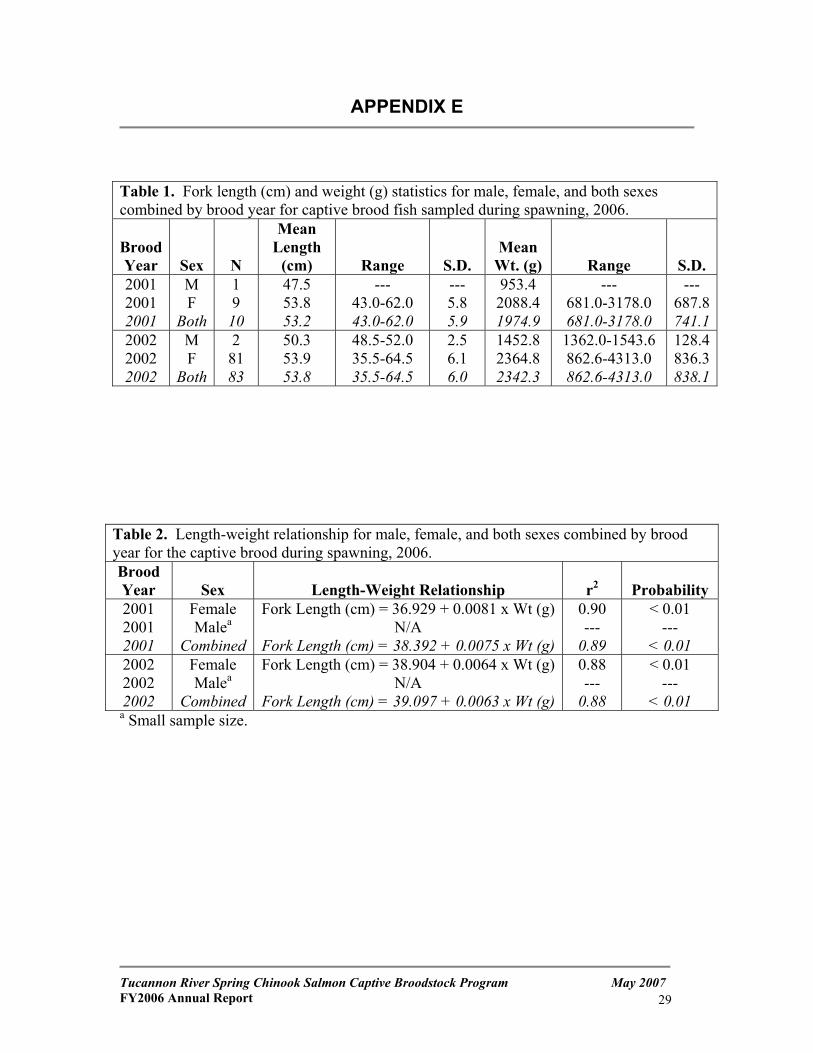
Table 1. Fork length (cm) and weight (g) statistics for male, female, and both sexes combined by brood year for captive brood fish sampled during spawning, 2006.................................................................................................................................29
Table 2. Length-weight relationship for male, female, and both sexes combined by brood year for the captive brood during spawning, 2006 ...............................................29
Appendix F: Summary of captive brood progeny releases from the Tucannon River Spring Chinook Captive Broodstock Program .....................................................30 Appendix G: Genetic assessment of spring Chinook in the Tucannon River (2005) using a microsatellite DNA analysis.....................................................................31
Tucannon River Spring Chinook Salmon Captive Broodstock Program May 2007 FY2006 Annual Report
v
Introduction
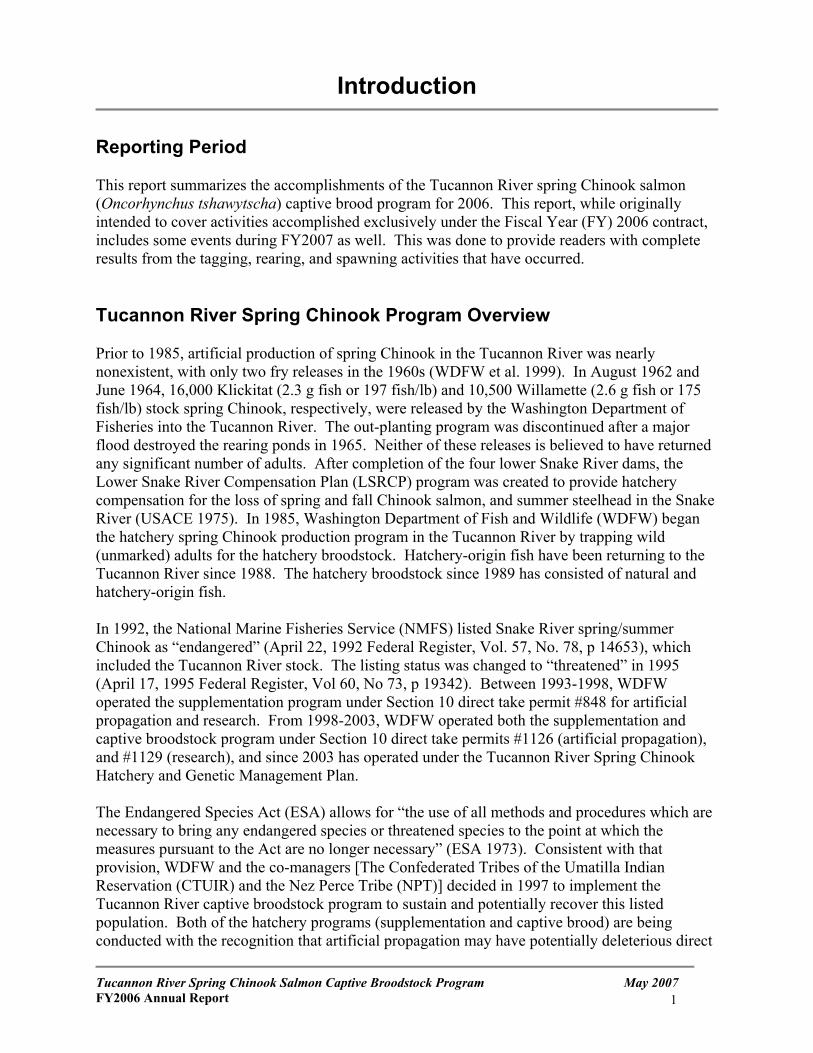
Reporting Period This report summarizes the accomplishments of the Tucannon River spring Chinook salmon (Oncorhynchus tshawytscha) captive brood program for 2006. This report, while originally intended to cover activities accomplished exclusively under the Fiscal Year (FY) 2006 contract, includes some events during FY2007 as well. This was done to provide readers with complete results from the tagging, rearing, and spawning activities that have occurred. Tucannon River Spring Chinook Program Overview Prior to 1985, artificial production of spring Chinook in the Tucannon River was nearly nonexistent, with only two fry releases in the 1960s (WDFW et al. 1999). In August 1962 and June 1964, 16,000 Klickitat (2.3 g fish or 197 fish/lb) and 10,500 Willamette (2.6 g fish or 175 fish/lb) stock spring Chinook, respectively, were released by the Washington Department of Fisheries into the Tucannon River. The out-planting program was discontinued after a major flood destroyed the rearing ponds in 1965. Neither of these releases is believed to have returned any significant number of adults. After completion of the four lower Snake River dams, the Lower Snake River Compensation Plan (LSRCP) program was created to provide hatchery compensation for the loss of spring and fall Chinook salmon, and summer steelhead in the Snake River (USACE 1975). In 1985, Washington Department of Fish and Wildlife (WDFW) began the hatchery spring Chinook production program in the Tucannon River by trapping wild (unmarked) adults for the hatchery broodstock. Hatchery-origin fish have been returning to the Tucannon River since 1988. The hatchery broodstock since 1989 has consisted of natural and hatchery-origin fish. In 1992, the National Marine Fisheries Service (NMFS) listed Snake River spring/summer Chinook as “endangered” (April 22, 1992 Federal Register, Vol. 57, No. 78, p 14653), which included the Tucannon River stock. The listing status was changed to “threatened” in 1995 (April 17, 1995 Federal Register, Vol 60, No 73, p 19342). Between 1993-1998, WDFW operated the supplementation program under Section 10 direct take permit #848 for artificial propagation and research. From 1998-2003, WDFW operated both the supplementation and captive broodstock program under Section 10 direct take permits #1126 (artificial propagation), and #1129 (research), and since 2003 has operated under the Tucannon River Spring Chinook Hatchery and Genetic Management Plan. The Endangered Species Act (ESA) allows for “the use of all methods and procedures which are necessary to bring any endangered species or threatened species to the point at which the measures pursuant to the Act are no longer necessary” (ESA 1973). Consistent with that provision, WDFW and the co-managers [The Confederated Tribes of the Umatilla Indian Reservation (CTUIR) and the Nez Perce Tribe (NPT)] decided in 1997 to implement the Tucannon River captive broodstock program to sustain and potentially recover this listed population. Both of the hatchery programs (supplementation and captive brood) are being conducted with the recognition that artificial propagation may have potentially deleterious direct
Tucannon River Spring Chinook Salmon Captive Broodstock Program May 2007 FY2006 Annual Report
1
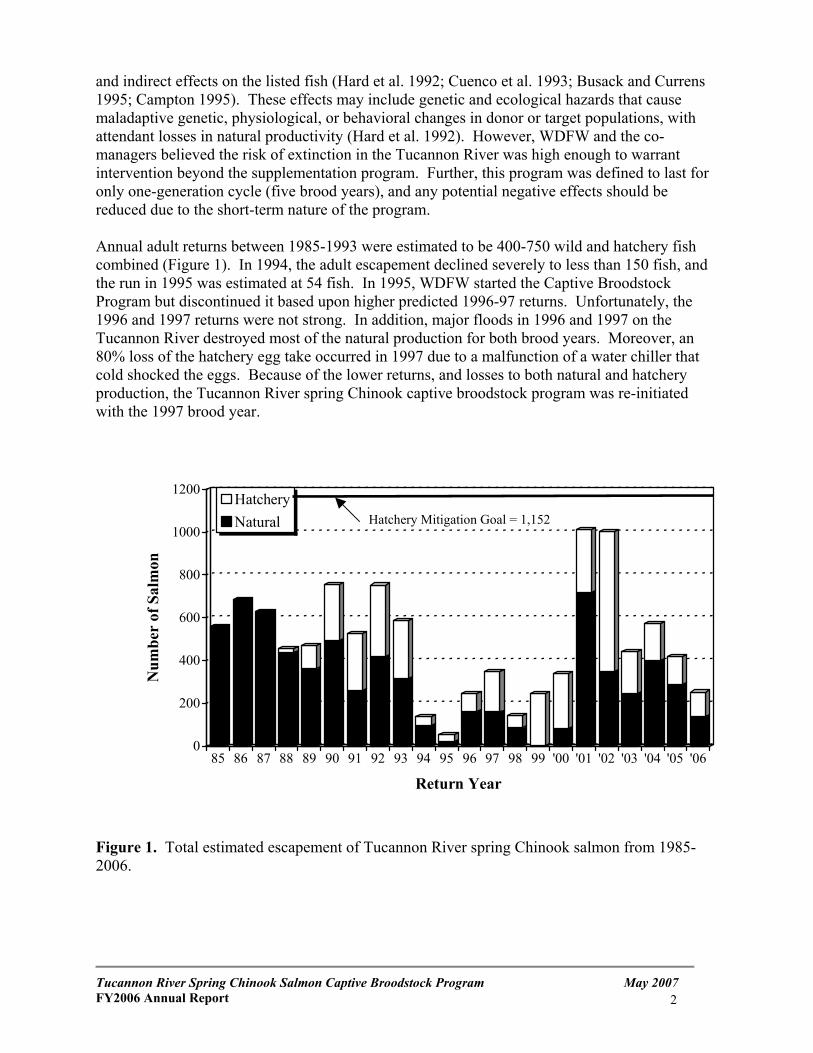
and indirect effects on the listed fish (Hard et al. 1992; Cuenco et al. 1993; Busack and Currens 1995; Campton 1995). These effects may include genetic and ecological hazards that cause maladaptive genetic, physiological, or behavioral changes in donor or target populations, with attendant losses in natural productivity (Hard et al. 1992). However, WDFW and the co-managers believed the risk of extinction in the Tucannon River was high enough to warrant intervention beyond the supplementation program. Further, this program was defined to last for only one-generation cycle (five brood years), and any potential negative effects should be reduced due to the short-term nature of the program. Annual adult returns between 1985-1993 were estimated to be 400-750 wild and hatchery fish combined (Figure 1). In 1994, the adult escapement declined severely to less than 150 fish, and the run in 1995 was estimated at 54 fish. In 1995, WDFW started the Captive Broodstock Program but discontinued it based upon higher predicted 1996-97 returns. Unfortunately, the 1996 and 1997 returns were not strong. In addition, major floods in 1996 and 1997 on the Tucannon River destroyed most of the natural production for both brood years. Moreover, an 80% loss of the hatchery egg take occurred in 1997 due to a malfunction of a water chiller that cold shocked the eggs. Because of the lower returns, and losses to both natural and hatchery production, the Tucannon River spring Chinook captive broodstock program was re-initiated with the 1997 brood year.
0
200
400
600
800
1000
1200
Num
ber
of S
alm
on
85 86 87 88 89 90 91 92 93 94 95 96 97 98 99 '00 '01 '02 '03 '04 '05 '06
Return Year
HatcheryNatural Hatchery Mitigation Goal = 1,152
Figure 1. Total estimated escapement of Tucannon River spring Chinook salmon from 1985-2006.
Tucannon River Spring Chinook Salmon Captive Broodstock Program May 2007 FY2006 Annual Report
2
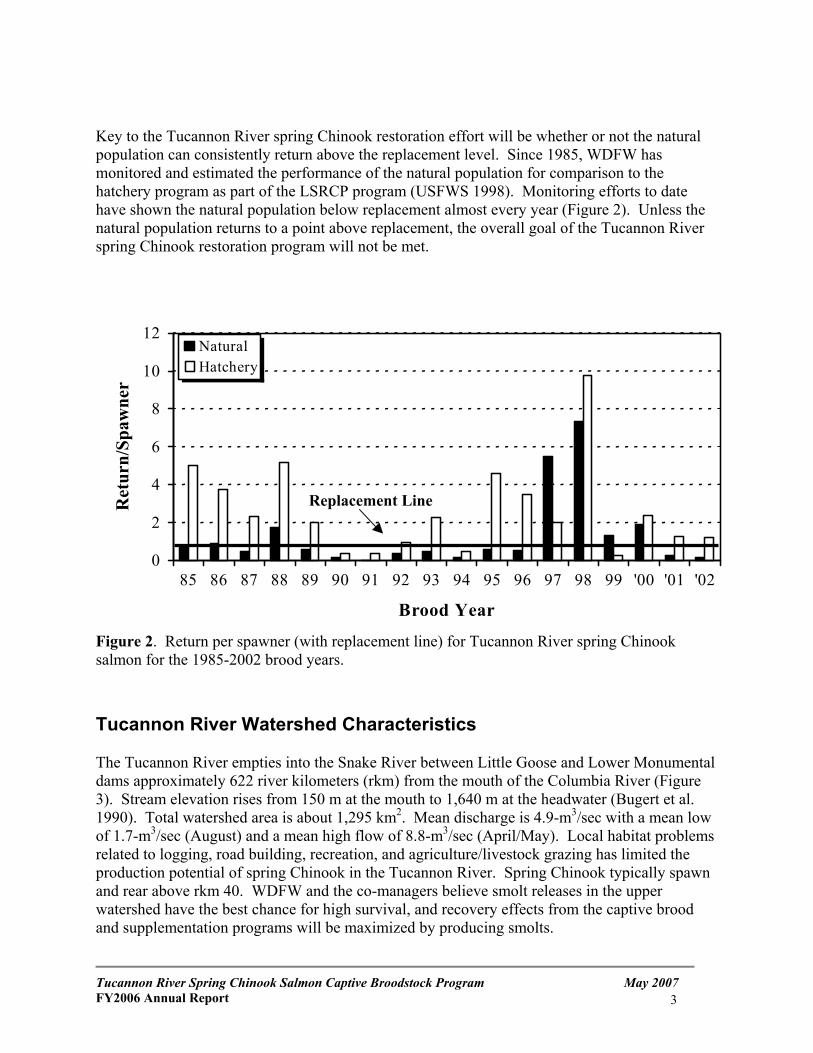
Key to the Tucannon River spring Chinook restoration effort will be whether or not the natural population can consistently return above the replacement level. Since 1985, WDFW has monitored and estimated the performance of the natural population for comparison to the hatchery program as part of the LSRCP program (USFWS 1998). Monitoring efforts to date have shown the natural population below replacement almost every year (Figure 2). Unless the natural population returns to a point above replacement, the overall goal of the Tucannon River spring Chinook restoration program will not be met.
0
2
4
6
8
10
12
85 86 87 88 89 90 91 92 93 94 95 96 97 98 99 '00 '01 '02
Brood Year
Ret
urn/
Spaw
ner
Natural
Figure 2. Return per spawner (with replacement line) for Tucannon River spring Chinook salmon for the 1985-2002 brood years.
Replacement Line
Hatchery
Tucannon River Watershed Characteristics The Tucannon River empties into the Snake River between Little Goose and Lower Monumental dams approximately 622 river kilometers (rkm) from the mouth of the Columbia River (Figure 3). Stream elevation rises from 150 m at the mouth to 1,640 m at the headwater (Bugert et al. 1990). Total watershed area is about 1,295 km2. Mean discharge is 4.9-m3/sec with a mean low of 1.7-m3/sec (August) and a mean high flow of 8.8-m3/sec (April/May). Local habitat problems related to logging, road building, recreation, and agriculture/livestock grazing has limited the production potential of spring Chinook in the Tucannon River. Spring Chinook typically spawn and rear above rkm 40. WDFW and the co-managers believe smolt releases in the upper watershed have the best chance for high survival, and recovery effects from the captive brood and supplementation programs will be maximized by producing smolts.
Tucannon River Spring Chinook Salmon Captive Broodstock Program May 2007 FY2006 Annual Report
3
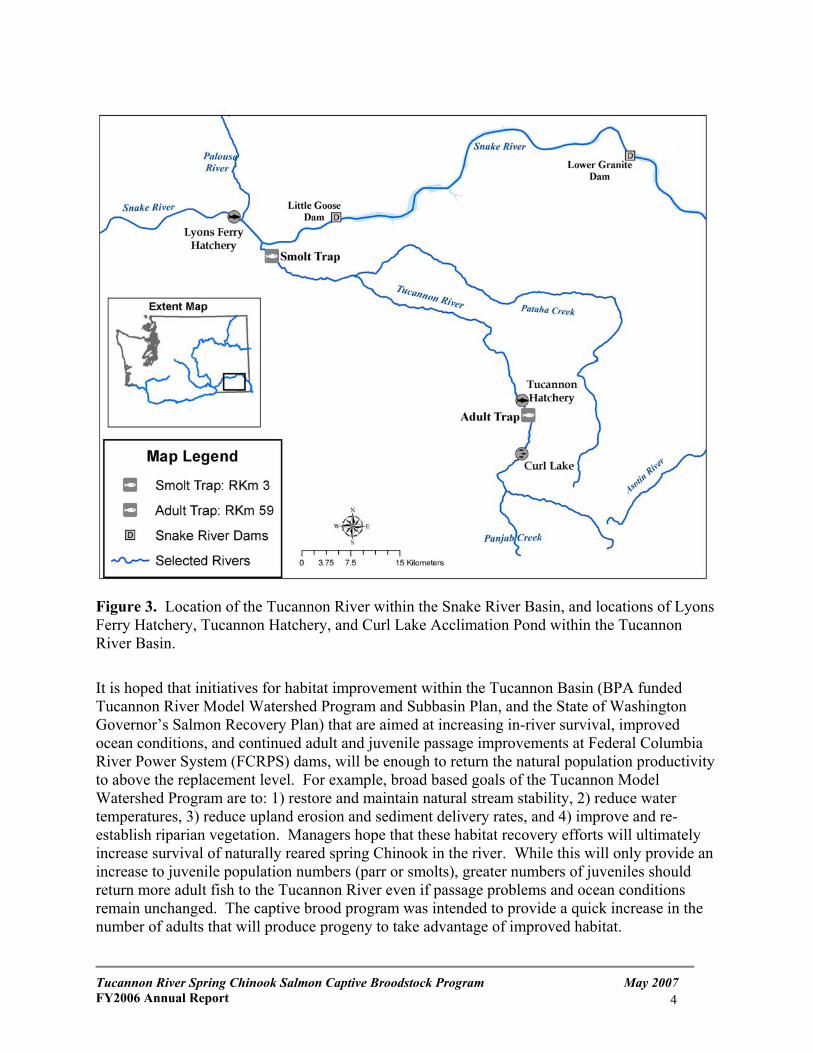
Figure 3. Location of the Tucannon River within the Snake River Basin, and locations of Lyons Ferry Hatchery, Tucannon Hatchery, and Curl Lake Acclimation Pond within the Tucannon River Basin.
It is hoped that initiatives for habitat improvement within the Tucannon Basin (BPA funded Tucannon River Model Watershed Program and Subbasin Plan, and the State of Washington Governor’s Salmon Recovery Plan) that are aimed at increasing in-river survival, improved ocean conditions, and continued adult and juvenile passage improvements at Federal Columbia River Power System (FCRPS) dams, will be enough to return the natural population productivity to above the replacement level. For example, broad based goals of the Tucannon Model Watershed Program are to: 1) restore and maintain natural stream stability, 2) reduce water temperatures, 3) reduce upland erosion and sediment delivery rates, and 4) improve and re-establish riparian vegetation. Managers hope that these habitat recovery efforts will ultimately increase survival of naturally reared spring Chinook in the river. While this will only provide an increase to juvenile population numbers (parr or smolts), greater numbers of juveniles should return more adult fish to the Tucannon River even if passage problems and ocean conditions remain unchanged. The captive brood program was intended to provide a quick increase in the number of adults that will produce progeny to take advantage of improved habitat.
Tucannon River Spring Chinook Salmon Captive Broodstock Program May 2007 FY2006 Annual Report
4
Facility Descriptions The spring Chinook supplementation program currently utilizes three different WDFW facilities: Lyons Ferry Hatchery (LFH), Tucannon Fish Hatchery (TFH), and Curl Lake Acclimation Pond (AP). Each of these facilities will also be used in some manner for the captive broodstock program for rearing, release and subsequent adult capture upon return. Lyons Ferry Hatchery is located on the Snake River (rkm 90) at its confluence with the Palouse River (Figure 3). LFH was constructed with funds provided by the Army Corps of Engineers, and has subsequently been funded through the LSRCP program of the U.S. Fish and Wildlife Service. Ultimately, the FCRPS through BPA bears the cost of the LSRCP program. Lyons Ferry is used for adult broodstock holding and spawning, and incubation and early life rearing until production marking. Fifteen 1.2-m diameter circular starter tanks were purchased when the captive broodstock program was started in 1995. In 1999, LSRCP purchased and supplied the funding for installation of eight 6.1-m diameter circular rearing tanks for the adults, and for relocation of the small circular tanks. The tanks were installed during August and September of 1999 in the captive broodstock rearing area at LFH. During 2000, BPA supplied funding for security fencing around the broodstock rearing area. A diagram of the captive broodstock facility is shown in Appendix A. Tucannon Hatchery, located at rkm 59 on the Tucannon River (Figure 3), has an adult collection trap on-site. Following marking at LFH, juveniles are transferred to TFH to rear through winter. In mid-February, the fish are transferred to Curl Lake AP for a minimum of three weeks acclimation. Curl Lake AP is a 0.85 ha natural bottom lake with a mean depth of 2.8 meters (pond volume estimated at 22,203 m³). Sometime between the middle of March and the first of April, the pond exit is opened and the fish are allowed to volitionally emigrate from the lake until the third week of April when they are forced out. Monitoring and Evaluation As previously mentioned, the LSRCP Tucannon River spring Chinook supplementation program has ongoing evaluations. Some of the monitoring and evaluation activities include: smolt release sampling, smolt trapping, spawning ground surveys, genetic monitoring, snorkel surveys for juvenile population estimates, spawning, fecundity monitoring, and experimental release strategies for smolts. Through these and other activities, survival rates of the natural and hatchery fish have been documented for the span of the supplementation program. These same and other activities will continue to play a major role in evaluating the success of the captive broodstock program in the future (for both parents and progeny). As part of the monitoring plan, survival and rate of maturation are being documented by family groups within each brood year. Fecundity and egg size in relation to spawning success will be documented for all spawned captive broodstock females. Maturation timing will be monitored as well as overall growth rates for each brood year. Smolt migration will be monitored through the use of Passive Integrated Transponder (PIT) tags, and adult return rates will be monitored through adult trapping and carcass recoveries during spawning ground surveys.
Tucannon River Spring Chinook Salmon Captive Broodstock Program May 2007 FY2006 Annual Report
5
Captive Broodstock Program
The overall goal of the Tucannon River spring Chinook salmon captive broodstock program is for the short-term, and eventually long-term, rebuilding of the natural run, with the intent that the natural population will sustain itself. The current hatchery mitigation goal under the LSRCP is to return 1,152 adult spring Chinook of Tucannon River stock to the river annually. Attempts to reach the LSRCP mitigation goal through an annual release of 132,000 smolts have failed largely because of poor smolt-to-adult survival rates. Currently, there is not an escapement goal for naturally produced spring Chinook in the Tucannon River. It is hoped that through re-negotiation of the Columbia River Fish Management Plan (CRFMP), and as part of the development of a Snake River Chinook recovery plan, an agreed upon natural production goal will be established. The captive broodstock program is not intended to replace the hatchery supplementation program. Rather, it is to provide a quick “boost” to the population in the short term because of poor runs initially predicted through 2000. A quick “boost” would not be possible under the existing supplementation program, as it would require about 200 adults for hatchery broodstock each year. This was not believed possible by WDFW biologists, as returns from 1998-2000 were expected to be less than 200 total fish annually. Further, such an increase would have required taking more fish from the river, nearly eliminating all natural production. WDFW believed that the low runs between 1997-2000 would limit both natural and hatchery production, possibly to a point where the run would not be able to recover. Based on this conclusion, the captive broodstock program was initiated. The program is scheduled to terminate with the final release of smolts in 2008. Successes and failures during and after the program ends will be evaluated by WDFW concurrently with the LSRCP hatchery evaluation program. The captive broodstock goal is to collect 290,000 eggs/year from captive brood females when three complete age classes (Age 3-Age 5) are spawned concurrently. Under the original program design, these eggs are expected to produce about 150,000 smolts for release from the Curl Lake AP. Depending on smolts produced each year this should provide a return of about 300 adult fish of captive broodstock origin per year between 2005-2010. These fish combined with fish from the hatchery supplementation program and natural production from the river should return 600-700 fish annually between 2005-2010. While this return is still well below the LSRCP mitigation goal, it would increase the in-river population level to a pre-1994 level. As described in the Master Plan, measures have been taken to minimize and mitigate potential genetic and/or ecological hazards of this program to the listed population (WDFW et al. 1999). Captive brood program production (adults, eggs, or juveniles) in excess of the smolt goal may be released by other methods as discussed in the Master Plan (WDFW et al. 1999). Options include adult outplants, remote site egg incubation, fry outplants, or smolt releases into other systems deemed suitable for Tucannon River spring Chinook stock introductions.
Tucannon River Spring Chinook Salmon Captive Broodstock Program May 2007 FY2006 Annual Report
6
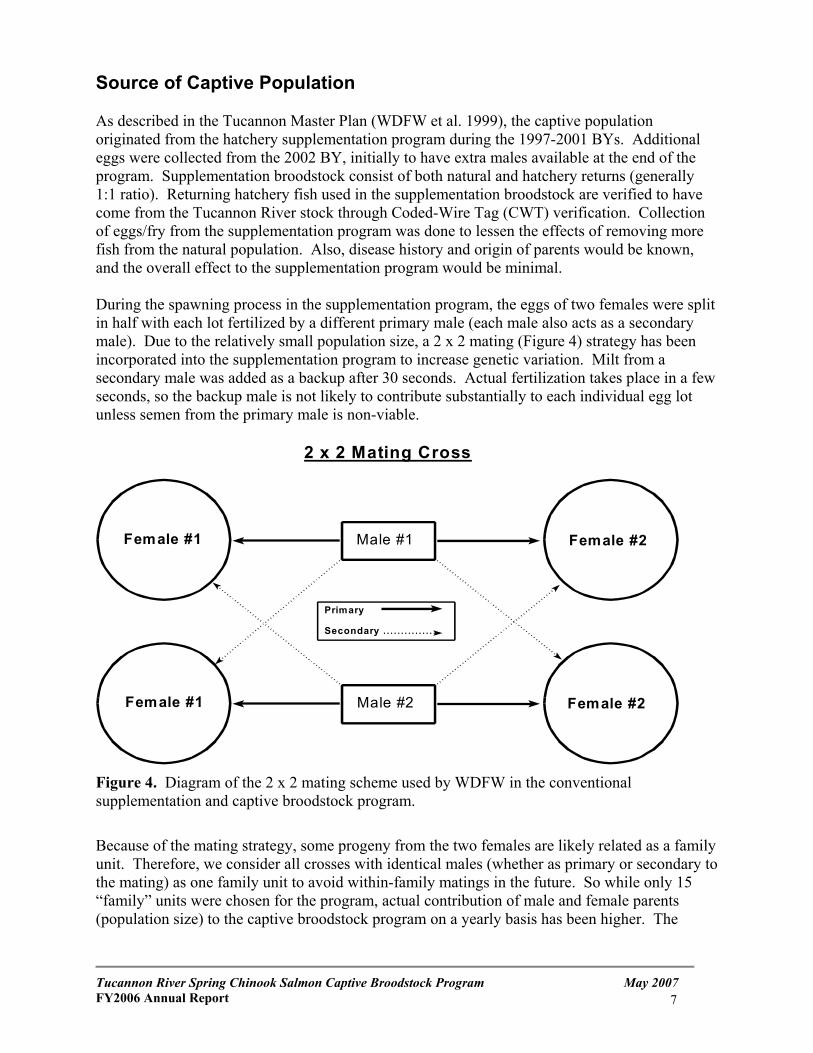
Source of Captive Population As described in the Tucannon Master Plan (WDFW et al. 1999), the captive population originated from the hatchery supplementation program during the 1997-2001 BYs. Additional eggs were collected from the 2002 BY, initially to have extra males available at the end of the program. Supplementation broodstock consist of both natural and hatchery returns (generally 1:1 ratio). Returning hatchery fish used in the supplementation broodstock are verified to have come from the Tucannon River stock through Coded-Wire Tag (CWT) verification. Collection of eggs/fry from the supplementation program was done to lessen the effects of removing more fish from the natural population. Also, disease history and origin of parents would be known, and the overall effect to the supplementation program would be minimal. During the spawning process in the supplementation program, the eggs of two females were split in half with each lot fertilized by a different primary male (each male also acts as a secondary male). Due to the relatively small population size, a 2 x 2 mating (Figure 4) strategy has been incorporated into the supplementation program to increase genetic variation. Milt from a secondary male was added as a backup after 30 seconds. Actual fertilization takes place in a few seconds, so the backup male is not likely to contribute substantially to each individual egg lot unless semen from the primary male is non-viable.
2 x 2 Mating Cross
Female #1 Male #1
Male #2
Primary
Secondary
Female #1
Female #2
Female #2
Figure 4. Diagram of the 2 x 2 mating scheme used by WDFW in the conventional supplementation and captive broodstock program.
Because of the mating strategy, some progeny from the two females are likely related as a family unit. Therefore, we consider all crosses with identical males (whether as primary or secondary to the mating) as one family unit to avoid within-family matings in the future. So while only 15 “family” units were chosen for the program, actual contribution of male and female parents (population size) to the captive broodstock program on a yearly basis has been higher. The
Tucannon River Spring Chinook Salmon Captive Broodstock Program May 2007 FY2006 Annual Report
7
actual number of parents that comprise the 1997-2002 BYs are given in Appendix B. Effective population size for each brood year was calculated by the formula: Ne = 4 (NM)(NF)/(NM + NF) Where: NM = number of males NF = number of females The effective population sizes of the 1997-2002 BYs were 53, 58, 42, 56, 58, and 59, respectively. Allendorf and Ryman (1987) and Verspoor (1988) have suggested that little (<1%) genetic variability will be lost in most salmonid species if the Ne of the founding population is greater than 50. Selection of eggs/fry for the captive brood program was based on Bacterial Kidney Disease (BKD) and virology screening of females, parent origin, and matings (Appendix B). Spawned females were examined for BKD using the Enzyme Linked Immunosorbent Assay (ELISA) technique. Only females that were given a “Low” (0.11 - 0.19 Optical Density (OD)) or “Below Low” (< 0.11 OD) ELISA result were selected, with priority given to “Below Low” females. Priority for selection (in the following order) of eggs/fry was given to Wild x Wild, Wild x Hatchery (Mixed), and Hatchery x Hatchery crosses. All BYs identified for the program followed the same criteria. Screening for BKD was a major factor in WDFW’s decision to collect eggs/fry from the supplementation program. By having the test results prior to selection, and by having rearing criteria that called for minimal sampling/handling, we felt that BKD outbreaks would be minimized. To date, we know of no mortalities that can be attributed to BKD in the captive brood population. Eighty fish from each of the 15 “family units” were selected (1,200 total fish) from each BY and moved to the 1.2-m circular fiberglass tanks. After rearing for one year, each of the “family” groups was reduced to 30 fish/family (450 fish/BY) by random selection just prior to marking. Excess fish were returned to the supplementation production group. Fish destined for the captive broodstock program were marked by “family” group with a CWT in the snout and adipose fin (backup). This was to verify “family” groups during future spawning activities so that full or half-siblings were not mated together. In addition to the CWT, an alphanumeric visual implant (VI) tag was placed behind the left or right eye to identify each fish. The VI tag, should it be retained, would provide a quicker “family” identification method than the CWT. In addition, fish that retain the VI would provide individual growth rates. After the fish were tagged, they were transferred to one of the 6.1-m circular fiberglass tanks for rearing to maturity. Once the fish were transferred to the larger rearing tanks, they were not moved again unless survival rates were greater than anticipated, or density limits were exceeded within the rearing tanks. At maturity, fish were transferred to the adult raceway located in the spawning building. Family size and marking procedures were the same for all brood years collected. Density limits for each rearing tank were established prior to any stocking of fish. Most of the density limits prescribed were taken from the WDFW Dungeness River Captive Broodstock Program, where similar size starter and adult rearing tanks were used. Based on those density limits and expected survival and maturation rates, we were able to design the facilities needed.
Tucannon River Spring Chinook Salmon Captive Broodstock Program May 2007 FY2006 Annual Report
8
The current fish number maximums are as follows: 1.2-m circular tanks = no more than 200 fish/tank at Age 1; 6.1-m circular tanks = no more than 150 fish/tank at Age 3, or 100 fish/tank at Age 4. Fry from each brood year were collected as described above, with appropriate families chosen for the program (Appendix B). Data on average length (mm), weight (g), and condition factor (K) for each “family” group were compiled during tagging (Appendix C). Rearing, Spawning, and Release Captive brood fish are reared at LFH using standard fish culture practices and approved theraputants in pathogen free well water that is a constant 11ºC. Each 6.1-m circular captive tank is supplied with about 581 L/min water flow, while the 1.2-m tanks receive about 23 L/min. To reduce the risk of catastrophic fish loss due to hatchery facility or operational failure, a number of safeguards are in place. LFH is staffed full time by personnel living on-station, providing for the protection of fish from vandalism and predation. The hatchery is also equipped with back-up generators in the event of power outages. All staff are trained in proper fish handling, transport, rearing, biological sampling, and WDFW fish health maintenance procedures to minimize the risk of fish loss due to human error. All fish are handled, transported, and propagated in accordance with the WDFW Fish Health Manual (WDFW 1996) and Pacific Northwest Fish Health Protection Committee (PNFHPC 1989) disease prevention and control standards to minimize loss due to disease. Sanitation procedures are employed to reduce the transfer and incidence of fish diseases, and to promote quality fish in accordance with PNFHPC (1989) and Integrated Hatcheries Operations Team (1995) guidelines. A variety of high quality commercial feed is provided through a state contract, and feed size varies with the estimated fish size of the different BYs. To date, we have used Moore-Clark NutraTM, Moore-Clark FryTM, Bio-Products Salmon Brood FeedTM, and Moore-Clark Pedigree Trout Brood FeedTM on the captive brood. Estimated size only is generally used to prescribe feeding rates, as WDFW decided initially that too much handling of the fish to determine growth and size would jeopardize fish health. This decision resulted from problems that Oregon Department of Fish and Wildlife (ODFW) and Idaho Department of Fish and Game (IDFG) captive programs experienced during their first years of operation with monthly fish sampling (Bumgarner and Gallinat 2001). Due to the degree of early maturation of females in the 1997 and 1998 brood years, size-at-age recommendations were revised to produce more mature Age 4 and 5 fish. Size-at-age goals are: Age 1, 20-25 g; Age 2, 150-200 g; Age 3, 900 g; and Age 4, 4,000 g. All captive brood fish are reared outside under natural photoperiod conditions. However, each of the 6.1-m circular tanks are covered with camouflage netting which shades the pond. The netting also prevents fish from jumping out of the tank.
Tucannon River Spring Chinook Salmon Captive Broodstock Program May 2007 FY2006 Annual Report
9
During the summer (late June to early July), captive brood fish that are Age 2 or greater are examined for signs of sexual maturation. Maturation is determined by change in body coloration, as other morphological sexual characteristics are not as obvious. Mature female captive broodstock were injected with Erythromycin (0.5 cc/4.5 kg of body weight) at sorting to prevent Bacterial Kidney Disease. The broodstock are also treated with a formalin flush (167 ppm) every other day to control fungus. Mature fish (primarily Age 2 jacks) not used for spawning are sacrificed at the end of the spawning season.
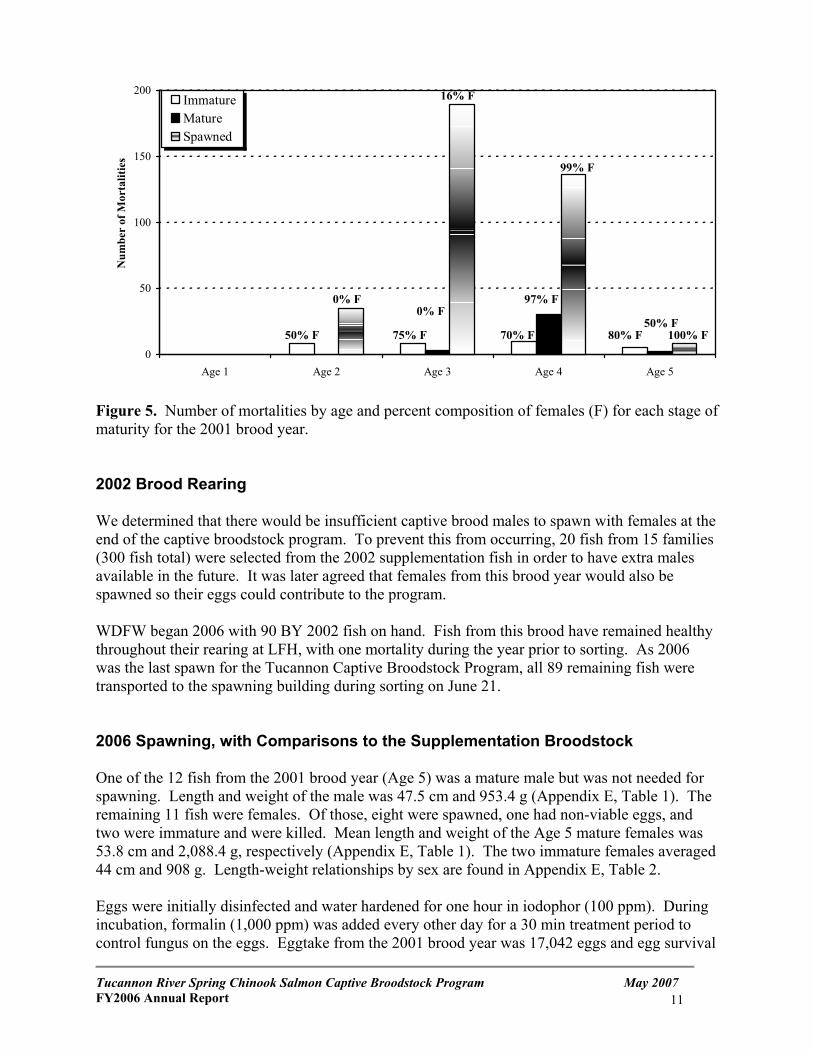
All captive brood progeny smolts are marked differently from supplementation progeny for identification upon adult return. Smolts are unclipped and marked with an agency-only wire tag (2000-2002 BYs) or CWT in the snout (production fish have an elastomer tag and CWT). When supplementation or captive brood fish return as adults at the TFH adult trap, each unmarked (no adipose clip) adult spring Chinook will be scanned for wire in the snout and examined for a VI tag. If the fish is not adipose fin clipped, and wire is present in the snout and no VI is present, the fish is likely from the captive broodstock program and will be passed upstream to spawn in the river. Only if the run completely collapses would any of the captive broodstock fish be collected for hatchery broodstock. We started the year (Jan. 1, 2006) with 15 01BY and 90 02BY fish on hand. The paragraphs below detail the rearing, sorting, spawning activities, and mortalities for each BY during 2006 as well as the inventory and release information for the 2005 and 2006 progeny groups. 2001 Brood Rearing We began 2006 with 15 BY 2001 fish on hand. Fish from this brood remained healthy throughout their rearing at LFH. There were three mortalities during the year not related to spawning (Appendix D). Since Age 1, there have only been 31 (7.0%) mortalities not related to maturation. The captive broodstock were sorted for maturity on June 21, 2006. Since we are only keeping each broodstock to the age of 5, all 12 fish from the 01 BY were transported to the spawning raceway for holding. All captive brood fish at the spawning building were held downstream of the supplementation broodstock captured at the adult trap on the Tucannon River to aid in maturation timing. Mature captive broodstock were held upstream of broodstock collected from the river in 2003 to address possible disease concerns, however spawn timing appeared to be adversely affected (Gallinat 2004). Length and weight samples were not collected from the 01 BY before transport. Mortalities by age for each stage of maturity have been followed since program inception (Figure 5). Fish from the captive brood program have matured earlier than fish from the supplementation program (Figure 5, Appendix D). Captive brood males began to mature at Age 2 and captive brood females began to mature at Age 3 (Figure 5). Mature fish not used for spawning are fish that were in excess of the number required for spawning or mature fish that did not become ripe in time for spawning (Figure 5).
Tucannon River Spring Chinook Salmon Captive Broodstock Program May 2007 FY2006 Annual Report
10
0
50
100
150
200
Age 1 Age 2 Age 3 Age 4 Age 5
Num
ber
of M
orta
litie
s
ImmatureMatureSpawned
50% F
0% F
75% F
0% F
16% F
70% F
97% F
99% F
80% F 50% F
100% F
Figure 5. Number of mortalities by age and percent composition of females (F) for each stage of maturity for the 2001 brood year. 2002 Brood Rearing We determined that there would be insufficient captive brood males to spawn with females at the end of the captive broodstock program. To prevent this from occurring, 20 fish from 15 families (300 fish total) were selected from the 2002 supplementation fish in order to have extra males available in the future. It was later agreed that females from this brood year would also be spawned so their eggs could contribute to the program. WDFW began 2006 with 90 BY 2002 fish on hand. Fish from this brood have remained healthy throughout their rearing at LFH, with one mortality during the year prior to sorting. As 2006 was the last spawn for the Tucannon Captive Broodstock Program, all 89 remaining fish were transported to the spawning building during sorting on June 21. 2006 Spawning, with Comparisons to the Supplementation Broodstock One of the 12 fish from the 2001 brood year (Age 5) was a mature male but was not needed for spawning. Length and weight of the male was 47.5 cm and 953.4 g (Appendix E, Table 1). The remaining 11 fish were females. Of those, eight were spawned, one had non-viable eggs, and two were immature and were killed. Mean length and weight of the Age 5 mature females was 53.8 cm and 2,088.4 g, respectively (Appendix E, Table 1). The two immature females averaged 44 cm and 908 g. Length-weight relationships by sex are found in Appendix E, Table 2. Eggs were initially disinfected and water hardened for one hour in iodophor (100 ppm). During incubation, formalin (1,000 ppm) was added every other day for a 30 min treatment period to control fungus on the eggs. Eggtake from the 2001 brood year was 17,042 eggs and egg survival
Tucannon River Spring Chinook Salmon Captive Broodstock Program May 2007 FY2006 Annual Report
11
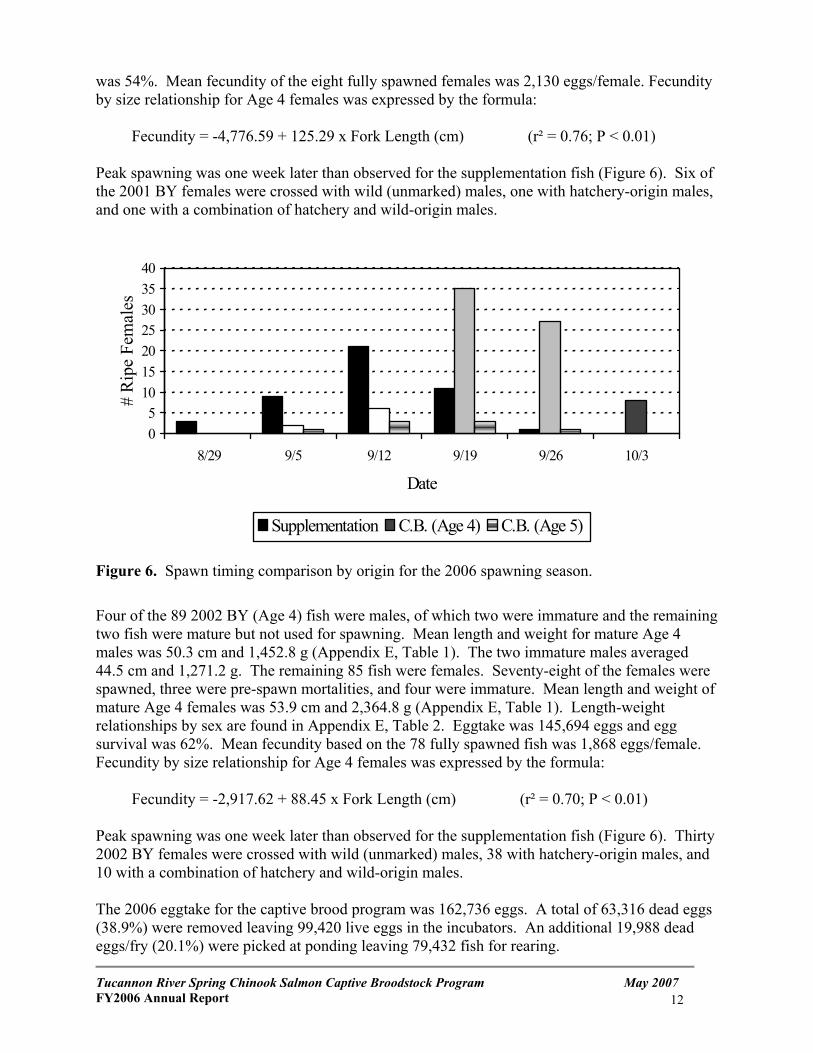
was 54%. Mean fecundity of the eight fully spawned females was 2,130 eggs/female. Fecundity by size relationship for Age 4 females was expressed by the formula: Fecundity = -4,776.59 + 125.29 x Fork Length (cm) (r² = 0.76; P < 0.01) Peak spawning was one week later than observed for the supplementation fish (Figure 6). Six of the 2001 BY females were crossed with wild (unmarked) males, one with hatchery-origin males, and one with a combination of hatchery and wild-origin males.
05
10152025303540
8/29 9/5 9/12 9/19 9/26 10/3
Date
# R
ipe
Fem
ales
Supplementation C.B. (Age 5)
C.B. (Age 4)
Figure 6. Spawn timing comparison by origin for the 2006 spawning season.
Four of the 89 2002 BY (Age 4) fish were males, of which two were immature and the remaining two fish were mature but not used for spawning. Mean length and weight for mature Age 4 males was 50.3 cm and 1,452.8 g (Appendix E, Table 1). The two immature males averaged 44.5 cm and 1,271.2 g. The remaining 85 fish were females. Seventy-eight of the females were spawned, three were pre-spawn mortalities, and four were immature. Mean length and weight of mature Age 4 females was 53.9 cm and 2,364.8 g (Appendix E, Table 1). Length-weight relationships by sex are found in Appendix E, Table 2. Eggtake was 145,694 eggs and egg survival was 62%. Mean fecundity based on the 78 fully spawned fish was 1,868 eggs/female. Fecundity by size relationship for Age 4 females was expressed by the formula: Fecundity = -2,917.62 + 88.45 x Fork Length (cm) (r² = 0.70; P < 0.01) Peak spawning was one week later than observed for the supplementation fish (Figure 6). Thirty 2002 BY females were crossed with wild (unmarked) males, 38 with hatchery-origin males, and 10 with a combination of hatchery and wild-origin males.
Tucannon River Spring Chinook Salmon Captive Broodstock Program May 2007 FY2006 Annual Report
12
The 2006 eggtake for the captive brood program was 162,736 eggs. A total of 63,316 dead eggs (38.9%) were removed leaving 99,420 live eggs in the incubators. An additional 19,988 dead eggs/fry (20.1%) were picked at ponding leaving 79,432 fish for rearing.
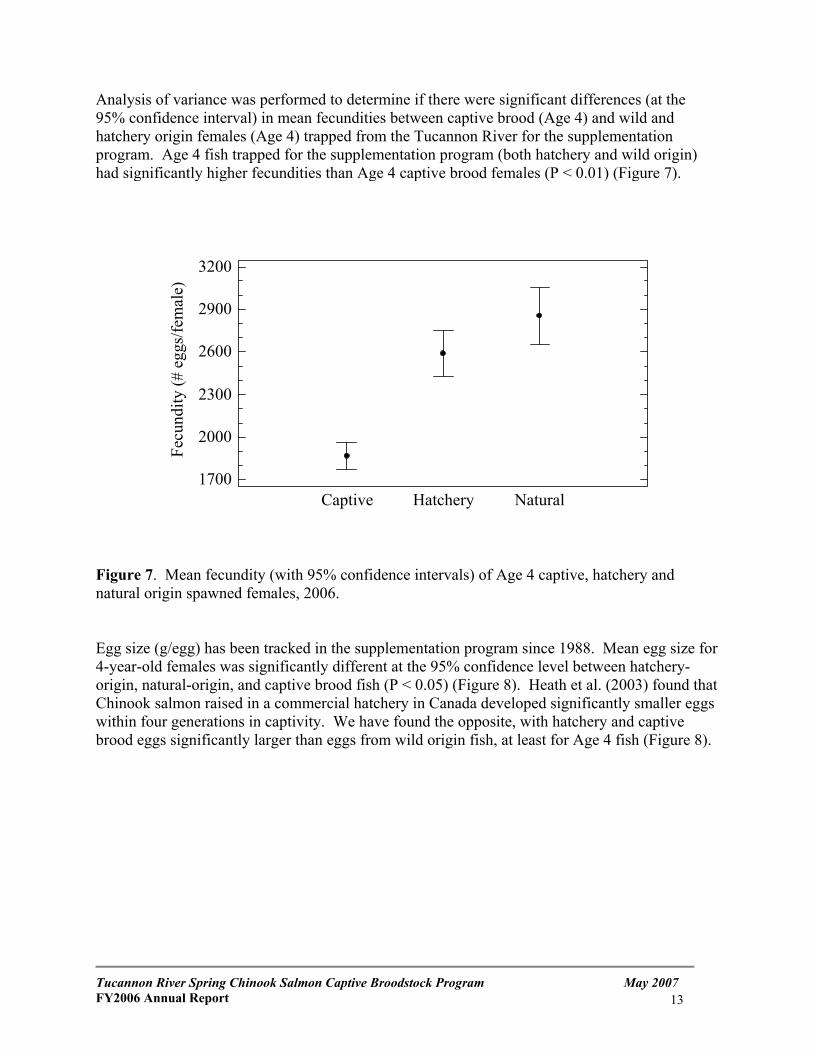
Analysis of variance was performed to determine if there were significant differences (at the 95% confidence interval) in mean fecundities between captive brood (Age 4) and wild and hatchery origin females (Age 4) trapped from the Tucannon River for the supplementation program. Age 4 fish trapped for the supplementation program (both hatchery and wild origin) had significantly higher fecundities than Age 4 captive brood females (P < 0.01) (Figure 7).
Fecu
ndity
(# e
ggs/
fem
ale)
Captive Hatchery Natural1700
2000
2300
2600
2900
3200
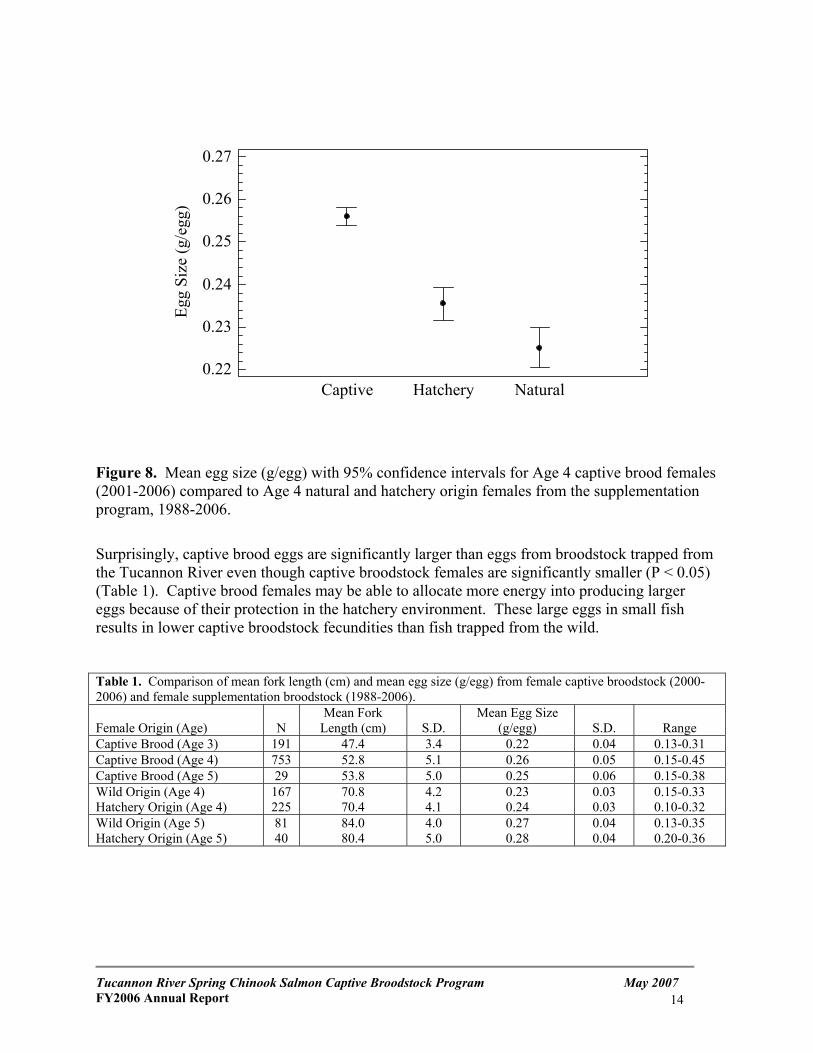
Figure 7. Mean fecundity (with 95% confidence intervals) of Age 4 captive, hatchery and natural origin spawned females, 2006. Egg size (g/egg) has been tracked in the supplementation program since 1988. Mean egg size for 4-year-old females was significantly different at the 95% confidence level between hatchery-origin, natural-origin, and captive brood fish (P < 0.05) (Figure 8). Heath et al. (2003) found that Chinook salmon raised in a commercial hatchery in Canada developed significantly smaller eggs within four generations in captivity. We have found the opposite, with hatchery and captive brood eggs significantly larger than eggs from wild origin fish, at least for Age 4 fish (Figure 8).
Tucannon River Spring Chinook Salmon Captive Broodstock Program May 2007 FY2006 Annual Report
13
Egg
Size
(g/e
gg)
Captive Hatchery Natural0.22
0.23
0.24
0.25
0.26
0.27
Figure 8. Mean egg size (g/egg) with 95% confidence intervals for Age 4 captive brood females (2001-2006) compared to Age 4 natural and hatchery origin females from the supplementation program, 1988-2006.
Surprisingly, captive brood eggs are significantly larger than eggs from broodstock trapped from the Tucannon River even though captive broodstock females are significantly smaller (P < 0.05) (Table 1). Captive brood females may be able to allocate more energy into producing larger eggs because of their protection in the hatchery environment. These large eggs in small fish results in lower captive broodstock fecundities than fish trapped from the wild. Table 1. Comparison of mean fork length (cm) and mean egg size (g/egg) from female captive broodstock (2000-2006) and female supplementation broodstock (1988-2006). Female Origin (Age)
N
Mean Fork Length (cm)
S.D.
Mean Egg Size (g/egg)
S.D.
Range
Captive Brood (Age 3) 191 47.4 3.4 0.22 0.04 0.13-0.31 Captive Brood (Age 4) 753 52.8 5.1 0.26 0.05 0.15-0.45 Captive Brood (Age 5) 29 53.8 5.0 0.25 0.06 0.15-0.38 Wild Origin (Age 4) Hatchery Origin (Age 4)
167 225
70.8 70.4
4.2 4.1
0.23 0.24
0.03 0.03
0.15-0.33 0.10-0.32
Wild Origin (Age 5) Hatchery Origin (Age 5)
81 40
84.0 80.4
4.0 5.0
0.27 0.28
0.04 0.04
0.13-0.35 0.20-0.36
Tucannon River Spring Chinook Salmon Captive Broodstock Program May 2007 FY2006 Annual Report
14
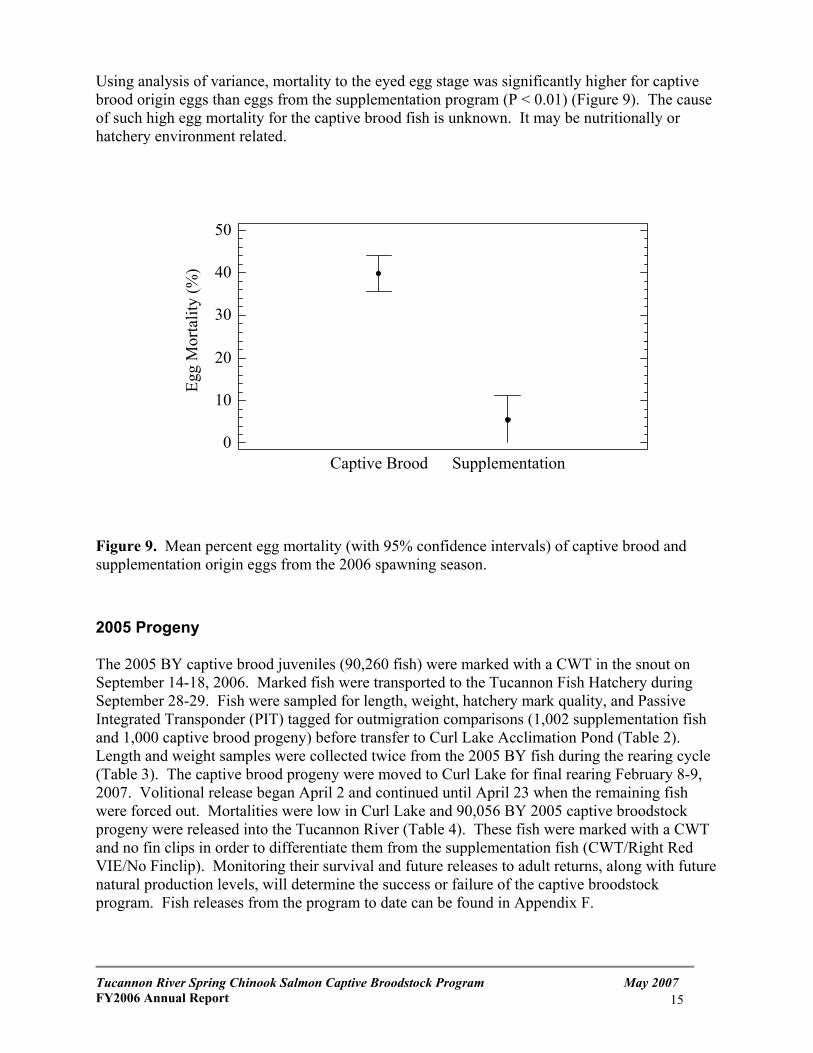
Using analysis of variance, mortality to the eyed egg stage was significantly higher for captive brood origin eggs than eggs from the supplementation program (P < 0.01) (Figure 9). The cause of such high egg mortality for the captive brood fish is unknown. It may be nutritionally or hatchery environment related.
Egg
Mor
talit
y (%
)
Captive Brood Supplementation0
10
20
30
40
50
Figure 9. Mean percent egg mortality (with 95% confidence intervals) of captive brood and supplementation origin eggs from the 2006 spawning season.
2005 Progeny The 2005 BY captive brood juveniles (90,260 fish) were marked with a CWT in the snout on September 14-18, 2006. Marked fish were transported to the Tucannon Fish Hatchery during September 28-29. Fish were sampled for length, weight, hatchery mark quality, and Passive Integrated Transponder (PIT) tagged for outmigration comparisons (1,002 supplementation fish and 1,000 captive brood progeny) before transfer to Curl Lake Acclimation Pond (Table 2). Length and weight samples were collected twice from the 2005 BY fish during the rearing cycle (Table 3). The captive brood progeny were moved to Curl Lake for final rearing February 8-9, 2007. Volitional release began April 2 and continued until April 23 when the remaining fish were forced out. Mortalities were low in Curl Lake and 90,056 BY 2005 captive broodstock progeny were released into the Tucannon River (Table 4). These fish were marked with a CWT and no fin clips in order to differentiate them from the supplementation fish (CWT/Right Red VIE/No Finclip). Monitoring their survival and future releases to adult returns, along with future natural production levels, will determine the success or failure of the captive broodstock program. Fish releases from the program to date can be found in Appendix F.
Tucannon River Spring Chinook Salmon Captive Broodstock Program May 2007 FY2006 Annual Report
15
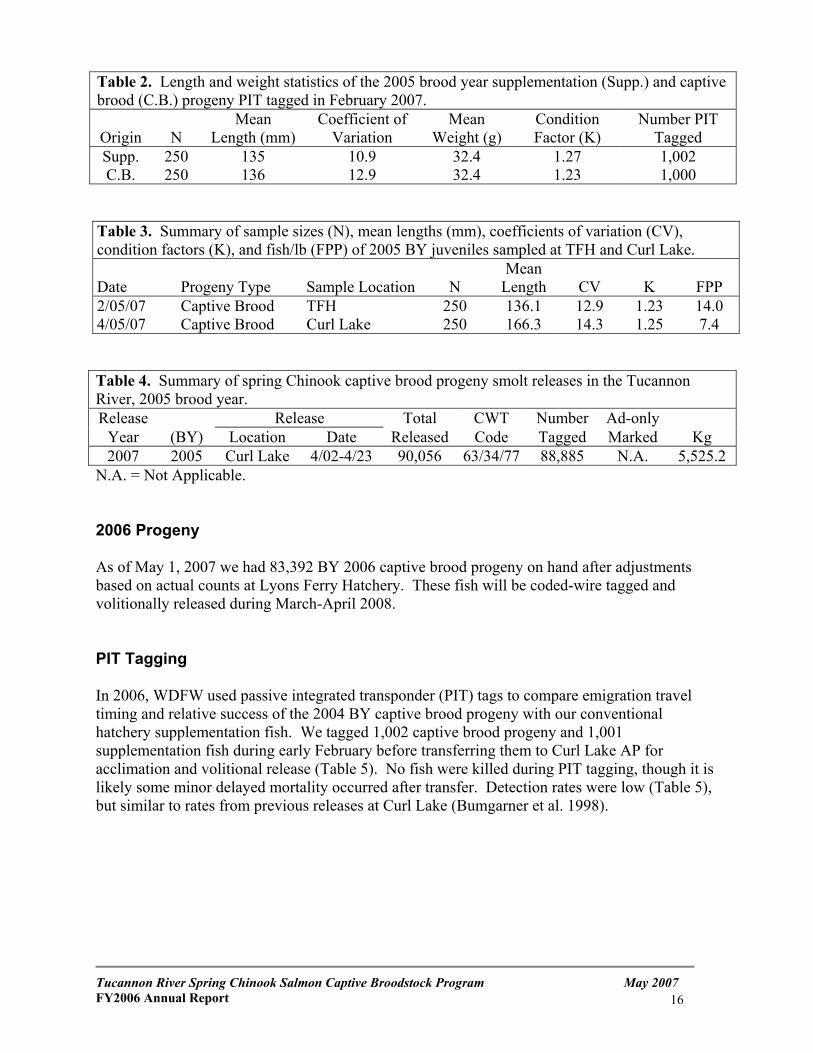
Table 2. Length and weight statistics of the 2005 brood year supplementation (Supp.) and captive brood (C.B.) progeny PIT tagged in February 2007.
Origin
N
Mean Length (mm)
Coefficient of Variation
Mean Weight (g)
Condition Factor (K)
Number PIT Tagged
Supp. C.B.
250 250
135 136
10.9 12.9
32.4 32.4
1.27 1.23
1,002 1,000
Table 3. Summary of sample sizes (N), mean lengths (mm), coefficients of variation (CV), condition factors (K), and fish/lb (FPP) of 2005 BY juveniles sampled at TFH and Curl Lake. Date
Progeny Type
Sample Location
N
Mean Length
CV
K
FPP
2/05/07 4/05/07
Captive Brood Captive Brood
TFH Curl Lake
250 250
136.1 166.3
12.9 14.3
1.23 1.25
14.0 7.4
Table 4. Summary of spring Chinook captive brood progeny smolt releases in the Tucannon River, 2005 brood year. Release Release Total CWT Number Ad-only
Year (BY) Location Date Released Code Tagged Marked Kg 2007 2005 Curl Lake 4/02-4/23 90,056 63/34/77 88,885 N.A. 5,525.2
N.A. = Not Applicable. 2006 Progeny As of May 1, 2007 we had 83,392 BY 2006 captive brood progeny on hand after adjustments based on actual counts at Lyons Ferry Hatchery. These fish will be coded-wire tagged and volitionally released during March-April 2008. PIT Tagging In 2006, WDFW used passive integrated transponder (PIT) tags to compare emigration travel timing and relative success of the 2004 BY captive brood progeny with our conventional hatchery supplementation fish. We tagged 1,002 captive brood progeny and 1,001 supplementation fish during early February before transferring them to Curl Lake AP for acclimation and volitional release (Table 5). No fish were killed during PIT tagging, though it is likely some minor delayed mortality occurred after transfer. Detection rates were low (Table 5), but similar to rates from previous releases at Curl Lake (Bumgarner et al. 1998).
Tucannon River Spring Chinook Salmon Captive Broodstock Program May 2007 FY2006 Annual Report
16
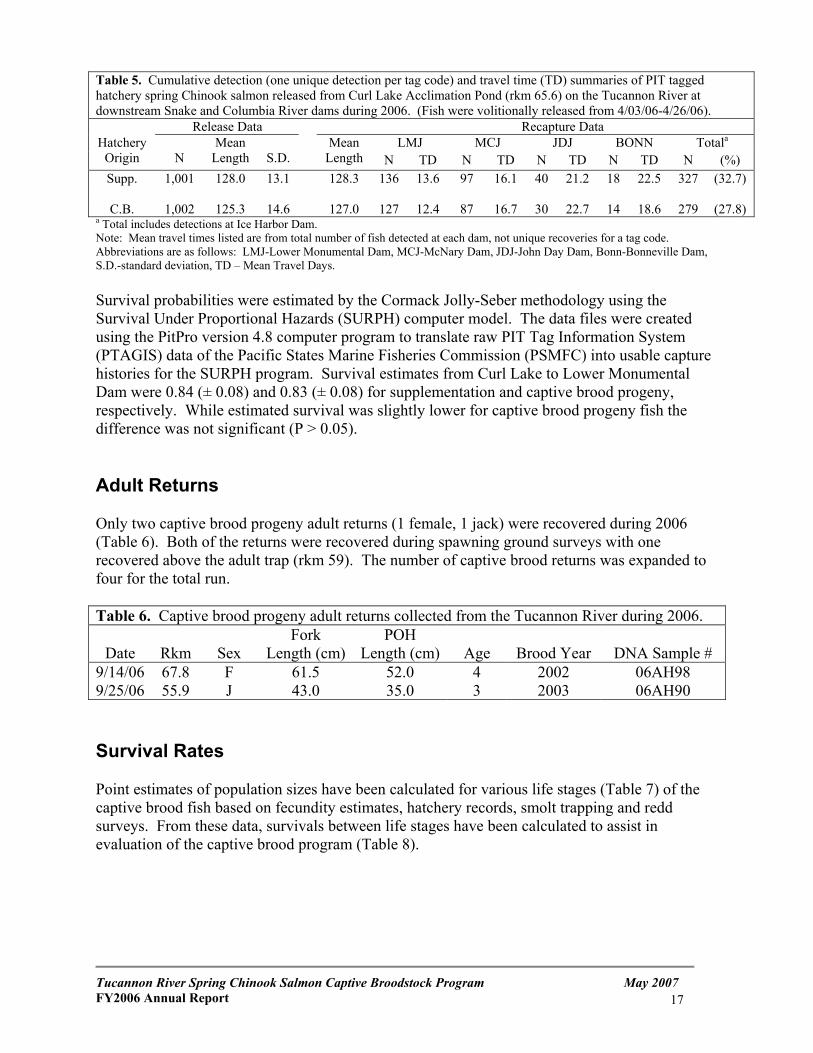
Table 5. Cumulative detection (one unique detection per tag code) and travel time (TD) summaries of PIT tagged hatchery spring Chinook salmon released from Curl Lake Acclimation Pond (rkm 65.6) on the Tucannon River at downstream Snake and Columbia River dams during 2006. (Fish were volitionally released from 4/03/06-4/26/06). Release Data Recapture Data
LMJ MCJ JDJ BONN Totala Hatchery Origin
N
Mean Length
S.D.
Mean Length N TD N TD N TD N TD N (%)
Supp. 1,001 128.0 13.1 128.3 136 13.6 97 16.1 40 21.2 18 22.5 327 (32.7)
C.B. 1,002 125.3 14.6 127.0 127 12.4 87 16.7 30 22.7 14 18.6 279 (27.8) a Total includes detections at Ice Harbor Dam. Note: Mean travel times listed are from total number of fish detected at each dam, not unique recoveries for a tag code. Abbreviations are as follows: LMJ-Lower Monumental Dam, MCJ-McNary Dam, JDJ-John Day Dam, Bonn-Bonneville Dam, S.D.-standard deviation, TD – Mean Travel Days. Survival probabilities were estimated by the Cormack Jolly-Seber methodology using the Survival Under Proportional Hazards (SURPH) computer model. The data files were created using the PitPro version 4.8 computer program to translate raw PIT Tag Information System (PTAGIS) data of the Pacific States Marine Fisheries Commission (PSMFC) into usable capture histories for the SURPH program. Survival estimates from Curl Lake to Lower Monumental Dam were 0.84 (± 0.08) and 0.83 (± 0.08) for supplementation and captive brood progeny, respectively. While estimated survival was slightly lower for captive brood progeny fish the difference was not significant (P > 0.05). Adult Returns Only two captive brood progeny adult returns (1 female, 1 jack) were recovered during 2006 (Table 6). Both of the returns were recovered during spawning ground surveys with one recovered above the adult trap (rkm 59). The number of captive brood returns was expanded to four for the total run. Table 6. Captive brood progeny adult returns collected from the Tucannon River during 2006.
Date
Rkm
Sex
Fork Length (cm)
POH Length (cm)
Age
Brood Year
DNA Sample #
9/14/06 67.8 F 61.5 52.0 4 2002 06AH98 9/25/06 55.9 J 43.0 35.0 3 2003 06AH90 Survival Rates Point estimates of population sizes have been calculated for various life stages (Table 7) of the captive brood fish based on fecundity estimates, hatchery records, smolt trapping and redd surveys. From these data, survivals between life stages have been calculated to assist in evaluation of the captive brood program (Table 8).
Tucannon River Spring Chinook Salmon Captive Broodstock Program May 2007 FY2006 Annual Report
17
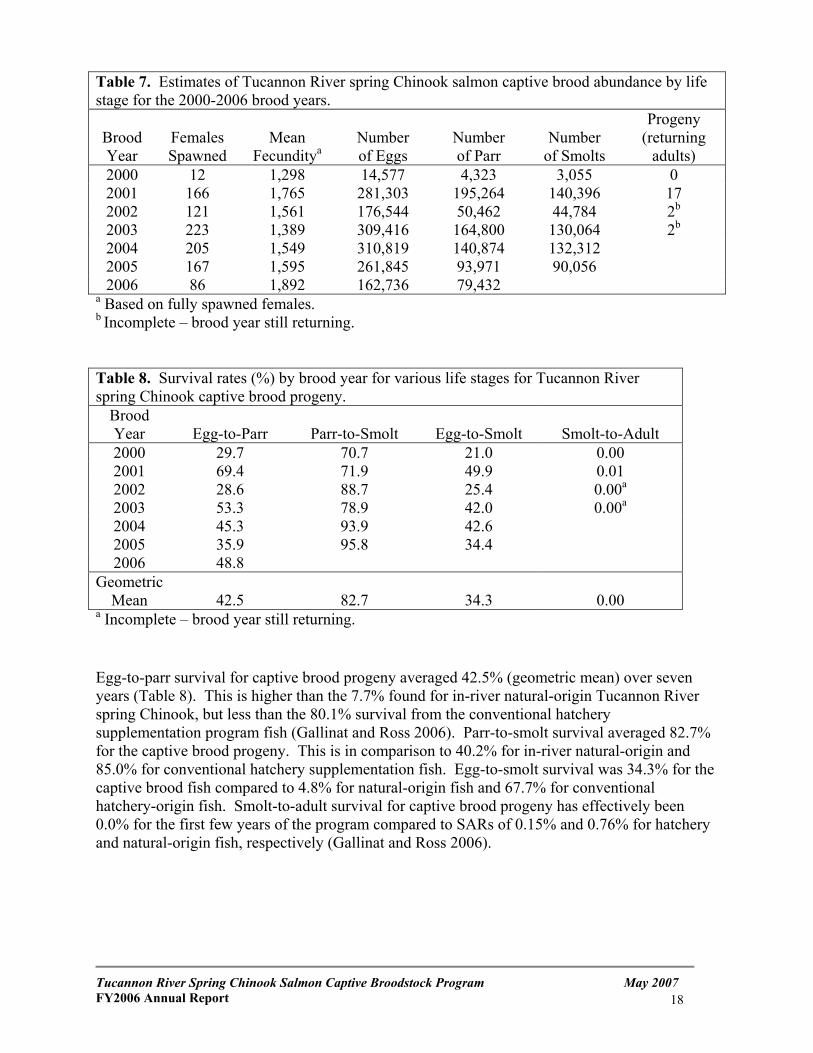
Table 7. Estimates of Tucannon River spring Chinook salmon captive brood abundance by life stage for the 2000-2006 brood years.
Brood Year
Females Spawned
Mean
Fecunditya
Number of Eggs
Number of Parr
Number
of Smolts
Progeny (returning
adults) 2000 12 1,298 14,577 4,323 3,055 0 2001 166 1,765 281,303 195,264 140,396 17 2002 121 1,561 176,544 50,462 44,784 2b
2003 223 1,389 309,416 164,800 130,064 2b
2004 205 1,549 310,819 140,874 132,312 2005 167 1,595 261,845 93,971 90,056 2006 86 1,892 162,736 79,432
a Based on fully spawned females. b Incomplete – brood year still returning. Table 8. Survival rates (%) by brood year for various life stages for Tucannon River spring Chinook captive brood progeny.
Brood Year
Egg-to-Parr
Parr-to-Smolt
Egg-to-Smolt
Smolt-to-Adult
2000 29.7 70.7 21.0 0.00 2001 69.4 71.9 49.9 0.01 2002 28.6 88.7 25.4 0.00a
2003 53.3 78.9 42.0 0.00a
2004 45.3 93.9 42.6 2005 35.9 95.8 34.4 2006 48.8
Geometric Mean
42.5
82.7
34.3
0.00
a Incomplete – brood year still returning. Egg-to-parr survival for captive brood progeny averaged 42.5% (geometric mean) over seven years (Table 8). This is higher than the 7.7% found for in-river natural-origin Tucannon River spring Chinook, but less than the 80.1% survival from the conventional hatchery supplementation program fish (Gallinat and Ross 2006). Parr-to-smolt survival averaged 82.7% for the captive brood progeny. This is in comparison to 40.2% for in-river natural-origin and 85.0% for conventional hatchery supplementation fish. Egg-to-smolt survival was 34.3% for the captive brood fish compared to 4.8% for natural-origin fish and 67.7% for conventional hatchery-origin fish. Smolt-to-adult survival for captive brood progeny has effectively been 0.0% for the first few years of the program compared to SARs of 0.15% and 0.76% for hatchery and natural-origin fish, respectively (Gallinat and Ross 2006).
Tucannon River Spring Chinook Salmon Captive Broodstock Program May 2007 FY2006 Annual Report
18
DNA Genetic Samples 2006 Brood Year Since the beginning of the program in 1997, we have collected DNA samples from all spring Chinook parents that eventually contributed gametes to the captive broodstock population. Additional samples are also collected during spawning ground surveys to provide a large genetic data set that will be used to describe the population. During 2006 we collected 140 DNA samples (operculum punches) from adult salmon (73 wild and 67 hatchery spring Chinook, including the two captive brood progeny adult returns) and 89 samples from captive broodstock spawners. The 2006 DNA samples were sent to the WDFW genetics lab in Olympia for baseline microsatellite DNA analysis. 2005 Brood Year A total of 343 Tucannon River spring Chinook samples collected in 2005 were genotyped at 14 microsatellite loci (Ogo-2, Ogo-4, Ots-3M, Ssa-197, Oki-100, Ots-201b, Ots-208b, Ssa-408, Omm-1080, Ots-213, Ots-G474, Ots-9, Ots-211, and Ots-212) using an Applied Biosystems 3730 DNA analyzer (Appendix G). Analysis to date provides evidence that the captive broodstock program has been an effective method of preserving overall genetic variation in Tucannon River spring Chinook while providing additional smolts for release (Kassler and Hawkins 2007, Appendix G). Genotypes, allele frequencies, and tissue samples are stored at WDFW’s Genetics Laboratory in Olympia, Washington. Coordination and Reporting Since BPA funding was acquired, WDFW has joined other researchers in a group known as the Captive Broodstock Technical Oversight Committee (CBTOC). The CBTOC is a forum for all BPA funded projects working with captive broodstock or captive rearing programs. The CBTOC goal is to ensure that all groups are coordinated, and communication is occurring between projects. The CBTOC also gives each of the researchers a chance to ask questions about other program’s successes and failures, so each respective program can be adapted for better results. WDFW also provides the co-managers with a monthly update on the captive broodstock and supplementation program activities. This monthly program update informs them about fish on hand, mortalities incurred, and any up-coming actions (i.e., sorting of mature fish) that may warrant their attention. This annual progress report is produced by WDFW to disseminate the information gathered from this project to other researchers in the Columbia and Snake River basins. Additional reports and papers will also be published following complete returns of all captive brood origin fish back to the Tucannon River.
Tucannon River Spring Chinook Salmon Captive Broodstock Program May 2007 FY2006 Annual Report
19
Literature Cited
Allendorf, F. W., and N. Ryman. 1987. Genetic management of hatchery stocks, p. 141-160. In
N. Ryman and F. Utter [ed.] Population Genetics and Fishery Management. University of Washington Press, Seattle, WA.
Bugert, R., P. LaRiviere, D. Marbach, S. Martin, L. Ross, D. Geist. 1990. Lower Snake River
compensation plan salmon hatchery evaluation program 1989 annual report to U.S. Fish and Wildlife Service, AFF 1/LSR-90-08, Cooperative Agreement 14-16-0001-89525. Washington Department of Fisheries, Olympia, Washington.
Bumgarner, J., D. Milks, L. Ross, and M. Varney. 1998. Tucannon River Spring Chinook
Salmon Hatchery Evaluation Program. 1997 Annual Report to U.S. Fish and Wildlife Service, Boise, ID. Washington Department of Fish and Wildlife, Fish Program/Hatcheries Division, Olympia, WA 98501-1091. Report #H98-06. 43 p.
Bumgarner, J. D. and M. P. Gallinat. 2001. Tucannon River spring Chinook salmon captive
broodstock program – FY2000 Annual Report. Washington Department of Fish and Wildlife. Report to BPA. Project #2000-019-00.
Busack, C. A. and K. P. Currens. 1995. Genetic risks and hazards in hatchery operations:
fundamental concepts and issues. American Fisheries Society Symposium. 15: 71-80. Campton, D. E. 1995. Genetic effects of hatchery fish on wild populations of Pacific salmon and
steelhead: what do we really know? American Fisheries Society Symposium. 15: 37-353. Cuenco, M. L., T. W. H. Backman, and P. R. Mundy. 1993. The use of supplementation to aid
in natural stock restoration. J. G. Cloud and G. H. Thorgaard, editors. Pages 269-293 IN: Genetic Conservation of Salmonid Fishes. Plenum Press, New York.
ESA. 1973. Endangered Species Act of 1973 - as amended through 1988. Senate and House of
Representatives of the United States of America. 75 pp. Gallinat, M. P. 2004. Tucannon River spring Chinook salmon captive broodstock program –
FY2003 Annual Report. Washington Department of Fish and Wildlife. Report to BPA. Project #2000-019-00.
Gallinat, M. P., and L. A. Ross. 2006. Tucannon River Spring Chinook Salmon Hatchery Evaluation Program 2005 Annual Report to U.S. Fish and Wildlife Service, Cooperative Agreement 1411-05-J056. Washington Department of Fish and Wildlife, Olympia, Washington. Report # FPA06-09. 105 p. Hard, J. J., R. P. Jones, M. R. Delarm, and R. S. Waples. 1992. Pacific salmon and artificial
propagation under the Endangered Species Act. Technical Memorandum NMFS-NWFSC-2. NOAA, U.S. Dept. of Commerce. 56 pp.
Tucannon River Spring Chinook Salmon Captive Broodstock Program May 2007 FY2006 Annual Report
20
Heath, D. D., J. W. Heath, C. A. Bryden, R. M. Johnson, and C. W. Fox. 2003. Rapid evolution of egg size in captive salmon. Science 299: 1738-1740.
IHOT (Integrated Hatcheries Operations Team). 1995. Kassler, T.W. and D. K. Hawkins. 2007. Genetic assessment of spring Chinook in the
Tucannon River (2005) using a microsatellite DNA analysis. Washington Dept. of Fish and Wildlife. Olympia, Washington. 30 p.
PNFHPC (Pacific Northwest Fish Health Protection Committee). 1989. Model comprehensive
fish health protection program. 19 pp. USACE (U.S. Army Corps of Engineers). 1975. Environmental Assessment: Lyons Ferry Fish
Hatchery - Lower Snake Fish and Wildlife Compensation Plan. Walla Walla, Washington. USFWS (United States Fish and Wildlife Service). 1998. Proceedings of the Lower Snake
River Compensation Plan Status Review Symposium. Boise, Idaho. Verspoor, E. 1988. Reduced genetic variability in first-generation hatchery populations of
Atlantic salmon (Salmo salar). Canadian Journal of Fisheries and Aquatic Sciences 45: 1686-1690.
Washington Department of Fish and Wildlife. 1996. Fish health manual. Hatcheries Program,
Fish Health Division, Washington Dept. of Fish and Wildlife. 600 Capitol Way N, Olympia, WA 98501-1091. 69 pp.
Washington Department of Fish and Wildlife, Nez Perce Tribe, Confederated Tribes of the
Umatilla Indian Reservation. 1999. Master plan for Tucannon River spring Chinook captive broodstock program. 34 pp.
Tucannon River Spring Chinook Salmon Captive Broodstock Program May 2007 FY2006 Annual Report
21
APPENDIX A
Existing Water Intake Line
Main Valve(with Alarm)
4' Tanks
(Security Fencing)
Pond Valves(with Pond Level Float Alarm)
Flat PlateScreen Drain
Captive Broodstock Facility at Lyons Ferry
14
Tank 8
2356789101112131415
Tank 2Tank 3Tank 4
Tank 5Tank 6Tank 7
Tank 1
Wastewater
Tucannon River Spring Chinook Salmon Captive Broodstock Program May 2007 FY2006 Annual Report
22
APPENDIX B
Table 1. Selection of progeny for the Tucannon River spring Chinook captive broodstock program based on origin, crosses, and BKD ELISA results, 1997 and 1998 BYs. Brood Year
Eggtake Date
Female Numbers
Male Numbers
Crosses
BKD ELISA1
Tank/Family Number
97 97 97 97 97 97 97 97 97 97 97 97 97 97 97
09/16 09/16 09/23 09/16 09/09 09/09 09/09 09/16 09/09 09/09 09/02 09/09 09/16 09/02 09/02
H885 + H886 H889
W958 + W957 W897 + W898 H872 + H871
H873 W881 + W882 W951 + W952 W874 + W875 W878 + W876 W869 + W867
H879 W899 W870 H868
W108 + W110 W116 + W120 H122 + H123 H156 + H199 W159 + W161 W163 + W165 H167 + H175 H149 + H157 H171 + H173 H179 + H181 H191 + H193 W169 + W177 H153 + H154 H183 + H185 W187 + W189
Mixed Mixed Mixed Mixed Mixed Mixed Mixed Mixed Mixed Mixed Mixed Mixed Mixed Mixed Mixed
LOW, BL BL BL BL BL
LOW BL BL BL
LOW, BL BL BL BL BL BL
TANK 1 TANK 2 TANK 3 TANK 4 TANK 5 TANK 6 TANK 7 TANK 8 TANK 9 TANK 10 TANK 11 TANK 12 TANK 13 TANK 14 TANK 15
98 98 98 98 98 98 98 98 98 98 98 98 98 98 98
08/25 08/25 09/08 09/08 09/08 09/08 09/08 09/11 09/11 09/11 09/11 09/15 09/15 09/22 09/22
W1003 + W1004 W1005 + W1006 W3001 + W3002 W3003 + W3004 W3005 + W3006 W3007 + W3008 H3009 + H3010 H4001 + H4002 W4003 + W4004 W4007 + W4008 W4009 + W4010
W5002 W5003
W6005 + W6006 W6007 + W6008
H754 + H753 H751 + W131 H758 + H759 H755 + H756 H757 + H760 W128 + W129 W130 + W133 W135 + W134 H762 + H761 H767 + H765 H769 + H768 H777 + H773 H772 + H771 H781 + H780 H783 + H782
Mixed Mixed Mixed Mixed Mixed Mixed Mixed Mixed Mixed Mixed Mixed Mixed Mixed Mixed Mixed
BL LOW, BL LOW, BL
BL BL BL
LOW, BL LOW, BL LOW, BL LOW, BL
BL LOW LOW
BL BL
TANK 1 TANK 2 TANK 3 TANK 4 TANK 5 TANK 6 TANK 7 TANK 8 TANK 9 TANK 10 TANK 11 TANK 12 TANK 13 TANK 14 TANK 15
1 Low = 0.11-0.19 Optical Density; Below Low = < 0.11 Optical Density.
Tucannon River Spring Chinook Salmon Captive Broodstock Program May 2007 FY2006 Annual Report
23
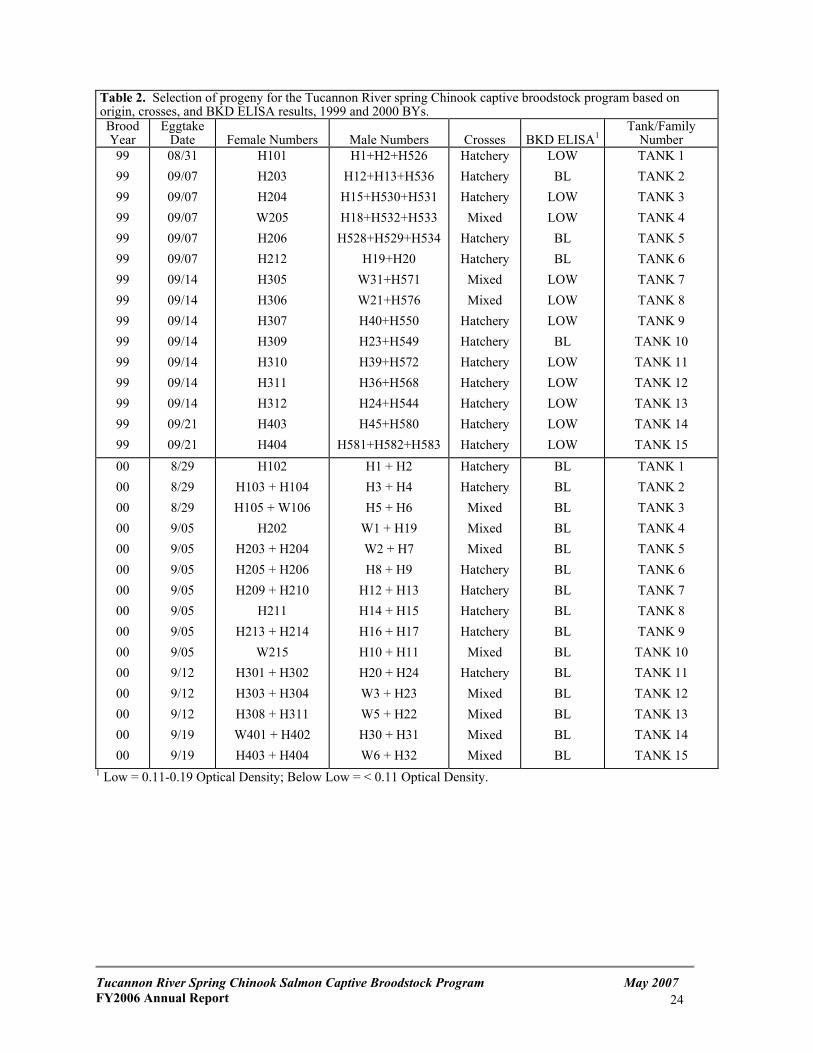
Table 2. Selection of progeny for the Tucannon River spring Chinook captive broodstock program based on origin, crosses, and BKD ELISA results, 1999 and 2000 BYs. Brood Year
Eggtake Date
Female Numbers
Male Numbers
Crosses
BKD ELISA1
Tank/Family Number
99 99 99 99 99 99 99 99 99 99 99 99 99 99 99
08/31 09/07 09/07 09/07 09/07 09/07 09/14 09/14 09/14 09/14 09/14 09/14 09/14 09/21 09/21
H101 H203 H204 W205 H206 H212 H305 H306 H307 H309 H310 H311 H312 H403 H404
H1+H2+H526 H12+H13+H536 H15+H530+H531 H18+H532+H533
H528+H529+H534 H19+H20
W31+H571 W21+H576 H40+H550 H23+H549 H39+H572 H36+H568 H24+H544 H45+H580
H581+H582+H583
Hatchery Hatchery Hatchery
Mixed Hatchery Hatchery
Mixed Mixed
Hatchery Hatchery Hatchery Hatchery Hatchery Hatchery Hatchery
LOW BL
LOW LOW
BL BL
LOW LOW LOW
BL LOW LOW LOW LOW LOW
TANK 1 TANK 2 TANK 3 TANK 4 TANK 5 TANK 6 TANK 7 TANK 8 TANK 9 TANK 10 TANK 11 TANK 12 TANK 13 TANK 14 TANK 15
00 00 00 00 00 00 00 00 00 00 00 00 00 00 00
8/29 8/29 8/29 9/05 9/05 9/05 9/05 9/05 9/05 9/05 9/12 9/12 9/12 9/19 9/19
H102 H103 + H104 H105 + W106
H202 H203 + H204 H205 + H206 H209 + H210
H211 H213 + H214
W215 H301 + H302 H303 + H304 H308 + H311 W401 + H402 H403 + H404
H1 + H2 H3 + H4 H5 + H6
W1 + H19 W2 + H7 H8 + H9
H12 + H13 H14 + H15 H16 + H17 H10 + H11 H20 + H24 W3 + H23 W5 + H22 H30 + H31 W6 + H32
Hatchery Hatchery
Mixed Mixed Mixed
Hatchery Hatchery Hatchery Hatchery
Mixed Hatchery
Mixed Mixed Mixed Mixed
BL BL BL BL BL BL BL BL BL BL BL BL BL BL BL
TANK 1 TANK 2 TANK 3 TANK 4 TANK 5 TANK 6 TANK 7 TANK 8 TANK 9 TANK 10 TANK 11 TANK 12 TANK 13 TANK 14 TANK 15
1 Low = 0.11-0.19 Optical Density; Below Low = < 0.11 Optical Density.
Tucannon River Spring Chinook Salmon Captive Broodstock Program May 2007 FY2006 Annual Report
24
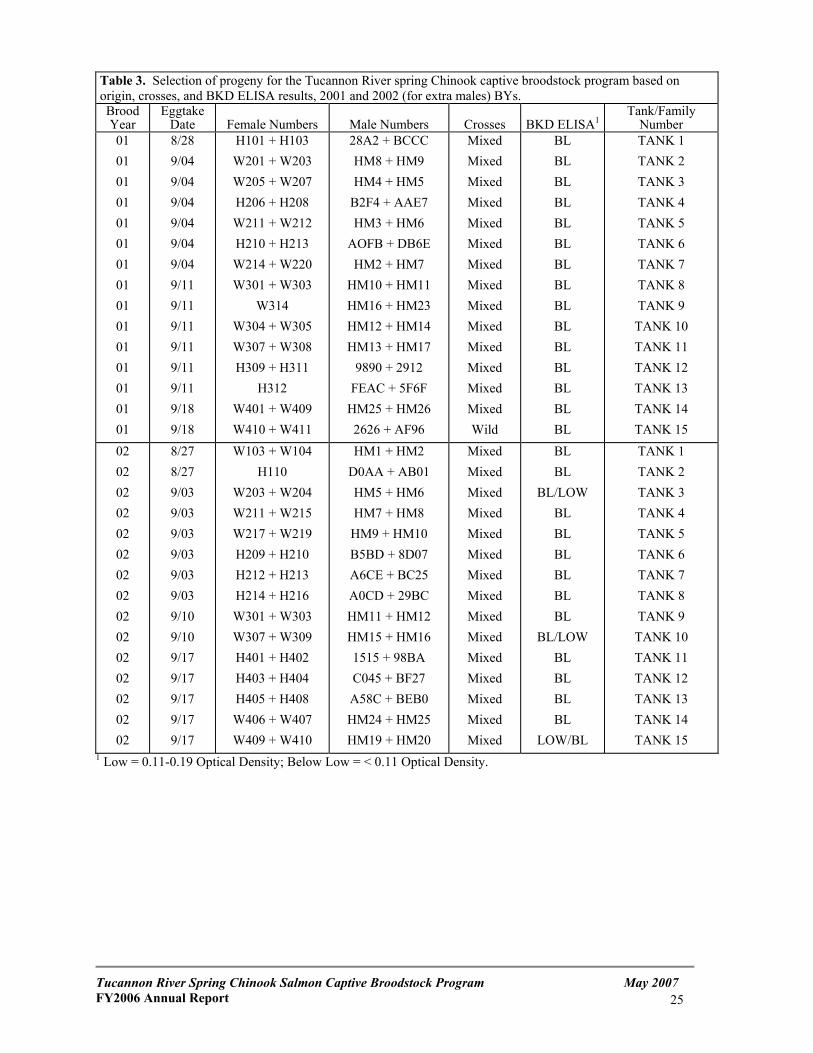
Table 3. Selection of progeny for the Tucannon River spring Chinook captive broodstock program based on origin, crosses, and BKD ELISA results, 2001 and 2002 (for extra males) BYs. Brood Year
Eggtake Date
Female Numbers
Male Numbers
Crosses
BKD ELISA1
Tank/Family Number
01 01 01 01 01 01 01 01 01 01 01 01 01 01 01
8/28 9/04 9/04 9/04 9/04 9/04 9/04 9/11 9/11 9/11 9/11 9/11 9/11 9/18 9/18
H101 + H103 W201 + W203 W205 + W207 H206 + H208 W211 + W212 H210 + H213 W214 + W220 W301 + W303
W314 W304 + W305 W307 + W308 H309 + H311
H312 W401 + W409 W410 + W411
28A2 + BCCC HM8 + HM9 HM4 + HM5
B2F4 + AAE7 HM3 + HM6
AOFB + DB6E HM2 + HM7
HM10 + HM11 HM16 + HM23 HM12 + HM14 HM13 + HM17
9890 + 2912 FEAC + 5F6F
HM25 + HM26 2626 + AF96
Mixed Mixed Mixed Mixed Mixed Mixed Mixed Mixed Mixed Mixed Mixed Mixed Mixed Mixed Wild
BL BL BL BL BL BL BL BL BL BL BL BL BL BL BL
TANK 1 TANK 2 TANK 3 TANK 4 TANK 5 TANK 6 TANK 7 TANK 8 TANK 9 TANK 10 TANK 11 TANK 12 TANK 13 TANK 14 TANK 15
02 02 02 02 02 02 02 02 02 02 02 02 02 02 02
8/27 8/27 9/03 9/03 9/03 9/03 9/03 9/03 9/10 9/10 9/17 9/17 9/17 9/17 9/17
W103 + W104 H110
W203 + W204 W211 + W215 W217 + W219 H209 + H210 H212 + H213 H214 + H216 W301 + W303 W307 + W309 H401 + H402 H403 + H404 H405 + H408 W406 + W407 W409 + W410
HM1 + HM2 D0AA + AB01 HM5 + HM6 HM7 + HM8 HM9 + HM10 B5BD + 8D07 A6CE + BC25 A0CD + 29BC HM11 + HM12 HM15 + HM16 1515 + 98BA C045 + BF27 A58C + BEB0 HM24 + HM25 HM19 + HM20
Mixed Mixed Mixed Mixed Mixed Mixed Mixed Mixed Mixed Mixed Mixed Mixed Mixed Mixed Mixed
BL BL
BL/LOW BL BL BL BL BL BL
BL/LOW BL BL BL BL
LOW/BL
TANK 1 TANK 2 TANK 3 TANK 4 TANK 5 TANK 6 TANK 7 TANK 8 TANK 9 TANK 10 TANK 11 TANK 12 TANK 13 TANK 14 TANK 15
1 Low = 0.11-0.19 Optical Density; Below Low = < 0.11 Optical Density.
Tucannon River Spring Chinook Salmon Captive Broodstock Program May 2007 FY2006 Annual Report
25
APPENDIX C
Average length (mm), weight (g), and condition factor (K) with standard deviations for each family unit from the 1997, 1998, 1999, 2000 and 2001 BYs of captive broodstock at the time of tagging.
Brood Year
Family Unit
Number of Fish
Mean Length
S.D.
Mean Weight
S.D.
K
1997 1 29 113 7.8 19.4 4.4 1.31 1997 2 14 110 5.2 17.3 2.7 1.29 1997 3 31 125 9.1 28.4 6.0 1.44 1997 4 29 118 9.3 22.7 6.0 1.37 1997 5 31 119 9.3 22.7 5.8 1.30 1997 6 30 119 8.6 22.6 5.2 1.33 1997 7 30 117 7.2 21.3 4.3 1.32 1997 8 29 121 10.2 24.8 6.8 1.36 1997 9 30 117 8.1 21.8 5.0 1.32 1997 10 30 115 11.0 19.7 6.1 1.27 1997 11 30 101 6.4 13.1 2.6 1.25 1997 12 30 120 12.5 24.5 8.0 1.38 1997 13 30 121 9.3 24.4 6.6 1.34 1997 14 30 112 6.2 18.8 3.2 1.33 1997 15 30 109 9.6 18.7 4.8 1.41
Totals / Means 433 116 10.5 21.5 6.4 1.34
1998 1 30 120 15.6 22.3 8.6 1.23 1998 2 29 108 10.0 15.9 5.0 1.25 1998 3 30 112 13.1 18.6 7.8 1.26 1998 4 30 112 11.5 17.7 6.4 1.24 1998 5 30 117 16.0 20.5 9.9 1.20 1998 6 28 117 15.0 21.6 11.0 1.26 1998 7 32 120 18.0 23.2 11.6 1.26 1998 8 30 129 12.0 26.5 7.8 1.21 1998 9 30 121 16.9 23.0 9.9 1.24 1998 10 28 130 9.0 26.0 4.9 1.18 1998 11 25 120 13.6 22.3 7.7 1.26 1998 12 31 127 10.1 24.0 4.9 1.16 1998 13 29 122 11.4 22.0 6.7 1.19 1998 14 27 120 13.2 21.6 7.7 1.20 1998 15 29 138 11.0 30.3 6.7 1.14
Totals / Means 438 121 15.2 22.4 8.7 1.22
1999 1 27 147 14.6 41.1 11.3 1.25 1999 2 28 138 13.1 35.7 8.9 1.34 1999 3 28 133 11.6 33.9 11.3 1.42 1999 4 30 145 8.9 39.2 6.7 1.27 1999 5 25 136 15.8 35.4 11.8 1.34 1999 6 30 136 10.7 33.8 8.9 1.32 1999 7 27 129 20.9 30.0 14.8 1.29 1999 8 29 129 12.0 29.9 9.0 1.35 1999 9 25 128 16.3 29.3 11.6 1.33 1999 10 23 130 18.9 31.0 14.4 1.32 1999 11 23 137 13.1 36.0 10.7 1.37 1999 12 28 141 13.5 38.4 10.2 1.33 1999 13 30 133 13.9 31.9 9.1 1.34 1999 14 30 133 10.7 31.6 7.6 1.32 1999 15 26 132 16.6 34.1 14.1 1.39
Totals / Means 409 135 15.1 34.1 11.2 1.33
Tucannon River Spring Chinook Salmon Captive Broodstock Program May 2007 FY2006 Annual Report
26
Appendix C (cont.). Average length (mm), weight (g), and condition factor (K) with standard deviations for each family unit from the 1997, 1998, 1999, 2000 and 2001 BYs of captive broodstock at the time of tagging.
Brood Year
Family Unit
Number of Fish
S.D.
Mean Weight
S.D. K
2000 1 30 164 52.3 8.4 1.19 2000 2 157 11.1 45.5 8.1 1.16
3 30 152 10.1 37.9 5.9 2000 4 30 152 11.0 8.0 1.20 2000 5 30 8.4 38.6 5.9 1.09 2000 30 138 11.3 31.2 6.1 1.18 2000 7 30 140 10.1 31.4 1.14 2000 8 30 147 35.0 5.4 1.10 2000 9 151 9.5 37.3 6.3 1.07
10 30 151 7.7 37.4 5.7 2000 11 30 143 13.9 8.3 1.18 2000 12 30 9.1 35.4 5.2 1.12 2000 30 144 13.5 34.1 8.7 1.13 2000 14 30 136 9.4 27.1
Mean Length
11.8 30
2000 1.08 43.0
152 6
5.4 8.4
30 2000 1.08
34.9 147
13 4.5 1.08
2000 15 132 10.8 25.1 5.1 1.10 450 147 13.4 36.4 9.4 1.13
2001 1 30 95 6.7 2.1 1.22 2001 2 30 8.7 12.6 3.0 1.22 2001 30 100 5.0 12.8 1.9 1.27 2001 4 30 107 6.9 14.8 1.21 2001 5 30 110 17.5 3.2 1.30 2001 6 104 7.7 14.7 3.6 1.29
7 30 101 6.9 13.1 2.4 2001 8 30 105 8.2 2.6 1.25 2001 9 30 9.2 13.8 3.1 1.17 2001 30 97 6.5 11.4 2.4 1.24 2001 11 30 101 7.5 12.7 1.21 2001 12 30 101
30 Totals / Means
10.4 101
3 3.9
8.3 30
2001 1.27 14.6
106 10
2.7 5.0 12.5 1.8 1.21
2001 13 30 100 7.5 12.2 2.9 1.20 2001 14 30 100 8.8 12.2 2.9 1.22 2001 15 30 99 7.6 12.2 2.7 1.25
Totals / Means 450 102 8.3 13.2 3.2 1.24
Tucannon River Spring Chinook Salmon Captive Broodstock Program May 2007 FY2006 Annual Report
27
APPENDIX D
Tucannon River spring Chinook captive broodstock mortalities by family unit, sex, age, and maturity for the 2001 Brood Year.
Males Females Age
1 Age
2 Age
3 Age
4 Age
5 Age
1 Age
2 Age
3 Age
4 Age
5
Family Unit
N IM IM MA SP IM MA SP IM MA SP IM MA IM IM MA IM MA SP IM MA SP IM MA SP
Total Mort.
% Mort.
1 2a
3 4 5 6b
7 8 9 10 11 12 13 14 15
30 30 30 30 30 30 30 30 30 30 30 30 30 30 30
1 1 1 1
2
1 3 3
1 8 7 3 4
1 2
1 1
2 1
13 8
13 6
11 12 9
14 9 4
11 12 12 11 14
1 2
1
1
1
1
2 1 1
1 1 1 1 1 1
14 2 1 1 2 3 1 5 1 3 1 1
4
1 2 1 1 1 1
2 3 2 1 2 2 2 2 3 2 1 1 3 2 1
7 7 8 13 11 11 10 10 4 10 7 8 5 12 5
1 2 1
1
1
1
1
3 2
27 28a
30 29 30 29b
29 30 29 28 27 29 26 31 29
90 93
100 97
100 97 97
100 97 93 90 97 87
103 97
Totals 450 4 35 2 3 159 3 1 1 1 1 4 6 30 7 29 135c 4 1 8 438c 97 IM = Immature, MA = Mature, SP = Spawned a Total includes 3 fish of unknown sex. (Three died from family 2 during tagging). b Total includes 1 fish of unknown sex (just fish head found from Age 2). c Total includes 7 fish from unknown families.
Tucannon River Spring Chinook Salmon Captive Broodstock Program May 2007 FY2006 Annual Report
28
APPENDIX E
Table 1. Fork length (cm) and weight (g) statistics for male, female, and both sexes combined by brood year for captive brood fish sampled during spawning, 2006.
Brood Year
Sex
N
Mean Length
(cm)
Range
S.D.
Mean
Wt. (g)
Range
S.D. 2001 2001 2001
M F
Both
1 9 10
47.5 53.8 53.2
--- 43.0-62.0 43.0-62.0
--- 5.8 5.9
953.4 2088.4 1974.9
--- 681.0-3178.0 681.0-3178.0
--- 687.8741.1
2002 2002 2002
M F
Both
2 81 83
50.3 53.9 53.8
48.5-52.0 35.5-64.5 35.5-64.5
2.5 6.1 6.0
1452.8 2364.8 2342.3
1362.0-1543.6 862.6-4313.0 862.6-4313.0
128.4836.3838.1
Table 2. Length-weight relationship for male, female, and both sexes combined by brood year for the captive brood during spawning, 2006. Brood Year
Sex
Length-Weight Relationship
r2
Probability
2001 2001 2001
Female Malea
Combined
Fork Length (cm) = 36.929 + 0.0081 x Wt (g) N/A
Fork Length (cm) = 38.392 + 0.0075 x Wt (g)
0.90 ---
0.89
< 0.01 ---
< 0.01 2002 2002 2002
Female
Malea
Combined
Fork Length (cm) = 38.904 + 0.0064 x Wt (g) N/A
Fork Length (cm) = 39.097 + 0.0063 x Wt (g)
0.88 ---
0.88
< 0.01 ---
< 0.01 a Small sample size.
Tucannon River Spring Chinook Salmon Captive Broodstock Program May 2007 FY2006 Annual Report
29
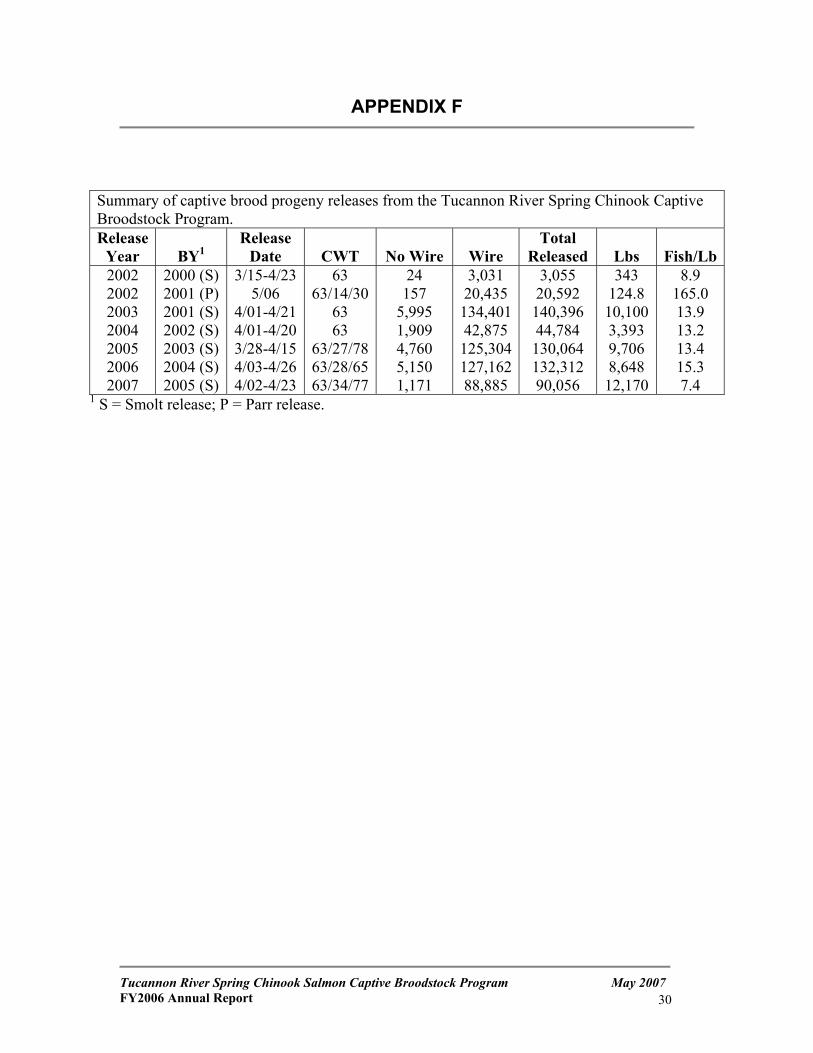
APPENDIX F
Summary of captive brood progeny releases from the Tucannon River Spring Chinook Captive Broodstock Program. Release
Year
BY1 Release
Date
CWT
No Wire
Wire Total
Released
Lbs
Fish/Lb2002 2002 2003 2004 2005 2006 2007
2000 (S) 2001 (P) 2001 (S) 2002 (S) 2003 (S) 2004 (S) 2005 (S)
3/15-4/23 5/06
4/01-4/21 4/01-4/20 3/28-4/15 4/03-4/26 4/02-4/23
63 63/14/30
63 63
63/27/78 63/28/65 63/34/77
24 157
5,995 1,909 4,760 5,150 1,171
3,031 20,435 134,40142,875 125,304127,16288,885
3,055 20,592 140,396 44,784 130,064 132,312 90,056
343 124.8 10,100 3,393 9,706 8,648 12,170
8.9 165.0 13.9 13.2 13.4 15.3 7.4
1 S = Smolt release; P = Parr release.
Tucannon River Spring Chinook Salmon Captive Broodstock Program May 2007 FY2006 Annual Report
30
APPENDIX G
Genetic Assessment of Spring Chinook in the Tucannon
River (2005) Using a Microsatellite DNA Analysis
by
Todd W. Kassler and
Denise K. Hawkins
Washington Department of Fish and Wildlife Genetics Laboratory 600 Capitol Way N
Olympia, WA 98501
April 2007
Tucannon River Spring Chinook Salmon Captive Broodstock Program May 2007 FY2006 Annual Report
31
Abstract
A total of 343 spring Chinook samples from the Tucannon River were analyzed
from collections made in 2005 using 14 microsatellite loci. Analyses were
performed on captive brood samples, supplementation spawners, and in-river
spawners. The supplementation and in-river spawners were of natural or
hatchery-origin (based on coded-wire tags) and were divided into those two
groups for further analysis. All collections were found to have relatively high and
similar levels of genetic diversity. Genotypic tests of differentiation indicated
highly significant differences between the captive brood spawners and both the
supplementation spawners and the in-river spawners. The supplementation and
in-river spawners were also significantly different from each other, however these
samples were more similar to each other than they were to the captive brood
samples. The composition of hatchery and natural-origin samples in the
supplementation and in-river samples was not equal and may have influenced
this result. Analysis of the collections re-grouped into hatchery and natural-origin
indicated highly significant differences among these two groups and the captive
brood. The highly significant difference between the hatchery and natural-origin
fish versus the low level of differentiation between the supplementation and in-
river spawners provides genetic evidence that the supplementation program has
been effective in mixing the two-spawner groups (supplementation and in-river).
The captive broodstock program has also been effective at maintaining overall
genetic variation in spring-run Chinook in the Tucannon River while providing
additional smolts for release.
Tucannon River Spring Chinook Salmon Captive Broodstock Program May 2007 FY2006 Annual Report
32
Introduction Prior to 1985, only two fry releases of spring Chinook salmon (O. tshawytscha)
occurred in the Tucannon River. In August 1962, 16,000 Klickitat River spring
Chinook fry were released and in June 1964, 10,500 Willamette, Oregon spring
Chinook fry were released by the Washington Department of Fisheries into the
Tucannon River. Neither of these releases is believed to have returned any
significant number of adults (Gallinat 2004). In 1985, the hatchery spring
Chinook production program was started by the Washington Department of
Fisheries in the Tucannon River by capturing wild (unmarked) adults from the
Tucannon River. Since 1988, hatchery-origin spring Chinook have been
returning to the Tucannon River and beginning in 1989 the hatchery broodstock
has consisted of both natural and hatchery-origin fish. This supplementation
program is part of the Lower Snake River Compensation Plan (LSRCP)
mitigation program, and will continue as long as mitigation is required under the
LSRCP.
In 1994, the adult escapement declined severely to less than 150 fish, and the
run in 1995 was estimated at 54 fish. In 1995, the Tucannon River spring
Chinook population was listed as threatened under the ESA because of declining
numbers of returning spring Chinook despite the supplementation program. As a
result, WDFW and the co-managers believed intervention beyond the
supplementation program was warranted in the form of a captive broodstock
program.
The plans for the captive broodstock program were determined and spring
Chinook from the Tucannon River supplementation program were collected from
1997-2001 brood years (BY) to be raised to adults and spawned. Males were
also collected from the 2002 BY in order to have enough to spawn with the
captive brood females towards the end of the program. Each year, fish that
mature from the initial group of captive broodstock are spawned. The captive
Tucannon River Spring Chinook Salmon Captive Broodstock Program May 2007 FY2006 Annual Report
33
brood program is scheduled to produce smolts for release through 2008. A
description of the captive brood program development and the number of families
used for each brood year is described in Gallinat (2006).
Both the supplementation and captive brood programs are being conducted with
the understanding that artificial propagation may have potentially deleterious
direct and indirect effects on spring Chinook in the Tucannon River. These
effects could include genetic and ecological changes that result in maladaptive
genetic, physiological, or behavioral changes in the donor or target populations,
thereby causing losses in natural productivity. A report by Gallinat (2004)
describes the restoration program for spring Chinook in the Tucannon River.
The goal of this report is to analyze spring Chinook collected in 2005 to assess
the genetic differences in the captive brood program, the supplementation
program, and fish that are spawning naturally in-river. Additional analyses will
assess the genetic differentiation of hatchery-origin and natural-origin spawners
to determine if the artificial production programs are having any genetic effects
on the natural-origin Chinook.
Materials and Methods Collections A total of 343 spring-run Chinook samples were analyzed at 14 microsatellite loci
(13 coastwide GAPS loci plus Ssa-197) from three sources in 2005: the
Tucannon River supplementation program, in-river (naturally produced Chinook
in the Tucannon River), and samples from the captive brood program (Table 1).
Collections were grouped in two ways for analysis. The first comparisons
(spawner) involved groups comprised of fish that actually spawned in the various
environments (i.e., supplementation hatchery, in-river, or part of the captive
brood program). Both the supplementation spawner and in-river spawner groups
are comprised of natural and hatchery-origin fish. Marking and tagging
operations in the hatchery made it possible to positively identify each Chinook as
Tucannon River Spring Chinook Salmon Captive Broodstock Program May 2007 FY2006 Annual Report
34
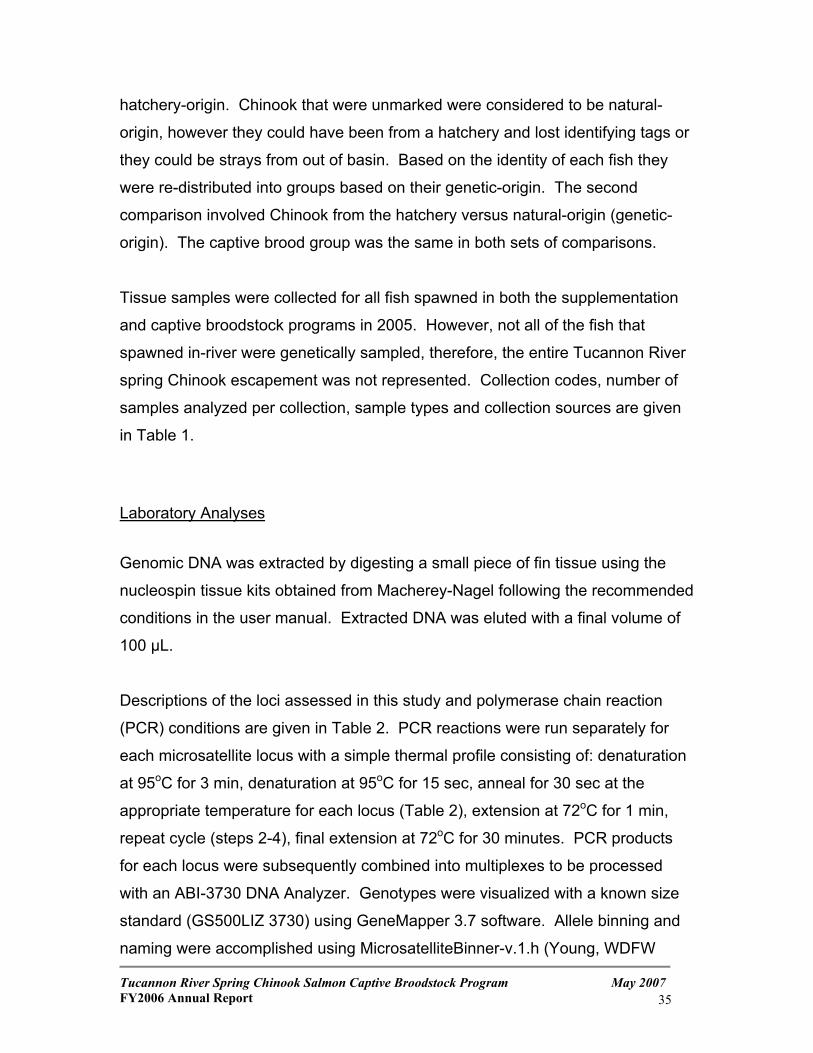
hatchery-origin. Chinook that were unmarked were considered to be natural-
origin, however they could have been from a hatchery and lost identifying tags or
they could be strays from out of basin. Based on the identity of each fish they
were re-distributed into groups based on their genetic-origin. The second
comparison involved Chinook from the hatchery versus natural-origin (genetic-
origin). The captive brood group was the same in both sets of comparisons.
Tissue samples were collected for all fish spawned in both the supplementation
and captive broodstock programs in 2005. However, not all of the fish that
spawned in-river were genetically sampled, therefore, the entire Tucannon River
spring Chinook escapement was not represented. Collection codes, number of
samples analyzed per collection, sample types and collection sources are given
in Table 1.
Laboratory Analyses
Genomic DNA was extracted by digesting a small piece of fin tissue using the
nucleospin tissue kits obtained from Macherey-Nagel following the recommended
conditions in the user manual. Extracted DNA was eluted with a final volume of
100 µL.
Tucannon River Spring Chinook Salmon Captive Broodstock Program May 2007 FY2006 Annual Report
35
Descriptions of the loci assessed in this study and polymerase chain reaction
(PCR) conditions are given in Table 2. PCR reactions were run separately for
each microsatellite locus with a simple thermal profile consisting of: denaturation
at 95oC for 3 min, denaturation at 95oC for 15 sec, anneal for 30 sec at the
appropriate temperature for each locus (Table 2), extension at 72oC for 1 min,
repeat cycle (steps 2-4), final extension at 72oC for 30 minutes. PCR products
for each locus were subsequently combined into multiplexes to be processed
with an ABI-3730 DNA Analyzer. Genotypes were visualized with a known size
standard (GS500LIZ 3730) using GeneMapper 3.7 software. Allele binning and
naming were accomplished using MicrosatelliteBinner-v.1.h (Young, WDFW
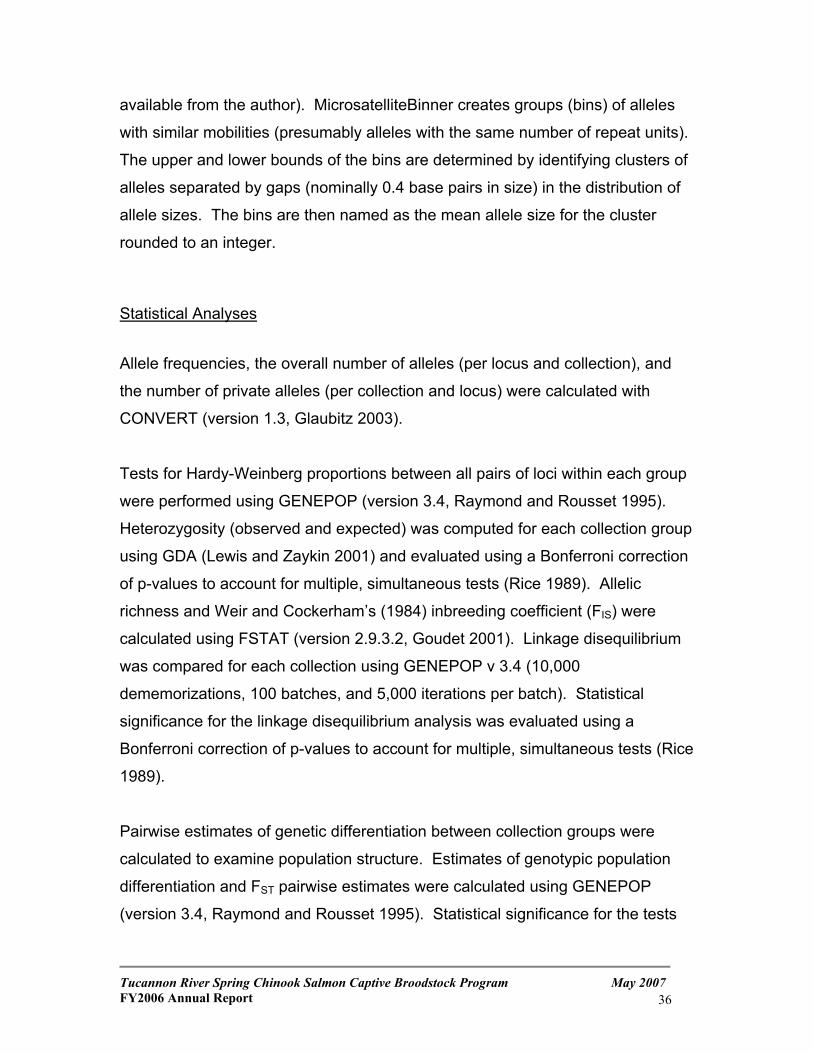
available from the author). MicrosatelliteBinner creates groups (bins) of alleles
with similar mobilities (presumably alleles with the same number of repeat units).
The upper and lower bounds of the bins are determined by identifying clusters of
alleles separated by gaps (nominally 0.4 base pairs in size) in the distribution of
allele sizes. The bins are then named as the mean allele size for the cluster
rounded to an integer.
Statistical Analyses
Allele frequencies, the overall number of alleles (per locus and collection), and
the number of private alleles (per collection and locus) were calculated with
CONVERT (version 1.3, Glaubitz 2003).
Tests for Hardy-Weinberg proportions between all pairs of loci within each group
were performed using GENEPOP (version 3.4, Raymond and Rousset 1995).
Heterozygosity (observed and expected) was computed for each collection group
using GDA (Lewis and Zaykin 2001) and evaluated using a Bonferroni correction
of p-values to account for multiple, simultaneous tests (Rice 1989). Allelic
richness and Weir and Cockerham’s (1984) inbreeding coefficient (FIS) were
calculated using FSTAT (version 2.9.3.2, Goudet 2001). Linkage disequilibrium
was compared for each collection using GENEPOP v 3.4 (10,000
dememorizations, 100 batches, and 5,000 iterations per batch). Statistical
significance for the linkage disequilibrium analysis was evaluated using a
Bonferroni correction of p-values to account for multiple, simultaneous tests (Rice
1989).
Pairwise estimates of genetic differentiation between collection groups were
calculated to examine population structure. Estimates of genotypic population
differentiation and FST pairwise estimates were calculated using GENEPOP
(version 3.4, Raymond and Rousset 1995). Statistical significance for the tests
Tucannon River Spring Chinook Salmon Captive Broodstock Program May 2007 FY2006 Annual Report
36
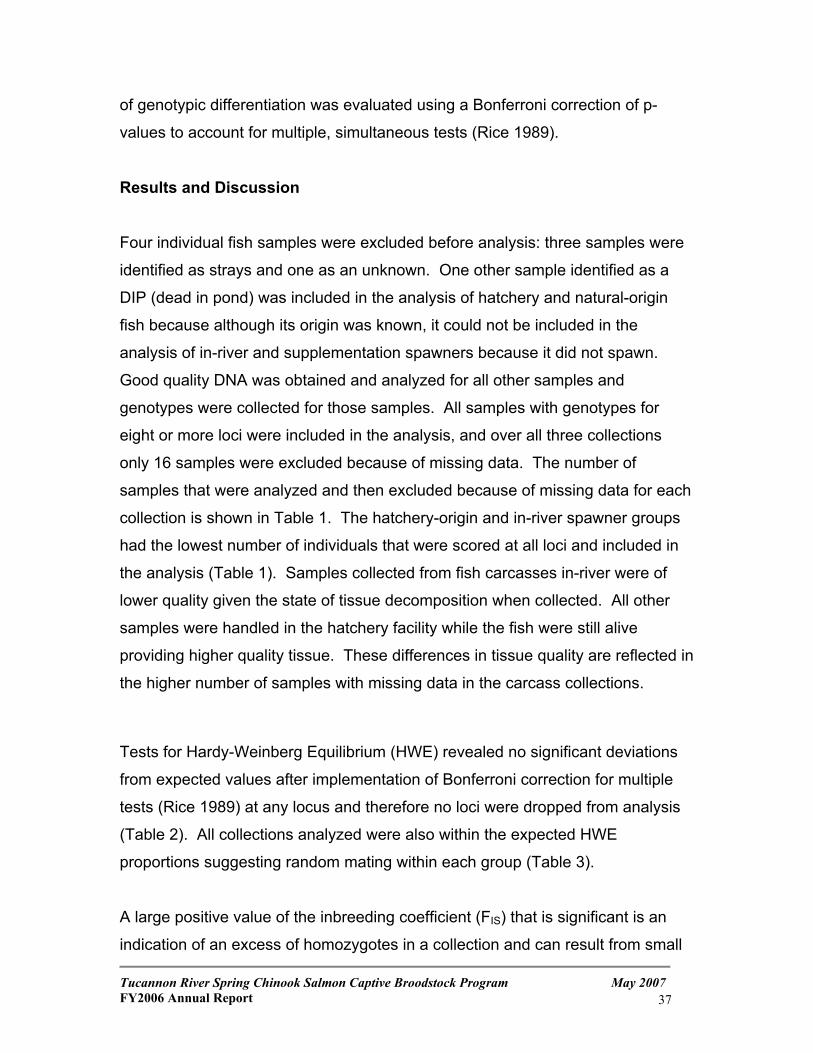
of genotypic differentiation was evaluated using a Bonferroni correction of p-
values to account for multiple, simultaneous tests (Rice 1989).
Results and Discussion
Four individual fish samples were excluded before analysis: three samples were
identified as strays and one as an unknown. One other sample identified as a
DIP (dead in pond) was included in the analysis of hatchery and natural-origin
fish because although its origin was known, it could not be included in the
analysis of in-river and supplementation spawners because it did not spawn.
Good quality DNA was obtained and analyzed for all other samples and
genotypes were collected for those samples. All samples with genotypes for
eight or more loci were included in the analysis, and over all three collections
only 16 samples were excluded because of missing data. The number of
samples that were analyzed and then excluded because of missing data for each
collection is shown in Table 1. The hatchery-origin and in-river spawner groups
had the lowest number of individuals that were scored at all loci and included in
the analysis (Table 1). Samples collected from fish carcasses in-river were of
lower quality given the state of tissue decomposition when collected. All other
samples were handled in the hatchery facility while the fish were still alive
providing higher quality tissue. These differences in tissue quality are reflected in
the higher number of samples with missing data in the carcass collections.
Tests for Hardy-Weinberg Equilibrium (HWE) revealed no significant deviations
from expected values after implementation of Bonferroni correction for multiple
tests (Rice 1989) at any locus and therefore no loci were dropped from analysis
(Table 2). All collections analyzed were also within the expected HWE
proportions suggesting random mating within each group (Table 3).
Tucannon River Spring Chinook Salmon Captive Broodstock Program May 2007 FY2006 Annual Report
37
A large positive value of the inbreeding coefficient (FIS) that is significant is an
indication of an excess of homozygotes in a collection and can result from small
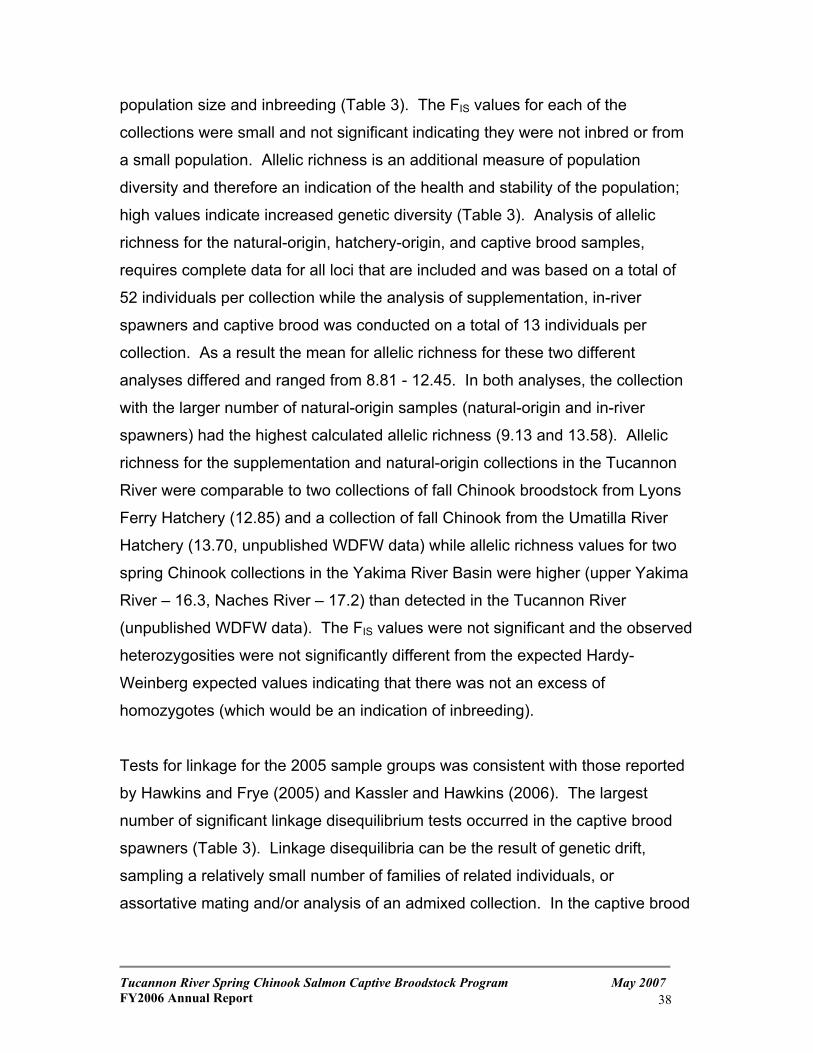
population size and inbreeding (Table 3). The FIS values for each of the
collections were small and not significant indicating they were not inbred or from
a small population. Allelic richness is an additional measure of population
diversity and therefore an indication of the health and stability of the population;
high values indicate increased genetic diversity (Table 3). Analysis of allelic
richness for the natural-origin, hatchery-origin, and captive brood samples,
requires complete data for all loci that are included and was based on a total of
52 individuals per collection while the analysis of supplementation, in-river
spawners and captive brood was conducted on a total of 13 individuals per
collection. As a result the mean for allelic richness for these two different
analyses differed and ranged from 8.81 - 12.45. In both analyses, the collection
with the larger number of natural-origin samples (natural-origin and in-river
spawners) had the highest calculated allelic richness (9.13 and 13.58). Allelic
richness for the supplementation and natural-origin collections in the Tucannon
River were comparable to two collections of fall Chinook broodstock from Lyons
Ferry Hatchery (12.85) and a collection of fall Chinook from the Umatilla River
Hatchery (13.70, unpublished WDFW data) while allelic richness values for two
spring Chinook collections in the Yakima River Basin were higher (upper Yakima
River – 16.3, Naches River – 17.2) than detected in the Tucannon River
(unpublished WDFW data). The FIS values were not significant and the observed
heterozygosities were not significantly different from the expected Hardy-
Weinberg expected values indicating that there was not an excess of
homozygotes (which would be an indication of inbreeding).
Tests for linkage for the 2005 sample groups was consistent with those reported
by Hawkins and Frye (2005) and Kassler and Hawkins (2006). The largest
number of significant linkage disequilibrium tests occurred in the captive brood
spawners (Table 3). Linkage disequilibria can be the result of genetic drift,
sampling a relatively small number of families of related individuals, or
assortative mating and/or analysis of an admixed collection. In the captive brood
Tucannon River Spring Chinook Salmon Captive Broodstock Program May 2007 FY2006 Annual Report
38
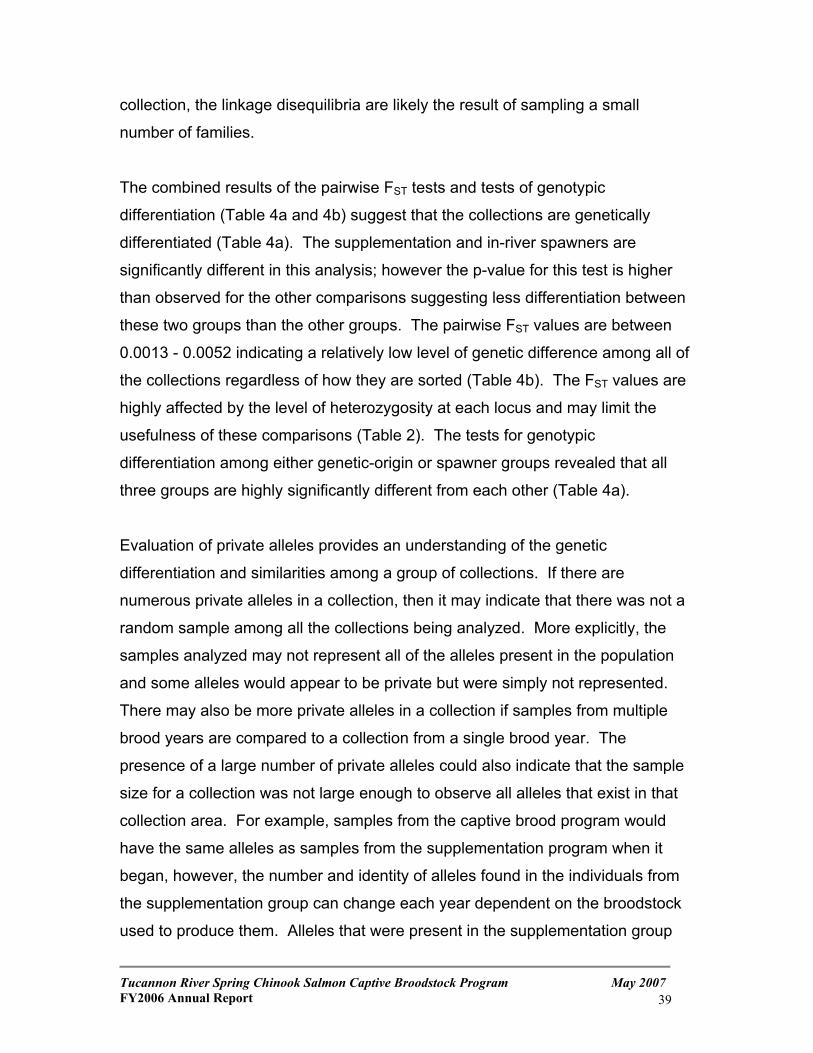
collection, the linkage disequilibria are likely the result of sampling a small
number of families.
The combined results of the pairwise FST tests and tests of genotypic
differentiation (Table 4a and 4b) suggest that the collections are genetically
differentiated (Table 4a). The supplementation and in-river spawners are
significantly different in this analysis; however the p-value for this test is higher
than observed for the other comparisons suggesting less differentiation between
these two groups than the other groups. The pairwise FST values are between
0.0013 - 0.0052 indicating a relatively low level of genetic difference among all of
the collections regardless of how they are sorted (Table 4b). The FST values are
highly affected by the level of heterozygosity at each locus and may limit the
usefulness of these comparisons (Table 2). The tests for genotypic
differentiation among either genetic-origin or spawner groups revealed that all
three groups are highly significantly different from each other (Table 4a).
Evaluation of private alleles provides an understanding of the genetic
differentiation and similarities among a group of collections. If there are
numerous private alleles in a collection, then it may indicate that there was not a
random sample among all the collections being analyzed. More explicitly, the
samples analyzed may not represent all of the alleles present in the population
and some alleles would appear to be private but were simply not represented.
There may also be more private alleles in a collection if samples from multiple
brood years are compared to a collection from a single brood year. The
presence of a large number of private alleles could also indicate that the sample
size for a collection was not large enough to observe all alleles that exist in that
collection area. For example, samples from the captive brood program would
have the same alleles as samples from the supplementation program when it
began, however, the number and identity of alleles found in the individuals from
the supplementation group can change each year dependent on the broodstock
used to produce them. Alleles that were present in the supplementation group
Tucannon River Spring Chinook Salmon Captive Broodstock Program May 2007 FY2006 Annual Report
39
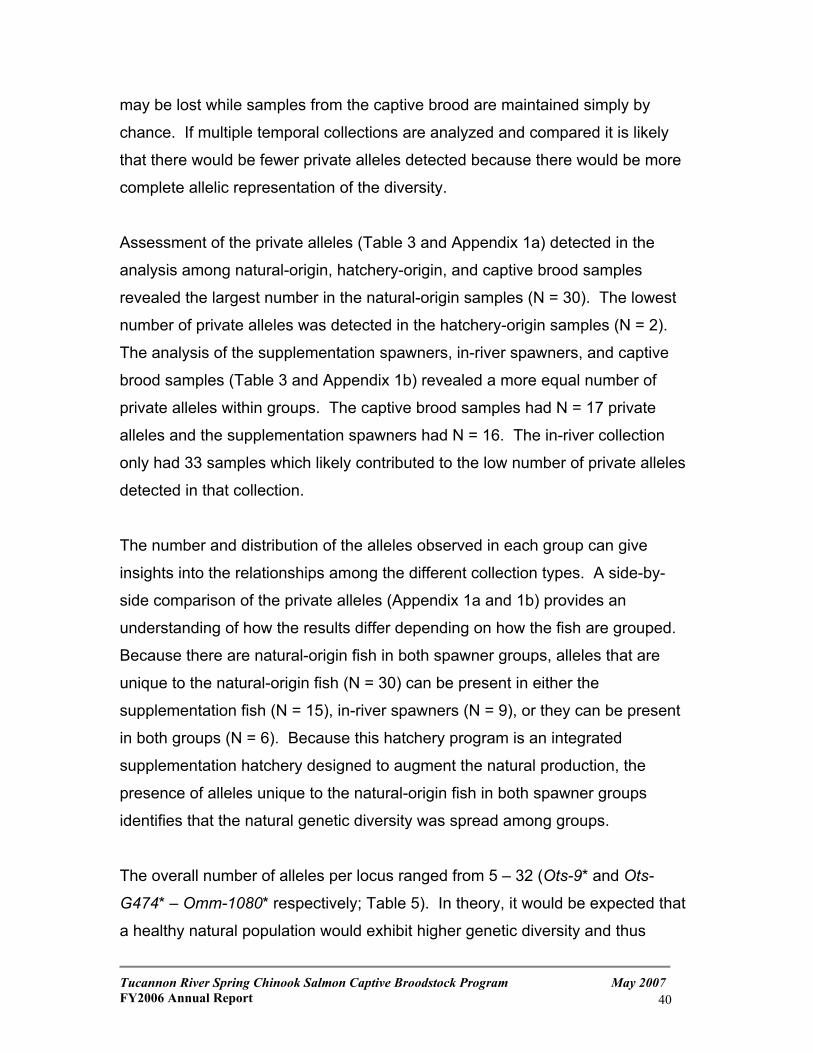
may be lost while samples from the captive brood are maintained simply by
chance. If multiple temporal collections are analyzed and compared it is likely
that there would be fewer private alleles detected because there would be more
complete allelic representation of the diversity.
Assessment of the private alleles (Table 3 and Appendix 1a) detected in the
analysis among natural-origin, hatchery-origin, and captive brood samples
revealed the largest number in the natural-origin samples (N = 30). The lowest
number of private alleles was detected in the hatchery-origin samples (N = 2).
The analysis of the supplementation spawners, in-river spawners, and captive
brood samples (Table 3 and Appendix 1b) revealed a more equal number of
private alleles within groups. The captive brood samples had N = 17 private
alleles and the supplementation spawners had N = 16. The in-river collection
only had 33 samples which likely contributed to the low number of private alleles
detected in that collection.
The number and distribution of the alleles observed in each group can give
insights into the relationships among the different collection types. A side-by-
side comparison of the private alleles (Appendix 1a and 1b) provides an
understanding of how the results differ depending on how the fish are grouped.
Because there are natural-origin fish in both spawner groups, alleles that are
unique to the natural-origin fish (N = 30) can be present in either the
supplementation fish (N = 15), in-river spawners (N = 9), or they can be present
in both groups (N = 6). Because this hatchery program is an integrated
supplementation hatchery designed to augment the natural production, the
presence of alleles unique to the natural-origin fish in both spawner groups
identifies that the natural genetic diversity was spread among groups.
The overall number of alleles per locus ranged from 5 – 32 (Ots-9* and Ots-
G474* – Omm-1080* respectively; Table 5). In theory, it would be expected that
a healthy natural population would exhibit higher genetic diversity and thus
Tucannon River Spring Chinook Salmon Captive Broodstock Program May 2007 FY2006 Annual Report
40
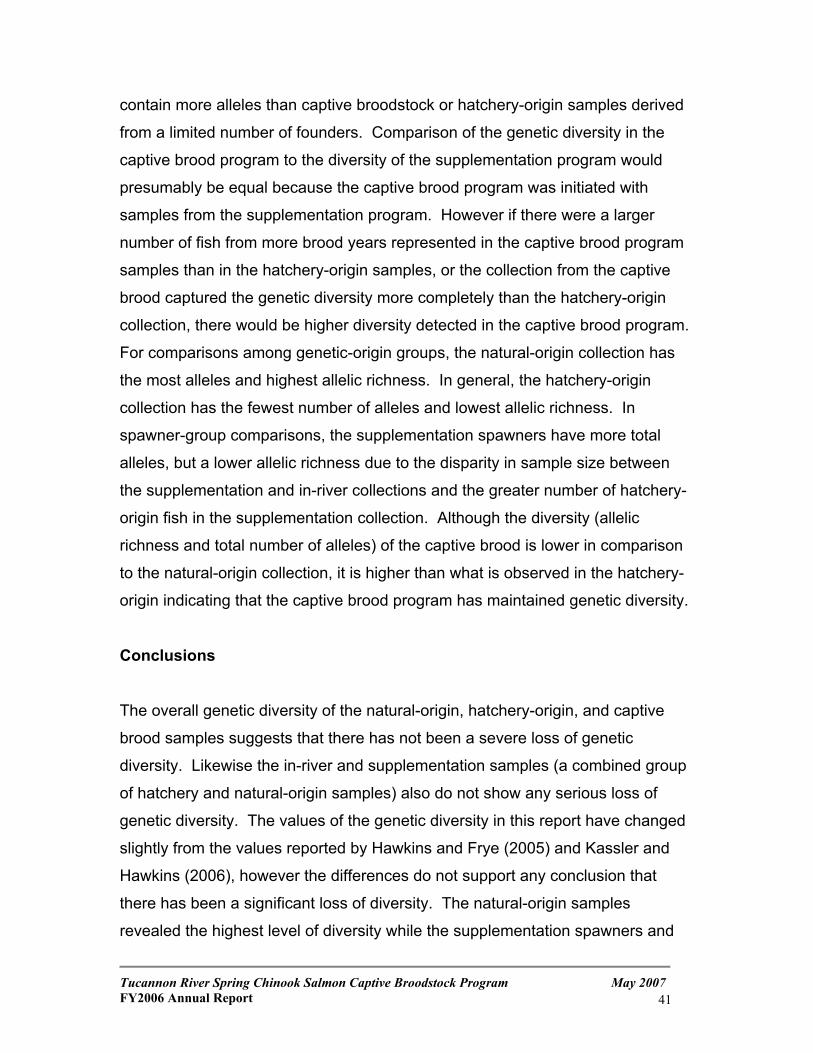
contain more alleles than captive broodstock or hatchery-origin samples derived
from a limited number of founders. Comparison of the genetic diversity in the
captive brood program to the diversity of the supplementation program would
presumably be equal because the captive brood program was initiated with
samples from the supplementation program. However if there were a larger
number of fish from more brood years represented in the captive brood program
samples than in the hatchery-origin samples, or the collection from the captive
brood captured the genetic diversity more completely than the hatchery-origin
collection, there would be higher diversity detected in the captive brood program.
For comparisons among genetic-origin groups, the natural-origin collection has
the most alleles and highest allelic richness. In general, the hatchery-origin
collection has the fewest number of alleles and lowest allelic richness. In
spawner-group comparisons, the supplementation spawners have more total
alleles, but a lower allelic richness due to the disparity in sample size between
the supplementation and in-river collections and the greater number of hatchery-
origin fish in the supplementation collection. Although the diversity (allelic
richness and total number of alleles) of the captive brood is lower in comparison
to the natural-origin collection, it is higher than what is observed in the hatchery-
origin indicating that the captive brood program has maintained genetic diversity.
Conclusions
The overall genetic diversity of the natural-origin, hatchery-origin, and captive
brood samples suggests that there has not been a severe loss of genetic
diversity. Likewise the in-river and supplementation samples (a combined group
of hatchery and natural-origin samples) also do not show any serious loss of
genetic diversity. The values of the genetic diversity in this report have changed
slightly from the values reported by Hawkins and Frye (2005) and Kassler and
Hawkins (2006), however the differences do not support any conclusion that
there has been a significant loss of diversity. The natural-origin samples
revealed the highest level of diversity while the supplementation spawners and
Tucannon River Spring Chinook Salmon Captive Broodstock Program May 2007 FY2006 Annual Report
41
the captive brood spawners have had lower values. This result is possibly a
sampling effect as fewer of the hatchery-origin fish were sampled than the
natural-origin population. The lower diversity in the supplementation group and
captive brood spawners likely reflects a smaller population size compared to the
natural-origin population (causing genetic drift to have a strong effect), and the
relatively small number of families (varying in the number of individuals per
family) for the captive brood spawners. Changes in sampling or variation in the
run from year to year can also affect the quantity and distribution of alleles. The
results and comparisons of the different collection types provides evidence that
the captive broodstock program and supplementation program have been
successful in preserving genetic variation, and that the supplementation program
has been effective in minimizing the genetic differences between the hatchery
and natural-origin fish.
Acknowledgements The Bonneville Power Administration (BPA) and WA State General Funds
provided funding for this project. We would like to thank Mike Gallinat (WDFW)
for initiating the study and for providing background and biological information.
We would also like to thank Mike Gallinat and the Snake River Laboratory staff
for collecting samples and Cheryl Dean (WDFW – Molecular Genetics
Laboratory) for processing samples. Mike Gallinat, Glen Mendel, and Mark
Schuck (WDFW) provided editorial review and comment.
Tucannon River Spring Chinook Salmon Captive Broodstock Program May 2007 FY2006 Annual Report
42
Literature Cited Gallinat, M. P. 2004. Tucannon River Spring Chinook Captive Broodstock
Program. BPA 2003 annual report. 39 pages. Gallinat, M.P. 2006. Tucannon River Spring Chinook Salmon Captive
Broodstock Program - FY2005 Annual Report. Washington Department of Fish and Wildlife. Report to BPA. Project #2000-019-00. 33 p.
Glaubitz, J.C. 2003. CONVERT (version 1.2): A user-friendly program to
reformat diploid genotypic data for commonly used population genetic software packages. http://www.agriculture.purdue.edu/fnr/html/faculty/Rhodes/Students%20and%20Staff/glaubitz/software.htm.
Goudet, J. 2001. FSTAT, a program to estimate and test gene diversities and
fixation indices (version 293). Updated from Goudet (1995). Available from http://www.unilch/izea/softwares/fstat.html.
Hawkins, D.K. and A. Frye. 2005. Microsatellite DNA analysis of Tucannon
River spring Chinook: 2003 collections of supplementation hatchery spawners, redd survey carcasses from the river, and captive brood spawners. Unpublished WDFW Genetics Laboratory report submitted to Mike Gallinat at WDFW Snake River Laboratory, Dayton, WA.
Kassler, T.W. and D.K. Hawkins. 2006. Genetic Assessment of the Spring
Chinook Captive Brood Program in the Tucannon River (2003 & 2004) Using a Microsatellite DNA Analysis. Unpublished WDFW Molecular Genetics Laboratory report submitted to Mike Gallinat at WDFW Snake River Laboratory, Dayton, WA.
Lewis, P. O. and D. Zaykin. 2001. Genetic Data Analysis: Computer program
for the analysis of allelic data. Version 1.0 (d16c). Free program distributed by the authors over the internet from http://lewis.eeb.uconn.edu/lewishome/software.html
Raymond, M. and F. Rousset. 1995. GENEPOP (Version 3.3): Population
genetics software for exact tests and ecumenicism. Journal of Heredity 86:248-249.
Rice, W.R. 1989. Analyzing tables of statistical tests. Evolution 43:223-225. Weir, B.S. and C.C. Cockerham. 1984. Estimating F-statistics for the analysis of
population structure. Evolution 38:1358-1370.
Tucannon River Spring Chinook Salmon Captive Broodstock Program May 2007 FY2006 Annual Report
43
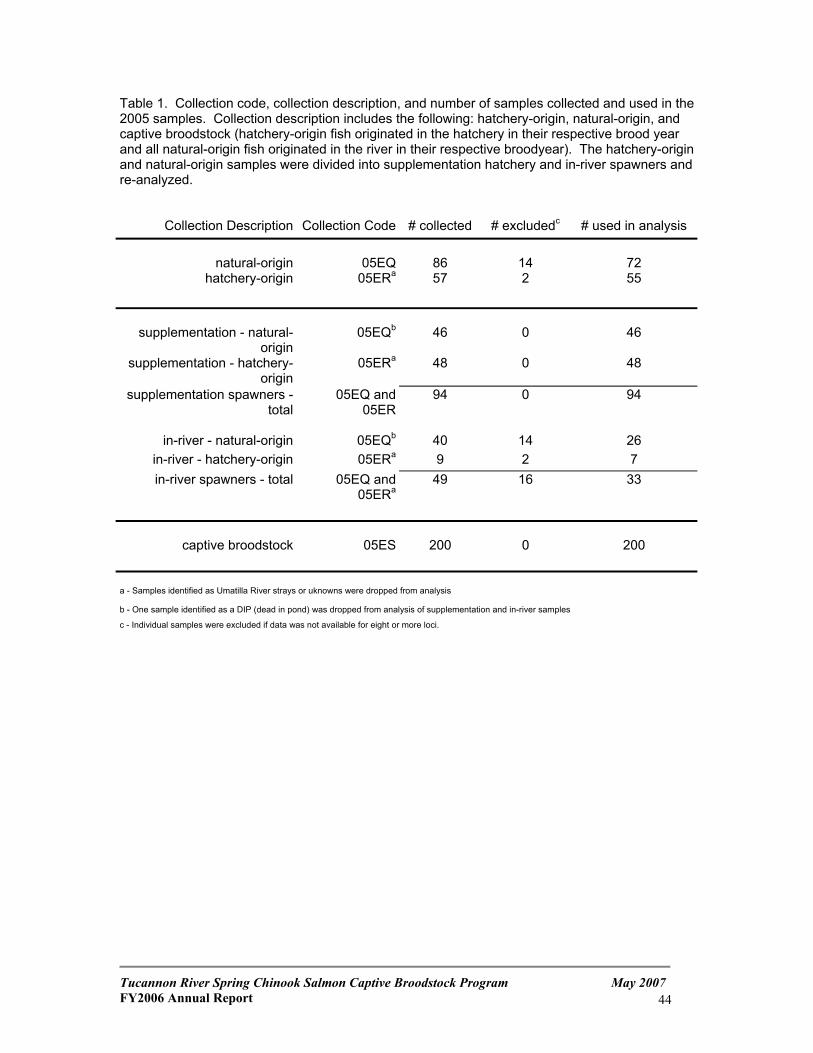
Table 1. Collection code, collection description, and number of samples collected and used in the 2005 samples. Collection description includes the following: hatchery-origin, natural-origin, and captive broodstock (hatchery-origin fish originated in the hatchery in their respective brood year and all natural-origin fish originated in the river in their respective broodyear). The hatchery-origin and natural-origin samples were divided into supplementation hatchery and in-river spawners and re-analyzed.
Collection Description Collection Code # collected # excludedc # used in analysis
natural-origin 05EQ 86 14 72 hatchery-origin 05ERa 57 2 55
supplementation - natural-origin
05EQb 46 0 46
supplementation - hatchery-origin
05ERa 48 0 48
supplementation spawners - total
05EQ and 05ER
94 0 94
in-river - natural-origin 05EQb 40 14 26
in-river - hatchery-origin 05ERa 9 2 7 in-river spawners - total 05EQ and
05ERa49 16 33
captive broodstock 05ES 200 0 200 a - Samples identified as Umatilla River strays or uknowns were dropped from analysis b - One sample identified as a DIP (dead in pond) was dropped from analysis of supplementation and in-river samples c - Individual samples were excluded if data was not available for eight or more loci.
Tucannon River Spring Chinook Salmon Captive Broodstock Program May 2007 FY2006 Annual Report
44
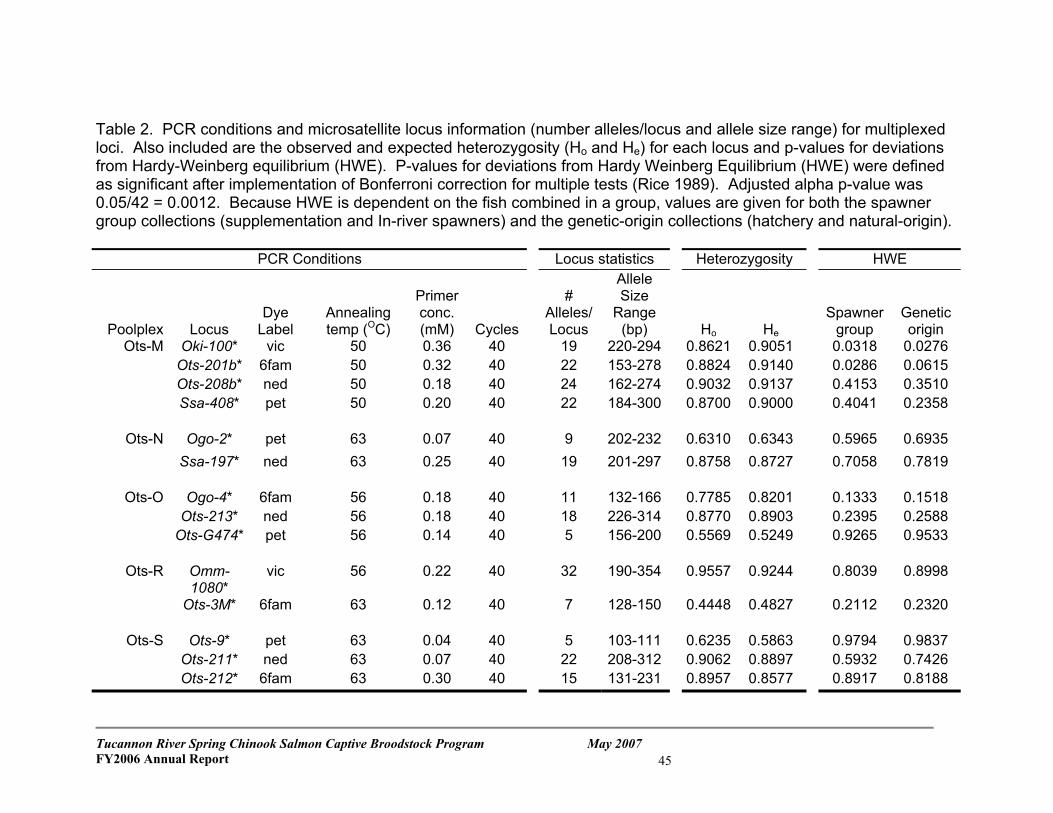
Table 2. PCR conditions and microsatellite locus information (number alleles/locus and allele size range) for multiplexed loci. Also included are the observed and expected heterozygosity (Ho and He) for each locus and p-values for deviations from Hardy-Weinberg equilibrium (HWE). P-values for deviations from Hardy Weinberg Equilibrium (HWE) were defined as significant after implementation of Bonferroni correction for multiple tests (Rice 1989). Adjusted alpha p-value was 0.05/42 = 0.0012. Because HWE is dependent on the fish combined in a group, values are given for both the spawner group collections (supplementation and In-river spawners) and the genetic-origin collections (hatchery and natural-origin).
PCR Conditions Locus statistics Heterozygosity HWE
Poolplex
Locus
Dye Label
Annealing temp (OC)
Primer conc. (mM)
Cycles
#
Alleles/ Locus
Allele Size
Range (bp)
Ho
He
Spawner group
Genetic origin
Ots-M Oki-100* vic
50 0.36 40 19 220-294 0.8621 0.9051 0.0318 0.0276 Ots-201b* 6fam 50 0.32 40 22 153-278 0.8824 0.9140 0.0286 0.0615 Ots-208b* ned 50 0.18 40 24 162-274 0.9032 0.9137 0.4153 0.3510 Ssa-408* pet
50
0.20 40
22 184-300 0.8700
0.9000
0.4041 0.2358
Ots-N Ogo-2* pet 63 0.07 40 9 202-232 0.6310 0.6343 0.5965 0.6935
Ssa-197* ned
63
0.25 40
19 201-297 0.8758
0.8727
0.7058 0.7819
Ots-O Ogo-4* 6fam 56 0.18 40 11 132-166 0.7785 0.8201 0.1333 0.1518 Ots-213* ned 56 0.18 40 18 226-314 0.8770 0.8903 0.2395 0.2588 Ots-G474* pet
56
0.14 40
5 156-200 0.5569
0.5249
0.9265 0.9533
Ots-R Omm-
1080* vic 56 0.22 40 32 190-354 0.9557 0.9244 0.8039 0.8998
Ots-3M* 6fam
63
0.12 40
7 128-150 0.4448
0.4827
0.2112 0.2320
Ots-S Ots-9* pet 63 0.04 40 5 103-111 0.6235 0.5863 0.9794 0.9837 Ots-211* ned 63 0.07 40 22 208-312 0.9062 0.8897 0.5932 0.7426
Ots-212* 6fam 63 0.30 40 15 131-231 0.8957 0.8577 0.8917 0.8188
Tucannon River Spring Chinook Salmon Captive Broodstock Program May 2007 FY2006 Annual Report
45
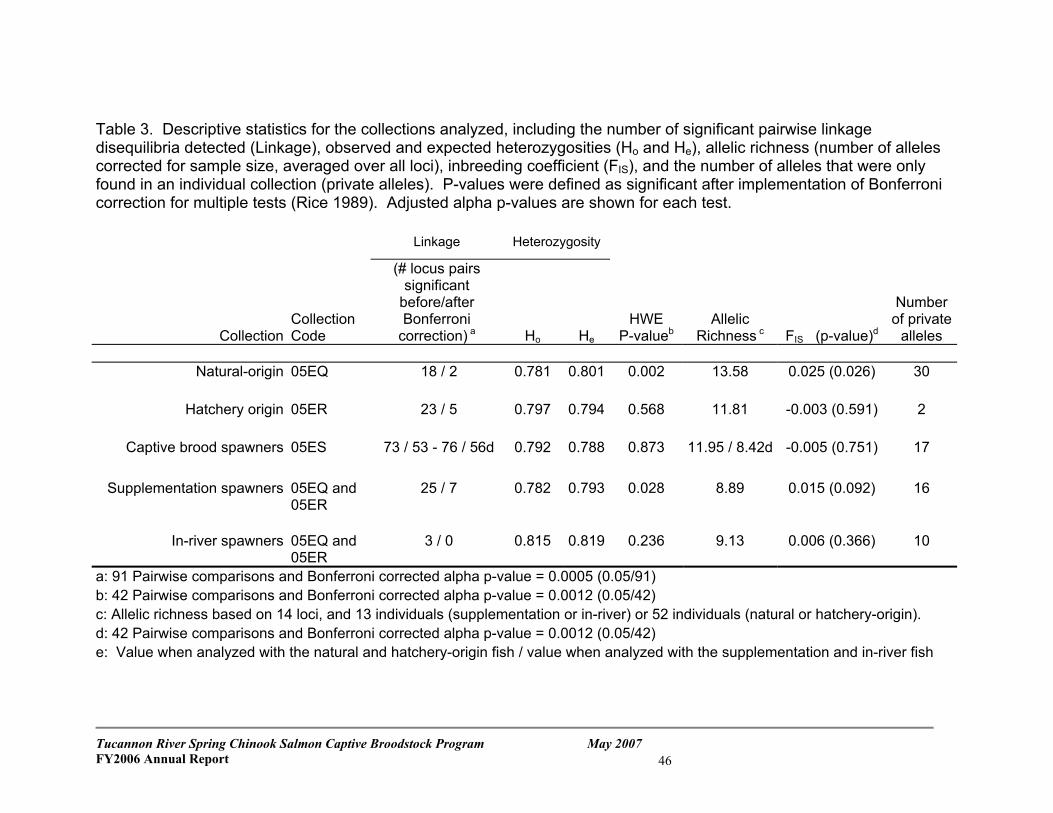
Table 3. Descriptive statistics for the collections analyzed, including the number of significant pairwise linkage disequilibria detected (Linkage), observed and expected heterozygosities (Ho and He), allelic richness (number of alleles corrected for sample size, averaged over all loci), inbreeding coefficient (FIS), and the number of alleles that were only found in an individual collection (private alleles). P-values were defined as significant after implementation of Bonferroni correction for multiple tests (Rice 1989). Adjusted alpha p-values are shown for each test. Linkage Heterozygosity
Collection
Collection Code
(# locus pairs significant
before/after Bonferroni
correction) a
Ho
He
HWE P-valueb
Allelic Richness c
FIS (p-value)d
Number of private
alleles
Natural-origin 05EQ 18 / 2 0.781 0.801 0.002 13.58 0.025 (0.026) 30
Hatchery origin
05ER 23 / 5 0.797 0.794 0.568
11.81
-0.003 (0.591) 2
Captive brood spawners 05ES 73 / 53 - 76 / 56d 0.792 0.788 0.873 11.95 / 8.42d -0.005 (0.751) 17
Supplementation spawners 05EQ and 05ER
25 / 7 0.782 0.793 0.028 8.89 0.015 (0.092) 16
In-river spawners 05EQ and
05ER 3 / 0 0.815 0.819 0.236 9.13 0.006 (0.366) 10
a: 91 Pairwise comparisons and Bonferroni corrected alpha p-value = 0.0005 (0.05/91) b: 42 Pairwise comparisons and Bonferroni corrected alpha p-value = 0.0012 (0.05/42) c: Allelic richness based on 14 loci, and 13 individuals (supplementation or in-river) or 52 individuals (natural or hatchery-origin). d: 42 Pairwise comparisons and Bonferroni corrected alpha p-value = 0.0012 (0.05/42) e: Value when analyzed with the natural and hatchery-origin fish / value when analyzed with the supplementation and in-river fish
Tucannon River Spring Chinook Salmon Captive Broodstock Program May 2007 FY2006 Annual Report
46
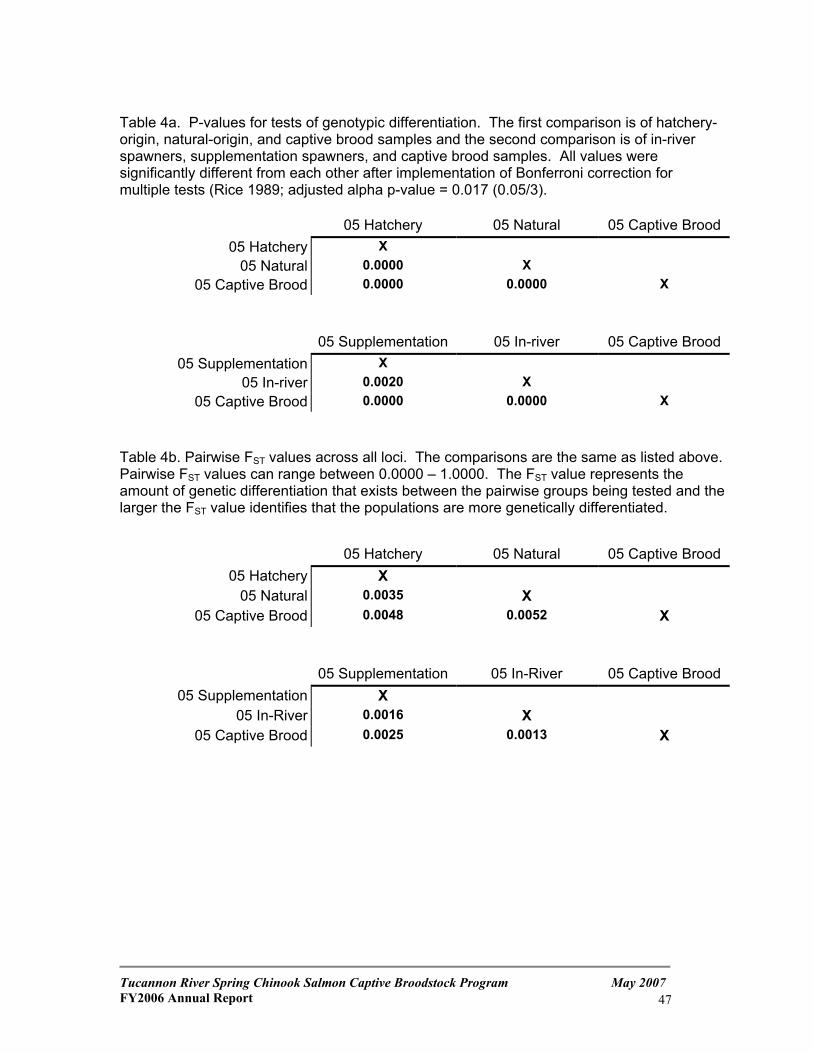
Table 4a. P-values for tests of genotypic differentiation. The first comparison is of hatchery-origin, natural-origin, and captive brood samples and the second comparison is of in-river spawners, supplementation spawners, and captive brood samples. All values were significantly different from each other after implementation of Bonferroni correction for multiple tests (Rice 1989; adjusted alpha p-value = 0.017 (0.05/3). 05 Hatchery 05 Natural 05 Captive Brood
05 Hatchery X 05 Natural 0.0000 X
05 Captive Brood 0.0000 0.0000 X 05 Supplementation 05 In-river 05 Captive Brood
05 Supplementation X 05 In-river 0.0020 X
05 Captive Brood 0.0000 0.0000 X Table 4b. Pairwise FST values across all loci. The comparisons are the same as listed above. Pairwise FST values can range between 0.0000 – 1.0000. The FST value represents the amount of genetic differentiation that exists between the pairwise groups being tested and the larger the FST value identifies that the populations are more genetically differentiated.
05 Hatchery 05 Natural 05 Captive Brood
05 Hatchery X 05 Natural 0.0035 X
05 Captive Brood 0.0048 0.0052 X 05 Supplementation 05 In-River 05 Captive Brood
05 Supplementation X 05 In-River 0.0016 X
05 Captive Brood 0.0025 0.0013 X
Tucannon River Spring Chinook Salmon Captive Broodstock Program May 2007 FY2006 Annual Report
47
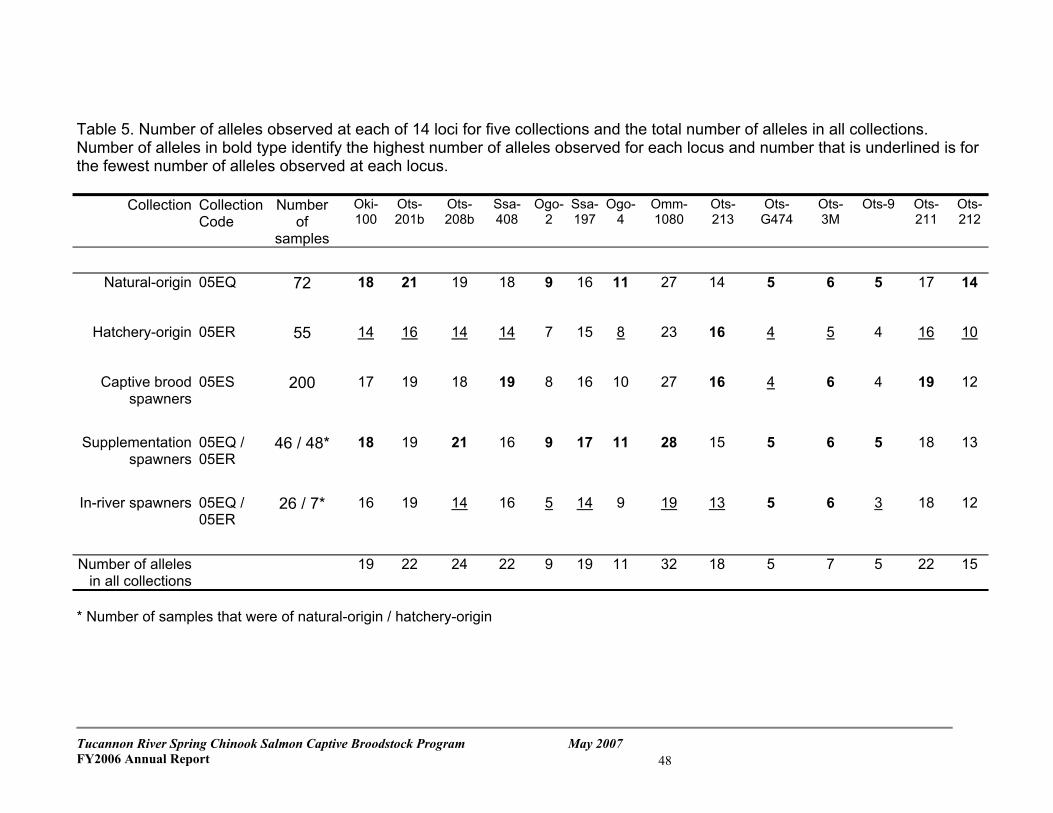
Table 5. Number of alleles observed at each of 14 loci for five collections and the total number of alleles in all collections. Number of alleles in bold type identify the highest number of alleles observed for each locus and number that is underlined is for the fewest number of alleles observed at each locus.
Collection Collection Code
Number of
samples
Oki-100
Ots-201b
Ots-208b
Ssa-408
Ogo-2
Ssa-197
Ogo-4
Omm-1080
Ots-213
Ots-G474
Ots-3M
Ots-9 Ots-211
Ots-212
Natural-origin 05EQ 72 18 21 19 18 9 16 11 27 14 5 6 5 17 14
Hatchery-origin 05ER 55 14 16 14 14 7 15 8 23 16 4 4 16 10
Captive brood spawners
05ES 200 17 19 18 19 8 16 10 27 16 4 6 4 19 12
Supplementation
spawners
05EQ / 05ER
46 / 48* 18 19 21 16 9 17 11 28 15 5 6 5 18 13
In-river spawners 05EQ /
05ER 26 / 7* 16 19 14 16 5 14 9 19 13 5 6 3 18 12
Number of alleles in all collections
19 22 24 22 9 19 11 32 18 5 7 5 22 15
* Number of samples that were of natural-origin / hatchery-origin
5
Tucannon River Spring Chinook Salmon Captive Broodstock Program May 2007 FY2006 Annual Report
48
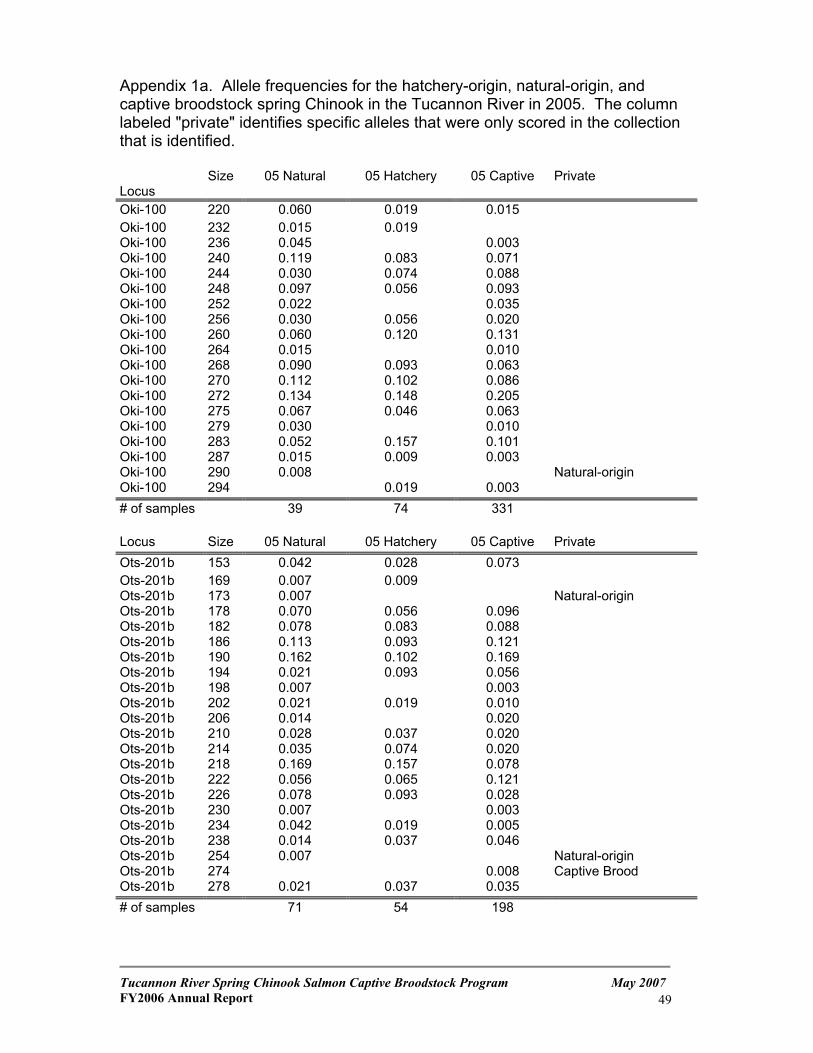
Appendix 1a. Allele frequencies for the hatchery-origin, natural-origin, and captive broodstock spring Chinook in the Tucannon River in 2005. The column labeled "private" identifies specific alleles that were only scored in the collection that is identified. Locus
Size 05 Natural 05 Hatchery 05 Captive Private
Oki-100 220 0.060 0.019 0.015 Oki-100 232 0.015 0.019 Oki-100 236 0.045 0.003 Oki-100 240 0.119 0.083 0.071 Oki-100 244 0.030 0.074 0.088 Oki-100 248 0.097 0.056 0.093 Oki-100 252 0.022 0.035 Oki-100 256 0.030 0.056 0.020 Oki-100 260 0.060 0.120 0.131 Oki-100 264 0.015 0.010 Oki-100 268 0.090 0.093 0.063 Oki-100 270 0.112 0.102 0.086 Oki-100 272 0.134 0.148 0.205 Oki-100 275 0.067 0.046 0.063 Oki-100 279 0.030 0.010 Oki-100 283 0.052 0.157 0.101 Oki-100 287 0.015 0.009 0.003 Oki-100 290 0.008 Natural-origin Oki-100 294 0.019 0.003 # of samples 39 74 331 Locus Size 05 Natural 05 Hatchery 05 Captive Private Ots-201b 153 0.042 0.028 0.073 Ots-201b 169 0.007 0.009 Ots-201b 173 0.007 Natural-origin Ots-201b 178 0.070 0.056 0.096 Ots-201b 182 0.078 0.083 0.088 Ots-201b 186 0.113 0.093 0.121 Ots-201b 190 0.162 0.102 0.169 Ots-201b 194 0.021 0.093 0.056 Ots-201b 198 0.007 0.003 Ots-201b 202 0.021 0.019 0.010 Ots-201b 206 0.014 0.020 Ots-201b 210 0.028 0.037 0.020 Ots-201b 214 0.035 0.074 0.020 Ots-201b 218 0.169 0.157 0.078 Ots-201b 222 0.056 0.065 0.121 Ots-201b 226 0.078 0.093 0.028 Ots-201b 230 0.007 0.003 Ots-201b 234 0.042 0.019 0.005 Ots-201b 238 0.014 0.037 0.046 Ots-201b 254 0.007 Natural-origin Ots-201b 274 0.008 Captive Brood Ots-201b 278 0.021 0.037 0.035 # of samples 71 54 198
Tucannon River Spring Chinook Salmon Captive Broodstock Program May 2007 FY2006 Annual Report
49
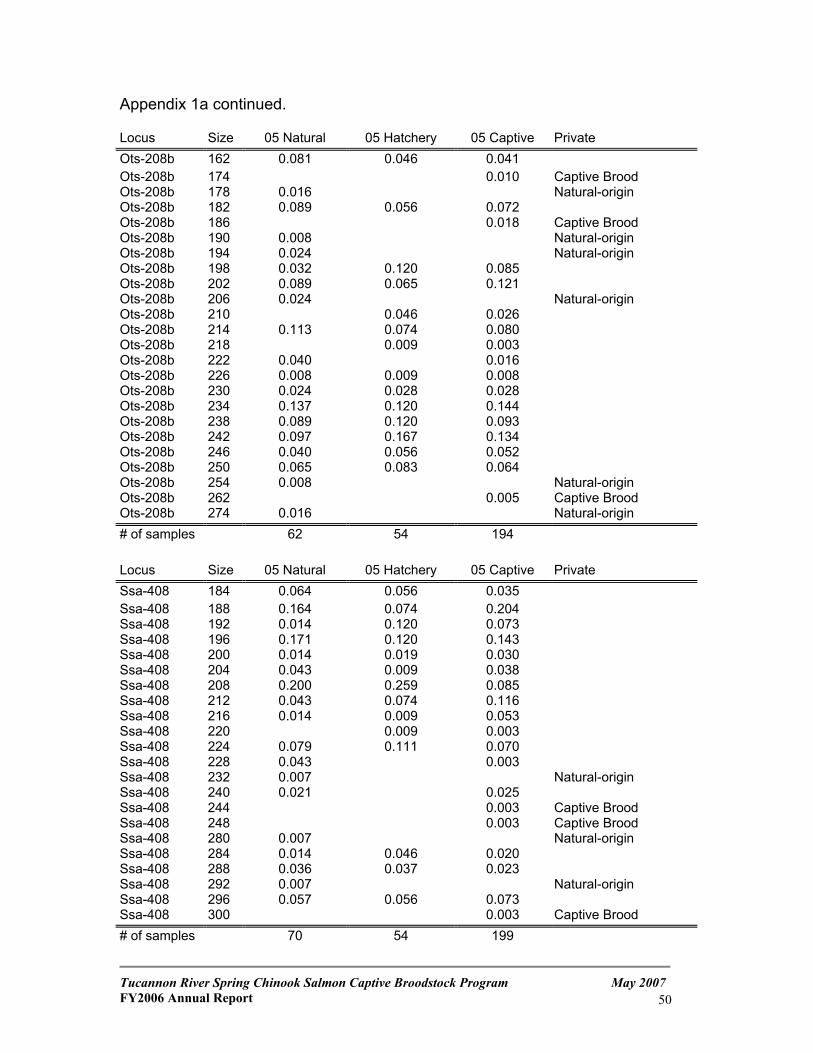
Locus Size 05 Natural 05 Hatchery 05 Captive Ots-208b 162 0.081 0.046 0.041 Ots-208b 174 0.010 Ots-208b 178 0.016 Ots-208b 182 0.089 0.056 0.072 Ots-208b 186 0.018 Ots-208b 190 0.008 Ots-208b 194 0.024 Ots-208b 198 0.032 0.120 0.085 Ots-208b 202 0.089 0.065 0.121 Ots-208b 206 0.024 Ots-208b 210 0.046 0.026 Ots-208b 214 0.113 0.074 0.080 Ots-208b 218 0.009 0.003 Ots-208b 222 0.040 0.016 Ots-208b 226 0.008 0.009 0.008
Appendix 1a continued. Private
Captive Brood Natural-origin
Captive Brood Natural-origin
Natural-origin Natural-origin
Ots-208b 230 0.024 0.028 0.028 Ots-208b 234 0.137 0.120 0.144 Ots-208b 238 0.089 0.120 0.093 Ots-208b 242 0.097 0.167 0.134 Ots-208b 246 0.056 0.052 Ots-208b 250 0.065 0.083 0.064 Ots-208b 254 0.008 Natural-origin Ots-208b 262 0.005 Captive Brood Ots-208b 274 0.016 Natural-origin # of samples 62 54 194 Locus Size 05 Natural 05 Hatchery 05 Captive Private Ssa-408 184 0.064 0.056 0.035 Ssa-408 188 0.164 0.074 0.204 Ssa-408 192 0.014 0.120 0.073 Ssa-408 196 0.171 0.120 0.143 Ssa-408 200 0.014 0.019 0.030 Ssa-408 204 0.043 0.009 0.038 Ssa-408 208 0.200 0.259 0.085 Ssa-408 212 0.043 0.074 0.116 Ssa-408 216 0.014 0.009 0.053 Ssa-408 220 0.009 0.003 Ssa-408 224 0.079 0.111 0.070 Ssa-408 228 0.043 0.003 Ssa-408 232 0.007 Natural-origin Ssa-408 240 0.021 0.025 Ssa-408 244 0.003 Captive Brood Ssa-408 248 0.003 Captive Brood Ssa-408 280 0.007 Natural-origin Ssa-408 284 0.014 0.046 0.020 Ssa-408 288 0.036 0.037 0.023 Ssa-408 292 0.007 Natural-origin Ssa-408 296 0.057 0.056 0.073 Ssa-408 300 0.003 Captive Brood # of samples 70 54 199
0.040
Tucannon River Spring Chinook Salmon Captive Broodstock Program May 2007 FY2006 Annual Report
50
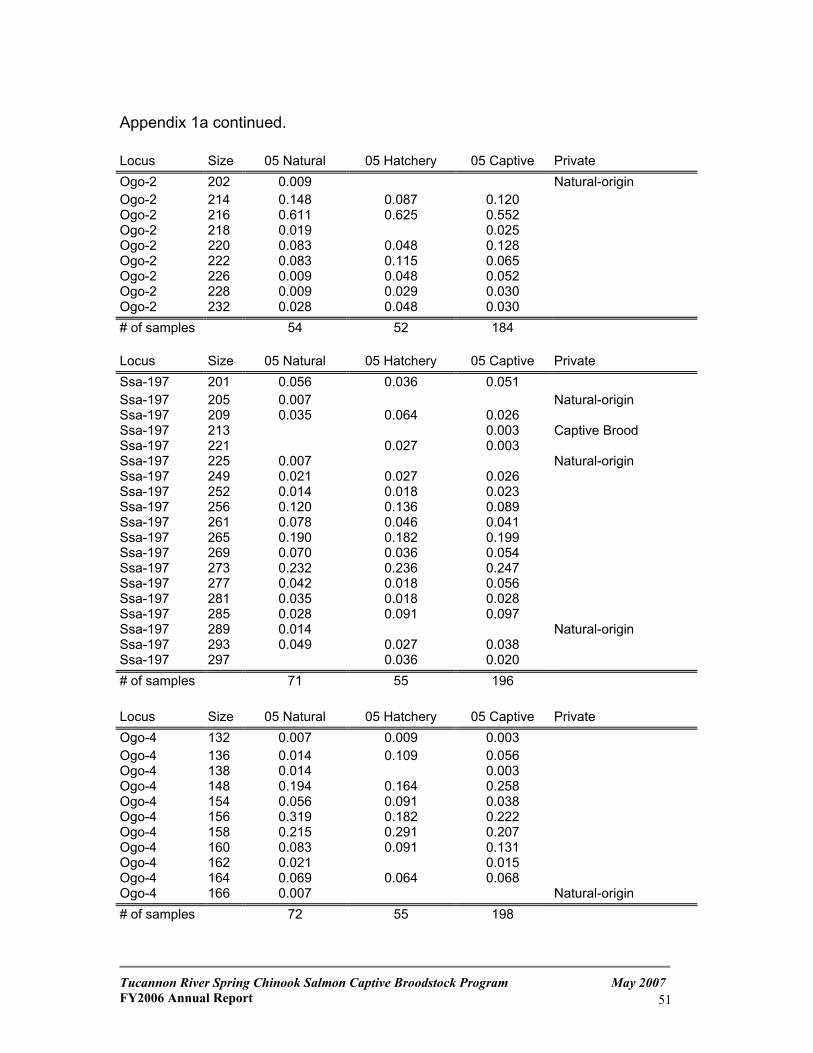
Appendix 1a continued. Locus Size 05 Natural 05 Hatchery 05 Captive Private Ogo-2 202 0.009 Natural-origin Ogo-2 214 0.148 0.087 0.120 Ogo-2 216 0.611 0.625 0.552 Ogo-2 218 0.019 0.025 Ogo-2 220 0.083 0.048 0.128 Ogo-2 222 0.083 0.115 0.065 Ogo-2 226 0.009 0.048 0.052 Ogo-2 228 0.009 0.029 0.030 Ogo-2 232 0.028 0.048 0.030 # of samples 54 52 184 Locus Size 05 Natural 05 Hatchery 05 Captive Private Ssa-197 201 0.056 0.036 0.051 Ssa-197 205 0.007 Natural-origin Ssa-197 209 0.035 0.064 0.026 Ssa-197 213 0.003 Captive Brood Ssa-197 221 0.027 0.003 Ssa-197 225 0.007 Natural-origin Ssa-197 249 0.021 0.027 0.026 Ssa-197 252 0.014 0.018 0.023 Ssa-197 256 0.120 0.136 0.089 Ssa-197 261 0.078 0.046 0.041 Ssa-197 265 0.190 0.182 0.199 Ssa-197 269 0.070 0.036 0.054 Ssa-197 273 0.232 0.236 0.247 Ssa-197 277 0.042 0.018 0.056 Ssa-197 281 0.035 0.018 0.028 Ssa-197 285 0.028 0.091 0.097 Ssa-197 289 0.014 Natural-origin Ssa-197 293 0.049 0.027 0.038 Ssa-197 297 0.036 0.020 # of samples 71 55 196 Locus Size 05 Natural 05 Hatchery 05 Captive Private Ogo-4 132 0.007 0.009 0.003 Ogo-4 136 0.014 0.109 0.056 Ogo-4 138 0.014 0.003 Ogo-4 148 0.194 0.164 0.258 Ogo-4 154 0.056 0.091 0.038 Ogo-4 156 0.319 0.182 0.222 Ogo-4 158 0.215 0.291 0.207 Ogo-4 160 0.083 0.091 0.131 Ogo-4 162 0.021 0.015 Ogo-4 164 0.069 0.064 0.068 Ogo-4 166 0.007 Natural-origin # of samples 72 55 198
Tucannon River Spring Chinook Salmon Captive Broodstock Program May 2007 FY2006 Annual Report
51
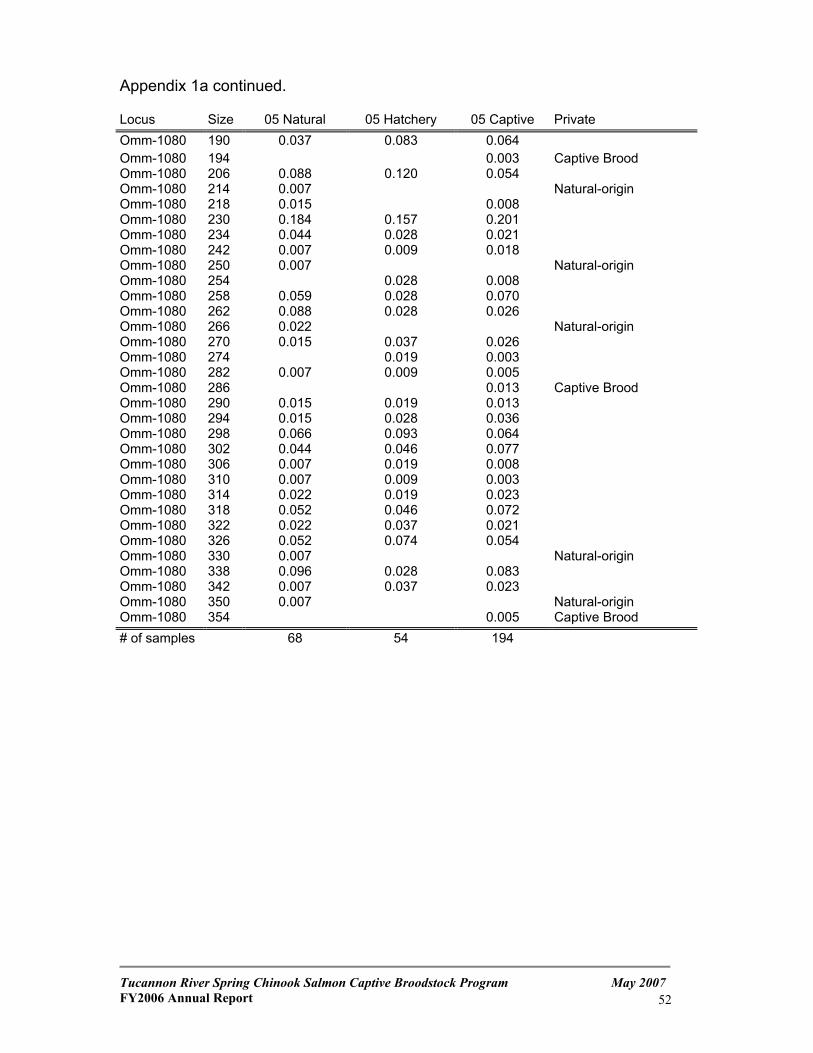
Appendix 1a continued. Locus Size 05 Natural 05 Hatchery 05 Captive Private Omm-1080 190 0.037 0.083 0.064 Omm-1080 194 0.003 Captive Brood Omm-1080 206 0.088 0.120 0.054 Omm-1080 214 0.007 Natural-origin Omm-1080 218 0.015 0.008 Omm-1080 230 0.184 0.157 0.201 Omm-1080 234 0.044 0.028 0.021 Omm-1080 242 0.007 0.009 0.018 Omm-1080 250 0.007 Natural-origin Omm-1080 254 0.028 0.008 Omm-1080 258 0.059 0.028 0.070 Omm-1080 262 0.088 0.028 0.026 Omm-1080 266 0.022 Natural-origin Omm-1080 270 0.015 0.037 0.026 Omm-1080 274 0.019 0.003 Omm-1080 282 0.007 0.009 0.005 Omm-1080 286 0.013 Captive Brood Omm-1080 290 0.015 0.019 0.013 Omm-1080 294 0.015 0.028 0.036 Omm-1080 298 0.066 0.093 0.064 Omm-1080 302 0.044 0.046 0.077 Omm-1080 306 0.007 0.019 0.008 Omm-1080 310 0.007 0.009 0.003 Omm-1080 314 0.022 0.019 0.023 Omm-1080 318 0.052 0.046 0.072 Omm-1080 322 0.022 0.037 0.021 Omm-1080 326 0.052 0.074 0.054 Omm-1080 330 0.007 Natural-origin Omm-1080 338 0.096 0.028 0.083 Omm-1080 342 0.007 0.037 0.023 Omm-1080 350 0.007 Natural-origin Omm-1080 354 0.005 Captive Brood # of samples 68 54 194
Tucannon River Spring Chinook Salmon Captive Broodstock Program May 2007 FY2006 Annual Report
52
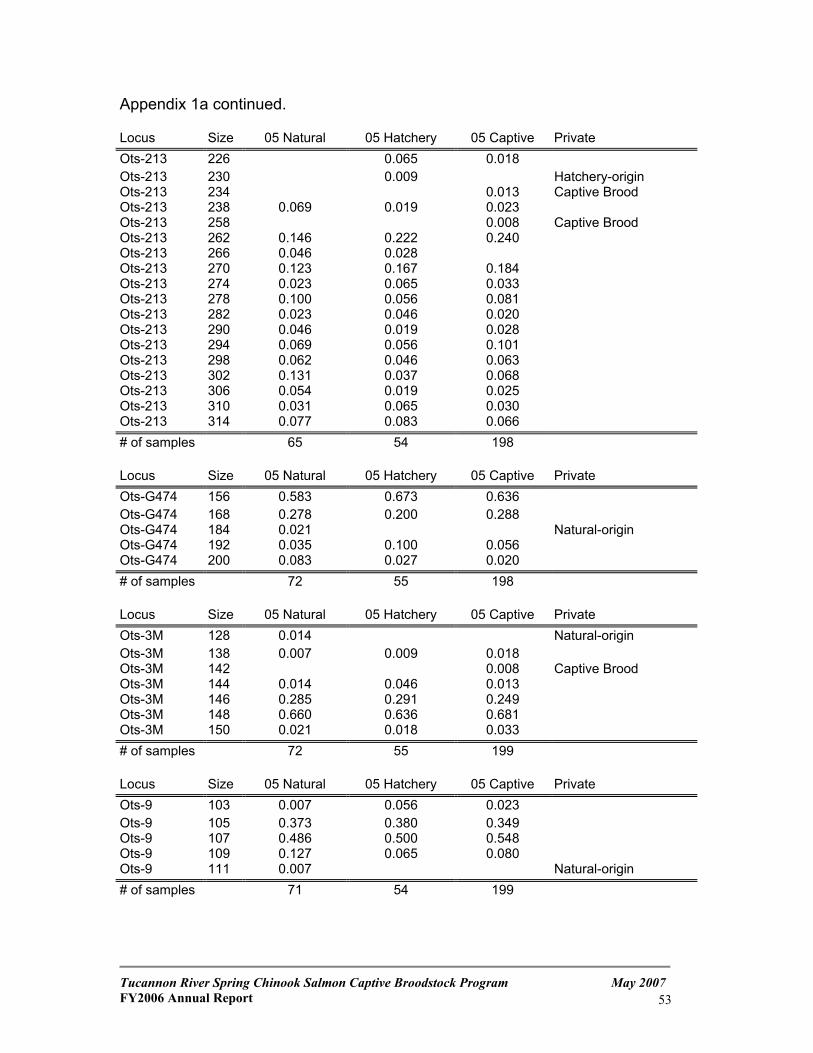
Appendix 1a continued. Locus Size 05 Natural 05 Hatchery 05 Captive Private Ots-213 226 0.065 0.018 Ots-213 230 0.009 Hatchery-origin Ots-213 234 0.013 Captive Brood Ots-213 238 0.069 0.019 0.023 Ots-213 258 0.008 Captive Brood Ots-213 262 0.146 0.222 0.240
0.065
0.023 Ots-213 290 0.028 Ots-213 294 Ots-213 298 0.062 0.063
Ots-213 310 0.065 314 0.083
54
Ots-213 266 0.046 0.028 Ots-213 270 0.123 0.167 0.184 Ots-213 274 0.023 0.033 Ots-213 278 0.100 0.056 0.081 Ots-213 282 0.046 0.020
0.046 0.019 0.069 0.056 0.101
0.046 Ots-213 302 0.131 0.037 0.068 Ots-213 306 0.054 0.019 0.025
0.031 0.030 Ots-213 0.077 0.066 # of samples 65 198 Locus Size 05 Natural 05 Hatchery Private Ots-G474 156
05 Captive 0.583 0.673 0.636
Ots-G474 168 0.278 0.200 0.288 Ots-G474 184
0.035 0.056 200 0.020
0.021 Natural-origin Ots-G474 192 0.100 Ots-G474 0.083 0.027 # of samples 72 55 198
Size 05 Hatchery 05 Captive Private
Ots-3M 128 Natural-origin Ots-3M 138 0.007 0.009 0.018 Ots-3M 142 0.008 Captive Brood Ots-3M 144 0.014 0.046 0.013 Ots-3M 146 0.285 0.291 0.249 Ots-3M 148 0.660 0.636 0.681 Ots-3M 150 0.021 0.018 0.033 # of samples 72 55 199 Locus Size 05 Natural 05 Hatchery 05 Captive Private Ots-9 103 0.007 0.056 0.023 Ots-9 105 0.373 0.380 0.349 Ots-9 107 0.486 0.500 0.548 Ots-9 109 0.127 0.065 0.080 Ots-9 111 0.007 Natural-origin # of samples 71 54 199
Locus 05 Natural
0.014
Tucannon River Spring Chinook Salmon Captive Broodstock Program May 2007 FY2006 Annual Report
53
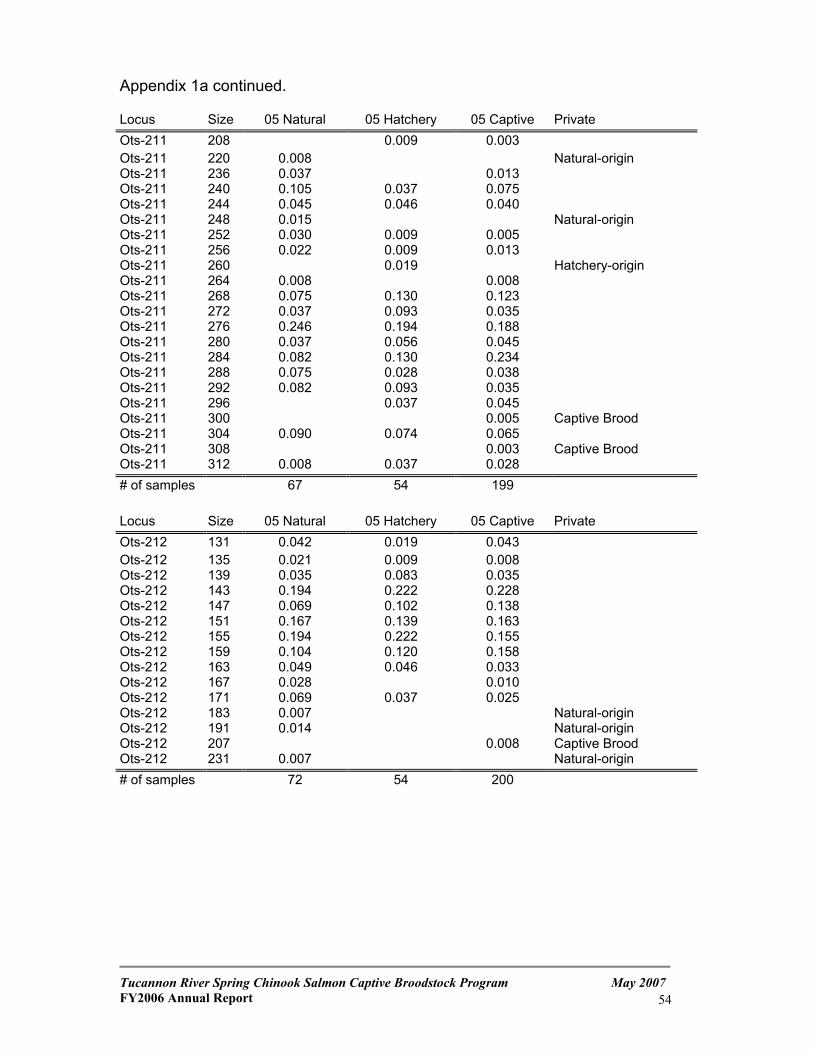
Appendix 1a continued. Locus Size 05 Natural 05 Hatchery 05 Captive Private Ots-211 208 0.009 0.003 Ots-211 220 0.008 Natural-origin Ots-211 236 0.037 0.013 Ots-211 240 0.105 0.037 0.075 Ots-211 244 0.045 0.046 0.040 Ots-211 248 0.015 Natural-origin Ots-211 252 0.030 0.009 0.005 Ots-211 256 0.022 0.009 0.013 Ots-211 260 0.019 Hatchery-origin Ots-211 264 0.008 0.008 Ots-211 268 0.075 0.130 0.123 Ots-211 272 0.037 0.093 0.035 Ots-211 276 0.246 0.194 0.188 Ots-211 280 0.037
Ots-211 288
0.056 0.045 Ots-211 284 0.082 0.130 0.234
0.075 0.028 0.038 Ots-211 292 0.082 0.093 0.035 Ots-211 296 0.037 0.045 Ots-211 300 0.005 Captive Brood Ots-211 304 0.090 0.074 0.065 Ots-211 308 0.003 Captive Brood Ots-211 312 0.008 0.037 0.028 # of samples 67 54 199 Locus Size 05 Natural 05 Hatchery 05 Captive Private Ots-212 131 0.042 0.019 0.043 Ots-212 135 0.021 0.009 0.008 Ots-212 139 0.035 0.083 0.035 Ots-212 143 0.194 0.222 0.228 Ots-212 147 0.069 0.102 0.138 Ots-212 151 0.167 0.139 0.163 Ots-212 155 0.194 0.222 0.155 Ots-212 159 0.104 0.120 0.158 Ots-212 163 0.049 0.046 0.033 Ots-212 167 0.028 0.010 Ots-212 171 0.069 0.037 0.025 Ots-212 183 0.007 Natural-origin Ots-212 191 0.014 Natural-origin Ots-212 207 0.008 Captive Brood Ots-212 231 0.007 Natural-origin # of samples 72 54 200
Tucannon River Spring Chinook Salmon Captive Broodstock Program May 2007 FY2006 Annual Report
54
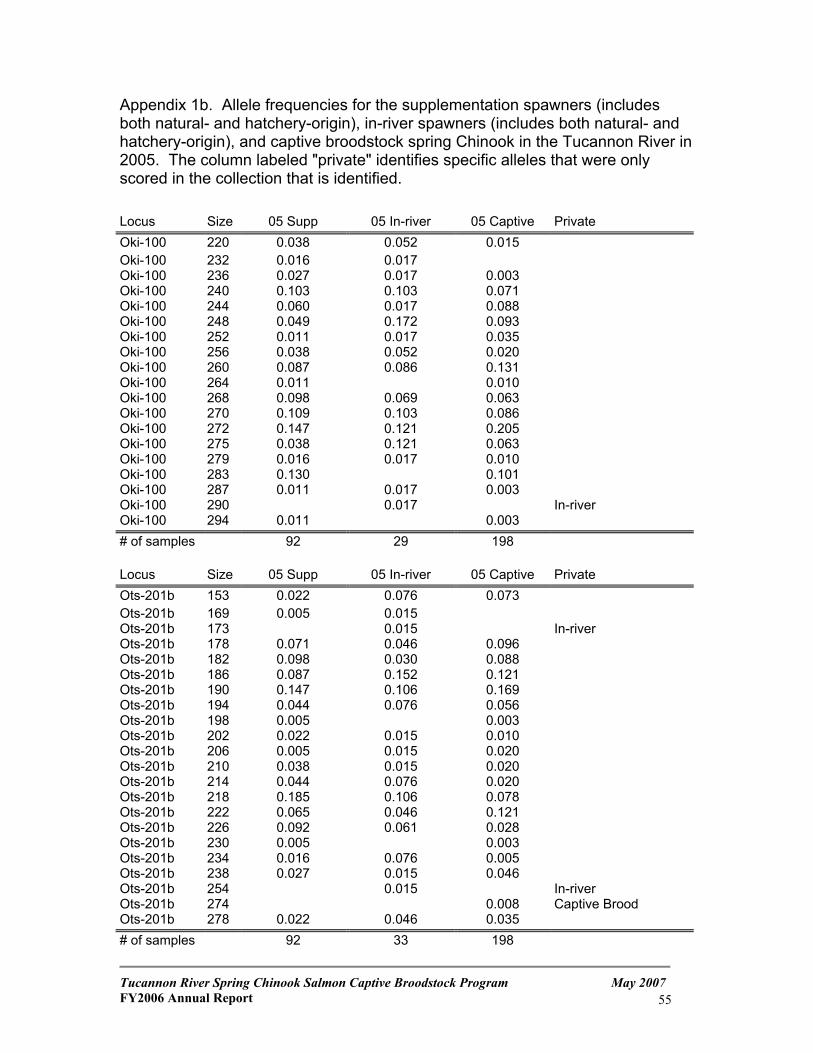
Appendix 1b. Allele frequencies for the supplementation spawners (includes both natural- and hatchery-origin), in-river spawners (includes both natural- and hatchery-origin), and captive broodstock spring Chinook in the Tucannon River in 2005. The column labeled "private" identifies specific alleles that were only scored in the collection that is identified. Locus Size 05 Supp 05 In-river 05 Captive Private Oki-100 220 0.038 0.052 0.015 Oki-100 232 0.016 0.017 Oki-100 236 0.027 0.017 0.003 Oki-100 240 0.103 0.103 0.071
244 0.060 0.088 Oki-100 248 0.049 Oki-100 252
Oki-100 0.017
0.172 0.093 0.011 0.017 0.035
Oki-100 256 0.038 0.052 0.020 Oki-100 260 0.087 0.086 0.131 Oki-100 264 0.011 0.010 Oki-100 268 0.098 0.069 0.063 Oki-100 270 0.109 0.103 0.086 Oki-100 272 0.147 0.121 0.205 Oki-100 275 0.038 0.121 0.063 Oki-100 279 0.016 0.017 0.010 Oki-100 283 0.130 0.101 Oki-100 287 0.011 0.017 0.003 Oki-100 290 0.017 In-river Oki-100 294 0.011 0.003 # of samples 92 29 198 Locus Size 05 Supp 05 In-river 05 Captive Private Ots-201b 153 0.022 0.076 0.073 Ots-201b 169 0.005 0.015 Ots-201b 173 0.015 In-river Ots-201b 178 0.071 0.046 0.096 Ots-201b 182 0.098 0.030 0.088 Ots-201b 186 0.087 0.152 0.121 Ots-201b 190 0.147 0.106 0.169 Ots-201b 194 0.044 0.076 0.056 Ots-201b 198 0.005 0.003 Ots-201b 202 0.022 0.015 0.010 Ots-201b 206 0.005 0.015 0.020 Ots-201b 210 0.038 0.015 0.020 Ots-201b 214 0.044 0.076 0.020 Ots-201b 218 0.185 0.106 0.078 Ots-201b 222 0.065 0.046 0.121 Ots-201b 226 0.092 0.061 0.028 Ots-201b 230 0.005 0.003 Ots-201b 234 0.016 0.076 0.005 Ots-201b 238 0.015
254 0.015 In-river Ots-201b 274 0.008
0.027 0.046 Ots-201b
Captive Brood Ots-201b 278 0.022 0.046 0.035 # of samples 92 33 198
Tucannon River Spring Chinook Salmon Captive Broodstock Program May 2007 FY2006 Annual Report
55
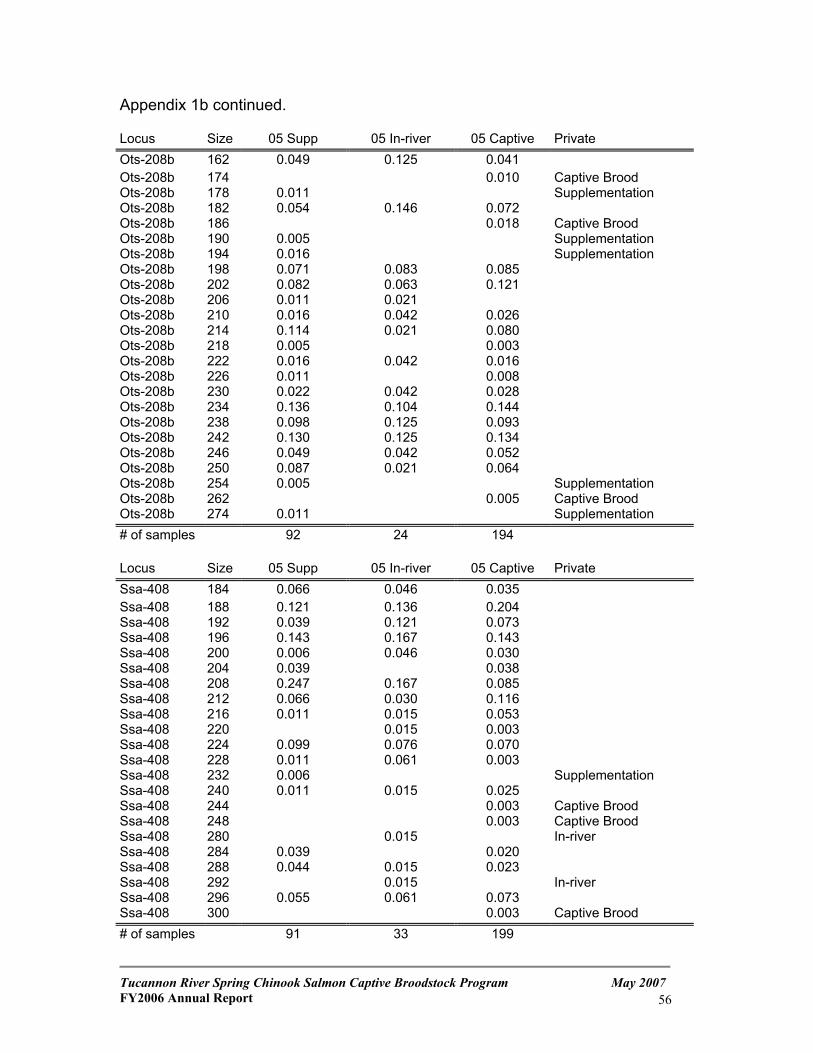
Appendix 1b continued. Locus Size
0.125 05 Supp 05 In-river 05 Captive Private
Ots-208b 162 0.049 0.041 Ots-208b 174 0.010 Captive Brood Ots-208b 178 0.011 Supplementation Ots-208b 182 0.054 0.146 0.072 Ots-208b 186 0.018 Captive Brood Ots-208b 190 0.005
202
Ots-208b 218
238 0.125
Supplementation Ots-208b 194 0.016 Supplementation Ots-208b 198 0.071 0.083 0.085 Ots-208b 0.082 0.063 0.121 Ots-208b 206 0.011 0.021 Ots-208b 210 0.016 0.042 0.026 Ots-208b 214 0.114 0.021 0.080
0.005 0.003 Ots-208b 222 0.016 0.042 0.016 Ots-208b 226 0.011 0.008 Ots-208b 230 0.022 0.042 0.028 Ots-208b 234 0.136 0.104 0.144 Ots-208b 0.098 0.125 0.093 Ots-208b 242 0.130 0.134 Ots-208b 246 0.049 0.042 0.052 Ots-208b 250 0.087 0.021 0.064 Ots-208b 254 0.005 Supplementation Ots-208b 262 0.005 Captive Brood Ots-208b 274 0.011 Supplementation # of samples 92 24 194 Locus Size 05 Supp 05 In-river 05 Captive Private Ssa-408 184 0.066 0.046 0.035 Ssa-408 188 0.121 0.136 0.204
Ssa-408 196 0.006
0.038
216 0.015
0.003
0.015
Ssa-408 192 0.039 0.121 0.073 0.143 0.167 0.143
Ssa-408 200 0.046 0.030 Ssa-408 204 0.039 Ssa-408 208 0.247 0.167 0.085 Ssa-408 212 0.066 0.030 0.116 Ssa-408 0.011 0.015 0.053 Ssa-408 220 0.003 Ssa-408 224 0.099 0.076 0.070 Ssa-408 228 0.011 0.061 0.003 Ssa-408 232 0.006 Supplementation Ssa-408 240 0.011 0.015 0.025 Ssa-408 244 Captive Brood Ssa-408 248 0.003 Captive Brood Ssa-408 280 0.015 In-river Ssa-408 284 0.039 0.020 Ssa-408 288 0.044 0.023 Ssa-408 292 0.015 In-river Ssa-408 296 0.055 0.061 0.073 Ssa-408 300 0.003 Captive Brood # of samples 91 33 199
Tucannon River Spring Chinook Salmon Captive Broodstock Program May 2007 FY2006 Annual Report
56
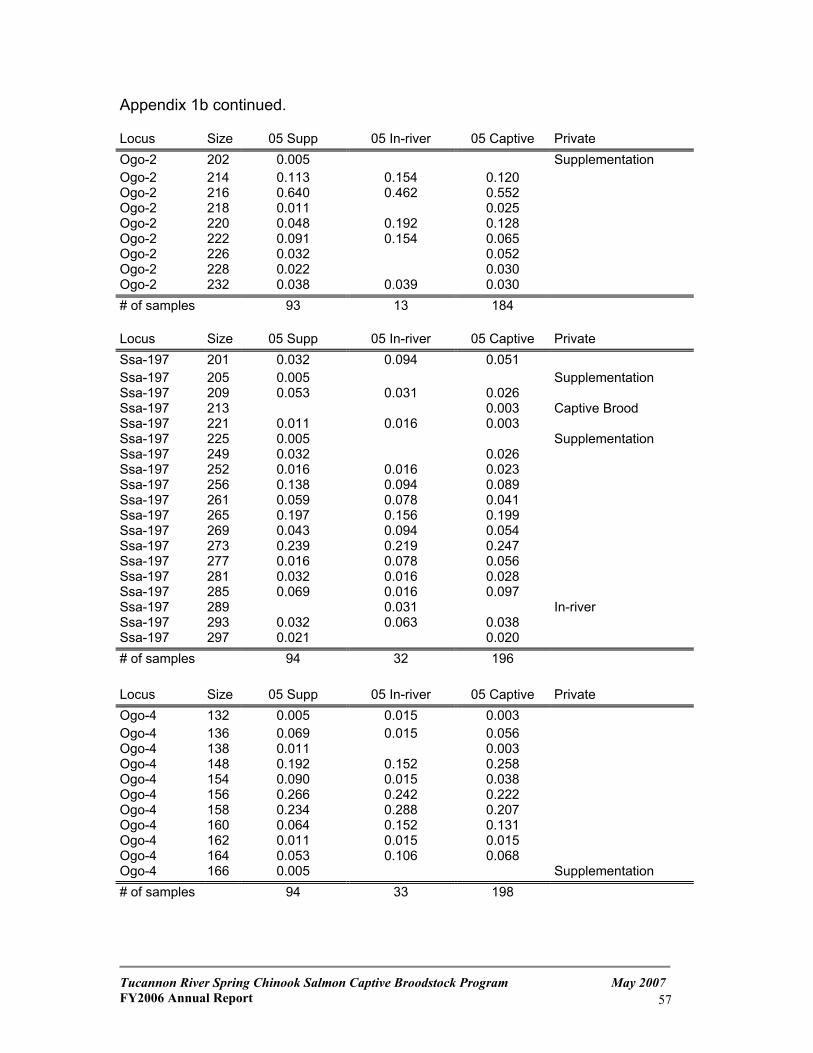
Appendix 1b continued.
05 Captive
Locus Size 05 Supp 05 In-river Private Ogo-2 202 0.005 Supplementation Ogo-2 214 0.113 0.154 0.120 Ogo-2 216 0.640 0.462 0.552 Ogo-2 218 0.011 0.025 Ogo-2 220 0.048 0.192 0.128 Ogo-2
226 0.022
222 0.091 0.154 0.065 Ogo-2 0.032 0.052 Ogo-2 228 0.030 Ogo-2 232 0.038 0.039 0.030 # of samples 93 13 184 Locus Size 05 Supp 05 In-river 05 Captive Private Ssa-197 201 0.032 0.094 0.051 Ssa-197 205 0.005 Supplementation Ssa-197 209 0.053 0.031 0.026 Ssa-197 213
252
0.239 0.056
Ssa-197 289 0.063
0.003 Captive Brood Ssa-197 221 0.011 0.016 0.003 Ssa-197 225 0.005 Supplementation Ssa-197 249 0.032 0.026 Ssa-197 0.016 0.016 0.023 Ssa-197 256 0.138 0.094 0.089 Ssa-197 261 0.059 0.078 0.041 Ssa-197 265 0.197 0.156 0.199 Ssa-197 269 0.043 0.094 0.054 Ssa-197 273 0.219 0.247 Ssa-197 277 0.016 0.078 Ssa-197 281 0.032 0.016 0.028 Ssa-197 285 0.069 0.016 0.097
0.031 In-river Ssa-197 293 0.032 0.038 Ssa-197 297 0.021 0.020 # of samples 94 32 196
Locus Size 05 Supp 05 In-river 05 Captive Private Ogo-4 132 0.005 0.015 Ogo-4 136 0.069 0.015 0.056 Ogo-4 138 0.011 0.003 Ogo-4 148 0.192 0.152 0.258 Ogo-4 154 0.090 0.015
Ogo-4
0.038 Ogo-4 156 0.266 0.242 0.222 Ogo-4 158 0.234 0.288 0.207
160 0.064 0.152 0.131 Ogo-4 162 0.011 0.015 0.015 Ogo-4 Ogo-4 # of samples
0.003
164 0.053 0.106 0.068 166 0.005 Supplementation 94 33 198
Tucannon River Spring Chinook Salmon Captive Broodstock Program May 2007 FY2006 Annual Report
57
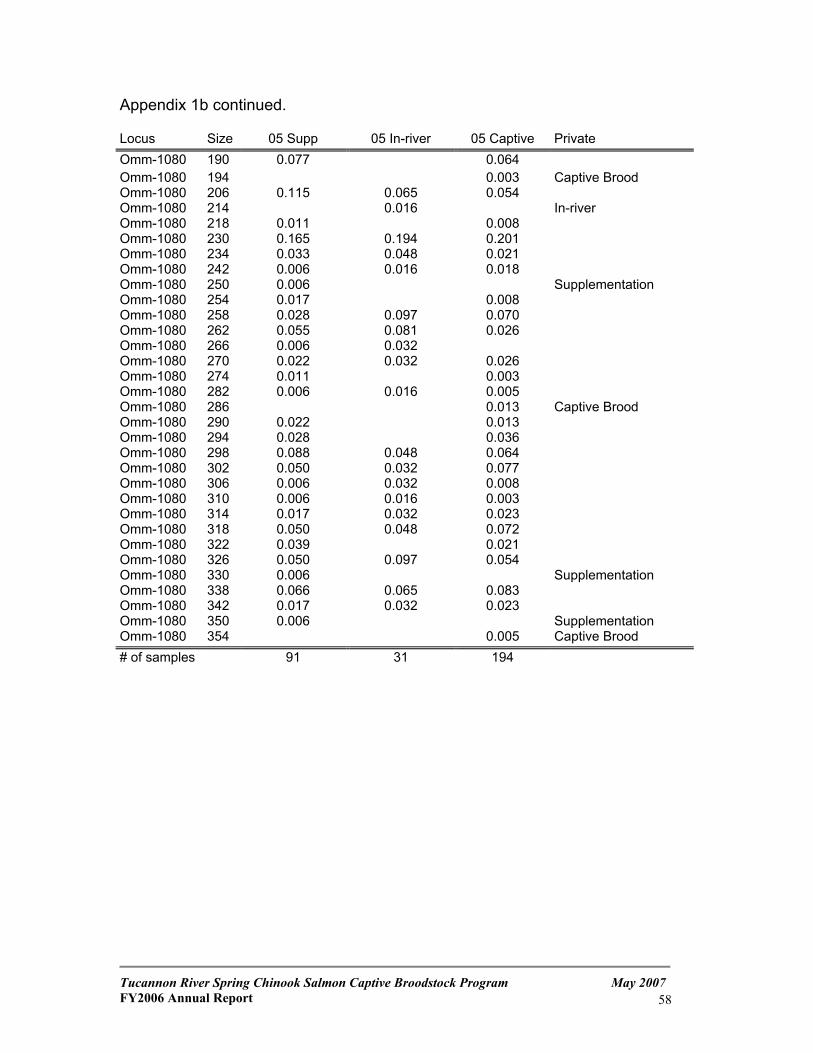
Appendix 1b continued. Locus Size 05 Supp 05 In-river 05 Captive Private Omm-1080 190 0.077 0.064 Omm-1080 194
218
258
0.011
Omm-1080 298 0.050 0.006
0.050
Omm-1080 326
0.006
31 194
0.003 Captive Brood Omm-1080 206 0.115 0.065 0.054 Omm-1080 214 0.016 In-river Omm-1080 0.011 0.008 Omm-1080 230 0.165 0.194 0.201 Omm-1080 234 0.033 0.048 0.021 Omm-1080 242 0.006 0.016 0.018 Omm-1080 250 0.006 Supplementation Omm-1080 254 0.017 0.008 Omm-1080 0.028 0.097 0.070 Omm-1080 262 0.055 0.081 0.026 Omm-1080 266 0.006 0.032 Omm-1080 270 0.022 0.032 0.026 Omm-1080 274 0.003 Omm-1080 282 0.006 0.016 0.005 Omm-1080 286 0.013 Captive Brood Omm-1080 290 0.022 0.013 Omm-1080 294 0.028 0.036
0.088 0.048 0.064 Omm-1080 302 0.032 0.077 Omm-1080 306 0.032 0.008 Omm-1080 310 0.006 0.016 0.003 Omm-1080 314 0.017 0.032 0.023 Omm-1080 318 0.048 0.072 Omm-1080 322 0.039 0.021
0.050 0.097 0.054 Omm-1080 330 0.006 Supplementation Omm-1080 338 0.066 0.065 0.083 Omm-1080 342 0.017 0.032 0.023 Omm-1080 350 Supplementation Omm-1080 354 0.005 Captive Brood # of samples 91
Tucannon River Spring Chinook Salmon Captive Broodstock Program May 2007 FY2006 Annual Report
58
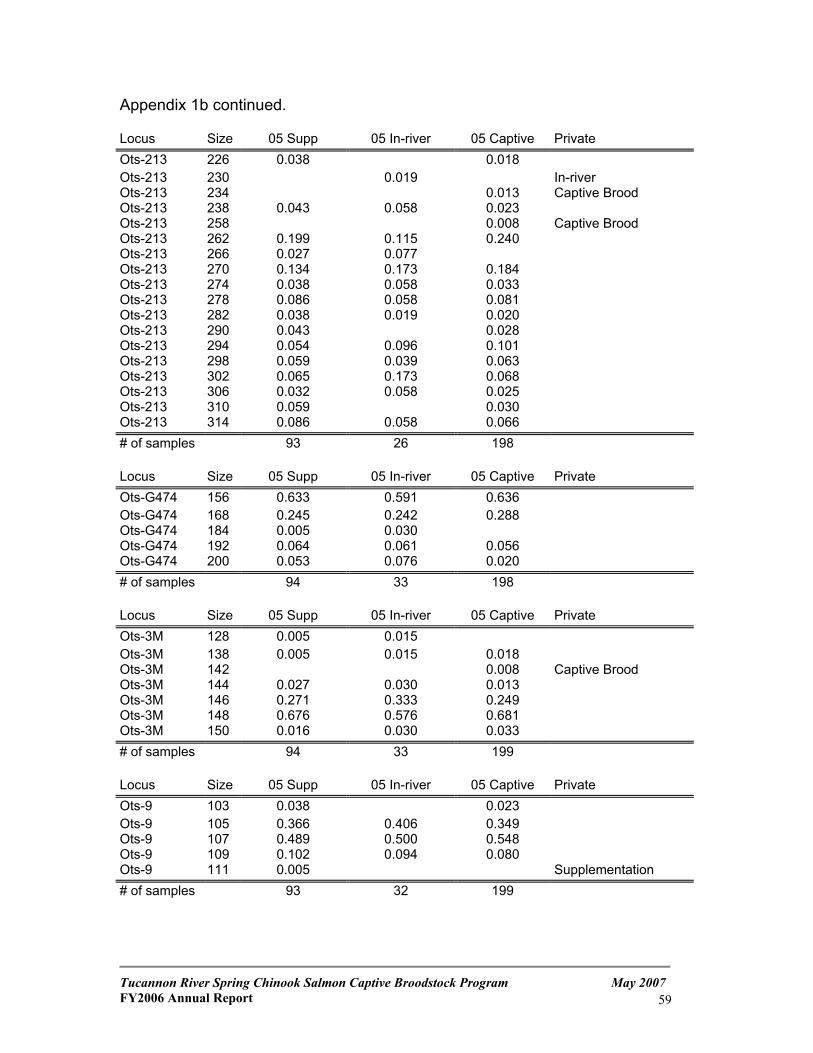
Appendix 1b continued.
05 In-river 0.038
Locus Size 05 Supp 05 Captive Private Ots-213 226 0.018 Ots-213 230
0.043 0.058
0.173 Ots-213 274
0.059 0.065
0.058
0.019 In-river Ots-213 234 0.013 Captive Brood Ots-213 238 0.023 Ots-213 258 0.008 Captive Brood Ots-213 262 0.199 0.115 0.240 Ots-213 266 0.027 0.077 Ots-213 270 0.134 0.184
0.038 0.058 0.033 Ots-213 278 0.086 0.058 0.081 Ots-213 282 0.038 0.019 0.020 Ots-213 290 0.043 0.028 Ots-213 294 0.054 0.096 0.101 Ots-213 298 0.039 0.063 Ots-213 302 0.173 0.068 Ots-213 306 0.032 0.025 Ots-213 310 0.059 0.030 Ots-213 314 0.086 0.058 0.066 # of samples 93 26 198 Locus Size 05 Supp 05 In-river 05 Captive Private Ots-G474 156 0.633 0.591 0.636 Ots-G474 168 0.245 0.242 0.288 Ots-G474 184 0.005 0.030 Ots-G474 192 0.064 0.061 0.056 Ots-G474 200 0.053 0.076 0.020 # of samples 94 33 198 Locus Size 05 Supp 05 In-river 05 Captive Private Ots-3M 128 0.005 0.015 Ots-3M 138 0.005 0.015 0.018 Ots-3M 142
0.027 0.030 0.008 Captive Brood
Ots-3M 144 0.013 Ots-3M 146 0.271 0.333 0.249 Ots-3M 148 0.676 0.576 0.681 Ots-3M 150 0.016 0.030 0.033 # of samples 94 33 199 Locus Size 05 Supp 05 In-river 05 Captive Private Ots-9 103 0.038 0.023 Ots-9 105 0.366 0.406 0.349 Ots-9 107 0.489 0.500 0.548 Ots-9 109 0.102 0.094 0.080 Ots-9 111 0.005 Supplementation # of samples 93 32 199
Tucannon River Spring Chinook Salmon Captive Broodstock Program May 2007 FY2006 Annual Report
59
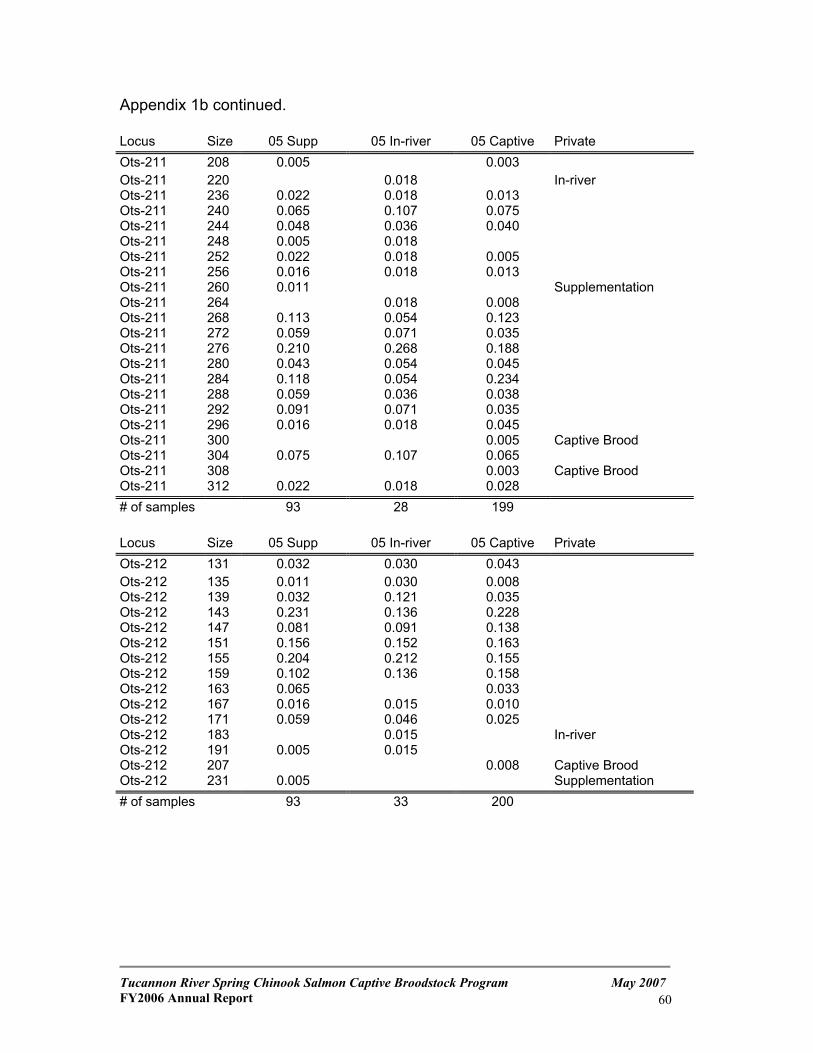
Appendix 1b continued. Locus Size 05 Supp 05 In-river 05 Captive Private Ots-211 208 0.005 0.003 Ots-211 220 0.018 In-river Ots-211 236 Ots-211 240
Ots-211 252
Ots-211 296 300 304
Ots-211 308
0.022 0.018 0.013 0.065 0.107 0.075
Ots-211 244 0.048 0.036 0.040 Ots-211 248 0.005 0.018
0.022 0.018 0.005 Ots-211 256 0.016 0.018 0.013 Ots-211 260 0.011 Supplementation Ots-211 264 0.018 0.008 Ots-211 268 0.113 0.054 0.123 Ots-211 272 0.059 0.071 0.035 Ots-211 276 0.210 0.268 0.188 Ots-211 280 0.043 0.054 0.045 Ots-211 284 0.118 0.054 0.234 Ots-211 288 0.059 0.036 0.038 Ots-211 292 0.091 0.071 0.035
0.016 0.018 0.045 Ots-211 0.005 Captive Brood Ots-211 0.075 0.107 0.065
0.003 Captive Brood Ots-211 312 0.022 0.018 0.028 # of samples 93 28 199 Locus Ots-212 131
Size 05 Supp 05 In-river 05 Captive Private
0.032 0.030 0.043 Ots-212 135 0.011 0.030 0.008 Ots-212 139 0.032 0.121 0.035 Ots-212 143 0.231 0.136 0.228 Ots-212 147 0.081 0.091 0.138 Ots-212 151 0.156 0.152 0.163 Ots-212 155 0.204
In-river
Captive Brood
0.212 0.155 Ots-212 159 0.102 0.136 0.158 Ots-212 163 0.065 0.033 Ots-212 167 0.016 0.015 0.010 Ots-212 171 0.059 0.046 0.025 Ots-212 183 0.015 Ots-212 191 0.005 0.015 Ots-212 207 0.008 Ots-212 231 0.005 Supplementation # of samples 93 33 200
Tucannon River Spring Chinook Salmon Captive Broodstock Program May 2007 FY2006 Annual Report
60
Office of External Programs
Arlington, VA 22203
This program receives Federal financial assistance from the U.S. Fish and Wildlife Service Title VI of the Civil Rights Act of 1964, Section 504 of
the Rehabilitation Act of 1973, Title II of the Americans with Disabilities Act of 1990, the Age Discrimination Act of 1975, and Title IX of the Education Amendments of 1972. The U.S. Department of the Interior and its bureaus prohibit discrimination on the bases of race, color, national origin, age, disability and sex (in educational
programs). If you believe that you have been discriminated against in any program, activity or facility, please write to:
U.S. Fish and Wildlife Service
4040 N. Fairfax Drive, Suite 130