Embed Size (px)
Citation preview
Tufts University
Cummings School of Veterinary Medicine
Wind Turbine Feasibility Study
Power Engineers, LLC
Boreal Renewable Energy Development
Saratoga Associates
June 2010

Cummings School Wind Turbine Feasibility Study June 2010
Page 3 of 73
Cummings School Wind Turbine Feasibility Study June 2010
Table of Contents
0 Executive Summary .................................................................................................... 5 1 Site Evaluation ............................................................................................................ 9
1.1 Background ......................................................................................................... 9 1.2 Geography ........................................................................................................... 9
1.2.1 Campus ............................................................................................... 9 1.2.2 Vicinity ............................................................................................. 10 1.2.3 Potential Site Constraints .................................................................. 11 1.2.4 Turbine Siting ................................................................................... 13 1.2.5 Photo Simulation ............................................................................... 15
1.3 Wind Resource Assessment .............................................................................. 28 1.3.1 Data Acquisition ............................................................................... 28 1.3.2 Wind Direction Assessment .............................................................. 28 1.3.3 Wind Speed Assessment ................................................................... 30
1.4 Engineering and Interconnection ...................................................................... 34 1.4.1 Energy Infrastructure & Consumption .............................................. 34 1.4.2 From Wind to Electricity .................................................................. 35 1.4.3 Staging / Erection/Construction ........................................................ 37 1.4.4 Electrical Engineering and Interconnection Requirements ............... 37
1.5 Permitting .......................................................................................................... 43 1.5.1 Town of Grafton ............................................................................... 43 1.5.2 Town of Westborough ...................................................................... 45 1.5.3 Local Permitting Recommendation .................................................. 46 1.5.4 State and Federal Permitting ............................................................. 46
2 Economic Feasibility Analysis ................................................................................. 51 2.1 Costs for Major Scenarios ................................................................................. 51
2.1.1 Capital Costs ..................................................................................... 51 2.1.2 Operating Costs ................................................................................. 53
2.2 Benefits of Electricity Production ..................................................................... 54 2.2.1 Benefits of Avoiding Utility Bill Charges ........................................ 54 2.2.2 Value of Net Metered Electricity ...................................................... 56 2.2.3 Protection from Volatile Electric Rates ............................................ 58 2.2.4 Renewable Energy Certificate Revenue ........................................... 59
2.3 Analyze Financing / Ownership Options .......................................................... 61 2.4 Grants ................................................................................................................ 61
2.4.1 MRET Grants .................................................................................... 61 2.5 Analyze Project Financials ............................................................................... 62
2.5.1 Methodology ..................................................................................... 62 2.5.2 Define Major Scenarios and Variants ............................................... 63 2.5.3 Financial Results ............................................................................... 64 2.5.4 Third Party Ownership ...................................................................... 66
2.6 Sensitivity Analysis .......................................................................................... 68 2.6.1 Wind Speed ....................................................................................... 68 2.6.2 Project Cost ....................................................................................... 69
Page 4 of 73
Cummings School Wind Turbine Feasibility Study June 2010
2.7 Conclusions ....................................................................................................... 70 2.7.1 Next Steps ......................................................................................... 70
A. Campus Map ............................................................................................................. 71 B. Electrical One Line Diagram .................................................................................... 72 C. Electrical Site Plan .................................................................................................... 73
Page 5 of 73
Cummings School Wind Turbine Feasibility Study
April 2010
0 Executive Summary
This study analyzes the feasibility of installing a single utility scale wind turbine at the
Tufts University Cummings School of Veterinary Medicine (hereafter referred to as
Cummings School). The results of the investigation determined that wind energy can
provide the Cummings School with noteworthy economic and environmental benefits to
their operations.
Significant findings regarding the project’s feasibility are listed below:
Site Layout
The 594 acre site is located in a thinly populated semi-rural area, and appears to
have sufficient buffer to site a wind turbine.
The Cummings School property falls in both the towns of Grafton and
Westborough. The primary turbine site would be located in Grafton.
There is sufficient space for turbine laydown and erection, though some tree
removal may be necessary depending on location. Property line and fall zone
issues will require civil engineering review before a final turbine location is
determined.
Wind Resources
Three months of wind resource data were logged by a Triton Sonic Wind Profiler
manufactured by Second Wind Inc.
For the August 5, 2009 through November 19, 2009 time period, wind speeds at
the Tufts Triton averaged 5.16 meters/second (m/s) at 80m.
o These wind data were leveraged to the Cummings School site through
the utilization of long-term weather station data from the Worcester
Regional Airport. Being 10 miles away from the Cummings School,
Worcester data offer an acceptable, however imperfect, correlation for
long-term forecasting.
o The estimated long-term average wind speed at 60m is 6.25 m/s. This is
0.25 m/s faster than predicted by publicly-available meso-scale wind
maps.
Page 6 of 73
Cummings School Wind Turbine Feasibility Study
April 2010
Environmental Resource Assessment
Sensitive habitat exists within the vicinity of the Tufts project. Because the
turbine is not within the habitat, such a designation should not cause major
issues to the project. Further communication with state and federal wildlife
officials is suggested.
State GIS resources indicate a small stream near the primary turbine location.
Further wetland research is warranted.
Tufts must engage relevant regulatory officers and stakeholders to address the
permitting issues that would permit installation of a wind turbine of the
recommended size.
Engineering and Interconnection Requirements
A standard spread foundation design will most likely be feasible. Further
subsurface exploration will be required to finalize the design of the foundation.
Electrical interconnection plans were developed for a turbine up to 1.5 MW
(1,500kW), although the interconnection would be similar for all turbines in the
range of 100-1500kW.
The final configuration of the wind turbine generator interconnection facilities will
be determined on the basis of the National Grid generator interconnection
application and system impact study process.
Permitting
The Town of Grafton currently has a 70 foot (21.3 meter) limit on wind turbine
height
o All turbines analyzed in this study far exceed this limit, as acceptable wind
speeds will occur in the 50-80 meter range.
o A special permit from the Town will be required if the turbine is to comply
with local regulations.
The Town of Westborough does not explicitly mention wind turbines in its bylaws
Wetlands and wildlife issues need to be further addressed at the state and/or
federal level.
Page 7 of 73
Cummings School Wind Turbine Feasibility Study
April 2010
All other applicable state and federal permits are expected to be obtainable for
the project.
Economic Feasibility Analysis
The Cummings School consumes approximately 8,400,000 kWh / year, and
spent roughly $1,000,000 between September 2007 and September 2008 on the
kWh portion of their electric bill.
Recent State net metering legislation is being put into place that will allow excess
turbine generation to be credited to the Cummings School account even if it is
not used simultaneously onsite
We recommend the installation of a 1.5 MW turbine. Based on estimated cost
figures, the Fuhrländer FL 1500 turbine demonstrates the best economic
payback of the turbines in this range.
A FL 1500 turbine would produce an estimated 3,100,000 kWh per year (a 23.5%
net capacity factor).
The estimated installed project cost of a Fuhrländer FL 1500 is $4,400,000.
It is estimated that the installation of a Fuhrländer FL 1500 will have a net
present value of 2,500,000 over the 20 year project life with the installation
becoming cash flow positive in 10.5 years.
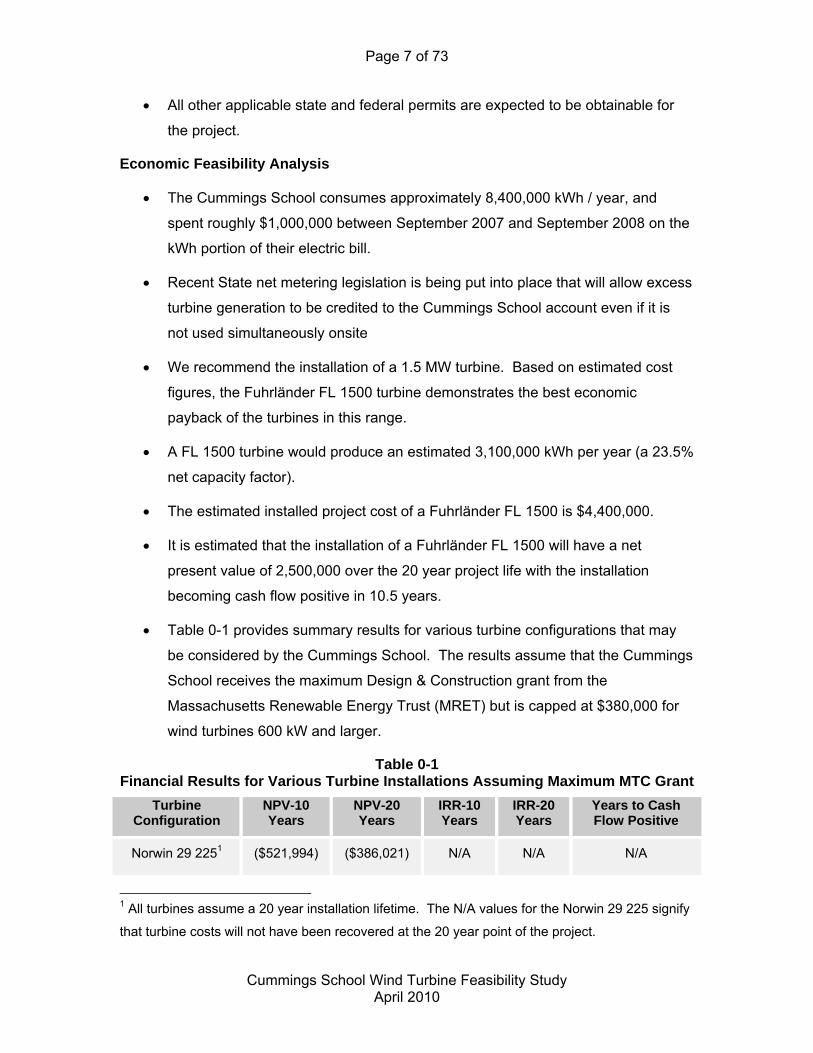
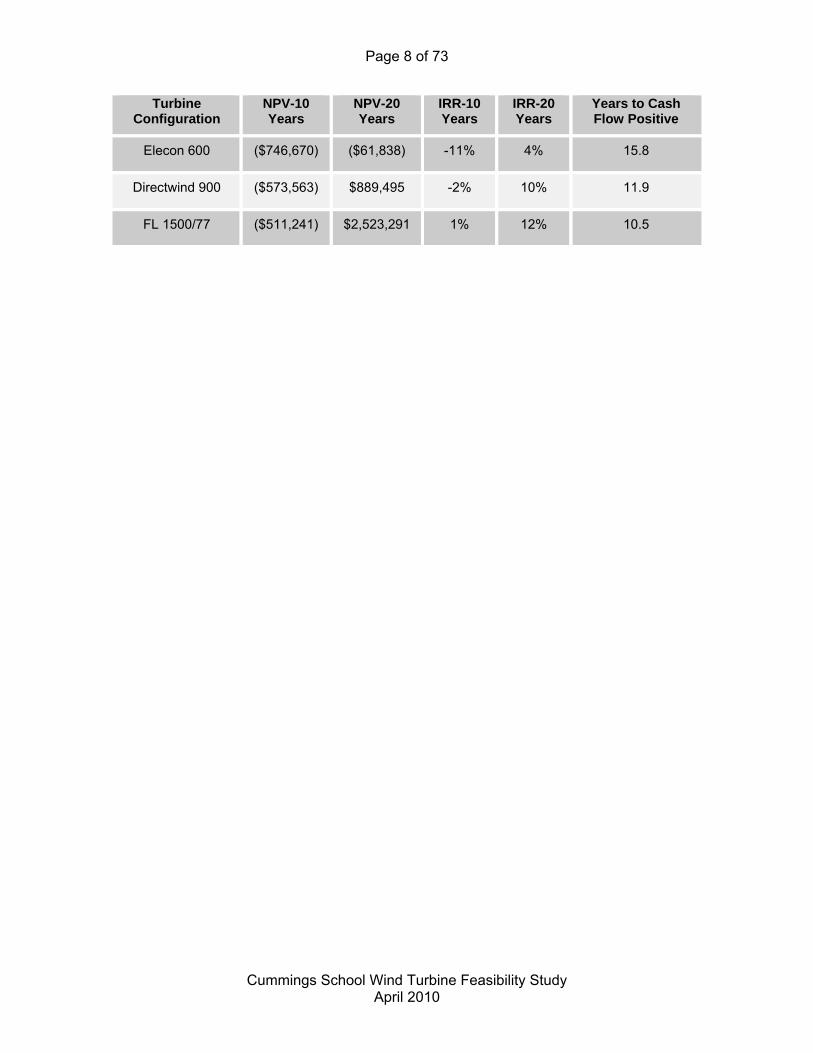
Table 0-1 provides summary results for various turbine configurations that may
be considered by the Cummings School. The results assume that the Cummings
School receives the maximum Design & Construction grant from the
Massachusetts Renewable Energy Trust (MRET) but is capped at $380,000 for
wind turbines 600 kW and larger.
Table 0-1 Financial Results for Various Turbine Installations Assuming Maximum MTC Grant
Turbine Configuration
NPV-10 Years
NPV-20 Years
IRR-10 Years
IRR-20 Years
Years to Cash Flow Positive
Norwin 29 2251 ($521,994) ($386,021) N/A N/A N/A
1 All turbines assume a 20 year installation lifetime. The N/A values for the Norwin 29 225 signify
that turbine costs will not have been recovered at the 20 year point of the project.
Page 8 of 73
Cummings School Wind Turbine Feasibility Study
April 2010
Turbine Configuration
NPV-10 Years
NPV-20 Years
IRR-10 Years
IRR-20 Years
Years to Cash Flow Positive
Elecon 600 ($746,670) ($61,838) -11% 4% 15.8
Directwind 900 ($573,563) $889,495 -2% 10% 11.9
FL 1500/77 ($511,241) $2,523,291 1% 12% 10.5
Page 9 of 73
Cummings School Wind Turbine Feasibility Study
April 2010
1 Site Evaluation
1.1 Background
The Cummings School of Veterinary Medicine is one of eight schools that make up Tufts
University. In addition to a handful of collaborative and multidisciplinary degrees, the
school is the only institution in New England to offer a Doctorate in Veterinary Medicine.
The Cummings School is located in the towns of Grafton and Westborough, MA on a
campus that is comprised of approximately 594 acres. It has a student population of 340
and includes a large and small animal hospital, as well as research facilities,
administrative buildings, and livestock and food operations. The hospitals treat over
28,000 animals annually.
1.2 Geography
1.2.1 Campus
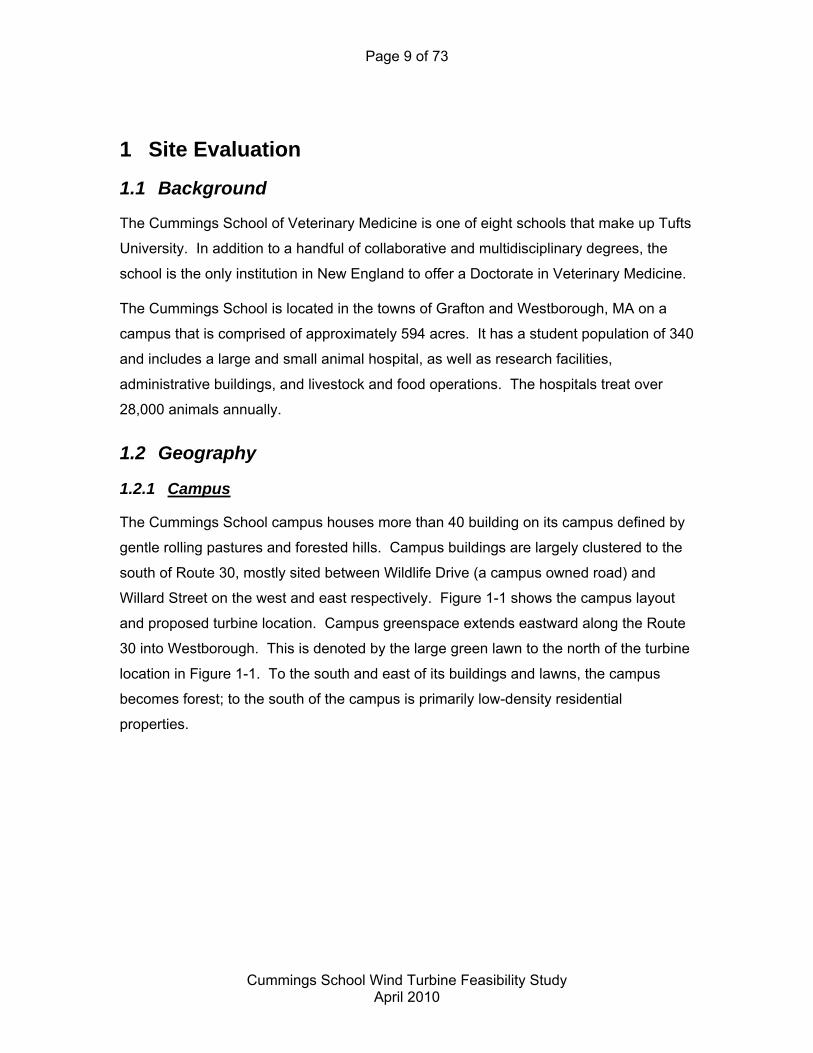
The Cummings School campus houses more than 40 building on its campus defined by
gentle rolling pastures and forested hills. Campus buildings are largely clustered to the
south of Route 30, mostly sited between Wildlife Drive (a campus owned road) and
Willard Street on the west and east respectively. Figure 1-1 shows the campus layout
and proposed turbine location. Campus greenspace extends eastward along the Route
30 into Westborough. This is denoted by the large green lawn to the north of the turbine
location in Figure 1-1. To the south and east of its buildings and lawns, the campus
becomes forest; to the south of the campus is primarily low-density residential
properties.
Page 10 of 73
Cummings School Wind Turbine Feasibility Study
April 2010
Figure 1-1 Aerial View of the Cummings School
In all, Tufts owns a handful of large parcels that offer ample space for wind turbine
development. A map that includes many campus building locations and names is
included as Appendix A.
1.2.2 Vicinity
Immediate abutters to the Cummings School are MBTA tracks to the north,
Commonwealth of Massachusetts Department of Capital Asset Management to the west
and residential properties to the south and east. Other notable parcels in the vicinity are
Grafton Job Corporation Center to the north of the MBTA tracks, Centech Park to the
northwest, and the Willard House and Clock Museum about 0.5 miles to the south.
These are all buffered significantly by the large cumulative size of Tufts’ parcels.
North Grafton is marked by a variety of land uses. Grafton’s central business district lies
2.8 miles to the south of the Cummings School campus while downtown Westborough is
located 3.3 miles to the northeast.
Page 11 of 73
Cummings School Wind Turbine Feasibility Study
April 2010
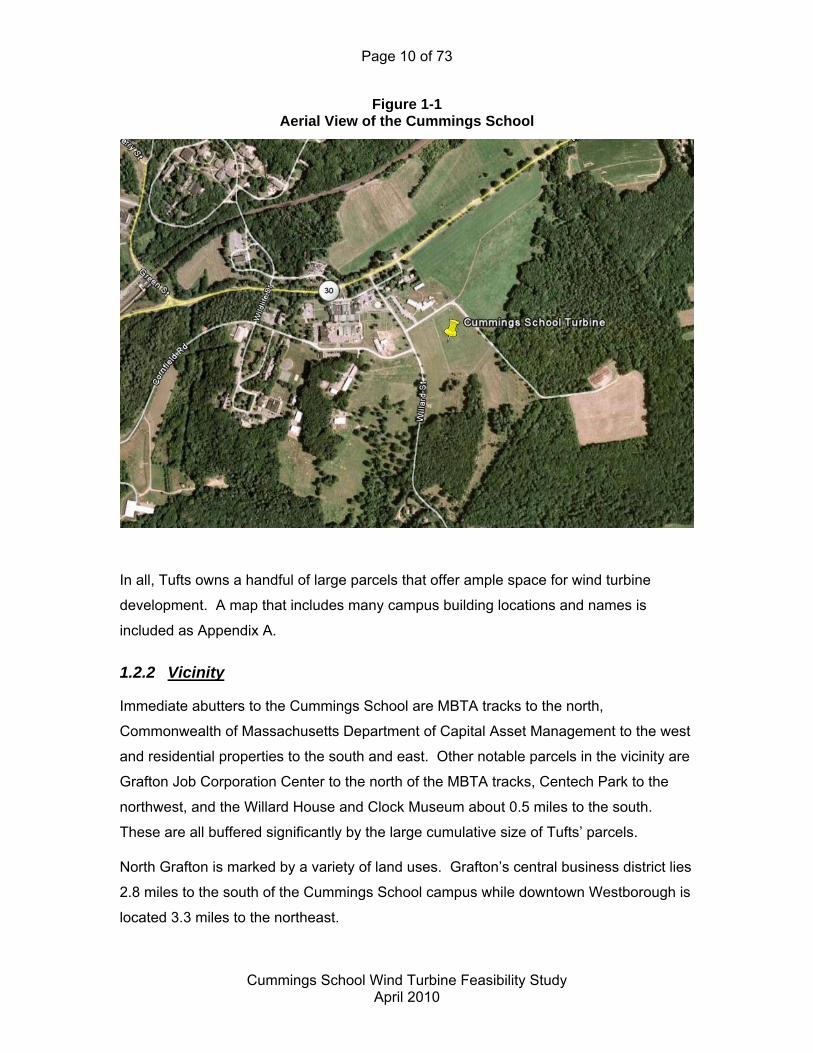
As shown in Figure 1-2, a Cummings School wind turbine has more than 1,000 feet of
separation from all nearby residences. Furthermore, the only nearby residences are in
low-density developments and are concentrated along Willard Street.
Figure 1-2 Cummings School Vicinity
1.2.3 Potential Site Constraints
1.2.3.1 Telecommunications
Most radio, microwave and TV signals are unaffected by the operation of wind turbines.
However, in some instances, AM radio signals can be impacted. Microwave signals also
can be blocked by the wind turbine if it is in a direct line between a transmitter and
receiver.
A review of all communication devices within a three mile radius of the turbine site was
conducted via the Federal Communications Commission (FCC) web database. A
handful of omni-directional communication facilities exist within 5 miles of the project
location, the closest of which (off-campus) is a cellular tower 1.9 miles west-northwest of
Page 12 of 73
Cummings School Wind Turbine Feasibility Study
April 2010
the Cummings School on Route 140 in Shrewsbury. The next closest towers are 2.3
miles to the southeast and 2.5 miles to the southwest.2
Given the separation from these towers and the lack of particularly sensitive
telecommunication nodes in the area, a wind turbine should not have an adverse impact
on communications networks in the area, including the on-campus cell tower.
1.2.3.2 Aviation
There are no airports within 10 miles of the Cummings School campus. Consequently, a
turbine of any commercially-available size should receive FAA approval.
1.2.3.3 Wildlife
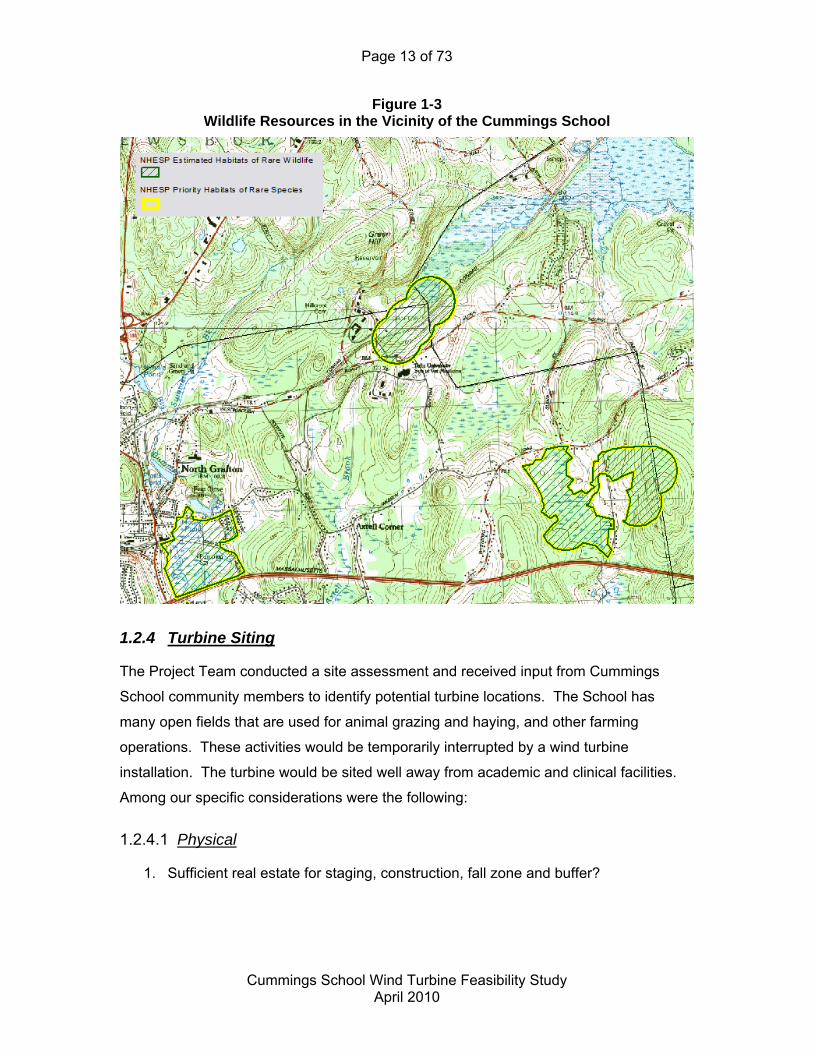
Significant wildlife resources are present in the vicinity of the project site. Figure 1-3
shows state-listed important habitats located on the campus, though largely north of
Route 30. The Massachusetts Natural Heritage and Endangered Species Program
(NHESP) has designated these estimated areas as habitats of rare wildlife and species.
The Project Team recommends contacting the NHESP for more information on the
species present in the vicinity of the proposed turbine site.
2 There is an on campus cell tower of approximately 100’ in height. It is unclear what impact a
wind turbine would have on this tower. It is recommended a more in-depth study of potential
impacts be conducted during the early design stage.
Page 13 of 73
Cummings School Wind Turbine Feasibility Study
April 2010
Figure 1-3 Wildlife Resources in the Vicinity of the Cummings School
1.2.4 Turbine Siting
The Project Team conducted a site assessment and received input from Cummings
School community members to identify potential turbine locations. The School has
many open fields that are used for animal grazing and haying, and other farming
operations. These activities would be temporarily interrupted by a wind turbine
installation. The turbine would be sited well away from academic and clinical facilities.
Among our specific considerations were the following:
1.2.4.1 Physical
1. Sufficient real estate for staging, construction, fall zone and buffer?
Page 14 of 73
Cummings School Wind Turbine Feasibility Study
April 2010
{The campus has suitable land resources in multiple locations. The fall zone of
the preliminary recommended turbine location extends beyond Willard Street and
into Westborough.}
2. Accessibility – Can equipment be transported to the site?
{Route 30 provides good access to the campus. Civil engineering during the
detailed design phase will confirm transportation logistics.}
3. Does not interfere with the existing operations.
{Delivery can be scheduled not to interfere with operations. Construction can be
scheduled in order to not interfere with campus operations.}
1.2.4.2 Operational
1. Electrical engineering feasibility and interconnection issues (minimize wiring runs
where possible).
{Interconnection of a utility scale wind turbine is technically feasible. See Section
1.4.4 for full analysis. The site chosen is nearby the campus connection to the
Tufts-owned 13.8kV distribution, which is connected to National Grid distribution
lines}
2. Review of wind speed data, electrical usage.
{There is adequate load at the Cummings School, and a fair wind resource is
present. Details on wind resources is provided in Section 1.3}
3. Modeling run of financial pro-forma with multiple turbine configurations providing
first estimate of economic feasibility.
{A wind turbine provides substantial economic returns. It will be up to the
University to determine if such returns are sufficient.}
1.2.4.3 Community
1. Compliance with local zoning regulations.
{Permitting for the chosen location is achievable, but will require amendments to
both the master plan and local zoning by-law. The Project Team recommends
consultation with local legal counsel, Town of Grafton Planner, Planning Board
and other civic leader, based on previously submitted Campus Master Plans.}
Page 15 of 73
Cummings School Wind Turbine Feasibility Study
April 2010
2. Significant buffer from nearest property line to assure Massachusetts noise policy
can be met.
{Turbine-based noise will not significantly impact nearby residences.}
3. Aesthetic impacts.
{The wind turbine may have an impact on the nearby viewshed. However, it
should not be visible from most locations in Grafton or Westborough because of
topography and vegetation.}
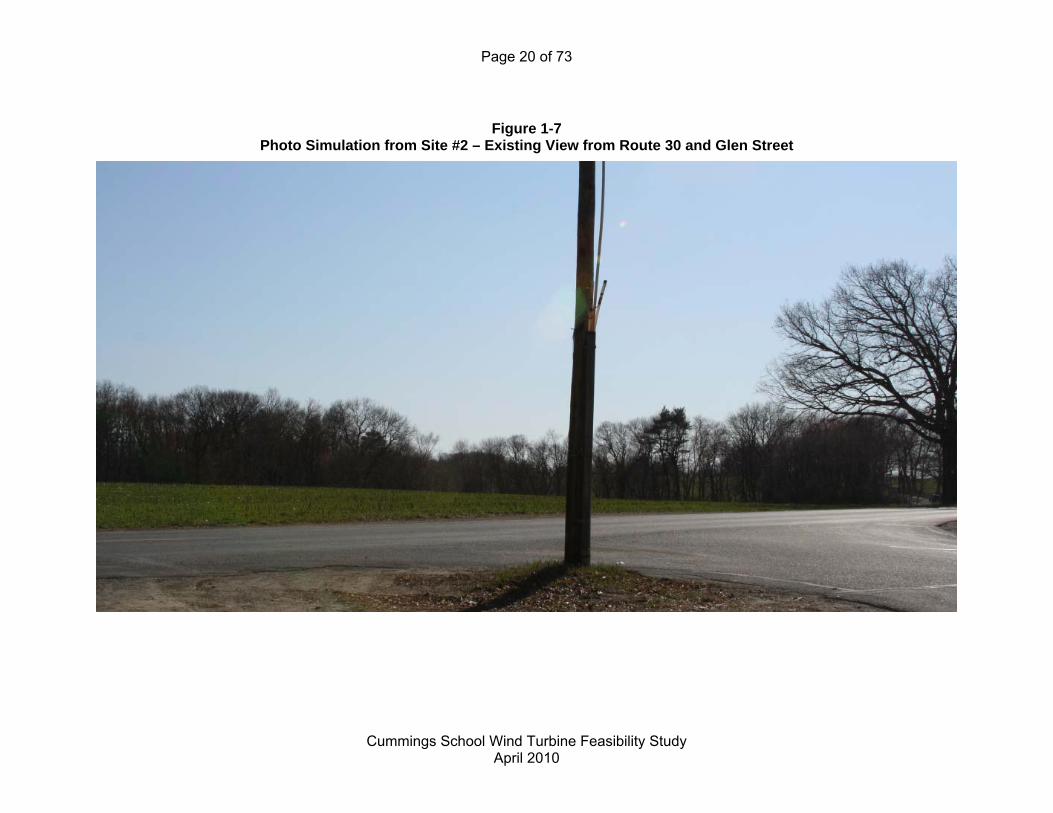
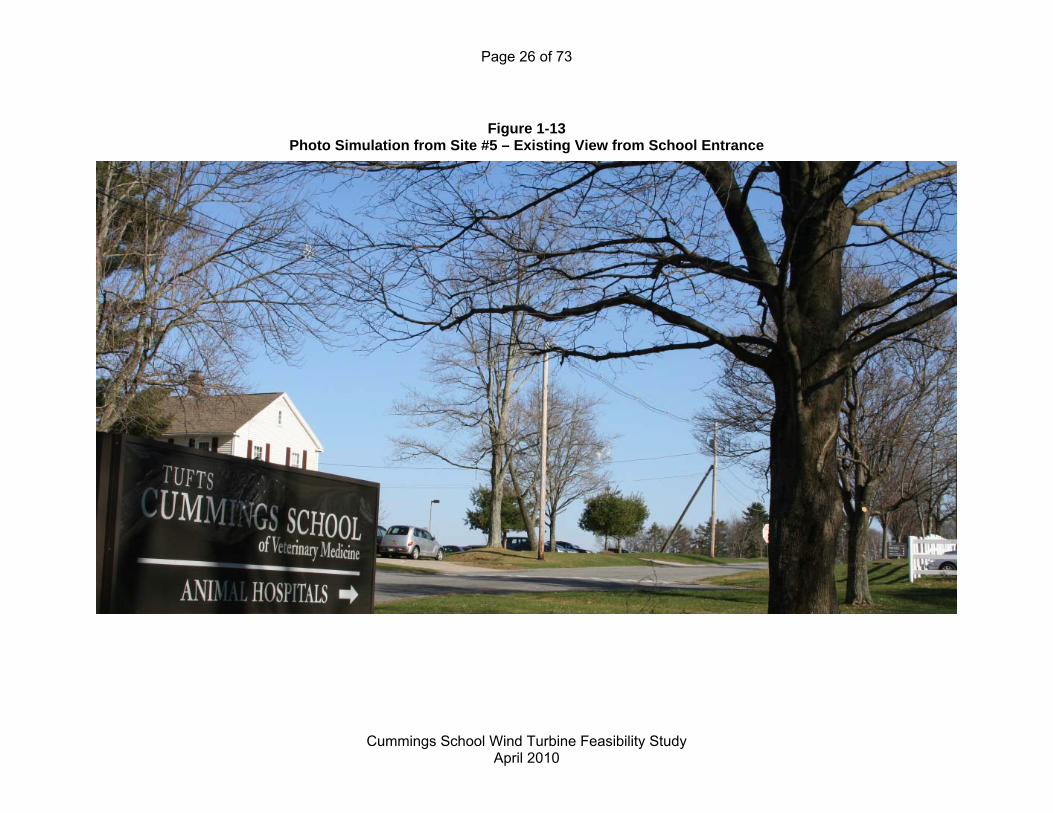
1.2.5 Photo Simulation
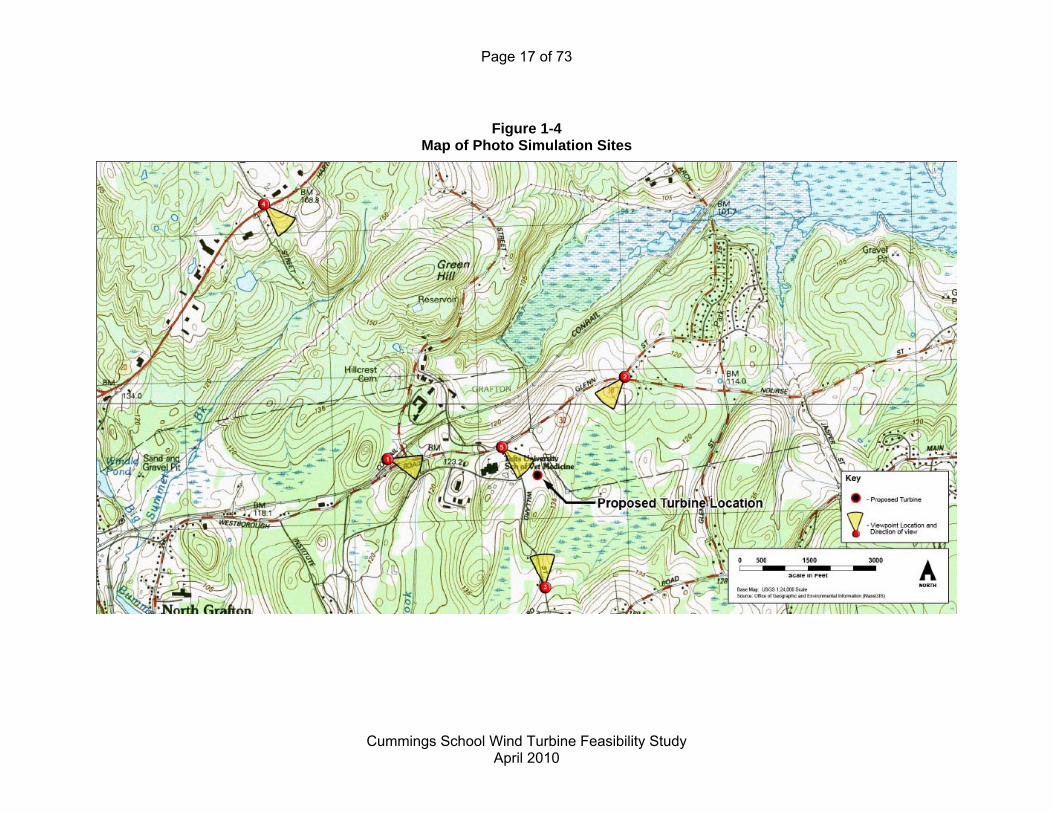
The following are scaled depictions of turbine visual impact generated by Saratoga
Associates through the use of sophisticated simulation software. Base photographs
(see Figure 1-5, Figure 1-7, Figure 1-9, Figure 1-11, and Figure 1-13) accompanying site
data were supplied to Saratoga Associates by Boreal as recommended by Cummings
School representatives.
Photo renderings were developed by superimposing a rendering of a three-dimensional
computer model of the proposed project into the base photograph taken from each
corresponding location. The three-dimensional computer model, covering the regional
terrain within the project area, were developed in AutoDesk Civil 3D 2009 and
Autodesk® 3ds Max Design® 2009 (MAX) software.
Simulated perspectives were matched to the corresponding base photograph for each
simulated view by matching the precise X, Y and Z coordinates of the field camera
position (as recorded by GPS) and the focal length of the camera lens used. The
camera’s target position was established by aligning common elements visible in both
the digital model and actual photograph (e.g., cell tower within view).
The proposed condition model was rendered at the same output size/digital resolution as
the base photograph, and using the base photograph as a background environment
map. The 3D model was rendered using sunlight settings matching the date and time of
day the base photograph was taken. To the extent practicable, design details (e.g.,
precise dimension and form of the selected wind turbine, color, etc.) of the proposed
turbine was built into the 3D model and incorporated into the rendering. Consequently,
the scale, alignment, elevations and location of the visible elements of the proposed
facilities are true to the proposed design. The rendered view was then superimposed
Page 16 of 73
Cummings School Wind Turbine Feasibility Study
April 2010
into a digital version of the base photograph using Adobe Photoshop CS2® software for
post-production editing.
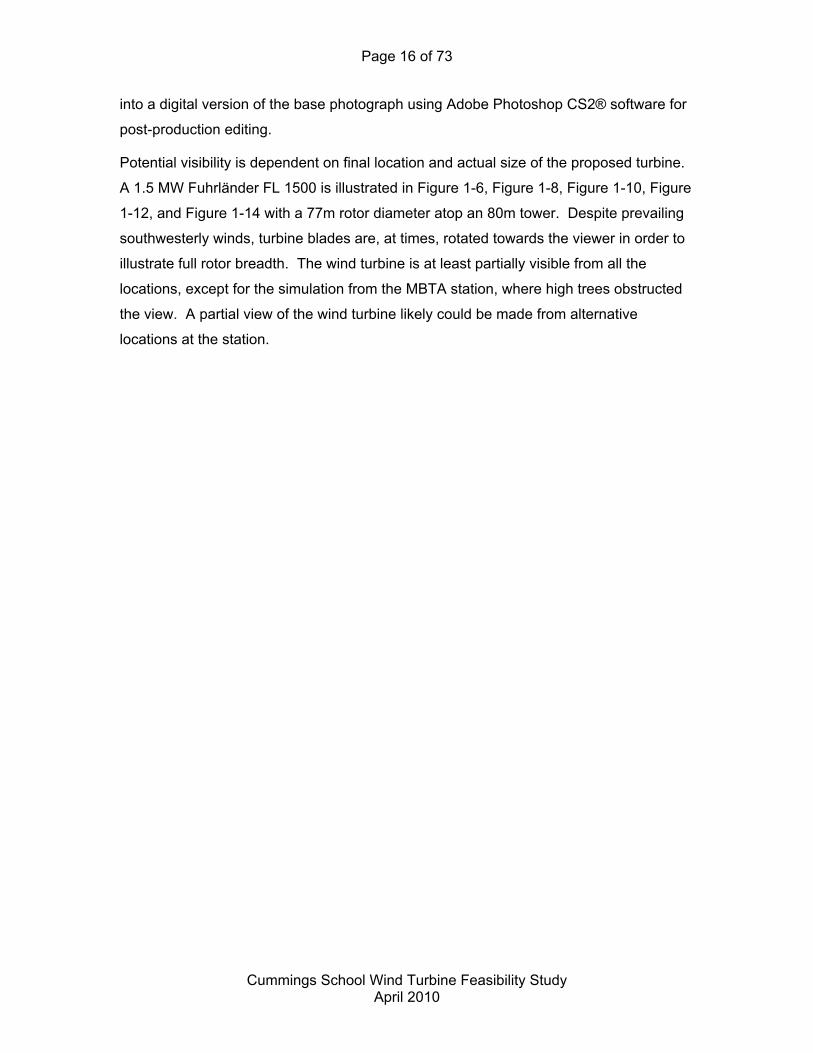
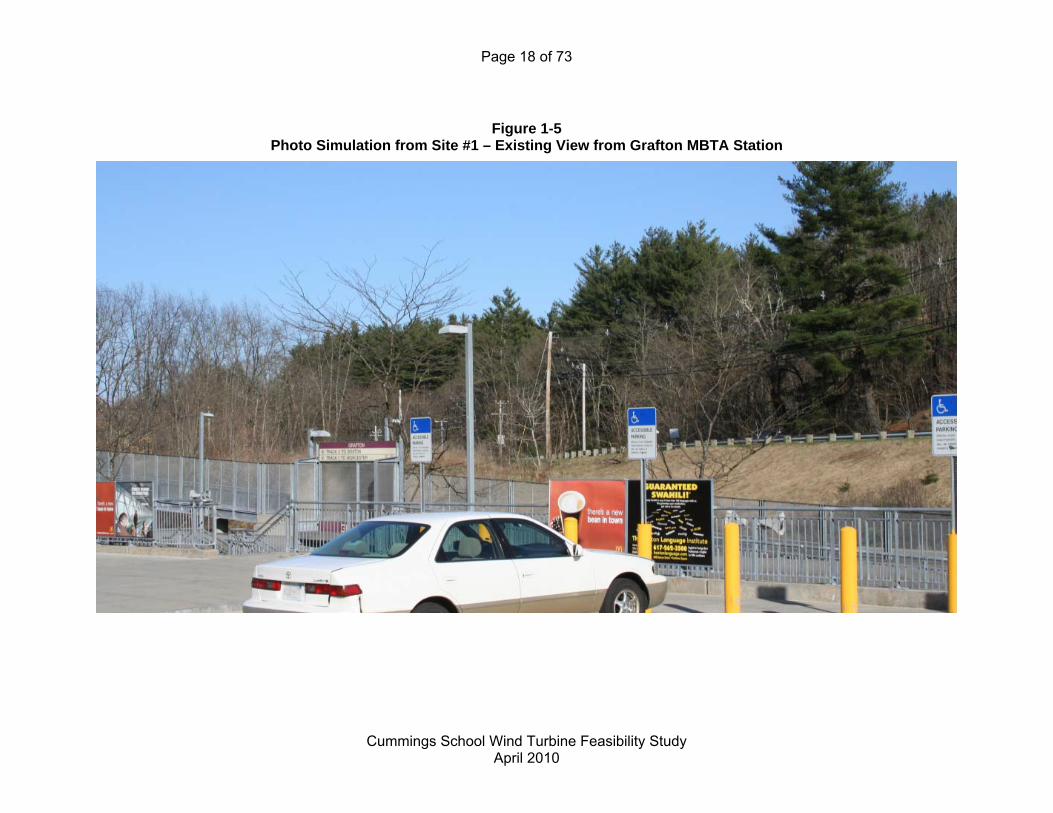
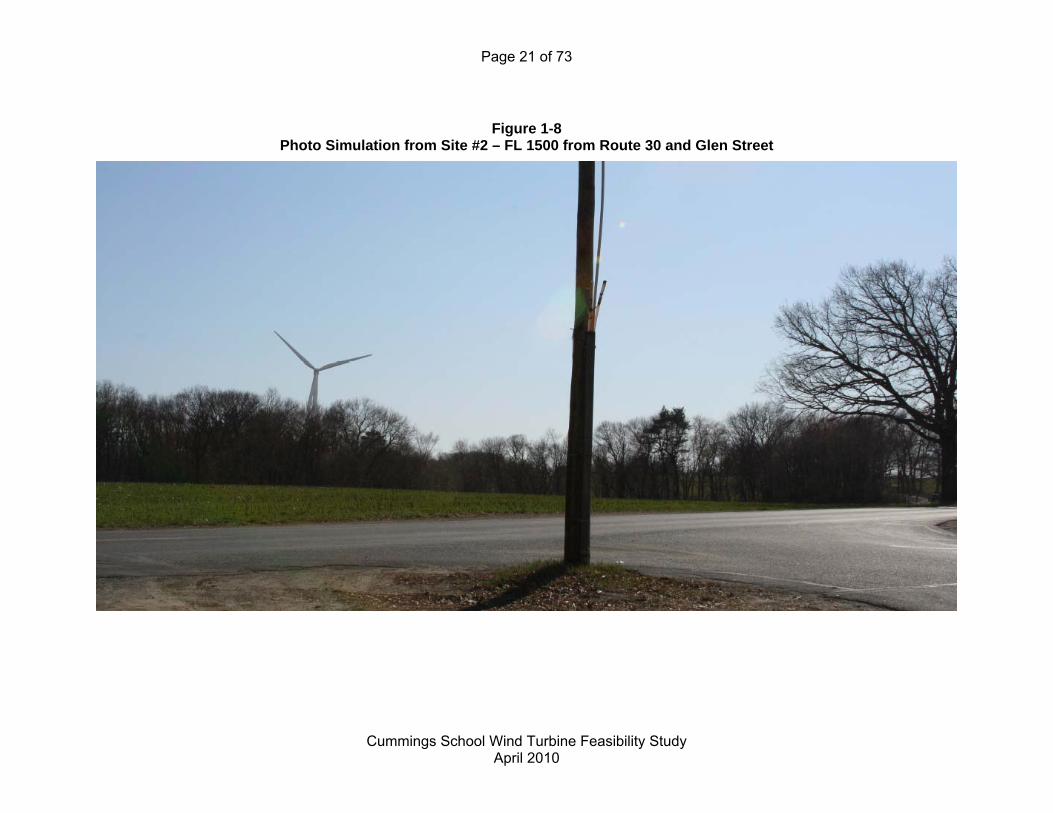
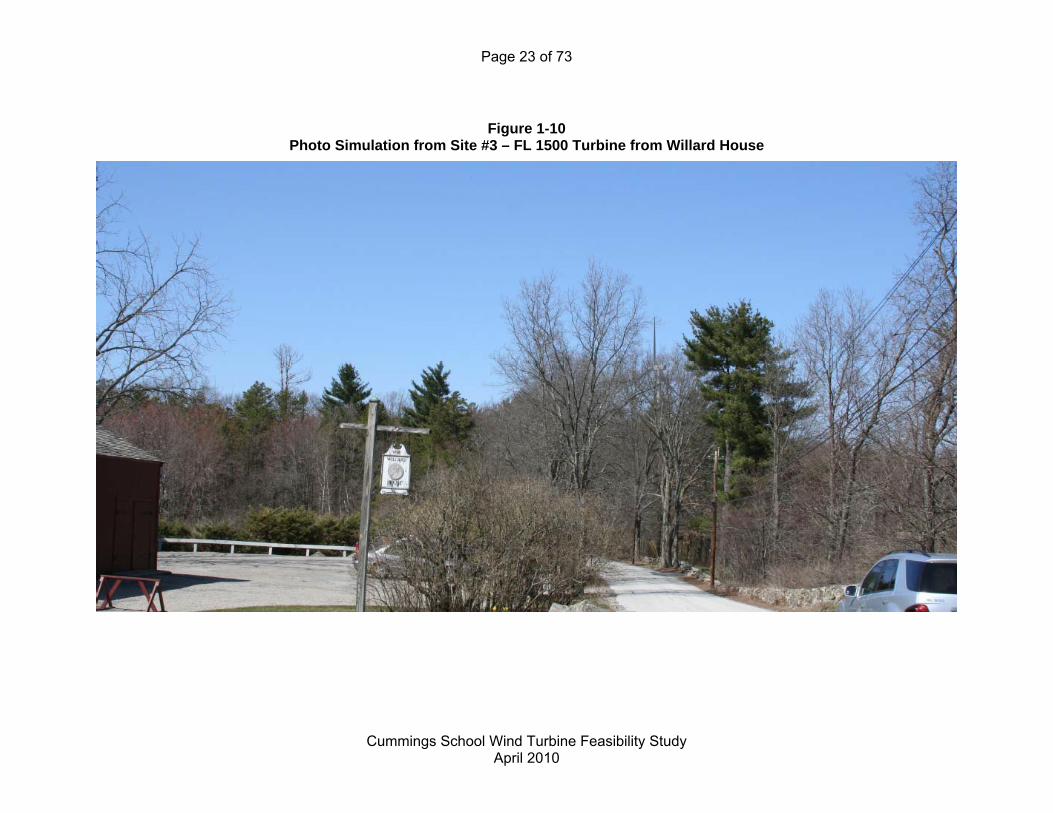
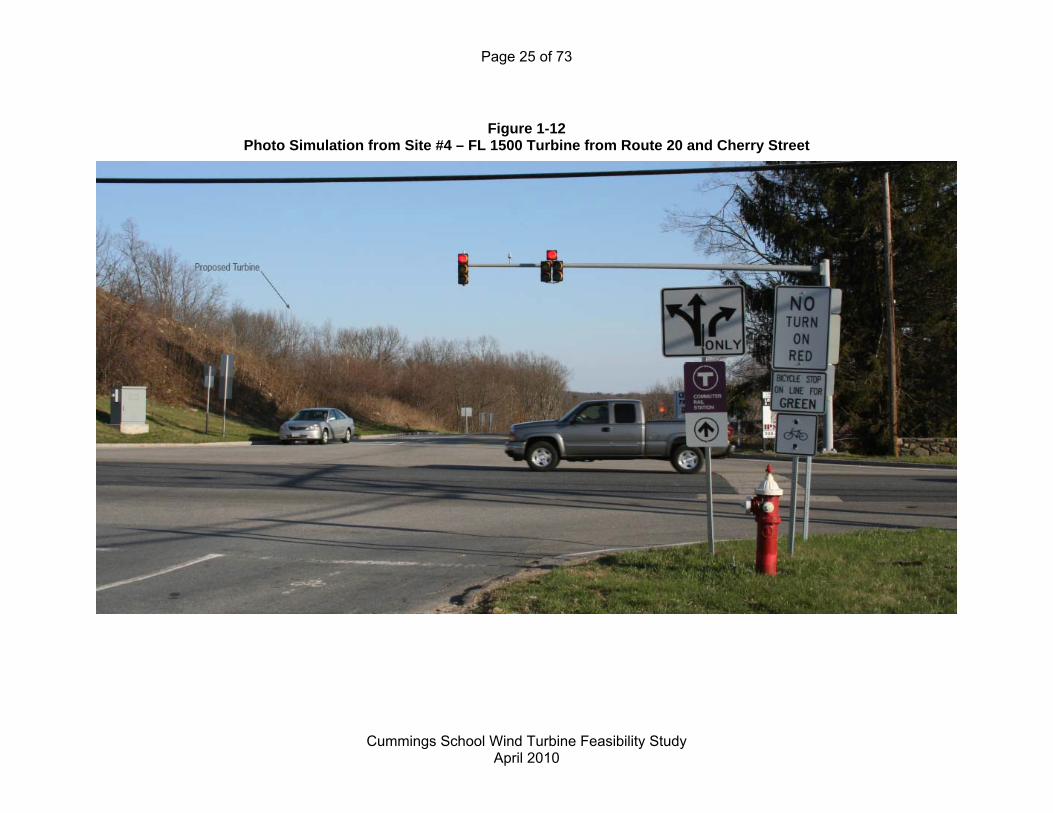
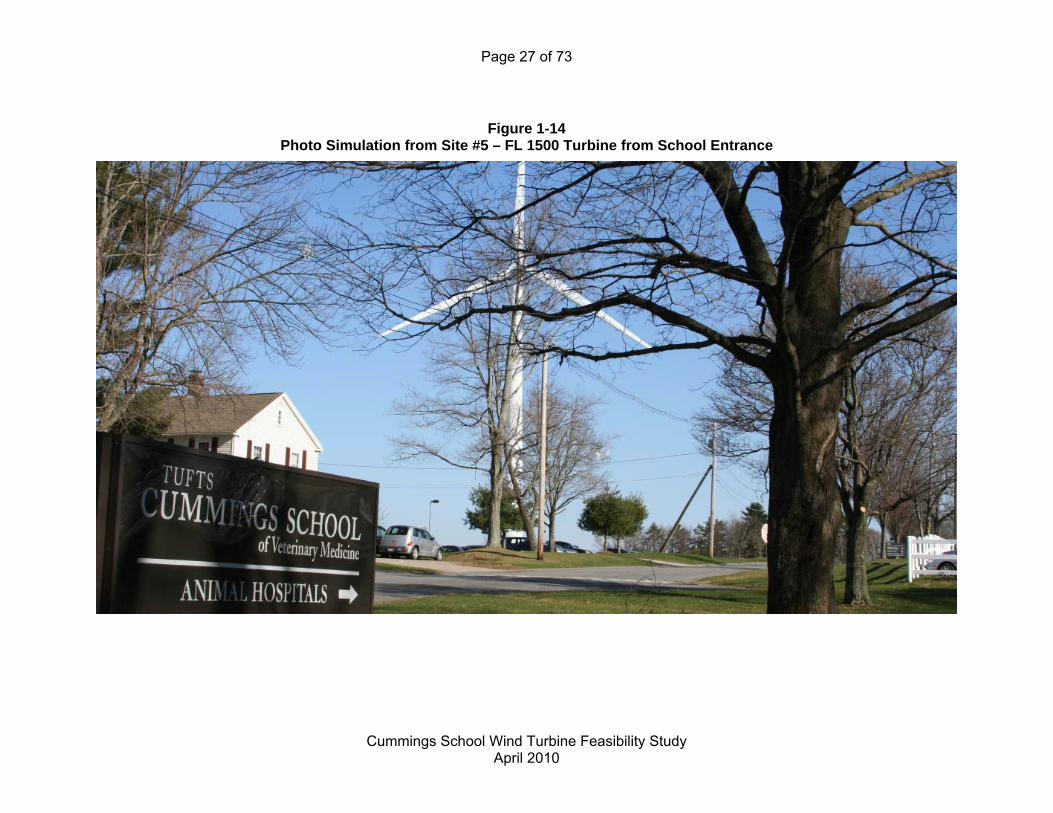
Potential visibility is dependent on final location and actual size of the proposed turbine.
A 1.5 MW Fuhrländer FL 1500 is illustrated in Figure 1-6, Figure 1-8, Figure 1-10, Figure
1-12, and Figure 1-14 with a 77m rotor diameter atop an 80m tower. Despite prevailing
southwesterly winds, turbine blades are, at times, rotated towards the viewer in order to
illustrate full rotor breadth. The wind turbine is at least partially visible from all the
locations, except for the simulation from the MBTA station, where high trees obstructed
the view. A partial view of the wind turbine likely could be made from alternative
locations at the station.
Page 17 of 73
Cummings School Wind Turbine Feasibility Study
April 2010
Figure 1-4 Map of Photo Simulation Sites
Page 18 of 73
Cummings School Wind Turbine Feasibility Study
April 2010
Figure 1-5 Photo Simulation from Site #1 – Existing View from Grafton MBTA Station
Page 19 of 73
Cummings School Wind Turbine Feasibility Study
April 2010
Figure 1-6 Photo Simulation from Site #1 – FL 1500 from Grafton MBTA Station
Page 20 of 73
Cummings School Wind Turbine Feasibility Study
April 2010
Figure 1-7 Photo Simulation from Site #2 – Existing View from Route 30 and Glen Street
Page 21 of 73
Cummings School Wind Turbine Feasibility Study
April 2010
Figure 1-8 Photo Simulation from Site #2 – FL 1500 from Route 30 and Glen Street

Page 22 of 73
Cummings School Wind Turbine Feasibility Study
April 2010
Figure 1-9 Photo Simulation from Site #3 – Existing View from Willard House
Page 23 of 73
Cummings School Wind Turbine Feasibility Study
April 2010
Figure 1-10 Photo Simulation from Site #3 – FL 1500 Turbine from Willard House

Page 24 of 73
Cummings School Wind Turbine Feasibility Study
April 2010
Figure 1-11 Photo Simulation from Site #4 – Existing View from Route 20 and Cherry Street
Page 25 of 73
Cummings School Wind Turbine Feasibility Study
April 2010
Figure 1-12 Photo Simulation from Site #4 – FL 1500 Turbine from Route 20 and Cherry Street
Page 26 of 73
Cummings School Wind Turbine Feasibility Study
April 2010
Figure 1-13 Photo Simulation from Site #5 – Existing View from School Entrance
Page 27 of 73
Cummings School Wind Turbine Feasibility Study
April 2010
Figure 1-14 Photo Simulation from Site #5 – FL 1500 Turbine from School Entrance
Page 28 of 73
Cummings School Wind Turbine Feasibility Study
April 2010
1.3 Wind Resource Assessment
At the study’s onset, it was assumed that the Cummings School site possessed marginal
wind resources - an average of 6.0 meters/second (m/s) at a 70 meter hub height.
These data were derived from the publically-available meso-scale New England Wind
Map compiled by AWS Truewind, a leader in the field. Values were accessed through
MassGIS’ reproduction of the Truewind maps on the MassGIS Wind Energy Site
Screening Tool.
1.3.1 Data Acquisition
The project team’s original intent was to gather meteorological data through the
installation of a meteorological tower (met tower) at the Cummings School. Permitting of
a 50m met tower in Grafton and Westborough, however, was deemed prohibitive due to
a potentially problematic permitting path.
Instead of installing a meteorological tower, Tufts elected to conduct a three-month
Sodar study on-site. A Triton sonic wind profiler was installed by Second Wind Inc.
(SWI) on August 5, 2009 and recorded wind speed and direction values at heights of up
to 200m through November 19, 2009.
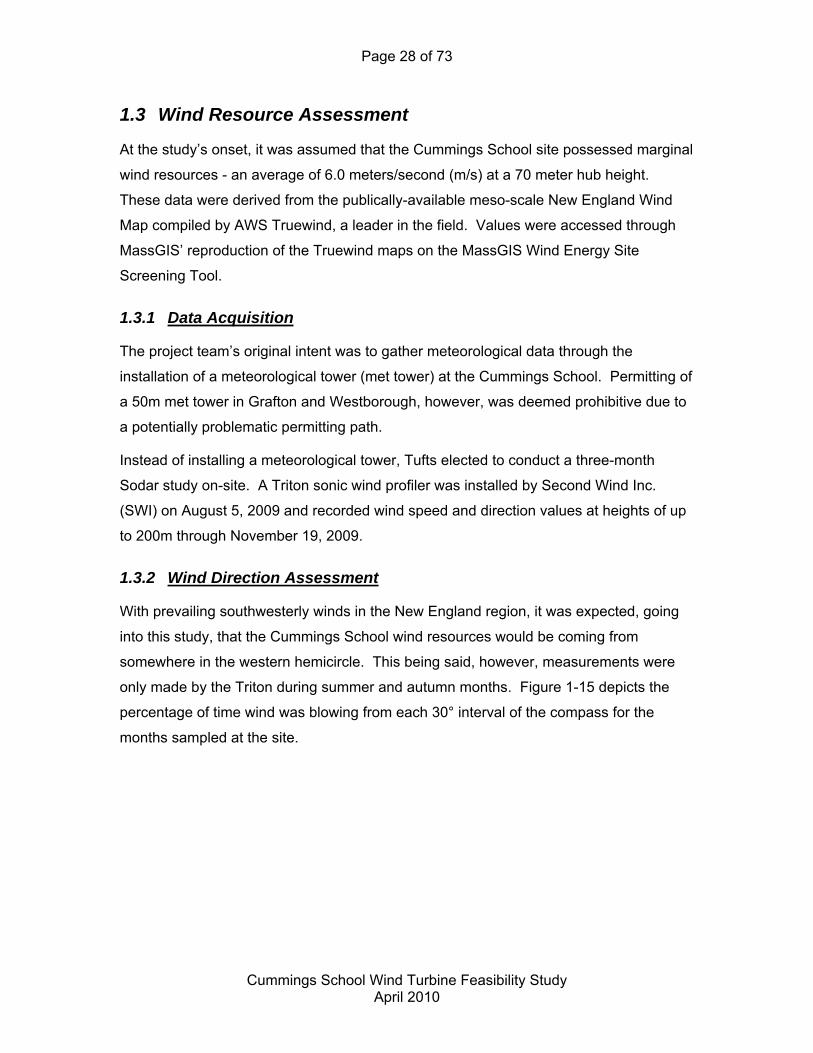
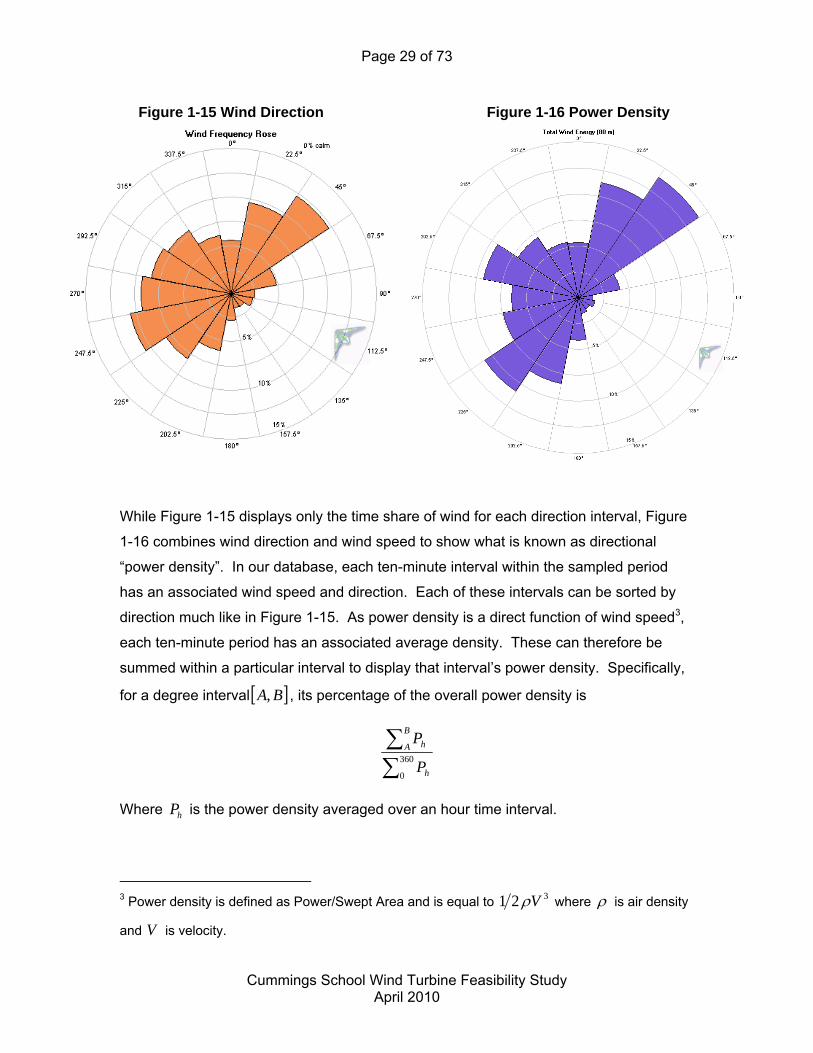
1.3.2 Wind Direction Assessment
With prevailing southwesterly winds in the New England region, it was expected, going
into this study, that the Cummings School wind resources would be coming from
somewhere in the western hemicircle. This being said, however, measurements were
only made by the Triton during summer and autumn months. Figure 1-15 depicts the
percentage of time wind was blowing from each 30° interval of the compass for the
months sampled at the site.
Page 29 of 73
Cummings School Wind Turbine Feasibility Study
April 2010
Figure 1-15 Wind Direction Figure 1-16 Power Density
While Figure 1-15 displays only the time share of wind for each direction interval, Figure
1-16 combines wind direction and wind speed to show what is known as directional
“power density”. In our database, each ten-minute interval within the sampled period
has an associated wind speed and direction. Each of these intervals can be sorted by
direction much like in Figure 1-15. As power density is a direct function of wind speed3,
each ten-minute period has an associated average density. These can therefore be
summed within a particular interval to display that interval’s power density. Specifically,
for a degree interval BA, , its percentage of the overall power density is
360
0 h
B
A h
P
P
Where hP is the power density averaged over an hour time interval.
3 Power density is defined as Power/Swept Area and is equal to 321 V where is air density
and V is velocity.
Page 30 of 73
Cummings School Wind Turbine Feasibility Study
April 2010
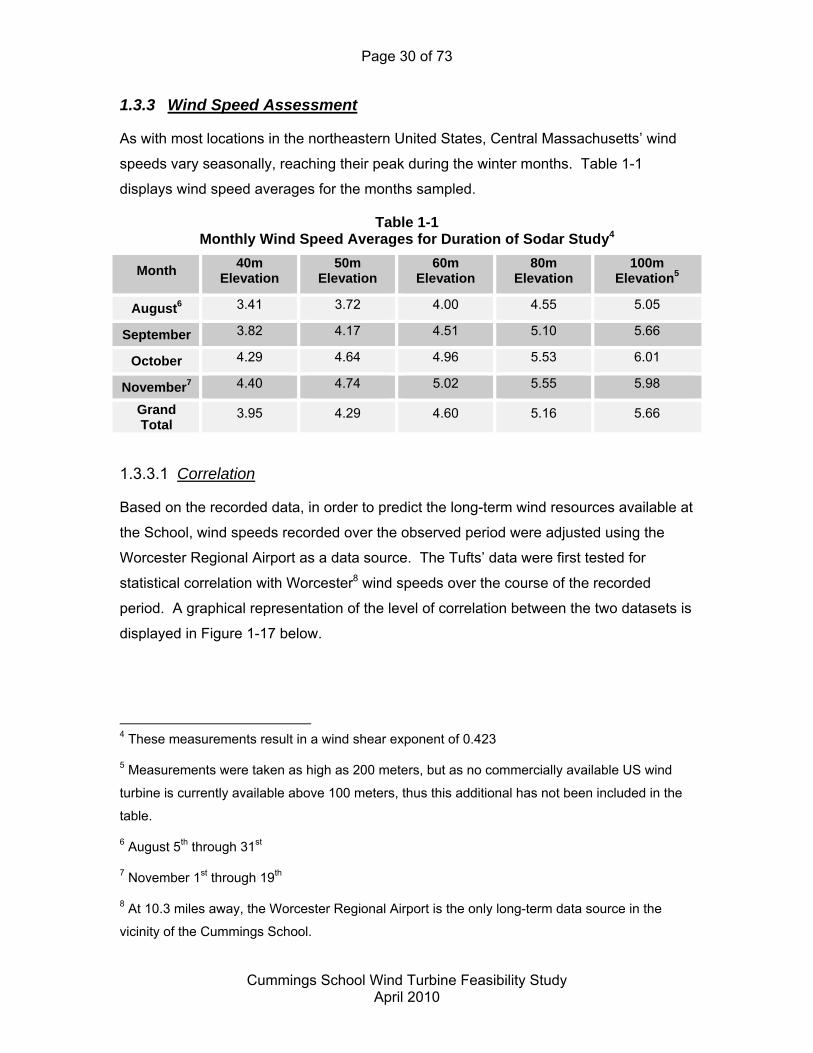
1.3.3 Wind Speed Assessment
As with most locations in the northeastern United States, Central Massachusetts’ wind
speeds vary seasonally, reaching their peak during the winter months. Table 1-1
displays wind speed averages for the months sampled.
Table 1-1 Monthly Wind Speed Averages for Duration of Sodar Study4
Month 40m
Elevation 50m
Elevation 60m
Elevation 80m
Elevation 100m
Elevation5
August6 3.41 3.72 4.00 4.55 5.05
September 3.82 4.17 4.51 5.10 5.66
October 4.29 4.64 4.96 5.53 6.01
November7 4.40 4.74 5.02 5.55 5.98
Grand Total
3.95 4.29 4.60 5.16 5.66
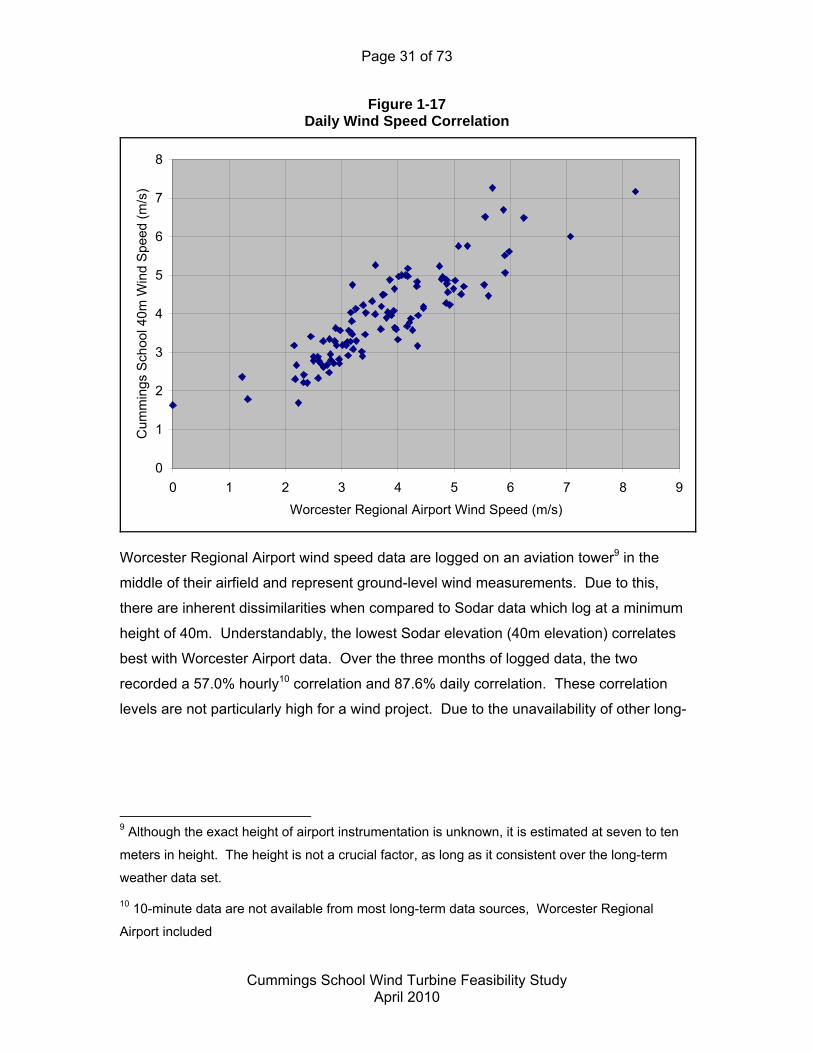
1.3.3.1 Correlation
Based on the recorded data, in order to predict the long-term wind resources available at
the School, wind speeds recorded over the observed period were adjusted using the
Worcester Regional Airport as a data source. The Tufts’ data were first tested for
statistical correlation with Worcester8 wind speeds over the course of the recorded
period. A graphical representation of the level of correlation between the two datasets is
displayed in Figure 1-17 below.
4 These measurements result in a wind shear exponent of 0.423
5 Measurements were taken as high as 200 meters, but as no commercially available US wind
turbine is currently available above 100 meters, thus this additional has not been included in the
table.
6 August 5th through 31st
7 November 1st through 19th
8 At 10.3 miles away, the Worcester Regional Airport is the only long-term data source in the
vicinity of the Cummings School.
Page 31 of 73
Cummings School Wind Turbine Feasibility Study
April 2010
Figure 1-17 Daily Wind Speed Correlation
0
1
2
3
4
5
6
7
8
0 1 2 3 4 5 6 7 8 9
Worcester Regional Airport Wind Speed (m/s)
Cum
min
gs
Sch
ool 4
0m
Win
d S
pe
ed (
m/s
)
Worcester Regional Airport wind speed data are logged on an aviation tower9 in the
middle of their airfield and represent ground-level wind measurements. Due to this,
there are inherent dissimilarities when compared to Sodar data which log at a minimum
height of 40m. Understandably, the lowest Sodar elevation (40m elevation) correlates
best with Worcester Airport data. Over the three months of logged data, the two
recorded a 57.0% hourly10 correlation and 87.6% daily correlation. These correlation
levels are not particularly high for a wind project. Due to the unavailability of other long-
9 Although the exact height of airport instrumentation is unknown, it is estimated at seven to ten
meters in height. The height is not a crucial factor, as long as it consistent over the long-term
weather data set.
10 10-minute data are not available from most long-term data sources, Worcester Regional
Airport included
Page 32 of 73
Cummings School Wind Turbine Feasibility Study
April 2010
term data sources in the area,11 Worcester data were deemed to be the best available
option for completion of the Measure-Correlate-Predict assessment.
1.3.3.2 Resource Estimation
To be useful, Cummings School Sodar data must be adjusted for long-term weather
patterns. The three month period sample represents only a short interval from which a
comparison to historic trends could be made with further investment.
The following steps were taken to estimate wind resources for a typical year:
Find the long-term weather station that is best correlated with the facility’s data.
Worcester Regional Airport was used for this purpose (see above).
Align hourly Sodar data at the appropriate hub height (80m) with Worcester Regional
Airport data. Calculate three month ratio of the two sites’ average wind speeds
(136.3%).
Use this ratio and Worcester wind speeds from a single proxy year (2006) to develop
an estimated average
Scale the above results for 2006 to match the long-term average annual wind speed
(a 1.3% decrease) at the airport.
o This results in estimated annual average winds speeds of 6.25 m/s at 80
meters
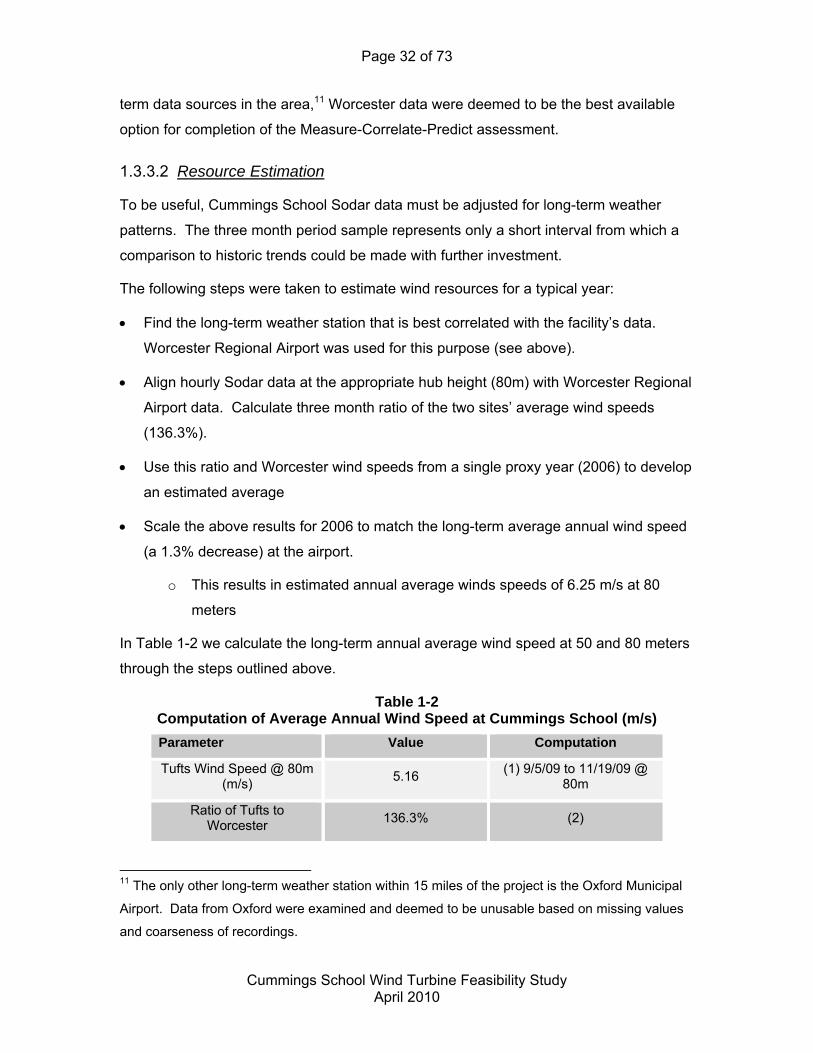
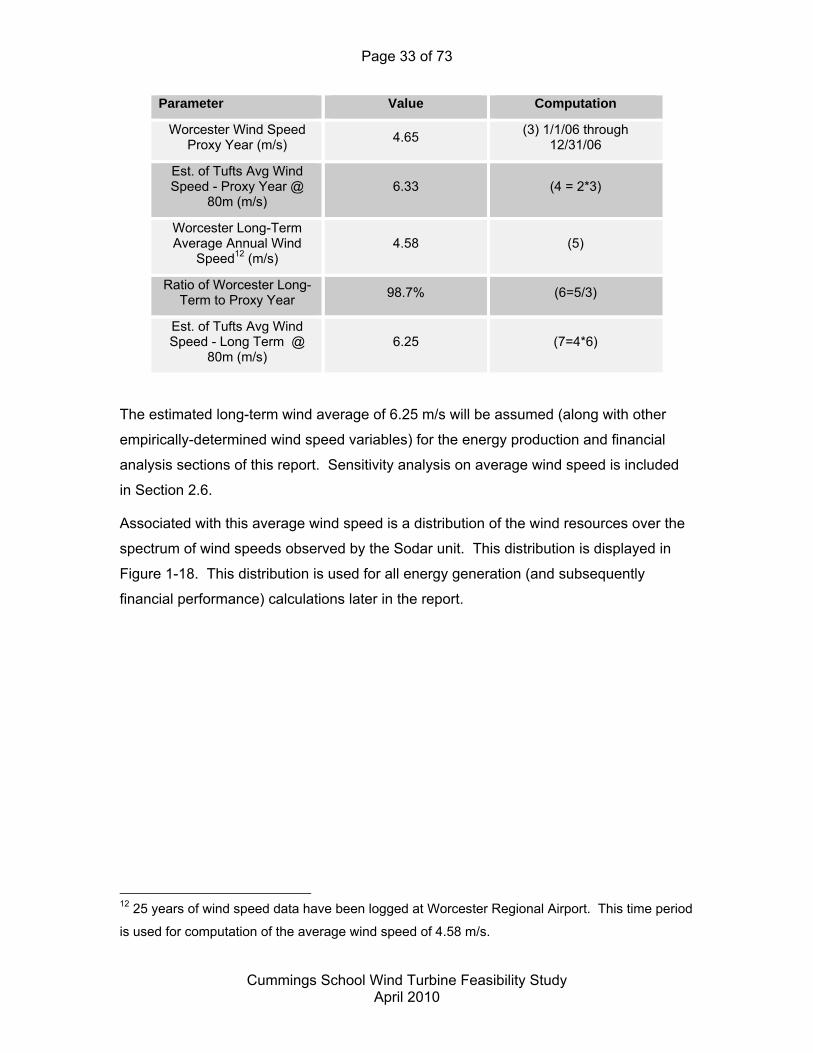
In Table 1-2 we calculate the long-term annual average wind speed at 50 and 80 meters
through the steps outlined above.
Table 1-2 Computation of Average Annual Wind Speed at Cummings School (m/s)
Parameter Value Computation
Tufts Wind Speed @ 80m (m/s)
5.16 (1) 9/5/09 to 11/19/09 @
80m
Ratio of Tufts to Worcester
136.3% (2)
11 The only other long-term weather station within 15 miles of the project is the Oxford Municipal
Airport. Data from Oxford were examined and deemed to be unusable based on missing values
and coarseness of recordings.
Page 33 of 73
Cummings School Wind Turbine Feasibility Study
April 2010
Parameter Value Computation
Worcester Wind Speed Proxy Year (m/s)
4.65 (3) 1/1/06 through
12/31/06
Est. of Tufts Avg Wind Speed - Proxy Year @
80m (m/s) 6.33 (4 = 2*3)
Worcester Long-Term Average Annual Wind
Speed12 (m/s) 4.58 (5)
Ratio of Worcester Long-Term to Proxy Year
98.7% (6=5/3)
Est. of Tufts Avg Wind Speed - Long Term @
80m (m/s) 6.25 (7=4*6)
The estimated long-term wind average of 6.25 m/s will be assumed (along with other
empirically-determined wind speed variables) for the energy production and financial
analysis sections of this report. Sensitivity analysis on average wind speed is included
in Section 2.6.
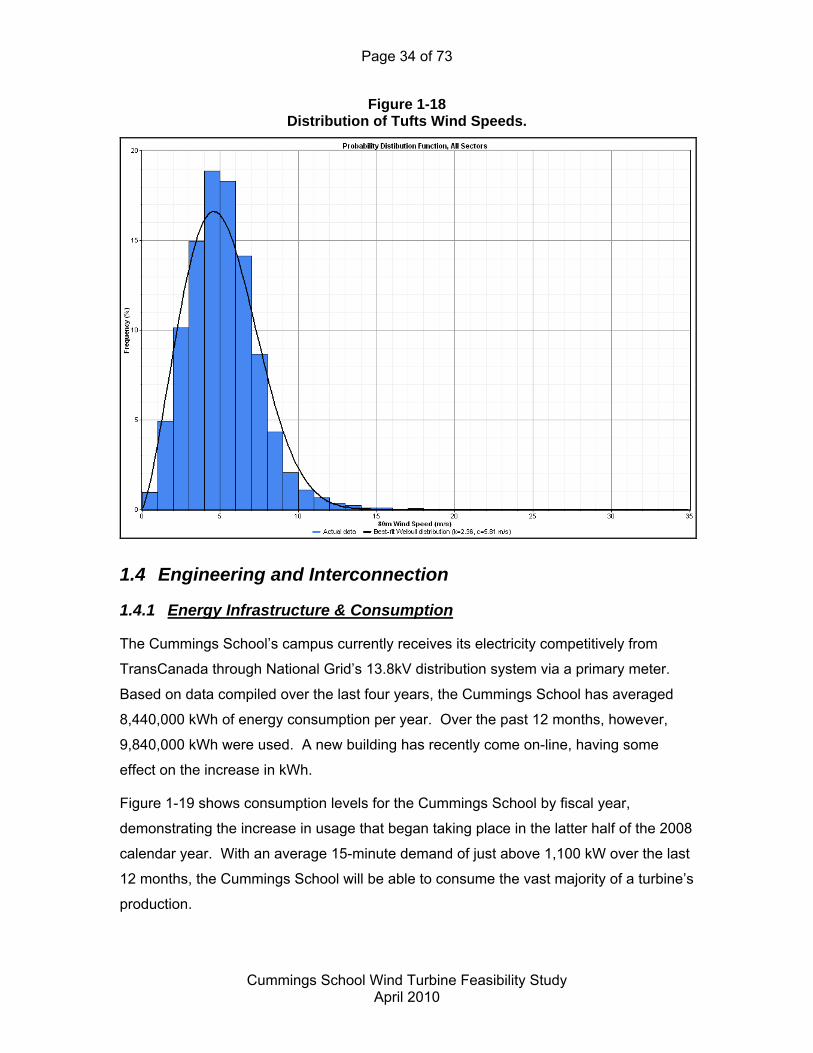
Associated with this average wind speed is a distribution of the wind resources over the
spectrum of wind speeds observed by the Sodar unit. This distribution is displayed in
Figure 1-18. This distribution is used for all energy generation (and subsequently
financial performance) calculations later in the report.
12 25 years of wind speed data have been logged at Worcester Regional Airport. This time period
is used for computation of the average wind speed of 4.58 m/s.
Page 34 of 73
Cummings School Wind Turbine Feasibility Study
April 2010
Figure 1-18 Distribution of Tufts Wind Speeds.
1.4 Engineering and Interconnection
1.4.1 Energy Infrastructure & Consumption
The Cummings School’s campus currently receives its electricity competitively from
TransCanada through National Grid’s 13.8kV distribution system via a primary meter.
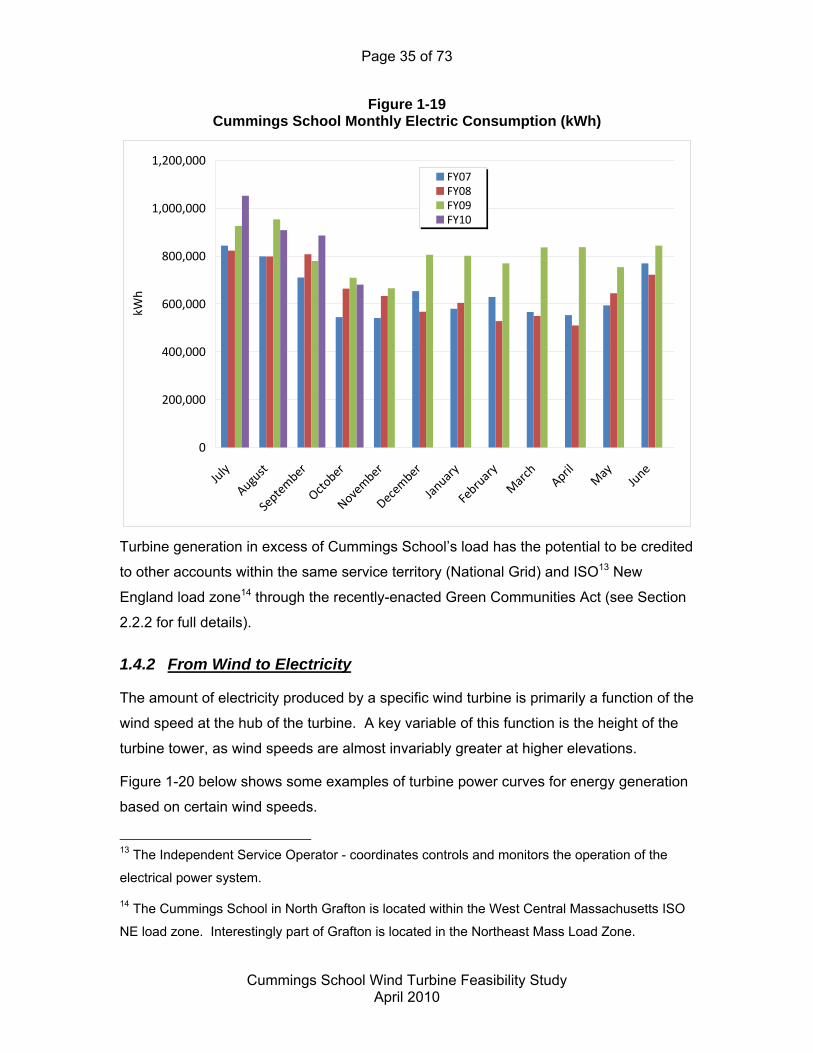
Based on data compiled over the last four years, the Cummings School has averaged
8,440,000 kWh of energy consumption per year. Over the past 12 months, however,
9,840,000 kWh were used. A new building has recently come on-line, having some
effect on the increase in kWh.
Figure 1-19 shows consumption levels for the Cummings School by fiscal year,
demonstrating the increase in usage that began taking place in the latter half of the 2008
calendar year. With an average 15-minute demand of just above 1,100 kW over the last
12 months, the Cummings School will be able to consume the vast majority of a turbine’s
production.
Page 35 of 73
Cummings School Wind Turbine Feasibility Study
April 2010
Figure 1-19 Cummings School Monthly Electric Consumption (kWh)
0
200,000
400,000
600,000
800,000
1,000,000
1,200,000
July
August
September
October
November
December
January
February
March
April
May
June
kWh
FY07FY08FY09FY10
Turbine generation in excess of Cummings School’s load has the potential to be credited
to other accounts within the same service territory (National Grid) and ISO13 New
England load zone14 through the recently-enacted Green Communities Act (see Section
2.2.2 for full details).
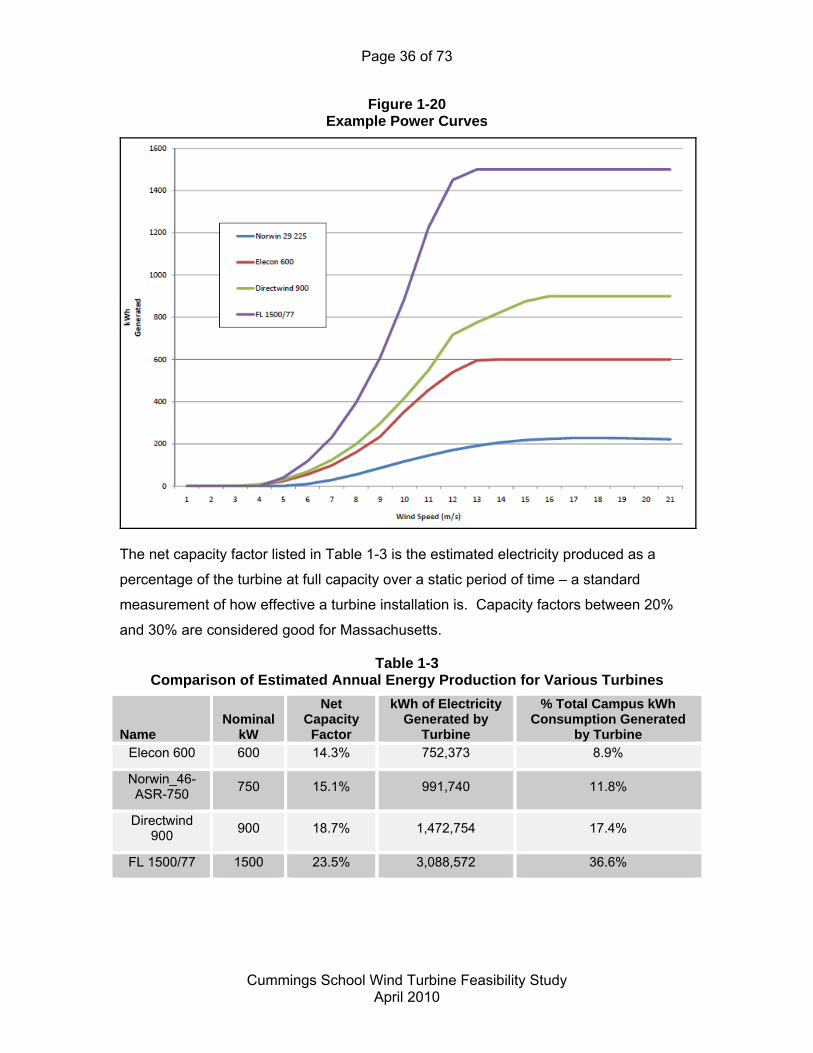
1.4.2 From Wind to Electricity
The amount of electricity produced by a specific wind turbine is primarily a function of the
wind speed at the hub of the turbine. A key variable of this function is the height of the
turbine tower, as wind speeds are almost invariably greater at higher elevations.
Figure 1-20 below shows some examples of turbine power curves for energy generation
based on certain wind speeds.
13 The Independent Service Operator - coordinates controls and monitors the operation of the
electrical power system.
14 The Cummings School in North Grafton is located within the West Central Massachusetts ISO
NE load zone. Interestingly part of Grafton is located in the Northeast Mass Load Zone.
Page 36 of 73
Cummings School Wind Turbine Feasibility Study
April 2010
Figure 1-20 Example Power Curves
The net capacity factor listed in Table 1-3 is the estimated electricity produced as a
percentage of the turbine at full capacity over a static period of time – a standard
measurement of how effective a turbine installation is. Capacity factors between 20%
and 30% are considered good for Massachusetts.
Table 1-3 Comparison of Estimated Annual Energy Production for Various Turbines
Name Nominal
kW
Net Capacity Factor
kWh of Electricity Generated by
Turbine
% Total Campus kWh Consumption Generated
by Turbine Elecon 600 600 14.3% 752,373 8.9%
Norwin_46-ASR-750
750 15.1% 991,740 11.8%
Directwind 900
900 18.7% 1,472,754 17.4%
FL 1500/77 1500 23.5% 3,088,572 36.6%
Page 37 of 73
Cummings School Wind Turbine Feasibility Study
April 2010
1.4.3 Staging / Erection/Construction
The Cummings School is well connected to roadways in the region. Transportation of
the wind turbine blades, tower sections, and nacelle to the site should not be an issue.
Construction activities can be scheduled so that the foundation and wiring runs will be
built prior to the turbine’s arrival. The construction of the foundation and wiring runs is
estimated to take approximately two months. Turbine and tower installation, including
crane set-up and break down, is expected to take approximately three weeks depending
on weather (windy conditions can extend construction schedules). Construction will be
arranged as to not interfere with school operations
The project team estimates permitting and construction can be completed within 18-21
months after project acquires applicable permits and approvals.
1.4.4 Electrical Engineering and Interconnection Requirements
1.4.4.1 Existing Electrical Infrastructure
The campus is currently supplied power from an overhead 13.8kV National Grid
distribution circuit, located on Route 30 (Westborough Road) in North Grafton, MA.
Presently there is a three-phase tap from Westborough Road to Willard Road.
Approximately 850-feet south down Willard Road, there is a primary tap off of the
overhead National Grid system to the Tufts underground primary system. An overhead
primary metering pole exists at this location, prior to the underground riser. The
underground primary cable goes through the first electric manhole (designated EMH#1)
and then into a padmounted sectionalizing cabinet. From this point the primary cable
continues both west to supply the core campus buildings, and east to supply the Bernice
Barbour Wildlife Medicine Building and other facilities east of Willard Street.
1.4.4.2 Electrical Interconnection Plan
A number of alternatives have been considered for the interconnection of wind turbines
ranging from 600kW to 1,500kW (1.5MW). Regardless of proposed turbine size, there is
one probable interconnection option that would allow the new turbine to connect to the
existing primary distribution system at its closest point, which would be the most
economical.
Page 38 of 73
Cummings School Wind Turbine Feasibility Study
April 2010
The proposed interconnection is illustrated in attached Plan E-1, the one-line diagram in
Appendix B. A 1,500kW wind turbine is shown, but the connection would be similar for
any turbine between 600kW-1,500kW.
The wind turbine generator would operate in parallel with the National Grid Electric
13,800V distribution system. This option would require a connection to the closest
existing primary point on the Tufts Grafton electrical 13.8kV distribution system, which is
the padmount transformer behind the Bernice Barbour Wildlife Medicine Building. This
location is northwest of the proposed turbine location, and the capacity of the existing
infrastructure can support the proposed turbine output power, based on no larger than a
1500kW single turbine being considered. The proposed wind turbine location is
approximately 425 feet to the southeast of the existing padmount transformer and
Wildlife Building. It is the most economical to connect with primary class (13.8kV) given
this distance, instead of trying to made a low-voltage (480V) connection to the electrical
infrastructure present in the existing facility.
Electrical power that is produced by the wind turbine generator that is in excess of the
Tufts Grafton’s electrical load would flow back into the National Grid Electric distribution
system.
The wind turbine generators each operate at a 600 volt class generating voltage so the
interconnection facilities for all options must include a generator step-up transformer to
convert the generator voltage to 13.8kV. The generator step-up transformer will have a
2000kVA power rating consistent with the generator power rating of the maximum size
1500kW and 0.9 power factor. If a smaller 600kW or 660kW turbine is chosen, then a
750kVA step-up transformer could be installed.
A 13.8kV underground cable circuit will connect the primary of the generator step up
transformer to facilitate the distribution of the wind turbine generator output to the point
of interconnection (existing padmount transformer).
For a generator rated up to 1500 kW, the current carrying requirement of the 13.8kV
power cable circuit will be less than 100 amperes and can be accommodated by three,
single conductor, 15kV class, #1 AWG, aluminum cables. New 15kV class cables
should be installed in an underground conduit for physical protection rather than being
directly buried.
Page 39 of 73
Cummings School Wind Turbine Feasibility Study
April 2010
The Project Team anticipates that National Grid Electric will require the installation of
utility grade relaying be installed at the turbine location. The turbines main low-voltage
circuit breaker will be capable of normal switching and fault current interruption. The
new protective relaying is typically required by National Grid Electric for interconnection
or parallel generation to their distribution system. The protective relays sense abnormal
circuit conditions that require the wind turbine generators to be disconnected from the
rest of the primary 13.8kV circuit. The protective relays that National Grid Electric will
likely require include over/under voltage relays, over/under frequency relays, and
overcurrent relays.
The interconnection plan also includes a three pole, non-fused padmount disconnect
switch for the manual disconnection and visible isolation of the wind turbine generator
from the existing distribution system. This switch is typically required by the local utility
to isolate the turbine, while not affecting the reliable operation of the existing system.
National Grid Electric operations personnel will need access to manually open and
padlock this disconnect switch in the open position to guarantee that the wind turbine
generator will not back-energize their 13.8kV distribution circuit while they are working
on it or when they otherwise deem it necessary.
1.4.4.3 Electrical Interconnection Details
1.4.4.3.1 Utility Interconnection Requirements
National Grid has specific standards and requirements for the interconnection of
distributed generation such as the proposed wind turbine generator project. The
interconnection requirements address electrical system protection, revenue metering,
operation, and the configuration of the primary interconnection equipment. National Grid
will review the proposed design of the electrical interconnection facilities and will perform
analyses to determine the impact of the proposed generation on their electrical
distribution system.
Based on the results of National Grid’s analysis, certain modifications may be needed
within the National Grid distribution system and/or to the interconnection facilities, which
will be paid for by Tufts, should they be required.
Page 40 of 73
Cummings School Wind Turbine Feasibility Study
April 2010
1.4.4.3.2 Generator Step-up and Step-down Transformers
The generator step-up transformer is described by specifying the transformer voltage
rating (primary and secondary), power rating (kilovolt-amperes or kVA), winding
configuration (primary and secondary), and construction type. Any transformer specified
shall be three phase, padmount type, oil-filled, self-cooled transformers.
The primary voltage rating of the transformers shall be consistent with the nominal
voltage of the National Grid distribution supply circuit to Tufts Grafton, which is 13.8kV
phase-to-phase for this part of the campus. To allow flexibility for local voltage
deviations that may exist on the National Grid distribution system or within the 13.8kV
interconnection circuitry, the transformer primary winding shall be equipped with five (5)
fixed taps to change the primary voltage rating +/- 5% from nominal voltage in 2-½ %
increments. For the generator step-up transformer, the secondary voltage rating shall
be consistent with the wind turbine generator voltage, which is typically in the range of
575 volts to 690 volts.
The three phase power rating of the generator step-up transformer (expressed in kVA)
shall be consistent with the wind turbine generator power rating (expressed in kW) and
increased for the allowable generator power factor. A 1500 kW wind turbine generator
operating at a 90% lagging power factor requires a padmount transformer with a
minimum continuous rating of 2000 kVA.
1.4.4.3.3 Interconnection Circuit 15kV Class Cables
The wind turbine generator interconnection option requires the use of 15kV class
interconnection circuit cables. A three phase interconnection circuit of approximately
550 feet is required from the generator step-up transformer to the point of
interconnection to the Tufts Grafton 13.8kV system.
The power cables shall be specified for 15kV class insulation and consist of three, single
conductor cables with either aluminum or copper conductors. For a wind turbine
generator with power ratings of up to 1500 kW, the size of the power cables shall be a
minimum of #1 AWG Aluminum. This is typically the smallest size primary cable
installed by utilities.
The power cables from the wind turbine generator step-up transformer to each 13.8kV
interconnection point shall be installed in underground conduit. The conduit shall be
Page 41 of 73
Cummings School Wind Turbine Feasibility Study
April 2010
Schedule 40 PVC that is encased in concrete At least two (2) additional conduits for
communications and control of the wind turbine generator should also be included in the
conduit system, with separate communications handholes.
1.4.4.3.4 Utility Disconnect Switch
The utility, non-fused disconnect switch specified for generator interconnection shall be a
manually operated, three pole padmount switch, necessary to break the current on the
secondary side of the wind turbine transformer. The switch shall be rated for 600
amperes of continuous current. The disconnect switch provides a visible open point
between the wind turbine generator and the National Grid system. The operating handle
of the disconnect switch shall be capable of being padlocked by a National Grid lock in
the open position. The position of the disconnect switch blades shall be capable of
being visually observed to allow positive determination of the electrical connection
between the wind turbine generator and the rest of the 13.8kV system. The utility
disconnect switch must be accessible to National Grid personnel at all times.
1.4.4.3.5 Protective Relay Scheme
The required protective relays for the selected generator interconnection option will be
specified by National Grid based on the results of their system impact study. Based on
the Project Team’s review of the National Grid Interconnection Requirements, it is
anticipated that the protective relay scheme for the interconnection of the wind turbine
generator will include over/under frequency relays, over/under voltage relays, and
overcurrent relays. All relays shall monitor all three phases and the overcurrent
protection should include ground overcurrent relaying. Upon sensing conditions that
exceed allowable operating limits, the protective relay scheme shall send a trip signal to
the appropriate tripping devices to open and disconnect the wind turbine generator from
the rest of the distribution system.
For the interconnection, the protective relaying and controls will curtail the operation of
the wind turbine generator if the electrical connection from the wind turbine generator to
the Tufts Grafton’s distribution system is disrupted. It will be necessary to include
protective relays to sense the amount of power that flows to the system and disconnect
the wind turbine generator if power flows exceed equipment ratings.
Page 42 of 73
Cummings School Wind Turbine Feasibility Study
April 2010
1.4.4.4 Revenue Metering Modifications
For the interconnection it is anticipated that Tufts Grafton will need a meter to measure
the amount of power delivered from the wind turbine generator through the new 13.8kV
interconnection circuitry. This metering is anticipated to be located at the wind turbine
main breaker or the secondary of the dedicated transformer to be installed at the turbine.
It is also anticipated that National Grid will require the existing revenue metering at the
Tufts Grafton main primary switchgear to be modified to allow the measurement of
power flowing to the National Grid Electric 13.8kV system during light load conditions.
1.4.4.5 Electrical Interconnection Cost Estimates
An electrical interconnection cost estimate is provided in this section for the
recommended interconnection of the proposed 1500kW (maximum size) wind turbine
generator.
The planning accuracy cost estimate has been developed for use in the feasibility
analysis. The planning accuracy cost estimate is based on conceptual interconnection
plans for the wind turbine generators and are generally expected to be within an
accuracy of +/-25%. The cost estimate is based on recent project experience and
vendor quotes and could change based on the final design and construction conditions,
including some minor unanticipated site conditions. The electrical construction would
most likely take 2 months and would begin concurrently with the foundation construction
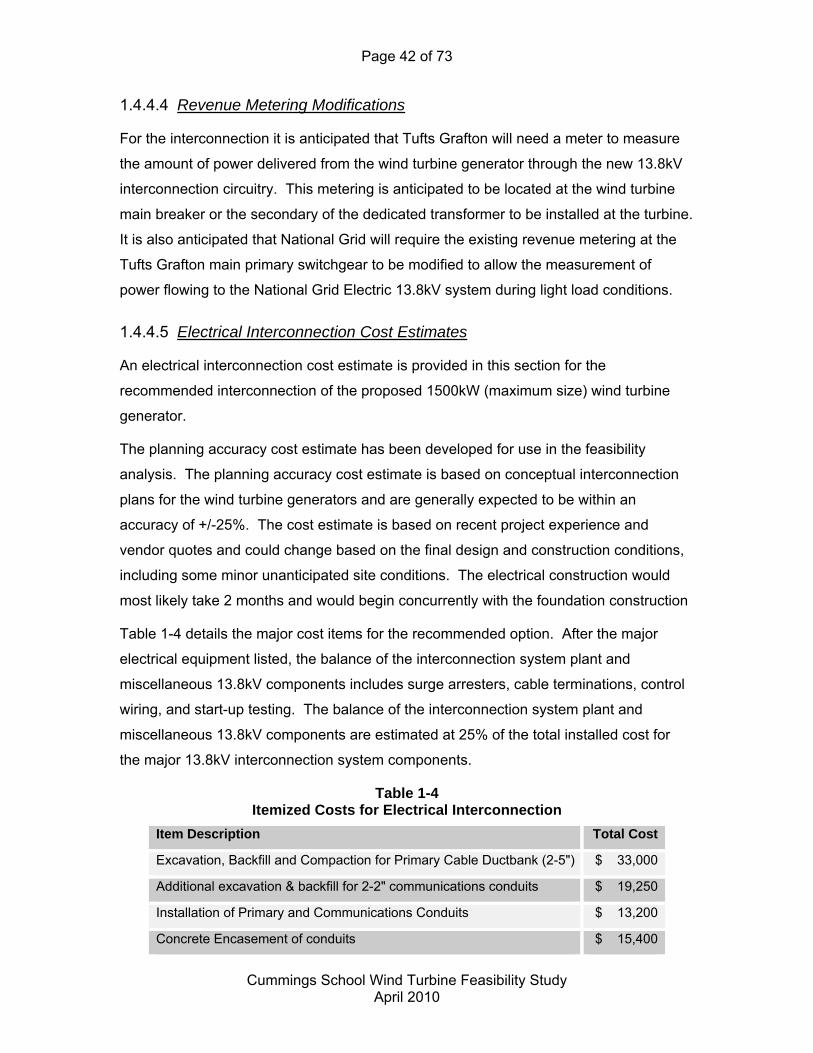
Table 1-4 details the major cost items for the recommended option. After the major
electrical equipment listed, the balance of the interconnection system plant and
miscellaneous 13.8kV components includes surge arresters, cable terminations, control
wiring, and start-up testing. The balance of the interconnection system plant and
miscellaneous 13.8kV components are estimated at 25% of the total installed cost for
the major 13.8kV interconnection system components.
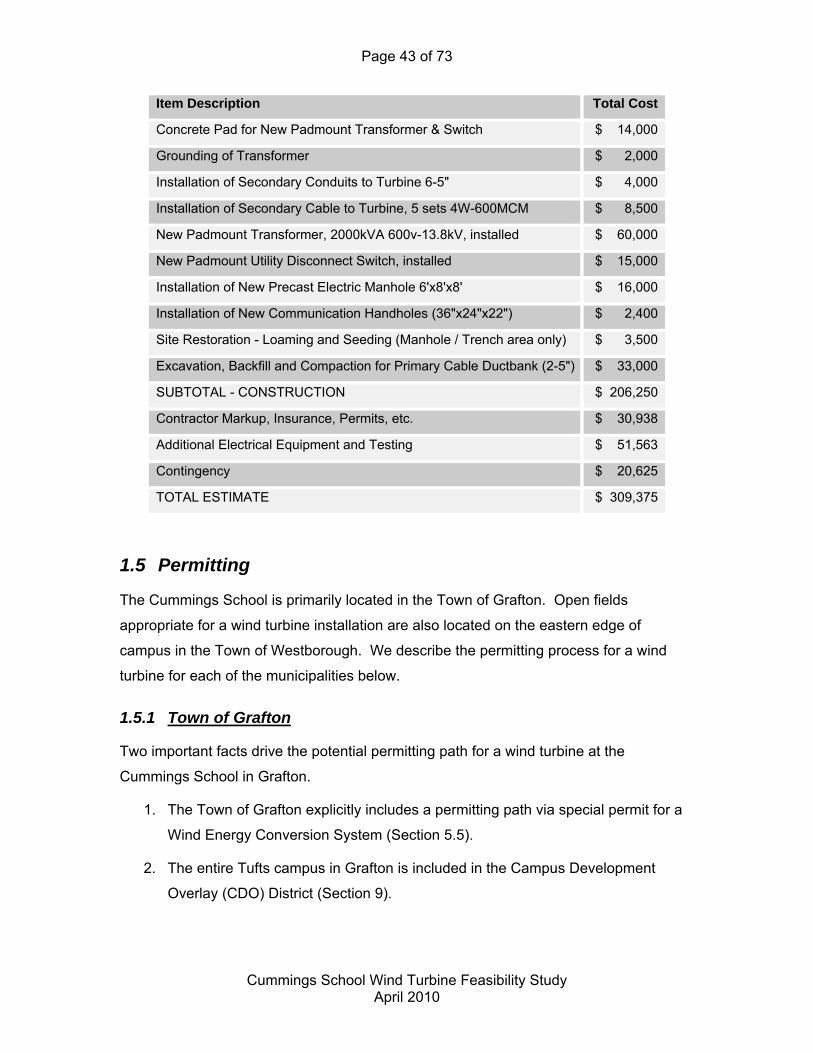
Table 1-4 Itemized Costs for Electrical Interconnection
Item Description Total Cost
Excavation, Backfill and Compaction for Primary Cable Ductbank (2-5") $ 33,000
Additional excavation & backfill for 2-2" communications conduits $ 19,250
Installation of Primary and Communications Conduits $ 13,200
Concrete Encasement of conduits $ 15,400
Page 43 of 73
Cummings School Wind Turbine Feasibility Study
April 2010
Item Description Total Cost
Concrete Pad for New Padmount Transformer & Switch $ 14,000
Grounding of Transformer $ 2,000
Installation of Secondary Conduits to Turbine 6-5" $ 4,000
Installation of Secondary Cable to Turbine, 5 sets 4W-600MCM $ 8,500
New Padmount Transformer, 2000kVA 600v-13.8kV, installed $ 60,000
New Padmount Utility Disconnect Switch, installed $ 15,000
Installation of New Precast Electric Manhole 6'x8'x8' $ 16,000
Installation of New Communication Handholes (36"x24"x22") $ 2,400
Site Restoration - Loaming and Seeding (Manhole / Trench area only) $ 3,500
Excavation, Backfill and Compaction for Primary Cable Ductbank (2-5") $ 33,000
SUBTOTAL - CONSTRUCTION $ 206,250
Contractor Markup, Insurance, Permits, etc. $ 30,938
Additional Electrical Equipment and Testing $ 51,563
Contingency $ 20,625
TOTAL ESTIMATE $ 309,375
1.5 Permitting
The Cummings School is primarily located in the Town of Grafton. Open fields
appropriate for a wind turbine installation are also located on the eastern edge of
campus in the Town of Westborough. We describe the permitting process for a wind
turbine for each of the municipalities below.
1.5.1 Town of Grafton
Two important facts drive the potential permitting path for a wind turbine at the
Cummings School in Grafton.
1. The Town of Grafton explicitly includes a permitting path via special permit for a
Wind Energy Conversion System (Section 5.5).
2. The entire Tufts campus in Grafton is included in the Campus Development
Overlay (CDO) District (Section 9).
Page 44 of 73
Cummings School Wind Turbine Feasibility Study
April 2010
Section 5.5 of the Town of Grafton Zoning By-Law adopted in September 2008 reads as
follows:
5.5 Wind Energy Conversion System
A wind energy conversion system may be built, provided that the height of any tower
plus the radius of any rotor mounted on such tower does not exceed 70 feet above the
ground level base of such tower, and that the distance from the ground level base of the
tower to any property or street line be not less than the sum of the total of the height of
the tower plus the radius of the rotor. The issuance of a special permit for a wind energy
conversion system shall be subject to a finding by the Grafton Planning Board that the
operation of such a system is not likely to cause electromagnetic disturbances for
adjacent properties. The Grafton Planning Board shall require the testimony of a
qualified expert witness to give such assurance and shall further require the applicant for
such a special permit pay for the services of the qualified expert witness.
All wind turbines being considered in this feasibility study far exceed 70 feet to the tip of
the blade. Thus, under normal circumstances a Variance would be required to install a
wind turbine on a non-overlay district parcel.
Section 9.4.E of the CDO, which partially denotes Permitted Uses, can be interpreted to
allow a wind turbine as an accessory use:
9.4.E. Facilities accessory to any of the foregoing, including water, sewage disposal,
drainage, electric, telephone and other utility services; roads, walks, paths, parking
areas and structures, and lighting, directional signage and vehicular services therefore;
grounds maintenance, snow plowing and open space protection; and all structures,
equipment and facilities necessary to any thereof.
The first sentence of Section 9.6.2.2 could be interpreted to allow a wind turbine to
exceed the normal height restrictions, as a modern wind turbine obviously needs to be
built to significant heights to accomplish its intended purpose.
9.6.2.2 Height: No building shall exceed sixty (60) feet in height, except that spires,
water tanks, communication towers, chimneys, exhaust stacks, flagpoles, mechanical
penthouses and other structures normally built above the roof and not devoted to human
occupancy may be erected to such heights as are necessary to accomplish the purpose
they are normally intended to serve. The height of a building shall be the vertical
distance measured from the mean finished grade of the ground adjoining the front of the
Page 45 of 73
Cummings School Wind Turbine Feasibility Study
April 2010
building, as determined by the Inspector of Buildings, to the top of the structure of the
highest occupied floor in the case of a flat roof, to the deck line of a mansard roof, and to
the top of the plate of a gable, hip or gambrel roof. The Planning Board may, by a vote of
at least four (4) members, each of whom is eligible to vote on the project, authorize
deviation from strict compliance with the provision of this section in order to allow a
maximum building height of up to 75 feet, allowing review and where such deviation is in
keeping with the objectives of the zoning bylaw.
No other requirement (e.g., setbacks, ground coverage, buffers / landscaping) appears
to be a significant hurdle for a wind turbine installation.
Nonetheless, to acquire approval may require substantial time and investment by Tufts
as it may require a modification to approved Campus Master Plan, and as recommended
by the Grafton Town Planner, a revision to the Zoning by-law to explicitly permit the
recommended turbine height in the CDO District (see Section 9.6.1.1).
1.5.2 Town of Westborough
The Town of Westborough does not explicitly address wind turbines or wind energy
conversion systems. The land parcel owned by Tufts in Westborough is zoned as
agricultural / open space. The Town of Westborough Zoning Bylaws does allow electric
generation devices, but does not allow structures in non-residential area in excess of 75
feet, as stated in Section 4451.
4451. Structures - Non-Residential Areas. In non-residential areas, no structures
(including but not limited to power generation or communication devices) shall be
permitted with a height in excess of seventy-five (75) feet, nor shall any such structure
be permitted as part of another structure or building with an aggregate height in excess
of seventy-five (75) feet. Structure height is as measured from the ground adjacent to
the structure to the highest point of the structure, including any moving parts or whip
antennae.
In order to permit a wind under an ordinary permitting path, Tufts could pursue a Special
Permit for exceptions (Section 1330a) or if that were rejected, have to pursue a
Variance. Tufts could argue that the current bylaws restrictions on structure height
impose substantial hardship for a wind turbine installation, as defined in Section 1320.
Page 46 of 73
Cummings School Wind Turbine Feasibility Study
April 2010
1320. Variances. To authorize upon appeal, or upon petition with respect to particular
land or structures a variance from the terms of the applicable zoning ordinance or Bylaw
where such permit granting authority specifically finds that owing to circumstances
relating to said conditions, shape or topography of such land or structures and especially
affecting such land or structures, but not affecting generally the zoning district in which it
located, a literal enforcement of the provisions of the ordinance of Bylaw would involve
substantial hardship, financial or otherwise, to the petitioner or appellant and that
desirable relief may be granted without substantial detriment to the public good and
without nullifying or substantially derogating from the intent or purpose of such ordinance
or Bylaw. Except where local ordinances or Bylaws shall expressly permit variances for
use, no variance may authorize a use or activity not otherwise permitted in the district in
which the land or structure is located; provided however, that such variances properly
granted prior to January first, nineteen hundred and seventy-six but limited in time, may
be extended on the same terms and conditions that were in effect for such variance
upon said effective date. The Board of Appeals is hereby authorized to grant use
variances conditioned upon the satisfaction of the criteria for the granting of variances in
this section.
It could be argued that height regulations are not reasonable for modern wind turbines.
1.5.3 Local Permitting Recommendation
The Town of Grafton provides a well defined permitting path for Tufts for a larger scale
wind turbine, which could include modifications and approval to the current Master Plan.
The permitting path for a wind turbine for Tufts is less defined in Westborough but a
Variance likely would be needed, due to the proposed height of the turbine.
The Project Team recommends consulting with the Grafton Town Planner and local legal
counsel to work with the Tufts regarding the optimum approval process for Tufts and
Grafton.
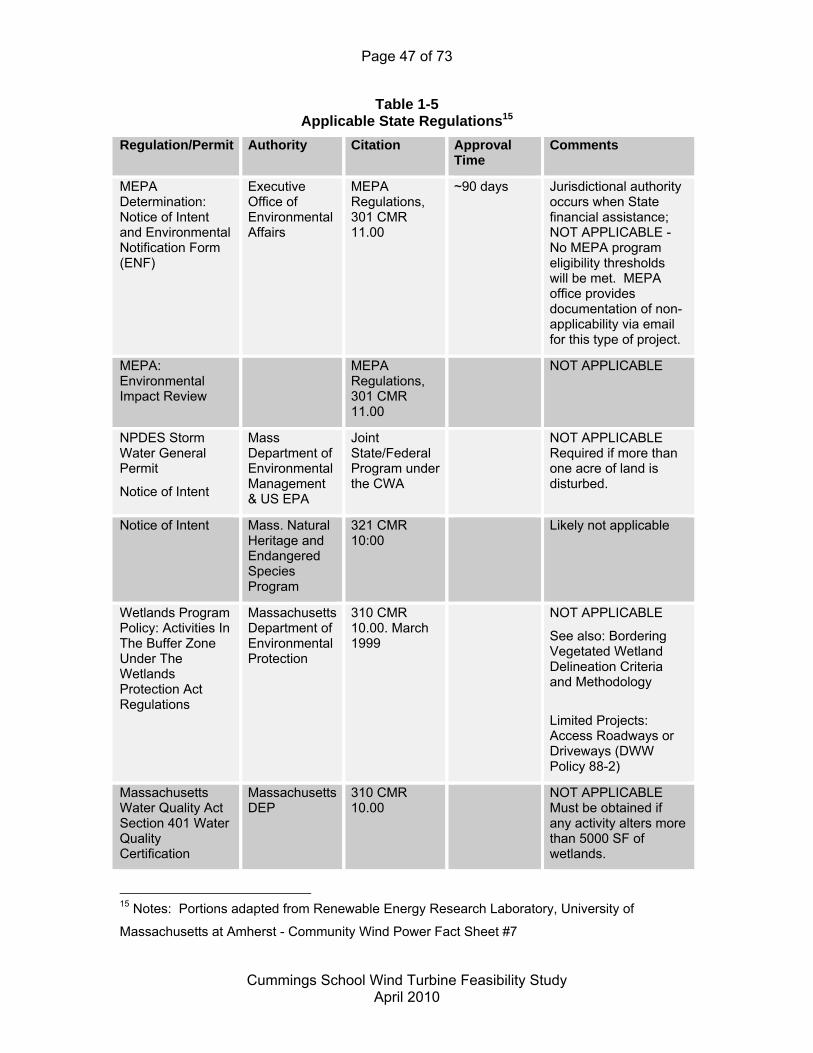
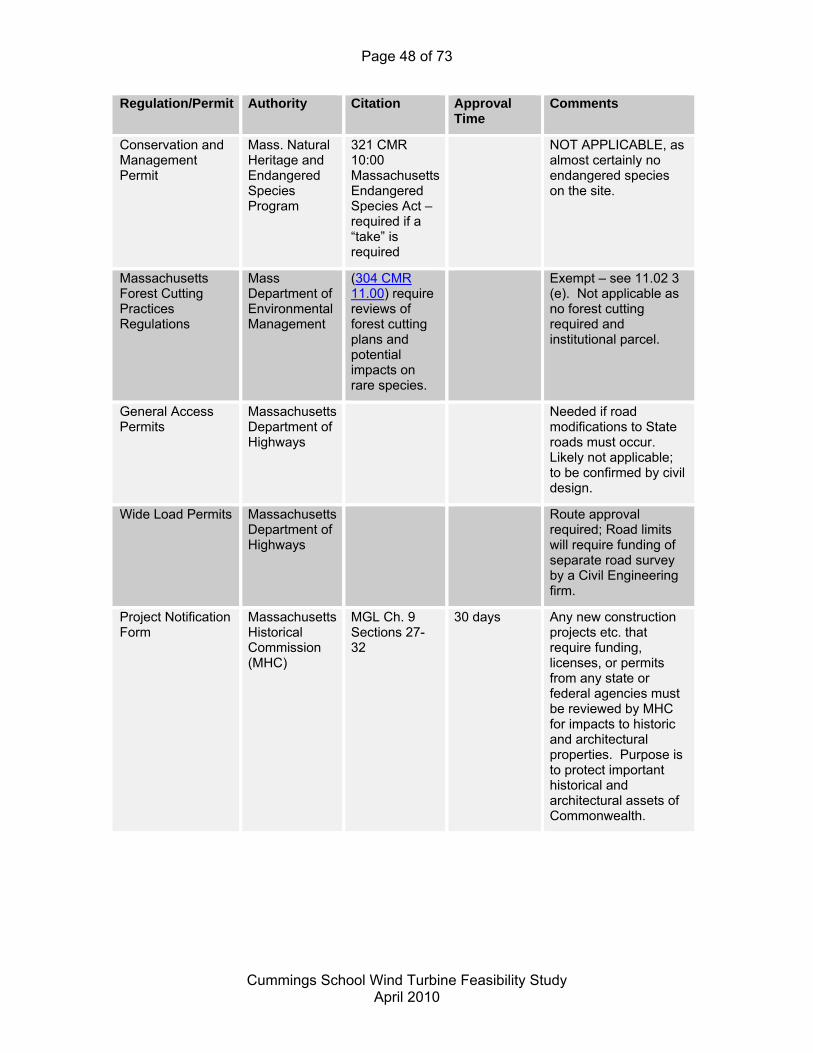
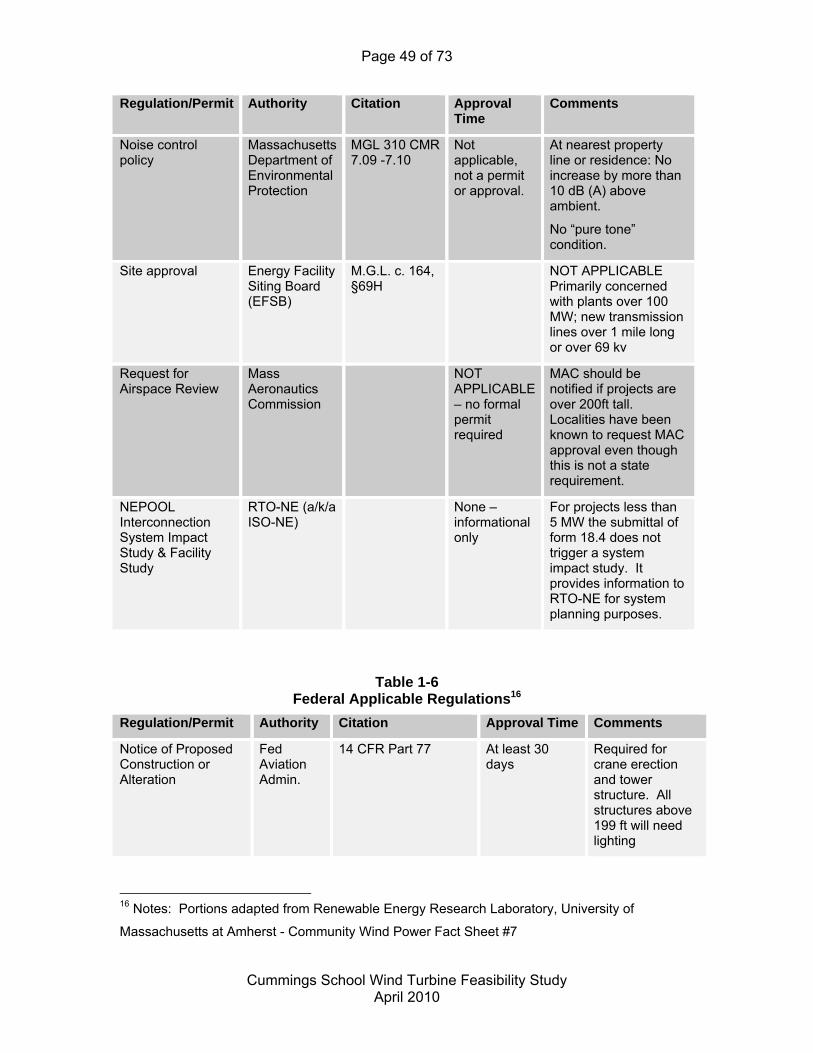
1.5.4 State and Federal Permitting
The Project Team prepared summary permitting tables to identify actual and potential
state and federal requirements, the authority and citation, and permit approval
timeframe, if relevant, as is outlined below:
Page 47 of 73
Cummings School Wind Turbine Feasibility Study
April 2010
Table 1-5 Applicable State Regulations15
Regulation/Permit Authority Citation Approval Time
Comments
MEPA Determination: Notice of Intent and Environmental Notification Form (ENF)
Executive Office of Environmental Affairs
MEPA Regulations, 301 CMR 11.00
~90 days Jurisdictional authority occurs when State financial assistance; NOT APPLICABLE - No MEPA program eligibility thresholds will be met. MEPA office provides documentation of non-applicability via email for this type of project.
MEPA: Environmental Impact Review
MEPA Regulations, 301 CMR 11.00
NOT APPLICABLE
NPDES Storm Water General Permit
Notice of Intent
Mass Department of Environmental Management & US EPA
Joint State/Federal Program under the CWA
NOT APPLICABLE Required if more than one acre of land is disturbed.
Notice of Intent Mass. Natural Heritage and Endangered Species Program
321 CMR 10:00
Likely not applicable
Wetlands Program Policy: Activities In The Buffer Zone Under The Wetlands Protection Act Regulations
Massachusetts Department of Environmental Protection
310 CMR 10.00. March 1999
NOT APPLICABLE
See also: Bordering Vegetated Wetland Delineation Criteria and Methodology
Limited Projects: Access Roadways or Driveways (DWW Policy 88-2)
Massachusetts Water Quality Act Section 401 Water Quality Certification
Massachusetts DEP
310 CMR 10.00
NOT APPLICABLE Must be obtained if any activity alters more than 5000 SF of wetlands.
15 Notes: Portions adapted from Renewable Energy Research Laboratory, University of
Massachusetts at Amherst - Community Wind Power Fact Sheet #7
Page 48 of 73
Cummings School Wind Turbine Feasibility Study
April 2010
Regulation/Permit Authority Citation Approval Time
Comments
Conservation and Management Permit
Mass. Natural Heritage and Endangered Species Program
321 CMR 10:00 Massachusetts Endangered Species Act – required if a “take” is required
NOT APPLICABLE, as almost certainly no endangered species on the site.
Massachusetts Forest Cutting Practices Regulations
Mass Department of Environmental Management
(304 CMR 11.00) require reviews of forest cutting plans and potential impacts on rare species.
Exempt – see 11.02 3 (e). Not applicable as no forest cutting required and institutional parcel.
General Access Permits
Massachusetts Department of Highways
Needed if road modifications to State roads must occur. Likely not applicable; to be confirmed by civil design.
Wide Load Permits Massachusetts Department of Highways
Route approval required; Road limits will require funding of separate road survey by a Civil Engineering firm.
Project Notification Form
Massachusetts Historical Commission (MHC)
MGL Ch. 9 Sections 27-32
30 days Any new construction projects etc. that require funding, licenses, or permits from any state or federal agencies must be reviewed by MHC for impacts to historic and architectural properties. Purpose is to protect important historical and architectural assets of Commonwealth.
Page 49 of 73
Cummings School Wind Turbine Feasibility Study
April 2010
Regulation/Permit Authority Citation Approval Time
Comments
Noise control policy
Massachusetts Department of Environmental Protection
MGL 310 CMR 7.09 -7.10
Not applicable, not a permit or approval.
At nearest property line or residence: No increase by more than 10 dB (A) above ambient.
No “pure tone” condition.
Site approval Energy Facility Siting Board (EFSB)
M.G.L. c. 164, §69H
NOT APPLICABLE Primarily concerned with plants over 100 MW; new transmission lines over 1 mile long or over 69 kv
Request for Airspace Review
Mass Aeronautics Commission
NOT APPLICABLE – no formal permit required
MAC should be notified if projects are over 200ft tall. Localities have been known to request MAC approval even though this is not a state requirement.
NEPOOL Interconnection System Impact Study & Facility Study
RTO-NE (a/k/a ISO-NE)
None – informational only
For projects less than 5 MW the submittal of form 18.4 does not trigger a system impact study. It provides information to RTO-NE for system planning purposes.
Table 1-6 Federal Applicable Regulations16
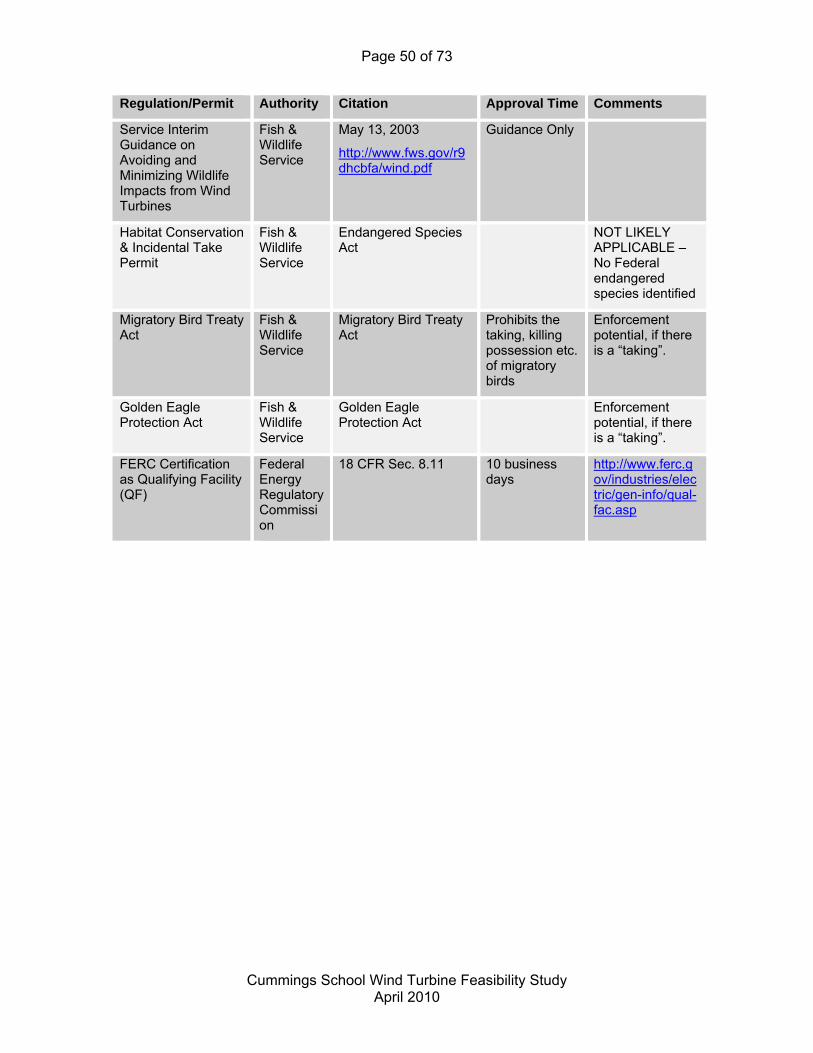
Regulation/Permit Authority Citation Approval Time Comments
Notice of Proposed Construction or Alteration
Fed Aviation Admin.
14 CFR Part 77 At least 30 days
Required for crane erection and tower structure. All structures above 199 ft will need lighting
16 Notes: Portions adapted from Renewable Energy Research Laboratory, University of
Massachusetts at Amherst - Community Wind Power Fact Sheet #7
Page 50 of 73
Cummings School Wind Turbine Feasibility Study
April 2010
Regulation/Permit Authority Citation Approval Time Comments
Service Interim Guidance on Avoiding and Minimizing Wildlife Impacts from Wind Turbines
Fish & Wildlife Service
May 13, 2003
http://www.fws.gov/r9dhcbfa/wind.pdf
Guidance Only
Habitat Conservation & Incidental Take Permit
Fish & Wildlife Service
Endangered Species Act
NOT LIKELY APPLICABLE – No Federal endangered species identified
Migratory Bird Treaty Act
Fish & Wildlife Service
Migratory Bird Treaty Act
Prohibits the taking, killing possession etc. of migratory birds
Enforcement potential, if there is a “taking”.
Golden Eagle Protection Act
Fish & Wildlife Service
Golden Eagle Protection Act
Enforcement potential, if there is a “taking”.
FERC Certification as Qualifying Facility (QF)
Federal Energy Regulatory Commission
18 CFR Sec. 8.11 10 business days
http://www.ferc.gov/industries/electric/gen-info/qual-fac.asp
Page 51 of 73
Cummings School Wind Turbine Feasibility Study
April 2010
2 Economic Feasibility Analysis
This section provides analysis on the economic viability of installing a wind turbine at the
Cummings School. First, it will describe the costs, financing options, and benefits of
installing a wind turbine onsite. It then will combine these factors and analyze scenarios
to provide the realistic net benefits for a wind turbine installation, concluding with
recommendations of next steps.
2.1 Costs for Major Scenarios
2.1.1 Capital Costs
The capital costs for wind turbines are substantial. In the 225 kW to 1.5 MW capacity
costs range from $3,000/kW to $4,400/kW installed.
Major categories of costs include17:
Turbine
o Turbine and Tower
o Freight
o FAA Lighting
Balance of Plant
o Site Development
o Pad Mount Transformer
o Concrete and Rebar
o Foundation Labor
o Tower Imbeds / Bolts
o Cranes, Crane & Erection Labor
o Construction Supervision
17 Adapted from “A Comparative Analysis of Community Wind Power Development Options in
Oregon”, July 2004. “Community Wind” development refers to installations that are of utility
scale, but smaller than most wind farms (i.e., 500 kW to 20,000 kW projects).
Page 52 of 73
Cummings School Wind Turbine Feasibility Study
April 2010
o Monitoring and Control System
Interconnection
o High Voltage Line Extension
o Interconnection and Metering
o Electrical Labor
Soft Costs
o Legal
o Permitting
o Development & Engineering
o Insurance
o Meteorological Tower and Feasibility Study
o Contingencies
We estimate capital costs will be somewhat higher than is generally described in
industry publications and papers because:
Most estimates assume larger wind farm installations where fixed costs can be
spread over many more turbines.
The complexity of the electrical system and more stringent Massachusetts
requirements result in higher interconnection costs than is commonly estimated.
The high demand for wind turbines in the U.S. and internationally has increased
turbine and ancillary equipment prices.
The high cost of steel has increased the cost of the tower and structural costs
(e.g., rebar in foundation).
Construction costs are typically higher in the northeastern U.S. as compared to
the rest of the country.
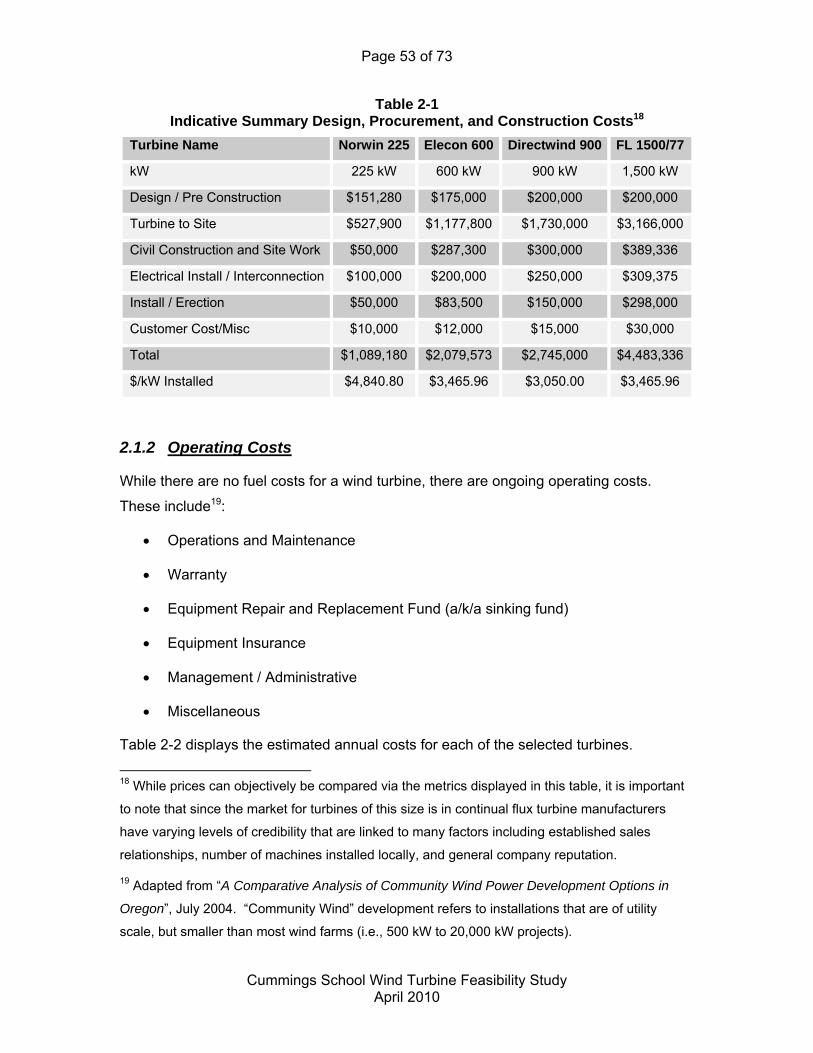
Table 2-1 displays estimated total installed costs for a subset of representative turbines
for a single turbine project. These costs come from recent manufacturer bids and
publicly available proposals for similar projects. In many cases, the economies of scale
are readily apparent.
Page 53 of 73
Cummings School Wind Turbine Feasibility Study
April 2010
Table 2-1 Indicative Summary Design, Procurement, and Construction Costs18
Turbine Name Norwin 225 Elecon 600 Directwind 900 FL 1500/77
kW 225 kW 600 kW 900 kW 1,500 kW
Design / Pre Construction $151,280 $175,000 $200,000 $200,000
Turbine to Site $527,900 $1,177,800 $1,730,000 $3,166,000
Civil Construction and Site Work $50,000 $287,300 $300,000 $389,336
Electrical Install / Interconnection $100,000 $200,000 $250,000 $309,375
Install / Erection $50,000 $83,500 $150,000 $298,000
Customer Cost/Misc $10,000 $12,000 $15,000 $30,000
Total $1,089,180 $2,079,573 $2,745,000 $4,483,336
$/kW Installed $4,840.80 $3,465.96 $3,050.00 $3,465.96
2.1.2 Operating Costs
While there are no fuel costs for a wind turbine, there are ongoing operating costs.
These include19:
Operations and Maintenance
Warranty
Equipment Repair and Replacement Fund (a/k/a sinking fund)
Equipment Insurance
Management / Administrative
Miscellaneous
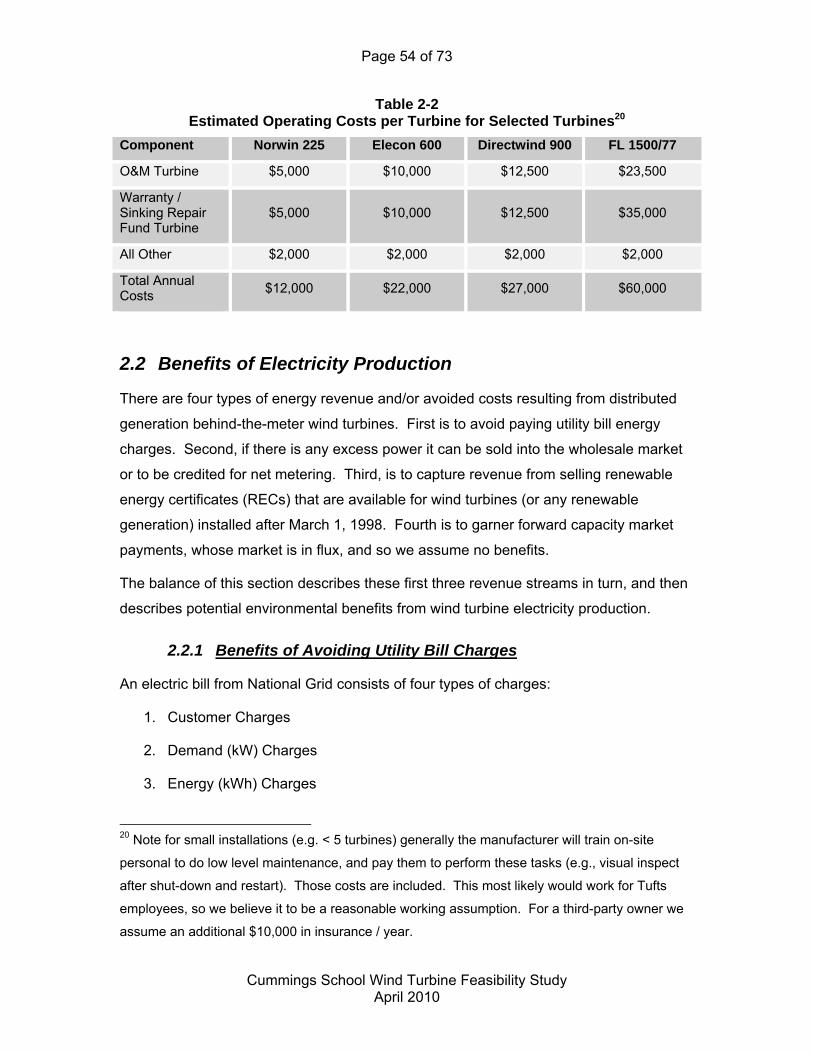
Table 2-2 displays the estimated annual costs for each of the selected turbines.
18 While prices can objectively be compared via the metrics displayed in this table, it is important
to note that since the market for turbines of this size is in continual flux turbine manufacturers
have varying levels of credibility that are linked to many factors including established sales
relationships, number of machines installed locally, and general company reputation.
19 Adapted from “A Comparative Analysis of Community Wind Power Development Options in
Oregon”, July 2004. “Community Wind” development refers to installations that are of utility
scale, but smaller than most wind farms (i.e., 500 kW to 20,000 kW projects).
Page 54 of 73
Cummings School Wind Turbine Feasibility Study
April 2010
Table 2-2 Estimated Operating Costs per Turbine for Selected Turbines20
Component Norwin 225 Elecon 600 Directwind 900 FL 1500/77
O&M Turbine $5,000 $10,000 $12,500 $23,500
Warranty / Sinking Repair Fund Turbine
$5,000 $10,000 $12,500 $35,000
All Other $2,000 $2,000 $2,000 $2,000
Total Annual Costs
$12,000 $22,000 $27,000 $60,000
2.2 Benefits of Electricity Production
There are four types of energy revenue and/or avoided costs resulting from distributed
generation behind-the-meter wind turbines. First is to avoid paying utility bill energy
charges. Second, if there is any excess power it can be sold into the wholesale market
or to be credited for net metering. Third, is to capture revenue from selling renewable
energy certificates (RECs) that are available for wind turbines (or any renewable
generation) installed after March 1, 1998. Fourth is to garner forward capacity market
payments, whose market is in flux, and so we assume no benefits.
The balance of this section describes these first three revenue streams in turn, and then
describes potential environmental benefits from wind turbine electricity production.
2.2.1 Benefits of Avoiding Utility Bill Charges
An electric bill from National Grid consists of four types of charges:
1. Customer Charges
2. Demand (kW) Charges
3. Energy (kWh) Charges
20 Note for small installations (e.g. < 5 turbines) generally the manufacturer will train on-site
personal to do low level maintenance, and pay them to perform these tasks (e.g., visual inspect
after shut-down and restart). Those costs are included. This most likely would work for Tufts
employees, so we believe it to be a reasonable working assumption. For a third-party owner we
assume an additional $10,000 in insurance / year.
Page 55 of 73
Cummings School Wind Turbine Feasibility Study
April 2010
4. Other (e.g., metering, interconnection study)
Customer, demand, and “other” charges all are considered purely utility “wire charges”
and generally are not offset by the installation of a wind turbine. The energy charges are
a mixture of “wire” and “generation” charges, and are offset by the installation of a wind
turbine.
The above charges (e.g., demand-kW, energy-kWh) are assessed for various “services”
and include:
Generation. Generation services currently can be purchased in two different
ways. They are:
1. Basic Service; and,
2. Competitive supply service (e.g., Dominion, Constellation NewEnergy, ConEd
Solutions21, etc.); and,
Distribution;
Transmission;
Competitive transition (i.e., stranded costs);
Energy efficiency; and,
Renewable energy fund.
Unless a customer opts to totally disconnect from the grid and rely on a combination of
wind turbines and other sources of electricity (e.g., photovoltaics, banks of batteries,
micro-turbines), they cannot avoid monthly customer charges nor demand (kW) charges.
What can be avoided (in part) by the installation of a wind turbine are energy charges22.
The amount of energy charges a customer pays on the utility bill varies by their location,
rate class and consumption patterns.
21 Currently Tufts has a generation supply contract with TransCanada. The price paid is fixed
rate of 9.474 cents/kWh primarily plus ISO-NE adders for congestion, reliability must run charges,
and capacity charges based on kW draw, not kWh consumption.
22 Including a “wires” portion, e.g. the kWh portion of the transmission and distribution charges,
but not the kW portion of the transmission and distribution charges.
Page 56 of 73
Cummings School Wind Turbine Feasibility Study
April 2010
2.2.1.1 No Implementation of “Standby” Generation Charges
Many utilities impose “standby” generation charges on customers that install on-site
generation. Currently National Grid imposes no standby charges. It is very unlikely
National Grid will ever try to impose standby charges on renewable generation wind
projects, and even less likely that the request would be accepted by the Department by
the Public Utilities.
2.2.2 Value of Net Metered Electricity
The 2008 legislation The Green Communities Act (S. 2768) outlines three general
classes for net metering. A Class I facility is defined as a plant or equipment (not a
transmission facility) that is used to produce or generate electricity with a capacity of
fewer than 60 KW. A Class II facility is defined as a solar, wind, or agricultural net
metering facility whose generating capacity is greater than 60 KW but less than or equal
to 1 MW. A Class III facility is a wind, solar, or agricultural net metering facility with a
generating capacity of greater than 1MW but less than 2MW. A neighborhood net
metering facility is a Class I, II, or III net metering facility that is owned by 10 or more
residential customers who live in the same neighborhood and are served by the same
distribution company; and is located within the same neighborhood as those who own or
are served by the facility.
For all three classes, the credits received depend upon categories listed in Table 2-3. If
there is sufficient on-site annual consumption, then all of the turbine’s excess generation
can be assigned to the host utility account. If there is not enough on-site annual
consumption, net metering credits may be assigned to other accounts (including those
not owned by the turbine producer) within the same ISO-NE load zone and utility service
territory. So if a project owner does not have enough generation to utilize all the net
metering credits, then they may have to set up one or more separate bi-lateral
transactions to assign the credits to other account holders (in the same service territory
and load zone). The value of these bi-lateral deals is whatever is negotiated.
For Class III projects, the utility has the option of to just pay the net metering project
owner. Total projects eligible for net metering are capped at 1% of a utility’s peak load,
approximately 47 MWs for National Grid.
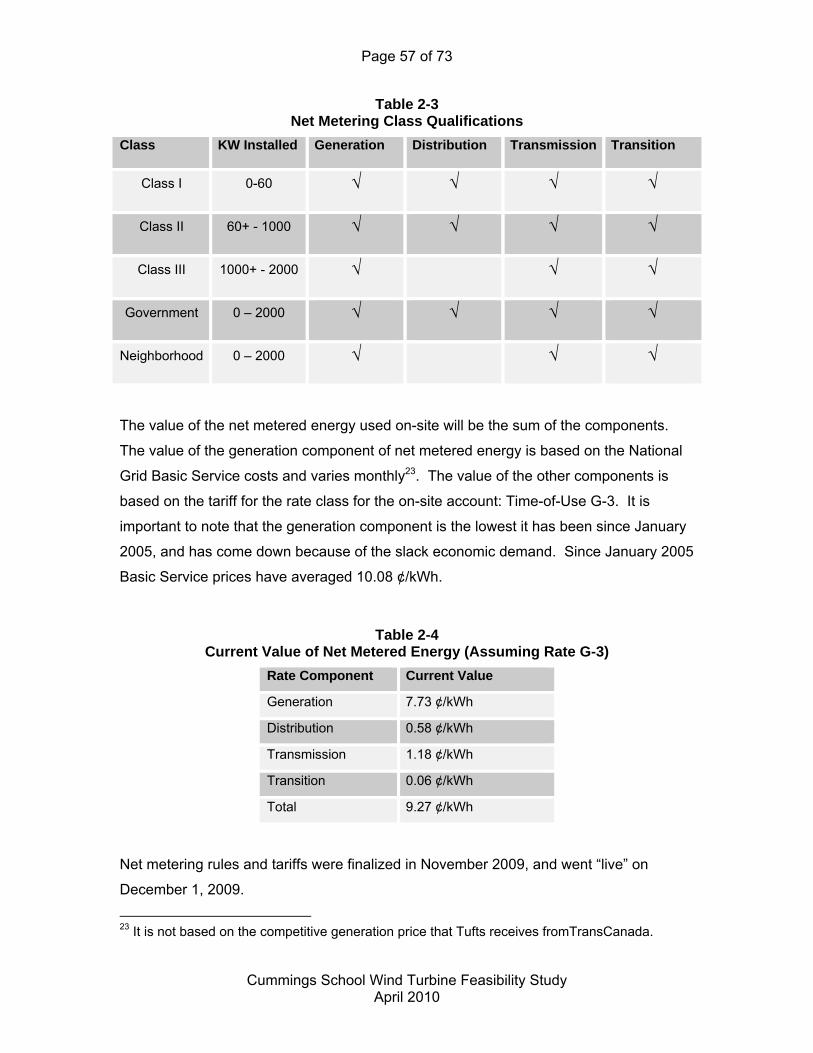
Page 57 of 73
Cummings School Wind Turbine Feasibility Study
April 2010
Table 2-3 Net Metering Class Qualifications
Class KW Installed Generation Distribution Transmission Transition
Class I 0-60 √ √ √ √
Class II 60+ - 1000 √ √ √ √
Class III 1000+ - 2000 √ √ √
Government 0 – 2000 √ √ √ √
Neighborhood 0 – 2000 √ √ √
The value of the net metered energy used on-site will be the sum of the components.
The value of the generation component of net metered energy is based on the National
Grid Basic Service costs and varies monthly23. The value of the other components is
based on the tariff for the rate class for the on-site account: Time-of-Use G-3. It is
important to note that the generation component is the lowest it has been since January
2005, and has come down because of the slack economic demand. Since January 2005
Basic Service prices have averaged 10.08 ¢/kWh.
Table 2-4 Current Value of Net Metered Energy (Assuming Rate G-3)
Rate Component Current Value
Generation 7.73 ¢/kWh
Distribution 0.58 ¢/kWh
Transmission 1.18 ¢/kWh
Transition 0.06 ¢/kWh
Total 9.27 ¢/kWh
Net metering rules and tariffs were finalized in November 2009, and went “live” on
December 1, 2009.
23 It is not based on the competitive generation price that Tufts receives fromTransCanada.
Page 58 of 73
Cummings School Wind Turbine Feasibility Study
April 2010
2.2.3 Protection from Volatile Electric Rates
For as long as the wind turbine is utilized, its fuel costs will be zero. This is in contrast to
highly volatile natural gas, fuel oil and electricity prices. A distributed generation wind
turbine can provide much of the energy currently consumed on-site (the most likely
sizing will be between 50% and 250% of current on-site consumption) though, as
discussed above, some will be consumed on-site and some will be exported back to the
grid. Regardless, any significant turbine project will dampen the risk associated with
volatile energy prices, and make budgeting and forecasting of energy operating costs
more certain.
School electric costs are to a large degree based on retail generation costs which are, in
turn, linked to wholesale generation costs.
As seen in Figure 2-1, the average hourly wholesale locational real time price for the
Northeast Massachusetts region (NEMA) of ISO-NE (the electric grid operator) has
fluctuated widely. The price spike in 2005 caused by the effects of Hurricane Katrina
and 2008 when commodity natural gas prices were surging (the biggest factor affecting
New England wholesale electric prices) can be easily seen, as can be the large
decrease in the most current prices caused by the economic slow-down. The average
wholesale price for the most recent twelve months was 7.37 ¢/kWh. In the near future, it
is likely that short-term electric prices will be depressed. With an economic recovery
prices will almost certainly rise, but to what degree is uncertain.
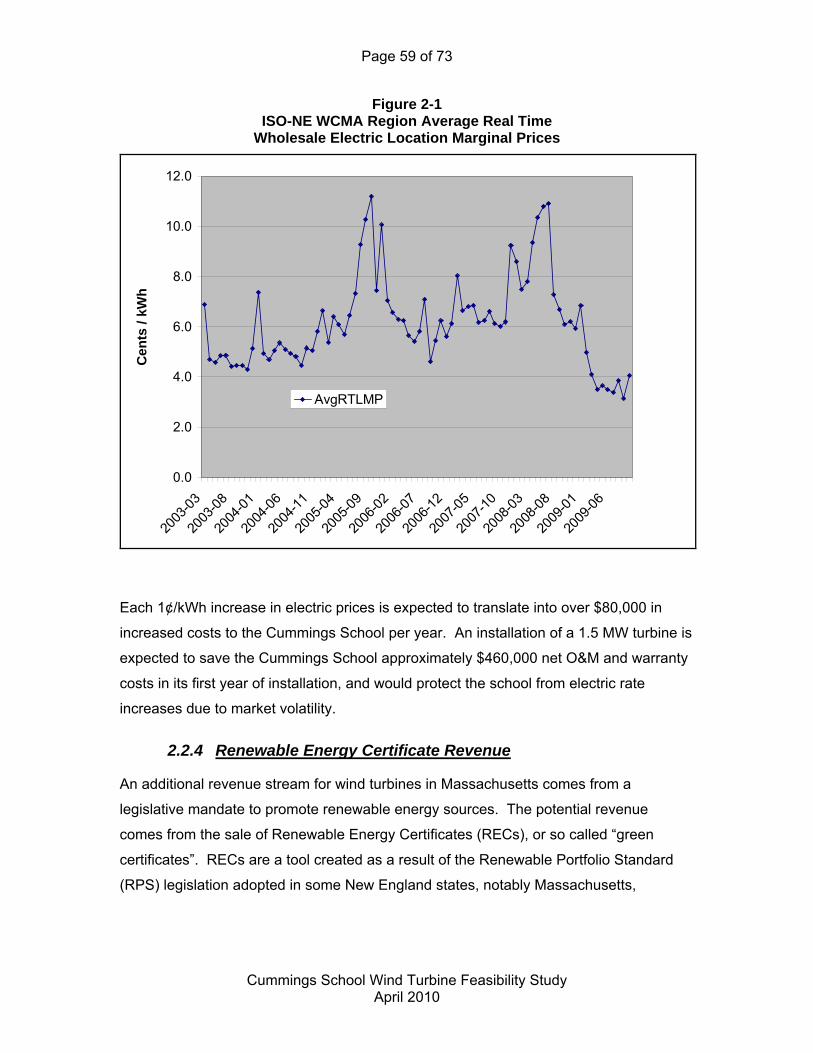
Page 59 of 73
Cummings School Wind Turbine Feasibility Study
April 2010
Figure 2-1 ISO-NE WCMA Region Average Real Time
Wholesale Electric Location Marginal Prices
0.0
2.0
4.0
6.0
8.0
10.0
12.0
2003
-03
2003
-08
2004
-01
2004
-06
2004
-11
2005
-04
2005
-09
2006
-02
2006
-07
2006
-12
2007
-05
2007
-10
2008
-03
2008
-08
2009
-01
2009
-06
Cen
ts /
kW
h
AvgRTLMP
Each 1¢/kWh increase in electric prices is expected to translate into over $80,000 in
increased costs to the Cummings School per year. An installation of a 1.5 MW turbine is
expected to save the Cummings School approximately $460,000 net O&M and warranty
costs in its first year of installation, and would protect the school from electric rate
increases due to market volatility.
2.2.4 Renewable Energy Certificate Revenue
An additional revenue stream for wind turbines in Massachusetts comes from a
legislative mandate to promote renewable energy sources. The potential revenue
comes from the sale of Renewable Energy Certificates (RECs), or so called “green
certificates”. RECs are a tool created as a result of the Renewable Portfolio Standard
(RPS) legislation adopted in some New England states, notably Massachusetts,

Page 60 of 73
Cummings School Wind Turbine Feasibility Study
April 2010
Connecticut, Rhode Island, and most recently New Hampshire and Maine. Vermont has
a RPS, but in practice it does not promote new renewable projects to a great degree24.
Accounting for RECs is the method to certify compliance with an RPS. The primary
purpose of the RPS legislation is to create demand and financial support for new
renewable electric generation sources which have significantly fewer environmental
impacts than traditional fossil fuel based generation and which help diversify the
domestic electricity generation mix thereby leading to greater long-term price stability.
The Massachusetts RPS mandates that 1% of all in-state investor owned utility service
territory (i.e., National Grid, NStar Electric, Unitil, and Western Mass Electric) electric
consumption come from new (post-1997) renewable resources by 2003. These levels
increased by 0.5% each year through 2009, and will increase by 1% for each year from
2010 through 2020 for a total of 15%. Connecticut, Rhode Island and New Hampshire
have similar requirements in place for in-state electricity consumption.
The alternative compliance payment (ACP, i.e., penalty) for an electricity supplier not
reaching these mandates in 2009 is $60.92/MWh for Massachusetts, Maine, New
Hampshire, and Rhode Island eligible projects and $55/MWh for Connecticut eligible
projects. The ACP in Massachusetts, Maine, New Hampshire and Rhode Island is
adjusted for inflation25.
Energy used onsite from the wind turbine can be used to satisfy the Massachusetts and
Connecticut26 RPSs. Energy that is not used onsite, and is from a project that is
deemed to be a wholesale generator, would be eligible to create RECs to satisfy any
state RPS in New England.
2.2.4.1 REC Prices
REC prices are driven by a combination of actual and anticipated supply and demand,
the ACP levels and, importantly, state rules regarding eligibility which affect both supply
24 New Hampshire, Maine and Rhode Island have the same Alternative Compliance Payment
(ACP) for Class I renewables (which includes wind) as Massachusetts.
25 The Connecticut ACP is not adjusted for inflation.
26 Massachusetts and Connecticut are the only New England states that allow out-of-state,
behind-the-meter generation to be eligible for their RPS.
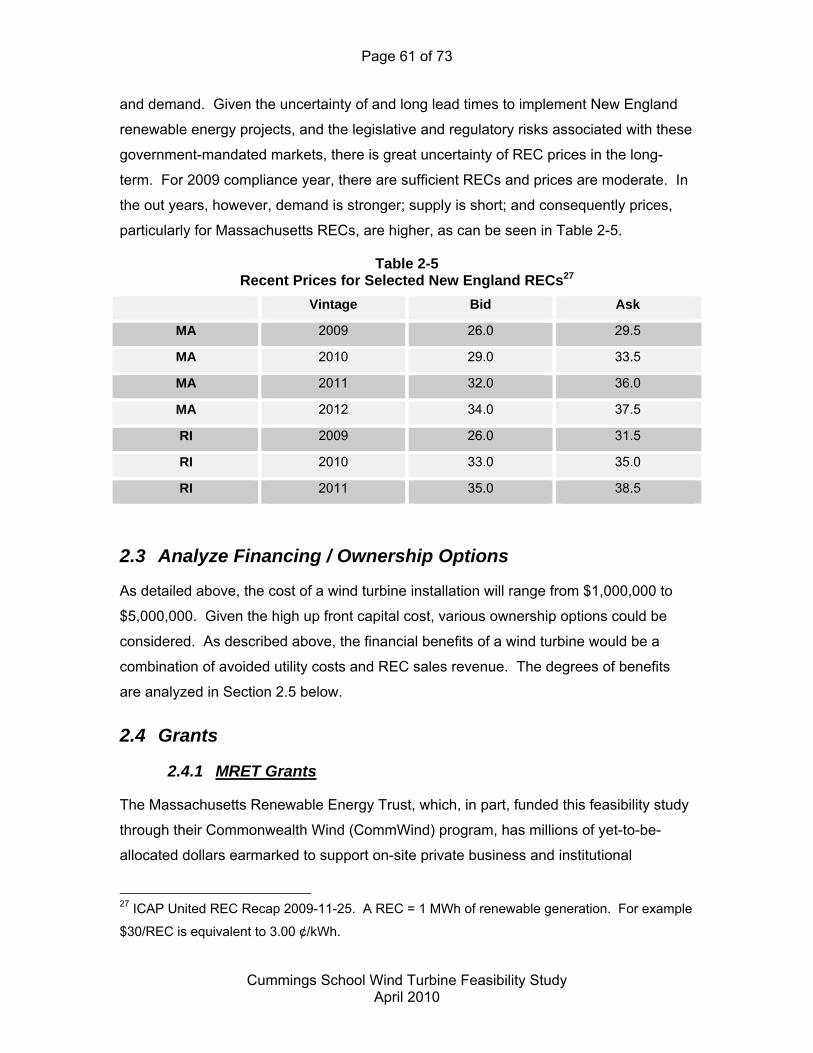
Page 61 of 73
Cummings School Wind Turbine Feasibility Study
April 2010
and demand. Given the uncertainty of and long lead times to implement New England
renewable energy projects, and the legislative and regulatory risks associated with these
government-mandated markets, there is great uncertainty of REC prices in the long-
term. For 2009 compliance year, there are sufficient RECs and prices are moderate. In
the out years, however, demand is stronger; supply is short; and consequently prices,
particularly for Massachusetts RECs, are higher, as can be seen in Table 2-5.
Table 2-5 Recent Prices for Selected New England RECs27
Vintage Bid Ask
MA 2009 26.0 29.5
MA 2010 29.0 33.5
MA 2011 32.0 36.0
MA 2012 34.0 37.5
RI 2009 26.0 31.5
RI 2010 33.0 35.0
RI 2011 35.0 38.5
2.3 Analyze Financing / Ownership Options
As detailed above, the cost of a wind turbine installation will range from $1,000,000 to
$5,000,000. Given the high up front capital cost, various ownership options could be
considered. As described above, the financial benefits of a wind turbine would be a
combination of avoided utility costs and REC sales revenue. The degrees of benefits
are analyzed in Section 2.5 below.
2.4 Grants
2.4.1 MRET Grants
The Massachusetts Renewable Energy Trust, which, in part, funded this feasibility study
through their Commonwealth Wind (CommWind) program, has millions of yet-to-be-
allocated dollars earmarked to support on-site private business and institutional
27 ICAP United REC Recap 2009-11-25. A REC = 1 MWh of renewable generation. For example
$30/REC is equivalent to 3.00 ¢/kWh.
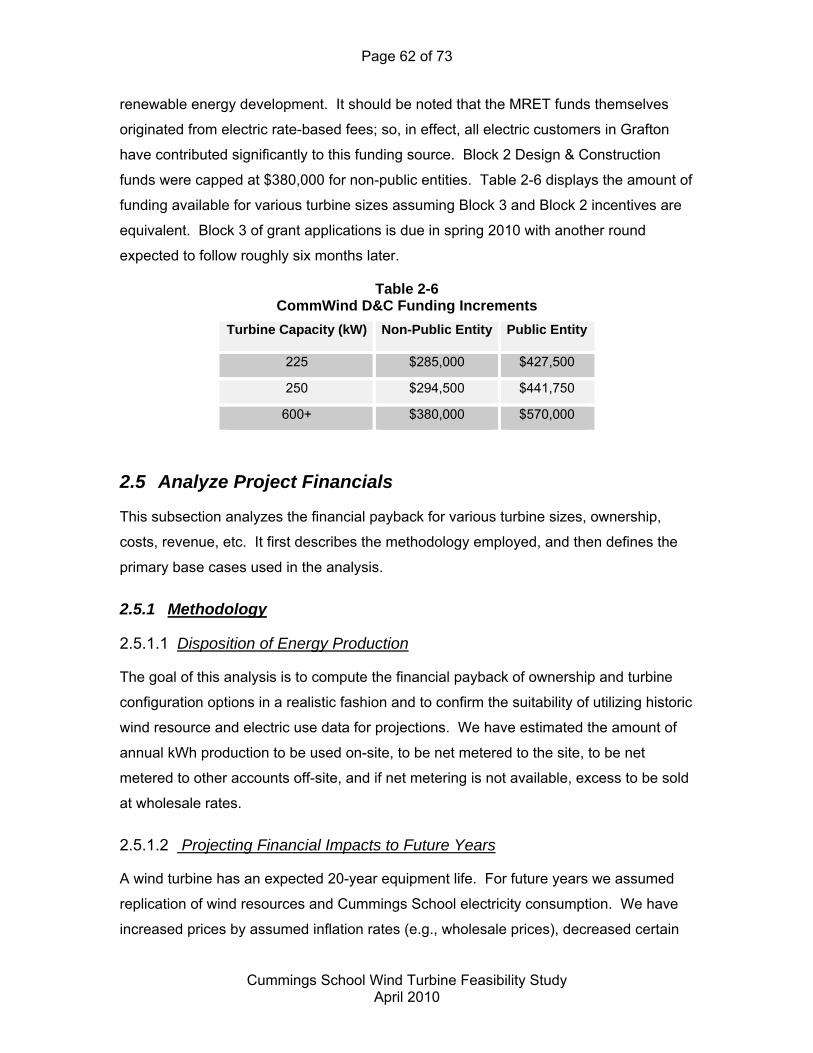
Page 62 of 73
Cummings School Wind Turbine Feasibility Study
April 2010
renewable energy development. It should be noted that the MRET funds themselves
originated from electric rate-based fees; so, in effect, all electric customers in Grafton
have contributed significantly to this funding source. Block 2 Design & Construction
funds were capped at $380,000 for non-public entities. Table 2-6 displays the amount of
funding available for various turbine sizes assuming Block 3 and Block 2 incentives are
equivalent. Block 3 of grant applications is due in spring 2010 with another round
expected to follow roughly six months later.
Table 2-6 CommWind D&C Funding Increments
Turbine Capacity (kW) Non-Public Entity Public Entity
225 $285,000 $427,500
250 $294,500 $441,750
600+ $380,000 $570,000
2.5 Analyze Project Financials
This subsection analyzes the financial payback for various turbine sizes, ownership,
costs, revenue, etc. It first describes the methodology employed, and then defines the
primary base cases used in the analysis.
2.5.1 Methodology
2.5.1.1 Disposition of Energy Production
The goal of this analysis is to compute the financial payback of ownership and turbine
configuration options in a realistic fashion and to confirm the suitability of utilizing historic
wind resource and electric use data for projections. We have estimated the amount of
annual kWh production to be used on-site, to be net metered to the site, to be net
metered to other accounts off-site, and if net metering is not available, excess to be sold
at wholesale rates.
2.5.1.2 Projecting Financial Impacts to Future Years
A wind turbine has an expected 20-year equipment life. For future years we assumed
replication of wind resources and Cummings School electricity consumption. We have
increased prices by assumed inflation rates (e.g., wholesale prices), decreased certain
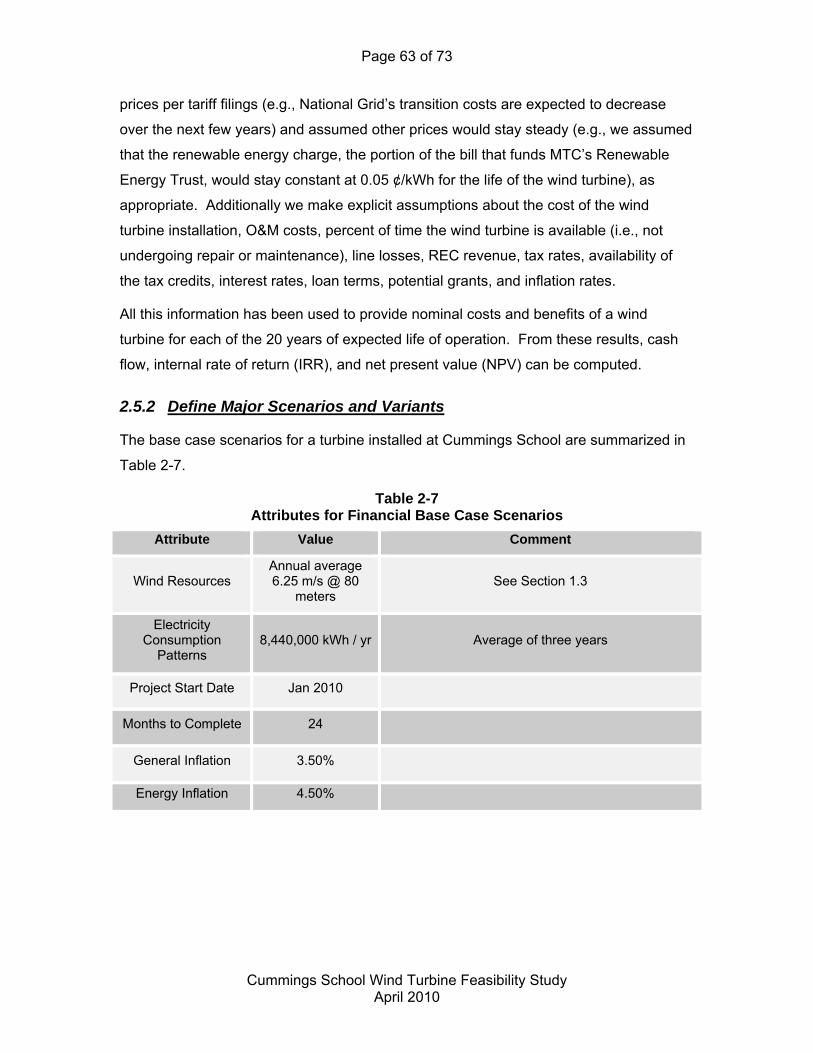
Page 63 of 73
Cummings School Wind Turbine Feasibility Study
April 2010
prices per tariff filings (e.g., National Grid’s transition costs are expected to decrease
over the next few years) and assumed other prices would stay steady (e.g., we assumed
that the renewable energy charge, the portion of the bill that funds MTC’s Renewable
Energy Trust, would stay constant at 0.05 ¢/kWh for the life of the wind turbine), as
appropriate. Additionally we make explicit assumptions about the cost of the wind
turbine installation, O&M costs, percent of time the wind turbine is available (i.e., not
undergoing repair or maintenance), line losses, REC revenue, tax rates, availability of
the tax credits, interest rates, loan terms, potential grants, and inflation rates.
All this information has been used to provide nominal costs and benefits of a wind
turbine for each of the 20 years of expected life of operation. From these results, cash
flow, internal rate of return (IRR), and net present value (NPV) can be computed.
2.5.2 Define Major Scenarios and Variants
The base case scenarios for a turbine installed at Cummings School are summarized in
Table 2-7.
Table 2-7 Attributes for Financial Base Case Scenarios
Attribute Value Comment
Wind Resources Annual average 6.25 m/s @ 80
meters See Section 1.3
Electricity Consumption
Patterns 8,440,000 kWh / yr Average of three years
Project Start Date Jan 2010
Months to Complete 24
General Inflation 3.50%
Energy Inflation 4.50%
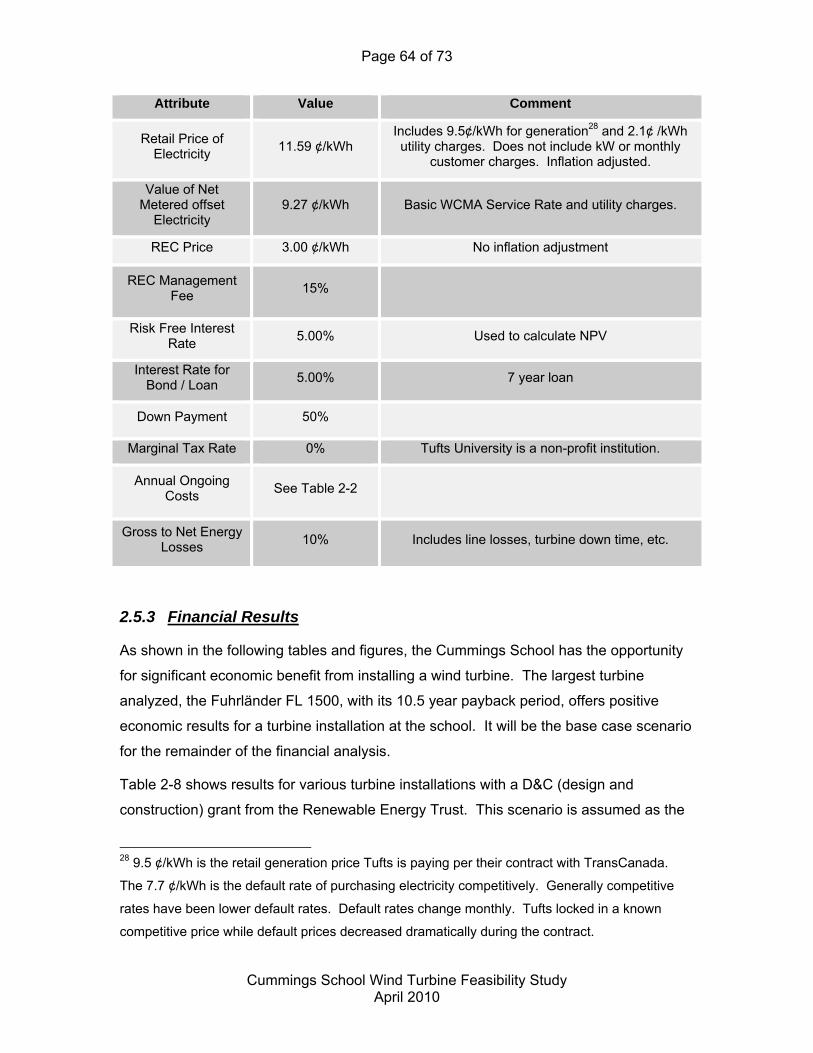
Page 64 of 73
Cummings School Wind Turbine Feasibility Study
April 2010
Attribute Value Comment
Retail Price of Electricity
11.59 ¢/kWh Includes 9.5¢/kWh for generation28 and 2.1¢ /kWh utility charges. Does not include kW or monthly
customer charges. Inflation adjusted.
Value of Net Metered offset
Electricity 9.27 ¢/kWh Basic WCMA Service Rate and utility charges.
REC Price 3.00 ¢/kWh No inflation adjustment
REC Management Fee
15%
Risk Free Interest Rate
5.00% Used to calculate NPV
Interest Rate for Bond / Loan
5.00% 7 year loan
Down Payment 50%
Marginal Tax Rate 0% Tufts University is a non-profit institution.
Annual Ongoing Costs
See Table 2-2
Gross to Net Energy Losses
10% Includes line losses, turbine down time, etc.
2.5.3 Financial Results
As shown in the following tables and figures, the Cummings School has the opportunity
for significant economic benefit from installing a wind turbine. The largest turbine
analyzed, the Fuhrländer FL 1500, with its 10.5 year payback period, offers positive
economic results for a turbine installation at the school. It will be the base case scenario
for the remainder of the financial analysis.
Table 2-8 shows results for various turbine installations with a D&C (design and
construction) grant from the Renewable Energy Trust. This scenario is assumed as the
28 9.5 ¢/kWh is the retail generation price Tufts is paying per their contract with TransCanada.
The 7.7 ¢/kWh is the default rate of purchasing electricity competitively. Generally competitive
rates have been lower default rates. Default rates change monthly. Tufts locked in a known
competitive price while default prices decreased dramatically during the contract.
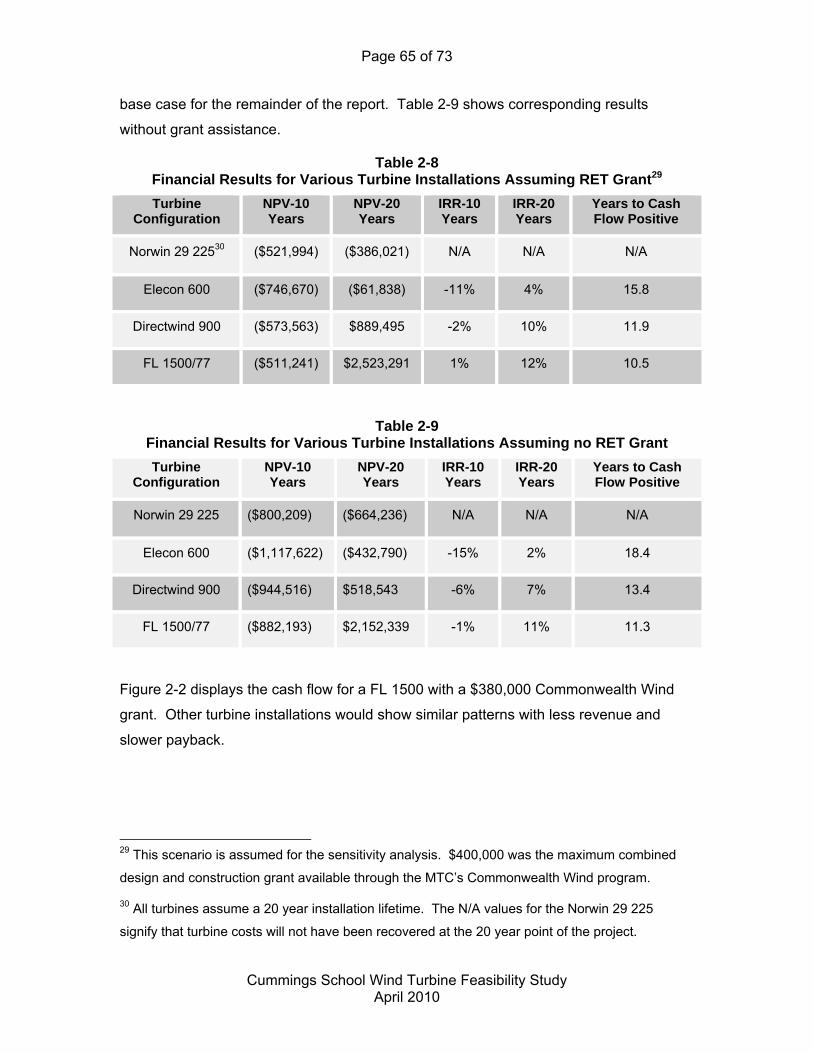
Page 65 of 73
Cummings School Wind Turbine Feasibility Study
April 2010
base case for the remainder of the report. Table 2-9 shows corresponding results
without grant assistance.
Table 2-8 Financial Results for Various Turbine Installations Assuming RET Grant29
Turbine Configuration
NPV-10 Years
NPV-20 Years
IRR-10 Years
IRR-20 Years
Years to Cash Flow Positive
Norwin 29 22530 ($521,994) ($386,021) N/A N/A N/A
Elecon 600 ($746,670) ($61,838) -11% 4% 15.8
Directwind 900 ($573,563) $889,495 -2% 10% 11.9
FL 1500/77 ($511,241) $2,523,291 1% 12% 10.5
Table 2-9 Financial Results for Various Turbine Installations Assuming no RET Grant
Turbine Configuration
NPV-10 Years
NPV-20 Years
IRR-10 Years
IRR-20 Years
Years to Cash Flow Positive
Norwin 29 225 ($800,209) ($664,236) N/A N/A N/A
Elecon 600 ($1,117,622) ($432,790) -15% 2% 18.4
Directwind 900 ($944,516) $518,543 -6% 7% 13.4
FL 1500/77 ($882,193) $2,152,339 -1% 11% 11.3
Figure 2-2 displays the cash flow for a FL 1500 with a $380,000 Commonwealth Wind
grant. Other turbine installations would show similar patterns with less revenue and
slower payback.
29 This scenario is assumed for the sensitivity analysis. $400,000 was the maximum combined
design and construction grant available through the MTC’s Commonwealth Wind program.
30 All turbines assume a 20 year installation lifetime. The N/A values for the Norwin 29 225
signify that turbine costs will not have been recovered at the 20 year point of the project.
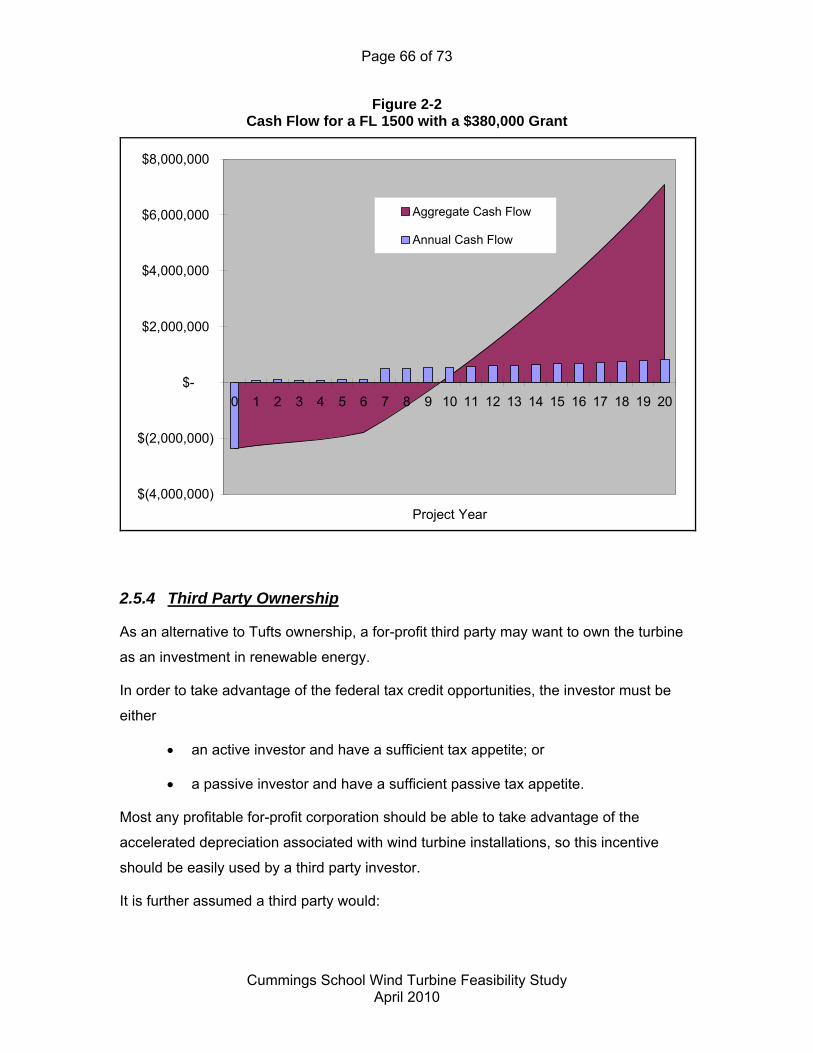
Page 66 of 73
Cummings School Wind Turbine Feasibility Study
April 2010
Figure 2-2 Cash Flow for a FL 1500 with a $380,000 Grant
$(4,000,000)
$(2,000,000)
$-
$2,000,000
$4,000,000
$6,000,000
$8,000,000
0 1 2 3 4 5 6 7 8 9 10 11 12 13 14 15 16 17 18 19 20
Project Year
Aggregate Cash Flow
Annual Cash Flow
2.5.4 Third Party Ownership
As an alternative to Tufts ownership, a for-profit third party may want to own the turbine
as an investment in renewable energy.
In order to take advantage of the federal tax credit opportunities, the investor must be
either
an active investor and have a sufficient tax appetite; or
a passive investor and have a sufficient passive tax appetite.
Most any profitable for-profit corporation should be able to take advantage of the
accelerated depreciation associated with wind turbine installations, so this incentive
should be easily used by a third party investor.
It is further assumed a third party would:
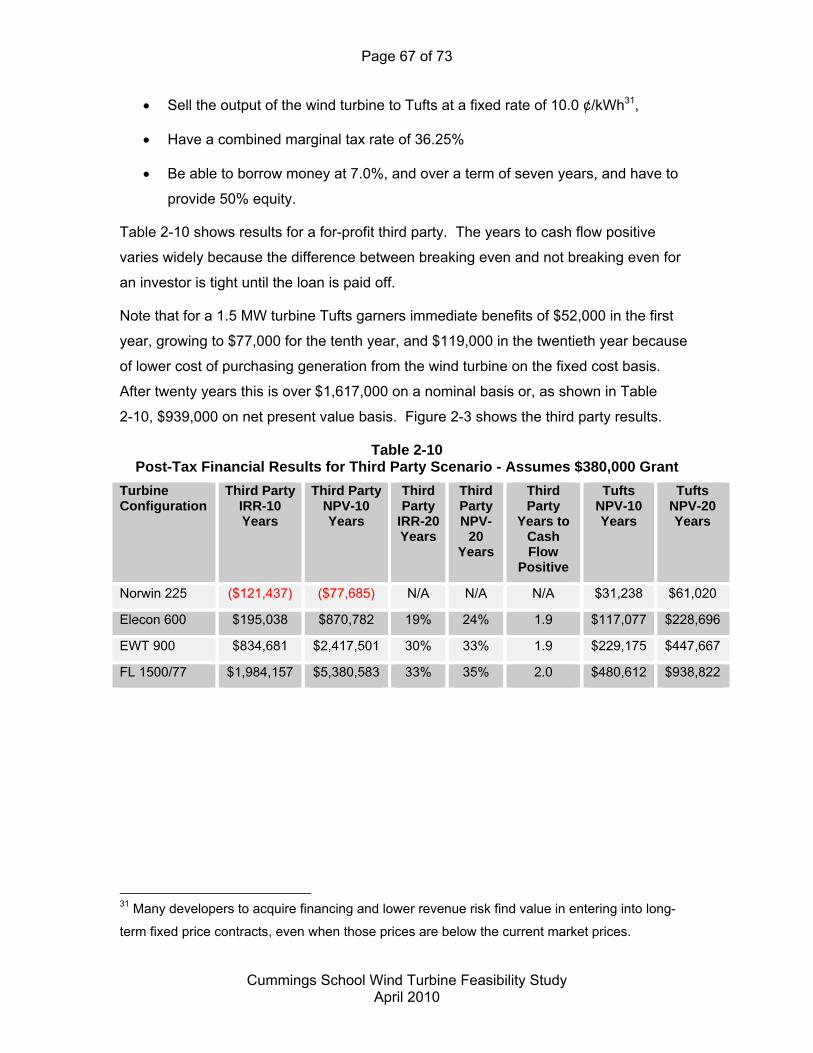
Page 67 of 73
Cummings School Wind Turbine Feasibility Study
April 2010
Sell the output of the wind turbine to Tufts at a fixed rate of 10.0 ¢/kWh31,
Have a combined marginal tax rate of 36.25%
Be able to borrow money at 7.0%, and over a term of seven years, and have to
provide 50% equity.
Table 2-10 shows results for a for-profit third party. The years to cash flow positive
varies widely because the difference between breaking even and not breaking even for
an investor is tight until the loan is paid off.
Note that for a 1.5 MW turbine Tufts garners immediate benefits of $52,000 in the first
year, growing to $77,000 for the tenth year, and $119,000 in the twentieth year because
of lower cost of purchasing generation from the wind turbine on the fixed cost basis.
After twenty years this is over $1,617,000 on a nominal basis or, as shown in Table
2-10, $939,000 on net present value basis. Figure 2-3 shows the third party results.
Table 2-10 Post-Tax Financial Results for Third Party Scenario - Assumes $380,000 Grant
Turbine Configuration
Third Party IRR-10 Years
Third Party NPV-10 Years
Third Party
IRR-20 Years
Third Party NPV-
20 Years
Third Party
Years to Cash Flow
Positive
Tufts NPV-10 Years
Tufts NPV-20 Years
Norwin 225 ($121,437) ($77,685) N/A N/A N/A $31,238 $61,020
Elecon 600 $195,038 $870,782 19% 24% 1.9 $117,077 $228,696
EWT 900 $834,681 $2,417,501 30% 33% 1.9 $229,175 $447,667
FL 1500/77 $1,984,157 $5,380,583 33% 35% 2.0 $480,612 $938,822
31 Many developers to acquire financing and lower revenue risk find value in entering into long-
term fixed price contracts, even when those prices are below the current market prices.
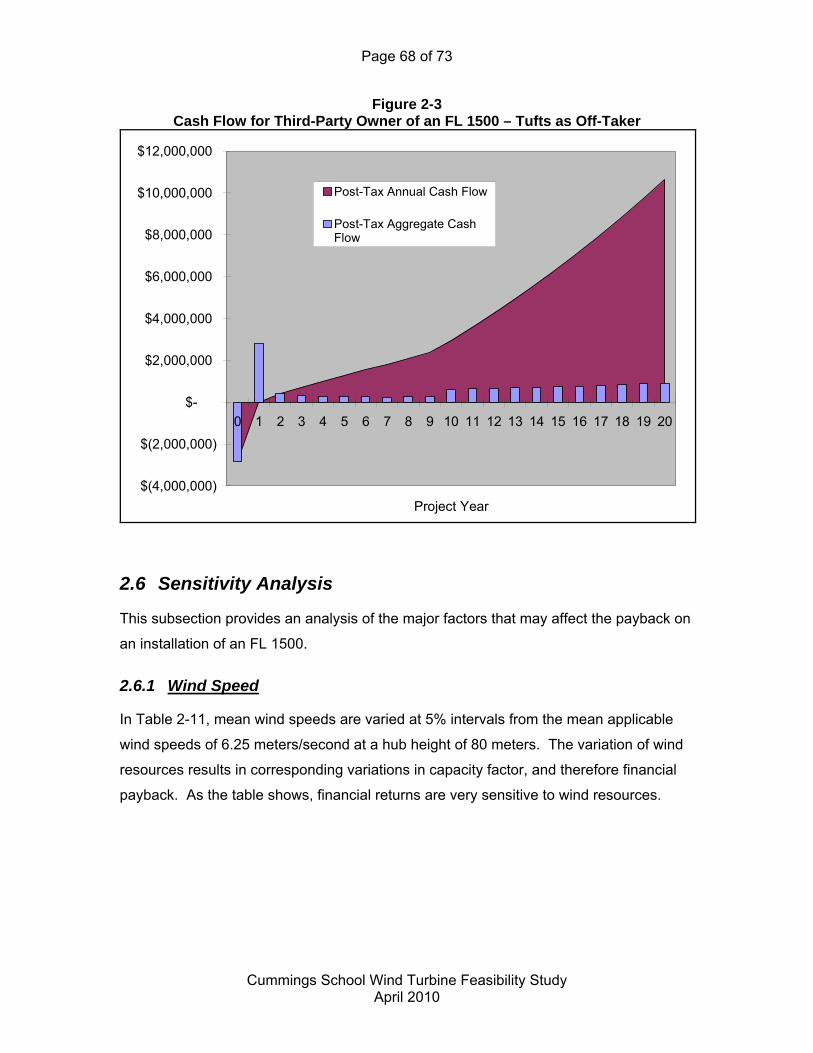
Page 68 of 73
Cummings School Wind Turbine Feasibility Study
April 2010
Figure 2-3 Cash Flow for Third-Party Owner of an FL 1500 – Tufts as Off-Taker
$(4,000,000)
$(2,000,000)
$-
$2,000,000
$4,000,000
$6,000,000
$8,000,000
$10,000,000
$12,000,000
0 1 2 3 4 5 6 7 8 9 10 11 12 13 14 15 16 17 18 19 20
Project Year
Post-Tax Annual Cash Flow
Post-Tax Aggregate CashFlow
2.6 Sensitivity Analysis
This subsection provides an analysis of the major factors that may affect the payback on
an installation of an FL 1500.
2.6.1 Wind Speed
In Table 2-11, mean wind speeds are varied at 5% intervals from the mean applicable
wind speeds of 6.25 meters/second at a hub height of 80 meters. The variation of wind
resources results in corresponding variations in capacity factor, and therefore financial
payback. As the table shows, financial returns are very sensitive to wind resources.
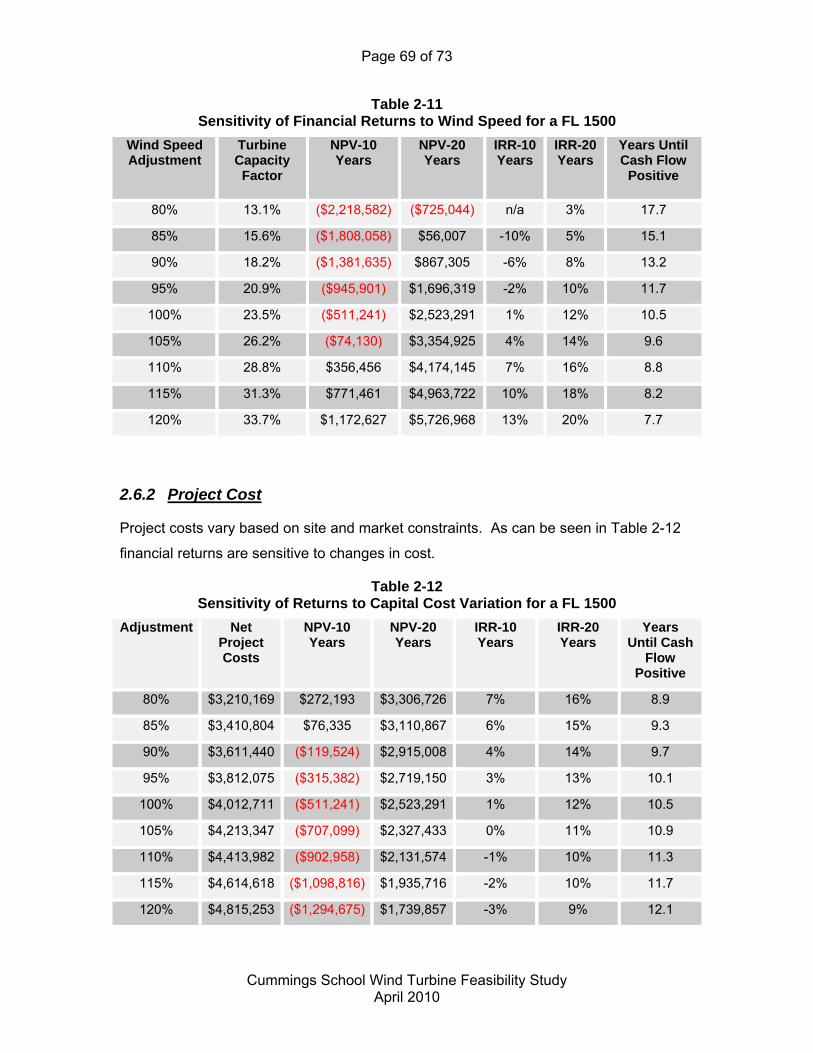
Page 69 of 73
Cummings School Wind Turbine Feasibility Study
April 2010
Table 2-11 Sensitivity of Financial Returns to Wind Speed for a FL 1500
Wind Speed Adjustment
Turbine Capacity
Factor
NPV-10 Years
NPV-20 Years
IRR-10 Years
IRR-20 Years
Years Until Cash Flow
Positive
80% 13.1% ($2,218,582) ($725,044) n/a 3% 17.7
85% 15.6% ($1,808,058) $56,007 -10% 5% 15.1
90% 18.2% ($1,381,635) $867,305 -6% 8% 13.2
95% 20.9% ($945,901) $1,696,319 -2% 10% 11.7
100% 23.5% ($511,241) $2,523,291 1% 12% 10.5
105% 26.2% ($74,130) $3,354,925 4% 14% 9.6
110% 28.8% $356,456 $4,174,145 7% 16% 8.8
115% 31.3% $771,461 $4,963,722 10% 18% 8.2
120% 33.7% $1,172,627 $5,726,968 13% 20% 7.7
2.6.2 Project Cost
Project costs vary based on site and market constraints. As can be seen in Table 2-12
financial returns are sensitive to changes in cost.
Table 2-12 Sensitivity of Returns to Capital Cost Variation for a FL 1500
Adjustment Net Project Costs
NPV-10 Years
NPV-20 Years
IRR-10 Years
IRR-20 Years
Years Until Cash
Flow Positive
80% $3,210,169 $272,193 $3,306,726 7% 16% 8.9
85% $3,410,804 $76,335 $3,110,867 6% 15% 9.3
90% $3,611,440 ($119,524) $2,915,008 4% 14% 9.7
95% $3,812,075 ($315,382) $2,719,150 3% 13% 10.1
100% $4,012,711 ($511,241) $2,523,291 1% 12% 10.5
105% $4,213,347 ($707,099) $2,327,433 0% 11% 10.9
110% $4,413,982 ($902,958) $2,131,574 -1% 10% 11.3
115% $4,614,618 ($1,098,816) $1,935,716 -2% 10% 11.7
120% $4,815,253 ($1,294,675) $1,739,857 -3% 9% 12.1
Page 70 of 73
Cummings School Wind Turbine Feasibility Study
April 2010
2.7 Conclusions
A wind turbine installation has the potential for financial and environmental benefit at the
Cummings School. A 1.5 MW turbine is recommended for the project as it moves
forward. Securing permits and local approval will be the project’s most significant
hurdle. Nonetheless, given the project’s economic outlook, a turbine installation could
be feasible.
2.7.1 Next Steps
Come to an institutional decision on whether or not to pursue the project further.
Contact Mass NHESP and US Fish and Wildlife Department concerning specific
wildlife resources in the vicinity
Engage Town and local stakeholders on the potential project and establish a
preliminary schedule to promote re-zoning to permit desired turbine height and
type.
Proceed to permitting, design, engineering and construction
o Finalize turbine location via civil engineering review
o Apply for Commonwealth Wind funding
o Begin permitting process at all possible levels
Consider further meteorological study. As mentioned a full year’s worth of Sodar
or meteorological tower wind resource data will be required for MTC grants and
other financing. Only 3 months of data was gathered during this study.
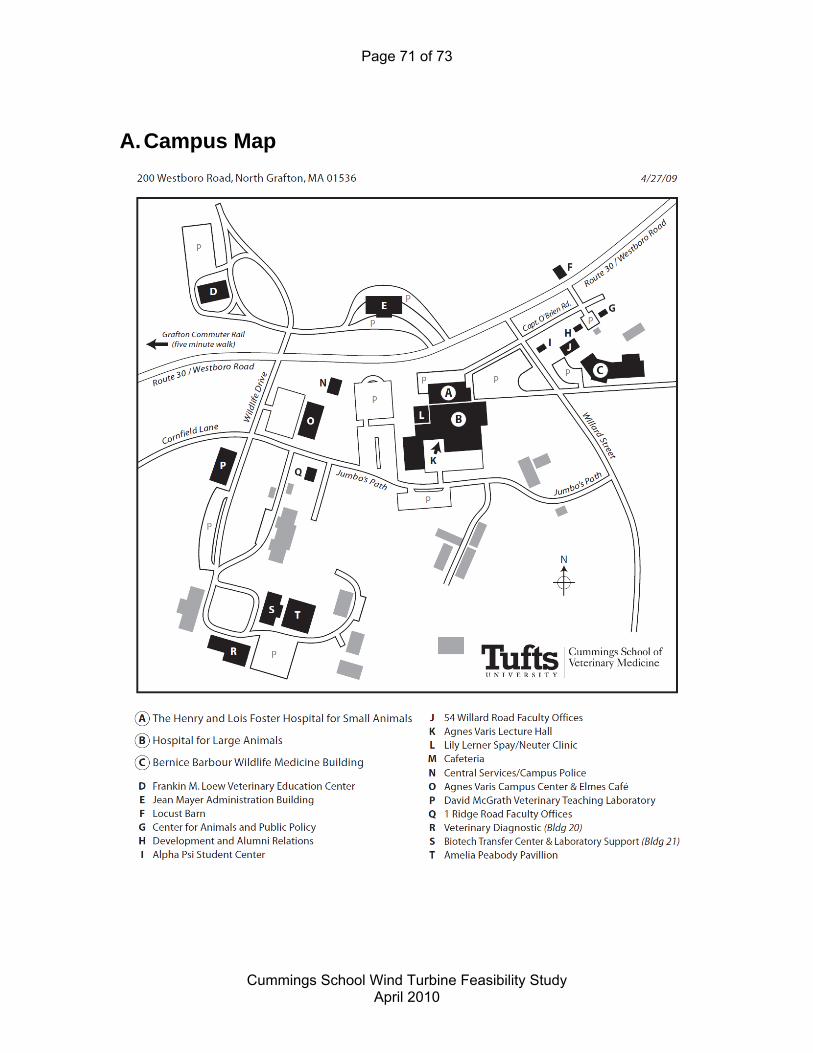
Page 71 of 73
Cummings School Wind Turbine Feasibility Study
April 2010
A. Campus Map

Page 72 of 73
Cummings School Wind Turbine Feasibility Study
April 2010
B. Electrical One Line Diagram

Page 73 of 73
Cummings School Wind Turbine Feasibility Study
April 2010
C. Electrical Site Plan