Embed Size (px)
Citation preview
TUNA BAIT-BOAT BAlTlNG TlME AND THE AVAlLABlLlTY OF ANCHOVY IN GHANAIAN WATERS
bY Eric A. KWEI, -1
K. A. KORANTENG -' and
P. O. BANNERMAN -' 1 STARKIST INTERNATIONAL
P.O. BOX 40, TEMA 2 FlSHERlES DEPARTMENT,
RESEARCH 84 UTlLlZATlON BRANCH, P.O. BOX B-62, TEMA
Abstract
The time used by tuna bait-boats in catching anchovies to be used as bait in their operations has been examined. The duration of baiting time has not significantly increased but the percentage of trip time spent at baiting increased between 1986 and 1992. Over the same period, the cpue of canoes exploiting anchovies have also steadily increased. There does not appear to be any change in the temporal and geographic distribution of anchovies in Ghanaian waters. Therefore it seems that the increasing percentage baiting time may be due to factors other than the availability of anchovy.
Résumé :
Ce document examine la durée des opérations de capture des anchois qui constituent l'appât vivant des thoniers canneurs ghanéens. La durée de ces opérations n 'a pas augmenté significativement lors des années 1986-1 992. Lors de la InBrne période le rendement (cpue) des pirogues exploitant les anchois a nettement augmenté. Il ne semble pas qu'il y ait eu un changement dans la distribution spatio-temporelle des anchois dans les eaux côtières ghanéennes. En conséquence il semble que 1 'accroissement supposé du pourcentage de temps destiné a faire 1 'appât soit lié a d'autres facteurs que la disponibilité de 1 'anchois.
263
1. Introduction : The commercial tuna fishery based at Tema in Ghana began in 1960 following
a survey conducted in 1959-60 by the Star-Kist Foods of U.S.A. under an agreement between the company and the Government of Ghana (Hammond, 1977).
One of the major aims of the survey was to study the distribution and abundance of tuna and tuna bait fishes in the Gulf of Guinea. The results of the snrvey established, among others, that tuna species abound in the Gulf of Guinea of which Ghana is a part. Bait fishes, anchovy and young sardinellas, for tuna bait-boat operations were found to be readily available, especially in Ghanaian waters. I
From the commencement of commercial tuna fishing, sardinellas and anchovies were used as live bait and the industry depended entirely on the amilability of these small pelagic fish species. Since the early 1976”s when sardinella resources were drastically reduced in Ghanaian waters, anchovy has bec e only fish species used as bait for tuna fishing. According to Choo and 1976), the anchovy Engraulis encrasicolus (Linnaeus,l758) is more preferable than Sardinella as bait. t
E. encrasicolus has also been found to be more reliable as bait partly because it is available almost throughout the year and also because it has been found to survive longer under artificial conditions (such as in bait-wells or tanks on tuna vessels) than sardinellas (Fisheries Department observation). E. encrasicolus is one of the most important marine fish species in Ghanaian waters, accounting for about 25% of marine fish landings in Ghana (Koranteng, 1993).
It is widely believed that, since the mid-l980s, tuna bait-boats are spending longer time now than before in obtaining sufficient bait to use in tuna fishing. Since the quantity of tuna caught is positively related ts the quantity of bait available to the bait-boats, any reduction in biomass or abundance of anchovy ’ will have an adverse effect on the performance of the bait-boats. The bait-boats will have to spend considerable proportions of their trip time looking for bait, , instead of fishing for tunas. The tuna fishery in Ghana will thus suffer unless sardinellas or some other small pelagic fish could be used as bait. This could in turn have serious repercussions on sardinella resonrces in Ghanaian waters.
In this paper, the baiting time and the proportion of trip time used for baiting, have been examined. The results of the investigation have been related to the landings of anchovy by the Ghanaian artisanal fishing fleet.
-
ait-Boat Operations and Baiting Time When a tuna bait-boat sets off for fishing, it spends sometime looking for
and catching the bait that will be used in attracting the tuna. The anehovy is encircled and caught with special purse-seine nets. The fish is taken alive with buckets and put into bait-Wells located on the bait-boat.
The operation of bait collection ends when al1 the bait Wells on the bait-boat are filled with live bait. The tuna bait-boat then moves to the expected fishing grounds which may be anywhere in the Gulf of Guinea, but may return to baiting grounds when the bait-Wells are empty.
3. Materials and Methods Records available in the log-books of six tuna bait-boats operating from
Tema over the period 1986-1992 were examined. The log book information was obtained from the local office of Star-Kïst International, the Company through which the landings of the six vessels are marketed. These vessels were selected from about 30 tuna bait-boats that operated during the period. They operated more regularly than most of the other vessels and their log-books were available and contained very consistent information.
The vessels, each of them measuring between 39 and 55 metres and of 280 to 440 Cross Registered Tonnage, were as follows : AFKO 303, AFKO 305, GBESE 9, BIG JOHN, GHAKO 101 and GOSHEN 602.
The data extracted from the log-books (for every trip that each vessel made) were : -
1. NUMBER OF DAYS AT SEA (DAS) and 2. NUMBER OF DAYS AT BAITING (DB).
The number of days spent for tuna fishing is the difference between DAS and DB.
Each vessel made between 3 and 11 trips in each of the years under consideration. The duration of a trip usually varied between 6 and 47 days during which 1 and 14 days were used for bait fishing. The percentage (Pb) of trip time spent at baiting was calculated as:
DB Pb = - x 100.
DAS
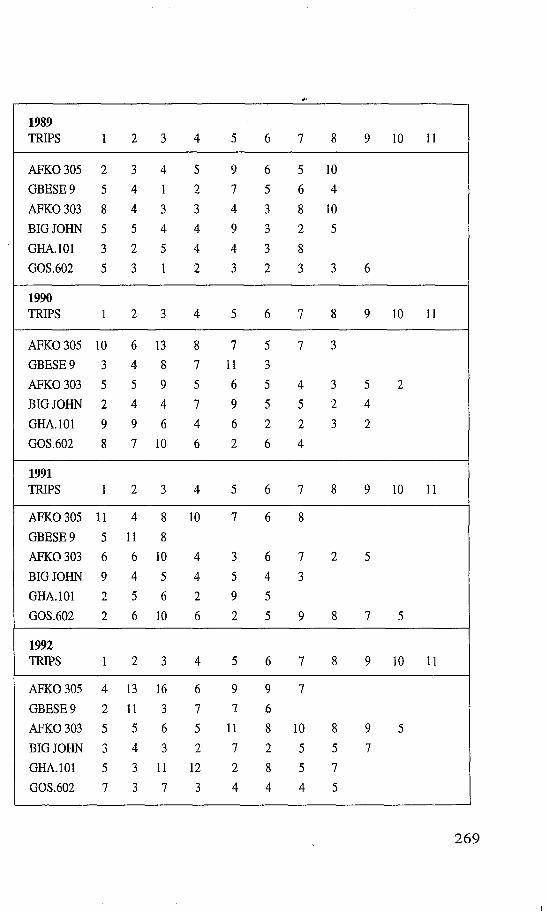
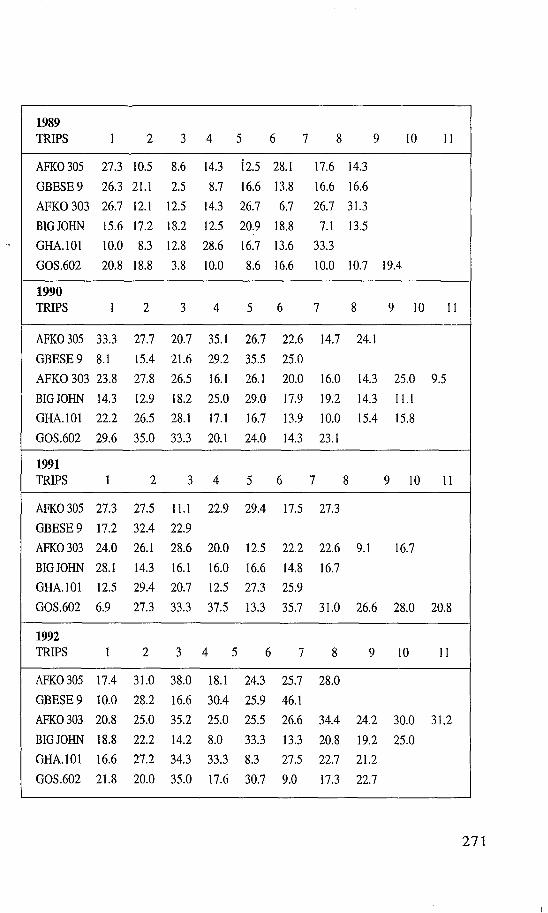
The baiting time and calculated values of Pb for al1 trips made by each vessel are presented in tables 1 and 2.
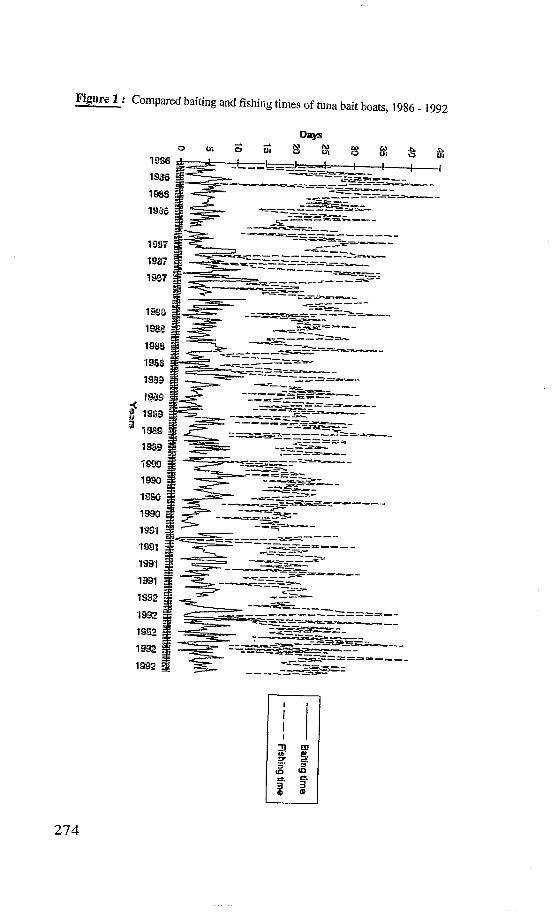
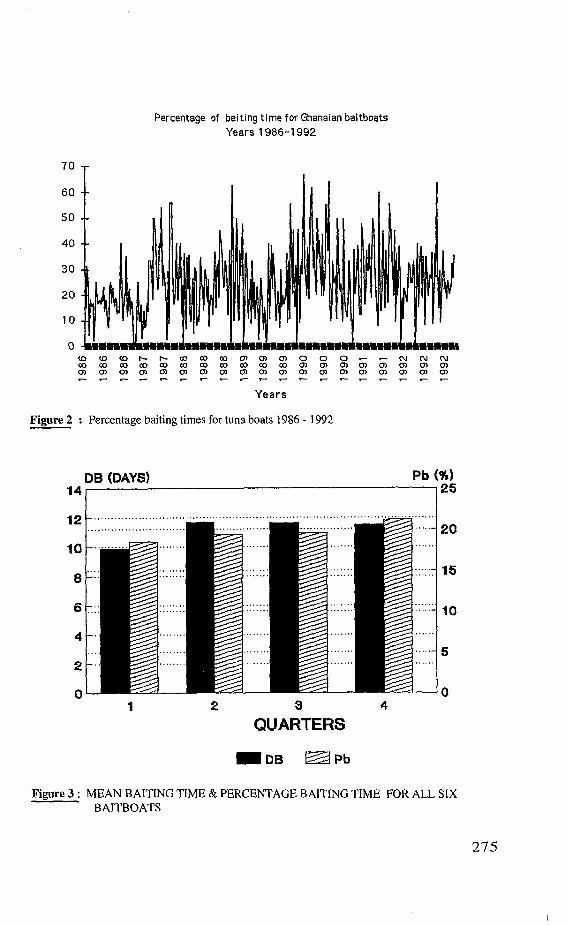
A total of 328 trips were made by al1 six vessels in the period under study. The baiting time, and time used for tuna fishing were plotted (Figure 1). The percentage baiting time, Pb was also plotted (Figure 2.)
For each vessel, the baiting times, DB and percentage baiting times, Pb were grouped on quarterly basis. That is the operations in the months of January- March were put in the first quarter, April-June in the second quarter, July- September in the third and October-December in the fourth quarter. The regrouped data are presented in tables 3A and 3B which also give the annual mean values of DB and Pb. Combining al1 years under study, the average values of DB and Pb for each quarter of the year were plotted in figure 3.
265
Analysis of variance was perfomed on the quarterly values of DB and Pb t s test the differences between years and quarters.
From the records of the Research and Utilization Branch of the Fishekes Department of Ghana, total landings and cpue of anchovy caught by the fleet of canoes using the artisanal purse seine net, called “poli”, in each of the four maritime regions were obtained (Table 4.) An analysis of variance was perfomed on the quarterly values of cpue.
sult and Discussion It is observed in figures 1-3 that the baiting and fishing times do not show
any cllear trend. From figure 3, however, there appexs to be an increasing trend in days
baiting (DB) and percentage baiting time (Pb) from the first to the fourth quarters of the year. However, from the analysis of variance (appendix l), the rising trends symbolising differences in DB and Pb were found to be statistically insignifiant (p=0.6724) for DB and 0.6242 for Pb). This means that there were no real differences in both days baiting and percentage baiting among the four quarterly periods of the year. On the other hand, the inter-annual differences were found to be significant (p=0.0462) in Pb but insignifiant in DB (P=0.7432).
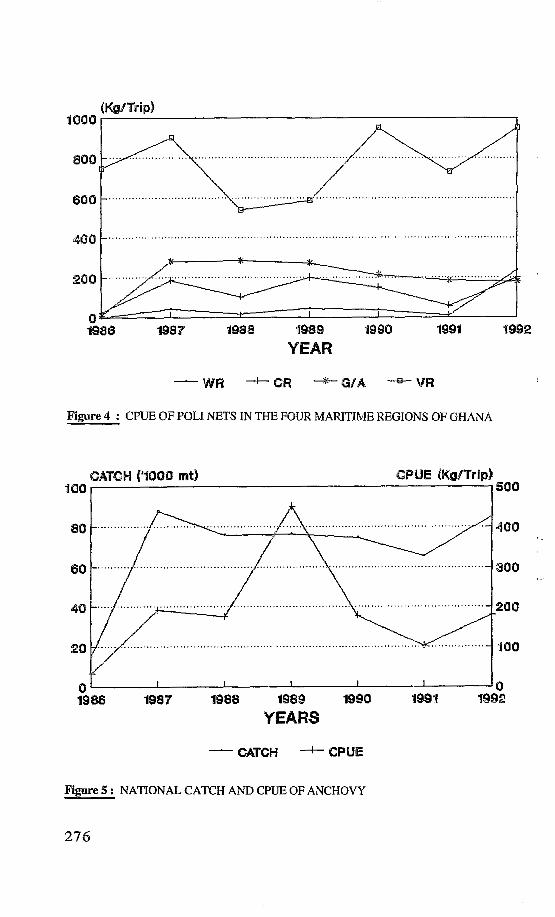
From table 4 and figure 4, cpue values s f anchovies caught with the poli net were highest in the Volta Region and lowest in the Western Region. This shows that anchovy is less available in the western than the eastern part of the country. However, frsm 1991 to 1992, there was a significant rise in cpue in the Western Region; coming second to the Volta Region. Central region also recorded a higher value than Greater Accra region. Except for this picture in 1992, there does not appear to be any changes in the temporal or geographic distribution of anchovy in Ghanaian waters. From the analysis of variance significant differences exist between quarters of the year (p=0.0034) and between years (P=0.0424).
On the whole, landings of the anchovy over the past seven years have fluctuated widely with a gradua1 decline observed from 1989 to 1991. Also within the same three year period, (1989-1 991) it was observed that baiting time increased steadily. From 1991 to 1992, however, there is seen a slight rise in landings (Figure 5.)
Since 1991, the observation on increasing baiting time has resulted in some fears that there is a possible decline in the abundance of anchovy in Ghanaian coastal waters. Estimates of the biomass of anchovies have not been commensurate with catches made by canoes. For example in 1989, the combined biomass of the anchovy and sardinellas was estimated as 53,000 metric tons (Alvheim et al, 1989) but in the same year, over 76,000 mt of anchovy alone were caught.
It is evident that over the period under consideration, although the baiting time did not show any statistically significant rise, the percentage baiting time increased particularly since 199 1 , and the cpue of poli canoes did not decreased.
266
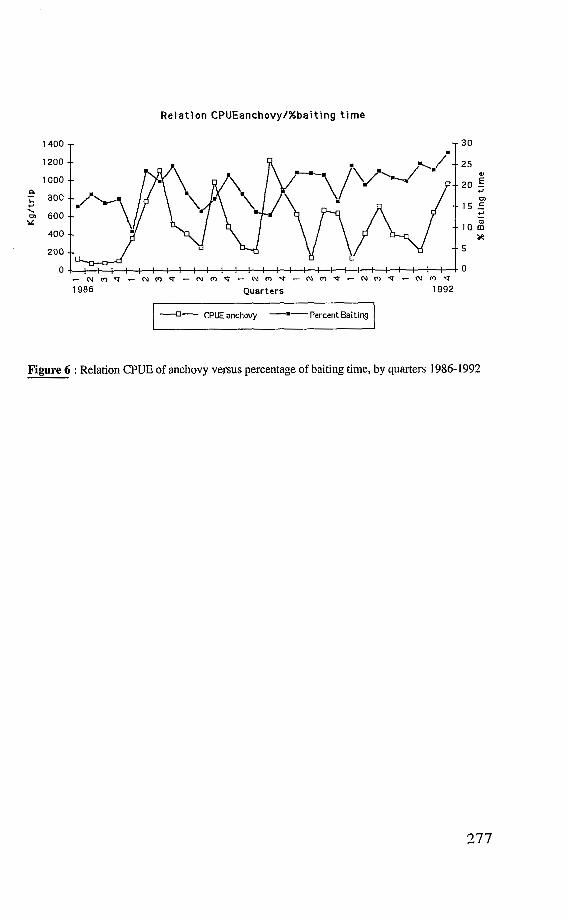
It is clear also on figure 6, that until 1991, the variation in percentage baiting time was generally in opposition of phase with variation in cpue of the poli canoes. One could therefore attribute the observed changes in baiting time and percentage baiting time to factors other than abundance or aivability of anchovy. However, there does not appear to be any cause for alarm with regard to the aivability of anchovy as tuna bait in the tuna bait-boat fishery in Ghanaian waters.
REFERENCES
Alvheim, O. (1989) : Surveys of the Small Pelagic fish resources of Cote d’Ivoire and Ghana, 12-20 October, 1989. CECAFECAF Series.
Choo, W.I. & Kim B.A.(1976) : Fishing of live bait for the Korean Pole and
Hammond, D.A.(1977) : Tuna Fisheries in Ghana. Fisheries Research Unit,
Koranteng, K.A.(1993) : Size at first maturity of the Anchovy in Ghanaian waters and suggestions for appropriate mesh size in its fishery. Naga, Iclarm
Line Fishery. SCRC-1976 V0L.VI p62-68.
Information Report No 14.
Q. 16( 1) : 29-30.
CAPTIONS OF TABLES AND FIGURES
Table 1 : Baiting time for six selected Ghanaian tuna bait-boats 1986-1992
Table 2 : Mean percentage of baiting time for the six selected tuna bait-boats
Table 3 : A- Mean quaterly and annual baiting time for al1 six tuna bait-boats
B- Mean percentage baiting time for al1 six tuna bait-boats 1986-1992 Table 4 : Catch and CPUE values of the anchovy
A- Total national catch and CPUE in each quarter of the year B- Overall national and regional CPUE.
1986-1992
-. 1986-1992.
Figure 1: Compared baiting and fishing time of the six selected tuna bait-boats 1986-1992
Figure 2 : Percentage of the baiting time for the six selected tuna bait-boats
Figure 3 : Mean baiting time and percentage baiting time for al1 six bait-boats
Figure 4 : CPUE of poli nets in the four maritime regions of Ghana
Figure 5 : National catch and CPUE of anchovy
1986-1992
Figure 6 : Relation CPUE of anchovy versus percentage of baiting time, by quarters 1986-1992
267
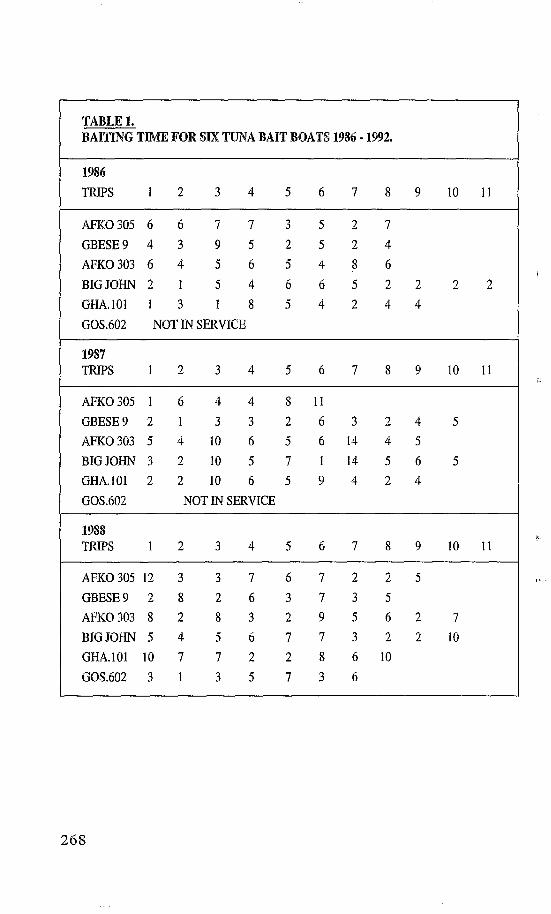
TABLE 1. TUA'A BAPT BOATS 1986 - 19992.
1986 TRIPS 1 2 3 4 5 6 7 8 9 1 0 1 1
AIX0305 6 6 7 7 3 5 2 7 GBESE9 4 3 9 5 2 5 2 4 AFKO303 6 4 5 6 5 4 8 6 BIGJOIHN2 1 5 4 6 6 5 2 2 2 2 GHA.101 1 3 1 8 5 4 2 4 4 GOS.602 NOT IN SERVICE
1987 mps 1 2 3 4 5 6 7 8 9 1 0 1 1
AFKO305 1 6 4 4 8 11 GBESE9 2 1 3 3 2 6 3 2 4 5 AFKO303 5 4 10 6 5 6 14 4 5 BIGJOHN 3 2 10 5 7 1 14 5 6 5 GHA.101 2 2 10 6 5 9 4 2 4 GOS.602 NOT IN SERVICE
1988 TRIPS 1 2 3 4 5 6 7 8 9 1 0 1 1
AFK0305 12 3 3 7 6 7 2 2 5 GBESE9 2 8 2 6 3 7 3 5 AFKO303 8 2 8 3 2 9 5 6 2 7 BIGJOHN 5 4 5 6 7 7 3 2 2 10 GHA.101 10 7 7 2 2 8 6 10 GOS.602 3 1 3 5 7 3 6
268
1989 1 2 3 4 5 6 7 8 9 1 0 1 1
AFKO305 2 3 4 5 9 6 5 10 GBESE9 5 4 1 2 7 5 6 4 AFK0303 8 4 3 3 4 3 8 10 BIGJOHN 5 5 4 4 9 3 2 5 GHA.101 3 2 5 4 4 3 8 GOS.602 5 3 1 2 3 2 3 3 6
1 E s 1 2 3 4 5 6 7 8 9 1 0 1 1
AFKO305 10 6 13 8 7 5 7 3 GBESE9 3 4 8 7 11 3 AFKO303 5 5 9 5 6 5 4 3 5 2 BIGJOHN 2 4 4 7 9 5 5 2 4 GHA.lO1 9 9 6 4 6 2 2 3 2 GOS.602 8 7 10 6 2 6 4
1991 TRIPS 1 2 3 4 5 6 7 8 9 1 0 1 1
AFKO 305 11 4 8 10 7 6 8 GBESE9 5 11 8 AFK0303 6 6 10 4 3 6 7 2 5 BIGJOHN 9 4 5 4 5 4 3 GHA.lO1 2 5 6 2 9 5
1 GOS.602 2 6 10 6 2 5 9 8 7 5 l 1992 TRIPS 1 2 3 4 5 6 7 8 9 1 0 1 1
AFK0305 4 13 16 6 9 9 7 GBESE9 2 11 3 7 7 6 AFK0303 5 5 6 5 11 8 10 8 9 5 BIGJOHN 3 4 3 2 7 2 5 5 7 GHA.lO1 5 3 11 12 2 8 5 7 GOS.602 7 3 7 3 4 4 4 5
269
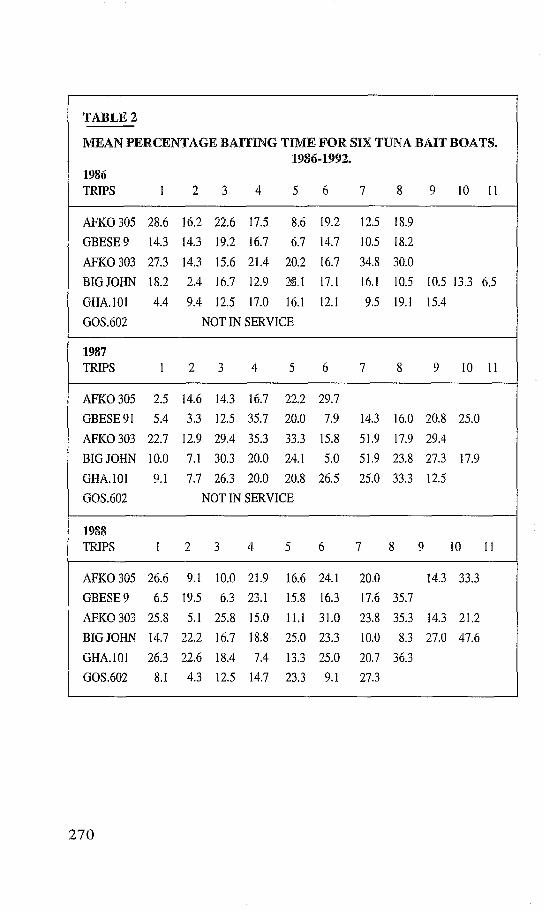
TABLE 2
CENTAGE BAITING TIME FOR SI TUNA BAIT BOATS.
1986 TRIPS 1 2 3 4 5 6 7 8 9 1 0 1 1
AFKO305 28.6 16.2 22.6 17.5 8.6 19.2 12.5 18.9 GBESE9 14.3 14.3 19.2 16.7 6.7 14.7 10.5 18.2 AFKO303 27.3 14.3 15.6 21.4 20.2 16.7 34.8 30.0 BIGJOHN 18.2 2.4 16.7 12.9 B.1 17.1 16.1 10.5 10.5 13.3 6.5 GHA.101 4.4 9.4 12.5 17.0 16.1 12.1 9.5 19.1 15.4 GOS.602 NOT IN SERVICE
1987 1 2 3 4 5 6 7 8 9 1 0 1 1
AF'KB 305 2.5 14.6 14.3 16.7 22.2 29.7 GBESE91 5.4 3.3 12.5 35.7 20.0 7.9 14.3 16.0 20.8 25.0 AFKO303 22.7 12.9 29.4 35.3 33.3 15.8 51.9 17.9 29.4 BIGJOHN 10.0 7.1 30.3 20.0 24.1 5.0 51.9 23.8 27.3 17.9 GHA.lO1 9.1 7.7 26.3 20.0 20.8 26.5 25.0 33.3 12.5 GOS.602 NOT IN SERVICE
1988 1 TRIPS 1 2 3 4 5 6 7 8 9 1 0 1 1
AFKO 305 26.6 9.1 10.0 21.9 16.6 24.1 20.0 14.3 33.3 GBESE9 6.5 19.5 6.3 23.1 15.8 16.3 17.6 35.7 AFKO303 25.8 5.1 25.8 15.0 11.1 31.0 23.8 35.3 14.3 21.2 BIGJOHN 14.7 22.2 16.7 18.8 25.0 23.3 10.0 8.3 27.0 47.6 GHA.101 26.3 22.6 18.4 7.4 13.3 25.0 20.7 36.3 GOS.602 8.1 4.3 12.5 14.7 23.3 9.1 27.3
270
1989 TRIPS 1 2 3 4 5 6 7 8 9 1 0 1 1
AFKO305 27.3 10.5 8.6 14.3 i2.5 28.1 17.6 14.3 GBESE9 26.3 21.1 2.5 8.7 16.6 13.8 16.6 16.6 AFKO 303 26.7 12.1 12.5 14.3 26.7 6.7 26.7 31.3 BIGJOHN 15.6 17.2 18.2 12.5 20.9 18.8 7.1 13.5 GHA.101 10.0 8.3 12.8 28.6 16.7 13.6 33.3 GOS.602 20.8 18.8 3.8 10.0 8.6 16.6 10.0 10.7 19.4
1990 TRIPS 1 2 3 4 5 6 7 8 9 1 0 1 1
AFKO 305 33.3 27.7 20.7 35.1 26.7 22.6 14.7 24.1 GBESE9 8.1 15.4 21.6 29.2 35.5 25.0 AFKO 303 23.8 27.8 26.5 16.1 26.1 20.0 16.0 14.3 25.0 9.5 BIGJOHN 14.3 12.9 18.2 25.0 29.0 17.9 19.2 14.3 1 1 . 1
GHA.101 22.2 26.5 28.1 17.1 16.7 13.9 10.0 15.4 15.8 GOS.602 29.6 35.0 33.3 20.1 24.0 14.3 23.1
1991 TRIPS 1 2 3 4 5 6 7 8 9 I O 11
AFKO 305 27.3 27.5 11.1 22.9 29.4 17.5 27.3 GBESE9 17.2 32.4 22.9 AFK0303 24.0 26.1 28.6 20.0 12.5 22.2 22.6 9.1 16.7 BIGJOHN 28.1 14.3 16.1 16.0 16.6 14.8 16.7 GHA.101 12.5 29.4 20.7 12.5 27.3 25.9 GOS.602 6.9 27.3 33.3 37.5 13.3 35.7 31.0 26.6 28.0 20.8
1992 TRIPS 1 2 3 4 5 6 7 8 9 1 0 11
AFKO305 17.4 31.0 38.0 18.1 24.3 25.7 28.0 GBESE9 10.0 28.2 16.6 30.4 25.9 46.1 AFK0303 20.8 25.0 35.2 25.0 25.5 26.6 34.4 24.2 30.0 31.2 BIGJOHN 18.8 22.2 14.2 8.0 33.3 13.3 20.8 19.2 25.0 GHA.lO1 16.6 27.2 34.3 33.3 8.3 27.5 22.7 21.2 GOS.602 21.8 20.0 35.0 17.6 30.7 9.0 17.3 22.7
27 1
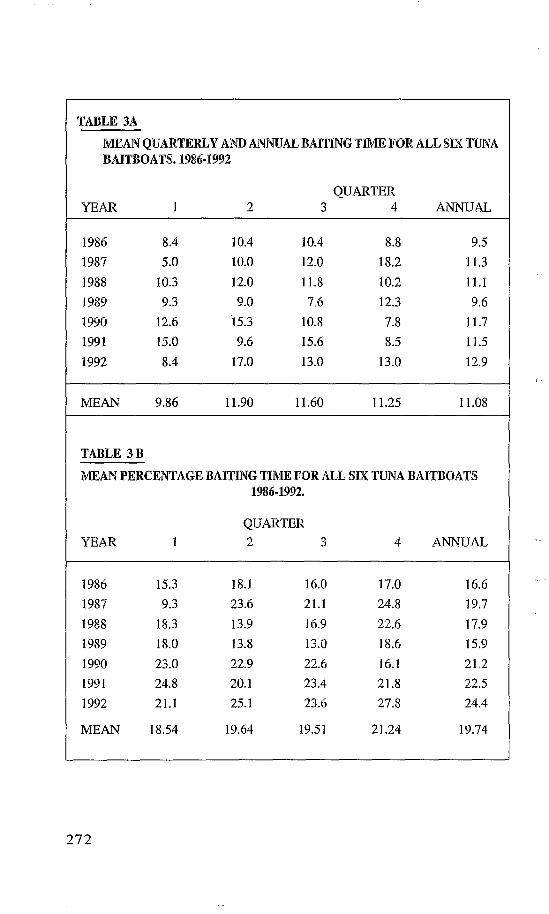
TABLE 3A
QUARTERLY AND ANNUAL BAITMG TEME FOR ALL S E TUNA BAWOATS. 1986-1992
QUARTER mm 1 2 3 4 mf4.1
1986 8.4 10.4 10.4 8.8 9.5 1987 5.0 10.0 12.0 18.2 11.3 1988 10.3 12.0 11.8 10.2 11.1 1989 9.3 9.0 7.6 12.3 9.6 1990 12.6 15.3 10.8 7.8 11.7 199 1 15.0 9.6 15.6 8.5 11.5 1992 8.4 17.0 13.0 13.0 12.9
9.86 1 1.90 11.60 1 1.25 1 1 .O8
TABLE 3 B ~ ~
PERCENTAGE BAPTII”JG TIME FOR ALL SI TUNA BAITBOATS 1986-1992.
QUARTER i mm 1 2 3 4 ANNUAL
1984 15.3 1987 9.3 1988 18.3 1989 18.0 1990 23.0 1991 24.8 1992 21.1
MEAN 1 8.54
18.1 23.6 13.9 13.8 22.9 20.1 25.1
19.64
16.0 21.1 16.9 13.0 22.6 23.4 23.6
19.51
17.0 24.8 22.6 18.6 16.1 21.8 27.8
21.24
16.6 19.7 17.9 15.9 21.2 22.5 24.4
19.74
272
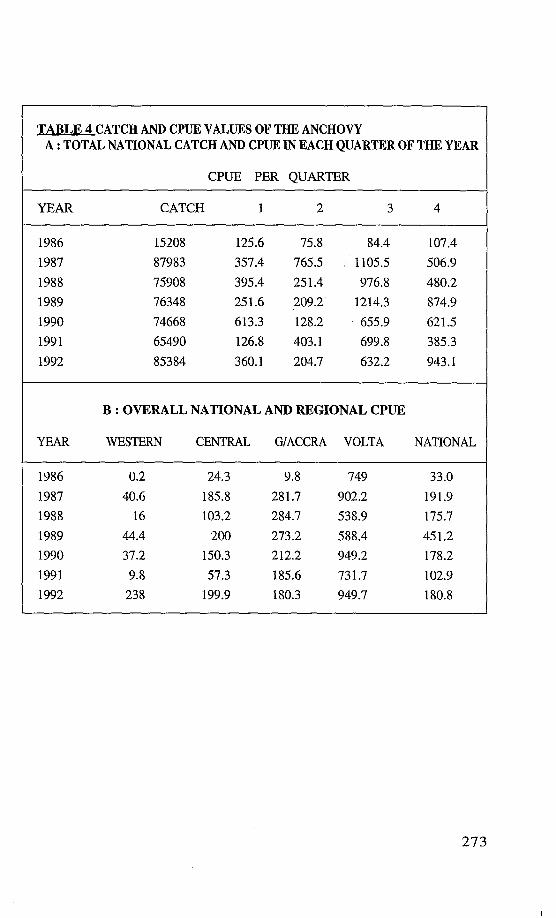
TABLE 4 CATCH AND CPUE VALUES OF THE. ANCHOVY A : TOTAL NATIONAL CATCH AND CPUE IN EACH QUARTER OF THE YEAR
CPUE PER QUARTER
YEAR CATCH 1 2 3 4
1986 15208 125.6 75.8 84.4 107.4 1987 87983 357.4 765.5 : 1105.5 506.9 1988 75908 395.4 251.4 976.8 480.2 1989 76348 251.6 209.2 1214.3 874.9 1990 74668 613.3 128.2 655.9 621.5 1991 65490 126.8 403.1 699.8 385.3 1992 85384 360.1 204.7 632.2 943.1
B : OVERALL NATIONAL AND REGIONAL CPUE
YEAR WESTERN CENTRAL G/ACCRA VOLTA NATIONAL
1986 0.2 24.3 9.8 749 33.0 1987 40.6 185.8 281.7 902.2 191.9 1988 16 103.2 284.7 538.9 175.7 1989 44.4 200 273.2 588.4 45 1.2 1990 37.2 150.3 212.2 949.2 178.2 1991 9.8 57.3 185.6 731.7 102.9 1992 238 199.9 180.3 949.7 180.8
27 3
274
Percentage of baiting time for Ghanaian baitboats Years 1986-1 992
70 T
60
50
40
30
20
10
Years
Figure 2 : Percentage baiting times for tuna boats 1986 - 1992
1 2 3 4 QUARTERS
Figure 3 : MEAN BAITING TIME & PERCENTAGE BAITING TIME FOR ALL SIX BAITBOATS
27 5
.......................................................
2
- W R +CR “ - G I A *YR
Figure 4 : @PUE OF POLI NETS IN THE FOUR MARITIME REGIONS OF GHANA
8 ~ .
........................................ ............................. ..
- CATCH --C @PUE
Figure 5 : NATIONAL CATCH AND CPUE OF ANCHOVY
Relation CPUEanchovy/%baiting time
1986 Qusrters 1992
--D- CpUE anchovy -‘-Percent Eaiting
Figure 6 : Relation CPUE of anchovy versus percentage of baiting time, by quarters 1986-1992
277
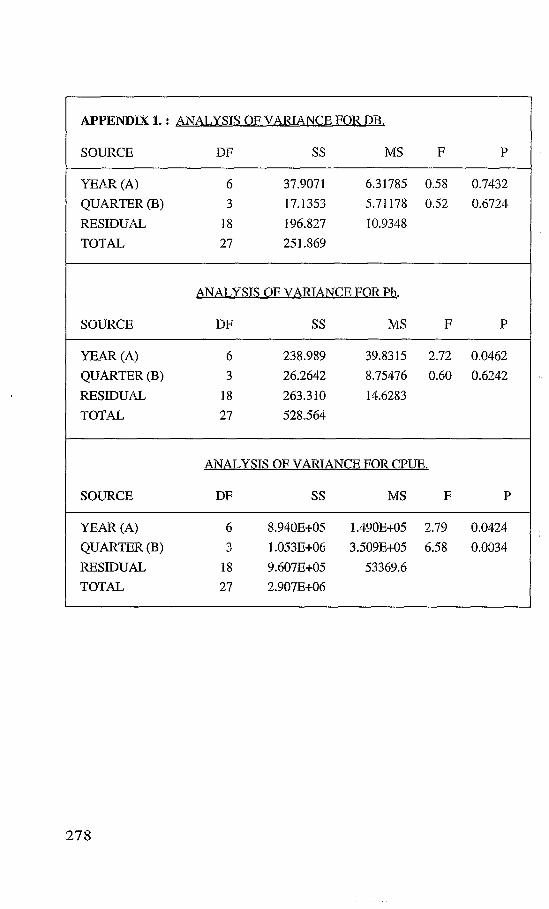
1. : ANALYSIS OF VARIANCE FOR DB.
S O U " DF SS MS F P
YEd4.R (A> 6 37.9071 6.31785 0.58 0.7432
QUARTER (B) 3 17.1353 5.71178 0.52 0.6724 RESIDUAL 18 196.827 10.9348 TOTAL 27 251.869
NALYSIS OF VARIANCE FOR Pb.
SOUECE DF ss MS F P
(A) 6 238.989 39.8315 2.72 0.0462 QUARTER (B) 3 26.2642 8.75476 0.60 0.6242 REsIDua 1s 263.310 14.6283 TOTAL 27 528.564
ANALYSIS OF VARIANCE FOR @PUE.
SOUFXE DF SS RIS F P
( 4 6 8.940E+05 1.490E+05 2.79 0.0424 QUARTHI (B) 3 1.053E+06 3.509E+05 6.58 0.0034 RESIDUAL 18 9.607E+05 53369.6 TOTAL 27 2.907Ei-06
27 8