Embed Size (px)
Citation preview
Tunnel erosion in East Gippsland
Tu
nn
el e
rosio
n in
East G
ipp
sla
nd
DEPARTMENT OF PRIMARY INDUSTRIES

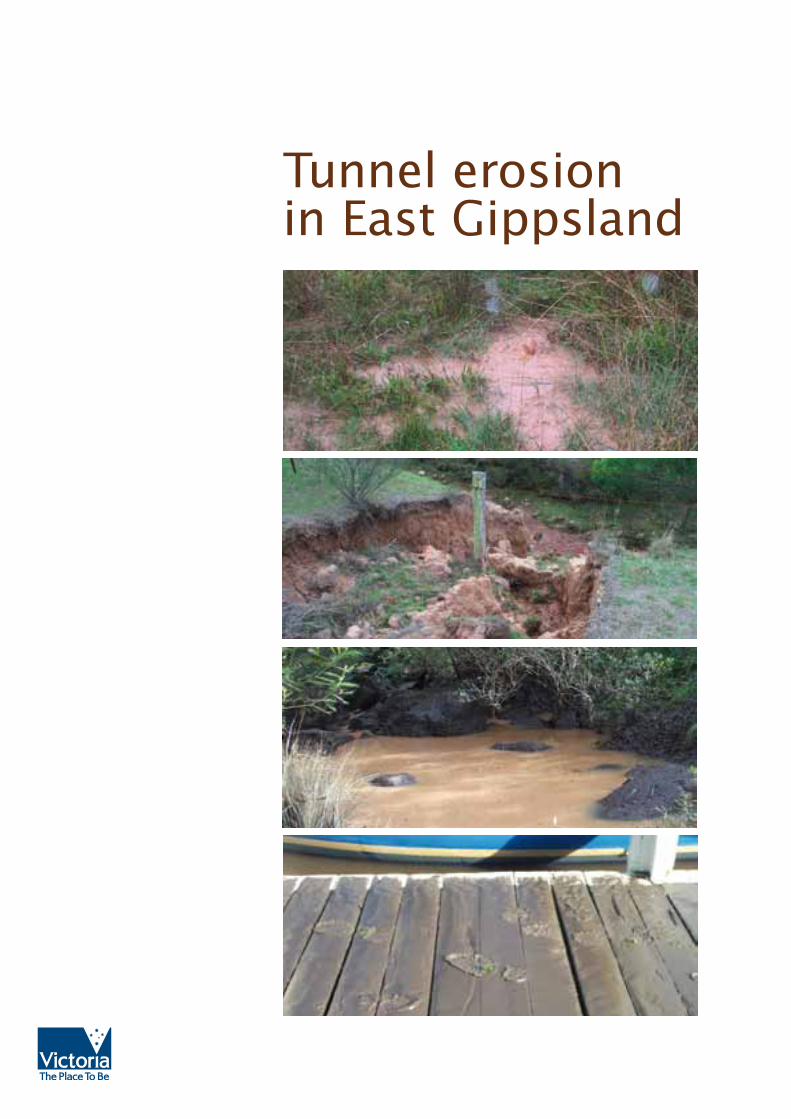
Tunnel erosion in East Gippsland

If you would like to receive this information/publication in an accessible format (such as large print or audio) please call the Customer Service Centre on 136 186; TTY: 1800122 969, or email [email protected]
Published by: Department of Primary Industries, Bairnsdale, Victoria 3953, AustraliaApril 2010
Authorised by: Victorian Government, 1 Spring Street, Melbourne, Victoria 3000 Australia
ISBN 978-1-74199-690-6 (print)ISBN 978-1-74199-691-3 (online)ISBN 978-1-74199-692-0 (CD-ROM)
© The State of Victoria, 2010
This publication is copyright. No part may be reproduced by any process except in accordance with the provisions of the Copyright Act 1968.
This publication is copyright. Apart from fair dealing for the purposes of private study, research, criticism or review as permitted under the Copyright Act 1968, no part may be reproduced, copied, transmitted in any form or by any means (electronic, mechanical or graphic) without the prior written permission of the State of Victoria, Department of Primary Industries. All requests and enquires should be directed to the Customer Service Centre, 136 186 or email [email protected]
Disclaimer:This publication may be of assistance to you but the State of Victoria and its employees do not guarantee that the publication is without flaw of any kind or is wholly appropriate for your particular purposes and therefore disclaims all liability for any error, loss or other consequence which may arise from you relying on any information in this publication.
For more information about DPI visit the website at www.dpi.vic.gov.au or call the Customer Service Centre on 136 186.
Department of
Primary Industries
Sustainability and Environment
3
Tunnel erosion in East Gippsland
3
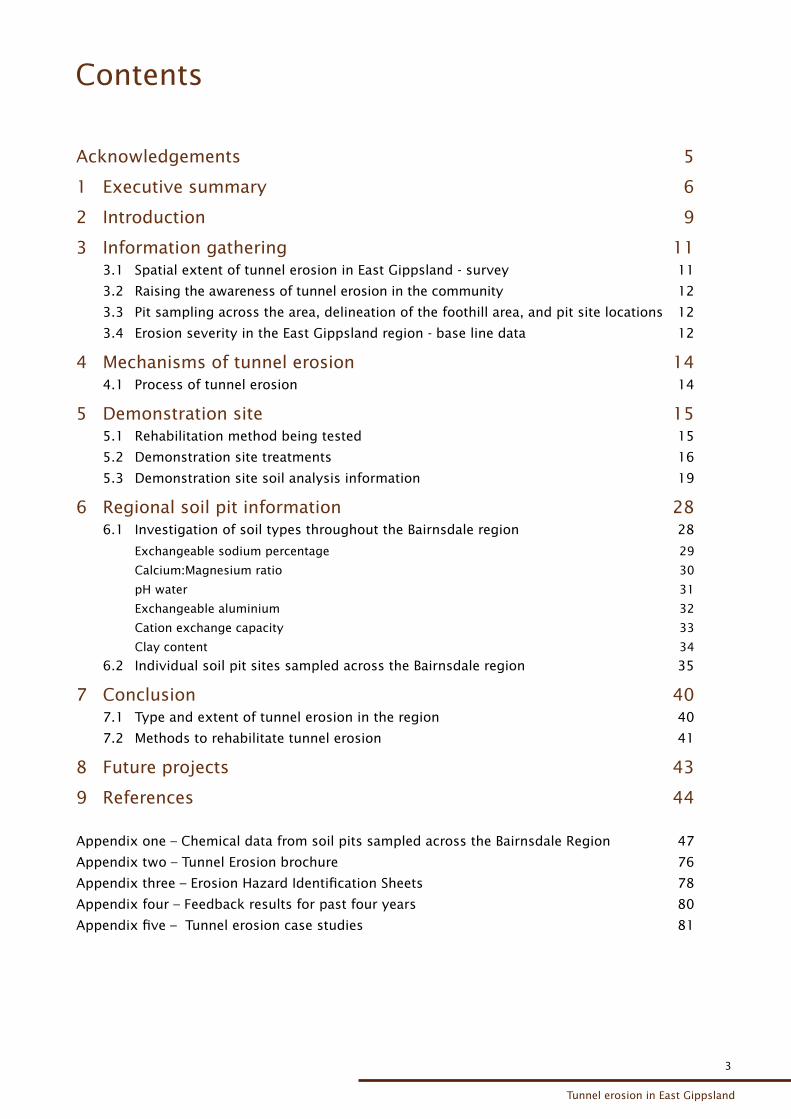
Contents
Acknowledgements 5
1 Executive summary 6
2 Introduction 9
3 Information gathering 11 3.1 Spatial extent of tunnel erosion in East Gippsland - survey 11
3.2 Raising the awareness of tunnel erosion in the community 12
3.3 Pit sampling across the area, delineation of the foothill area, and pit site locations 12
3.4 Erosion severity in the East Gippsland region - base line data 12
4 Mechanisms of tunnel erosion 14 4.1 Process of tunnel erosion 14
5 Demonstration site 15 5.1 Rehabilitation method being tested 15
5.2 Demonstration site treatments 16
5.3 Demonstration site soil analysis information 19
6 Regional soil pit information 28 6.1 Investigation of soil types throughout the Bairnsdale region 28
Exchangeable sodium percentage 29
Calcium:Magnesium ratio 30
pH water 31
Exchangeable aluminium 32
Cation exchange capacity 33
Clay content 34
6.2 Individual soil pit sites sampled across the Bairnsdale region 35
7 Conclusion 40 7.1 Type and extent of tunnel erosion in the region 40
7.2 Methods to rehabilitate tunnel erosion 41
8 Future projects 43
9 References 44
Appendix one – Chemical data from soil pits sampled across the Bairnsdale Region 47
Appendix two – Tunnel Erosion brochure 76
Appendix three – Erosion Hazard Identification Sheets 78
Appendix four – Feedback results for past four years 80
Appendix five – Tunnel erosion case studies 81
4
4
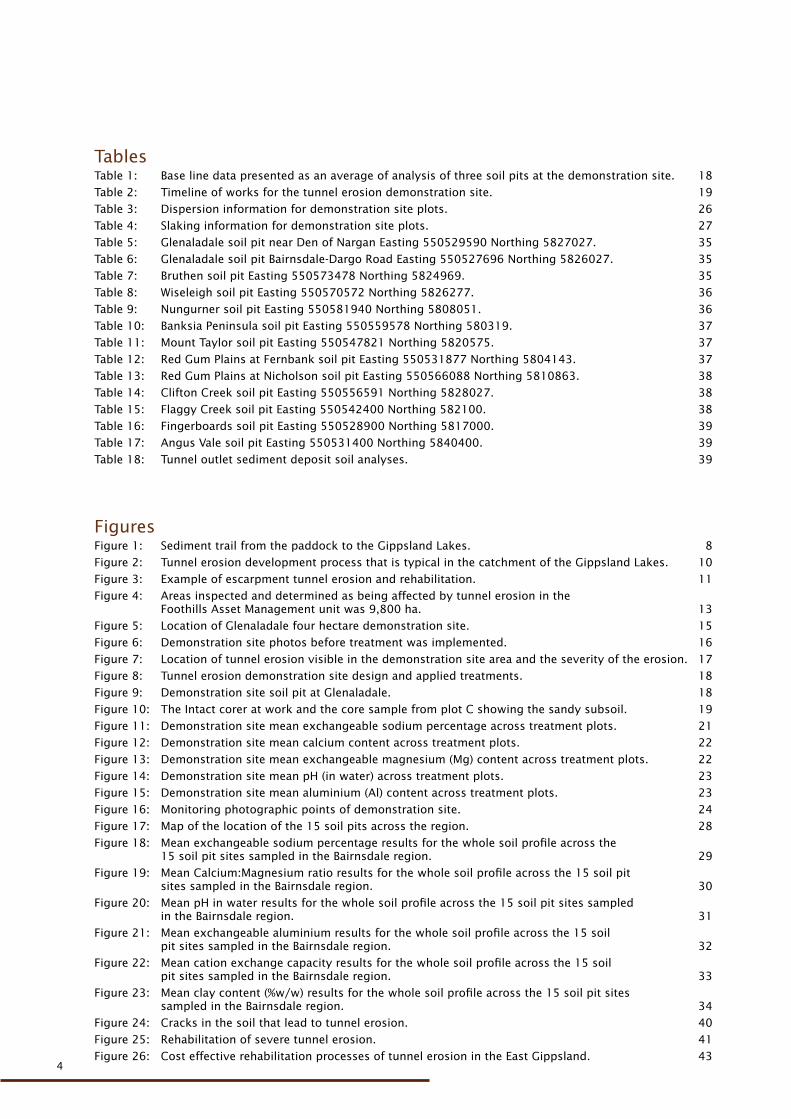
TablesTable 1: Base line data presented as an average of analysis of three soil pits at the demonstration site. 18Table 2: Timeline of works for the tunnel erosion demonstration site. 19Table 3: Dispersion information for demonstration site plots. 26Table 4: Slaking information for demonstration site plots. 27Table 5: Glenaladale soil pit near Den of Nargan Easting 550529590 Northing 5827027. 35Table 6: Glenaladale soil pit Bairnsdale-Dargo Road Easting 550527696 Northing 5826027. 35Table 7: Bruthen soil pit Easting 550573478 Northing 5824969. 35Table 8: Wiseleigh soil pit Easting 550570572 Northing 5826277. 36Table 9: Nungurner soil pit Easting 550581940 Northing 5808051. 36Table 10: Banksia Peninsula soil pit Easting 550559578 Northing 580319. 37Table 11: Mount Taylor soil pit Easting 550547821 Northing 5820575. 37Table 12: Red Gum Plains at Fernbank soil pit Easting 550531877 Northing 5804143. 37Table 13: Red Gum Plains at Nicholson soil pit Easting 550566088 Northing 5810863. 38Table 14: Clifton Creek soil pit Easting 550556591 Northing 5828027. 38Table 15: Flaggy Creek soil pit Easting 550542400 Northing 582100. 38Table 16: Fingerboards soil pit Easting 550528900 Northing 5817000. 39Table 17: Angus Vale soil pit Easting 550531400 Northing 5840400. 39Table 18: Tunnel outlet sediment deposit soil analyses. 39
FiguresFigure 1: Sediment trail from the paddock to the Gippsland Lakes. 8Figure 2: Tunnel erosion development process that is typical in the catchment of the Gippsland Lakes. 10Figure 3: Example of escarpment tunnel erosion and rehabilitation. 11Figure 4: Areas inspected and determined as being affected by tunnel erosion in the
Foothills Asset Management unit was 9,800 ha. 13Figure 5: Location of Glenaladale four hectare demonstration site. 15Figure 6: Demonstration site photos before treatment was implemented. 16Figure 7: Location of tunnel erosion visible in the demonstration site area and the severity of the erosion. 17Figure 8: Tunnel erosion demonstration site design and applied treatments. 18Figure 9: Demonstration site soil pit at Glenaladale. 18Figure 10: The Intact corer at work and the core sample from plot C showing the sandy subsoil. 19Figure 11: Demonstration site mean exchangeable sodium percentage across treatment plots. 21Figure 12: Demonstration site mean calcium content across treatment plots. 22Figure 13: Demonstration site mean exchangeable magnesium (Mg) content across treatment plots. 22Figure 14: Demonstration site mean pH (in water) across treatment plots. 23Figure 15: Demonstration site mean aluminium (Al) content across treatment plots. 23Figure 16: Monitoring photographic points of demonstration site. 24Figure 17: Map of the location of the 15 soil pits across the region. 28Figure 18: Mean exchangeable sodium percentage results for the whole soil profile across the
15 soil pit sites sampled in the Bairnsdale region. 29Figure 19: Mean Calcium:Magnesium ratio results for the whole soil profile across the 15 soil pit
sites sampled in the Bairnsdale region. 30Figure 20: Mean pH in water results for the whole soil profile across the 15 soil pit sites sampled
in the Bairnsdale region. 31Figure 21: Mean exchangeable aluminium results for the whole soil profile across the 15 soil
pit sites sampled in the Bairnsdale region. 32Figure 22: Mean cation exchange capacity results for the whole soil profile across the 15 soil
pit sites sampled in the Bairnsdale region. 33Figure 23: Mean clay content (%w/w) results for the whole soil profile across the 15 soil pit sites
sampled in the Bairnsdale region. 34Figure 24: Cracks in the soil that lead to tunnel erosion. 40Figure 25: Rehabilitation of severe tunnel erosion. 41Figure 26: Cost effective rehabilitation processes of tunnel erosion in the East Gippsland. 43
5
Tunnel erosion in East Gippsland
5
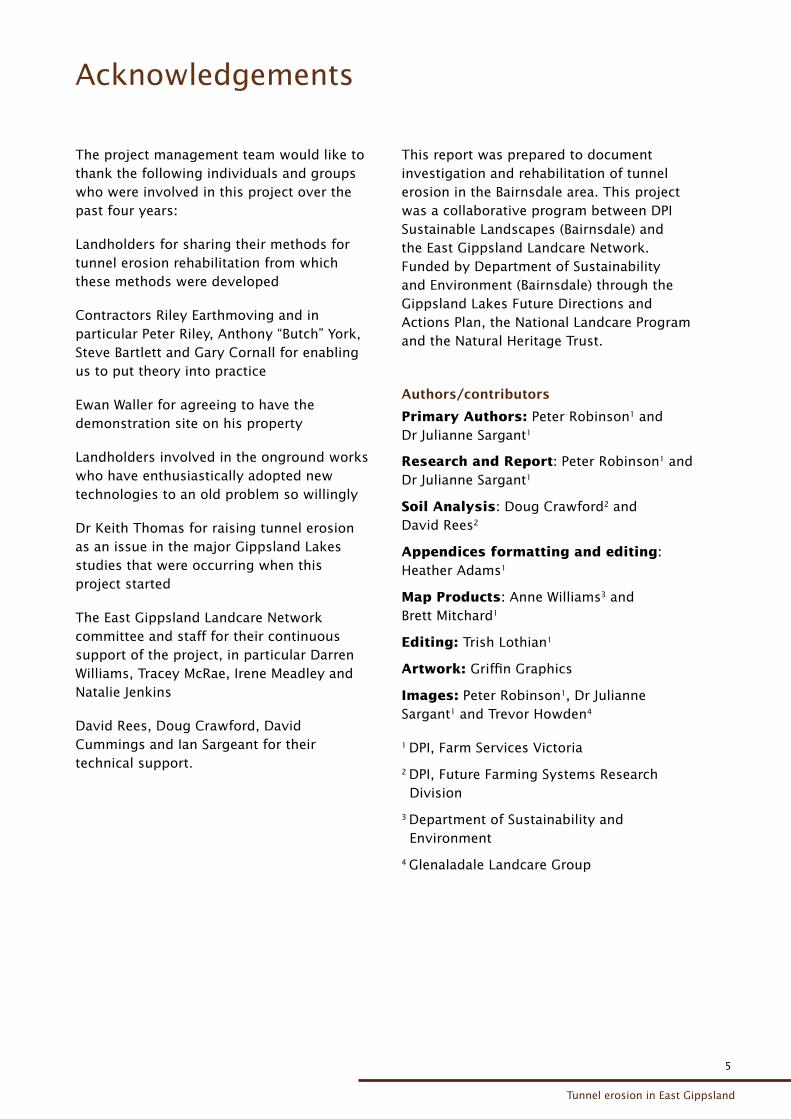
The project management team would like to thank the following individuals and groups who were involved in this project over the past four years:
Landholders for sharing their methods for tunnel erosion rehabilitation from which these methods were developed
Contractors Riley Earthmoving and in particular Peter Riley, Anthony “Butch” York, Steve Bartlett and Gary Cornall for enabling us to put theory into practice
Ewan Waller for agreeing to have the demonstration site on his property
Landholders involved in the onground works who have enthusiastically adopted new technologies to an old problem so willingly
Dr Keith Thomas for raising tunnel erosion as an issue in the major Gippsland Lakes studies that were occurring when this project started
The East Gippsland Landcare Network committee and staff for their continuous support of the project, in particular Darren Williams, Tracey McRae, Irene Meadley and Natalie Jenkins
David Rees, Doug Crawford, David Cummings and Ian Sargeant for their technical support.
Acknowledgements
This report was prepared to document investigation and rehabilitation of tunnel erosion in the Bairnsdale area. This project was a collaborative program between DPI Sustainable Landscapes (Bairnsdale) and the East Gippsland Landcare Network. Funded by Department of Sustainability and Environment (Bairnsdale) through the Gippsland Lakes Future Directions and Actions Plan, the National Landcare Program and the Natural Heritage Trust.
Authors/contributors
Primary Authors: Peter Robinson1 and Dr Julianne Sargant1
Research and Report: Peter Robinson1 and Dr Julianne Sargant1
Soil Analysis: Doug Crawford2 and David Rees2
Appendices formatting and editing: Heather Adams1
Map Products: Anne Williams3 and Brett Mitchard1
Editing: Trish Lothian1
Artwork: Griffin Graphics
Images: Peter Robinson1, Dr Julianne Sargant1 and Trevor Howden4
1 DPI, Farm Services Victoria
2 DPI, Future Farming Systems Research Division
3 Department of Sustainability and Environment
4 Glenaladale Landcare Group
6
6
Tunnel erosion poses a severe threat to livestock and people, inhibits use of the land and has considerable off-site impacts through suspended sediments and nutrients discharged to waterways.
This document reports on work done to recognise and reduce the tunnel erosion problem in East Gippsland. The work was initiated in response to sediment and nutrient entering the Gippsland Lakes via the Mitchell River, and the disruption to Bairnsdale’s water supply through periods of high turbidity in the Mitchell River. Work was done in two stages.
Stage 1
1. Determined the extent of tunnel erosion in the region.
2. Increased the awareness of tunnel erosion and how to detect it in the early stages of development.
3. Evaluated methods to rehabilitate tunnel erosion in the East Gippsland region using a combination of heavy machinery disturbance, and the amount and type of calcium required to ameliorate the soil dispersiveness in these soils.
In the past recommendations for the rehabilitation of tunnel erosion have been to revegetate and construct stock exclusion fencing. Knowledge about tunnel erosion in the Bairnsdale region had come from extension staff’s field knowledge through dealing with landholder requests for technical advice. Site visits by staff observed that where the erosion was frequently very visible, it was already threatening high value assets making remediation difficult. Another field observation was that tunnel erosion in East Gippsland affects whole farms and the traditional recommendations are therefore difficult to implement if the farms are to remain profitable and productive.
1 Executive summary
Stage 1 was carried out as a project “Reduction of sediment and nutrient export from tunnel affected areas of the Mitchell, Nicholson and Tambo Rivers”. It was funded by the Gippsland Lakes Future Directions and Actions Plan. This project has been the main focus of the information in this report.
Stage 2
This stage was the implementation of a tunnel erosion control using a rehabilitation technique developed from the demonstration in Stage 1.
Overall the demonstration site and the regional soil analysis provided sufficient data to develop a method for tunnel erosion rehabilitation that was comparable to gully erosion works termed “cost effective” in this report that have been used extensively in the East Gippsland region. As well, this report provides information about the extent, severity and location of tunnel erosion in this region.
The final cost effective method of rehabilitation for tunnel erosion that was developed involves the following process:
• application of 4t/ha of gypsum
• single pass deep ripping by a dozer no less than 38 tonnes and 300 horse power on contour with the rip lines 1 metre apart at 1 metre deep over the whole local paddock catchment area from top to bottom
• establishment of perennial pasture and in some cases, in combination with a crop in the first year depending on the slope of the site
• trees indigenous to the area were planted where it was impractical to put the sites back into production.
7
Tunnel erosion in East Gippsland
7
This stage constitutes the work of two projects: “East Gippsland Catchment Protection Project” (funded by Department of Sustainability and Environment Sustainable Landscapes Section and the Gippsland Lakes Future Directions and Actions Plan); and “What’s Beneath Your Feet – Sustainable Soil Management” (a collaborative program between DPI and the East Gippsland Landcare Network, funded by the National Landcare Program). Together they expanded the trial work into large scale rehabilitation works across the foothills region north of Bairnsdale that form part of the catchment for the Gippsland Lakes.
Both these projects have been implemented over the four year period from 2004 to 2008 and 445 hectares of tunnel erosion affected agricultural land has been rehabilitated, 37 km of fencing constructed and 10,500 trees planted. The total project cost has been $1.58 million with $800,000 of government funds and $780,000 of landholder contribution. This has prevented an estimated 2,850 tonnes of soil from entering the Bairnsdale region’s major rivers and the Gippsland Lakes.
Future projects
The method of rehabilitation of tunnel erosion in East Gippsland’s Foothill area has developed as result of these projects. However, further work is required to provide landholders with recommendations of how to manage these areas into the future to monitor rehabilitated sites and refine repair methods.
The demonstration site results indicate that soil disturbance is an effective method in itself of rehabilitation. This report has established the soils are highly dispersive (15 tonnes of gypsum is needed to ameliorate the soil) and recommended rates (4 tonnes of gypsum per year) are unable to address this issue in one year. Therefore further investigations are needed to determine effective application rates and follow-up application of ameliorants after rehabilitation works are completed, would be beneficial and if so at what rates and at the same time ensuring they are cost effective in the long term for the landholders.
8
8
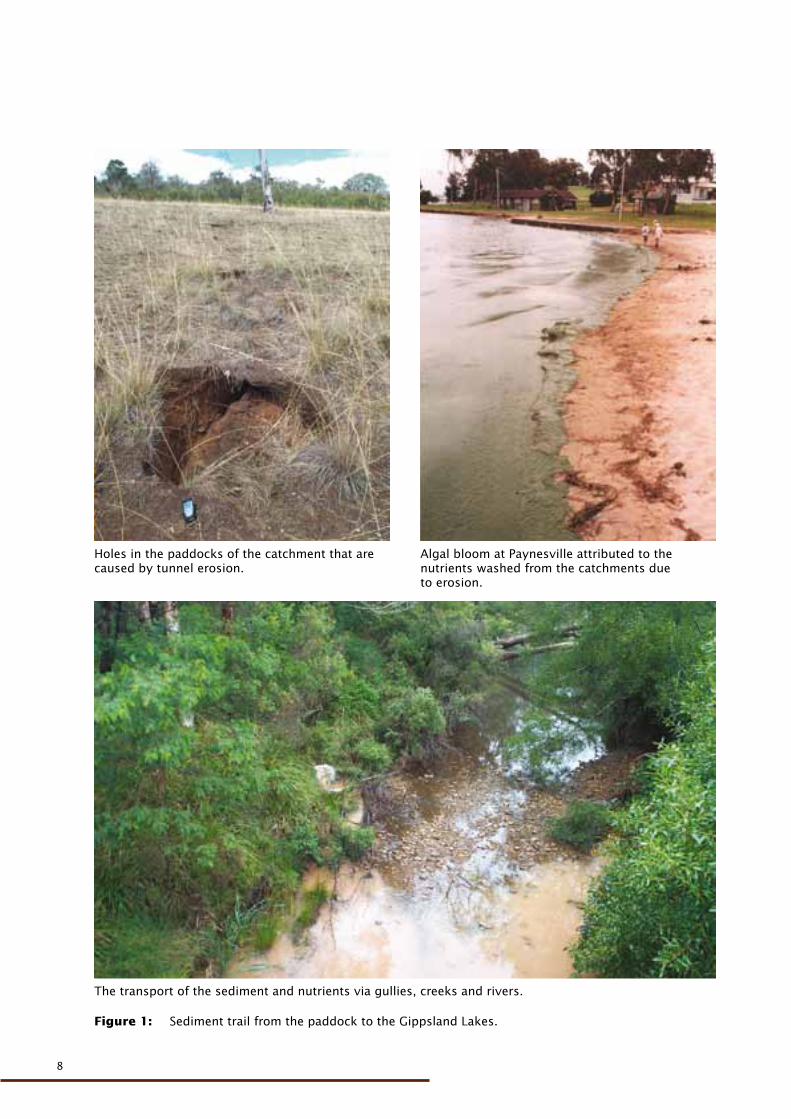
Figure 1: Sediment trail from the paddock to the Gippsland Lakes.
Holes in the paddocks of the catchment that are caused by tunnel erosion.
Algal bloom at Paynesville attributed to the nutrients washed from the catchments due to erosion.
The transport of the sediment and nutrients via gullies, creeks and rivers.
9
Tunnel erosion in East Gippsland
9
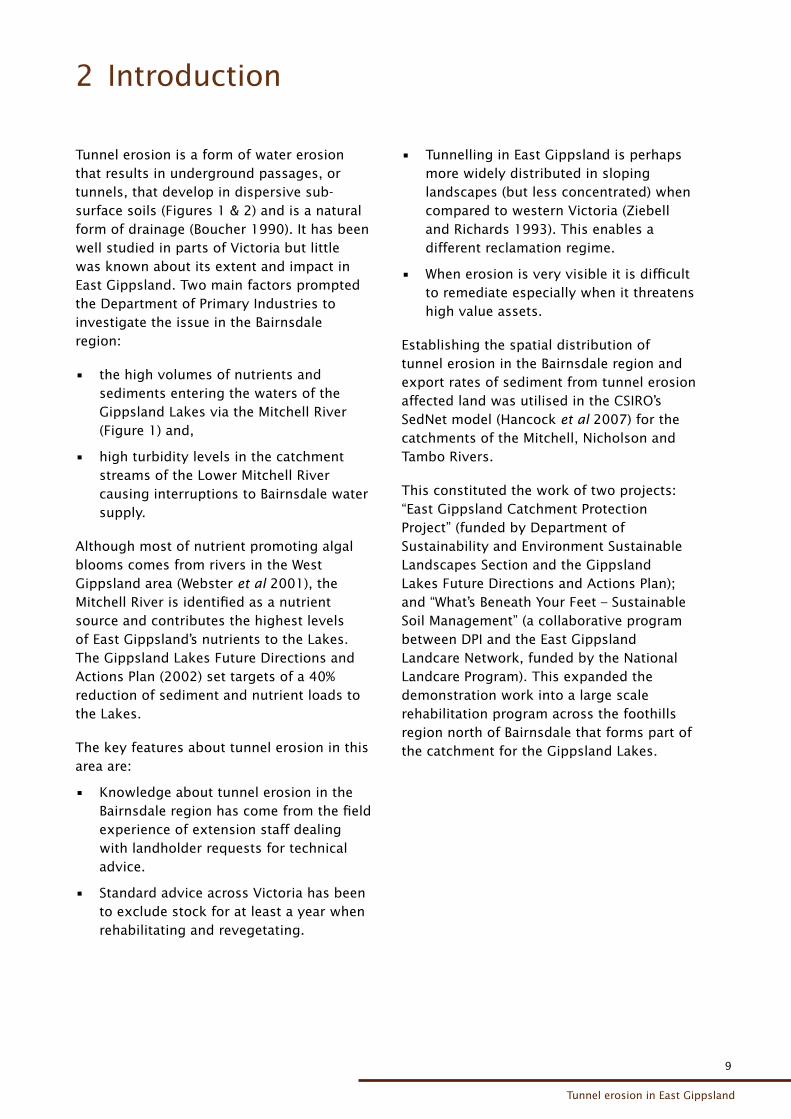
2 Introduction
Tunnel erosion is a form of water erosion that results in underground passages, or tunnels, that develop in dispersive sub-surface soils (Figures 1 & 2) and is a natural form of drainage (Boucher 1990). It has been well studied in parts of Victoria but little was known about its extent and impact in East Gippsland. Two main factors prompted the Department of Primary Industries to investigate the issue in the Bairnsdale region:
• the high volumes of nutrients and sediments entering the waters of the Gippsland Lakes via the Mitchell River (Figure 1) and,
• high turbidity levels in the catchment streams of the Lower Mitchell River causing interruptions to Bairnsdale water supply.
Although most of nutrient promoting algal blooms comes from rivers in the West Gippsland area (Webster et al 2001), the Mitchell River is identified as a nutrient source and contributes the highest levels of East Gippsland’s nutrients to the Lakes. The Gippsland Lakes Future Directions and Actions Plan (2002) set targets of a 40% reduction of sediment and nutrient loads to the Lakes.
The key features about tunnel erosion in this area are:
• Knowledge about tunnel erosion in the Bairnsdale region has come from the field experience of extension staff dealing with landholder requests for technical advice.
• Standard advice across Victoria has been to exclude stock for at least a year when rehabilitating and revegetating.
• Tunnelling in East Gippsland is perhaps more widely distributed in sloping landscapes (but less concentrated) when compared to western Victoria (Ziebell and Richards 1993). This enables a different reclamation regime.
• When erosion is very visible it is difficult to remediate especially when it threatens high value assets.
Establishing the spatial distribution of tunnel erosion in the Bairnsdale region and export rates of sediment from tunnel erosion affected land was utilised in the CSIRO’s SedNet model (Hancock et al 2007) for the catchments of the Mitchell, Nicholson and Tambo Rivers.
This constituted the work of two projects: “East Gippsland Catchment Protection Project” (funded by Department of Sustainability and Environment Sustainable Landscapes Section and the Gippsland Lakes Future Directions and Actions Plan); and “What’s Beneath Your Feet – Sustainable Soil Management” (a collaborative program between DPI and the East Gippsland Landcare Network, funded by the National Landcare Program). This expanded the demonstration work into a large scale rehabilitation program across the foothills region north of Bairnsdale that forms part of the catchment for the Gippsland Lakes.
10
10
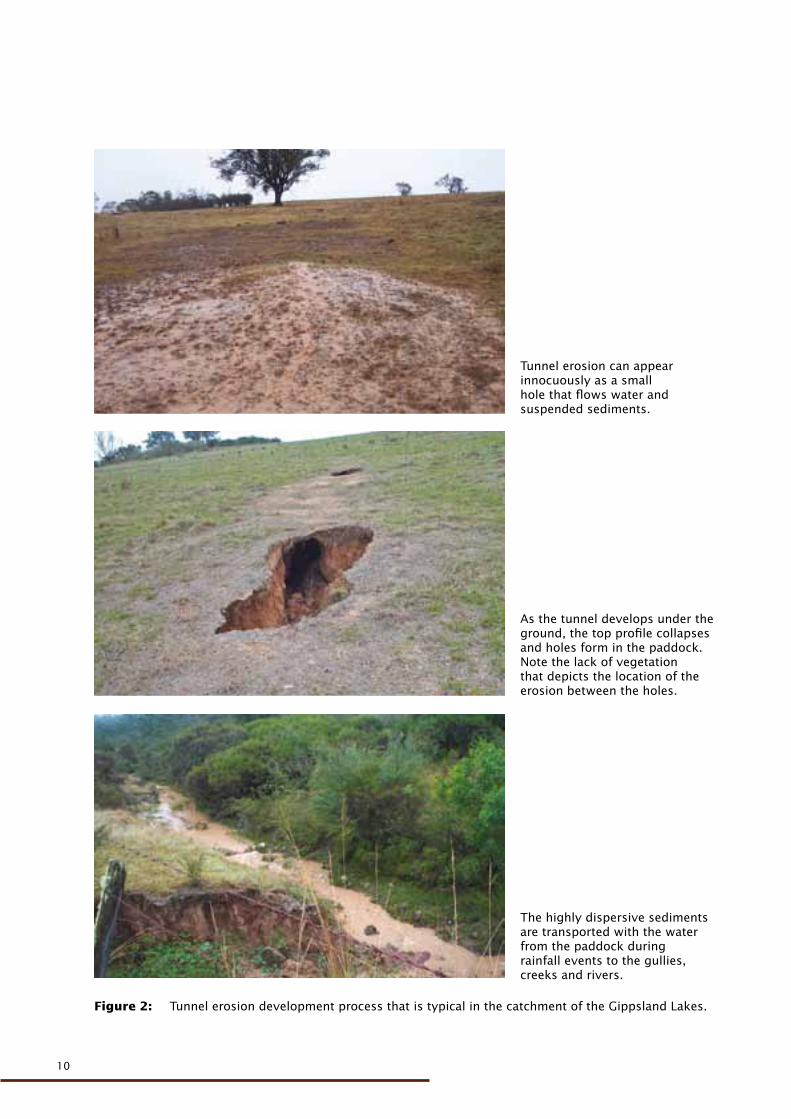
Figure 2: Tunnel erosion development process that is typical in the catchment of the Gippsland Lakes.
Tunnel erosion can appear innocuously as a small hole that flows water and suspended sediments.
As the tunnel develops under the ground, the top profile collapses and holes form in the paddock. Note the lack of vegetation that depicts the location of the erosion between the holes.
The highly dispersive sediments are transported with the water from the paddock during rainfall events to the gullies, creeks and rivers.
11
Tunnel erosion in East Gippsland
11
3 Information gathering
3.1 Spatial extent of tunnel erosion in East Gippsland - survey
Initially DPI contacted 3,047 landholders in an area around Bairnsdale from Stratford in the east to Lake Tyers in the west and Dargo in the north including Buchan, Bruthen, Gelantipy and Wulgulmerang. Property maps and a questionnaire about erosion severity were then sent to respondents. As a result over 100 properties were inspected. Erosion was assessed as detailed in Appendix three. Soil pits were excavated and examined at 15 locations both with and without tunnel erosion across the survey area (Figure 17). As a result of the survey and property inspections, tunnel erosion was classified as two different types in the East Gippsland region — and named ‘paddock’ and ‘escarpment’ tunnel erosion. The areas that ‘Paddock’ tunnel erosion (Figure 2) is
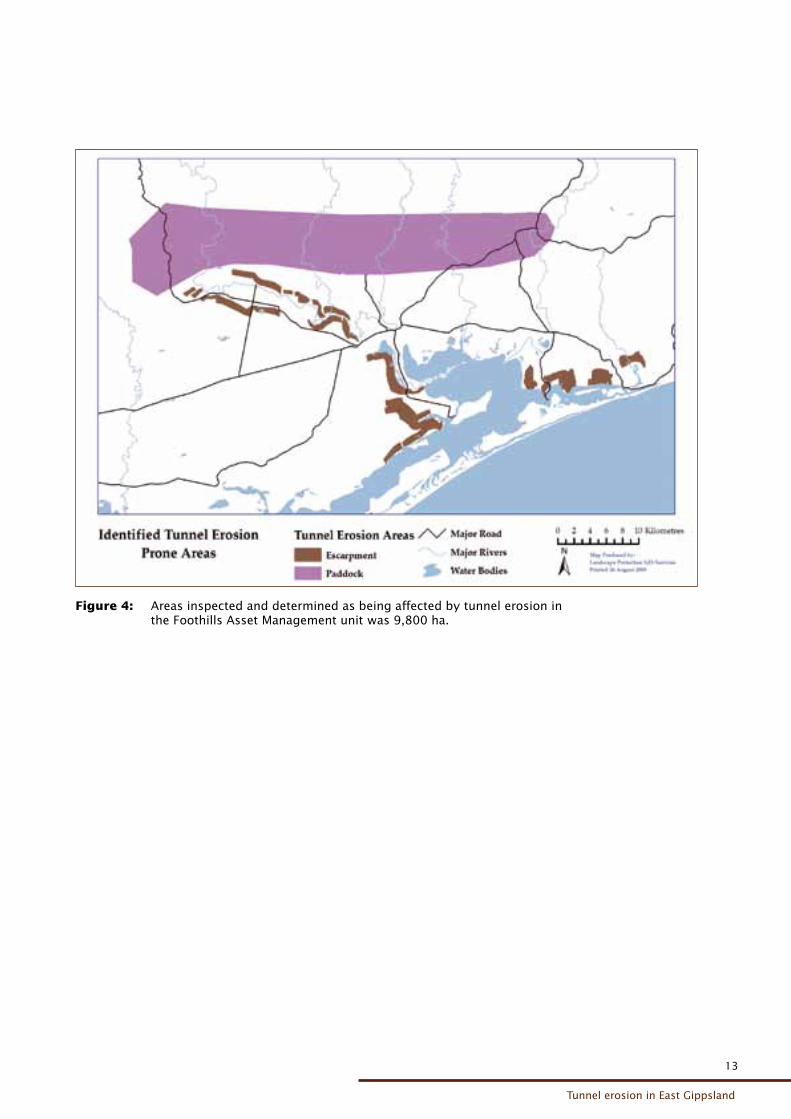
predominant is mainly the Foothill region and usually develops at depths of up to 1.5 metres deep. ‘Escarpment’ tunnel erosion (Figure 3) is predominatly located on the Gippsland Lakes foreshore and frontage of the major river areas. These different types of erosion and where they occur have been depicted in Figure 4.
The Foothills area (53,466 hectares) was identified from property inspections as having the highest proportion of tunnel erosion in the region (Figure 4). The Glenaladale area in the Foothills north of Bairnsdale was identified as the area of highest priority for remediation works because of the threat posed by tunnel erosion to quality of water for both the town’s water supply and the Lakes, and to farm safety.
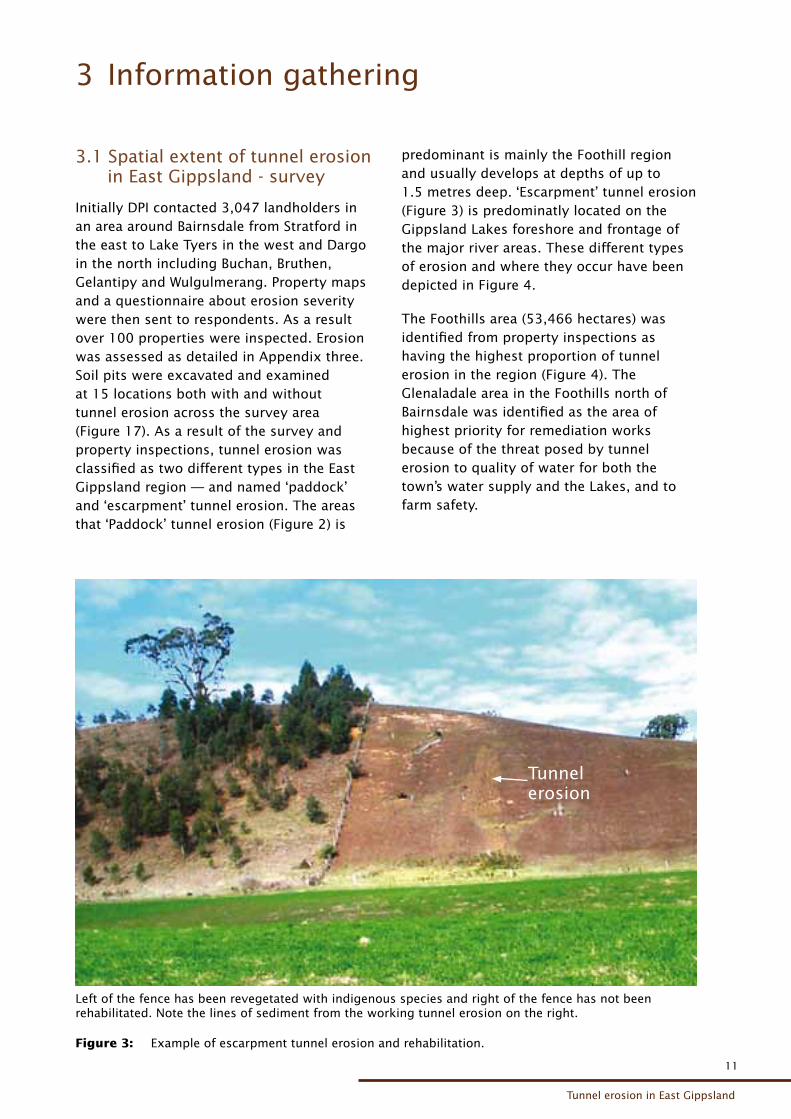
Figure 3: Example of escarpment tunnel erosion and rehabilitation.
Left of the fence has been revegetated with indigenous species and right of the fence has not been rehabilitated. Note the lines of sediment from the working tunnel erosion on the right.
Tunnel erosion
12
12
3.2 Raising the awareness of tunnel erosion in the community
From this regional survey a large gap was identified in regard to information available to service providers and land managers about how to identify tunnel erosion in East Gippsland. To resolve this knowledge gap, an East Gippsland Tunnel Erosion identification brochure (Appendix two) was developed.
The brochure has been used to support talks, radio interviews and media articles. Talks involved Landcare groups, EGCMA Catchment Advisory Groups, school and TAFE students and individual property owners in discussions of tunnel erosion to increase awareness of the processes and the effects of the erosion on and off the farm.
3.3 Pit sampling across the area, delineation of the foothill area, and pit site locations
Soil pits were excavated at 15 locations across the Bairnsdale region (see Figure 17). Of these, 10 were located in the Foothills and five on the Red Gum Plains (East Gippsland Catchment Management Authority 2005). Locations were based on DPI field staff knowledge and the postal survey results. Samples were taken at different depths in the soil profiles by soil scientists Doug Crawford and David Rees. The following analyses were performed by the State Chemical Laboratories:- total phosphorous; available phosphorous or Olsen P; exchangeable calcium, magnesium, sodium and potassium and hydrogen;
electrical conductivity; pH; total soluble solids; total carbon; organic matter; slaking; dispersion; and the proportions of coarse sand, silt and clay. From these results, the following were calculated: cation exchange capacity (CEC); calcium:magnesium ratio (Ca:Mg); and the amounts of calcium, magnesium; sodium and potassium expressed as a percentage of the cation exchange capacity. The results of these analyses are detailed in Section 6 of this report.
3.4 Erosion severity in the East Gippsland region - base line data
The sediment transport from the Foothills area (Figure 4) as a result of tunnel erosion has been estimated as high as 1.6 tonnes of soil per hectare per year from severely affected areas to as low as 0.54 tonnes per hectare per year in paddocks low to moderately affected by tunnel erosion (Hancock et al 2007). The CSIRO SedNet model has estimated a soil loss of 8,000 tonnes per year from the Bairnsdale Foothills area, with 5,000 tonnes of soil per year reaching the Gippsland Lakes. In comparison gully erosion has also been modelled and estimated to produce sediment at between 1,000 and 5,000 tonnes per year entering the Gippsland Lakes (Hancock et al 2007). This information indicates that tunnel erosion is as effective at removing soil from the catchments as gully erosion and poses the same environmental and production risks in this region.
13
Tunnel erosion in East Gippsland
13
Figure 4: Areas inspected and determined as being affected by tunnel erosion in the Foothills Asset Management unit was 9,800 ha.
14
14
4.1 Process of tunnel erosion
Soils susceptible to tunnel erosion typically have hard setting surface soils and dispersive subsoils (i.e. contain clay particles which readily separate into individual mobile particles when in direct contact with water). It often, but not exclusively, occurs on duplex soils (i.e. soils with sandy or loamy surface horizons with a sharp or clear boundary to clay subsoils) which are sodic. Sodicity is a measure of the exchangeable sodium in relation to other exchangeable cations (mainly calcium and magnesium) held on negative charges on the clay and is expressed as the exchangeable sodium percentage (ESP). If the ESP value is less than 8, the soil is non-sodic; from 8 – 15 the soil is sodic; and greater than 15 the soil is strongly sodic. The ESP and other exchangeable cation data is given in Section 5 of this report (Sargeant I and Sargant J 2005).
The chemical process of dispersion is caused by high levels of exchangeable sodium inherently present in sodic soils. When sodic soils are wet the sodium cations held onto the clay particles are surrounded by a water shell that forces the clay particles away from each other. This in turn results in the disintegration of the soil aggregates and causes dispersion (Lines-Kelly et al 2000). Thus when the sodic B horizon becomes wet, the clays that bind the fine and larger particles (silt and sand) together into soil aggregates swell and become suspended in the soil water. Dispersion typically affects clay particles less than 0.002 mm in diameter. Slaking is said to occur when the soil aggregates collapse but dispersion occurs when soil aggregates not only collapse but subsequently separate out into
4 Mechanisms of tunnel erosion
individual soil particles. Thus dispersion influences the microscopic structure of the soil through the breaking of the chemical bonds that hold the soil together (Peverill et al 2001). Once dispersed the clay particles then move into the soil pores from which they are easily washed via the tunnels away from the paddock.
Chemical treatment to modify dispersion involves the addition of calcium compounds to reduce the quantity of sodium ions on the exchange complex of clays by direct replacement. The two main sources of calcium for this purpose are gypsum and lime. There are two main effects when added to the soil. Firstly, the electrolyte strength is raised in the soil solution which suppresses dispersion and swelling. Secondly, for both lime and gypsum, calcium replaces the sodium at exchangeable sites (Peverill et al 2001). The sodium cations then become dissolved in the soil solution and usually leached from the system (Abbott and McKenzie 1996). This process can lead to better aggregation, enhanced porosity and improved soil structure. Historically in Australia gypsum has been used to reduce the dispersion of sodic soils (McKenzie et al 1993). However, studies overseas have shown that lime, while not as soluble as gypsum, still has the same chemical effects and may even remain in the soils for a longer period of time (Nadiu et al 1993). The other significant difference between lime and gypsum is the cost. Locally sourced lime delivered and spread in East Gippsland is half the cost of gypsum. Thus lime was included in the demonstration as a potential alternative to gypsum for the remediation of dispersive soils under East Gippsland conditions.
15
Tunnel erosion in East Gippsland
15
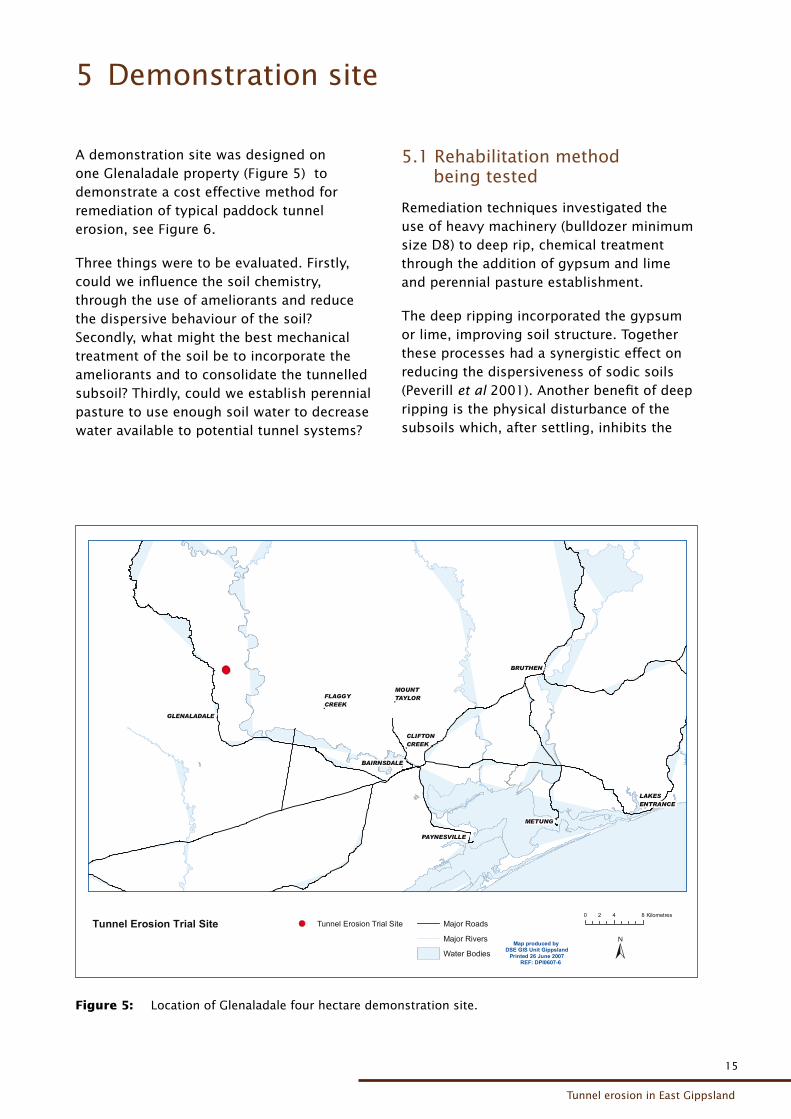
A demonstration site was designed on one Glenaladale property (Figure 5) to demonstrate a cost effective method for remediation of typical paddock tunnel erosion, see Figure 6.
Three things were to be evaluated. Firstly, could we influence the soil chemistry, through the use of ameliorants and reduce the dispersive behaviour of the soil? Secondly, what might the best mechanical treatment of the soil be to incorporate the ameliorants and to consolidate the tunnelled subsoil? Thirdly, could we establish perennial pasture to use enough soil water to decrease water available to potential tunnel systems?
FLAGGYCREEKFLAGGYCREEK
MOUNTTAYLORMOUNTTAYLOR
CLIFTONCREEKCLIFTONCREEK
PAYNESVILLEPAYNESVILLE
METUNGMETUNG
BAIRNSDALEBAIRNSDALE
GLENALADALEGLENALADALE
BRUTHENBRUTHEN
LAKESENTRANCELAKESENTRANCE
Map produced by DSE GIS Unit Gippsland
Printed 26 June 2007 REF: DPI0607-6
0 4 82 Kilometres
Tunnel Erosion Trial Site Major Roads
Major Rivers
Water Bodies
Tunnel Erosion Trial Site
Figure 5: Location of Glenaladale four hectare demonstration site.
5 Demonstration site
5.1 Rehabilitation method being tested
Remediation techniques investigated the use of heavy machinery (bulldozer minimum size D8) to deep rip, chemical treatment through the addition of gypsum and lime and perennial pasture establishment.
The deep ripping incorporated the gypsum or lime, improving soil structure. Together these processes had a synergistic effect on reducing the dispersiveness of sodic soils (Peverill et al 2001). Another benefit of deep ripping is the physical disturbance of the subsoils which, after settling, inhibits the
16
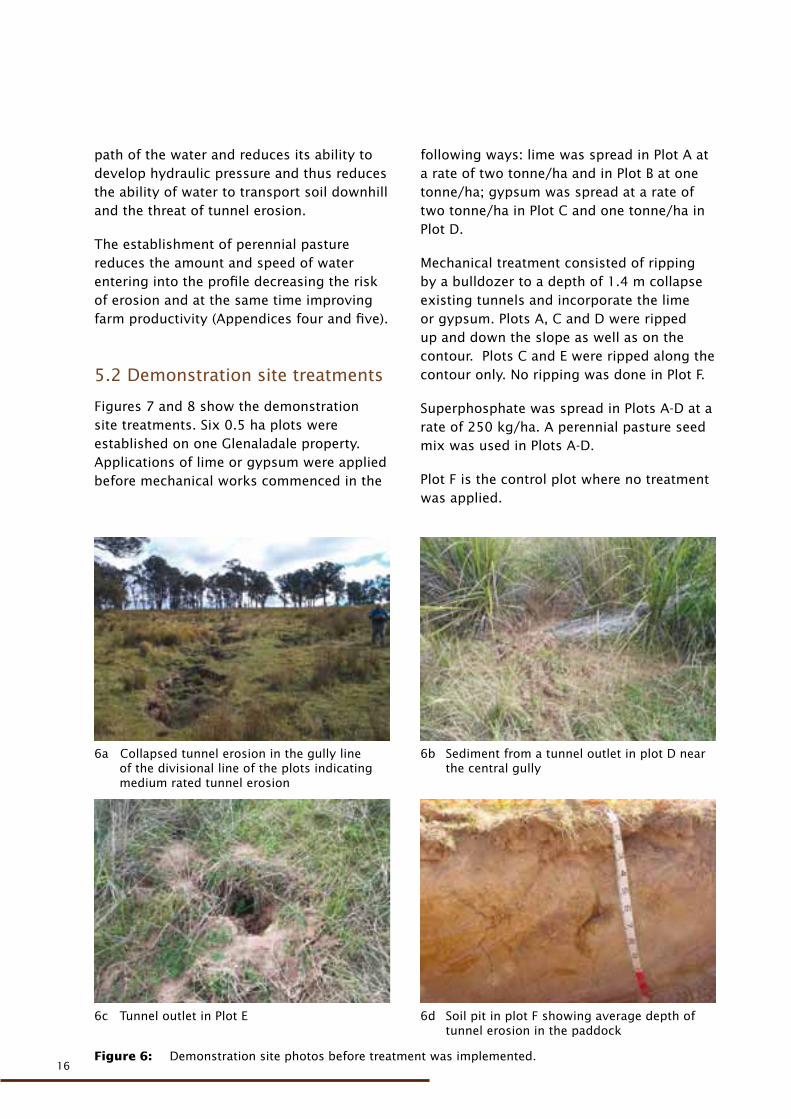
16Figure 6: Demonstration site photos before treatment was implemented.
6d Soil pit in plot F showing average depth of tunnel erosion in the paddock
6c Tunnel outlet in Plot E
6b Sediment from a tunnel outlet in plot D near the central gully
6a Collapsed tunnel erosion in the gully line of the divisional line of the plots indicating medium rated tunnel erosion
path of the water and reduces its ability to develop hydraulic pressure and thus reduces the ability of water to transport soil downhill and the threat of tunnel erosion.
The establishment of perennial pasture reduces the amount and speed of water entering into the profile decreasing the risk of erosion and at the same time improving farm productivity (Appendices four and five).
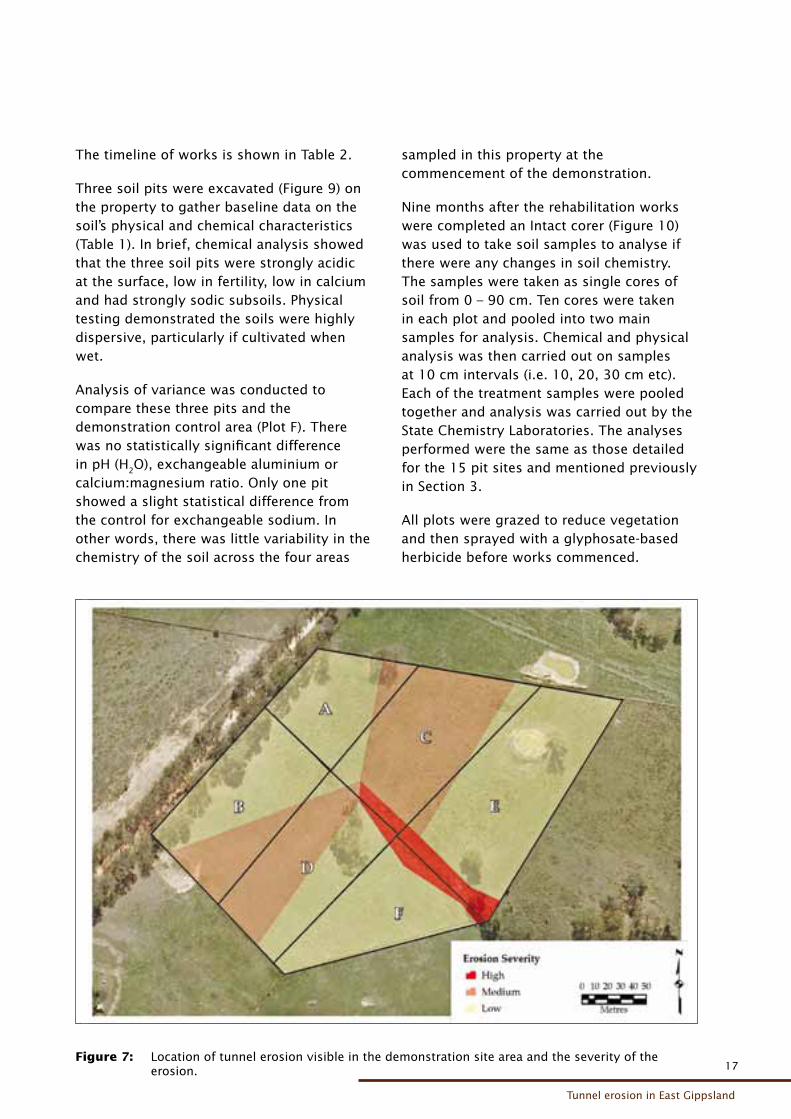
5.2 Demonstration site treatments
Figures 7 and 8 show the demonstration site treatments. Six 0.5 ha plots were established on one Glenaladale property. Applications of lime or gypsum were applied before mechanical works commenced in the
following ways: lime was spread in Plot A at a rate of two tonne/ha and in Plot B at one tonne/ha; gypsum was spread at a rate of two tonne/ha in Plot C and one tonne/ha in Plot D.
Mechanical treatment consisted of ripping by a bulldozer to a depth of 1.4 m collapse existing tunnels and incorporate the lime or gypsum. Plots A, C and D were ripped up and down the slope as well as on the contour. Plots C and E were ripped along the contour only. No ripping was done in Plot F.
Superphosphate was spread in Plots A-D at a rate of 250 kg/ha. A perennial pasture seed mix was used in Plots A-D.
Plot F is the control plot where no treatment was applied.
17
Tunnel erosion in East Gippsland
17Figure 7: Location of tunnel erosion visible in the demonstration site area and the severity of the
erosion.
The timeline of works is shown in Table 2.
Three soil pits were excavated (Figure 9) on the property to gather baseline data on the soil’s physical and chemical characteristics (Table 1). In brief, chemical analysis showed that the three soil pits were strongly acidic at the surface, low in fertility, low in calcium and had strongly sodic subsoils. Physical testing demonstrated the soils were highly dispersive, particularly if cultivated when wet.
Analysis of variance was conducted to compare these three pits and the demonstration control area (Plot F). There was no statistically significant difference in pH (H2O), exchangeable aluminium or calcium:magnesium ratio. Only one pit showed a slight statistical difference from the control for exchangeable sodium. In other words, there was little variability in the chemistry of the soil across the four areas
sampled in this property at the commencement of the demonstration.
Nine months after the rehabilitation works were completed an Intact corer (Figure 10) was used to take soil samples to analyse if there were any changes in soil chemistry. The samples were taken as single cores of soil from 0 – 90 cm. Ten cores were taken in each plot and pooled into two main samples for analysis. Chemical and physical analysis was then carried out on samples at 10 cm intervals (i.e. 10, 20, 30 cm etc). Each of the treatment samples were pooled together and analysis was carried out by the State Chemistry Laboratories. The analyses performed were the same as those detailed for the 15 pit sites and mentioned previously in Section 3.
All plots were grazed to reduce vegetation and then sprayed with a glyphosate-based herbicide before works commenced.
18
18
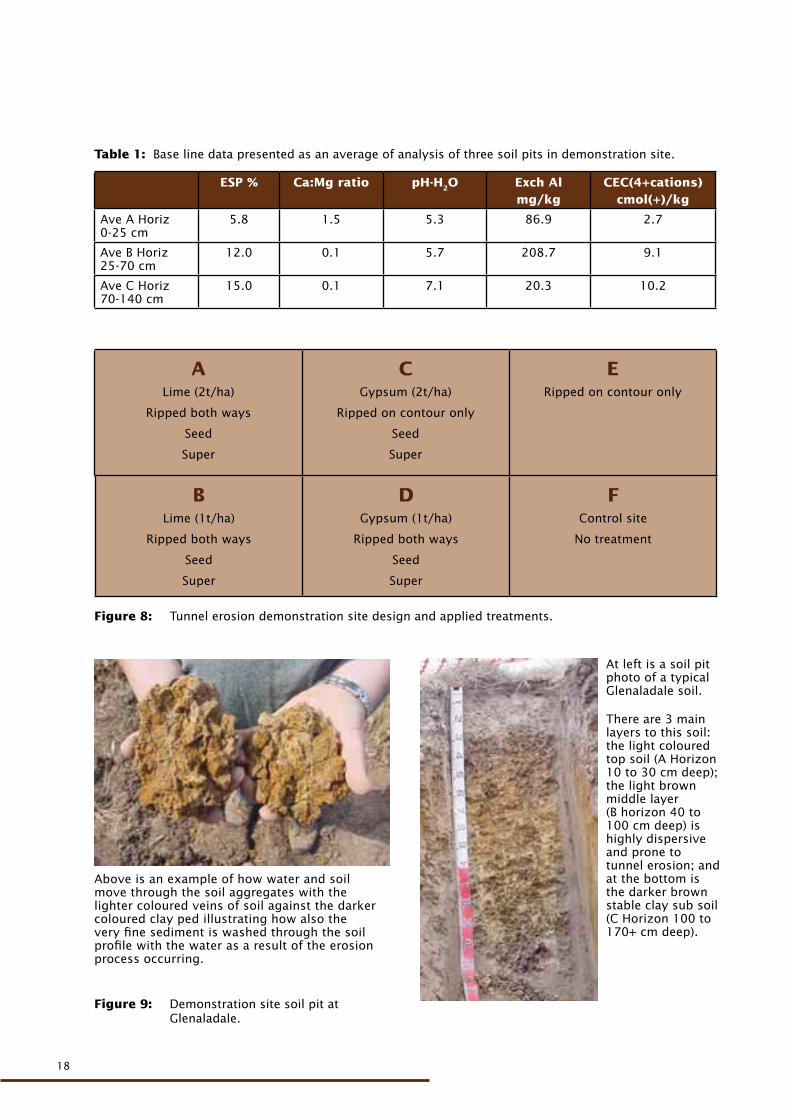
ESP % Ca:Mg ratio pH-H2O Exch Almg/kg
CEC(4+cations)cmol(+)/kg
Ave A Horiz 0-25 cm
5.8 1.5 5.3 86.9 2.7
Ave B Horiz 25-70 cm
12.0 0.1 5.7 208.7 9.1
Ave C Horiz 70-140 cm
15.0 0.1 7.1 20.3 10.2
Table 1: Base line data presented as an average of analysis of three soil pits in demonstration site.
Figure 9: Demonstration site soil pit at Glenaladale.
Above is an example of how water and soil move through the soil aggregates with the lighter coloured veins of soil against the darker coloured clay ped illustrating how also the very fine sediment is washed through the soil profile with the water as a result of the erosion process occurring.
At left is a soil pit photo of a typical Glenaladale soil.
There are 3 main layers to this soil: the light coloured top soil (A Horizon 10 to 30 cm deep); the light brown middle layer (B horizon 40 to 100 cm deep) is highly dispersive and prone to tunnel erosion; and at the bottom is the darker brown stable clay sub soil (C Horizon 100 to 170+ cm deep).
ALime (2t/ha)
Ripped both ways
Seed
Super
CGypsum (2t/ha)
Ripped on contour only
Seed
Super
ERipped on contour only
BLime (1t/ha)
Ripped both ways
Seed
Super
DGypsum (1t/ha)
Ripped both ways
Seed
Super
FControl site
No treatment
Figure 8: Tunnel erosion demonstration site design and applied treatments.
19
Tunnel erosion in East Gippsland
19
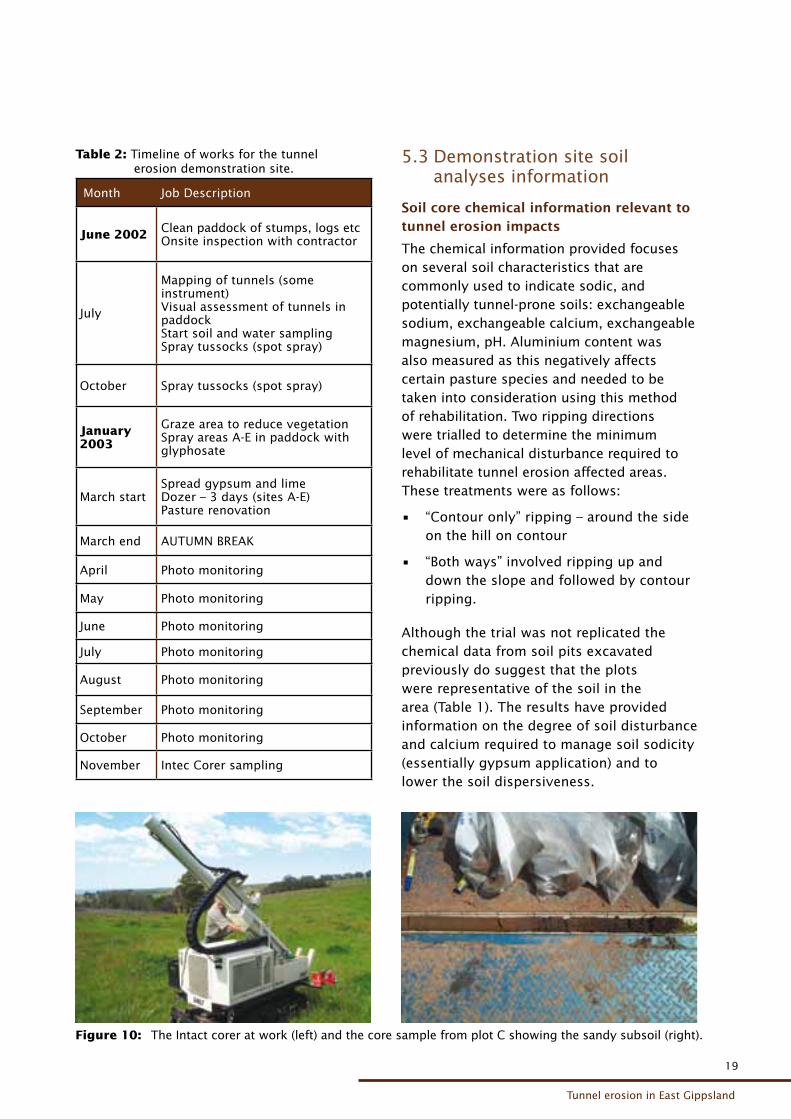
Table 2: Timeline of works for the tunnel erosion demonstration site.
Month Job Description
June 2002 Clean paddock of stumps, logs etcOnsite inspection with contractor
July
Mapping of tunnels (some instrument)Visual assessment of tunnels in paddockStart soil and water samplingSpray tussocks (spot spray)
October Spray tussocks (spot spray)
January 2003
Graze area to reduce vegetationSpray areas A-E in paddock with glyphosate
March startSpread gypsum and limeDozer – 3 days (sites A-E)Pasture renovation
March end AUTUMN BREAK
April Photo monitoring
May Photo monitoring
June Photo monitoring
July Photo monitoring
August Photo monitoring
September Photo monitoring
October Photo monitoring
November Intec Corer sampling
Figure 10: The Intact corer at work (left) and the core sample from plot C showing the sandy subsoil (right).
5.3 Demonstration site soil analyses information
Soil core chemical information relevant to tunnel erosion impacts
The chemical information provided focuses on several soil characteristics that are commonly used to indicate sodic, and potentially tunnel-prone soils: exchangeable sodium, exchangeable calcium, exchangeable magnesium, pH. Aluminium content was also measured as this negatively affects certain pasture species and needed to be taken into consideration using this method of rehabilitation. Two ripping directions were trialled to determine the minimum level of mechanical disturbance required to rehabilitate tunnel erosion affected areas. These treatments were as follows:
• “Contour only” ripping – around the side on the hill on contour
• “Both ways” involved ripping up and down the slope and followed by contour ripping.
Although the trial was not replicated the chemical data from soil pits excavated previously do suggest that the plots were representative of the soil in the area (Table 1). The results have provided information on the degree of soil disturbance and calcium required to manage soil sodicity (essentially gypsum application) and to lower the soil dispersiveness.
20
20
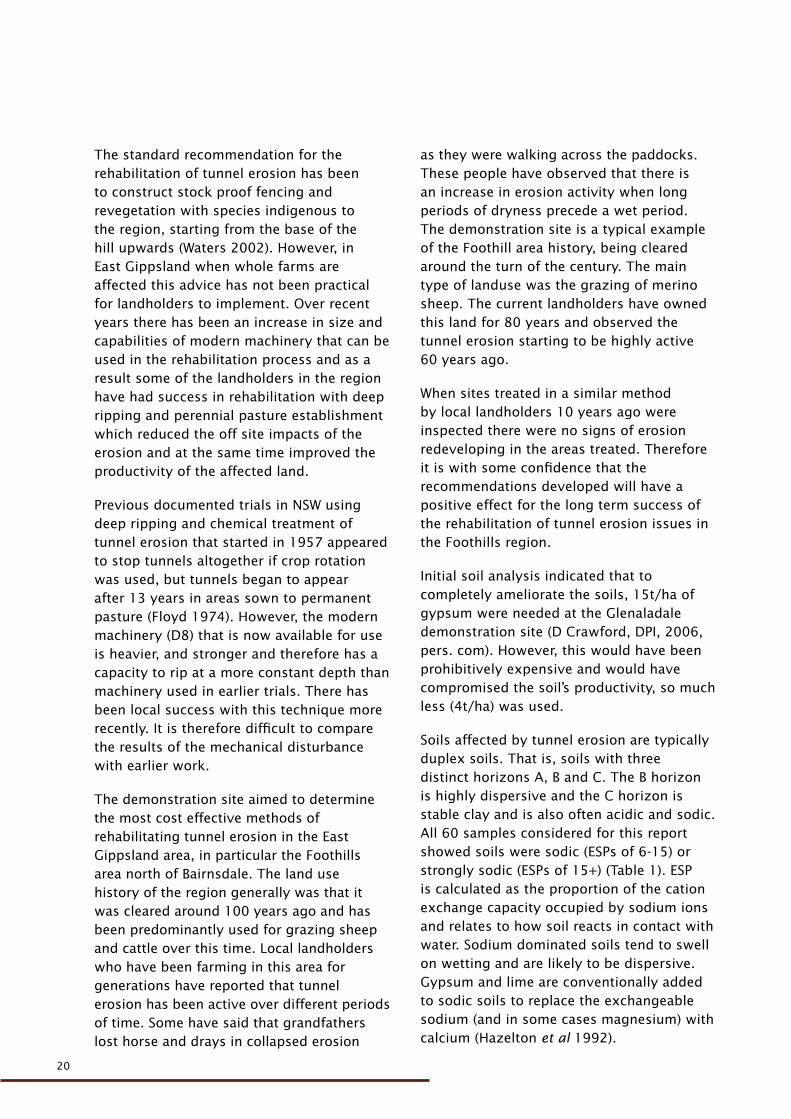
The standard recommendation for the rehabilitation of tunnel erosion has been to construct stock proof fencing and revegetation with species indigenous to the region, starting from the base of the hill upwards (Waters 2002). However, in East Gippsland when whole farms are affected this advice has not been practical for landholders to implement. Over recent years there has been an increase in size and capabilities of modern machinery that can be used in the rehabilitation process and as a result some of the landholders in the region have had success in rehabilitation with deep ripping and perennial pasture establishment which reduced the off site impacts of the erosion and at the same time improved the productivity of the affected land.
Previous documented trials in NSW using deep ripping and chemical treatment of tunnel erosion that started in 1957 appeared to stop tunnels altogether if crop rotation was used, but tunnels began to appear after 13 years in areas sown to permanent pasture (Floyd 1974). However, the modern machinery (D8) that is now available for use is heavier, and stronger and therefore has a capacity to rip at a more constant depth than machinery used in earlier trials. There has been local success with this technique more recently. It is therefore difficult to compare the results of the mechanical disturbance with earlier work.
The demonstration site aimed to determine the most cost effective methods of rehabilitating tunnel erosion in the East Gippsland area, in particular the Foothills area north of Bairnsdale. The land use history of the region generally was that it was cleared around 100 years ago and has been predominantly used for grazing sheep and cattle over this time. Local landholders who have been farming in this area for generations have reported that tunnel erosion has been active over different periods of time. Some have said that grandfathers lost horse and drays in collapsed erosion
as they were walking across the paddocks. These people have observed that there is an increase in erosion activity when long periods of dryness precede a wet period. The demonstration site is a typical example of the Foothill area history, being cleared around the turn of the century. The main type of landuse was the grazing of merino sheep. The current landholders have owned this land for 80 years and observed the tunnel erosion starting to be highly active 60 years ago.
When sites treated in a similar method by local landholders 10 years ago were inspected there were no signs of erosion redeveloping in the areas treated. Therefore it is with some confidence that the recommendations developed will have a positive effect for the long term success of the rehabilitation of tunnel erosion issues in the Foothills region.
Initial soil analysis indicated that to completely ameliorate the soils, 15t/ha of gypsum were needed at the Glenaladale demonstration site (D Crawford, DPI, 2006, pers. com). However, this would have been prohibitively expensive and would have compromised the soil’s productivity, so much less (4t/ha) was used.
Soils affected by tunnel erosion are typically duplex soils. That is, soils with three distinct horizons A, B and C. The B horizon is highly dispersive and the C horizon is stable clay and is also often acidic and sodic. All 60 samples considered for this report showed soils were sodic (ESPs of 6-15) or strongly sodic (ESPs of 15+) (Table 1). ESP is calculated as the proportion of the cation exchange capacity occupied by sodium ions and relates to how soil reacts in contact with water. Sodium dominated soils tend to swell on wetting and are likely to be dispersive. Gypsum and lime are conventionally added to sodic soils to replace the exchangeable sodium (and in some cases magnesium) with calcium (Hazelton et al 1992).
21
Tunnel erosion in East Gippsland
21
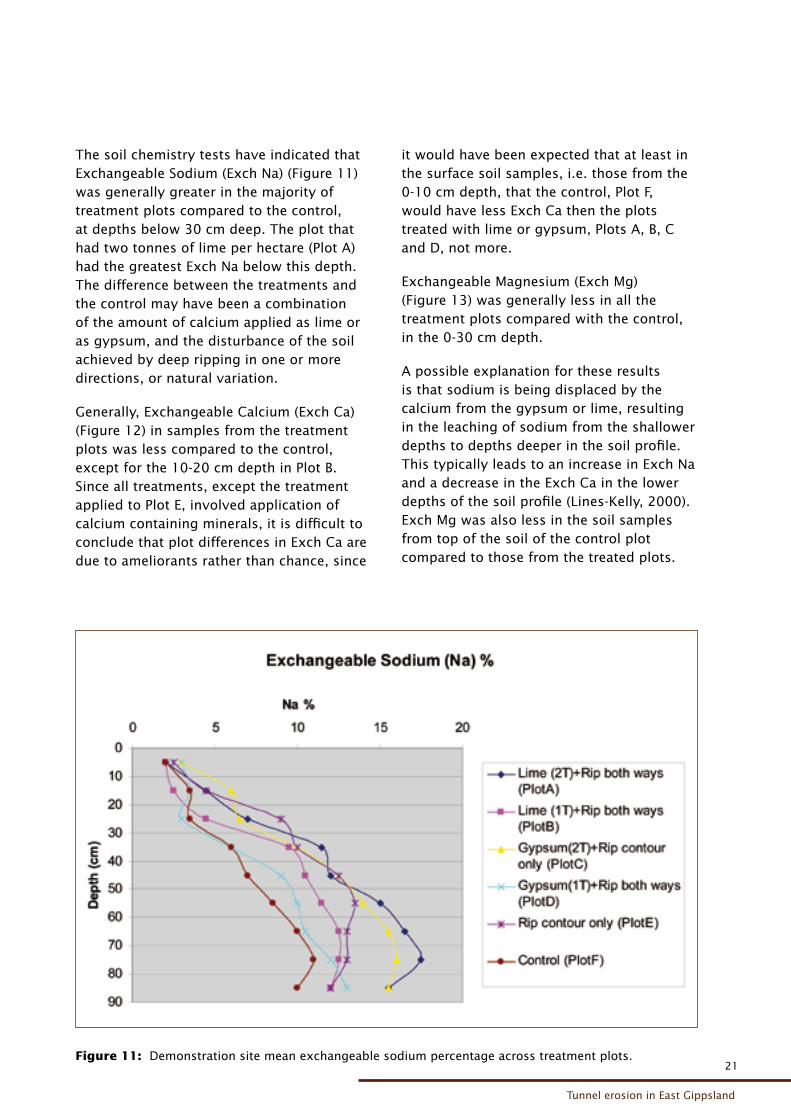
The soil chemistry tests have indicated that Exchangeable Sodium (Exch Na) (Figure 11) was generally greater in the majority of treatment plots compared to the control, at depths below 30 cm deep. The plot that had two tonnes of lime per hectare (Plot A) had the greatest Exch Na below this depth. The difference between the treatments and the control may have been a combination of the amount of calcium applied as lime or as gypsum, and the disturbance of the soil achieved by deep ripping in one or more directions, or natural variation.
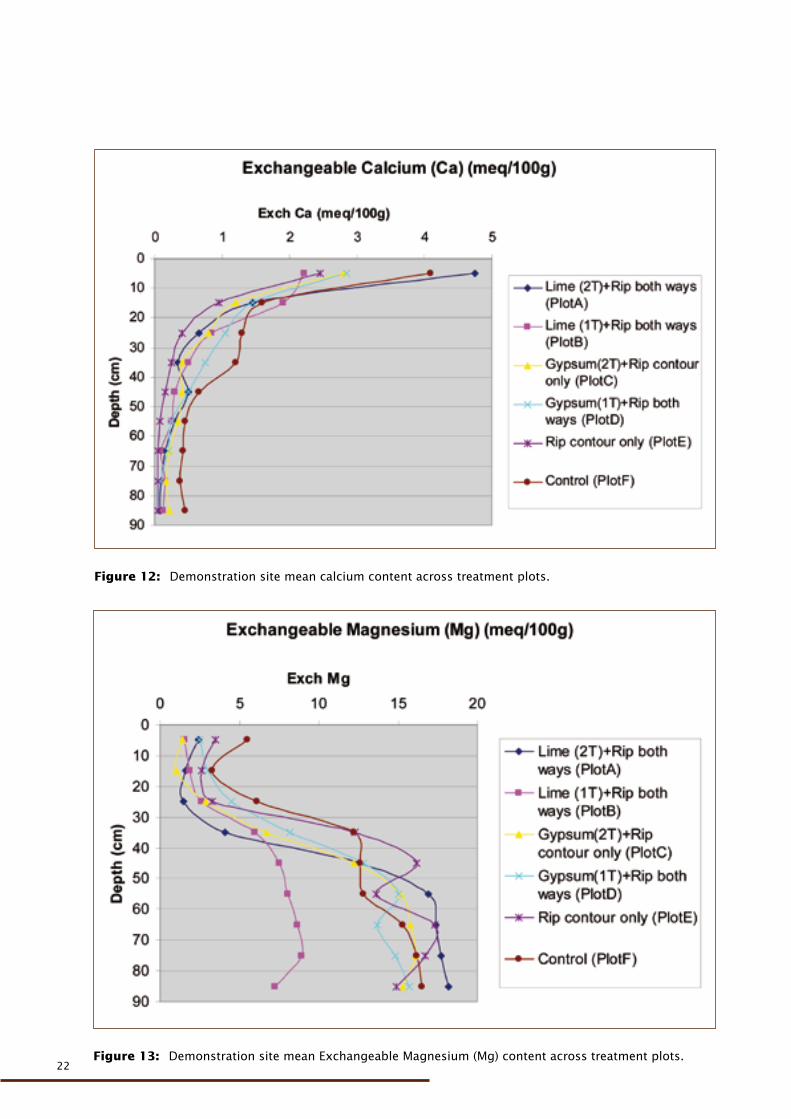
Generally, Exchangeable Calcium (Exch Ca) (Figure 12) in samples from the treatment plots was less compared to the control, except for the 10-20 cm depth in Plot B. Since all treatments, except the treatment applied to Plot E, involved application of calcium containing minerals, it is difficult to conclude that plot differences in Exch Ca are due to ameliorants rather than chance, since
it would have been expected that at least in the surface soil samples, i.e. those from the 0-10 cm depth, that the control, Plot F, would have less Exch Ca then the plots treated with lime or gypsum, Plots A, B, C and D, not more.
Exchangeable Magnesium (Exch Mg) (Figure 13) was generally less in all the treatment plots compared with the control, in the 0-30 cm depth.
A possible explanation for these results is that sodium is being displaced by the calcium from the gypsum or lime, resulting in the leaching of sodium from the shallower depths to depths deeper in the soil profile. This typically leads to an increase in Exch Na and a decrease in the Exch Ca in the lower depths of the soil profile (Lines-Kelly, 2000). Exch Mg was also less in the soil samples from top of the soil of the control plot compared to those from the treated plots.
Figure 11: Demonstration site mean exchangeable sodium percentage across treatment plots.
22
22
Figure 12: Demonstration site mean calcium content across treatment plots.
Figure 13: Demonstration site mean Exchangeable Magnesium (Mg) content across treatment plots.
23
Tunnel erosion in East Gippsland
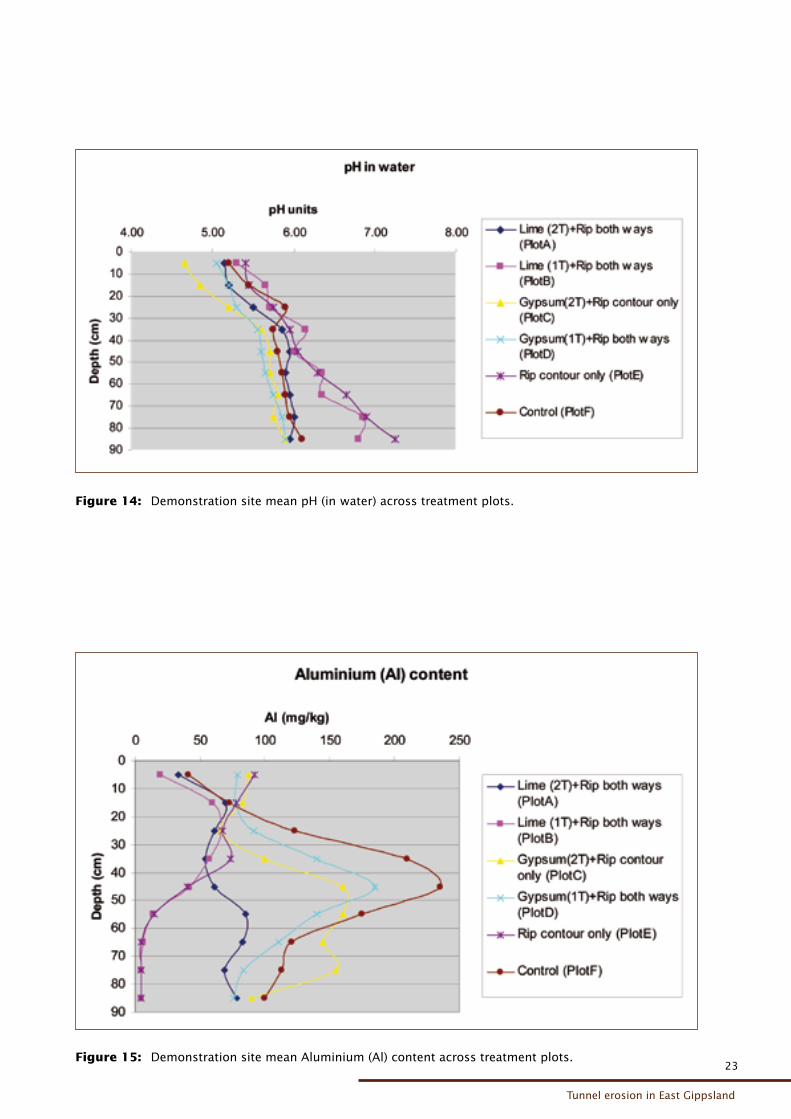
23Figure 15: Demonstration site mean Aluminium (Al) content across treatment plots.
Figure 14: Demonstration site mean pH (in water) across treatment plots.
24
24
The reduction of Mg in the profile as a result of this process may negatively affect the productive capacity of the areas treated in the future as it is important for plant nutrition, especially if high concentrations of aluminium in the soil solution of acidic sub-soil prevent plant roots reaching cation nutrients in the sub-soil. Other elements such as potassium may also be impacted and on-going soil testing should be undertaken by farmers in the future to monitor these nutrients (Peverill et al., 2001).
The pH (water) results from the samples representing the different plots (Figure 14) were unhelpful in demonstrating treatment impacts on soil as there are no clear differences in pH (water) in relation to the presence or absence of applied lime. As gypsum is a salt, and slight increases in soil salinity can slightly decrease test results based pH (water), differences between plots treated with gypsum and the control may in part be confounded by this salt affect.
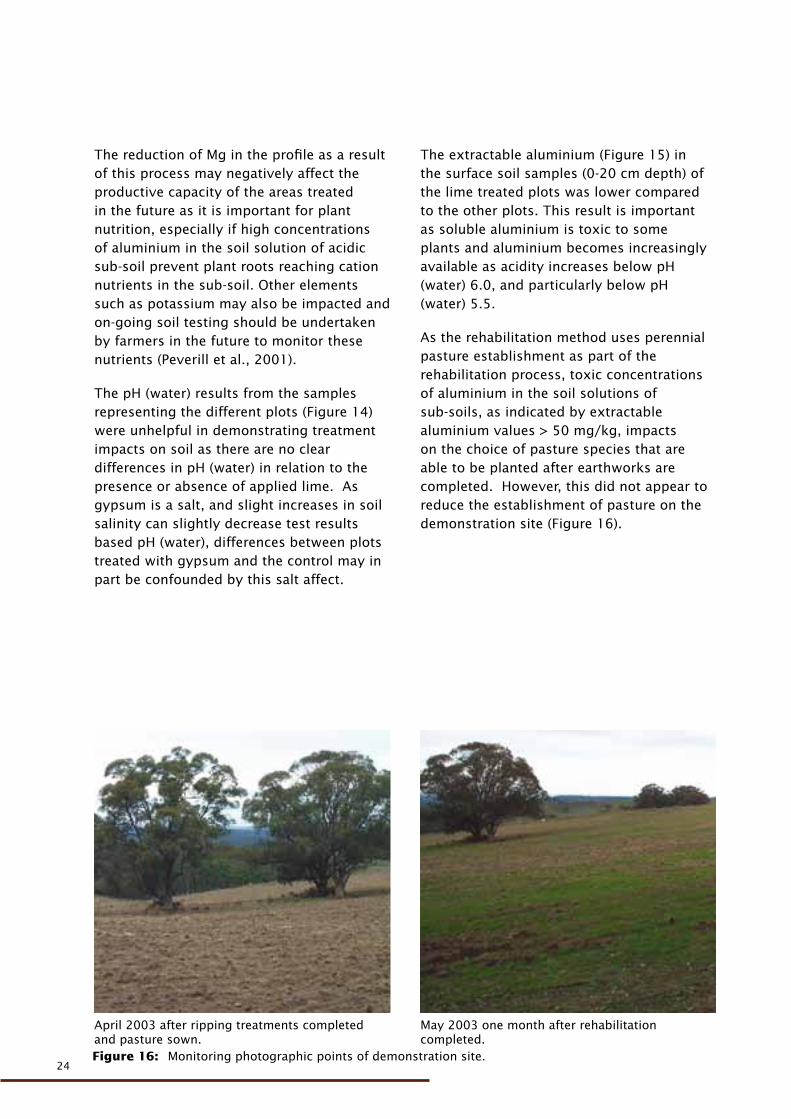
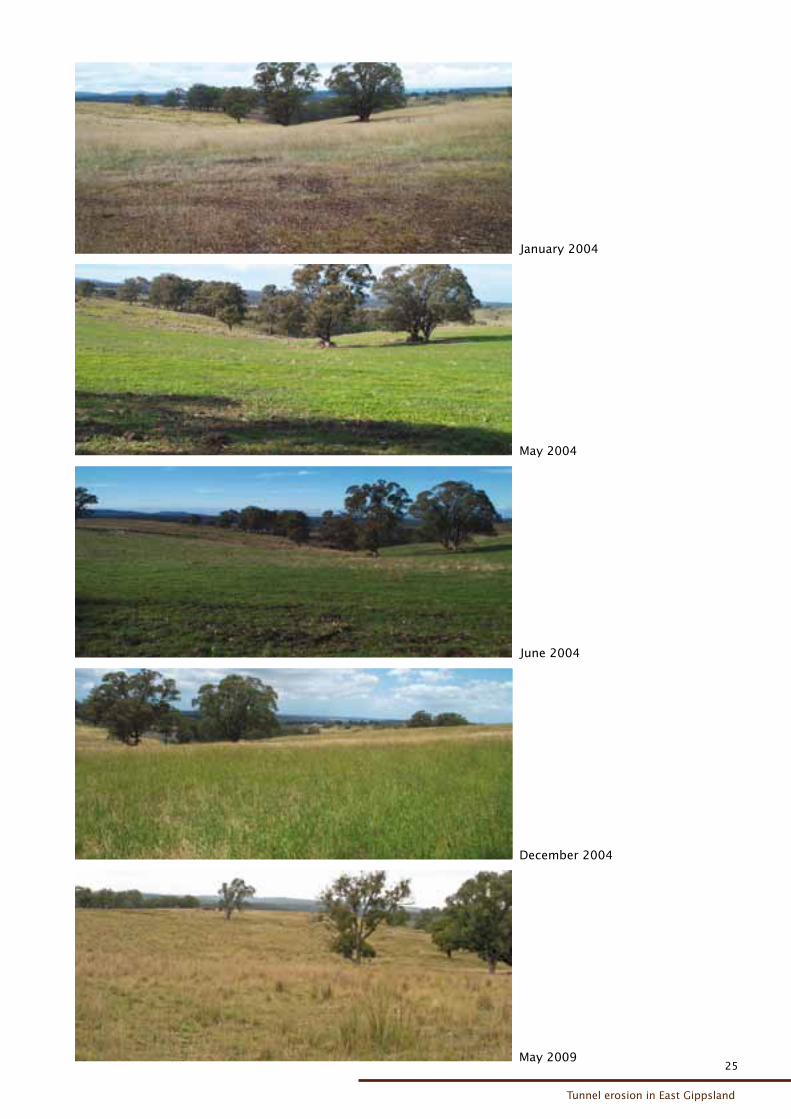
Figure 16: Monitoring photographic points of demonstration site.
April 2003 after ripping treatments completed and pasture sown.
May 2003 one month after rehabilitation completed.
The extractable aluminium (Figure 15) in the surface soil samples (0-20 cm depth) of the lime treated plots was lower compared to the other plots. This result is important as soluble aluminium is toxic to some plants and aluminium becomes increasingly available as acidity increases below pH (water) 6.0, and particularly below pH (water) 5.5.
As the rehabilitation method uses perennial pasture establishment as part of the rehabilitation process, toxic concentrations of aluminium in the soil solutions of sub-soils, as indicated by extractable aluminium values > 50 mg/kg, impacts on the choice of pasture species that are able to be planted after earthworks are completed. However, this did not appear to reduce the establishment of pasture on the demonstration site (Figure 16).
25
Tunnel erosion in East Gippsland
25
May 2004
May 2009
January 2004
June 2004
December 2004
26
26
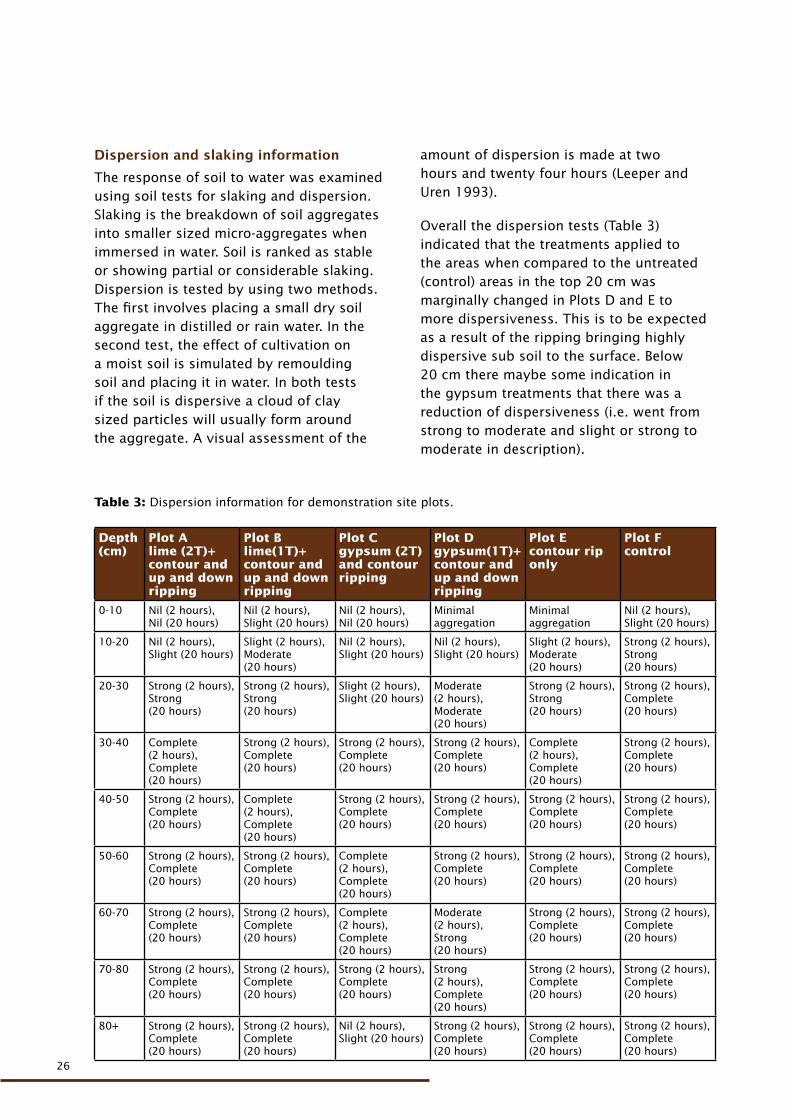
Dispersion and slaking information
The response of soil to water was examined using soil tests for slaking and dispersion. Slaking is the breakdown of soil aggregates into smaller sized micro-aggregates when immersed in water. Soil is ranked as stable or showing partial or considerable slaking. Dispersion is tested by using two methods. The first involves placing a small dry soil aggregate in distilled or rain water. In the second test, the effect of cultivation on a moist soil is simulated by remoulding soil and placing it in water. In both tests if the soil is dispersive a cloud of clay sized particles will usually form around the aggregate. A visual assessment of the
amount of dispersion is made at two hours and twenty four hours (Leeper and Uren 1993).
Overall the dispersion tests (Table 3) indicated that the treatments applied to the areas when compared to the untreated (control) areas in the top 20 cm was marginally changed in Plots D and E to more dispersiveness. This is to be expected as a result of the ripping bringing highly dispersive sub soil to the surface. Below 20 cm there maybe some indication in the gypsum treatments that there was a reduction of dispersiveness (i.e. went from strong to moderate and slight or strong to moderate in description).
Table 3: Dispersion information for demonstration site plots.
Depth (cm)
Plot A lime (2T)+contour and up and down ripping
Plot B lime(1T)+ contour and up and down ripping
Plot C gypsum (2T) and contour ripping
Plot D gypsum(1T)+ contour and up and down ripping
Plot E contour rip only
Plot F control
0-10 Nil (2 hours), Nil (20 hours)
Nil (2 hours), Slight (20 hours)
Nil (2 hours), Nil (20 hours)
Minimal aggregation
Minimal aggregation
Nil (2 hours), Slight (20 hours)
10-20 Nil (2 hours), Slight (20 hours)
Slight (2 hours), Moderate (20 hours)
Nil (2 hours), Slight (20 hours)
Nil (2 hours), Slight (20 hours)
Slight (2 hours), Moderate (20 hours)
Strong (2 hours), Strong (20 hours)
20-30 Strong (2 hours), Strong (20 hours)
Strong (2 hours), Strong (20 hours)
Slight (2 hours), Slight (20 hours)
Moderate (2 hours), Moderate (20 hours)
Strong (2 hours), Strong (20 hours)
Strong (2 hours), Complete (20 hours)
30-40 Complete (2 hours), Complete (20 hours)
Strong (2 hours), Complete (20 hours)
Strong (2 hours), Complete (20 hours)
Strong (2 hours), Complete (20 hours)
Complete (2 hours), Complete (20 hours)
Strong (2 hours), Complete (20 hours)
40-50 Strong (2 hours), Complete (20 hours)
Complete (2 hours), Complete (20 hours)
Strong (2 hours), Complete (20 hours)
Strong (2 hours), Complete (20 hours)
Strong (2 hours), Complete (20 hours)
Strong (2 hours), Complete (20 hours)
50-60 Strong (2 hours), Complete (20 hours)
Strong (2 hours), Complete (20 hours)
Complete (2 hours), Complete (20 hours)
Strong (2 hours), Complete (20 hours)
Strong (2 hours), Complete (20 hours)
Strong (2 hours), Complete (20 hours)
60-70 Strong (2 hours), Complete (20 hours)
Strong (2 hours), Complete (20 hours)
Complete (2 hours), Complete (20 hours)
Moderate (2 hours), Strong (20 hours)
Strong (2 hours), Complete (20 hours)
Strong (2 hours), Complete (20 hours)
70-80 Strong (2 hours), Complete (20 hours)
Strong (2 hours), Complete (20 hours)
Strong (2 hours), Complete (20 hours)
Strong (2 hours), Complete (20 hours)
Strong (2 hours), Complete (20 hours)
Strong (2 hours), Complete (20 hours)
80+ Strong (2 hours), Complete (20 hours)
Strong (2 hours), Complete (20 hours)
Nil (2 hours), Slight (20 hours)
Strong (2 hours), Complete (20 hours)
Strong (2 hours), Complete (20 hours)
Strong (2 hours), Complete (20 hours)
27
Tunnel erosion in East Gippsland
27
Table 4: Slaking information for demonstration site plots.
Depth (cm)
Plot A lime (2T) + contour and up and down ripping
Plot B lime (1T)+ contour and up and down ripping
Plot C gypsum (2T) and contour ripping
Plot D gypsum (1T) + contour and up and down ripping
Plot E contour rip only
Plot F control
0-10 Water stable Partial Water stable Water stable Minimal aggregation
Water stable
10-20 Water stable Partial Water stable Water stable Water stable Partial
20-30 Water stable Partial Considerable Partial Partial Partial
30-40 Partial Partial Considerable Partial Considerable Partial
40-50 Considerable Partial Considerable Partial Considerable Considerable
50-60 Considerable Partial Considerable Partial Considerable Partial
60-70 Partial Partial Considerable Considerable Considerable Partial
70-80 Considerable Considerable Considerable Considerable Partial Considerable
80+ Partial Considerable Partial Considerable Partial Considerable
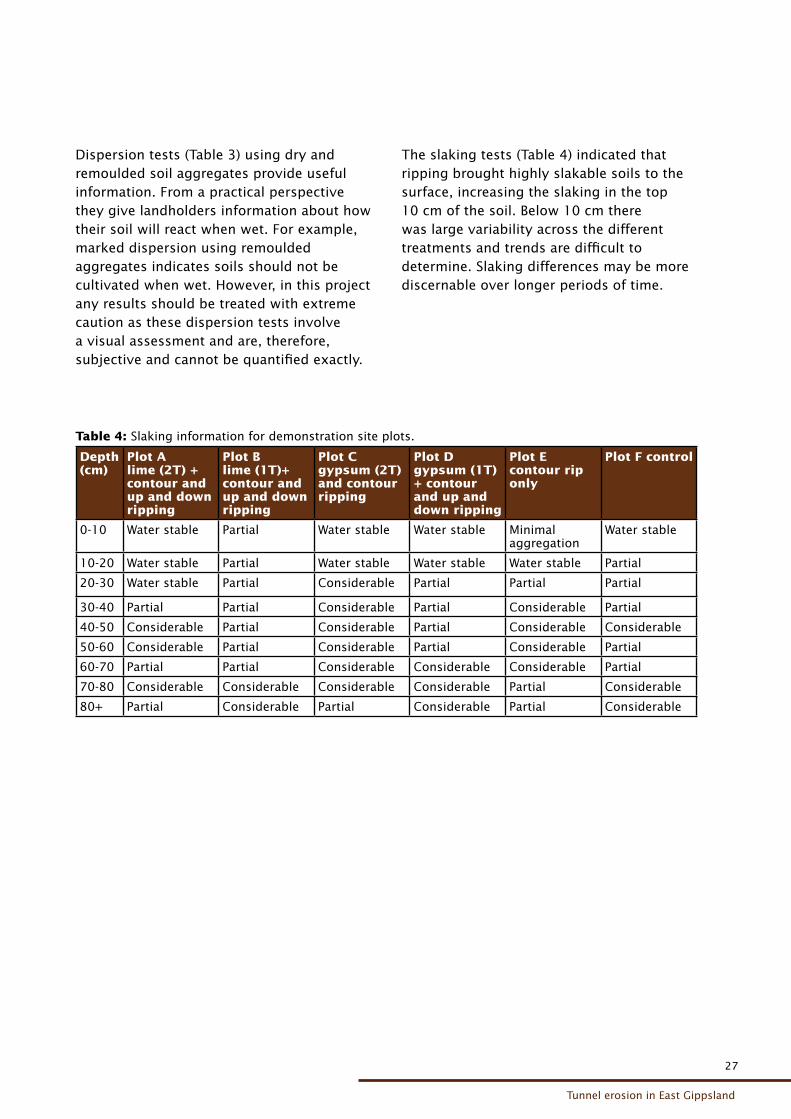
Dispersion tests (Table 3) using dry and remoulded soil aggregates provide useful information. From a practical perspective they give landholders information about how their soil will react when wet. For example, marked dispersion using remoulded aggregates indicates soils should not be cultivated when wet. However, in this project any results should be treated with extreme caution as these dispersion tests involve a visual assessment and are, therefore, subjective and cannot be quantified exactly.
The slaking tests (Table 4) indicated that ripping brought highly slakable soils to the surface, increasing the slaking in the top 10 cm of the soil. Below 10 cm there was large variability across the different treatments and trends are difficult to determine. Slaking differences may be more discernable over longer periods of time.
28
28
6 Regional soil pit information
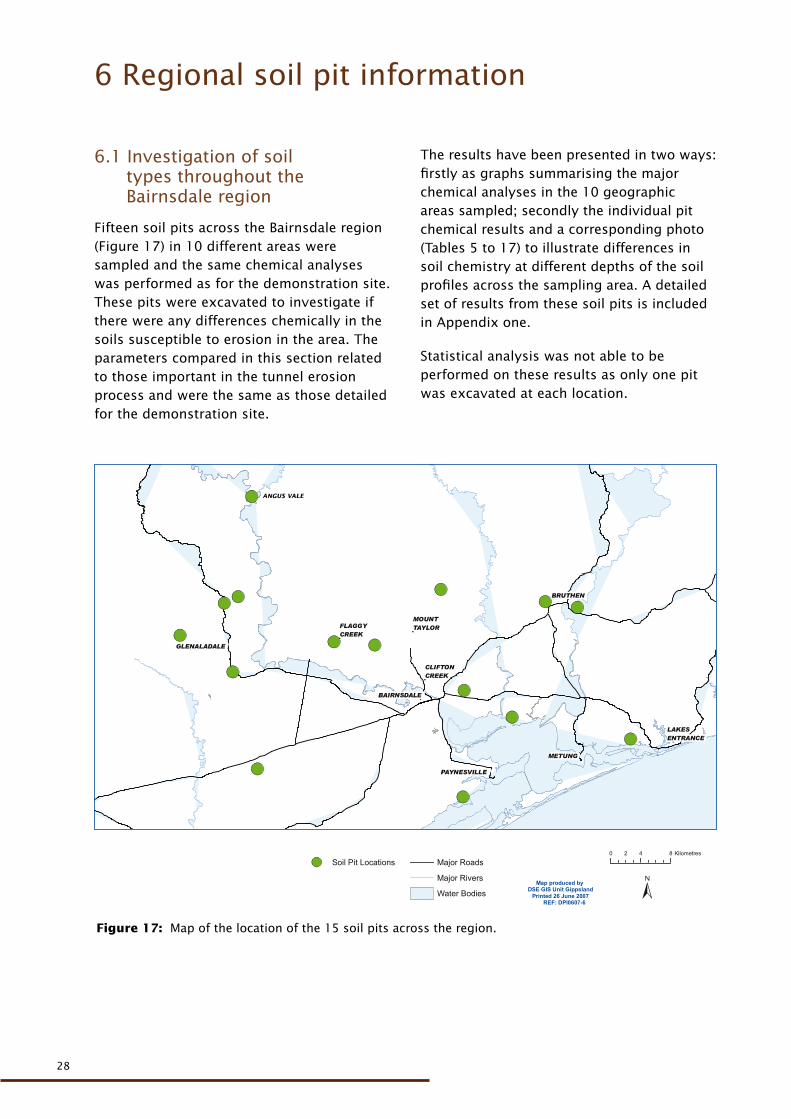
6.1 Investigation of soil types throughout the Bairnsdale region
Fifteen soil pits across the Bairnsdale region (Figure 17) in 10 different areas were sampled and the same chemical analyses was performed as for the demonstration site. These pits were excavated to investigate if there were any differences chemically in the soils susceptible to erosion in the area. The parameters compared in this section related to those important in the tunnel erosion process and were the same as those detailed for the demonstration site.
The results have been presented in two ways: firstly as graphs summarising the major chemical analyses in the 10 geographic areas sampled; secondly the individual pit chemical results and a corresponding photo (Tables 5 to 17) to illustrate differences in soil chemistry at different depths of the soil profiles across the sampling area. A detailed set of results from these soil pits is included in Appendix one.
Statistical analysis was not able to be performed on these results as only one pit was excavated at each location.
Figure 17: Map of the location of the 15 soil pits across the region.
FLAGGYCREEKFLAGGYCREEK
MOUNTTAYLORMOUNTTAYLOR
CLIFTONCREEKCLIFTONCREEK
PAYNESVILLEPAYNESVILLE
METUNGMETUNG
BAIRNSDALEBAIRNSDALE
GLENALADALEGLENALADALE
BRUTHENBRUTHEN
LAKESENTRANCELAKESENTRANCE
Map produced by DSE GIS Unit Gippsland
Printed 26 June 2007 REF: DPI0607-6
0 4 82 Kilometres
Soil Pit Locations Major Roads
Major Rivers
Water Bodies
Soil Pit Locations
ANGUS VALE
29
Tunnel erosion in East Gippsland
29
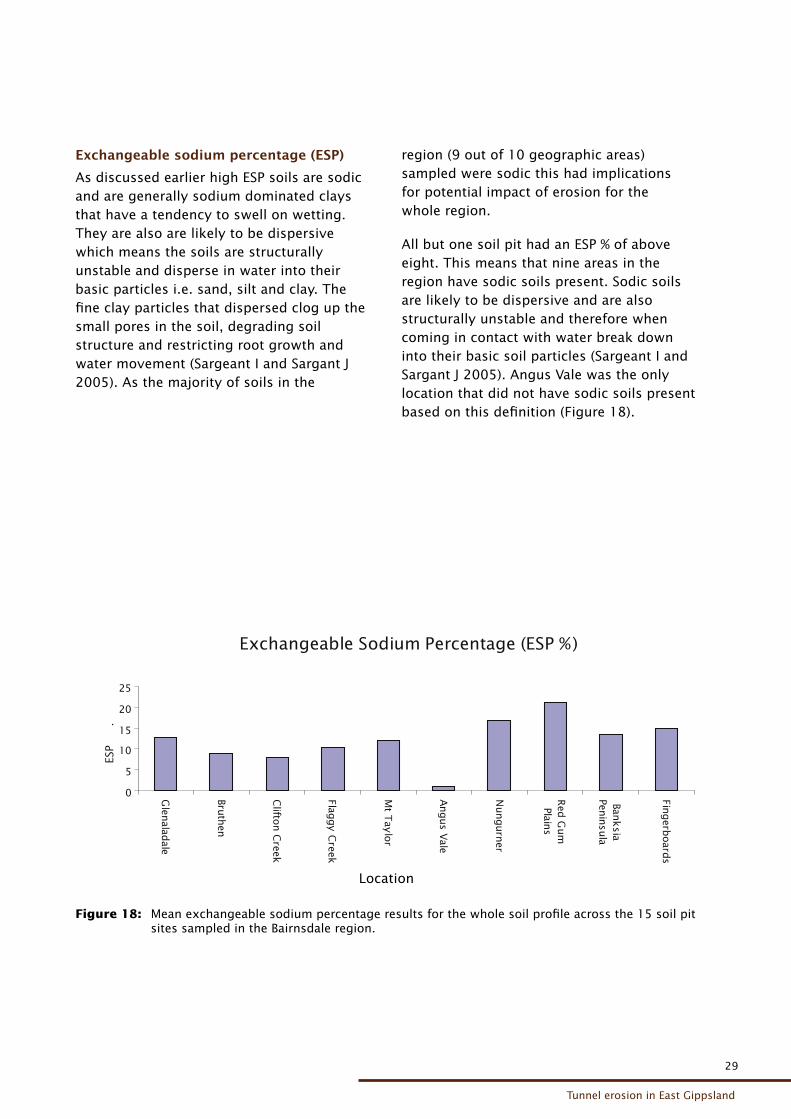
Exchangeable sodium percentage (ESP)
As discussed earlier high ESP soils are sodic and are generally sodium dominated clays that have a tendency to swell on wetting. They are also are likely to be dispersive which means the soils are structurally unstable and disperse in water into their basic particles i.e. sand, silt and clay. The fine clay particles that dispersed clog up the small pores in the soil, degrading soil structure and restricting root growth and water movement (Sargeant I and Sargant J 2005). As the majority of soils in the
region (9 out of 10 geographic areas) sampled were sodic this had implications for potential impact of erosion for the whole region.
All but one soil pit had an ESP % of above eight. This means that nine areas in the region have sodic soils present. Sodic soils are likely to be dispersive and are also structurally unstable and therefore when coming in contact with water break down into their basic soil particles (Sargeant I and Sargant J 2005). Angus Vale was the only location that did not have sodic soils present based on this definition (Figure 18).
Figure 18: Mean exchangeable sodium percentage results for the whole soil profile across the 15 soil pit sites sampled in the Bairnsdale region.
Exchangeable Sodium Percentage (ESP %)
0
5
10
15
20
25
Glen
aladale
Bruth
en
Clifto
n C
reek
Flaggy C
reek
Mt T
aylo
r
Angus V
ale
Nungurn
er
Red
Gum
Plains
Banksia
Penin
sula
Fingerb
oard
s
Region
ESP
.
Location
30
30
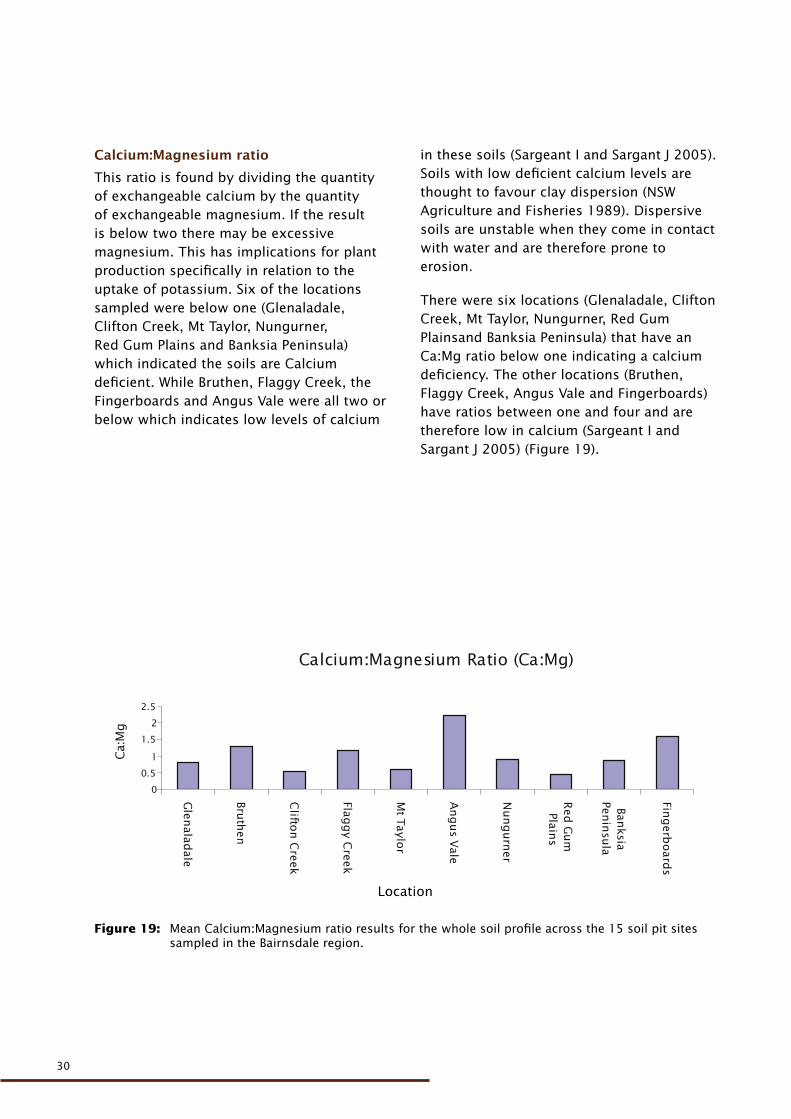
Calcium:Magnesium ratio
This ratio is found by dividing the quantity of exchangeable calcium by the quantity of exchangeable magnesium. If the result is below two there may be excessive magnesium. This has implications for plant production specifically in relation to the uptake of potassium. Six of the locations sampled were below one (Glenaladale, Clifton Creek, Mt Taylor, Nungurner, Red Gum Plains and Banksia Peninsula) which indicated the soils are Calcium deficient. While Bruthen, Flaggy Creek, the Fingerboards and Angus Vale were all two or below which indicates low levels of calcium
in these soils (Sargeant I and Sargant J 2005). Soils with low deficient calcium levels are thought to favour clay dispersion (NSW Agriculture and Fisheries 1989). Dispersive soils are unstable when they come in contact with water and are therefore prone to erosion.
There were six locations (Glenaladale, Clifton Creek, Mt Taylor, Nungurner, Red Gum Plainsand Banksia Peninsula) that have an Ca:Mg ratio below one indicating a calcium deficiency. The other locations (Bruthen, Flaggy Creek, Angus Vale and Fingerboards) have ratios between one and four and are therefore low in calcium (Sargeant I and Sargant J 2005) (Figure 19).
Figure 19: Mean Calcium:Magnesium ratio results for the whole soil profile across the 15 soil pit sites sampled in the Bairnsdale region.
Calcium:Magnesium Ratio (Ca:Mg)
0
0.5
1
1.5
2
2.5
Glen
aladale
Bruth
en
Clifto
n C
reek
Flagg
y Creek
Mt T
aylor
An
gu
s Vale
Nu
ng
urn
er
Red
Gu
mPlain
s
Banksia
Penin
sula
Fing
erbo
ards
Region
Ca:
Mg
Location
31
Tunnel erosion in East Gippsland
31
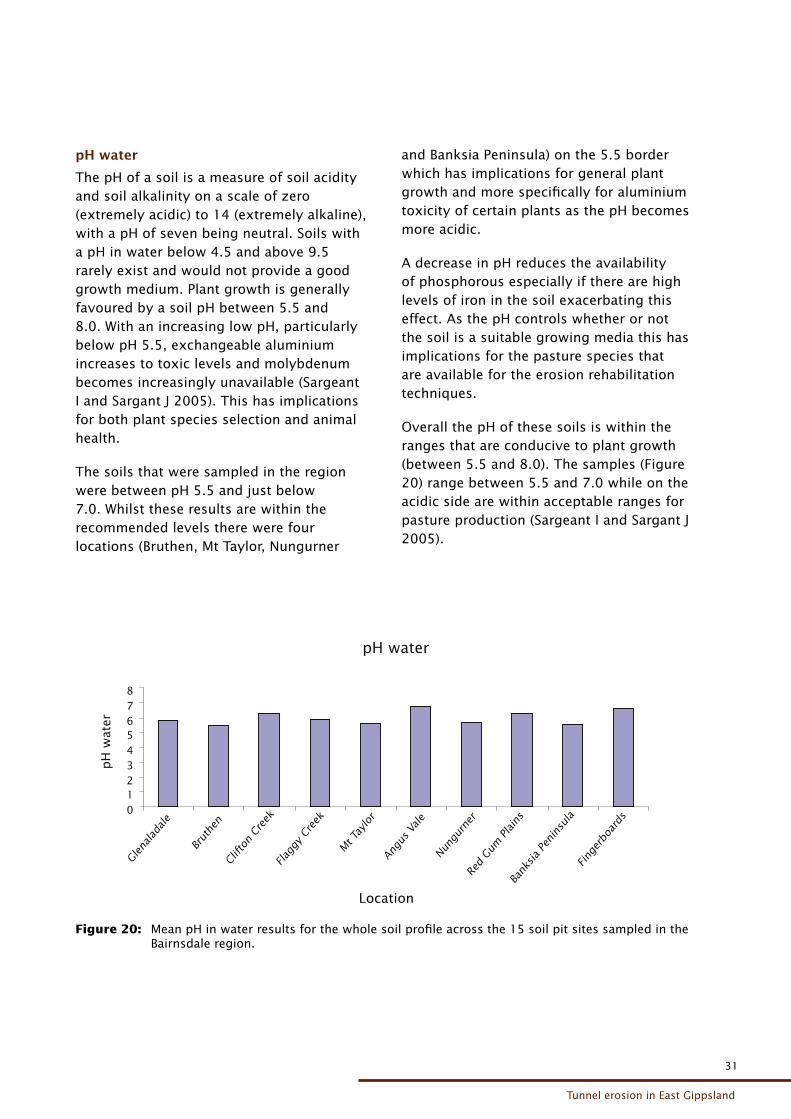
pH water
The pH of a soil is a measure of soil acidity and soil alkalinity on a scale of zero (extremely acidic) to 14 (extremely alkaline), with a pH of seven being neutral. Soils with a pH in water below 4.5 and above 9.5 rarely exist and would not provide a good growth medium. Plant growth is generally favoured by a soil pH between 5.5 and 8.0. With an increasing low pH, particularly below pH 5.5, exchangeable aluminium increases to toxic levels and molybdenum becomes increasingly unavailable (Sargeant I and Sargant J 2005). This has implications for both plant species selection and animal health.
The soils that were sampled in the region were between pH 5.5 and just below 7.0. Whilst these results are within the recommended levels there were four locations (Bruthen, Mt Taylor, Nungurner
and Banksia Peninsula) on the 5.5 border which has implications for general plant growth and more specifically for aluminium toxicity of certain plants as the pH becomes more acidic.
A decrease in pH reduces the availability of phosphorous especially if there are high levels of iron in the soil exacerbating this effect. As the pH controls whether or not the soil is a suitable growing media this has implications for the pasture species that are available for the erosion rehabilitation techniques.
Overall the pH of these soils is within the ranges that are conducive to plant growth (between 5.5 and 8.0). The samples (Figure 20) range between 5.5 and 7.0 while on the acidic side are within acceptable ranges for pasture production (Sargeant I and Sargant J 2005).
Figure 20: Mean pH in water results for the whole soil profile across the 15 soil pit sites sampled in the Bairnsdale region.
pH water
012345678
Glena
lada
le
Brut
hen
Clift
on C
reek
Flag
gy C
reek
Mt T
aylor
Angu
s Va
le
Nungu
rner
Red Gum
Plains
Bank
sia Pe
nins
ula
Fing
erbo
ards
Region
pH
wat
er
Location
32
32
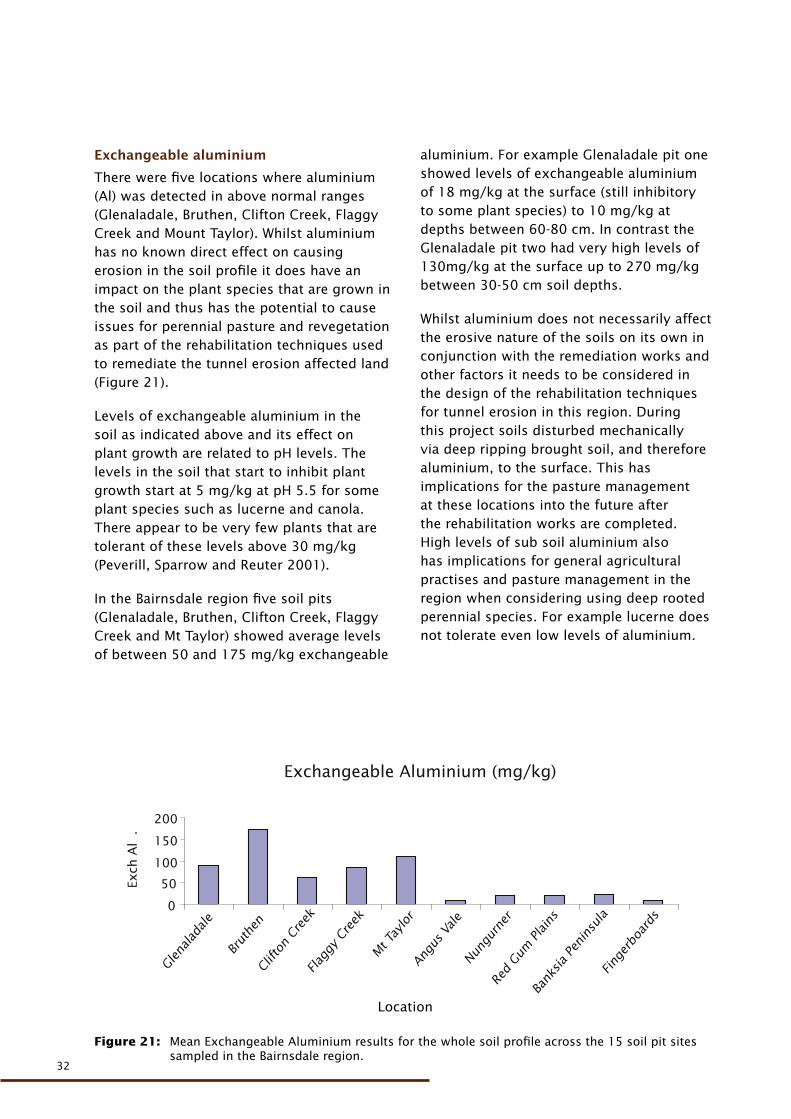
Exchangeable aluminium
There were five locations where aluminium (Al) was detected in above normal ranges (Glenaladale, Bruthen, Clifton Creek, Flaggy Creek and Mount Taylor). Whilst aluminium has no known direct effect on causing erosion in the soil profile it does have an impact on the plant species that are grown in the soil and thus has the potential to cause issues for perennial pasture and revegetation as part of the rehabilitation techniques used to remediate the tunnel erosion affected land (Figure 21).
Levels of exchangeable aluminium in the soil as indicated above and its effect on plant growth are related to pH levels. The levels in the soil that start to inhibit plant growth start at 5 mg/kg at pH 5.5 for some plant species such as lucerne and canola. There appear to be very few plants that are tolerant of these levels above 30 mg/kg (Peverill, Sparrow and Reuter 2001).
In the Bairnsdale region five soil pits (Glenaladale, Bruthen, Clifton Creek, Flaggy Creek and Mt Taylor) showed average levels of between 50 and 175 mg/kg exchangeable
aluminium. For example Glenaladale pit one showed levels of exchangeable aluminium of 18 mg/kg at the surface (still inhibitory to some plant species) to 10 mg/kg at depths between 60-80 cm. In contrast the Glenaladale pit two had very high levels of 130mg/kg at the surface up to 270 mg/kg between 30-50 cm soil depths.
Whilst aluminium does not necessarily affect the erosive nature of the soils on its own in conjunction with the remediation works and other factors it needs to be considered in the design of the rehabilitation techniques for tunnel erosion in this region. During this project soils disturbed mechanically via deep ripping brought soil, and therefore aluminium, to the surface. This has implications for the pasture management at these locations into the future after the rehabilitation works are completed. High levels of sub soil aluminium also has implications for general agricultural practises and pasture management in the region when considering using deep rooted perennial species. For example lucerne does not tolerate even low levels of aluminium.
Figure 21: Mean Exchangeable Aluminium results for the whole soil profile across the 15 soil pit sites sampled in the Bairnsdale region.
Exchangeable Aluminium (mg/kg)
0
50
100
150
200
Glena
lada
le
Brut
hen
Clift
on C
reek
Flag
gy C
reek
Mt T
aylor
Angu
s Va
le
Nungu
rner
Red Gum
Plains
Bank
sia Pe
nins
ula
Fing
erbo
ards
Region
Exch
Al .
Location
33
Tunnel erosion in East Gippsland
33
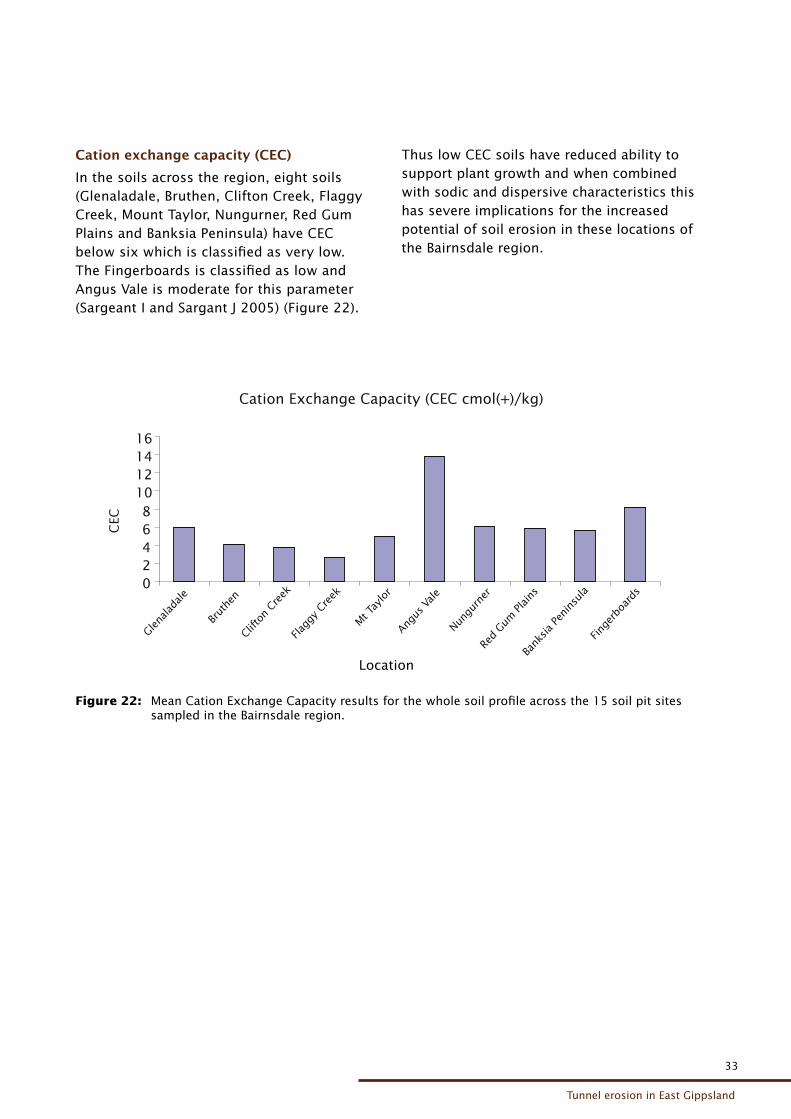
Cation exchange capacity (CEC)
In the soils across the region, eight soils (Glenaladale, Bruthen, Clifton Creek, Flaggy Creek, Mount Taylor, Nungurner, Red Gum Plains and Banksia Peninsula) have CEC below six which is classified as very low. The Fingerboards is classified as low and Angus Vale is moderate for this parameter (Sargeant I and Sargant J 2005) (Figure 22).
Thus low CEC soils have reduced ability to support plant growth and when combined with sodic and dispersive characteristics this has severe implications for the increased potential of soil erosion in these locations of the Bairnsdale region.
Figure 22: Mean Cation Exchange Capacity results for the whole soil profile across the 15 soil pit sites sampled in the Bairnsdale region.
Cation Exchange Capacity (CEC cmol(+)/kg)
02468
10121416
Glena
lada
le
Brut
hen
Clifto
n Cre
ek
Flag
gy C
reek
Mt T
aylor
Angu
s Va
le
Nungu
rner
Red
Gum Plains
Bank
sia Pen
insu
la
Fing
erbo
ards
Region
CEC
.
Location
34
34
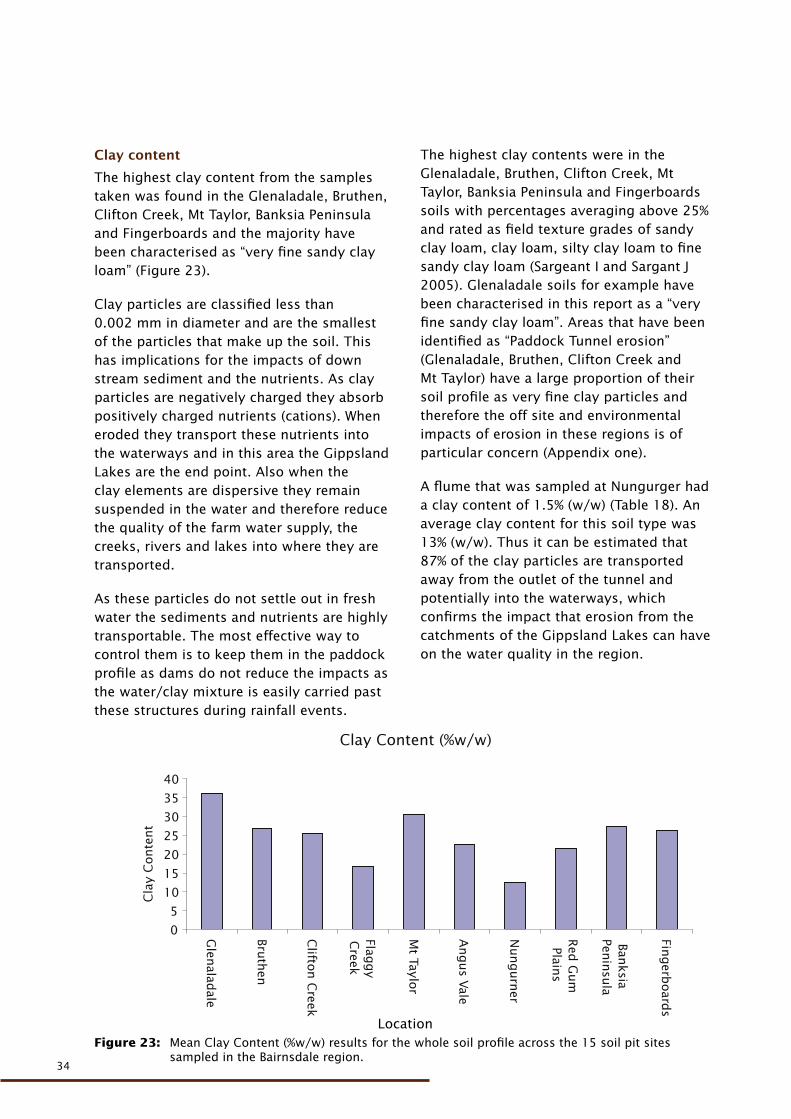
Clay content
The highest clay content from the samples taken was found in the Glenaladale, Bruthen, Clifton Creek, Mt Taylor, Banksia Peninsula and Fingerboards and the majority have been characterised as “very fine sandy clay loam” (Figure 23).
Clay particles are classified less than 0.002 mm in diameter and are the smallest of the particles that make up the soil. This has implications for the impacts of down stream sediment and the nutrients. As clay particles are negatively charged they absorb positively charged nutrients (cations). When eroded they transport these nutrients into the waterways and in this area the Gippsland Lakes are the end point. Also when the clay elements are dispersive they remain suspended in the water and therefore reduce the quality of the farm water supply, the creeks, rivers and lakes into where they are transported.
As these particles do not settle out in fresh water the sediments and nutrients are highly transportable. The most effective way to control them is to keep them in the paddock profile as dams do not reduce the impacts as the water/clay mixture is easily carried past these structures during rainfall events.
The highest clay contents were in the Glenaladale, Bruthen, Clifton Creek, Mt Taylor, Banksia Peninsula and Fingerboards soils with percentages averaging above 25% and rated as field texture grades of sandy clay loam, clay loam, silty clay loam to fine sandy clay loam (Sargeant I and Sargant J 2005). Glenaladale soils for example have been characterised in this report as a “very fine sandy clay loam”. Areas that have been identified as “Paddock Tunnel erosion” (Glenaladale, Bruthen, Clifton Creek and Mt Taylor) have a large proportion of their soil profile as very fine clay particles and therefore the off site and environmental impacts of erosion in these regions is of particular concern (Appendix one).
A flume that was sampled at Nungurger had a clay content of 1.5% (w/w) (Table 18). An average clay content for this soil type was 13% (w/w). Thus it can be estimated that 87% of the clay particles are transported away from the outlet of the tunnel and potentially into the waterways, which confirms the impact that erosion from the catchments of the Gippsland Lakes can have on the water quality in the region.
Figure 23: Mean Clay Content (%w/w) results for the whole soil profile across the 15 soil pit sites sampled in the Bairnsdale region.
Clay Content (%w/w)
0
5
10
15
20
25
30
35
40
Glen
aladale
Bruth
en
Clifto
n C
reek
Flaggy
Creek
Mt Taylo
r
Angus Vale
Nungurn
er
Red
Gum
Plains
Banksia
Penin
sula
Fingerb
oard
s
Region
Cla
y C
onte
nt
.
Location
35
Tunnel erosion in East Gippsland
35
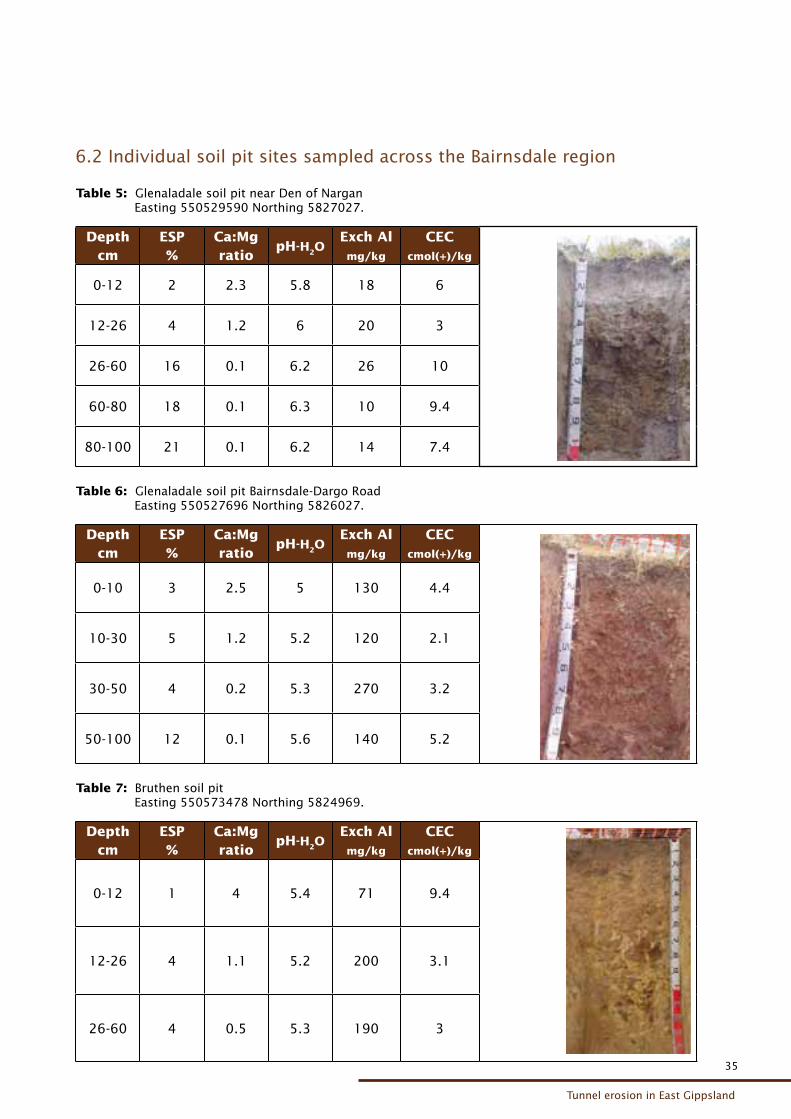
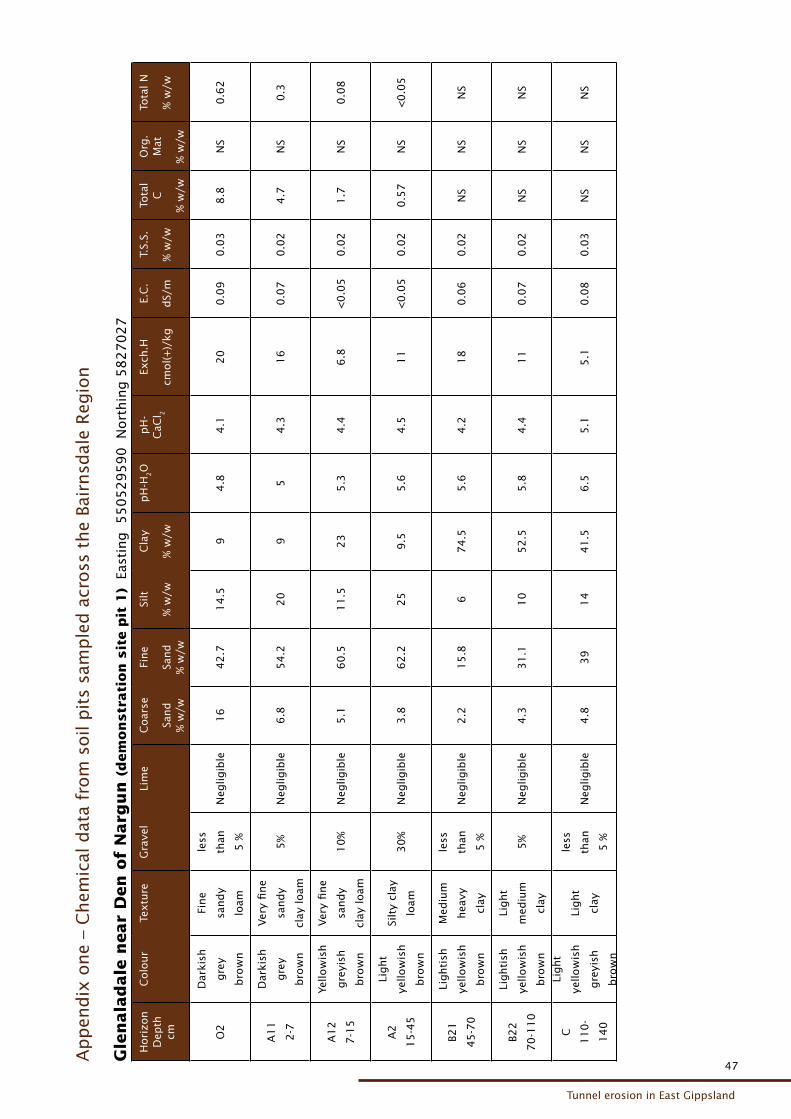
Table 5: Glenaladale soil pit near Den of NarganEasting 550529590 Northing 5827027.
Depthcm
ESP%
Ca:Mg ratio
pH-H2OExch Almg/kg
CECcmol(+)/kg
0-12 2 2.3 5.8 18 6
12-26 4 1.2 6 20 3
26-60 16 0.1 6.2 26 10
60-80 18 0.1 6.3 10 9.4
80-100 21 0.1 6.2 14 7.4
Table 6: Glenaladale soil pit Bairnsdale-Dargo Road Easting 550527696 Northing 5826027.
Depthcm
ESP%
Ca:Mgratio
pH-H2OExch Almg/kg
CECcmol(+)/kg
0-10 3 2.5 5 130 4.4
10-30 5 1.2 5.2 120 2.1
30-50 4 0.2 5.3 270 3.2
50-100 12 0.1 5.6 140 5.2
Table 7: Bruthen soil pitEasting 550573478 Northing 5824969.
Depthcm
ESP%
Ca:Mg ratio
pH-H2OExch Almg/kg
CECcmol(+)/kg
0-12 1 4 5.4 71 9.4
12-26 4 1.1 5.2 200 3.1
26-60 4 0.5 5.3 190 3
6.2 Individual soil pit sites sampled across the Bairnsdale region
36
36
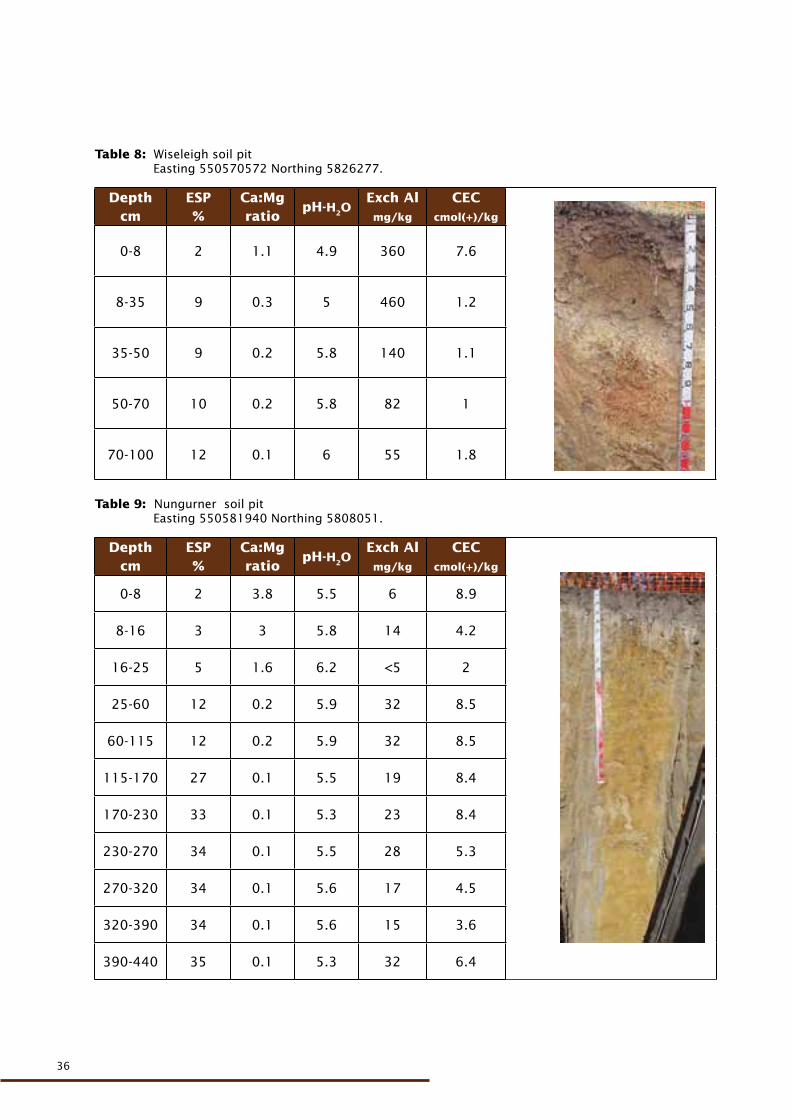
Table 8: Wiseleigh soil pitEasting 550570572 Northing 5826277.
Depthcm
ESP%
Ca:Mgratio
pH-H2OExch Almg/kg
CECcmol(+)/kg
0-8 2 1.1 4.9 360 7.6
8-35 9 0.3 5 460 1.2
35-50 9 0.2 5.8 140 1.1
50-70 10 0.2 5.8 82 1
70-100 12 0.1 6 55 1.8
Table 9: Nungurner soil pitEasting 550581940 Northing 5808051.
Depthcm
ESP%
Ca:Mgratio
pH-H2OExch Almg/kg
CECcmol(+)/kg
0-8 2 3.8 5.5 6 8.9
8-16 3 3 5.8 14 4.2
16-25 5 1.6 6.2 <5 2
25-60 12 0.2 5.9 32 8.5
60-115 12 0.2 5.9 32 8.5
115-170 27 0.1 5.5 19 8.4
170-230 33 0.1 5.3 23 8.4
230-270 34 0.1 5.5 28 5.3
270-320 34 0.1 5.6 17 4.5
320-390 34 0.1 5.6 15 3.6
390-440 35 0.1 5.3 32 6.4
37
Tunnel erosion in East Gippsland
37
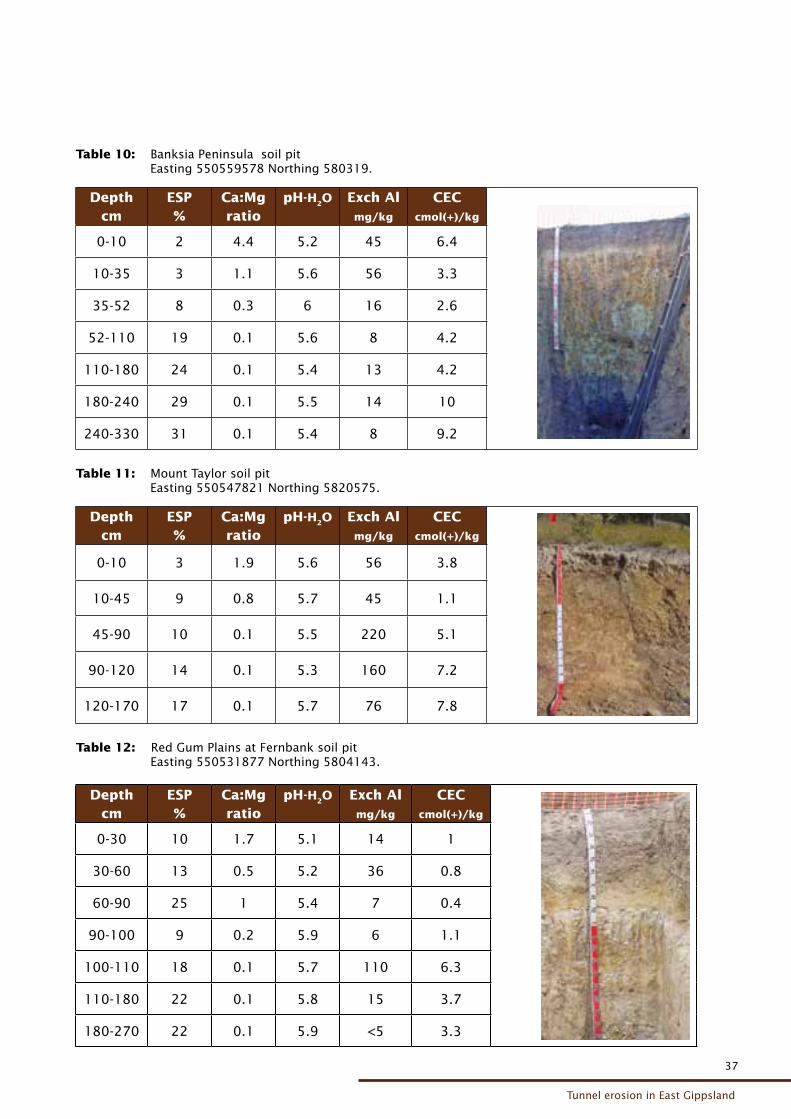
Table 10: Banksia Peninsula soil pitEasting 550559578 Northing 580319.
Depthcm
ESP%
Ca:Mgratio
pH-H2O
Exch Almg/kg
CECcmol(+)/kg
0-10 2 4.4 5.2 45 6.4
10-35 3 1.1 5.6 56 3.3
35-52 8 0.3 6 16 2.6
52-110 19 0.1 5.6 8 4.2
110-180 24 0.1 5.4 13 4.2
180-240 29 0.1 5.5 14 10
240-330 31 0.1 5.4 8 9.2
Table 11: Mount Taylor soil pitEasting 550547821 Northing 5820575.
Depthcm
ESP%
Ca:Mgratio
pH-H2O
Exch Almg/kg
CECcmol(+)/kg
0-10 3 1.9 5.6 56 3.8
10-45 9 0.8 5.7 45 1.1
45-90 10 0.1 5.5 220 5.1
90-120 14 0.1 5.3 160 7.2
120-170 17 0.1 5.7 76 7.8
Table 12: Red Gum Plains at Fernbank soil pitEasting 550531877 Northing 5804143.
Depthcm
ESP%
Ca:Mgratio
pH-H2O Exch Almg/kg
CECcmol(+)/kg
0-30 10 1.7 5.1 14 1
30-60 13 0.5 5.2 36 0.8
60-90 25 1 5.4 7 0.4
90-100 9 0.2 5.9 6 1.1
100-110 18 0.1 5.7 110 6.3
110-180 22 0.1 5.8 15 3.7
180-270 22 0.1 5.9 <5 3.3
38
38
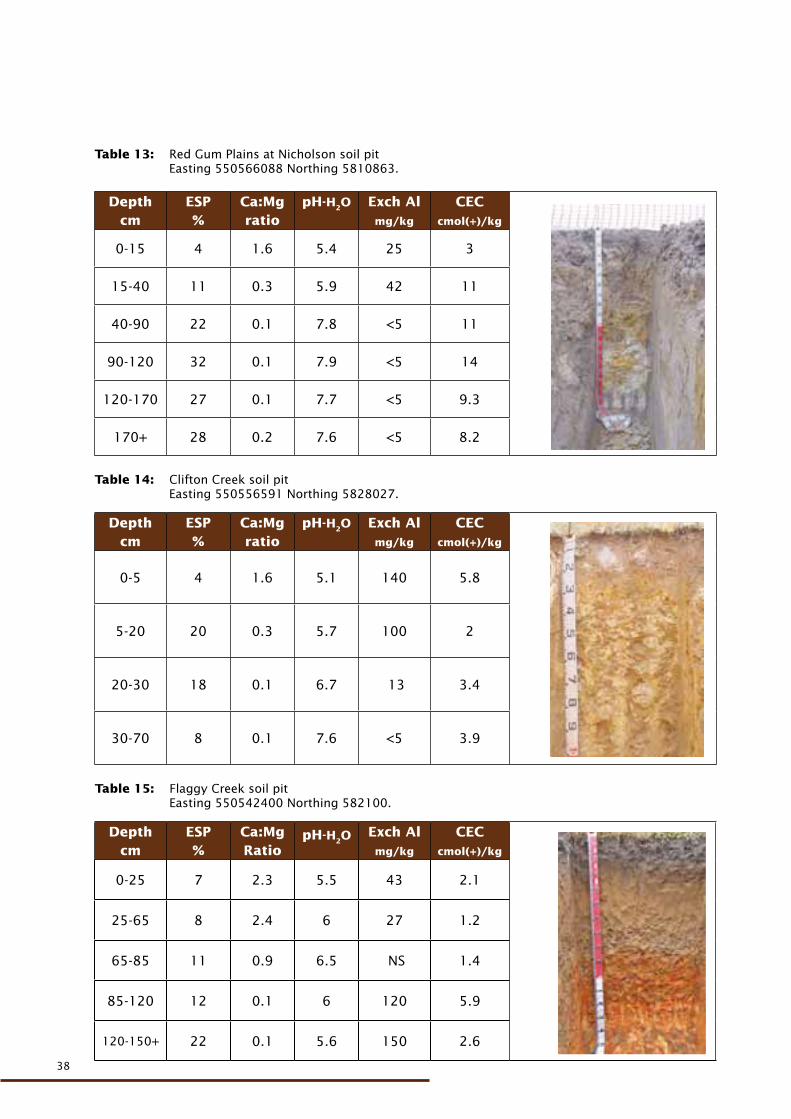
Table 13: Red Gum Plains at Nicholson soil pit Easting 550566088 Northing 5810863.
Depth
cmESP%
Ca:Mgratio
pH-H2O Exch Almg/kg
CECcmol(+)/kg
0-15 4 1.6 5.4 25 3
15-40 11 0.3 5.9 42 11
40-90 22 0.1 7.8 <5 11
90-120 32 0.1 7.9 <5 14
120-170 27 0.1 7.7 <5 9.3
170+ 28 0.2 7.6 <5 8.2
Table 14: Clifton Creek soil pitEasting 550556591 Northing 5828027.
Depthcm
ESP%
Ca:Mgratio
pH-H2O
Exch Almg/kg
CECcmol(+)/kg
0-5 4 1.6 5.1 140 5.8
5-20 20 0.3 5.7 100 2
20-30 18 0.1 6.7 13 3.4
30-70 8 0.1 7.6 <5 3.9
Table 15: Flaggy Creek soil pit Easting 550542400 Northing 582100.
Depth cm
ESP %
Ca:Mg Ratio
pH-H2OExch Al mg/kg
CECcmol(+)/kg
0-25 7 2.3 5.5 43 2.1
25-65 8 2.4 6 27 1.2
65-85 11 0.9 6.5 NS 1.4
85-120 12 0.1 6 120 5.9
120-150+ 22 0.1 5.6 150 2.6
39
Tunnel erosion in East Gippsland
39
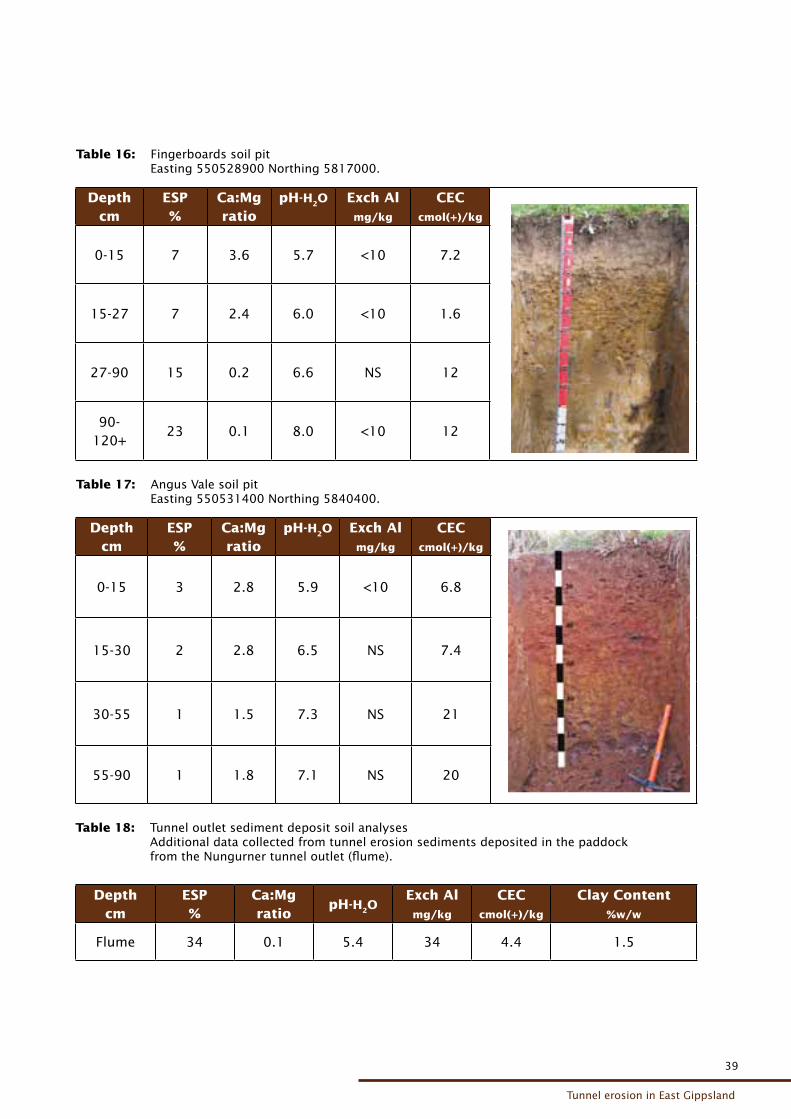
Table 16: Fingerboards soil pitEasting 550528900 Northing 5817000.
Depth cm
ESP %
Ca:Mg ratio
pH-H2O Exch Al mg/kg
CECcmol(+)/kg
0-15 7 3.6 5.7 <10 7.2
15-27 7 2.4 6.0 <10 1.6
27-90 15 0.2 6.6 NS 12
90-120+
23 0.1 8.0 <10 12
Table 17: Angus Vale soil pit
Easting 550531400 Northing 5840400.
Depth cm
ESP %
Ca:Mg ratio
pH-H2O Exch Al mg/kg
CECcmol(+)/kg
0-15 3 2.8 5.9 <10 6.8
15-30 2 2.8 6.5 NS 7.4
30-55 1 1.5 7.3 NS 21
55-90 1 1.8 7.1 NS 20
Table 18: Tunnel outlet sediment deposit soil analyses Additional data collected from tunnel erosion sediments deposited in the paddock
from the Nungurner tunnel outlet (flume).
Depth cm
ESP %
Ca:Mg ratio
pH-H2OExch Al mg/kg
CECcmol(+)/kg
Clay Content %w/w
Flume 34 0.1 5.4 34 4.4 1.5
40
40
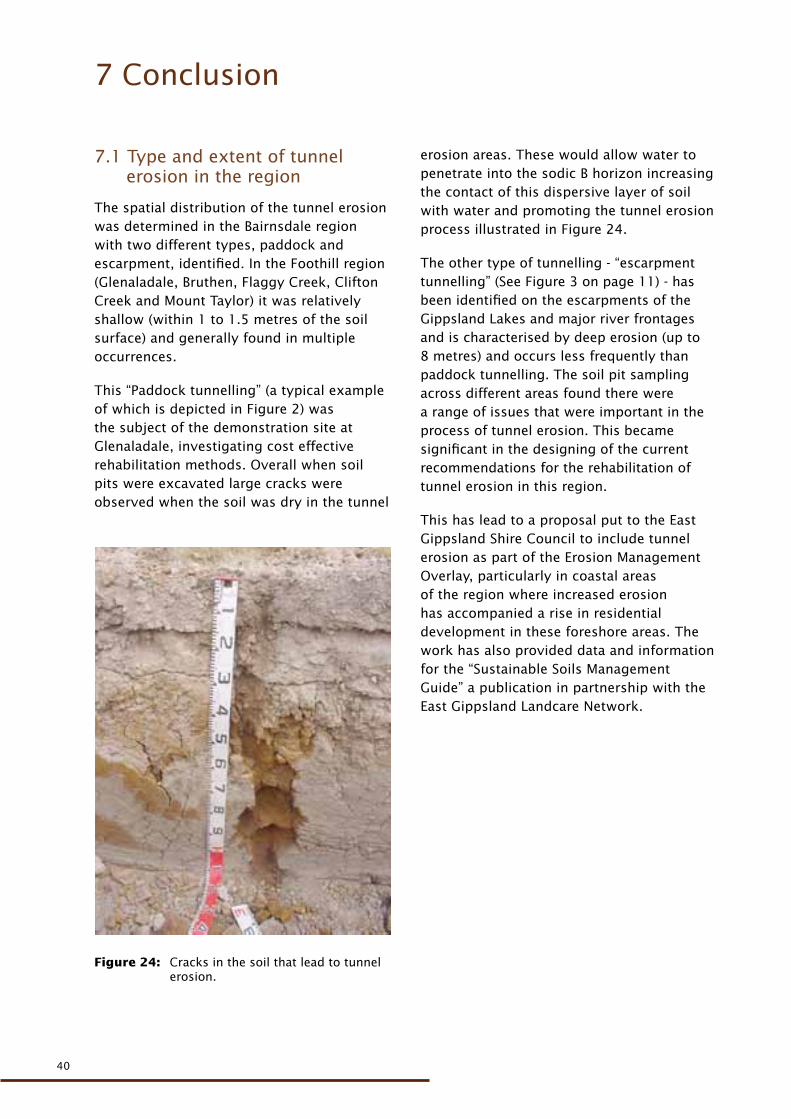
Figure 24: Cracks in the soil that lead to tunnel erosion.
7 Conclusion
7.1 Type and extent of tunnel erosion in the region
The spatial distribution of the tunnel erosion was determined in the Bairnsdale region with two different types, paddock and escarpment, identified. In the Foothill region (Glenaladale, Bruthen, Flaggy Creek, Clifton Creek and Mount Taylor) it was relatively shallow (within 1 to 1.5 metres of the soil surface) and generally found in multiple occurrences.
This “Paddock tunnelling” (a typical example of which is depicted in Figure 2) was the subject of the demonstration site at Glenaladale, investigating cost effective rehabilitation methods. Overall when soil pits were excavated large cracks were observed when the soil was dry in the tunnel
erosion areas. These would allow water to penetrate into the sodic B horizon increasing the contact of this dispersive layer of soil with water and promoting the tunnel erosion process illustrated in Figure 24.
The other type of tunnelling - “escarpment tunnelling” (See Figure 3 on page 11) - has been identified on the escarpments of the Gippsland Lakes and major river frontages and is characterised by deep erosion (up to 8 metres) and occurs less frequently than paddock tunnelling. The soil pit sampling across different areas found there were a range of issues that were important in the process of tunnel erosion. This became significant in the designing of the current recommendations for the rehabilitation of tunnel erosion in this region.
This has lead to a proposal put to the East Gippsland Shire Council to include tunnel erosion as part of the Erosion Management Overlay, particularly in coastal areas of the region where increased erosion has accompanied a rise in residential development in these foreshore areas. The work has also provided data and information for the “Sustainable Soils Management Guide” a publication in partnership with the East Gippsland Landcare Network.
41
Tunnel erosion in East Gippsland
41
7.2 Methods to rehabilitate tunnel erosion
Works at the Glenaladale demonstration site indicated that deep ripping alone can produce effective results for up to seven years (Figures 25 and 26).
To supplement ripping in the rehabilitation of tunnel erosion, calcium in the form of lime and gypsum was applied with the intention of reducing clay dispersion. Our results did not show that this had occurred. This could partly have been due to the amounts used (1 and 2 t/ha) being considerably less than laboratory testing suggested for full dispersion control (15 t/ha) and partly due to
the fact that the demonstration site was not replicated to enable statistical differences to be detected. However, despite this the available literature indicates applications of both these forms of calcium contribute to reducing the dispersiveness of soils (Hazelton et al 1992).
The demonstration site and the regional soil analyses provided sufficient data to develop a comparable costing method to that used on gully erosion, to rehabilitate tunnel erosion in the Foothills area of the East Gippsland region. In addition, important information was provided about the extent, severity and location of tunnel erosion in this region.
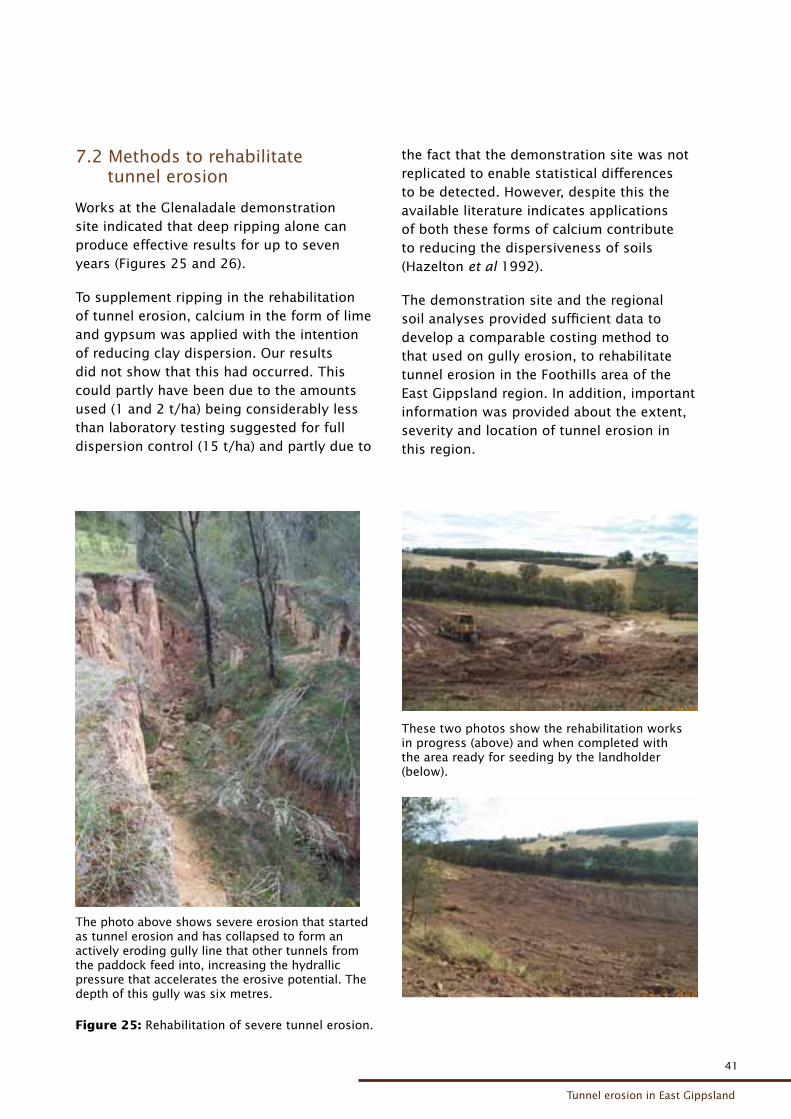
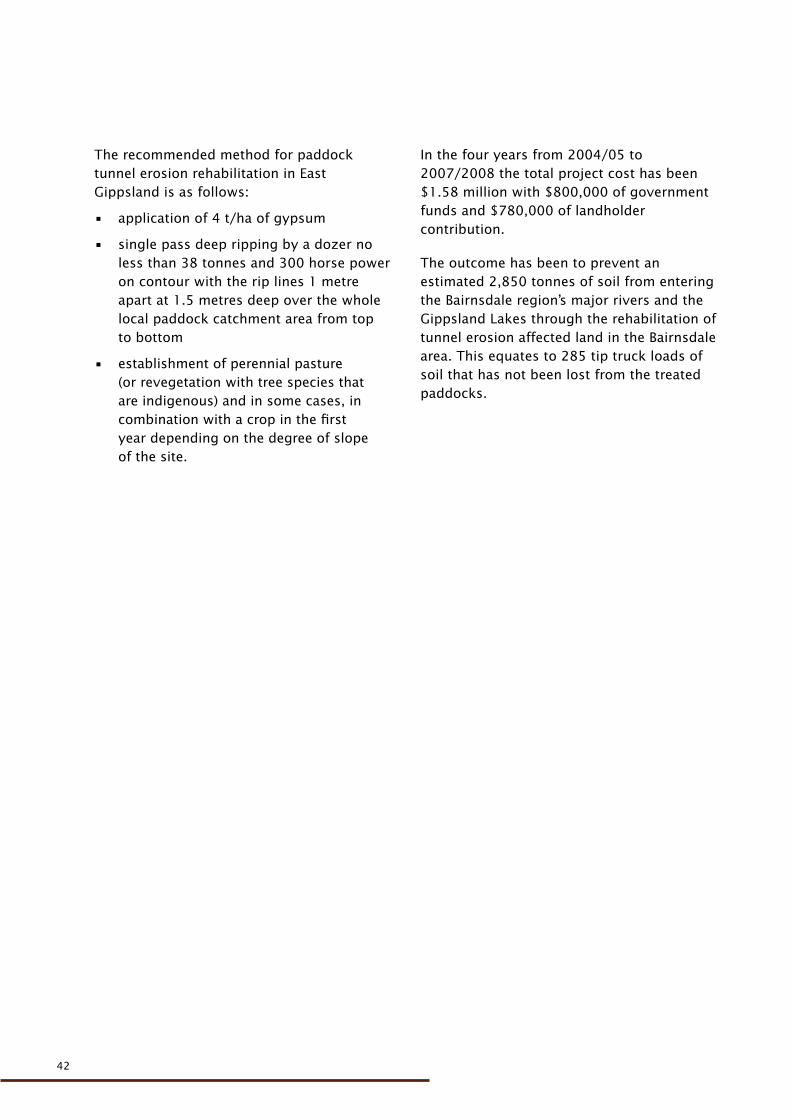
Figure 25: Rehabilitation of severe tunnel erosion.
The photo above shows severe erosion that started as tunnel erosion and has collapsed to form an actively eroding gully line that other tunnels from the paddock feed into, increasing the hydrallic pressure that accelerates the erosive potential. The depth of this gully was six metres.
These two photos show the rehabilitation works in progress (above) and when completed with the area ready for seeding by the landholder (below).
42
42
The recommended method for paddock tunnel erosion rehabilitation in East Gippsland is as follows:
• application of 4 t/ha of gypsum
• single pass deep ripping by a dozer no less than 38 tonnes and 300 horse power on contour with the rip lines 1 metre apart at 1.5 metres deep over the whole local paddock catchment area from top to bottom
• establishment of perennial pasture (or revegetation with tree species that are indigenous) and in some cases, in combination with a crop in the first year depending on the degree of slope of the site.
In the four years from 2004/05 to 2007/2008 the total project cost has been $1.58 million with $800,000 of government funds and $780,000 of landholder contribution.
The outcome has been to prevent an estimated 2,850 tonnes of soil from entering the Bairnsdale region’s major rivers and the Gippsland Lakes through the rehabilitation of tunnel erosion affected land in the Bairnsdale area. This equates to 285 tip truck loads of soil that has not been lost from the treated paddocks.
43
Tunnel erosion in East Gippsland
43
8 Future projects
The main areas needing further investigation include the following:
• The demonstration site and areas that have been rehabilitated require long term monitoring to ensure the current stability of the soil is maintained.
• Providing landholders with recommendations on how to manage these areas into the future (in terms of additional requirements for the addition of either gypsum or lime) to maintain the stability of the soil and the perennial pasture cover.
An investigation has commenced to address this issue and landholder guidelines will be provided at the end of 2011(Project title: Tunnel Erosion Rehabilitation Research Project).
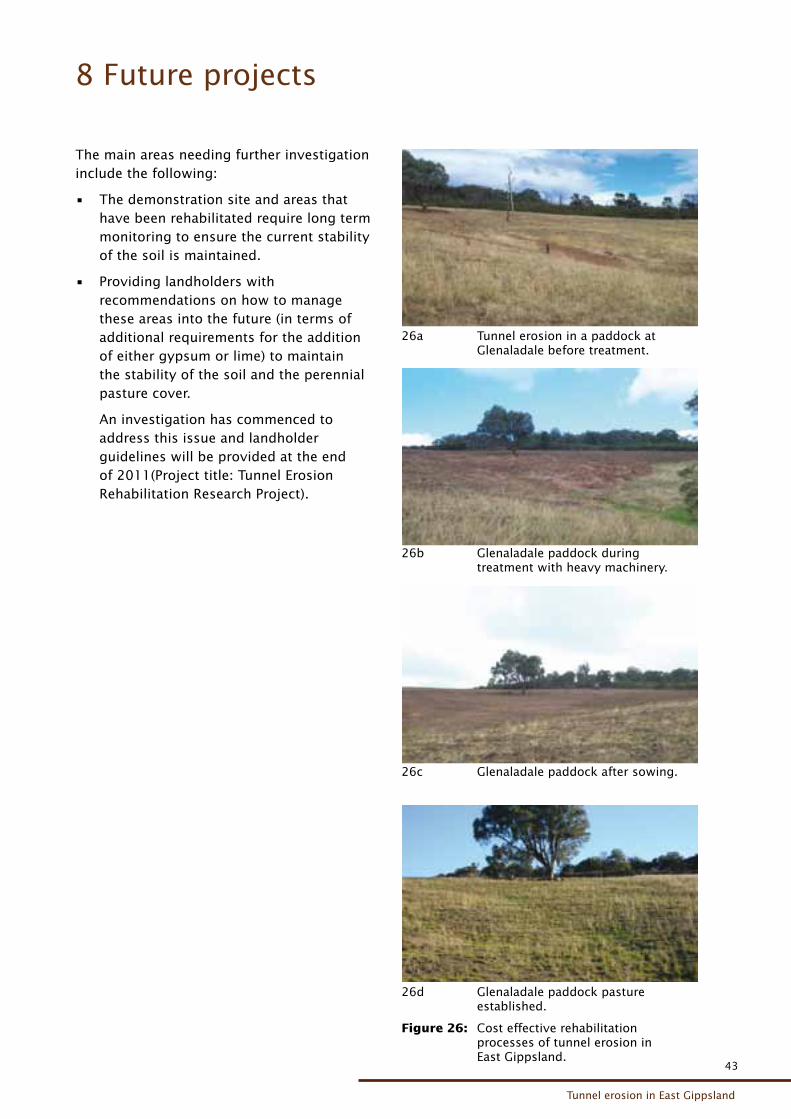
Figure 26: Cost effective rehabilitation processes of tunnel erosion in East Gippsland.
26a Tunnel erosion in a paddock at Glenaladale before treatment.
26b Glenaladale paddock during treatment with heavy machinery.
26c Glenaladale paddock after sowing.
26d Glenaladale paddock pasture established.
44
44
45
Tunnel erosion in East Gippsland
45
Abbott TS, McKenzie DC (1996). Improving soil structure with gypsum and lime. AgFact AC10 second edition NSW Agriculture.
Boucher SC (1990). Field Tunnel Erosion: its Characteristics and Amelioration. PhD Thesis, University of Monash, (Clayton and Department of Conservation and Environment, East Melbourne) Australia.
Boucher S (2006). Tunnel erosion. Online article available at www.vro.vic.gov.au. (Department of Primary Industries).
East Gippsland Catchment Management Authority (2005). East Gippsland Regional Catchment Strategy. (East Gippsland Catchment Management Authority).
Floyd EJ (1974). Tunnel erosion--a field study in the Riverina. Journal Soil Conservation New South Wales 30,145-156.
Gippsland Lakes Future Directions and Action Plan (2002). Department of Natural Resources and Environment. (Gippsland Coastal Board).
Hazelton PA, Murphy BM (1992). What Do All the Numbers Mean? A Guide for the Interpretation of Soil Test Results, (Dept of Conservation & Land Management, Sydney).
Hancock G, Wilkinson S, Read A (2007). Sources of sediment and nutrients to the Gippsland Lakes assessed using catchment modelling and sediment tracers. CSIRO Land and Water Science Report 70/07 July 2007.
Leeper GW and Uren N (1993). Introduction to Soil Science. Melbourne University Press, Melbourne.
Lines-Kelly R (Ed) (2000). Soil sense soil management for NSW North Coast farmers. NSW Agriculture.
McKenzie DC, Abbott TS, Chan KY, Slavich PG, Hall DJM (1993). The nature, distribution and management of sodic soils in New South Wales. Australian Journal of Soil Research 31, 839-868.
Nadiu R, Merry RH, Churchman GJ, Wright MJ, Murray RS, Fitzpatrick RW, Zarcinas BA (1993). Sodicity in South Australia – a review. Australian Journal of Soil Research 31, 911-29.
NSW Agriculture and Fisheries (1989). Soil testing Methods And Interpretation. Biological and Chemical Research Institute, NSW Agriculture & Fisheries, Rydalmere.
Peverill KI, Sparrow LA, Reuter DI (Eds) (2001). Soil analysis an interpretation manual. CSIRO Publishing Australia.
Sargeant I, Sargant J (2005). Sustainable Soil Management. A reference manual to the major agricultural soils of the Bairnsdale and Dargo regions. East Gippsland Landcare Network Version 1.
Waters C (2002). Tunnel erosion. Department of Primary Industries Information Notes Series Number AG0474.
Webster IT, Parslow JS, Grayson RB, Molloy JA, Pavel S, Seong Tan K, Walker SJ, Wallace BB (2001). Gippsland Lakes Environmental Study Assessing Options for Improving Water Quality and Ecological Function. Final Report November. CSIRO Publishing.
Ziebell D and Richards P (1993). Tunnel erosion. Department of Conservation and Natural Resources. Farm Care Note 3.1
9 References
46
46
Appendix one - Chemical data from soil pits sampled across the Bairnsdale Region
Appendix two - East Gippsland Tunnel Erosion brochure
Appendix three - Erosion Hazard Identification Sheet
Appendix four - Feedback results for past four years
Appendix five - Tunnel erosion case studies
47
Tunnel erosion in East Gippsland
47
Appen
dix
one
– C
hem
ical
dat
a fr
om
soil
pit
s sa
mple
d a
cross
the
Bair
nsd
ale
Reg
ion
Gle
nala
dale
near
Den
of
Narg
un
(d
em
on
str
ati
on
sit
e p
it 1
) E
asti
ng
55
05
29
59
0
Nort
hin
g 5
82
70
27
Hori
zon
Dep
th
cm
Colo
ur
Textu
reG
rave
lLi
me
Coar
se
Sand
% w
/w
Fine
Sand
% w
/w
Silt
% w
/w
Cla
y
% w
/w
pH
-H2O
pH
-C
aCl 2
Exch
.H
cmol(+
)/kg
E.C
.
dS/
m
T.S.
S.
% w
/w
Tota
l C
% w
/w
Org
.M
at
% w
/w
Tota
l N
% w
/w
O2
Dar
kish
gre
y
bro
wn
Fine
sand
y
loam
less
than
5 %
Neg
ligib
le1
64
2.7
14
.59
4.8
4.1
20
0.0
90
.03
8.8
NS
0.6
2
A1
1
2-7
Dar
kish
gre
y
bro
wn
Ver
y fi
ne
sand
y
clay
loam
5%
Neg
ligib
le6
.85
4.2
20
95
4.3
16
0.0
70
.02
4.7
NS
0.3
A1
2
7-1
5
Yello
wis
h
gre
yish
bro
wn
Ver
y fi
ne
sand
y
clay
loam
10
%N
eglig
ible
5.1
60
.51
1.5
23
5.3
4.4
6.8
<0
.05
0.0
21
.7N
S0
.08
A2
15
-45
Light
yello
wis
h
bro
wn
Silt
y cl
ay
loam
30
%N
eglig
ible
3.8
62
.22
59
.55
.64
.51
1<
0.0
50
.02
0.5
7N
S<
0.0
5
B21
45
-70
Lighti
sh
yello
wis
h
bro
wn
Med
ium
hea
vy
clay
less
than
5 %
Neg
ligib
le2
.21
5.8
67
4.5
5.6
4.2
18
0.0
60
.02
NS
NS
NS
B22
70
-11
0
Lighti
sh
yello
wis
h
bro
wn
Light
med
ium
clay
5%
Neg
ligib
le4
.33
1.1
10
52
.55
.84
.41
10
.07
0.0
2N
SN
SN
S
C
11
0-
14
0
Light
yello
wis
h
gre
yish
bro
wn
Light
clay
less
than
5 %
Neg
ligib
le4
.83
91
44
1.5
6.5
5.1
5.1
0.0
80
.03
NS
NS
NS
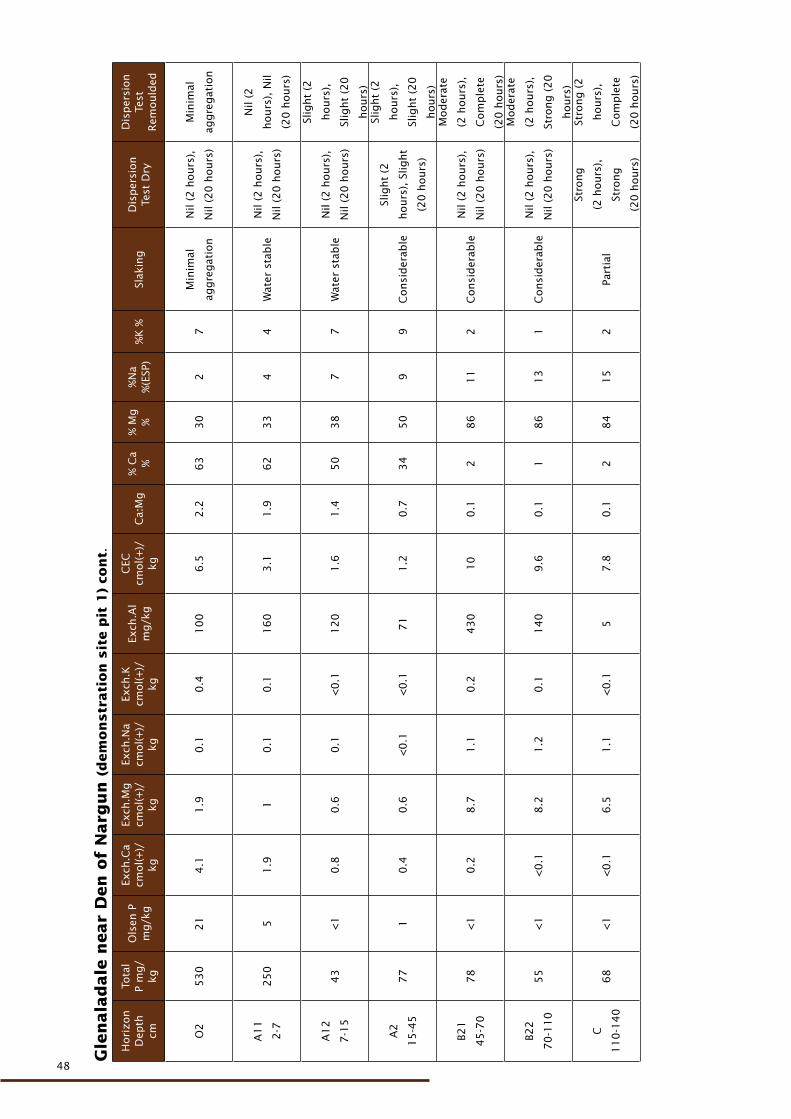
48
48
Gle
nala
dale
near
Den
of
Narg
un
(d
em
on
str
ati
on
sit
e p
it 1
) co
nt.
Hori
zon
Dep
th
cm
Tota
l P
mg/
kg
Ols
en P
m
g/k
g
Exch
.Ca
cmol(+
)/kg
Exch
.Mg
cmol(+
)/kg
Exch
.Na
cmol(+
)/kg
Exch
.K
cmol(+
)/kg
Exch
.Al
mg/k
g
CEC
cm
ol(+
)/kg
Ca:
Mg
% C
a %
% M
g
%%
Na
%(E
SP)
%K
%Sl
akin
gD
isp
ersi
on
Test
Dry
Dis
per
sion
Test
R
emould
ed
O2
53
02
14
.11
.90
.10
.41
00
6.5
2.2
63
30
27
Min
imal
aggre
gat
ion
Nil
(2 h
ours
),
Nil
(20
hours
)
Min
imal
aggre
gat
ion
A1
1
2-7
25
05
1.9
10
.10
.11
60
3.1
1.9
62
33
44
Wat
er s
tab
leN
il (2
hours
),
Nil
(20
hours
)
Nil
(2
hours
), N
il
(20
hours
)
A1
2
7-1
54
3<
10
.80
.60
.1<
0.1
12
01
.61
.45
03
87
7W
ater
sta
ble
Nil
(2 h
ours
),
Nil
(20
hours
)
Slig
ht
(2
hours
),
Slig
ht
(20
hours
)
A2
15
-45
77
10
.40
.6<
0.1
<0
.17
11
.20
.73
45
09
9C
onsi
der
able
Slig
ht
(2
hours
), S
light
(20
hours
)
Slig
ht
(2
hours
),
Slig
ht
(20
hours
)
B21
45
-70
78
<1
0.2
8.7
1.1
0.2
43
01
00
.12
86
11
2C
onsi
der
able
Nil
(2 h
ours
),
Nil
(20
hours
)
Mod
erat
e
(2 h
ours
),
Com
ple
te
(20
hours
)
B22
70
-11
05
5<
1<
0.1
8.2
1.2
0.1
14
09
.60
.11
86
13
1C
onsi
der
able
Nil
(2 h
ours
),
Nil
(20
hours
)
Mod
erat
e
(2 h
ours
),
Stro
ng (
20
hours
)
C
11
0-1
40
68
<1
<0
.16
.51
.1<
0.1
57
.80
.12
84
15
2Pa
rtia
l
Stro
ng
(2 h
ours
),
Stro
ng
(20
hours
)
Stro
ng (
2
hours
),
Com
ple
te
(20
hours
)
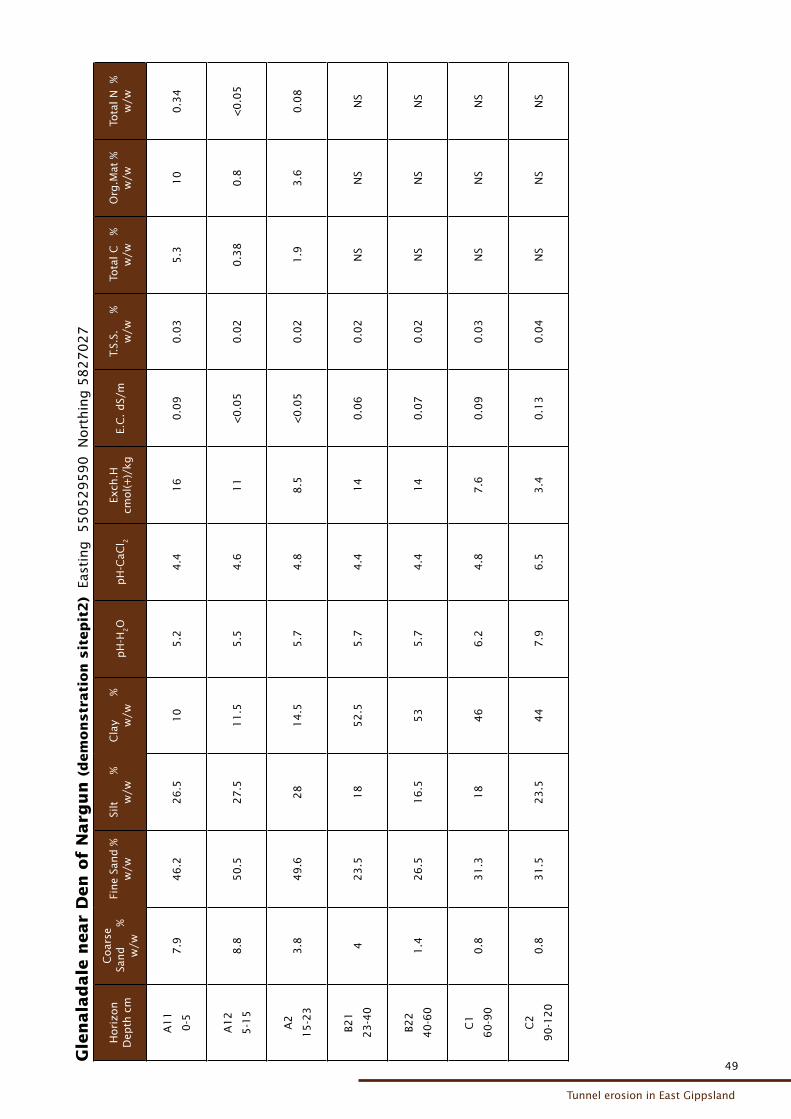
49
Tunnel erosion in East Gippsland
49
Gle
nala
dale
near
Den
of
Narg
un
(d
em
on
str
ati
on
sit
ep
it2
) E
asti
ng
55
05
29
59
0
Nort
hin
g 5
82
70
27
Hori
zon
Dep
th c
m
Coar
se
Sand
%
w
/w
Fine
Sand
%
w/w
Silt
%
w/w
Cla
y
%
w/w
pH
-H2O
pH
-CaC
l 2
Exch
.H
cmol(+
)/kg
E.C
. d
S/m
T.S.
S.
%
w
/wTo
tal C
%
w
/wO
rg.M
at %
w
/wTo
tal N
%
w
/w
A1
1
0-5
7.9
46
.22
6.5
10
5.2
4.4
16
0.0
90
.03
5.3
10
0.3
4
A1
2
5-1
58
.85
0.5
27
.51
1.5
5.5
4.6
11
<0
.05
0.0
20
.38
0.8
<0
.05
A2
15
-23
3.8
49
.62
81
4.5
5.7
4.8
8.5
<0
.05
0.0
21
.93
.60
.08
B21
23
-40
42
3.5
18
52
.55
.74
.41
40
.06
0.0
2N
S
N
S
N
S
B22
40
-60
1.4
26
.51
6.5
53
5.7
4.4
14
0.0
70
.02
NS
NS
NS
C1
60
-90
0.8
31
.31
84
66
.24
.87
.60
.09
0.0
3N
S
N
S
N
S
C2
90
-12
00
.83
1.5
23
.54
47
.96
.53
.40
.13
0.0
4N
S
N
S
N
S
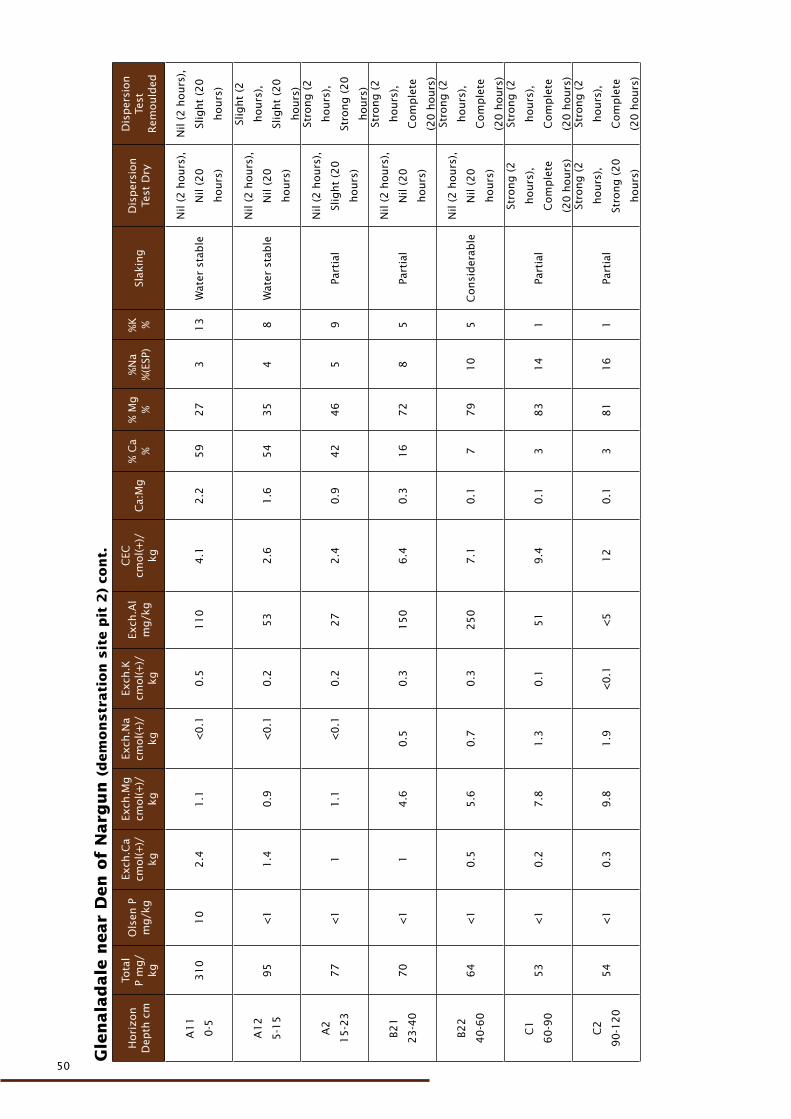
50
50
Gle
nala
dale
near
Den
of
Narg
un
(d
em
on
str
ati
on
sit
e p
it 2
) co
nt.
Hori
zon
Dep
th c
m
Tota
l P
mg/
kg
Ols
en P
m
g/k
g
Exch
.Ca
cmol(+
)/kg
Exch
.Mg
cmol(+
)/kg
Exch
.Na
cmol(+
)/kg
Exch
.K
cmol(+
)/kg
Exch
.Al
mg/k
g
CEC
cm
ol(+
)/kg
Ca:
Mg
% C
a %
% M
g
%%
Na
%(E
SP)
%K
%
Slak
ing
Dis
per
sion
Test
Dry
Dis
per
sion
Test
R
emould
ed
A1
1
0-5
31
01
02
.41
.1
<0
.10
.51
10
4.1
2.2
59
27
31
3W
ater
sta
ble
Nil
(2 h
ours
),
Nil
(20
hours
)
Nil
(2 h
ours
),
Slig
ht
(20
hours
)
A1
2
5-1
59
5<
11
.40
.9
<0
.10
.25
32
.61
.65
43
54
8W
ater
sta
ble
Nil
(2 h
ours
),
Nil
(20
hours
)
Slig
ht
(2
hours
),
Slig
ht
(20
hours
)
A2
15
-23
77
<1
11
.1
<0
.10
.22
72
.40
.94
24
65
9Pa
rtia
l
Nil
(2 h
ours
),
Slig
ht
(20
hours
)
Stro
ng (
2
hours
),
Stro
ng (
20
hours
)
B21
23
-40
70
<1
14
.60
.50
.31
50
6.4
0.3
16
72
85
Part
ial
Nil
(2 h
ours
),
Nil
(20
hours
)
Stro
ng (
2
hours
),
Com
ple
te
(20
hours
)
B22
40
-60
64
<1
0.5
5.6
0.7
0.3
25
07
.10
.17
79
10
5C
onsi
der
able
Nil
(2 h
ours
),
Nil
(20
hours
)
Stro
ng (
2
hours
),
Com
ple
te
(20
hours
)
C1
60
-90
53
<1
0.2
7.8
1.3
0.1
51
9.4
0.1
38
31
41
Part
ial
Stro
ng (
2
hours
),
Com
ple
te
(20
hours
)
Stro
ng (
2
hours
),
Com
ple
te
(20
hours
)
C2
90
-12
05
4<
10
.39
.81
.9<
0.1
<5
12
0.1
38
11
61
Part
ial
Stro
ng (
2
hours
),
Stro
ng (
20
hours
)
Stro
ng (
2
hours
),
Com
ple
te
(20
hours
)
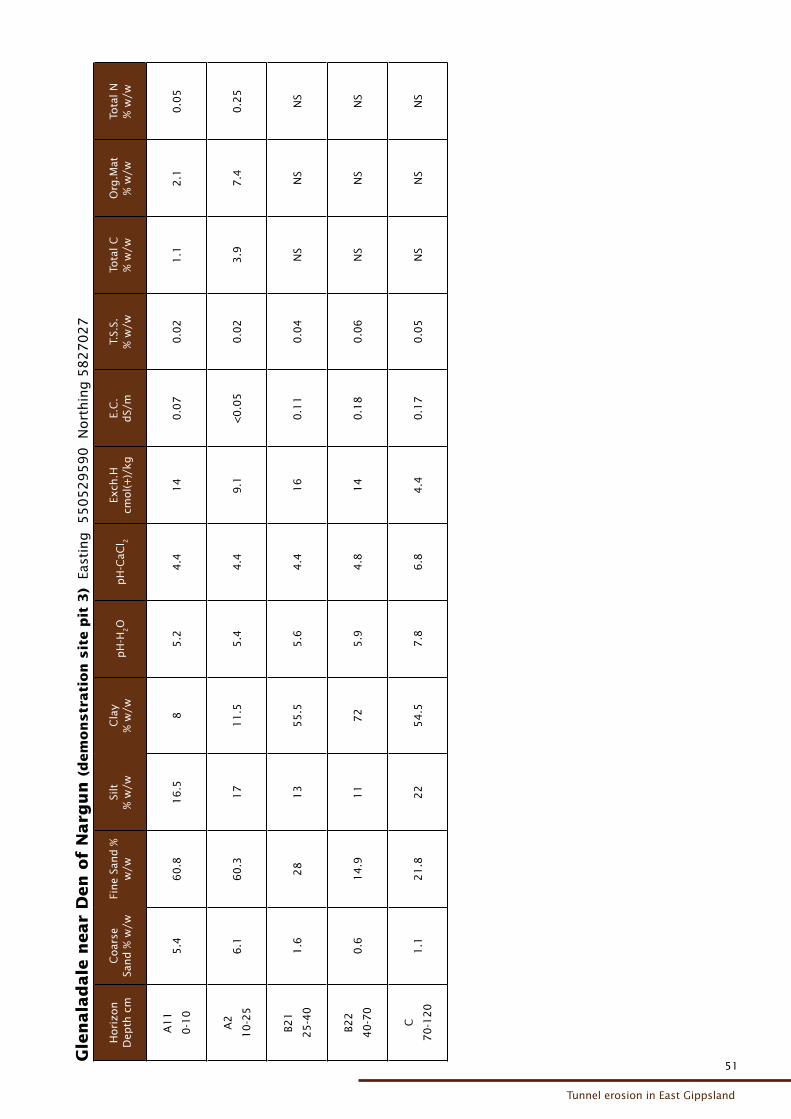
51
Tunnel erosion in East Gippsland
51
Gle
nala
dale
near
Den
of
Narg
un
(d
em
on
str
ati
on
sit
e p
it 3
) E
asti
ng
55
05
29
59
0
Nort
hin
g 5
82
70
27
Hori
zon
Dep
th c
mC
oar
se
Sand
% w
/wFi
ne
Sand
%
w/w
Silt
%
w/w
Cla
y %
w/w
pH
-H2O
pH
-CaC
l 2
Exch
.H
cmol(+
)/kg
E.C
. d
S/m
T.S.
S.
% w
/wTo
tal C
%
w/w
Org
.Mat
%
w/w
Tota
l N
%
w/w
A1
1
0-1
05
.46
0.8
16
.58
5.2
4.4
14
0.0
70
.02
1.1
2.1
0.0
5
A2
10
-25
6.1
60
.31
71
1.5
5.4
4.4
9.1
<0
.05
0.0
23
.97
.40
.25
B21
25
-40
1.6
28
13
55
.55
.64
.41
60
.11
0.0
4N
S
N
SN
S
B22
40
-70
0.6
14
.91
17
25
.94
.81
40
.18
0.0
6N
S
N
SN
S
C
70
-12
01
.12
1.8
22
54
.57
.86
.84
.40
.17
0.0
5N
S
N
SN
S
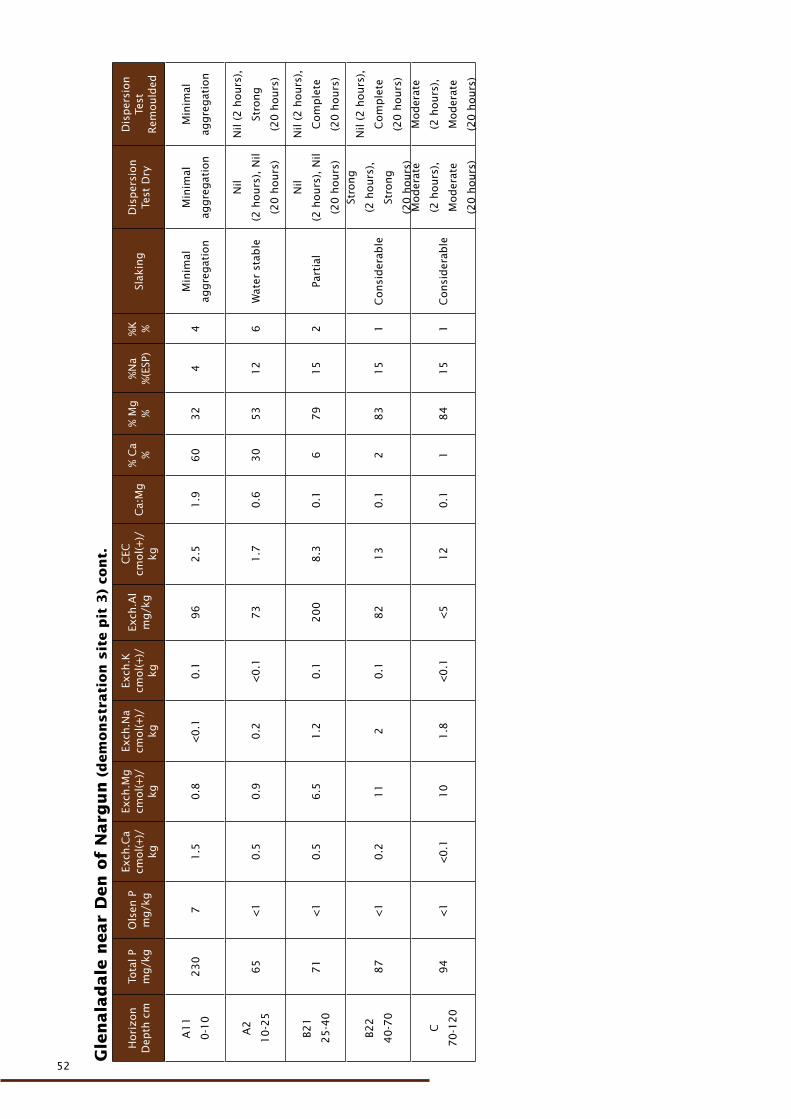
52
52
Gle
nala
dale
near
Den
of
Narg
un
(d
em
on
str
ati
on
sit
e p
it 3
) co
nt.
Hori
zon
Dep
th c
mTo
tal P
mg/k
gO
lsen
P
mg/k
g
Exch
.Ca
cmol(+
)/kg
Exch
.Mg
cmol(+
)/kg
Exch
.Na
cmol(+
)/kg
Exch
.K
cmol(+
)/kg
Exch
.Al
mg/k
g
CEC
cm
ol(+
)/kg
Ca:
Mg
% C
a %
% M
g
%%
Na
%(E
SP)
%K
%
Slak
ing
Dis
per
sion
Test
Dry
Dis
per
sion
Test
R
emould
ed
A1
1
0-1
02
30
71
.50
.8<
0.1
0.1
96
2.5
1.9
60
32
44
Min
imal
aggre
gat
ion
Min
imal
aggre
gat
ion
Min
imal
aggre
gat
ion
A2
10
-25
65
<1
0.5
0.9
0.2
<0
.17
31
.70
.63
05
31
26
Wat
er s
tab
le
Nil
(2 h
ours
), N
il
(20
hours
)
Nil
(2 h
ours
),
Stro
ng
(20
hours
)
B21
25
-40
71
<1
0.5
6.5
1.2
0.1
20
08
.30
.16
79
15
2Pa
rtia
l
Nil
(2 h
ours
), N
il
(20
hours
)
Nil
(2 h
ours
),
Com
ple
te
(20
hours
)
B22
40
-70
87
<1
0.2
11
20
.18
21
30
.12
83
15
1C
onsi
der
able
Stro
ng
(2 h
ours
),
Stro
ng
(20
hours
)
Nil
(2 h
ours
),
Com
ple
te
(20
hours
)
C
70
-12
09
4<
1<
0.1
10
1.8
<0
.1<
51
20
.11
84
15
1C
onsi
der
able
Mod
erat
e
(2 h
ours
),
Mod
erat
e
(20
hours
)
Mod
erat
e
(2 h
ours
),
Mod
erat
e
(20
hours
)
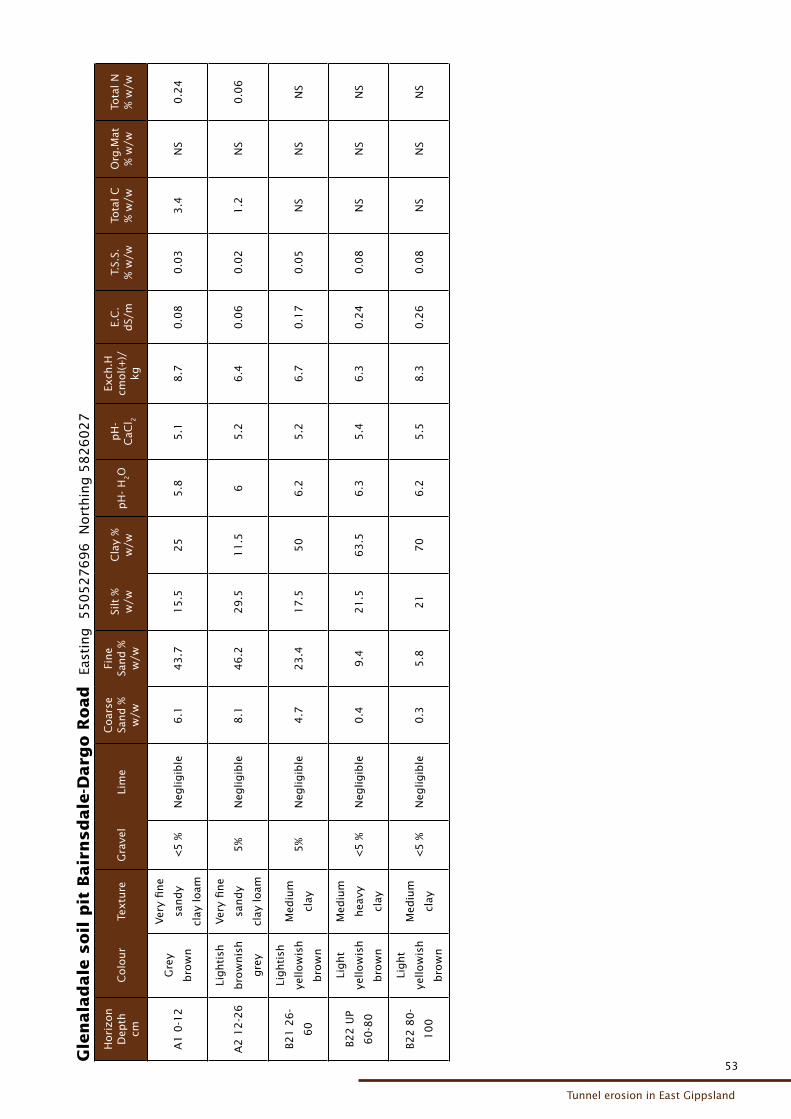
53
Tunnel erosion in East Gippsland
53
Gle
nala
dale
soil
pit
Bair
nsd
ale
-Darg
o R
oad
Ea
stin
g
55
05
27
69
6
Nort
hin
g 5
82
60
27
Hori
zon
Dep
th
cmC
olo
ur
Textu
reG
rave
lLi
me
Coar
se
Sand
%
w/w
Fine
Sand
%
w/w
Silt
%
w/w
Cla
y %
w
/wp
H-
H2O
pH
- C
aCl 2
Exch
.H
cmol(+
)/kg
E.C
. d
S/m
T.S.
S.
% w
/wTo
tal C
%
w/w
Org
.Mat
%
w/w
Tota
l N
%
w/w
A1
0-1
2G
rey
bro
wn
Ver
y fi
ne
sand
y
clay
loam
<5
%N
eglig
ible
6.1
43
.71
5.5
25
5.8
5.1
8.7
0.0
80
.03
3.4
NS
0.2
4
A2
12
-26
Lighti
sh
bro
wnis
h
gre
y
Ver
y fi
ne
sand
y
clay
loam
5%
Neg
ligib
le8
.14
6.2
29
.51
1.5
65
.26
.40
.06
0.0
21
.2N
S
0
.06
B21
26
-
60
Lighti
sh
yello
wis
h
bro
wn
Med
ium
clay
5%
Neg
ligib
le4
.72
3.4
17
.55
06
.25
.26
.70
.17
0.0
5N
S
NS
NS
B22
UP
60
-80
Light
yello
wis
h
bro
wn
Med
ium
hea
vy
clay
<5
%N
eglig
ible
0.4
9.4
21
.56
3.5
6.3
5.4
6.3
0.2
40
.08
NS
NS
NS
B22
80
-
10
0
Light
yello
wis
h
bro
wn
Med
ium
clay
<5
%N
eglig
ible
0.3
5.8
21
70
6.2
5.5
8.3
0.2
60
.08
NS
NS
NS
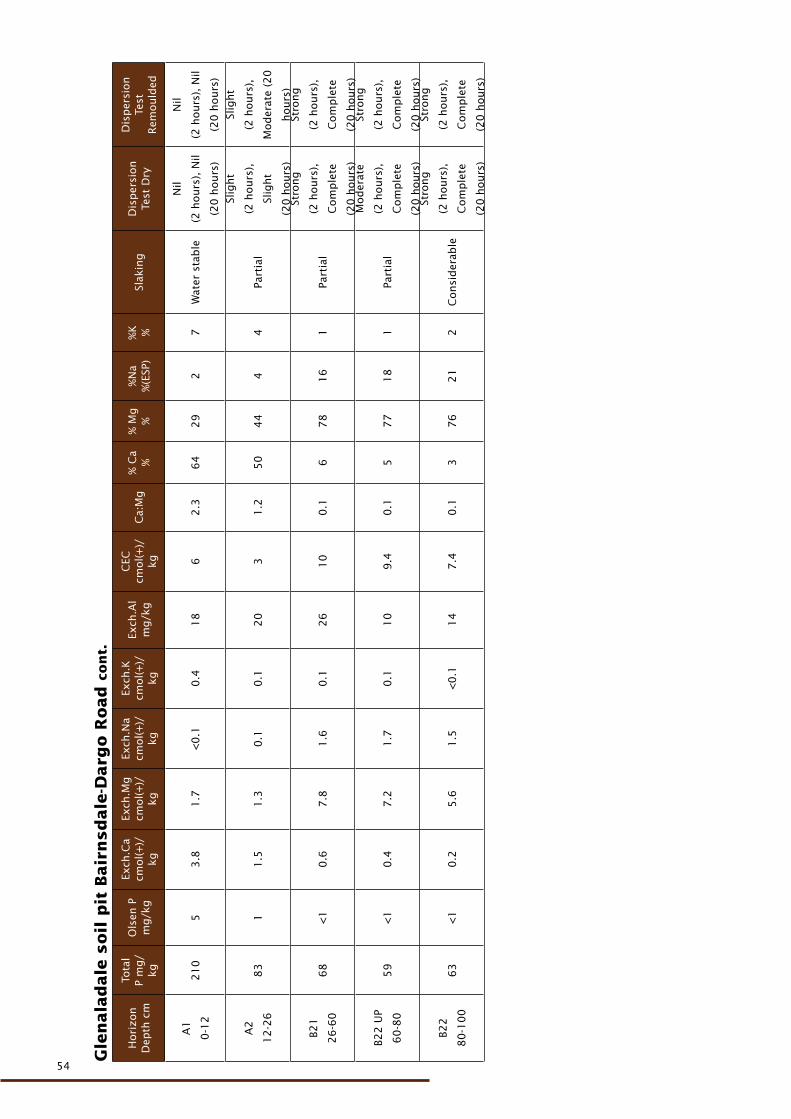
54
54
Gle
nala
dale
soil
pit
Bair
nsd
ale
-Darg
o R
oad
con
t.
Hori
zon
Dep
th c
m
Tota
l P
mg/
kg
Ols
en P
m
g/k
g
Exch
.Ca
cmol(+
)/kg
Exch
.Mg
cmol(+
)/kg
Exch
.Na
cmol(+
)/kg
Exch
.K
cmol(+
)/kg
Exch
.Al
mg/k
g
CEC
cm
ol(+
)/kg
Ca:
Mg
% C
a %
% M
g
%%
Na
%(E
SP)
%K
%
Slak
ing
Dis
per
sion
Test
Dry
Dis
per
sion
Test
R
emould
ed
A1
0-1
22
10
53
.81
.7<
0.1
0.4
18
62
.36
42
92
7W
ater
sta
ble
Nil
(2 h
ours
), N
il
(20
hours
)
Nil
(2 h
ours
), N
il
(20
hours
)
A2
12
-26
83
11
.51
.30
.10
.12
03
1.2
50
44
44
Part
ial
Slig
ht
(2 h
ours
),
Slig
ht
(20
hours
)
Slig
ht
(2 h
ours
),
Mod
erat
e (2
0
hours
)
B21
26
-60
68
<1
0.6
7.8
1.6
0.1
26
10
0.1
67
81
61
Part
ial
Stro
ng
(2 h
ours
),
Com
ple
te
(20
hours
)
Stro
ng
(2 h
ours
),
Com
ple
te
(20
hours
)
B22
UP
60
-80
59
<1
0.4
7.2
1.7
0.1
10
9.4
0.1
57
71
81
Part
ial
Mod
erat
e
(2 h
ours
),
Com
ple
te
(20
hours
)
Stro
ng
(2 h
ours
),
Com
ple
te
(20
hours
)
B22
80
-10
06
3<
10
.25
.61
.5<
0.1
14
7.4
0.1
37
62
12
Consi
der
able
Stro
ng
(2 h
ours
),
Com
ple
te
(20
hours
)
Stro
ng
(2 h
ours
),
Com
ple
te
(20
hours
)
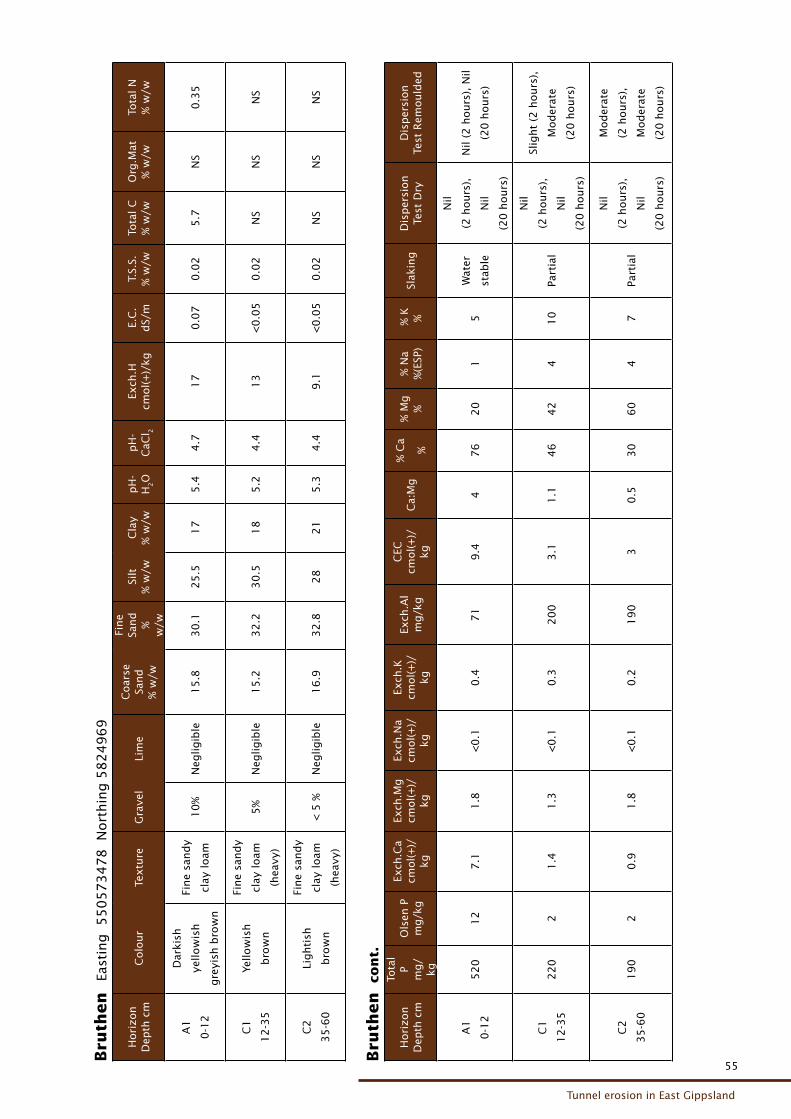
55
Tunnel erosion in East Gippsland
55
Bru
then
Ea
stin
g
55
05
73
47
8
Nort
hin
g 5
82
49
69
Hori
zon
Dep
th c
mC
olo
ur
Textu
reG
rave
lLi
me
Coar
seSa
nd
% w
/w
Fine
Sand
%
w/w
Silt
% w
/wC
lay
% w
/wp
H-
H2O
pH
- C
aCl 2
Exch
.Hcm
ol(+
)/kg
E.C
.d
S/m
T.S.
S.%
w/w
Tota
l C
% w
/wO
rg.M
at%
w/w
Tota
l N
% w
/w
A1
0-1
2
Dar
kish
yello
wis
h
gre
yish
bro
wn
Fine
sand
y
clay
loam
10
%N
eglig
ible
15
.83
0.1
25
.51
75
.44
.71
70
.07
0.0
25
.7N
S0
.35
C1
12
-35
Yello
wis
h
bro
wn
Fine
sand
y
clay
loam
(hea
vy)
5%
Neg
ligib
le1
5.2
32
.23
0.5
18
5.2
4.4
13
<0
.05
0.0
2N
SN
SN
S
C2
35
-60
Lighti
sh
bro
wn
Fine
sand
y
clay
loam
(hea
vy)
< 5
%N
eglig
ible
16
.93
2.8
28
21
5.3
4.4
9.1
<0
.05
0.0
2N
SN
SN
S
Bru
then
co
nt.
Hori
zon
Dep
th c
m
Tota
l P
mg/
kg
Ols
en P
m
g/k
g
Exch
.Ca
cmol(+
)/kg
Exch
.Mg
cmol(+
)/kg
Exch
.Na
cmol(+
)/kg
Exch
.K
cmol(+
)/kg
Exch
.Al
mg/k
g
CEC
cm
ol(+
)/kg
Ca:
Mg
% C
a
%
% M
g
%%
Na
%(E
SP)
% K
%
Slak
ing
Dis
per
sion
Test
Dry
Dis
per
sion
Test
Rem
ould
ed
A1
0-1
25
20
12
7.1
1.8
<0
.10
.47
19
.44
76
20
15
Wat
er
stab
le
Nil
(2 h
ours
),
Nil
(20
hours
)
Nil
(2 h
ours
), N
il
(20
hours
)
C1
12
-35
22
02
1.4
1.3
<0
.10
.32
00
3.1
1.1
46
42
41
0Pa
rtia
l
Nil
(2 h
ours
),
Nil
(20
hours
)
Slig
ht
(2 h
ours
),
Mod
erat
e
(20
hours
)
C2
35
-60
19
02
0.9
1.8
<0
.10
.21
90
30
.53
06
04
7Pa
rtia
l
Nil
(2 h
ours
),
Nil
(20
hours
)
Mod
erat
e
(2 h
ours
),
Mod
erat
e
(20
hours
)
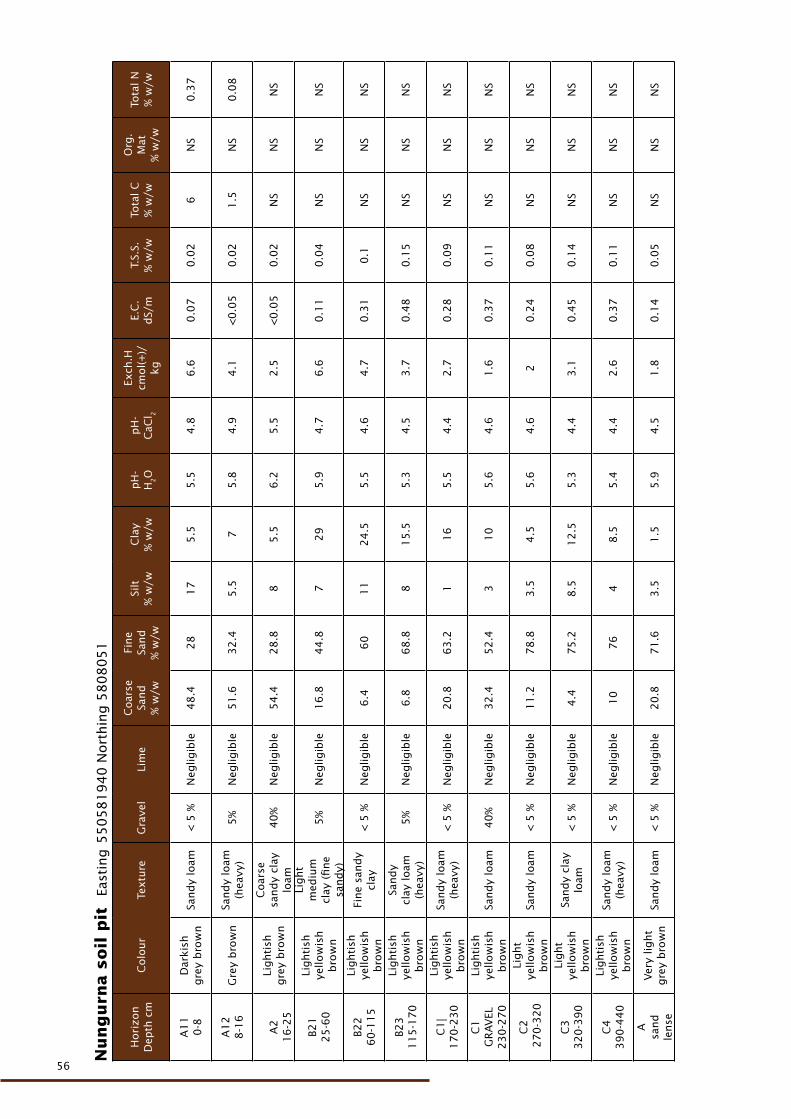
56
56
Nu
ng
urn
a s
oil
pit
Ea
stin
g 5
50
58
19
40
Nort
hin
g 5
80
80
51
Hori
zon
Dep
th c
mC
olo
ur
Textu
reG
rave
lLi
me
Coar
seSa
nd
% w
/w
Fine
Sand
% w
/w
Silt
% w
/wC
lay
% w
/wp
H-
H2O
pH
- C
aCl 2
Exch
.Hcm
ol(+
)/kg
E.C
.d
S/m
T.S.
S.%
w/w
Tota
l C
% w
/w
Org
.M
at%
w/w
Tota
l N
% w
/w
A1
10
-8D
arki
sh
gre
y b
row
nSa
nd
y lo
am<
5 %
Neg
ligib
le4
8.4
28
17
5.5
5.5
4.8
6.6
0.0
70
.02
6N
S0
.37
A1
28
-16
Gre
y b
row
nSa
nd
y lo
am
(hea
vy)
5%
Neg
ligib
le5
1.6
32
.45
.57
5.8
4.9
4.1
<0
.05
0.0
21
.5N
S0
.08
A2
1
6-2
5
Lighti
sh
gre
y b
row
n
Coar
se
sand
y cl
ay
loam
40
%N
eglig
ible
54
.42
8.8
85
.56
.25
.52
.5<
0.0
50
.02
NS
NS
NS
B21
2
5-6
0
Lighti
sh
yello
wis
h
bro
wn
Light
med
ium
cl
ay (
fine
sand
y)
5%
Neg
ligib
le1
6.8
44
.87
29
5.9
4.7
6.6
0.1
10
.04
NS
NS
NS
B22
6
0-1
15
Lighti
sh
yello
wis
h
bro
wn
Fine
sand
y cl
ay<
5 %
Neg
ligib
le6
.46
01
12
4.5
5.5
4.6
4.7
0.3
10
.1N
SN
SN
S
B23
1
15
-17
0
Lighti
sh
yello
wis
h
bro
wn
Sand
y cl
ay loam
(h
eavy
)5
%N
eglig
ible
6.8
68
.88
15
.55
.34
.53
.70
.48
0.1
5N
SN
SN
S
C1
| 1
70
-23
0
Lighti
sh
yello
wis
h
bro
wn
Sand
y lo
am
(hea
vy)
< 5
%N
eglig
ible
20
.86
3.2
11
65
.54
.42
.70
.28
0.0
9N
SN
SN
S
C1
G
RAV
EL
23
0-2
70
Lighti
sh
yello
wis
h
bro
wn
Sand
y lo
am4
0%
Neg
ligib
le3
2.4
52
.43
10
5.6
4.6
1.6
0.3
70
.11
NS
NS
NS
C2
2
70
-32
0
Light
yello
wis
h
bro
wn
Sand
y lo
am<
5 %
Neg
ligib
le1
1.2
78
.83
.54
.55
.64
.62
0.2
40
.08
NS
NS
NS
C3
3
20
-39
0
Light
yello
wis
h
bro
wn
Sand
y cl
ay
loam
< 5
%N
eglig
ible
4.4
75
.28
.51
2.5
5.3
4.4
3.1
0.4
50
.14
NS
NS
NS
C4
39
0-4
40
Lighti
sh
yello
wis
h
bro
wn
Sand
y lo
am
(hea
vy)
< 5
%N
eglig
ible
10
76
48
.55
.44
.42
.60
.37
0.1
1N
SN
SN
S
Asa
nd
lense
Ver
y lig
ht
gre
y b
row
nSa
nd
y lo
am<
5 %
Neg
ligib
le2
0.8
71
.63
.51
.55
.94
.51
.80
.14
0.0
5N
SN
SN
S
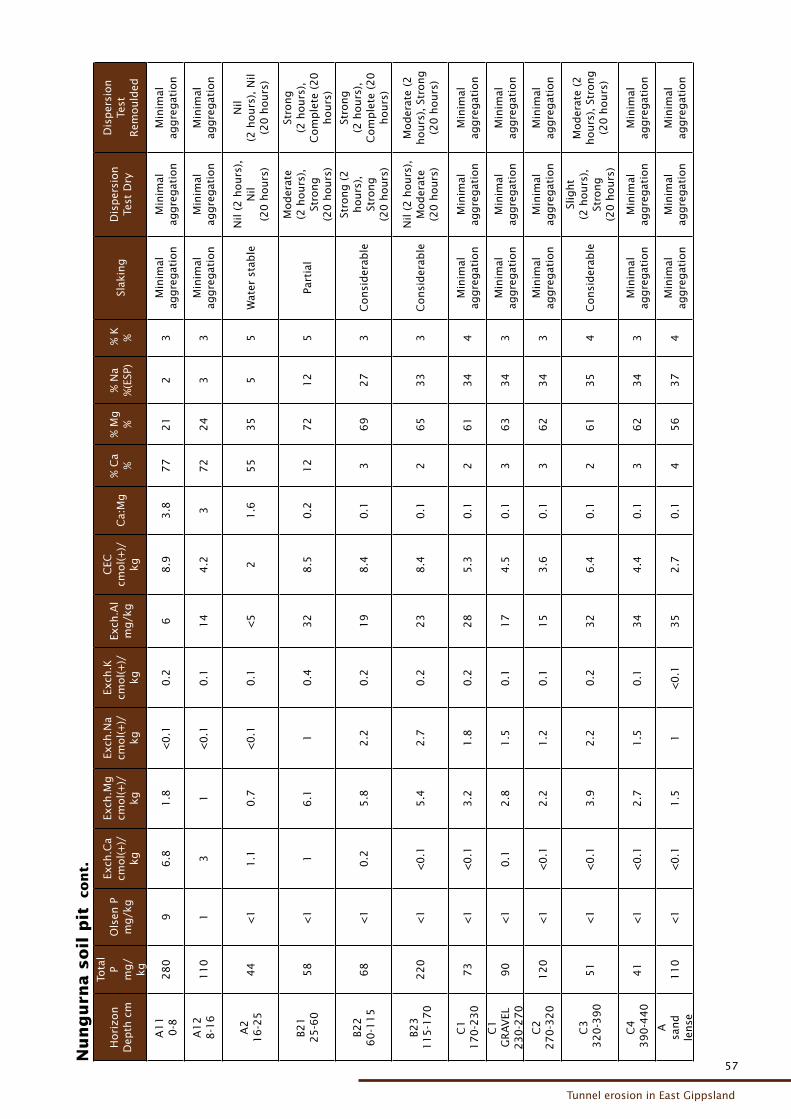
57
Tunnel erosion in East Gippsland
57
Nu
ng
urn
a s
oil
pit
co
nt.
Hori
zon
Dep
th c
m
Tota
l P
mg/
kg
Ols
en P
m
g/k
g
Exch
.Ca
cmol(+
)/kg
Exch
.Mg
cmol(+
)/kg
Exch
.Na
cmol(+
)/kg
Exch
.K
cmol(+
)/kg
Exch
.Al
mg/k
g
CEC
cm
ol(+
)/kg
Ca:
Mg
% C
a %
% M
g
%%
Na
%(E
SP)
% K
%
Slak
ing
Dis
per
sion
Test
Dry
Dis
per
sion
Test
R
emould
ed
A1
10
-82
80
96
.81
.8<
0.1
0.2
68
.93
.87
72
12
3M
inim
al
aggre
gat
ion
Min
imal
ag
gre
gat
ion
Min
imal
ag
gre
gat
ion
A1
28
-16
11
01
31
<0
.10
.11
44
.23
72
24
33
Min
imal
ag
gre
gat
ion
Min
imal
ag
gre
gat
ion
Min
imal
ag
gre
gat
ion
A2
1
6-2
54
4<
11
.10
.7<
0.1
0.1
<5
21
.65
53
55
5W
ater
sta
ble
Nil
(2 h
ours
),
Nil
(20
hours
)
Nil
(2 h
ours
), N
il (2
0 h
ours
)
B21
2
5-6
05
8<
11
6.1
10
.43
28
.50
.21
27
21
25
Part
ial
Mod
erat
e (2
hours
),
Stro
ng
(20
hours
)
Stro
ng
(2 h
ours
),
Com
ple
te (
20
hours
)
B22
6
0-1
15
68
<1
0.2
5.8
2.2
0.2
19
8.4
0.1
36
92
73
Consi
der
able
Stro
ng (
2
hours
),
Stro
ng
(20
hours
)
Stro
ng
(2 h
ours
),
Com
ple
te (
20
hours
)
B23
11
5-1
70
22
0<
1<
0.1
5.4
2.7
0.2
23
8.4
0.1
26
53
33
Consi
der
able
Nil
(2 h
ours
),
Mod
erat
e (2
0 h
ours
)
Mod
erat
e (2
hours
), S
trong
(20
hours
)
C1
17
0-2
30
73
<1
<0
.13
.21
.80
.22
85
.30
.12
61
34
4M
inim
al
aggre
gat
ion
Min
imal
ag
gre
gat
ion
Min
imal
ag
gre
gat
ion
C1
G
RAV
EL
23
0-2
70
90
<1
0.1
2.8
1.5
0.1
17
4.5
0.1
36
33
43
Min
imal
ag
gre
gat
ion
Min
imal
ag
gre
gat
ion
Min
imal
ag
gre
gat
ion
C2
27
0-3
20
12
0<
1<
0.1
2.2
1.2
0.1
15
3.6
0.1
36
23
43
Min
imal
ag
gre
gat
ion
Min
imal
ag
gre
gat
ion
Min
imal
ag
gre
gat
ion
C3
32
0-3
90
51
<1
<0
.13
.92
.20
.23
26
.40
.12
61
35
4C
onsi
der
able
Slig
ht
(2 h
ours
),
Stro
ng
(20
hours
)
Mod
erat
e (2
hours
), S
trong
(20
hours
)
C4
3
90
-44
04
1<
1<
0.1
2.7
1.5
0.1
34
4.4
0.1
36
23
43
Min
imal
ag
gre
gat
ion
Min
imal
ag
gre
gat
ion
Min
imal
ag
gre
gat
ion
Asa
nd
lense
11
0<
1<
0.1
1.5
1<
0.1
35
2.7
0.1
45
63
74
Min
imal
ag
gre
gat
ion
Min
imal
ag
gre
gat
ion
Min
imal
ag
gre
gat
ion
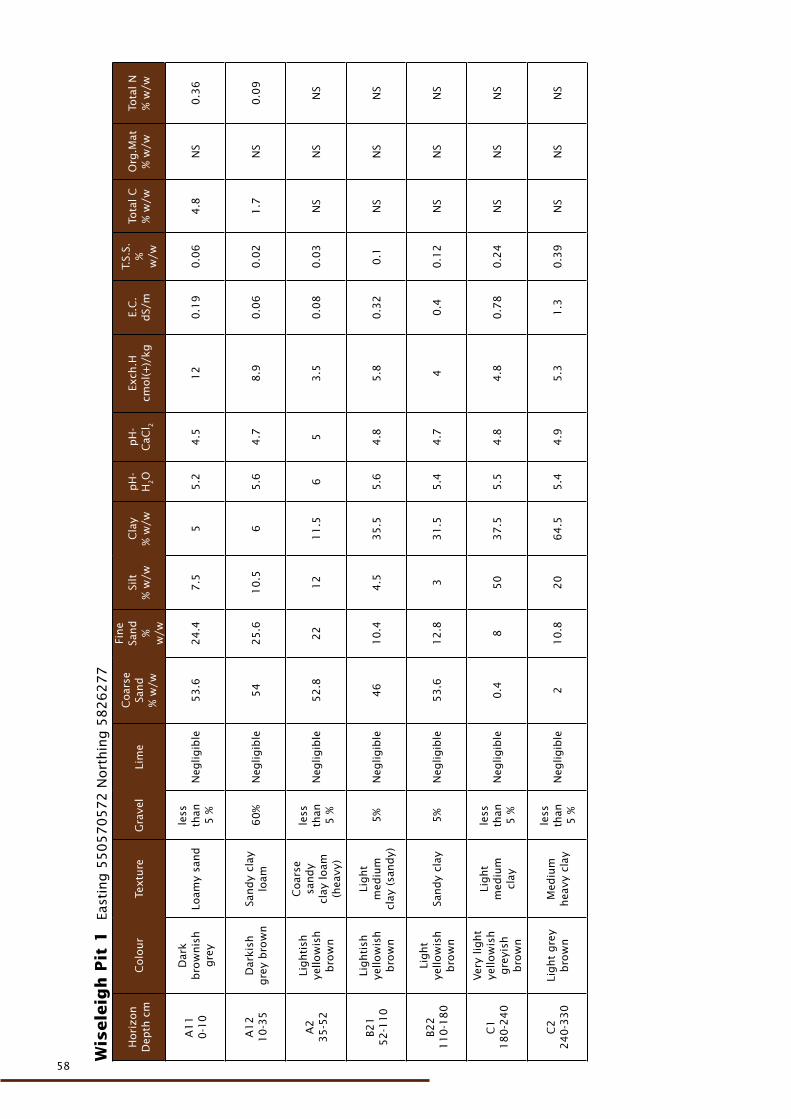
58
58
Wis
ele
igh
Pit
1
East
ing 5
50
57
05
72
Nort
hin
g 5
82
62
77
Hori
zon
Dep
th c
mC
olo
ur
Textu
reG
rave
lLi
me
Coar
seSa
nd
% w
/w
Fine
Sand
%
w/w
Silt
% w
/wC
lay
% w
/wp
H-
H2O
pH
- C
aCl 2
Exch
.Hcm
ol(+
)/kg
E.C
.d
S/m
T.S.
S.%
w
/w
Tota
l C
% w
/wO
rg.M
at%
w/w
Tota
l N
% w
/w
A1
1
0-1
0
Dar
k b
row
nis
h
gre
yLo
amy
sand
less
th
an
5 %
Neg
ligib
le5
3.6
24
.47
.55
5.2
4.5
12
0.1
90
.06
4.8
NS
0.3
6
A1
2
10
-35
Dar
kish
gre
y b
row
nSa
nd
y cl
ay
loam
60
%N
eglig
ible
54
25
.61
0.5
65
.64
.78
.90
.06
0.0
21
.7N
S0
.09
A2
3
5-5
2
Lighti
sh
yello
wis
h
bro
wn
Coar
se
sand
y cl
ay loam
(h
eavy
)
less
th
an
5 %
Neg
ligib
le5
2.8
22
12
11
.56
53
.50
.08
0.0
3N
SN
SN
S
B21
5
2-1
10
Lighti
sh
yello
wis
h
bro
wn
Light
med
ium
cl
ay (
sand
y)5
%N
eglig
ible
46
10
.44
.53
5.5
5.6
4.8
5.8
0.3
20
.1N
SN
SN
S
B22
1
10
-18
0
Light
yello
wis
h
bro
wn
Sand
y cl
ay5
%N
eglig
ible
53
.61
2.8
33
1.5
5.4
4.7
40
.40
.12
NS
NS
NS
C1
1
80
-24
0
Ver
y lig
ht
yello
wis
h
gre
yish
b
row
n
Light
med
ium
cl
ay
less
th
an
5 %
Neg
ligib
le0
.48
50
37
.55
.54
.84
.80
.78
0.2
4N
SN
SN
S
C2
2
40
-33
0Li
ght
gre
y b
row
nM
ediu
m
hea
vy c
lay
less
th
an
5 %
Neg
ligib
le2
10
.82
06
4.5
5.4
4.9
5.3
1.3
0.3
9N
SN
SN
S
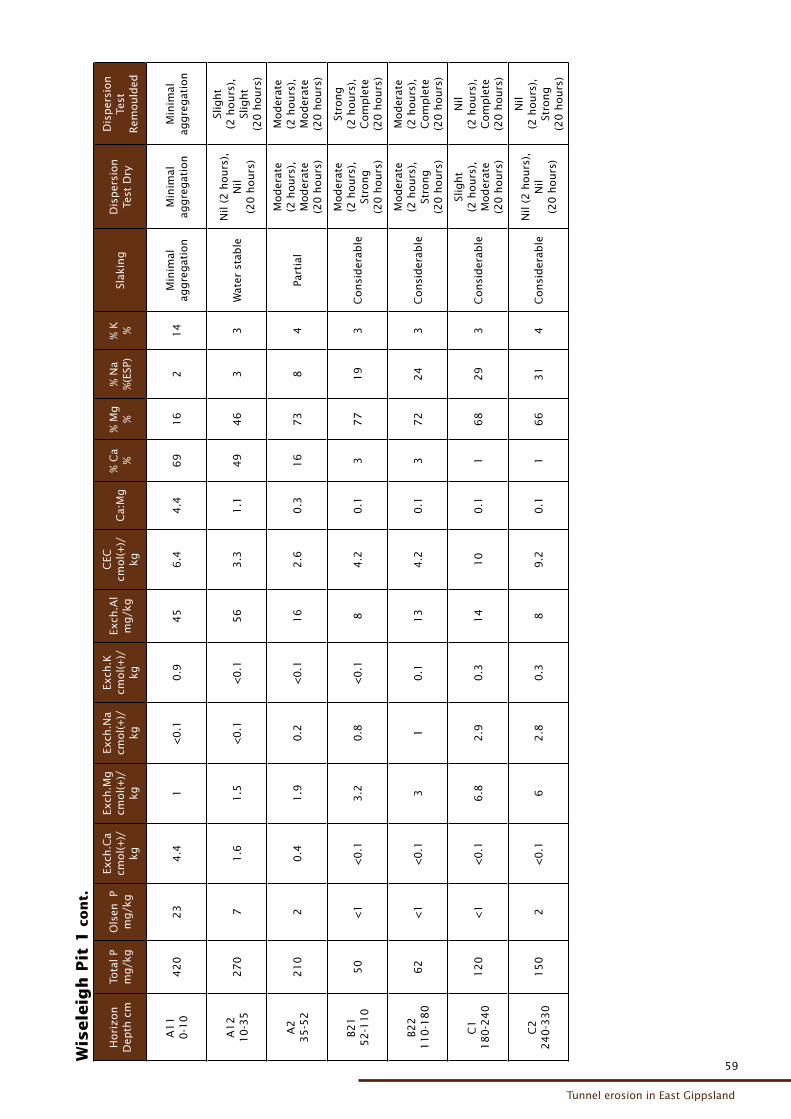
59
Tunnel erosion in East Gippsland
59
Wis
ele
igh
Pit
1 c
on
t.
Hori
zon
Dep
th c
mTo
tal P
mg/k
gO
lsen
P
mg/k
g
Exch
.Ca
cmol(+
)/kg
Exch
.Mg
cmol(+
)/kg
Exch
.Na
cmol(+
)/kg
Exch
.K
cmol(+
)/kg
Exch
.Al
mg/k
g
CEC
cm
ol(+
)/kg
Ca:
Mg
% C
a %
% M
g
%%
Na
%(E
SP)
% K
%
Slak
ing
Dis
per
sion
Test
Dry
Dis
per
sion
Test
R
emould
ed
A1
1
0-1
04
20
23
4.4
1<
0.1
0.9
45
6.4
4.4
69
16
21
4M
inim
al
aggre
gat
ion
Min
imal
ag
gre
gat
ion
Min
imal
ag
gre
gat
ion
A1
2
10
-35
27
07
1.6
1.5
<0
.1<
0.1
56
3.3
1.1
49
46
33
Wat
er s
tab
leN
il (2
hours
),
Nil
(20
hours
)
Slig
ht
(2 h
ours
),
Slig
ht
(20
hours
)
A2
3
5-5
22
10
20
.41
.90
.2<
0.1
16
2.6
0.3
16
73
84
Part
ial
Mod
erat
e (2
hours
),
Mod
erat
e (2
0 h
ours
)
Mod
erat
e (2
hours
),
Mod
erat
e (2
0 h
ours
)
B21
5
2-1
10
50
<1
<0
.13
.20
.8<
0.1
84
.20
.13
77
19
3C
onsi
der
able
Mod
erat
e (2
hours
),
Stro
ng
(20
hours
)
Stro
ng
(2 h
ours
),
Com
ple
te
(20
hours
)
B22
1
10
-18
06
2<
1<
0.1
31
0.1
13
4.2
0.1
37
22
43
Consi
der
able
Mod
erat
e (2
hours
),
Stro
ng
(20
hours
)
Mod
erat
e (2
hours
),
Com
ple
te
(20
hours
)
C1
1
80
-24
01
20
<1
<0
.16
.82
.90
.31
41
00
.11
68
29
3C
onsi
der
able
Slig
ht
(2 h
ours
),
Mod
erat
e (2
0 h
ours
)
Nil
(2 h
ours
),
Com
ple
te
(20
hours
)
C2
2
40
-33
01
50
2<
0.1
62
.80
.38
9.2
0.1
16
63
14
Consi
der
able
Nil
(2 h
ours
),
Nil
(20
hours
)
Nil
(2 h
ours
),
Stro
ng
(20
hours
)
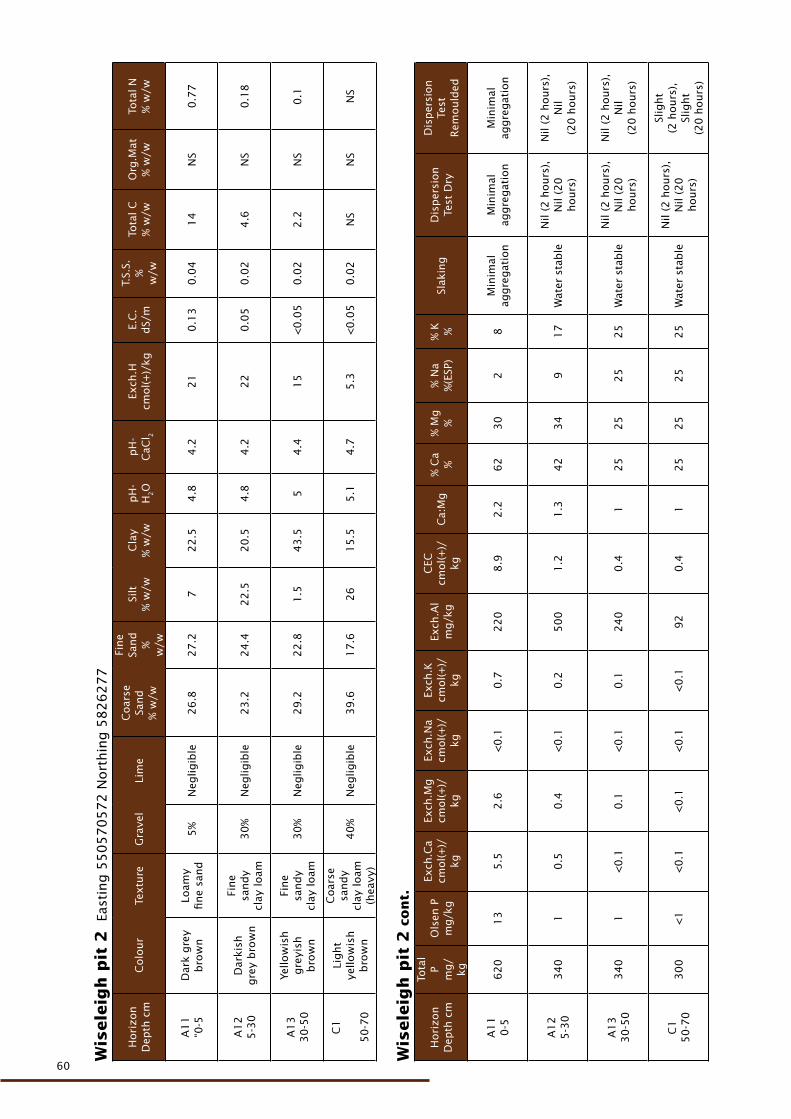
60
60
Wis
ele
igh
pit
2
East
ing 5
50
57
05
72
Nort
hin
g 5
82
62
77
Hori
zon
Dep
th c
mC
olo
ur
Textu
reG
rave
lLi
me
Coar
seSa
nd
% w
/w
Fine
Sand
%
w/w
Silt
% w
/wC
lay
% w
/wp
H-
H2O
pH
- C
aCl 2
Exch
.Hcm
ol(+
)/kg
E.C
.d
S/m
T.S.
S.%
w
/w
Tota
l C
% w
/wO
rg.M
at%
w/w
Tota
l N
% w
/w
A1
1
“0-5
Dar
k gre
y b
row
nLo
amy
fine
sand
5%
Neg
ligib
le2
6.8
27
.27
22
.54
.84
.22
10
.13
0.0
41
4N
S0
.77
A1
2
5-3
0D
arki
sh
gre
y b
row
n
Fine
sand
y cl
ay loam
30
%N
eglig
ible
23
.22
4.4
22
.52
0.5
4.8
4.2
22
0.0
50
.02
4.6
NS
0.1
8
A1
3
30
-50
Yello
wis
h
gre
yish
b
row
n
Fine
sand
y cl
ay loam
30
%N
eglig
ible
29
.22
2.8
1.5
43
.55
4.4
15
<0
.05
0.0
22
.2N
S0
.1
C1
50
-70
Light
yello
wis
h
bro
wn
Coar
se
sand
y cl
ay loam
(h
eavy
)
40
%N
eglig
ible
39
.61
7.6
26
15
.55
.14
.75
.3<
0.0
50
.02
NS
NS
NS
Wis
ele
igh
pit
2 c
on
t.
Hori
zon
Dep
th c
m
Tota
l P
mg/
kg
Ols
en P
m
g/k
g
Exch
.Ca
cmol(+
)/kg
Exch
.Mg
cmol(+
)/kg
Exch
.Na
cmol(+
)/kg
Exch
.K
cmol(+
)/kg
Exch
.Al
mg/k
g
CEC
cm
ol(+
)/kg
Ca:
Mg
% C
a %
% M
g
%%
Na
%(E
SP)
% K
%
Slak
ing
Dis
per
sion
Test
Dry
Dis
per
sion
Test
R
emould
ed
A1
1
0-5
62
01
35
.52
.6<
0.1
0.7
22
08
.92
.26
23
02
8M
inim
al
aggre
gat
ion
Min
imal
ag
gre
gat
ion
Min
imal
ag
gre
gat
ion
A1
2
5-3
03
40
10
.50
.4<
0.1
0.2
50
01
.21
.34
23
49
17
Wat
er s
tab
leN
il (2
hours
),
Nil
(20
hours
)
Nil
(2 h
ours
),
Nil
(20
hours
)
A1
3
30
-50
34
01
<0
.10
.1<
0.1
0.1
24
00
.41
25
25
25
25
Wat
er s
tab
leN
il (2
hours
),
Nil
(20
hours
)
Nil
(2 h
ours
),
Nil
(20
hours
)
C1
5
0-7
03
00
<1
<0
.1<
0.1
<0
.1<
0.1
92
0.4
12
52
52
52
5W
ater
sta
ble
Nil
(2 h
ours
),
Nil
(20
hours
)
Slig
ht
(2 h
ours
),
Slig
ht
(20
hours
)
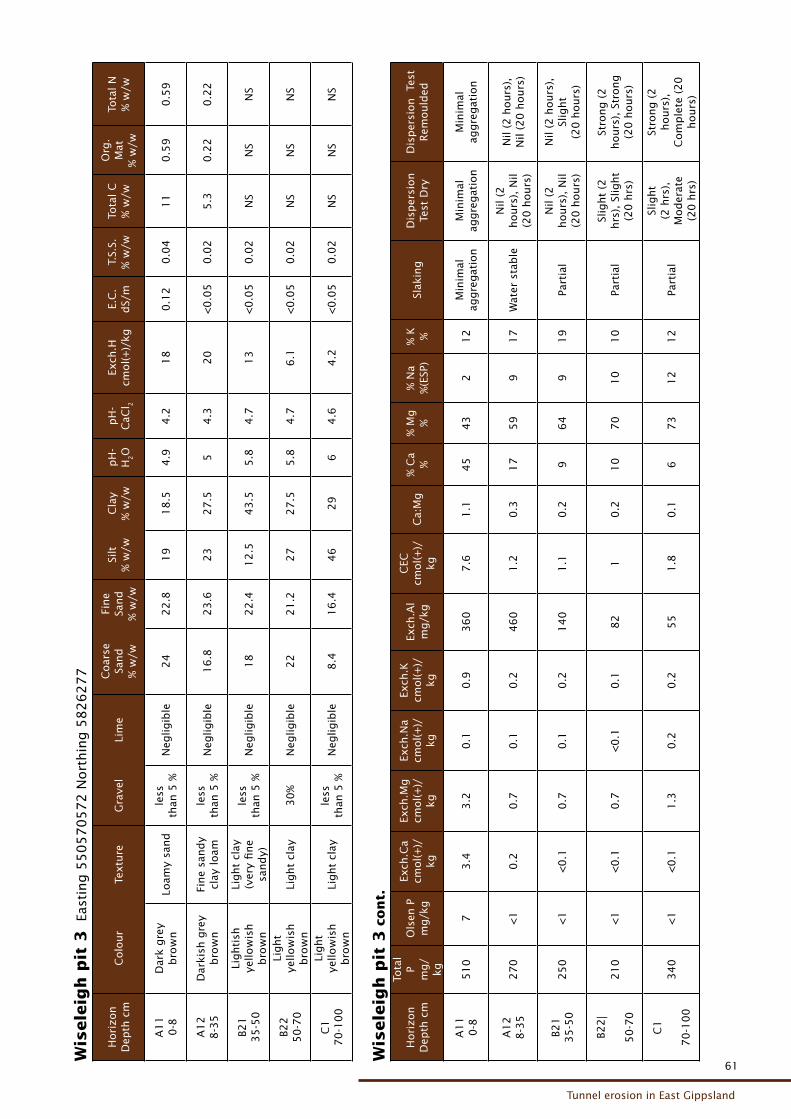
61
Tunnel erosion in East Gippsland
61
Wis
ele
igh
pit
3
East
ing 5
50
57
05
72
Nort
hin
g 5
82
62
77
Hori
zon
Dep
th c
mC
olo
ur
Textu
reG
rave
lLi
me
Coar
seSa
nd
% w
/w
Fine
Sand
% w
/w
Silt
% w
/wC
lay
% w
/wp
H-
H2O
pH
- C
aCl 2
Exch
.Hcm
ol(+
)/kg
E.C
.d
S/m
T.S.
S.%
w/w
Tota
l C
% w
/w
Org
.M
at%
w/w
Tota
l N
% w
/w
A1
1
0-8
Dar
k gre
y b
row
nLo
amy
sand
less
th
an 5
%N
eglig
ible
24
22
.81
91
8.5
4.9
4.2
18
0.1
20
.04
11
0.5
90
.59
A1
2
8-3
5D
arki
sh g
rey
bro
wn
Fine
sand
y cl
ay loam
less
th
an 5
%N
eglig
ible
16
.82
3.6
23
27
.55
4.3
20
<0
.05
0.0
25
.30
.22
0.2
2
B21
35
-50
Lighti
sh
yello
wis
h
bro
wn
Light
clay
(v
ery
fine
sand
y)
less
th
an 5
%N
eglig
ible
18
22
.41
2.5
43
.55
.84
.71
3<
0.0
50
.02
NS
NS
NS
B22
5
0-7
0
Light
yello
wis
h
bro
wn
Light
clay
30
%N
eglig
ible
22
21
.22
72
7.5
5.8
4.7
6.1
<0
.05
0.0
2N
SN
SN
S
C1
7
0-1
00
Light
yello
wis
h
bro
wn
Light
clay
less
th
an 5
%N
eglig
ible
8.4
16
.44
62
96
4.6
4.2
<0
.05
0.0
2N
SN
SN
S
Wis
ele
igh
pit
3 c
on
t.
Hori
zon
Dep
th c
m
Tota
l P
mg/
kg
Ols
en P
m
g/k
g
Exch
.Ca
cmol(+
)/kg
Exch
.Mg
cmol(+
)/kg
Exch
.Na
cmol(+
)/kg
Exch
.K
cmol(+
)/kg
Exch
.Al
mg/k
g
CEC
cm
ol(+
)/kg
Ca:
Mg
% C
a %
% M
g
%%
Na
%(E
SP)
% K
%
Slak
ing
Dis
per
sion
Test
Dry
Dis
per
sion
Test
R
emould
ed
A1
1
0-8
51
07
3.4
3.2
0.1
0.9
36
07
.61
.14
54
32
12
Min
imal
ag
gre
gat
ion
Min
imal
ag
gre
gat
ion
Min
imal
ag
gre
gat
ion
A1
2
8-3
52
70
<1
0.2
0.7
0.1
0.2
46
01
.20
.31
75
99
17
Wat
er s
tab
leN
il (2
hours
), N
il (2
0 h
ours
)
Nil
(2 h
ours
),
Nil
(20
hours
)
B21
35
-50
25
0<
1<
0.1
0.7
0.1
0.2
14
01
.10
.29
64
91
9Pa
rtia
lN
il (2
hours
), N
il (2
0 h
ours
)
Nil
(2 h
ours
),
Slig
ht
(20
hours
)
B22
|
50
-70
21
0<
1<
0.1
0.7
<0
.10
.18
21
0.2
10
70
10
10
Part
ial
Slig
ht
(2
hrs
), S
light
(20
hrs
)
Stro
ng (
2
hours
), S
trong
(20
hours
)
C1
70
-10
03
40
<1
<0
.11
.30
.20
.25
51
.80
.16
73
12
12
Part
ial
Slig
ht
(2 h
rs),
M
od
erat
e (2
0 h
rs)
Stro
ng (
2
hours
),
Com
ple
te (
20
hours
)
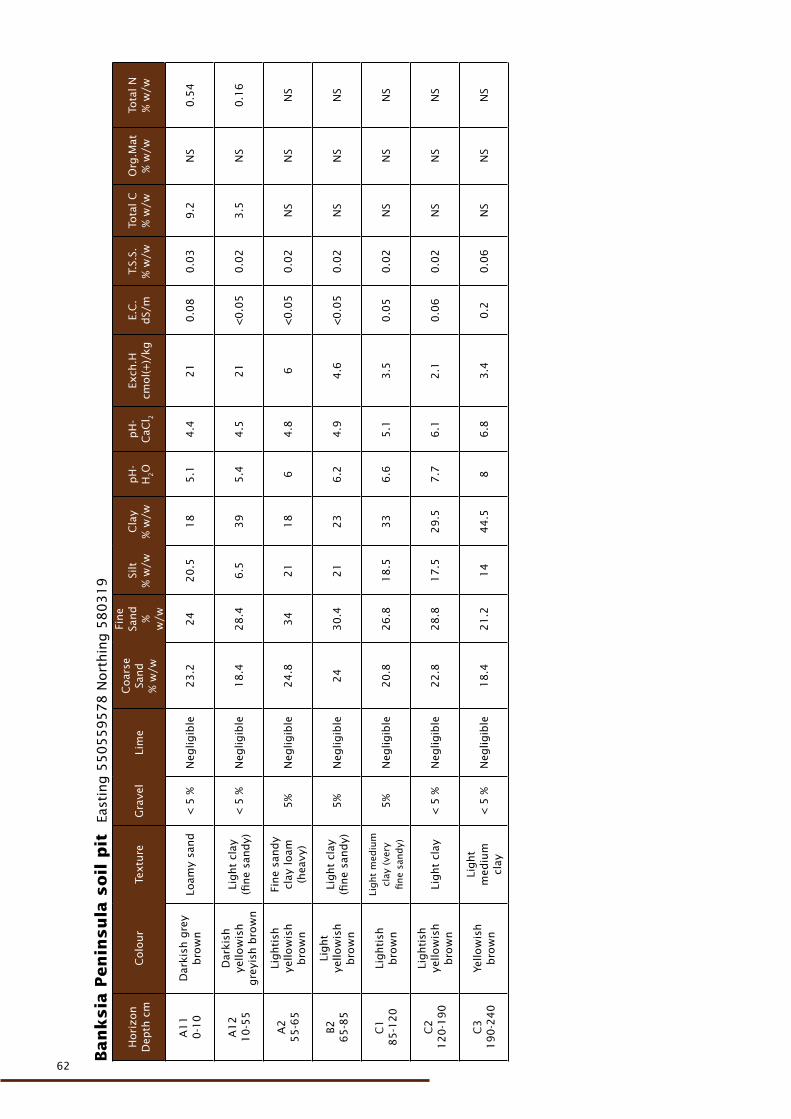
62
62
Ban
ksia
Pen
insu
la s
oil
pit
Ea
stin
g 5
50
55
95
78
Nort
hin
g 5
80
31
9
Hori
zon
Dep
th c
mC
olo
ur
Textu
reG
rave
lLi
me
Coar
seSa
nd
% w
/w
Fine
Sand
%
w/w
Silt
% w
/wC
lay
% w
/wp
H-
H2O
pH
- C
aCl 2
Exch
.Hcm
ol(+
)/kg
E.C
.d
S/m
T.S.
S.%
w/w
Tota
l C
% w
/wO
rg.M
at%
w/w
Tota
l N
% w
/w
A1
1
0-1
0D
arki
sh g
rey
bro
wn
Loam
y sa
nd
< 5
%N
eglig
ible
23
.22
42
0.5
18
5.1
4.4
21
0.0
80
.03
9.2
NS
0.5
4
A1
2
10
-55
Dar
kish
ye
llow
ish
gre
yish
bro
wn
Light
clay
(fi
ne
sand
y)<
5 %
Neg
ligib
le1
8.4
28
.46
.53
95
.44
.52
1<
0.0
50
.02
3.5
NS
0.1
6
A2
5
5-6
5
Lighti
sh
yello
wis
h
bro
wn
Fine
sand
y cl
ay loam
(h
eavy
)5
%N
eglig
ible
24
.83
42
11
86
4.8
6<
0.0
50
.02
NS
NS
NS
B2
65
-85
Light
yello
wis
h
bro
wn
Light
clay
(fi
ne
sand
y)5
%N
eglig
ible
24
30
.42
12
36
.24
.94
.6<
0.0
50
.02
NS
NS
NS
C1
8
5-1
20
Lighti
sh
bro
wn
Light
med
ium
cl
ay (
very
fi
ne
sand
y)5
%N
eglig
ible
20
.82
6.8
18
.53
36
.65
.13
.50
.05
0.0
2N
SN
SN
S
C2
1
20
-19
0
Lighti
sh
yello
wis
h
bro
wn
Light
clay
< 5
%N
eglig
ible
22
.82
8.8
17
.52
9.5
7.7
6.1
2.1
0.0
60
.02
NS
NS
NS
C3
1
90
-24
0Ye
llow
ish
bro
wn
Light
med
ium
cl
ay<
5 %
Neg
ligib
le1
8.4
21
.21
44
4.5
86
.83
.40
.20
.06
NS
NS
NS
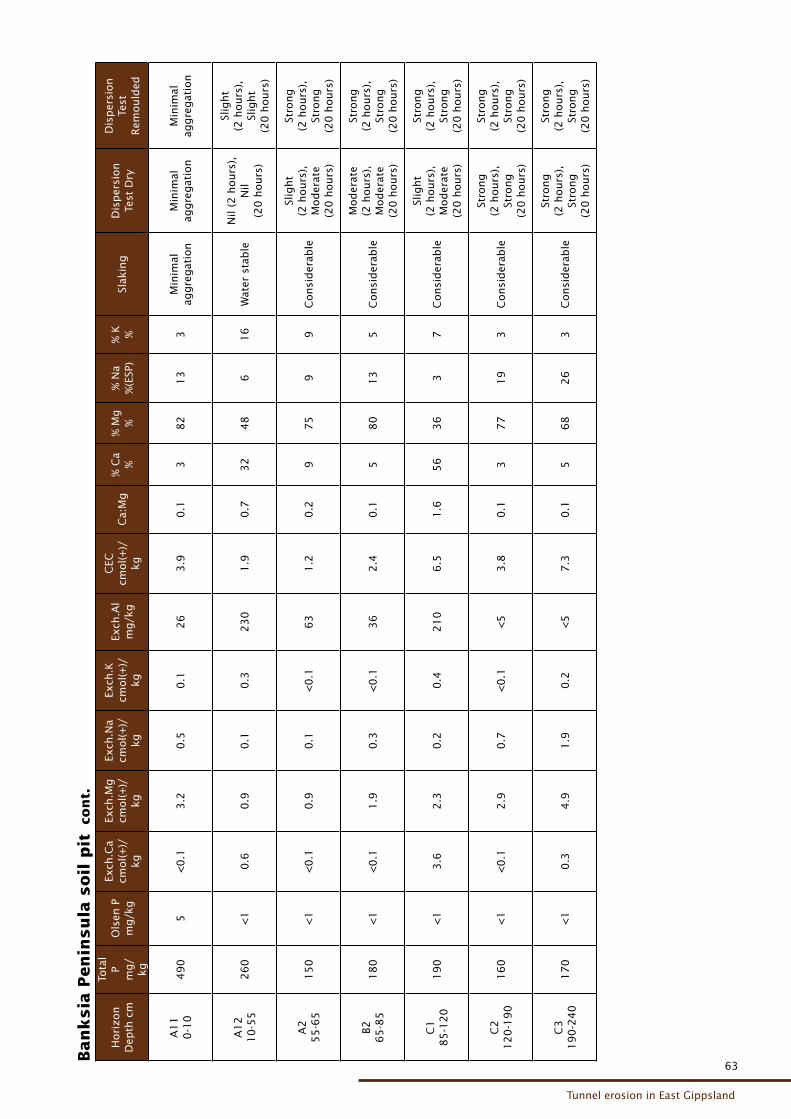
63
Tunnel erosion in East Gippsland
63
Ban
ksia
Pen
insu
la s
oil
pit
co
nt.
Hori
zon
Dep
th c
m
Tota
l P
mg/
kg
Ols
en P
m
g/k
g
Exch
.Ca
cmol(+
)/kg
Exch
.Mg
cmol(+
)/kg
Exch
.Na
cmol(+
)/kg
Exch
.K
cmol(+
)/kg
Exch
.Al
mg/k
g
CEC
cm
ol(+
)/kg
Ca:
Mg
% C
a %
% M
g
%%
Na
%(E
SP)
% K
%
Slak
ing
Dis
per
sion
Test
Dry
Dis
per
sion
Test
R
emould
ed
A1
1
0-1
04
90
5<
0.1
3.2
0.5
0.1
26
3.9
0.1
38
21
33
Min
imal
ag
gre
gat
ion
Min
imal
ag
gre
gat
ion
Min
imal
ag
gre
gat
ion
A1
2
10
-55
26
0<
10
.60
.90
.10
.32
30
1.9
0.7
32
48
61
6W
ater
sta
ble
Nil
(2 h
ours
),
Nil
(20
hours
)
Slig
ht
(2 h
ours
),
Slig
ht
(20
hours
)
A2
5
5-6
51
50
<1
<0
.10
.90
.1<
0.1
63
1.2
0.2
97
59
9C
onsi
der
able
Slig
ht
(2 h
ours
),
Mod
erat
e (2
0 h
ours
)
Stro
ng
(2 h
ours
),
Stro
ng
(20
hours
)
B2
65
-85
18
0<
1<
0.1
1.9
0.3
<0
.13
62
.40
.15
80
13
5C
onsi
der
able
Mod
erat
e (2
hours
),
Mod
erat
e (2
0 h
ours
)
Stro
ng
(2 h
ours
),
Stro
ng
(20
hours
)
C1
8
5-1
20
19
0<
13
.62
.30
.20
.42
10
6.5
1.6
56
36
37
Consi
der
able
Slig
ht
(2 h
ours
),
Mod
erat
e (2
0 h
ours
)
Stro
ng
(2 h
ours
),
Stro
ng
(20
hours
)
C2
1
20
-19
01
60
<1
<0
.12
.90
.7<
0.1
<5
3.8
0.1
37
71
93
Consi
der
able
Stro
ng
(2 h
ours
),
Stro
ng
(20
hours
)
Stro
ng
(2 h
ours
),
Stro
ng
(20
hours
)
C3
1
90
-24
01
70
<1
0.3
4.9
1.9
0.2
<5
7.3
0.1
56
82
63
Consi
der
able
Stro
ng
(2 h
ours
),
Stro
ng
(20
hours
)
Stro
ng
(2 h
ours
),
Stro
ng
(20
hours
)
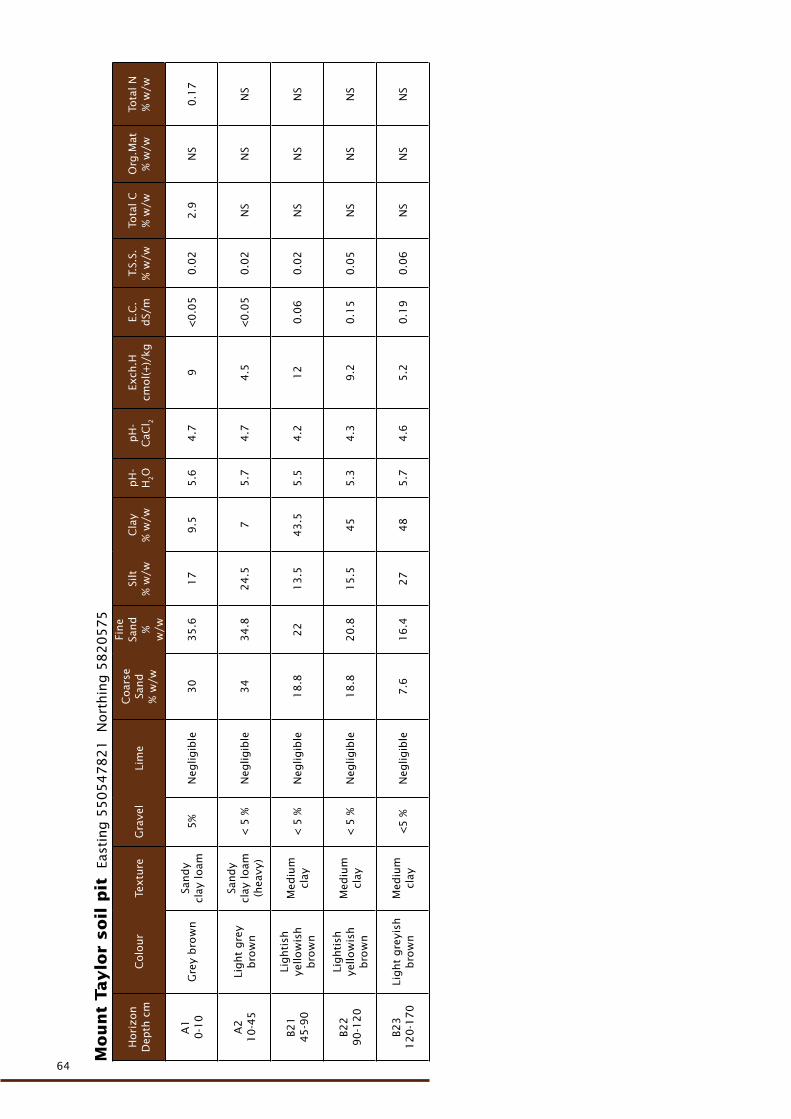
64
64
Mou
nt
Taylo
r soil
pit
Ea
stin
g 5
50
54
78
21
N
ort
hin
g 5
82
05
75
Hori
zon
Dep
th c
mC
olo
ur
Textu
reG
rave
lLi
me
Coar
seSa
nd
% w
/w
Fine
Sand
%
w/w
Silt
% w
/wC
lay
% w
/wp
H-
H2O
pH
- C
aCl 2
Exch
.Hcm
ol(+
)/kg
E.C
.d
S/m
T.S.
S.%
w/w
Tota
l C
% w
/wO
rg.M
at%
w/w
Tota
l N
% w
/w
A1
0
-10
Gre
y b
row
nSa
nd
y cl
ay loam
5%
Neg
ligib
le3
03
5.6
17
9.5
5.6
4.7
9<
0.0
50
.02
2.9
NS
0.1
7
A2
1
0-4
5Li
ght
gre
y b
row
n
Sand
y cl
ay loam
(h
eavy
)<
5 %
Neg
ligib
le3
43
4.8
24
.57
5.7
4.7
4.5
<0
.05
0.0
2N
SN
SN
S
B21
4
5-9
0
Lighti
sh
yello
wis
h
bro
wn
Med
ium
cl
ay<
5 %
Neg
ligib
le1
8.8
22
13
.54
3.5
5.5
4.2
12
0.0
60
.02
NS
NS
NS
B22
9
0-1
20
Lighti
sh
yello
wis
h
bro
wn
Med
ium
cl
ay<
5 %
Neg
ligib
le1
8.8
20
.81
5.5
45
5.3
4.3
9.2
0.1
50
.05
NS
NS
NS
B23
1
20
-17
0Li
ght
gre
yish
b
row
nM
ediu
m
clay
<5
%N
eglig
ible
7.6
16
.42
74
85
.74
.65
.20
.19
0.0
6N
SN
SN
S
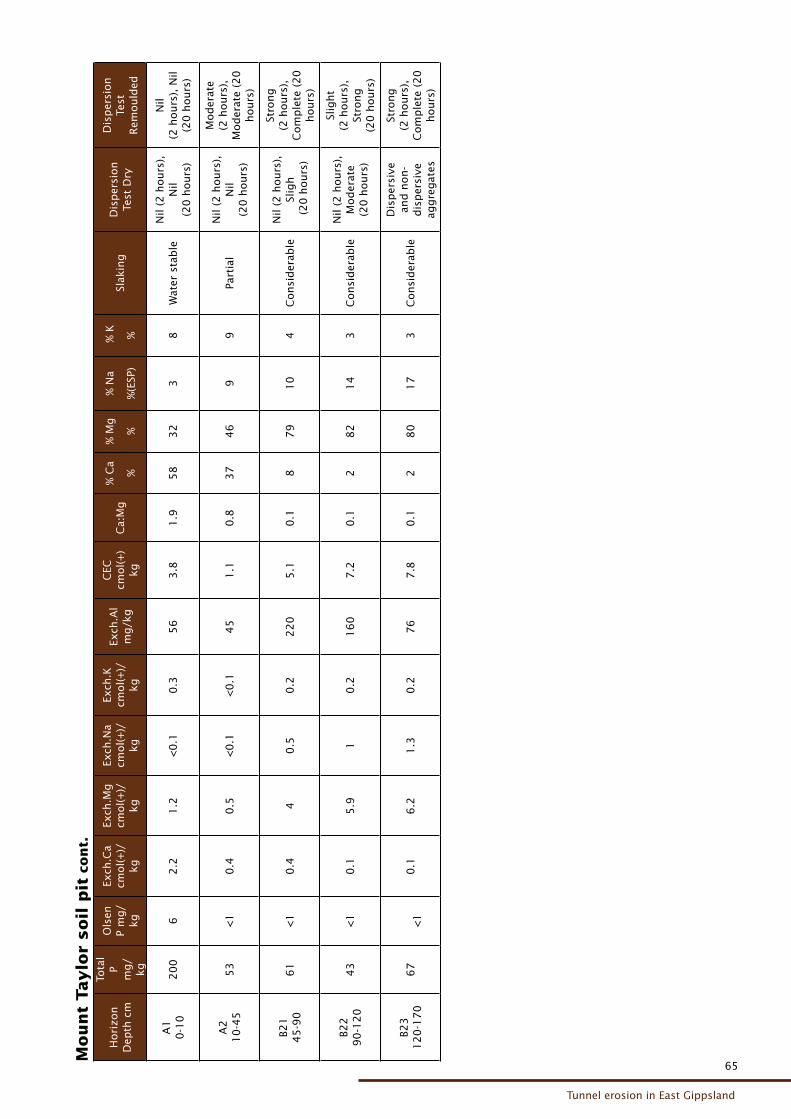
65
Tunnel erosion in East Gippsland
65
Mou
nt
Taylo
r soil
pit
con
t.
Hori
zon
Dep
th c
m
Tota
l P
mg/
kg
Ols
en
P m
g/
kg
Exch
.Ca
cmol(+
)/kg
Exch
.Mg
cmol(+
)/kg
Exch
.Na
cmol(+
)/kg
Exch
.K
cmol(+
)/kg
Exch
.Al
mg/k
g
CEC
cm
ol(+
) kg
Ca:
Mg
% C
a
%
% M
g
%
% N
a
%(E
SP)
% K %
Slak
ing
Dis
per
sion
Test
Dry
Dis
per
sion
Test
R
emould
ed
A1
0
-10
20
06
2.2
1.2
<0
.10
.35
63
.81
.95
83
23
8W
ater
sta
ble
Nil
(2 h
ours
),
Nil
(20
hours
)
Nil
(2 h
ours
), N
il (2
0 h
ours
)
A2
1
0-4
55
3<
10
.40
.5<
0.1
<0
.14
51
.10
.83
74
69
9Pa
rtia
lN
il (2
hours
),
Nil
(20
hours
)
Mod
erat
e (2
hours
),
Mod
erat
e (2
0
hours
)
B21
4
5-9
06
1<
10
.44
0.5
0.2
22
05
.10
.18
79
10
4C
onsi
der
able
Nil
(2 h
ours
),
Slig
h
(2
0 h
ours
)
Stro
ng
(2 h
ours
),
Com
ple
te (
20
hours
)
B22
9
0-1
20
43
<1
0.1
5.9
10
.21
60
7.2
0.1
28
21
43
Consi
der
able
Nil
(2 h
ours
),
Mod
erat
e (2
0 h
ours
)
Slig
ht
(2 h
ours
),
Stro
ng
(20
hours
)
B23
1
20
-17
06
7
<
10
.16
.21
.30
.27
67
.80
.12
80
17
3C
onsi
der
able
Dis
per
sive
an
d n
on-
dis
per
sive
ag
gre
gat
es
Stro
ng
(2 h
ours
),
Com
ple
te (
20
hours
)
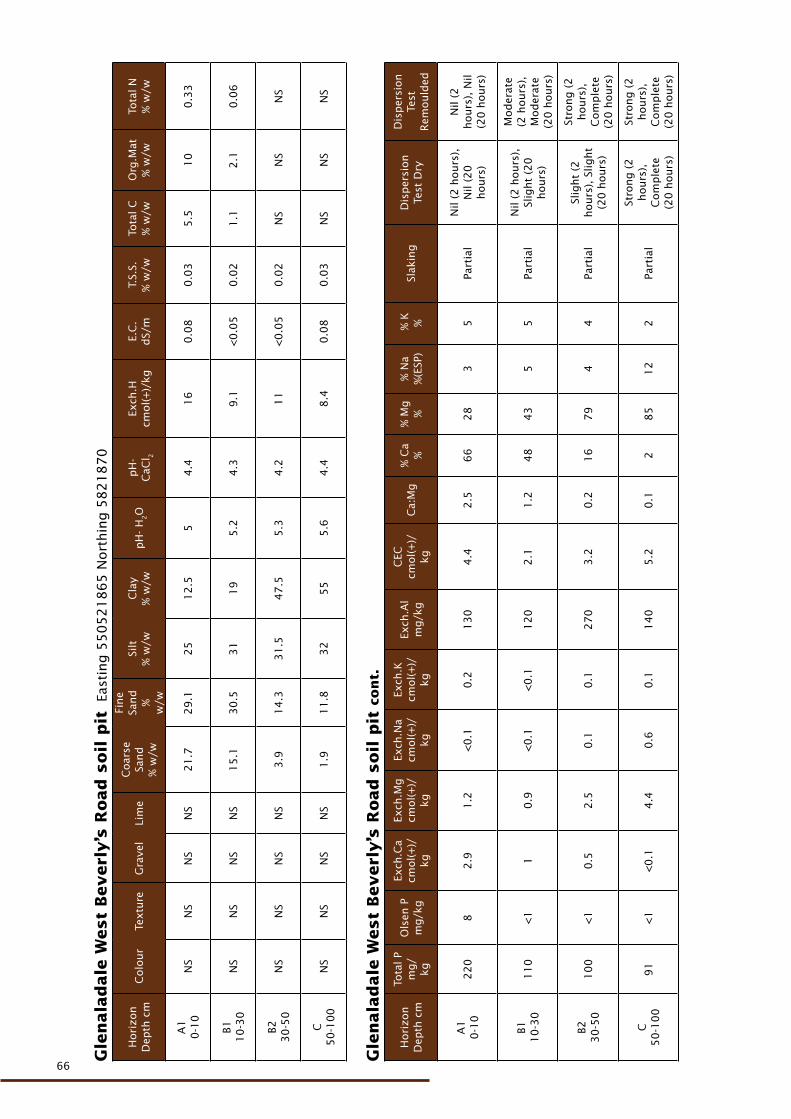
66
66
Gle
nala
dale
West
Beverl
y’s
Road
soil
pit
Ea
stin
g 5
50
52
18
65
Nort
hin
g 5
82
18
70
Hori
zon
Dep
th c
mC
olo
ur
Textu
reG
rave
lLi
me
Coar
seSa
nd
% w
/w
Fine
Sand
%
w/w
Silt
% w
/wC
lay
% w
/wp
H-
H2O
pH
- C
aCl 2
Exch
.Hcm
ol(+
)/kg
E.C
.d
S/m
T.S.
S.%
w/w
Tota
l C
% w
/wO
rg.M
at%
w/w
Tota
l N
% w
/w
A1
0
-10
NS
NS
NS
NS
21
.72
9.1
25
12
.55
4.4
16
0.0
80
.03
5.5
10
0.3
3
B1
10
-30
NS
NS
NS
NS
15
.13
0.5
31
19
5.2
4.3
9.1
<0
.05
0.0
21
.12
.10
.06
B2
30
-50
NS
NS
NS
NS
3.9
14
.33
1.5
47
.55
.34
.21
1<
0.0
50
.02
NS
NS
NS
C
50
-10
0N
SN
SN
SN
S1
.91
1.8
32
55
5.6
4.4
8.4
0.0
80
.03
NS
NS
NS
Gle
nala
dale
West
Beverl
y’s
Road
soil
pit
con
t.
Hori
zon
Dep
th c
m
Tota
l P
mg/
kg
Ols
en P
m
g/k
g
Exch
.Ca
cmol(+
)/kg
Exch
.Mg
cmol(+
)/kg
Exch
.Na
cmol(+
)/kg
Exch
.K
cmol(+
)/kg
Exch
.Al
mg/k
g
CEC
cm
ol(+
)/kg
Ca:
Mg
% C
a %
% M
g
%%
Na
%(E
SP)
% K
%
Slak
ing
Dis
per
sion
Test
Dry
Dis
per
sion
Test
R
emould
ed
A1
0
-10
22
08
2.9
1.2
<0
.10
.21
30
4.4
2.5
66
28
35
Part
ial
Nil
(2 h
ours
),
Nil
(20
hours
)
Nil
(2
hours
), N
il (2
0 h
ours
)
B1
10
-30
11
0<
11
0.9
<0
.1<
0.1
12
02
.11
.24
84
35
5Pa
rtia
lN
il (2
hours
),
Slig
ht
(20
hours
)
Mod
erat
e (2
hours
),
Mod
erat
e (2
0 h
ours
)
B2
30
-50
10
0<
10
.52
.50
.10
.12
70
3.2
0.2
16
79
44
Part
ial
Slig
ht
(2
hours
), S
light
(20
hours
)
Stro
ng (
2
hours
),
Com
ple
te
(20
hours
)
C
50
-10
09
1<
1<
0.1
4.4
0.6
0.1
14
05
.20
.12
85
12
2Pa
rtia
l
Stro
ng (
2
hours
),
Com
ple
te
(20
hours
)
Stro
ng (
2
hours
),
Com
ple
te
(20
hours
)
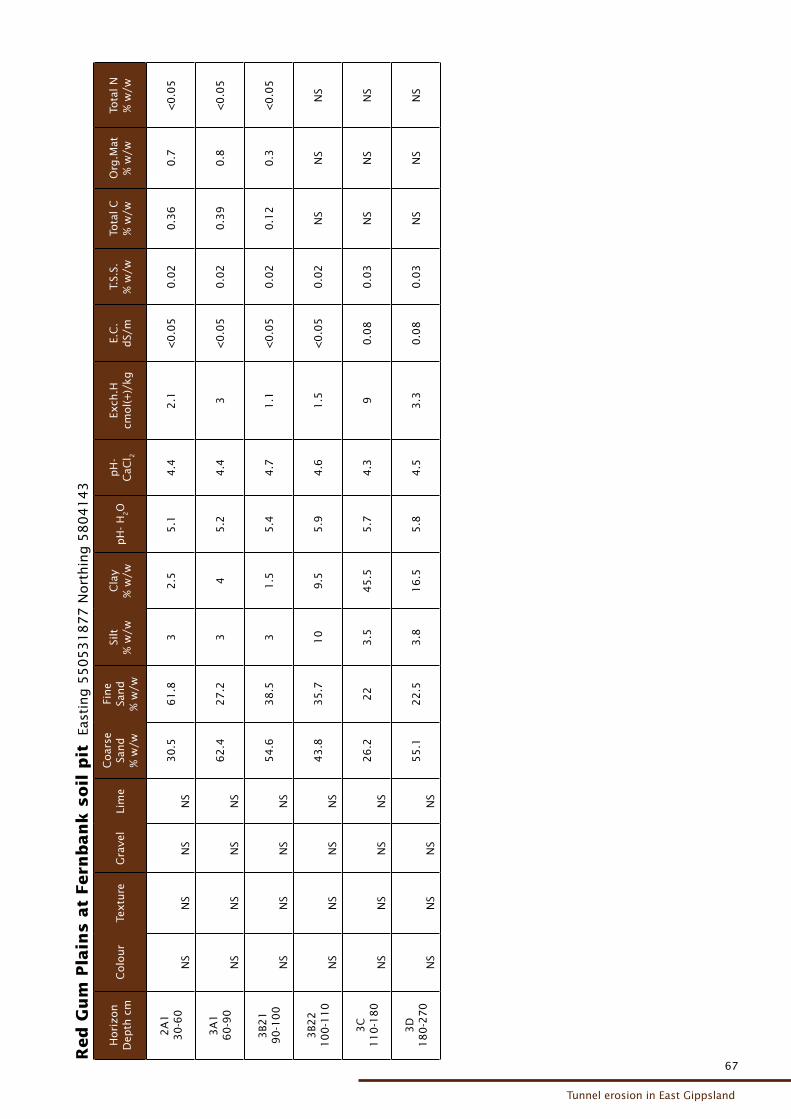
67
Tunnel erosion in East Gippsland
67
Red
Gu
m P
lain
s a
t Fern
ban
k s
oil
pit
Ea
stin
g 5
50
53
18
77
Nort
hin
g 5
80
41
43
Hori
zon
Dep
th c
mC
olo
ur
Textu
reG
rave
lLi
me
Coar
seSa
nd
% w
/w
Fine
Sand
% w
/w
Silt
% w
/wC
lay
% w
/wp
H-
H2O
pH
- C
aCl 2
Exch
.Hcm
ol(+
)/kg
E.C
.d
S/m
T.S.
S.%
w/w
Tota
l C
% w
/wO
rg.M
at%
w/w
Tota
l N
% w
/w
2A
1
30
-60
NS
NS
NS
NS
30
.56
1.8
32
.55
.14
.42
.1<
0.0
50
.02
0.3
60
.7<
0.0
5
3A
1
60
-90
NS
NS
NS
NS
62
.42
7.2
34
5.2
4.4
3<
0.0
50
.02
0.3
90
.8<
0.0
5
3B2
1
90
-10
0N
SN
SN
SN
S5
4.6
38
.53
1.5
5.4
4.7
1.1
<0
.05
0.0
20
.12
0.3
<0
.05
3B2
2
10
0-1
10
NS
NS
NS
NS
43
.83
5.7
10
9.5
5.9
4.6
1.5
<0
.05
0.0
2N
SN
SN
S
3C
1
10
-18
0N
SN
SN
SN
S2
6.2
22
3.5
45
.55
.74
.39
0.0
80
.03
NS
NS
NS
3D
1
80
-27
0N
SN
SN
SN
S5
5.1
22
.53
.81
6.5
5.8
4.5
3.3
0.0
80
.03
NS
NS
NS
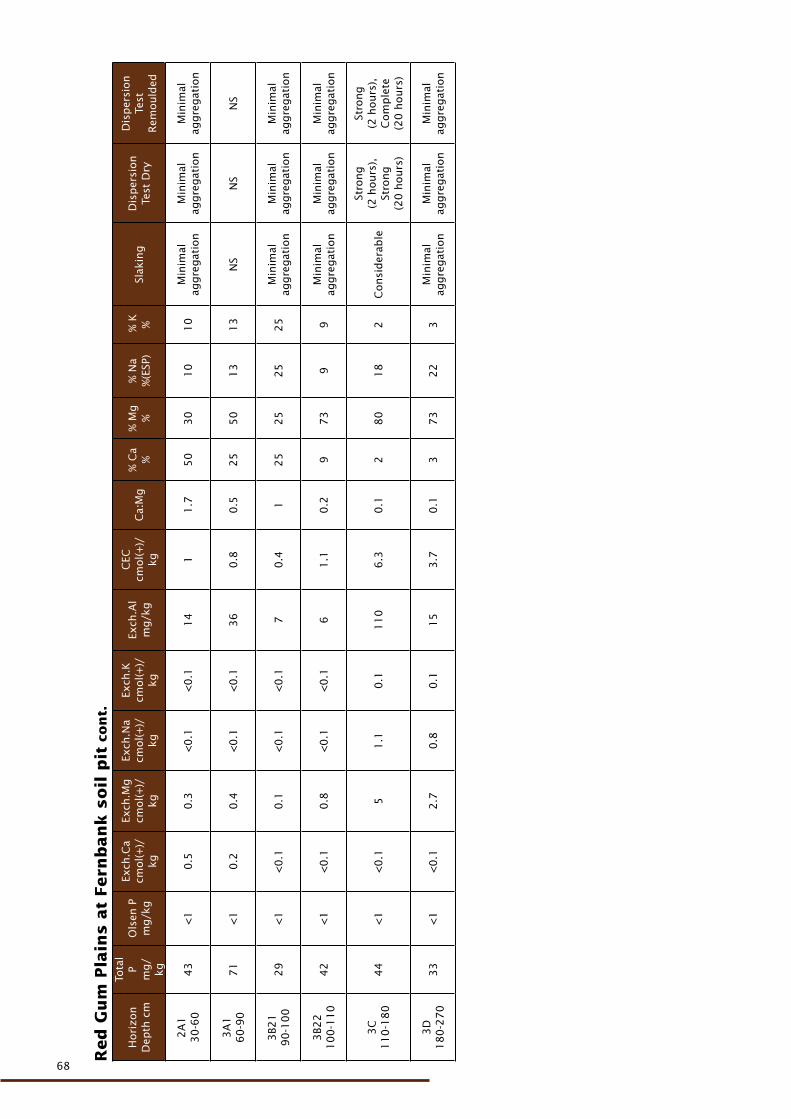
68
68
Red
Gu
m P
lain
s a
t Fern
ban
k s
oil
pit
con
t.
Hori
zon
Dep
th c
m
Tota
l P
mg/
kg
Ols
en P
m
g/k
g
Exch
.Ca
cmol(+
)/kg
Exch
.Mg
cmol(+
)/kg
Exch
.Na
cmol(+
)/kg
Exch
.K
cmol(+
)/kg
Exch
.Al
mg/k
g
CEC
cm
ol(+
)/kg
Ca:
Mg
% C
a %
% M
g
%%
Na
%(E
SP)
% K
%
Slak
ing
Dis
per
sion
Test
Dry
Dis
per
sion
Test
R
emould
ed
2A
1
30
-60
43
<1
0.5
0.3
<0
.1<
0.1
14
11
.75
03
01
01
0M
inim
al
aggre
gat
ion
Min
imal
ag
gre
gat
ion
Min
imal
ag
gre
gat
ion
3A
1
60
-90
71
<1
0.2
0.4
<0
.1<
0.1
36
0.8
0.5
25
50
13
13
NS
NS
NS
3B2
1
90
-10
02
9<
1<
0.1
0.1
<0
.1<
0.1
70
.41
25
25
25
25
Min
imal
ag
gre
gat
ion
Min
imal
ag
gre
gat
ion
Min
imal
ag
gre
gat
ion
3B2
2
10
0-1
10
42
<1
<0
.10
.8<
0.1
<0
.16
1.1
0.2
97
39
9M
inim
al
aggre
gat
ion
Min
imal
ag
gre
gat
ion
Min
imal
ag
gre
gat
ion
3C
11
0-1
80
44
<1
<0
.15
1.1
0.1
11
06
.30
.12
80
18
2C
onsi
der
able
Stro
ng
(2 h
ours
),
Stro
ng
(20
hours
)
Stro
ng
(2 h
ours
),
Com
ple
te
(20
hours
)
3D
1
80
-27
03
3<
1<
0.1
2.7
0.8
0.1
15
3.7
0.1
37
32
23
Min
imal
ag
gre
gat
ion
Min
imal
ag
gre
gat
ion
Min
imal
ag
gre
gat
ion
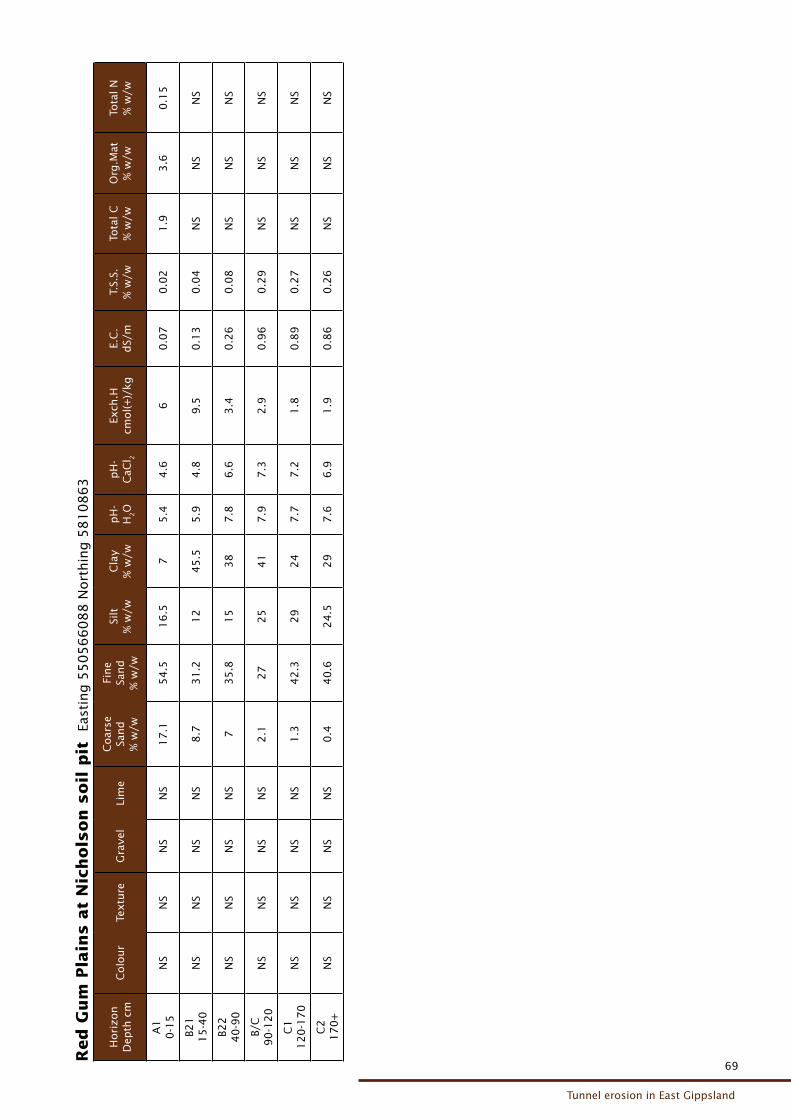
69
Tunnel erosion in East Gippsland
69
Red
Gu
m P
lain
s a
t N
ich
ols
on
soil
pit
Ea
stin
g 5
50
56
60
88
Nort
hin
g 5
81
08
63
Hori
zon
Dep
th c
mC
olo
ur
Textu
reG
rave
lLi
me
Coar
seSa
nd
% w
/w
Fine
Sand
% w
/w
Silt
% w
/wC
lay
% w
/wp
H-
H2O
pH
- C
aCl 2
Exch
.Hcm
ol(+
)/kg
E.C
.d
S/m
T.S.
S.%
w/w
Tota
l C
% w
/wO
rg.M
at%
w/w
Tota
l N
% w
/w
A1
0
-15
NS
NS
NS
NS
17
.15
4.5
16
.57
5.4
4.6
60
.07
0.0
21
.93
.60
.15
B21
1
5-4
0N
SN
SN
SN
S8
.73
1.2
12
45
.55
.94
.89
.50
.13
0.0
4N
SN
SN
S
B22
4
0-9
0N
SN
SN
SN
S7
35
.81
53
87
.86
.63
.40
.26
0.0
8N
SN
SN
S
B/C
9
0-1
20
NS
NS
NS
NS
2.1
27
25
41
7.9
7.3
2.9
0.9
60
.29
NS
NS
NS
C1
1
20
-17
0N
SN
SN
SN
S1
.34
2.3
29
24
7.7
7.2
1.8
0.8
90
.27
NS
NS
NS
C2
1
70
+N
SN
SN
SN
S0
.44
0.6
24
.52
97
.66
.91
.90
.86
0.2
6N
SN
SN
S
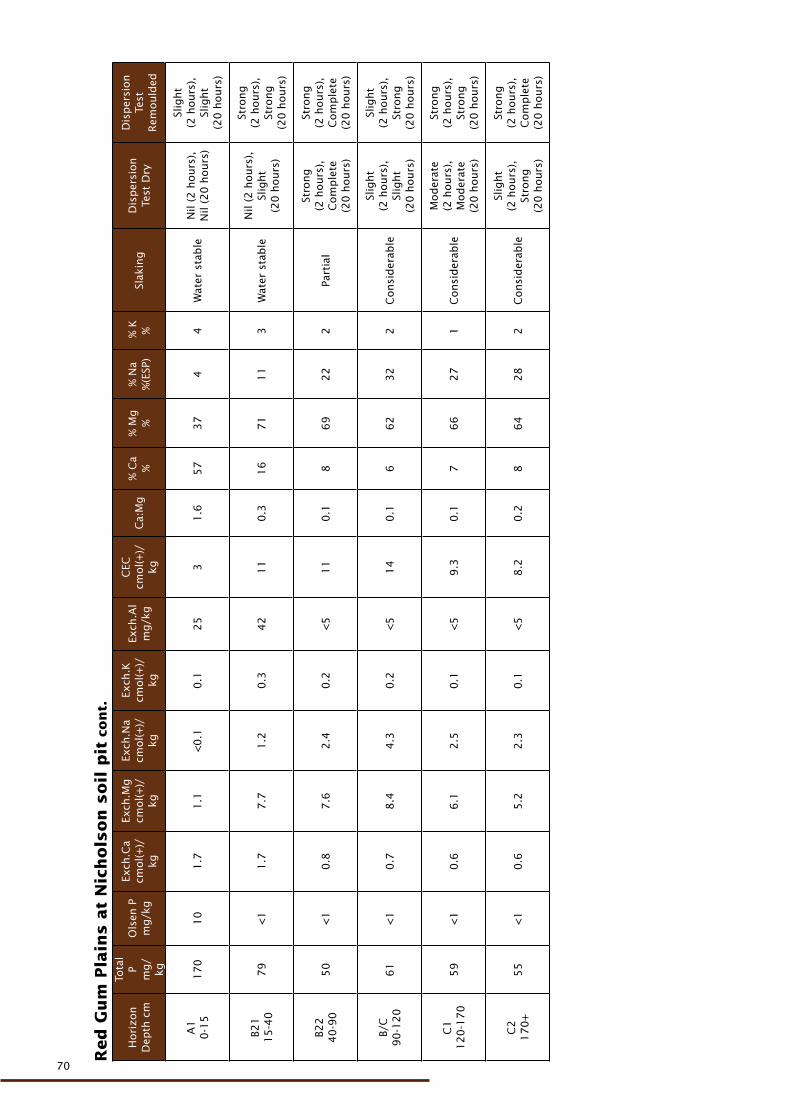
70
70
Red
Gu
m P
lain
s a
t N
ich
ols
on
soil
pit
con
t.
Hori
zon
Dep
th c
m
Tota
l P
mg/
kg
Ols
en P
m
g/k
g
Exch
.Ca
cmol(+
)/kg
Exch
.Mg
cmol(+
)/kg
Exch
.Na
cmol(+
)/kg
Exch
.K
cmol(+
)/kg
Exch
.Al
mg/k
g
CEC
cm
ol(+
)/kg
Ca:
Mg
% C
a %
% M
g
%%
Na
%(E
SP)
% K
%
Slak
ing
Dis
per
sion
Test
Dry
Dis
per
sion
Test
R
emould
ed
A1
0
-15
17
01
01
.71
.1<
0.1
0.1
25
31
.65
73
74
4W
ater
sta
ble
Nil
(2 h
ours
),
Nil
(20
hours
)
Slig
ht
(2 h
ours
),
Slig
ht
(20
hours
)
B21
1
5-4
07
9<
11
.77
.71
.20
.34
21
10
.31
67
11
13
Wat
er s
tab
leN
il (2
hours
),
Slig
ht
(20
hours
)
Stro
ng
(2 h
ours
),
Stro
ng
(20
hours
)
B22
4
0-9
05
0<
10
.87
.62
.40
.2<
51
10
.18
69
22
2Pa
rtia
l
Stro
ng
(2 h
ours
),
Com
ple
te
(20
hours
)
Stro
ng
(2 h
ours
),
Com
ple
te
(20
hours
)
B/C
9
0-1
20
61
<1
0.7
8.4
4.3
0.2
<5
14
0.1
66
23
22
Consi
der
able
Slig
ht
(2 h
ours
),
Slig
ht
(20
hours
)
Slig
ht
(2 h
ours
),
Stro
ng
(20
hours
)
C1
1
20
-17
05
9<
10
.66
.12
.50
.1<
59
.30
.17
66
27
1C
onsi
der
able
Mod
erat
e (2
hours
),
Mod
erat
e (2
0 h
ours
)
Stro
ng
(2 h
ours
),
Stro
ng
(20
hours
)
C2
1
70
+5
5<
10
.65
.22
.30
.1<
58
.20
.28
64
28
2C
onsi
der
able
Slig
ht
(2 h
ours
),
Stro
ng
(20
hours
)
Stro
ng
(2 h
ours
),
Com
ple
te
(20
hours
)
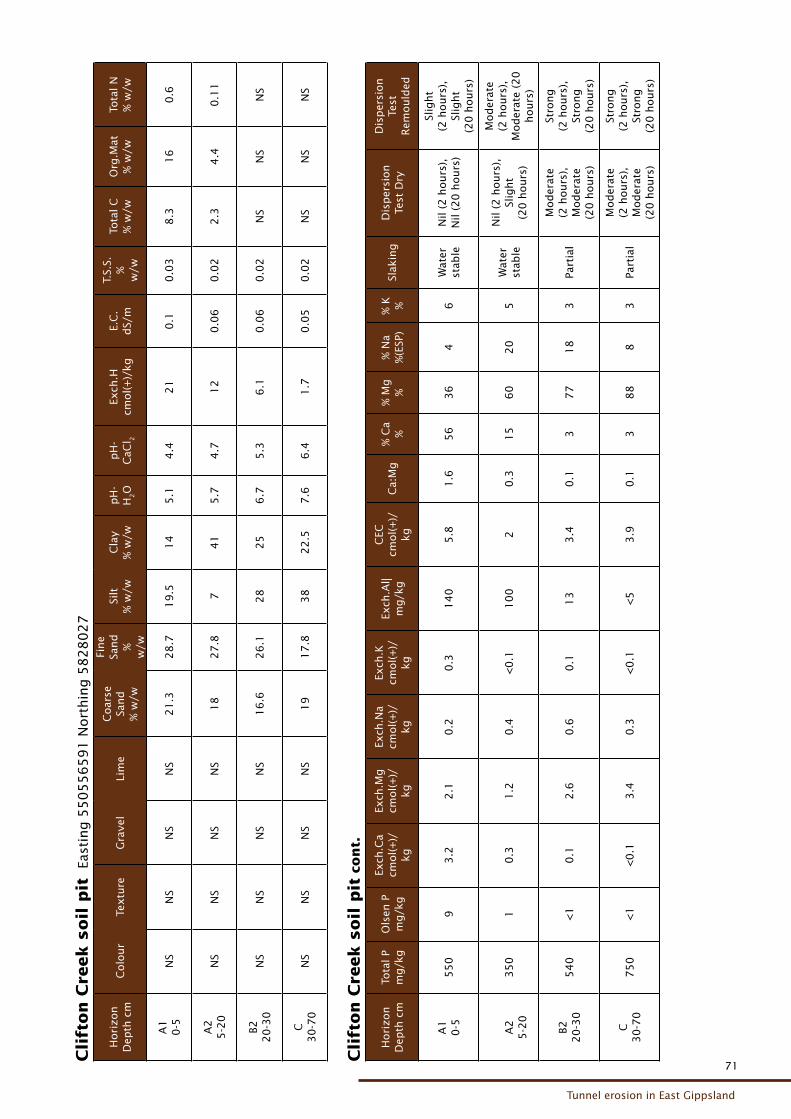
71
Tunnel erosion in East Gippsland
71
Cli
fton
Cre
ek s
oil
pit
Ea
stin
g 5
50
55
65
91
Nort
hin
g 5
82
80
27
Hori
zon
Dep
th c
mC
olo
ur
Textu
reG
rave
lLi
me
Coar
seSa
nd
% w
/w
Fine
Sand
%
w/w
Silt
% w
/wC
lay
% w
/wp
H-
H2O
pH
- C
aCl 2
Exch
.Hcm
ol(+
)/kg
E.C
.d
S/m
T.S.
S.%
w
/w
Tota
l C
% w
/wO
rg.M
at%
w/w
Tota
l N
% w
/w
A1
0-5
NS
NS
NS
NS
21
.32
8.7
19
.51
45
.14
.42
10
.10
.03
8.3
16
0.6
A2
5-2
0N
SN
SN
SN
S1
82
7.8
74
15
.74
.71
20
.06
0.0
22
.34
.40
.11
B22
0-3
0N
SN
SN
SN
S1
6.6
26
.12
82
56
.75
.36
.10
.06
0.0
2N
SN
SN
S
C3
0-7
0N
SN
SN
SN
S1
91
7.8
38
22
.57
.66
.41
.70
.05
0.0
2N
SN
SN
S
Cli
fton
Cre
ek s
oil
pit
con
t.
Hori
zon
Dep
th c
mTo
tal P
mg/k
gO
lsen
P
mg/k
g
Exch
.Ca
cmol(+
)/kg
Exch
.Mg
cmol(+
)/kg
Exch
.Na
cmol(+
)/kg
Exch
.K
cmol(+
)/kg
Exch
.Al|
mg/k
g
CEC
cm
ol(+
)/kg
Ca:
Mg
% C
a %
% M
g
%%
Na
%(E
SP)
% K
%
Slak
ing
Dis
per
sion
Test
Dry
Dis
per
sion
Test
R
emould
ed
A1
0-5
55
09
3.2
2.1
0.2
0.3
14
05
.81
.65
63
64
6W
ater
st
able
Nil
(2 h
ours
),
Nil
(20
hours
)
Slig
ht
(2 h
ours
),
Slig
ht
(20
hours
)
A2
5-2
03
50
10
.31
.20
.4<
0.1
10
02
0.3
15
60
20
5W
ater
st
able
Nil
(2 h
ours
),
Slig
ht
(20
hours
)
Mod
erat
e (2
hours
),
Mod
erat
e (2
0
hours
)
B22
0-3
05
40
<1
0.1
2.6
0.6
0.1
13
3.4
0.1
37
71
83
Part
ial
Mod
erat
e (2
hours
),
Mod
erat
e(2
0 h
ours
)
Stro
ng
(2 h
ours
),
Stro
ng
(20
hours
)
C3
0-7
07
50
<1
<0
.13
.40
.3<
0.1
<5
3.9
0.1
38
88
3Pa
rtia
l
Mod
erat
e (2
hours
),
Mod
erat
e (2
0 h
ours
)
Stro
ng
(2 h
ours
),
Stro
ng
(20
hours
)
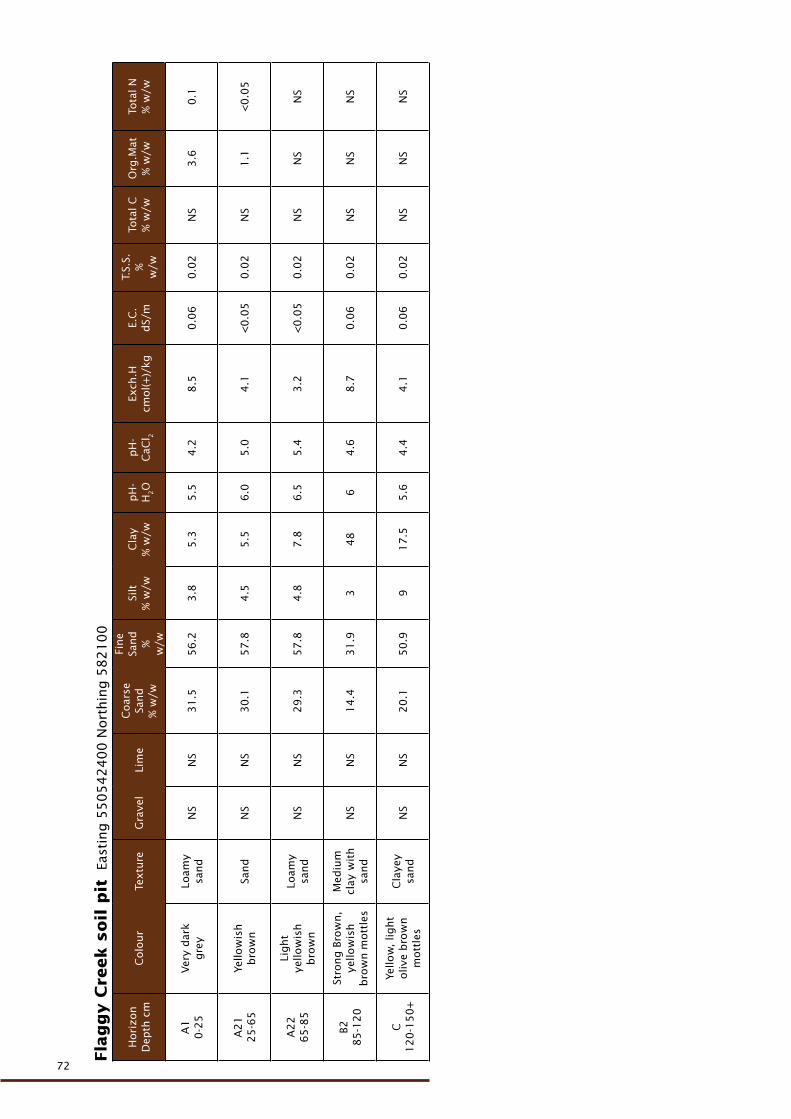
72
72
Fla
gg
y C
reek s
oil
pit
Ea
stin
g 5
50
54
24
00
Nort
hin
g 5
82
10
0
Hori
zon
Dep
th c
mC
olo
ur
Textu
reG
rave
lLi
me
Coar
seSa
nd
% w
/w
Fine
Sand
%
w/w
Silt
% w
/wC
lay
% w
/wp
H-
H2O
pH
- C
aCl 2
Exch
.Hcm
ol(+
)/kg
E.C
.d
S/m
T.S.
S.%
w
/w
Tota
l C
% w
/wO
rg.M
at%
w/w
Tota
l N
% w
/w
A1
0-2
5Ver
y d
ark
gre
yLo
amy
sand
NS
NS
31
.55
6.2
3.8
5.3
5.5
4.2
8.5
0.0
60
.02
NS
3.6
0.1
A2
12
5-6
5Ye
llow
ish
bro
wn
Sand
NS
NS
30
.15
7.8
4.5
5.5
6.0
5.0
4.1
<0
.05
0.0
2N
S1
.1<
0.0
5
A2
26
5-8
5
Light
yello
wis
h
bro
wn
Loam
y sa
nd
NS
NS
29
.35
7.8
4.8
7.8
6.5
5.4
3.2
<0
.05
0.0
2N
SN
SN
S
B28
5-1
20
Stro
ng B
row
n,
yello
wis
h
bro
wn m
ott
les
Med
ium
cl
ay w
ith
sand
NS
NS
14
.43
1.9
34
86
4.6
8.7
0.0
60
.02
NS
NS
NS
C1
20
-15
0+
Yello
w,
light
oliv
e b
row
n
mott
les
Cla
yey
sand
NS
NS
20
.15
0.9
91
7.5
5.6
4.4
4.1
0.0
60
.02
NS
NS
NS
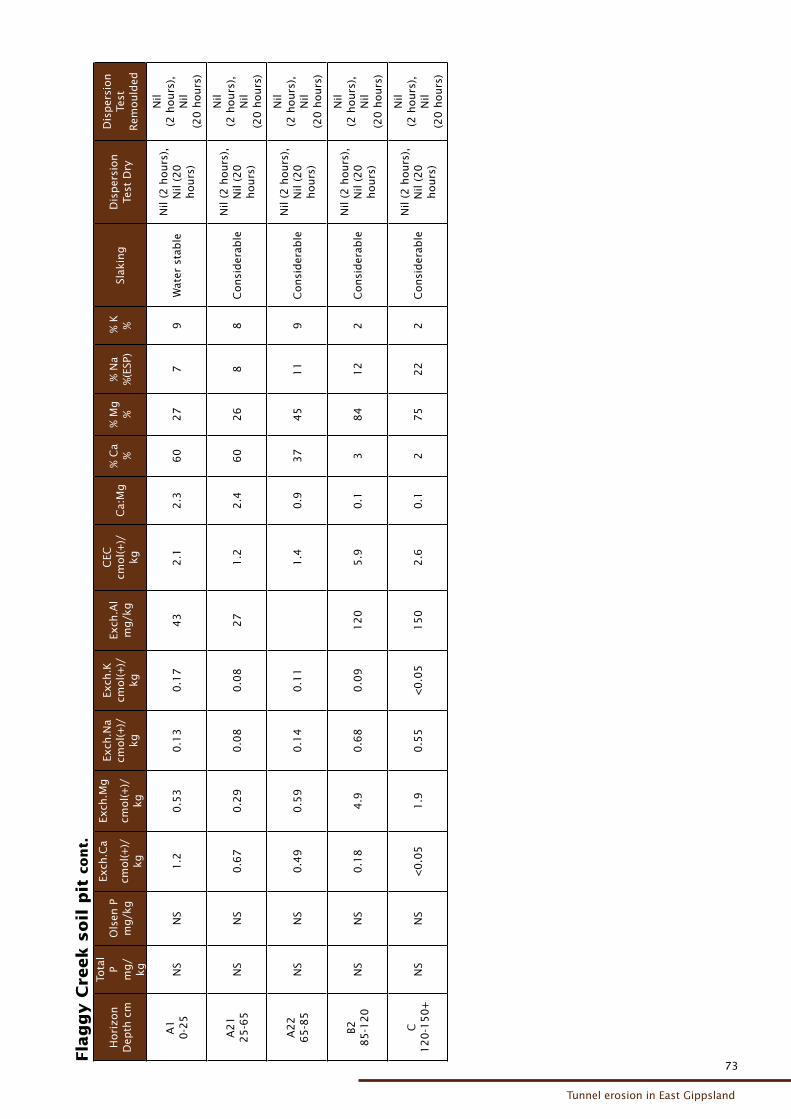
73
Tunnel erosion in East Gippsland
73
Fla
gg
y C
reek s
oil
pit
con
t.
Hori
zon
Dep
th c
m
Tota
l P
mg/
kg
Ols
en P
m
g/k
g
Exch
.Ca
cmol(+
)/kg
Exch
.Mg
cmol(+
)/kg
Exch
.Na
cmol(+
)/kg
Exch
.K
cmol(+
)/kg
Exch
.Al
mg/k
g
CEC
cm
ol(+
)/kg
Ca:
Mg
% C
a %
% M
g
%%
Na
%(E
SP)
% K
%
Slak
ing
Dis
per
sion
Test
Dry
Dis
per
sion
Test
R
emould
ed
A1
0-2
5N
SN
S1
.20
.53
0.1
30
.17
43
2.1
2.3
60
27
79
Wat
er s
tab
leN
il (2
hours
),
Nil
(20
hours
)
Nil
(2 h
ours
),
Nil
(20
hours
)
A2
12
5-6
5N
SN
S0
.67
0.2
90
.08
0.0
82
71
.22
.46
02
68
8C
onsi
der
able
Nil
(2 h
ours
),
Nil
(20
hours
)
Nil
(2 h
ours
),
Nil
(20
hours
)
A2
26
5-8
5N
SN
S0
.49
0.5
90
.14
0.1
11
.40
.93
74
51
19
Consi
der
able
Nil
(2 h
ours
),
Nil
(20
hours
)
Nil
(2 h
ours
),
Nil
(20
hours
)
B28
5-1
20
NS
NS
0.1
84
.90
.68
0.0
91
20
5.9
0.1
38
41
22
Consi
der
able
Nil
(2 h
ours
),
Nil
(20
hours
)
Nil
(2 h
ours
),
Nil
(20
hours
)
C1
20
-15
0+
NS
NS
<0
.05
1.9
0.5
5<
0.0
51
50
2.6
0.1
27
52
22
Consi
der
able
Nil
(2 h
ours
),
Nil
(20
hours
)
Nil
(2 h
ours
),
Nil
(20
hours
)
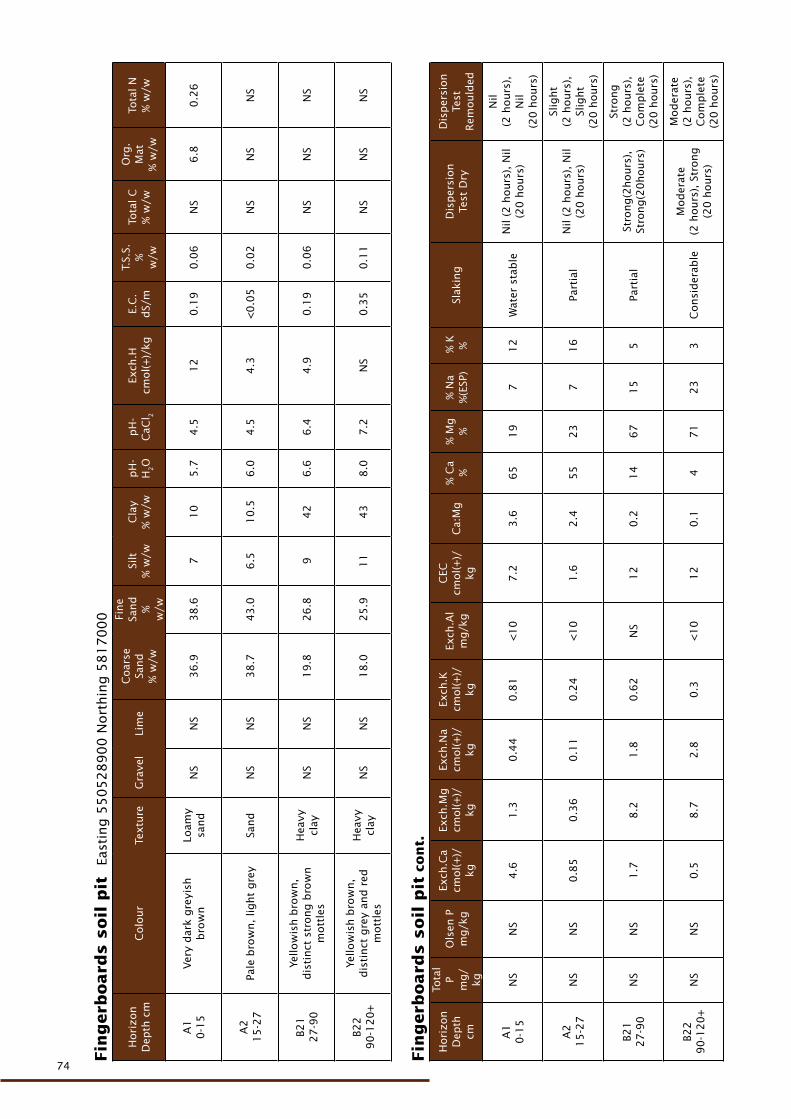
74
74
Fin
gerb
oard
s s
oil
pit
Ea
stin
g 5
50
52
89
00
Nort
hin
g 5
81
70
00
Hori
zon
Dep
th c
mC
olo
ur
Textu
reG
rave
lLi
me
Coar
seSa
nd
% w
/w
Fine
Sand
%
w/w
Silt
% w
/wC
lay
% w
/wp
H-
H2O
pH
- C
aCl 2
Exch
.Hcm
ol(+
)/kg
E.C
.d
S/m
T.S.
S.%
w
/w
Tota
l C
% w
/w
Org
.M
at%
w/w
Tota
l N
% w
/w
A1
0-1
5Ver
y d
ark
gre
yish
b
row
nLo
amy
sand
NS
NS
36
.93
8.6
71
05
.74
.51
20
.19
0.0
6N
S6
.80
.26
A2
15
-27
Pale
bro
wn,
light
gre
y Sa
nd
NS
NS
38
.74
3.0
6.5
10
.56
.04
.54
.3<
0.0
50
.02
NS
NS
NS
B21
27
-90
Yello
wis
h b
row
n,
dis
tinct
str
ong b
row
n
mott
les
Hea
vy
clay
N
SN
S1
9.8
26
.89
42
6.6
6.4
4.9
0.1
90
.06
NS
NS
NS
B22
90
-12
0+
Yello
wis
h b
row
n,
dis
tinct
gre
y an
d r
ed
mott
les
Hea
vy
clay
NS
NS
18
.02
5.9
11
43
8.0
7.2
NS
0.3
50
.11
NS
NS
NS
Fin
gerb
oard
s s
oil
pit
con
t.
Hori
zon
Dep
th
cm
Tota
l P
mg/
kg
Ols
en P
m
g/k
g
Exch
.Ca
cmol(+
)/kg
Exch
.Mg
cmol(+
)/kg
Exch
.Na
cmol(+
)/kg
Exch
.K
cmol(+
)/kg
Exch
.Al
mg/k
g
CEC
cm
ol(+
)/kg
Ca:
Mg
% C
a %
% M
g
%%
Na
%(E
SP)
% K
%
Slak
ing
Dis
per
sion
Test
Dry
Dis
per
sion
Test
R
emould
ed
A1
0-1
5N
SN
S4
.61
.30
.44
0.8
1<
10
7.2
3.6
65
19
71
2W
ater
sta
ble
Nil
(2 h
ours
), N
il (2
0 h
ours
)
Nil
(2 h
ours
),N
il (2
0 h
ours
)
A2
15
-27
NS
NS
0.8
50
.36
0.1
10
.24
<1
01
.62
.45
52
37
16
Part
ial
Nil
(2 h
ours
), N
il (2
0 h
ours
)
Slig
ht
(2 h
ours
),Sl
ight
(20
hours
)
B21
27
-90
NS
NS
1.7
8.2
1.8
0.6
2N
S
12
0.2
14
67
15
5Pa
rtia
lSt
rong(2
hours
),
Stro
ng(2
0hours
)
Stro
ng
(2 h
ours
),
Com
ple
te
(20
hours
)
B22
90
-12
0+
NS
NS
0.5
8.7
2.8
0.3
<1
01
20
.14
71
23
3C
onsi
der
able
Mod
erat
e(2
hours
), S
trong
(20
hours
)
Mod
erat
e (2
hours
),
Com
ple
te
(20
hours
)
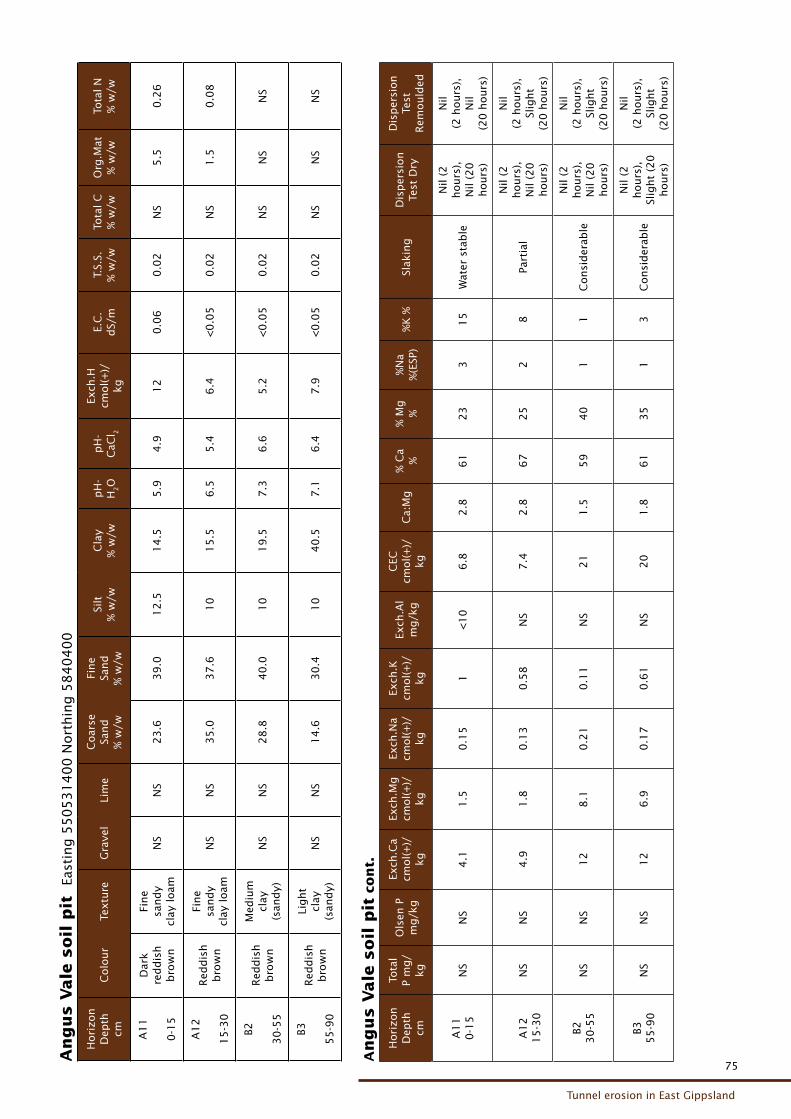
75
Tunnel erosion in East Gippsland
75
An
gu
s V
ale
soil
pit
Ea
stin
g 5
50
53
14
00
Nort
hin
g 5
84
04
00
Hori
zon
Dep
th
cmC
olo
ur
Textu
reG
rave
lLi
me
Coar
se
Sand
% w
/w
Fine
Sand
% w
/w
Silt
%
w/w
Cla
y %
w/w
pH
- H
2O
pH
- C
aCl 2
Exch
.H
cmol(+
)/kg
E.C
. d
S/m
T.S.
S.
% w
/wTo
tal C
%
w/w
Org
.Mat
%
w/w
Tota
l N
%
w/w
A1
1
0-1
5
Dar
k re
dd
ish
bro
wn
Fine
sand
y cl
ay lo
amN
SN
S2
3.6
39
.01
2.5
14
.55
.94
.91
20
.06
0.0
2N
S5
.50
.26
A1
2
15
-30
Red
dis
h
bro
wn
Fine
sand
y cl
ay lo
amN
SN
S3
5.0
37
.61
01
5.5
6.5
5.4
6.4
<0
.05
0.0
2N
S1
.50
.08
B2
30
-55
Red
dis
h
bro
wn
Med
ium
cl
ay
(san
dy)
NS
NS
28
.84
0.0
10
19
.57
.36
.65
.2<
0.0
50
.02
NS
NS
NS
B3
55
-90
Red
dis
h
bro
wn
Light
clay
(s
and
y)N
SN
S1
4.6
30
.41
04
0.5
7.1
6.4
7.9
<0
.05
0.0
2N
SN
SN
S
An
gu
s V
ale
soil
pit
con
t.
Hori
zon
Dep
th
cm
Tota
l P
mg/
kg
Ols
en P
m
g/k
g
Exch
.Ca
cmol(+
)/kg
Exch
.Mg
cmol(+
)/kg
Exch
.Na
cmol(+
)/kg
Exch
.K
cmol(+
)/kg
Exch
.Al
mg/k
g
CEC
cm
ol(+
)/kg
Ca:
Mg
% C
a %
% M
g
%%
Na
%(E
SP)
%K
%Sl
akin
gD
isp
ersi
on
Test
Dry
Dis
per
sion
Test
R
emould
ed
A1
10
-15
NS
NS
4.1
1.5
0.1
51
<1
06
.82
.86
12
33
15
Wat
er s
tab
le
Nil
(2
hours
),
Nil
(20
hours
)
Nil
(2 h
ours
),
Nil
(20
hours
)
A1
21
5-3
0N
SN
S4
.91
.80
.13
0.5
8N
S7
.42
.86
72
52
8Pa
rtia
l
Nil
(2
hours
),
Nil
(20
hours
)
Nil
(2 h
ours
),
Slig
ht
(20
hours
)
B23
0-5
5N
SN
S1
28
.10
.21
0.1
1N
S2
11
.55
94
01
1C
onsi
der
able
Nil
(2
hours
),
Nil
(20
hours
)
Nil
(2 h
ours
),
Slig
ht
(20
hours
)
B35
5-9
0N
SN
S1
26
.90
.17
0.6
1N
S2
01
.86
13
51
3C
onsi
der
able
Nil
(2
hours
),
Slig
ht
(20
hours
)
Nil
(2 h
ours
),
Slig
ht
(20
hours
)
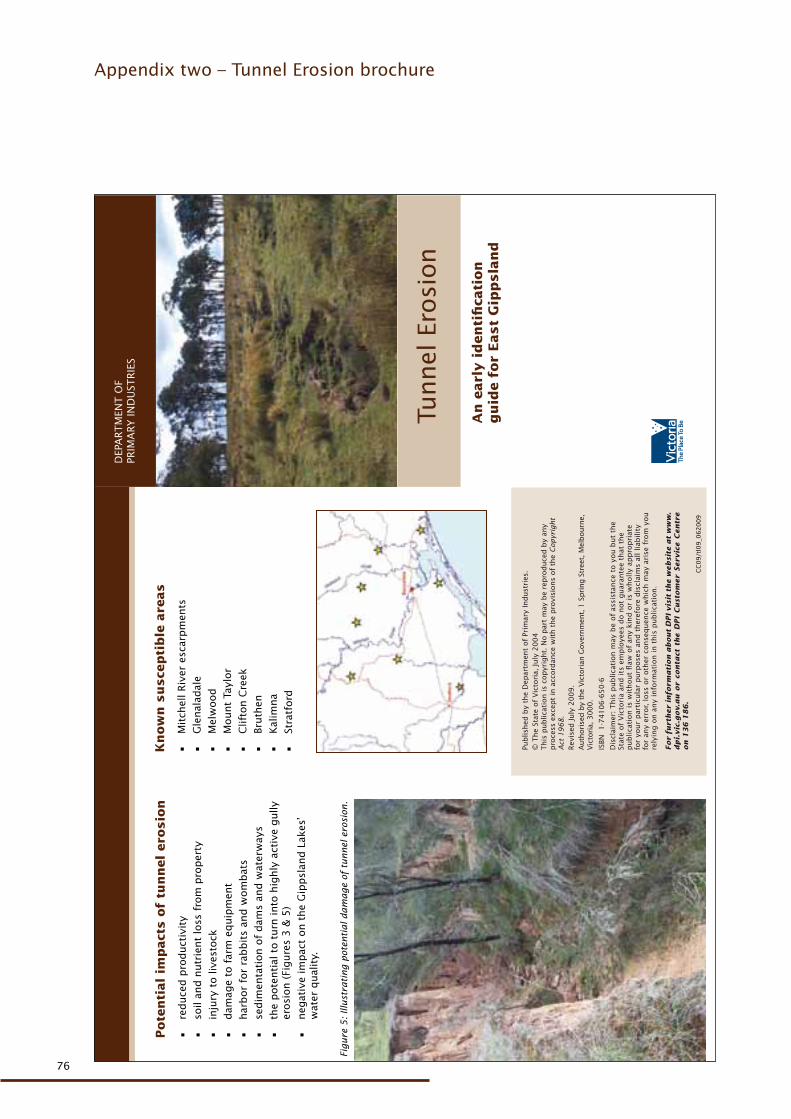
76
76
Appendix two – Tunnel Erosion brochure
Pote
nti
al
imp
act
s o
f tu
nn
el
ero
sio
n
reduce
d p
roduct
ivit
y•
soil
and n
utr
ient
loss
fro
m p
roper
ty•
inju
ry t
o liv
esto
ck•
dam
age
to f
arm
equip
men
t •
har
bor
for
rabbit
s an
d w
om
bat
s•
sedim
enta
tion o
f dam
s an
d w
ater
way
s•
the
pote
nti
al t
o t
urn
into
hig
hly
act
ive
gully
•
erosi
on (
Figure
s 3
& 5
)
neg
ativ
e im
pac
t on t
he
Gip
psl
and L
akes
’ •
wat
er q
ual
ity.
Publis
hed
by
the
Dep
artm
ent
of
Prim
ary
Indust
ries
.©
The
Stat
e of
Vic
tori
a, July
20
04
This
public
atio
n is
copyr
ight.
No p
art
may
be
repro
duce
d b
y an
y pro
cess
exce
pt
in a
ccord
ance
wit
h t
he
pro
visi
ons
of
the
Cop
yrig
ht
Act
19
68
.R
evis
ed July
20
09
.A
uth
ori
sed b
y th
e V
icto
rian
Gove
rnm
ent,
1 S
pri
ng S
tree
t, M
elbourn
e,
Vic
tori
a, 3
000.
ISBN
1
-74
10
6-6
50
-6
Dis
clai
mer
: T
his
pub
lica
tion m
ay b
e of
assi
stan
ce t
o y
ou b
ut
the
Stat
e of
Vic
tori
a an
d its
em
plo
yees
do n
ot
guar
ante
e th
at t
he
pub
lica
tion is
wit
hout
flaw
of
any
kin
d o
r is
wholly
app
rop
riat
e fo
r yo
ur
par
ticu
lar
purp
ose
s an
d t
her
efore
dis
clai
ms
all liab
ilit
y fo
r an
y er
ror, loss
or
oth
er c
onse
quen
ce w
hic
h m
ay a
rise
fro
m y
ou
rely
ing
on a
ny
info
rmat
ion in t
his
pub
lica
tion.
For
furt
her
info
rma
tion
ab
ou
t D
PI vis
it t
he w
eb
site
at
ww
w.
dp
i.vic
.gov.
au
or
con
tact
th
e D
PI
Cu
stom
er
Serv
ice C
en
tre
on
13
6 1
86
.
Kn
ow
n s
usce
pti
ble
are
as
Mit
chel
l R
iver
esc
arpm
ents
•
Gle
nal
adal
e•
Mel
wood
•
Mount
Tayl
or
•
Clif
ton C
reek
•
Bruth
en•
Kal
imna
•
Stra
tford
•
DEP
ART
MEN
T O
FPR
IMA
RY IN
DU
STR
IES
An
earl
y i
den
tifi
cati
on
g
uid
e f
or
East
Gip
psla
nd
Tunnel
Ero
sion
CC
09
/tl0
9_0
62
00
9
Figure
5:
Illust
rati
ng p
oten
tial dam
age
of t
unnel
ero
sion
.
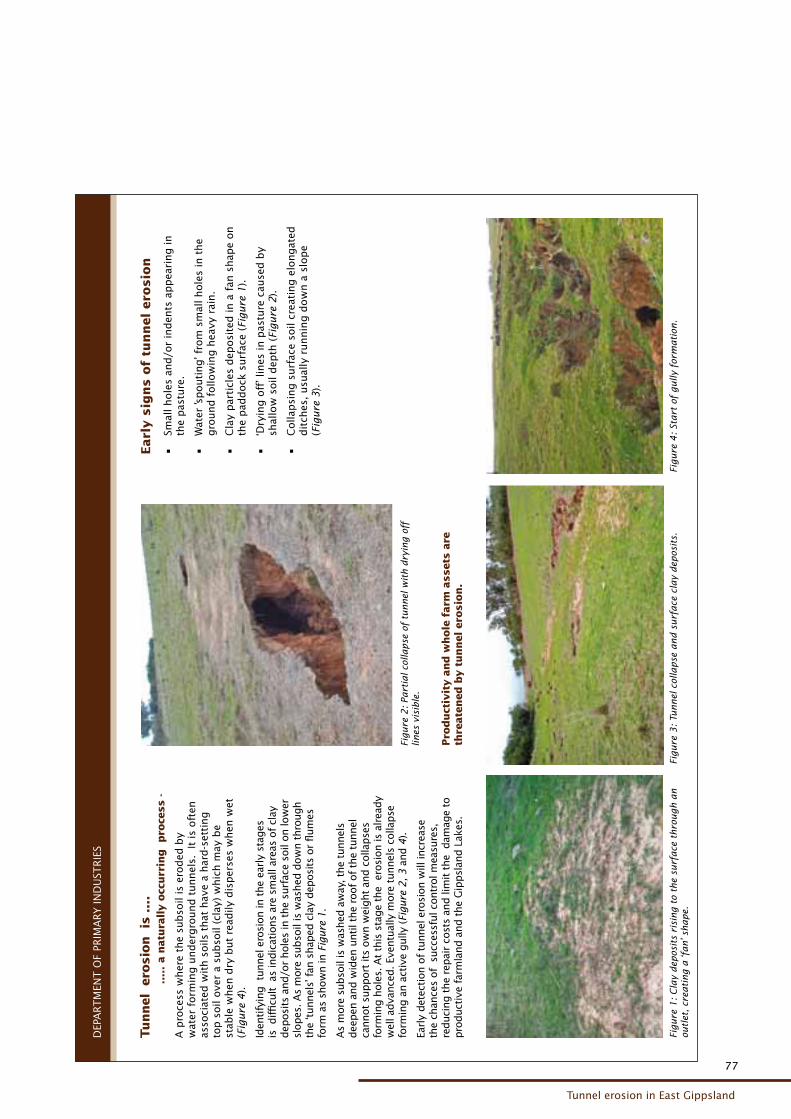
77
Tunnel erosion in East Gippsland
77
Tunnel e
rosio
n is
...
.
....
. a n
atu
rally o
ccurr
ing pro
cess -
A p
roce
ss w
her
e th
e su
bso
il is
ero
ded
by
wat
er f
orm
ing u
nder
gro
und t
unnel
s.
It is
oft
en
asso
ciat
ed w
ith s
oils
that
hav
e a
har
d-s
etti
ng
top s
oil
ove
r a
subso
il (c
lay)
whic
h m
ay b
e st
able
when
dry
but
read
ily d
isper
ses
when
wet
(F
igure
4).
Iden
tify
ing t
unnel
ero
sion
in t
he
earl
y st
ages
is
difficu
lt a
s in
dic
atio
ns
are
smal
l are
as o
f cl
ay
dep
osits
and/o
r hol
es in
the
surf
ace
soil
on lo
wer
sl
opes
. As
mor
e su
bso
il is
was
hed
dow
n t
hro
ugh
the
‘tunnel
s’ f
an s
hap
ed c
lay
dep
osits
or fl
um
es
form
as
show
n in
Fig
ure
1.
As
mor
e su
bso
il is
was
hed
aw
ay, t
he
tunnel
s dee
pen
and w
iden
until t
he
roof
of
the
tunnel
ca
nnot
suppor
t its
own w
eight
and c
olla
pse
s fo
rmin
g h
oles
. At
this
sta
ge
the
ero
sion
is a
lrea
dy
w
ell a
dva
nce
d. E
ventu
ally
mor
e tu
nnel
s co
llapse
fo
rmin
g a
n a
ctiv
e gully
(Fi
gure
2, 3
and 4
).
Earl
y det
ection
of
tunnel
ero
sion
will
incr
ease
th
e ch
ance
s of
succ
essf
ul c
ontr
ol m
easu
res,
re
duci
ng t
he
repai
r co
sts
and li
mit t
he
dam
age
to
pro
duct
ive
farm
land a
nd t
he
Gip
psl
and L
akes
.Pro
duct
ivit
y a
nd w
hole
farm
assets
are
th
reate
ned b
y t
unnel ero
sio
n.
Earl
y s
ign
s o
f tu
nn
el
ero
sio
n
Smal
l hole
s an
d/o
r in
den
ts a
ppea
ring in
•
the
pas
ture
.
Wat
er ’s
pouti
ng’ f
rom
sm
all hole
s in
the
•
gro
und f
ollo
win
g h
eavy
rai
n.
Cla
y par
ticl
es d
eposi
ted in a
fan
shap
e on
•
the
pad
dock
surf
ace
(Fig
ure
1).
‘Dry
ing o
ff’ l
ines
in p
astu
re c
ause
d b
y •
shal
low
soil
dep
th (
Figure
2).
Colla
psi
ng s
urf
ace
soil
crea
ting e
longat
ed
•
dit
ches
, usu
ally
runnin
g d
ow
n a
slo
pe
(Fig
ure
3).
DEP
ART
MEN
T O
F PR
IMA
RY IN
DU
STR
IES
Figure
2:
Part
ial co
llapse
of
tunnel
wit
h d
ryin
g o
ff
lines
vis
ible
.
Figure
1:
Cla
y dep
osit
s ri
sing t
o th
e su
rface
thro
ugh a
n
outl
et,
crea
ting a
‘fan’ s
hape.
Figure
3:
Tunnel
col
lapse
and s
urf
ace
cla
y dep
osit
s.Fi
gure
4:
Start
of
gully
for
mati
on.
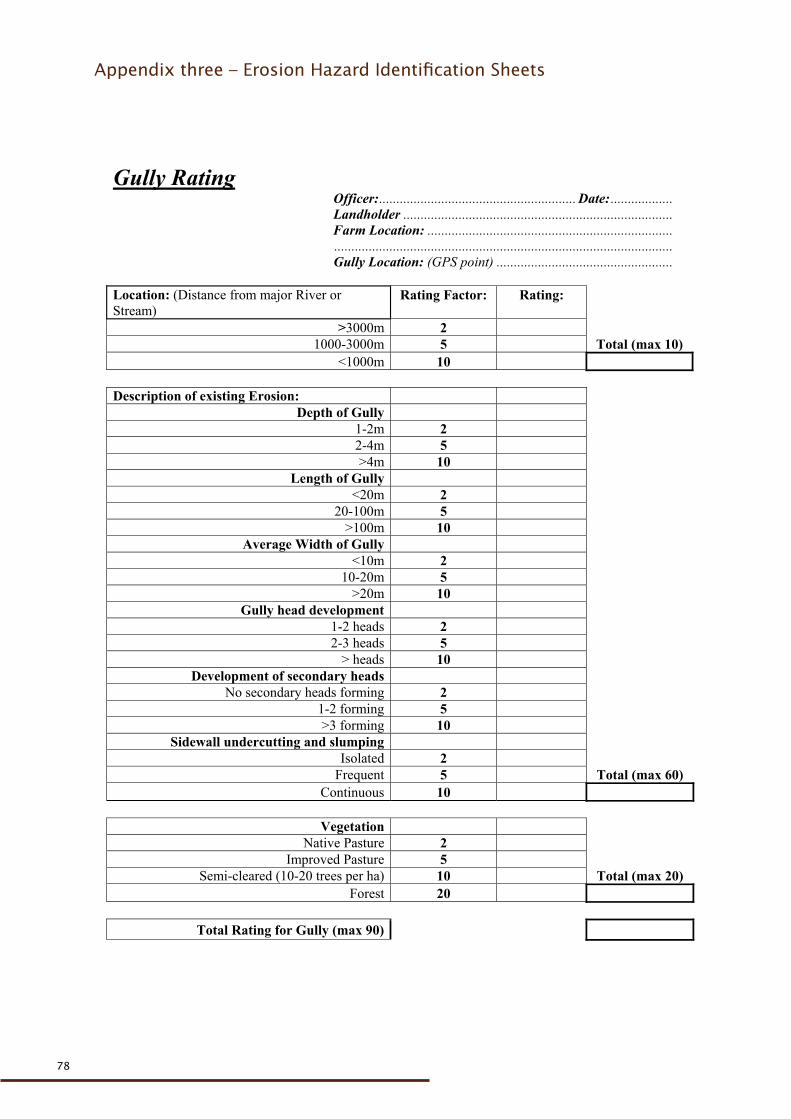
78
78
Gully Rating Officer:......................................................... Date: .................. Landholder .............................................................................. Farm Location: ....................................................................... .................................................................................................. Gully Location: (GPS point) ................................................... Location: (Distance from major River or Stream)
Rating Factor: Rating:
>3000m 2 1000-3000m 5 Total (max 10)
<1000m 10 Description of existing Erosion:
Depth of Gully 1-2m 2 2-4m 5 >4m 10
Length of Gully <20m 2
20-100m 5 >100m 10
Average Width of Gully <10m 2
10-20m 5 >20m 10
Gully head development 1-2 heads 2 2-3 heads 5
> heads 10 Development of secondary heads
No secondary heads forming 2 1-2 forming 5 >3 forming 10
Sidewall undercutting and slumping Isolated 2
Frequent 5 Total (max 60) Continuous 10
Vegetation
Native Pasture 2 Improved Pasture 5
Semi-cleared (10-20 trees per ha) 10 Total (max 20) Forest 20
Total Rating for Gully (max 90)
Appendix three – Erosion Hazard Identification Sheets
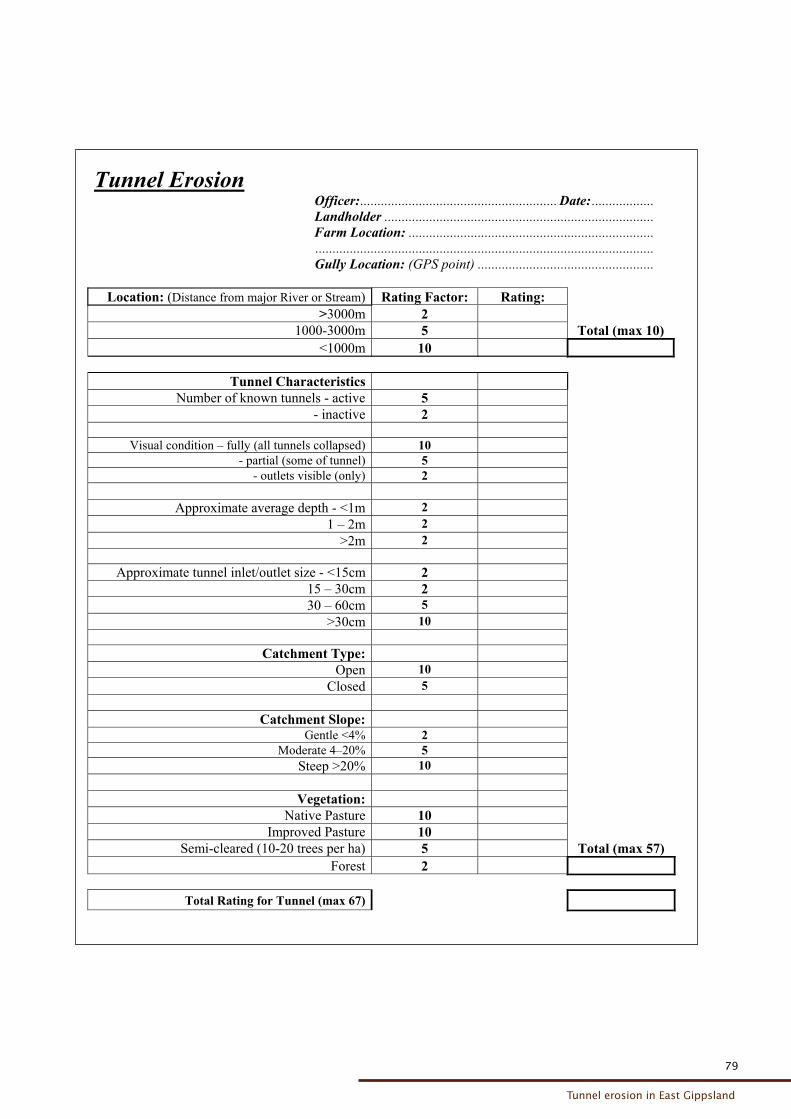
79
Tunnel erosion in East Gippsland
79
Tunnel Erosion Officer:......................................................... Date: .................. Landholder .............................................................................. Farm Location: ....................................................................... .................................................................................................. Gully Location: (GPS point) ...................................................
Location: (Distance from major River or Stream) Rating Factor: Rating: >3000m 2
1000-3000m 5 Total (max 10) <1000m 10
Tunnel Characteristics
Number of known tunnels - active 5 - inactive 2
Visual condition – fully (all tunnels collapsed) 10
- partial (some of tunnel) 5 - outlets visible (only) 2
Approximate average depth - <1m 2
1 – 2m 2 >2m 2
Approximate tunnel inlet/outlet size - <15cm 2
15 – 30cm 2 30 – 60cm 5
>30cm 10
Catchment Type: Open 10
Closed 5
Catchment Slope: Gentle <4% 2
Moderate 4–20% 5 Steep >20% 10
Vegetation:
Native Pasture 10 Improved Pasture 10
Semi-cleared (10-20 trees per ha) 5 Total (max 57) Forest 2
Total Rating for Tunnel (max 67)
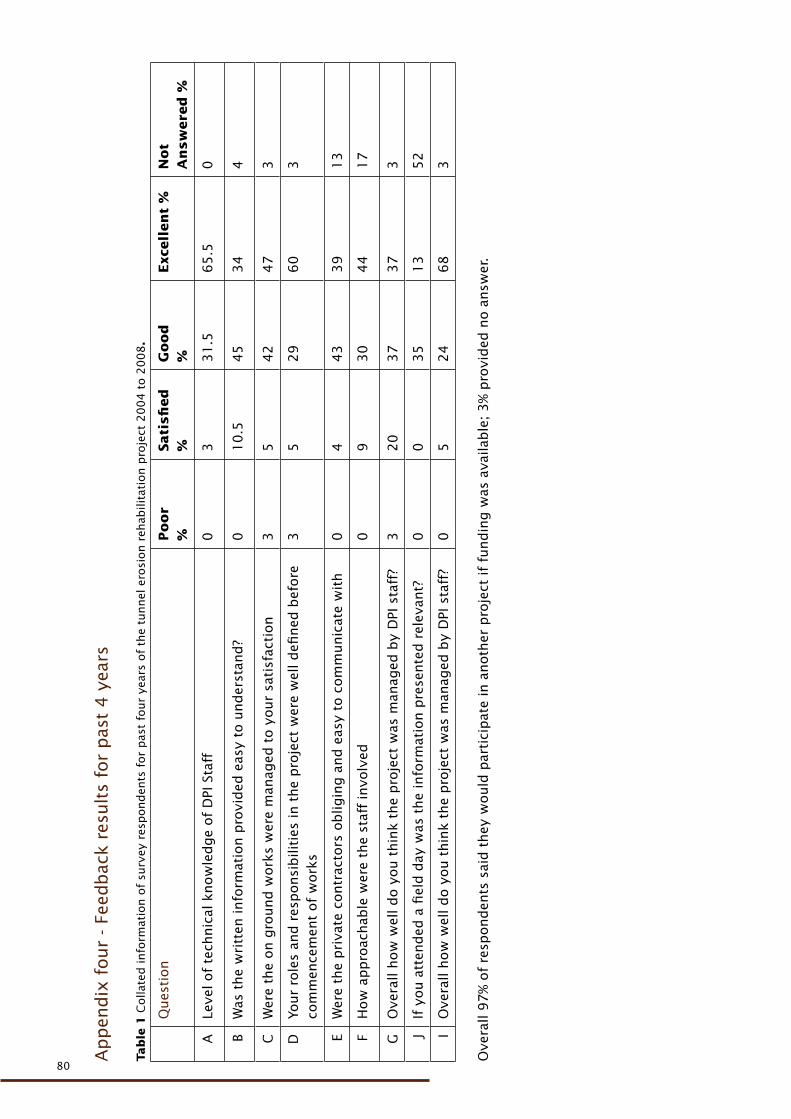
80
80
Appen
dix
four
- Fe
edbac
k re
sult
s fo
r pas
t 4
yea
rs
Tab
le 1
Colla
ted
info
rmat
ion o
f su
rvey
res
pond
ents
for
pas
t fo
ur
year
s of
the
tunnel
ero
sion r
ehab
ilita
tion p
roje
ct 2
00
4 t
o 2
00
8.
Ques
tion
Poor
%Sati
sfi
ed
%
Good
%
Exc
ell
en
t %
Not
An
sw
ere
d %
ALe
vel of
tech
nic
al k
now
led
ge
of
DPI
Sta
ff0
33
1.5
65
.50
BW
as t
he
wri
tten
info
rmat
ion p
rovi
ded
eas
y to
und
erst
and
?0
10
.54
53
44
CW
ere
the
on g
round
work
s w
ere
man
aged
to y
our
sati
sfac
tion
35
42
47
3
DYo
ur
role
s an
d r
esp
onsi
bili
ties
in t
he
pro
ject
wer
e w
ell d
efined
bef
ore
co
mm
ence
men
t of
work
s3
52
96
03
EW
ere
the
pri
vate
contr
acto
rs o
blig
ing a
nd
eas
y to
com
munic
ate
wit
h
04
43
39
13
FH
ow
ap
pro
achab
le w
ere
the
staf
f in
volv
ed0
93
04
41
7
GO
vera
ll how
wel
l d
o y
ou t
hin
k th
e p
roje
ct w
as m
anag
ed b
y D
PI s
taff
?3
20
37
37
3
JIf
you a
tten
ded
a fi
eld
day
was
the
info
rmat
ion p
rese
nte
d r
elev
ant?
00
35
13
52
IO
vera
ll how
wel
l d
o y
ou t
hin
k th
e p
roje
ct w
as m
anag
ed b
y D
PI s
taff
?0
52
46
83
Ove
rall
97
% o
f re
spond
ents
sai
d t
hey
would
par
tici
pat
e in
anoth
er p
roje
ct if
fund
ing w
as a
vaila
ble
; 3
% p
rovi
ded
no a
nsw
er.
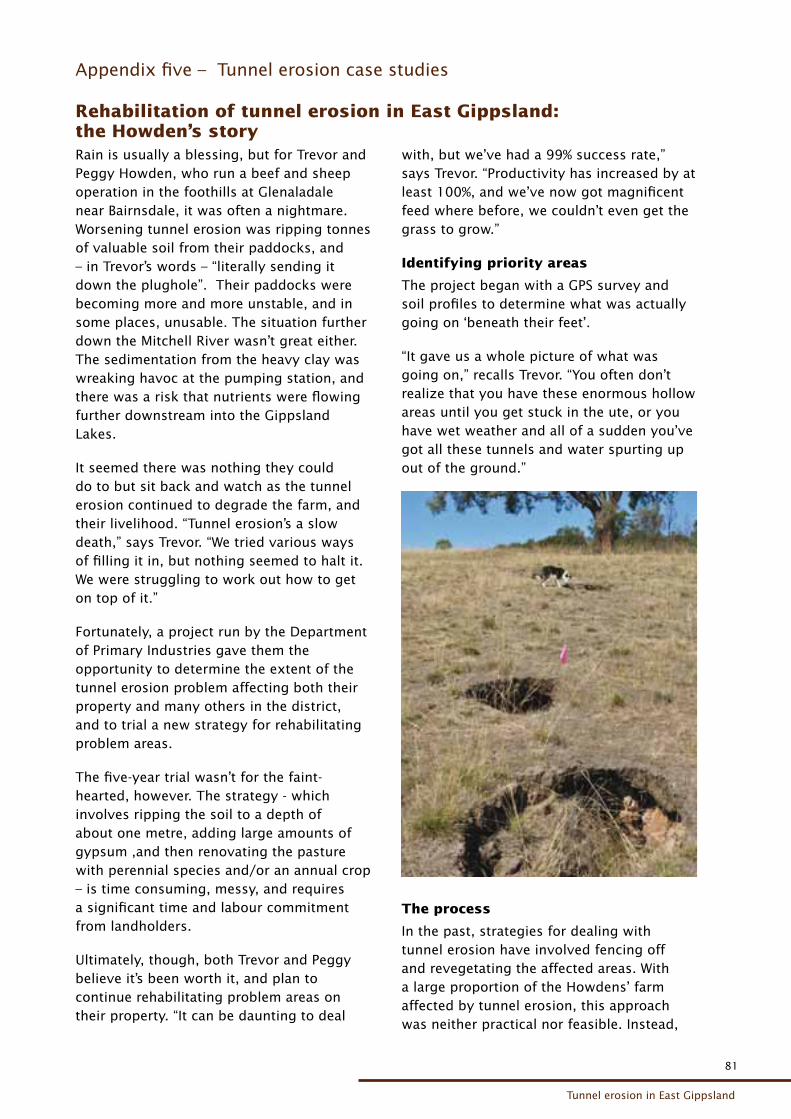
81
Tunnel erosion in East Gippsland
81
Appendix five – Tunnel erosion case studies
Rain is usually a blessing, but for Trevor and Peggy Howden, who run a beef and sheep operation in the foothills at Glenaladale near Bairnsdale, it was often a nightmare. Worsening tunnel erosion was ripping tonnes of valuable soil from their paddocks, and – in Trevor’s words – “literally sending it down the plughole”. Their paddocks were becoming more and more unstable, and in some places, unusable. The situation further down the Mitchell River wasn’t great either. The sedimentation from the heavy clay was wreaking havoc at the pumping station, and there was a risk that nutrients were flowing further downstream into the Gippsland Lakes.
It seemed there was nothing they could do to but sit back and watch as the tunnel erosion continued to degrade the farm, and their livelihood. “Tunnel erosion’s a slow death,” says Trevor. “We tried various ways of filling it in, but nothing seemed to halt it. We were struggling to work out how to get on top of it.”
Fortunately, a project run by the Department of Primary Industries gave them the opportunity to determine the extent of the tunnel erosion problem affecting both their property and many others in the district, and to trial a new strategy for rehabilitating problem areas.
The five-year trial wasn’t for the faint-hearted, however. The strategy - which involves ripping the soil to a depth of about one metre, adding large amounts of gypsum ,and then renovating the pasture with perennial species and/or an annual crop – is time consuming, messy, and requires a significant time and labour commitment from landholders.
Ultimately, though, both Trevor and Peggy believe it’s been worth it, and plan to continue rehabilitating problem areas on their property. “It can be daunting to deal
with, but we’ve had a 99% success rate,” says Trevor. “Productivity has increased by at least 100%, and we’ve now got magnificent feed where before, we couldn’t even get the grass to grow.”
Identifying priority areas
The project began with a GPS survey and soil profiles to determine what was actually going on ‘beneath their feet’.
“It gave us a whole picture of what was going on,” recalls Trevor. “You often don’t realize that you have these enormous hollow areas until you get stuck in the ute, or you have wet weather and all of a sudden you’ve got all these tunnels and water spurting up out of the ground.”
The process
In the past, strategies for dealing with tunnel erosion have involved fencing off and revegetating the affected areas. With a large proportion of the Howdens’ farm affected by tunnel erosion, this approach was neither practical nor feasible. Instead,
Rehabilitation of tunnel erosion in East Gippsland: the Howden’s story
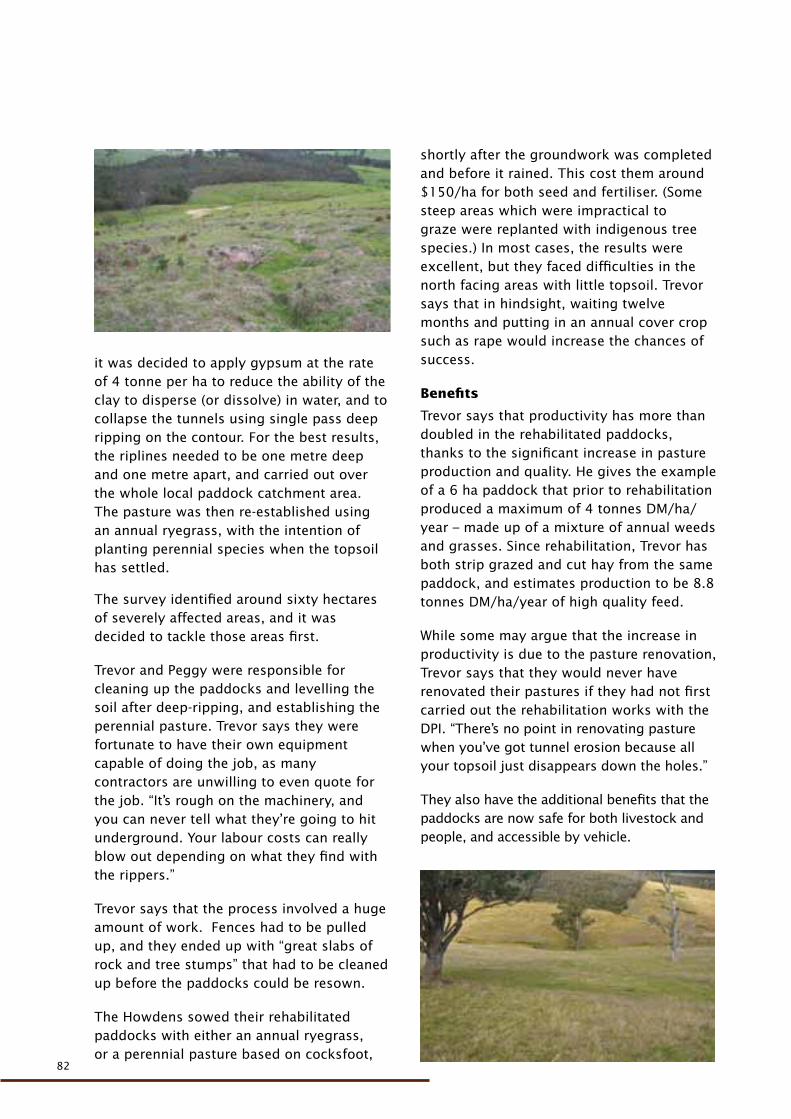
82
82
The survey identified around sixty hectares of severely affected areas, and it was decided to tackle those areas first.
Trevor and Peggy were responsible for cleaning up the paddocks and levelling the soil after deep-ripping, and establishing the perennial pasture. Trevor says they were fortunate to have their own equipment capable of doing the job, as many contractors are unwilling to even quote for the job. “It’s rough on the machinery, and you can never tell what they’re going to hit underground. Your labour costs can really blow out depending on what they find with the rippers.”
Trevor says that the process involved a huge amount of work. Fences had to be pulled up, and they ended up with “great slabs of rock and tree stumps” that had to be cleaned up before the paddocks could be resown.
The Howdens sowed their rehabilitated paddocks with either an annual ryegrass, or a perennial pasture based on cocksfoot,
shortly after the groundwork was completed and before it rained. This cost them around $150/ha for both seed and fertiliser. (Some steep areas which were impractical to graze were replanted with indigenous tree species.) In most cases, the results were excellent, but they faced difficulties in the north facing areas with little topsoil. Trevor says that in hindsight, waiting twelve months and putting in an annual cover crop such as rape would increase the chances of success.
Benefits
Trevor says that productivity has more than doubled in the rehabilitated paddocks, thanks to the significant increase in pasture production and quality. He gives the example of a 6 ha paddock that prior to rehabilitation produced a maximum of 4 tonnes DM/ha/year – made up of a mixture of annual weeds and grasses. Since rehabilitation, Trevor has both strip grazed and cut hay from the same paddock, and estimates production to be 8.8 tonnes DM/ha/year of high quality feed.
While some may argue that the increase in productivity is due to the pasture renovation, Trevor says that they would never have renovated their pastures if they had not first carried out the rehabilitation works with the DPI. “There’s no point in renovating pasture when you’ve got tunnel erosion because all your topsoil just disappears down the holes.”
They also have the additional benefits that the paddocks are now safe for both livestock and people, and accessible by vehicle.
it was decided to apply gypsum at the rate of 4 tonne per ha to reduce the ability of the clay to disperse (or dissolve) in water, and to collapse the tunnels using single pass deep ripping on the contour. For the best results, the riplines needed to be one metre deep and one metre apart, and carried out over the whole local paddock catchment area. The pasture was then re-established using an annual ryegrass, with the intention of planting perennial species when the topsoil has settled.
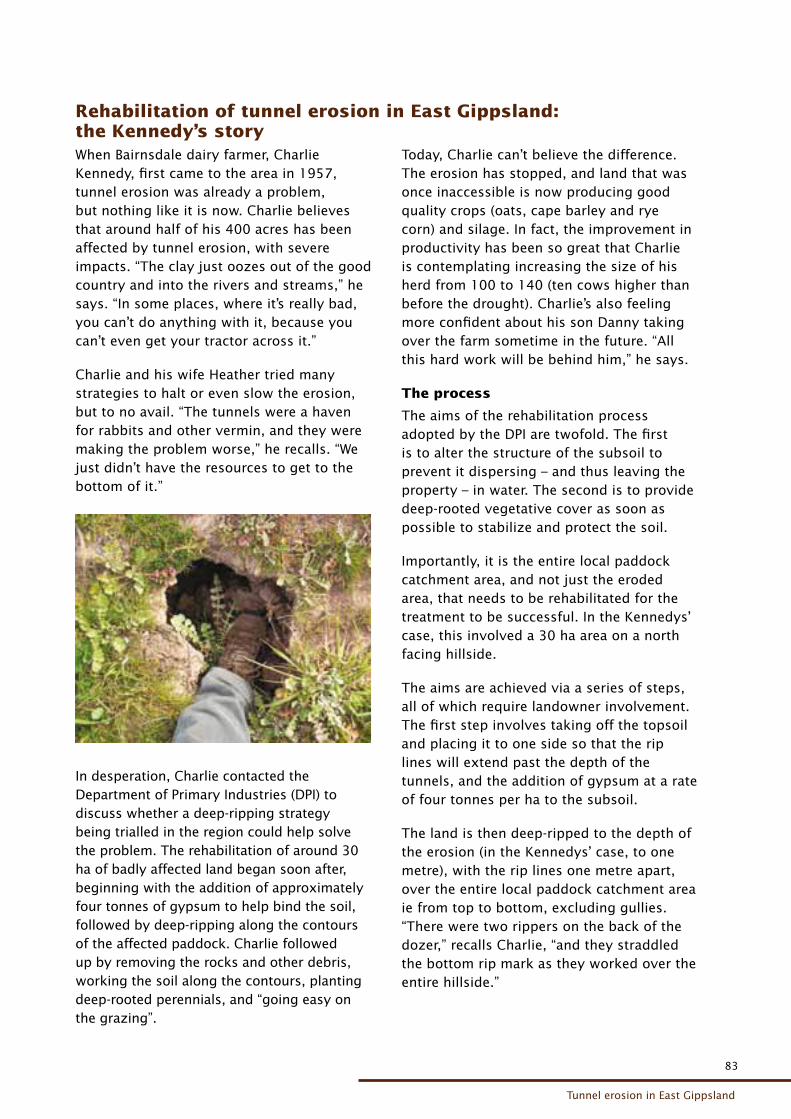
83
Tunnel erosion in East Gippsland
83
When Bairnsdale dairy farmer, Charlie Kennedy, first came to the area in 1957, tunnel erosion was already a problem, but nothing like it is now. Charlie believes that around half of his 400 acres has been affected by tunnel erosion, with severe impacts. “The clay just oozes out of the good country and into the rivers and streams,” he says. “In some places, where it’s really bad, you can’t do anything with it, because you can’t even get your tractor across it.”
Charlie and his wife Heather tried many strategies to halt or even slow the erosion, but to no avail. “The tunnels were a haven for rabbits and other vermin, and they were making the problem worse,” he recalls. “We just didn’t have the resources to get to the bottom of it.”
In desperation, Charlie contacted the Department of Primary Industries (DPI) to discuss whether a deep-ripping strategy being trialled in the region could help solve the problem. The rehabilitation of around 30 ha of badly affected land began soon after, beginning with the addition of approximately four tonnes of gypsum to help bind the soil, followed by deep-ripping along the contours of the affected paddock. Charlie followed up by removing the rocks and other debris, working the soil along the contours, planting deep-rooted perennials, and “going easy on the grazing”.
Today, Charlie can’t believe the difference. The erosion has stopped, and land that was once inaccessible is now producing good quality crops (oats, cape barley and rye corn) and silage. In fact, the improvement in productivity has been so great that Charlie is contemplating increasing the size of his herd from 100 to 140 (ten cows higher than before the drought). Charlie’s also feeling more confident about his son Danny taking over the farm sometime in the future. “All this hard work will be behind him,” he says.
The process
The aims of the rehabilitation process adopted by the DPI are twofold. The first is to alter the structure of the subsoil to prevent it dispersing – and thus leaving the property – in water. The second is to provide deep-rooted vegetative cover as soon as possible to stabilize and protect the soil.
Importantly, it is the entire local paddock catchment area, and not just the eroded area, that needs to be rehabilitated for the treatment to be successful. In the Kennedys’ case, this involved a 30 ha area on a north facing hillside.
The aims are achieved via a series of steps, all of which require landowner involvement. The first step involves taking off the topsoil and placing it to one side so that the rip lines will extend past the depth of the tunnels, and the addition of gypsum at a rate of four tonnes per ha to the subsoil.
The land is then deep-ripped to the depth of the erosion (in the Kennedys’ case, to one metre), with the rip lines one metre apart, over the entire local paddock catchment area ie from top to bottom, excluding gullies. “There were two rippers on the back of the dozer,” recalls Charlie, “and they straddled the bottom rip mark as they worked over the entire hillside.”
Rehabilitation of tunnel erosion in East Gippsland: the Kennedy’s story
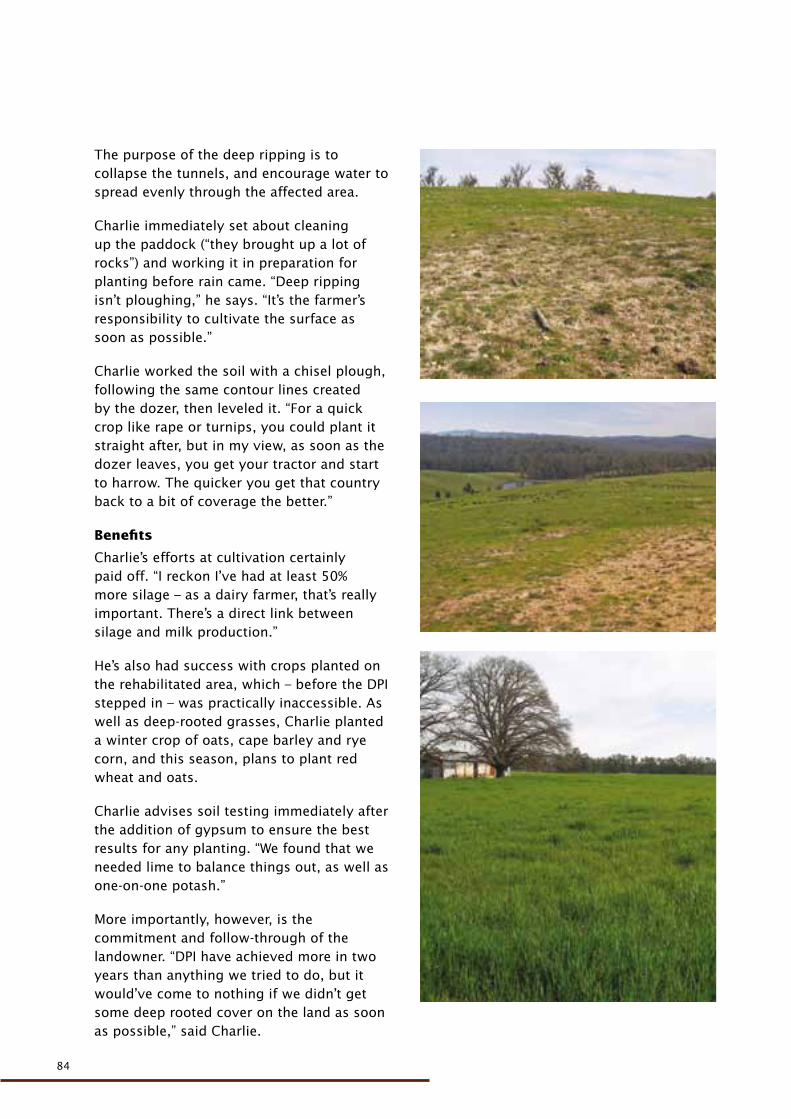
84
84
The purpose of the deep ripping is to collapse the tunnels, and encourage water to spread evenly through the affected area.
Charlie immediately set about cleaning up the paddock (“they brought up a lot of rocks”) and working it in preparation for planting before rain came. “Deep ripping isn’t ploughing,” he says. “It’s the farmer’s responsibility to cultivate the surface as soon as possible.”
Charlie worked the soil with a chisel plough, following the same contour lines created by the dozer, then leveled it. “For a quick crop like rape or turnips, you could plant it straight after, but in my view, as soon as the dozer leaves, you get your tractor and start to harrow. The quicker you get that country back to a bit of coverage the better.”
Benefits
Charlie’s efforts at cultivation certainly paid off. “I reckon I’ve had at least 50% more silage – as a dairy farmer, that’s really important. There’s a direct link between silage and milk production.”
He’s also had success with crops planted on the rehabilitated area, which – before the DPI stepped in – was practically inaccessible. As well as deep-rooted grasses, Charlie planted a winter crop of oats, cape barley and rye corn, and this season, plans to plant red wheat and oats.
Charlie advises soil testing immediately after the addition of gypsum to ensure the best results for any planting. “We found that we needed lime to balance things out, as well as one-on-one potash.”
More importantly, however, is the commitment and follow-through of the landowner. “DPI have achieved more in two years than anything we tried to do, but it would’ve come to nothing if we didn’t get some deep rooted cover on the land as soon as possible,” said Charlie.

Tunnel erosion in East Gippsland
Tu
nn
el e
rosio
n in
East G
ipp
sla
nd
DEPARTMENT OF PRIMARY INDUSTRIES